
Boundary coverage assessment of digital terrestrial … coverage assessment of digital terrestrial...
52
Report ITU-R BT.2143-2 (10/2010) Boundary coverage assessment of digital terrestrial television broadcasting signals BT Series Broadcasting service (television)
Transcript of Boundary coverage assessment of digital terrestrial … coverage assessment of digital terrestrial...

Report ITU-R BT.2143-2(10/2010)
Boundary coverage assessmentof digital terrestrial television
broadcasting signals
BT Series
Broadcasting service(television)
ii Rep. ITU-R BT.2143-2
Foreword
The role of the Radiocommunication Sector is to ensure the rational, equitable, efficient and economical use of the radio-frequency spectrum by all radiocommunication services, including satellite services, and carry out studies without limit of frequency range on the basis of which Recommendations are adopted.
The regulatory and policy functions of the Radiocommunication Sector are performed by World and Regional Radiocommunication Conferences and Radiocommunication Assemblies supported by Study Groups.
Policy on Intellectual Property Right (IPR)
ITU-R policy on IPR is described in the Common Patent Policy for ITU-T/ITU-R/ISO/IEC referenced in Annex 1 of Resolution ITU-R 1. Forms to be used for the submission of patent statements and licensing declarations by patent holders are available from http://www.itu.int/ITU-R/go/patents/en where the Guidelines for Implementation of the Common Patent Policy for ITU-T/ITU-R/ISO/IEC and the ITU-R patent information database can also be found.
Series of ITU-R Reports
(Also available online at http://www.itu.int/publ/R-REP/en)
Series Title
BO Satellite delivery
BR Recording for production, archival and play-out; film for television
BS Broadcasting service (sound)
BT Broadcasting service (television)
F Fixed service
M Mobile, radiodetermination, amateur and related satellite services
P Radiowave propagation
RA Radio astronomy
RS Remote sensing systems
S Fixed-satellite service
SA Space applications and meteorology
SF Frequency sharing and coordination between fixed-satellite and fixed service systems
SM Spectrum management
Note: This ITU-R Report was approved in English by the Study Group under the procedure detailed in Resolution ITU-R 1.
Electronic Publication Geneva, 2011
ITU 2011
All rights reserved. No part of this publication may be reproduced, by any means whatsoever, without written permission of ITU.

Rep. ITU-R BT.2143-2 1
REPORT ITU-R BT.2143-2
Boundary coverage assessment of digital terrestrial television broadcasting signals*
(Question ITU-R 31/6)
(2009-2010)
Foreword
This Report contains information gathered from Radiocommunication Study Group 6 and Radiocommunication Working Party 6A. The development of the report has been driven by the fact that the measurement and verification of the planned coverage is of the utmost importance after the planning of digital broadcasting services.
TABLE OF CONTENTS
Page
1 Coverage ......................................................................................................................... 3
2 Assessment of the coverage ............................................................................................ 3
3 Comparison with planned values .................................................................................... 4
4 The different reception ways .......................................................................................... 4
5 Parameters to be evaluated ............................................................................................. 4
6 The model for coverage assessment ............................................................................... 5
Appendix 1 – The results of experimental estimation of DVB-T system work stability under a multibeam signal ................................................................................................ 7
1 Introduction .................................................................................................................... 7
2 Parameters of DVB-T transmission station .................................................................... 7
3 Parameters of experimental paths and test stations (see Fig. 1) ..................................... 7
4 Measurement equipment ................................................................................................ 8
5 Methods and the results of the measurement.................................................................. 8
6 Conclusions .................................................................................................................... 8
* It should be noted that the findings in this Report might not be applicable to countries signatory to the GE-06 Agreement.

2 Rep. ITU-R BT.2143-2
Page
Appendix 2 – The usage of a spectrum analyzer for field-strength measurements ................. 11
1 Introduction .................................................................................................................... 11
2 Digital signal voltage measurement technique ............................................................... 11
Appendix 3 – The impact of signal parameters variation on DVB-T reception quality .......... 13
1 Low or not present external interference conditions ...................................................... 13
2 Presence of external interference .................................................................................... 14
Appendix 4 – The impact of mountainous area conditions on reception quality of digital TV broadcasting ............................................................................................................. 17
1 The impact of propagation path on useful signal field strength ..................................... 17
2 The impact of reflected signals on reception quality ...................................................... 21
3 Estimation of digital set-top boxes work in multipath conditions .................................. 30
Attachment 1 to Appendix 4 – Detailed information on measurements .................................. 32
1 Measurement location .................................................................................................... 32
2 Measurement technique .................................................................................................. 32
2.1 Measurement of received signal level ................................................................ 32
2.2 Measurement of S/N ........................................................................................... 32
2.3 Measurement of BER ......................................................................................... 33
2.4 Determination of reception quality ..................................................................... 33
3 Description of transmitting network ............................................................................... 33
4 Measuring equipment ..................................................................................................... 36
Appendix 5 – Digital terrestrial television broadcasting reception conditions in the urban environment .................................................................................................................... 38
1 The impact of the propagation path on useful signal field strength ............................... 38
2 Conclusions .................................................................................................................... 46
Attachment 1 to Appendix 5 – Detailed information on measurements .................................. 47
1 Measurement location .................................................................................................... 47
2 Measurement technique .................................................................................................. 47
2.1 Measurement of received signal level ................................................................ 47
2.2 Determination of reception quality ..................................................................... 47
3 Measurement routes ........................................................................................................ 49

Rep. ITU-R BT.2143-2 3
1 Coverage
The term “coverage” is typically used in this Report to represent all the points where the electromagnetic field strength is higher than the minimum theoretical required value and the interference signal level is lower to that indicated as protection ratio parameters in ITU-R Recommendations. Both wanted field strength and the potential unwanted interfering signals can be evaluated by means of theoretical calculations or by measurements. However, the extension of the coverage area for DTTB depends on several additional factors:
a) the channel model adopted as reference (i.e. Rayleigh, Rice, ANWG, etc.);
b) the modulation configuration adopted (which includes more than one hundred possibilities);
c) the kind of the network implemented (SFN vs. MFN); and
d) the reception types (fixed, portable, mobile, indoor), continuous and troposphere interferences, man made noise, and so on.
It is clear that, when the electromagnetic field strength exceeds the minimum theoretical value, evaluated at reference clutter height, it should be protected against interference through the normal frequency coordination process. However, it is also possible to have good reception also with the electromagnetic field strength lower than the minimum theoretical value.
In terms of theoretical evaluation, in the ITU-R DTTB Handbook, Edition 2002, both time and location variability of field strength have been defined. In particular for each reception condition a three-level approach has been defined:
Level 1: single point reception. A point can be considered served if the minimum field strength required to guarantee a service is exceeded for more than 99% of the time.
Level 2: small coverage area (100 × 100 m). It is necessary to introduce the level of the coverage. Coverage is defined as “good” if at least 95% of the points included in the area are covered. Coverage is defined as “acceptable” if at least 70% of the points included in the area are covered.
Level 3: coverage area of transmitter. The global “good” and “acceptable” area of transmitter coverage is given respectively by the sum of all little areas.
Coverage assessment of the transmitter is given by verification of the coverage area boundary in comparison with a theoretical one.
As mentioned above, each result obtained using the three-level approach method is valid for a specific reception condition. It is necessary to specify for which reception condition (Level 1, 2 or 3) the evaluation has been done.
2 Assessment of the coverage
The coverage of a specific area, as determined by a prediction method, should be verified by “in-field” measurements in order to assess prediction results.
The digital terrestrial television reception system works on the basis of a “threshold” and the coverage depends on three factors:
a) the access to the service,
b) the time availability,
c) the location availability.
4 Rep. ITU-R BT.2143-2
The service can be defined available at the boundary, under Level 1 conditions, if the following two statements are true: BER (bit error rate) after Viterbi is less than 2 × 10⁻⁴ (QEF) and measured field strength is higher than the minimum needed field strength, indicated for the considered transmitter configuration and channel type (i.e. Ricean, Rayleigh).
The service “time availability” can be defined if the above-mentioned statements are verified for any time interval. Time availability is evaluated taking into account both transmitter status and channel conditions (interferences, reflections, propagation and so on).
The service “spatial availability” can be defined if the above-mentioned items are verified under Level 2 conditions. In such cases the placement of receiving antennas is not critical.
The coverage assessment criteria should be based on the described factors and should also take into account practical objectives such that:
– measurements should be repeatable in the conditions and in the results;
– measurement procedures should provide results in an efficient way;
the methods do not necessarily have to be sophisticated and expensive.
3 Comparison with planned values
The field strength and BER change continuously during the antenna positioning process up to clutter height above ground level. The observed values depend on the different path combinations and also on the effects of obstruction at low height of the receive antenna.
Both wanted and unwanted interfering signal field-strength values should be calculated and used in the comparison process. As far as the measurements are made to the fixed high, the appropriate propagation prediction model is to be chosen for the comparison.
4 The different reception ways
The digital television signal can be received in different ways. The conventional method considered for planning for early DTTB service planning is based on fixed receiving antennas placed on the roof of buildings, as for analogue systems. Moreover, it needs to be considered the same antennas are used which are already in place for analogue systems. The criteria proposed herewith are based principally on fixed reception conditions. For fixed reception, the channel conditions under Rice propagation mode can be assumed quite constant in time. Reception conditions based on mobile or portable systems are related to extremely variable context and further studies are needed.
4.1 In cities and forest park areas, propagation of a digital television signal can be the multibeam. It renders essential influence on an opportunity of decoding action of a signal. Variation of value of field strength of a digital television signal due to its multibeam propagation is shown in the Appendix 1. This variation reaches essential values for terminal conditions BER = 2 × 10⁻⁴. Appendix 2 describes the usage of a spectrum analyzer for field-strength measurements.
5 Parameters to be evaluated
As reported in the current version of Recommendation ITU-R SM.1682 at § 2.6, the parameters to be evaluated are: field strength and BER after different decoding. The BER after Viterbi (VBER) is used to determine the threshold of QEF condition. One more parameter should also be recorded during measurement activities. It is MER (modulation error ratio) at the transmitting site. MER represents a synthetic form of constellation analysis. If the MER value at the transmitting site is lower than an established value, e.g. 32 dB, the measurement activities should be stopped due to possible transmission failure.

Rep. ITU-R BT.2143-2 5
Appendix 3 provides the results on evaluation of dependence of the DVB-T signal quality on the filed strength and BER after Viterbi decoder and after Reed-Solomon decoder.
6 The model for coverage assessment
It is well known that field strength measured at receiving sites varies with location. The variability, at fixed power flux-density, depends on amplitude and phase combination of several paths that reach the receiving antenna. Variability is more accentuated for CW signals than spread spectrum signals. The reflected paths can give either possible positive (additive or subtractive) or negative contributions. Negative contributions are connected to the intersymbol interference that happens when the delay of one or more paths is greater than the guard interval. Possible positive contributions are generated when the path’s delay is lower than the guard interval. The presence of several paths falling into the guard interval frame can result in additive or subtractive contributions depending on implementation of Viterbi soft decision, fixed or moving research window and paths phase. The intrinsic non-linearity related to Viterbi soft decision, protection levels, temporal and spatial dispersion gives as a result a low correlation between field strength and BER. Existence of a correlation law is yet to be studied.
As far as defining a planning method the coverage border line for E70 and E95, in the coverage assessment is important to verify the real extension of border lines.
For fixed reception, it is proposed the scale reported in Table 1 is used.
TABLE 1
DTTB coverage assessment
BER
Field strength
VBER > 2 × 10⁻⁴ VBER ≤ 2 × 10⁻⁴
E < E70 F A
E70 ≤ E < E95 NA A
≥ E95 NA G
where:
E70 or E951
represents the minimum median field strength needed for location probability of 70% or 95% (DTTB Handbook Edition 2002 – Chapter 5 and Recommendation ITU-R BT.1368-4). E70 or E95 value depends on the adopted configuration. VBER of 2 × 10⁻⁴ is referred to the QEF condition. F = Failure; A = Adequate; NA = Not Adequate; G = Good.
The E70 or E95 border lines as provided by the planning system, should be chosen as the measuring points to assess the coverage. The parameters to be acquired to characterize each measurement point are described in Recommendation ITU-R SM.1682. On the base of the parameter acquired it is possible to apply the Table 1, in order to get the more appropriate qualification of the measurement point under investigation.
1 E70 or E95 may also represent the planning values chosen by administrations.

6 Rep. ITU-R BT.2143-2
Starting from the first measuring point and moving along the border line in clockwise direction (or counter clockwise) it is simple to connect each point with the following ones having the same assignment (e.g. G or A) given by mean of the Table 1 scheme application. In such a way the first draft of measured envelopes of the coverage area are obtained, under the E70 or E95 planning condition.
FIGURE 1
Boundary coverage assessment
boundary
Tx
Coverage assessment
points
boundaryE95
E70
The measured envelopes can be improved/refined by two actions at each measurement point:
a) by increasing the number of measuring points;
b) by moving measurements point either toward to or far from the transmitter when the assignments fall into NA/F or in A/G part of Table 1, respectively.
FIGURE 2
Refining of the boundary coverage assessment
boundary
Tx
E70
NA/F
A/G
The coverage assessment for a network of transmitters is given by the envelope of the coverage border line assessed for each transmitter in the network.

Rep. ITU-R BT.2143-2 7
Appendix 1
The results of experimental estimation of DVB-T system work stability under a multibeam signal
1 Introduction
In the planning of DVB-T networks and in the analysing of their performance such a characteristic as the strength of electromagnetic field is basically used. However, as the investigations show, this characteristic is often not sufficient for the evaluation of a digital system’s operation capability.
The results of the evaluation of the signals of DVB-T decimetric range transmitter installed in St. Petersburg and adopted in four paths with different conditions of radio waves’ propagation and with different irradiation field structure in test stations, are given below.
The purpose of the work is to determine the threshold value of the equivalent field strength of a signal Eth; the threshold value is the smallest value of the signal in which the disruption of a digital bitstream’s demodulation still does not occur (picture and sound remain the same) and in which the number of mistakes after Viterbi decoder is not higher than BER = 2 × 10⁻⁴.
2 Parameters of DVB-T transmission station
– place of installation is St. Petersburg, Russia;
– transmitter output power of 500 W;
– Tx antenna’s power gain is with respect to half-wave vibrator is 9 ± 3 dB;
– height of antenna suspension 203 m;
– emission frequency band 574 … 582 MHz (34 TV channel);
– modulation: mode 8k, 64-QAM, convolutional code 2/3, guard interval 1/32, digital bit stream 24, 128 Mbit/s.
3 Parameters of experimental paths and test stations (see Fig. 1)
Path 1 – An open path, supposedly a single-beam because its first part is located over a city zone and the second part – over a woodless and practically flat countryside; the receiving station “Razmetelevo” is sited on the top of the sparsely wooded hill.
Path 2 – An open path, supposedly also a single-beam because of the following reasons. Firstly, only a small part of the initial sector of the path is located over the city area. Secondly, only about half of the path is located in woodland. Finally, the receiving station “Sestrovsk” has several kilometres of flat marshland in front.
Path 3 – An open path, the first part is over the city area; the second part is over the Gulf of Finland. It is important to mention that the signal energy can be reflected from the surface of the Gulf of Finland, generating another beam, which is comparable in strength to the direct one. This phenomenon can be observed in the receiving station “Strelna”.
Path 4 – Closed city multibeam path, maximum signal is from the azimuth, which is drastically different from the direct one (to the transmitter), the mobile station “Moyka” is situated in the courtyard of four- and six-storied houses.

8 Rep. ITU-R BT.2143-2
4 Measurement equipment
You can see the measurement equipment installed on the automobile below:
– Measurement log-periodic antenna on the telescopic mast, which has a height h2 = 10 m above the surface.
– Selective microvoltmeter.
– Attenuator for 50 dB with 1 dB step is switched between the exit of antenna feeder and the entrance of selective microvoltmeter.
– DVB stream tester.
5 Methods and the results of the measurement
Measurements were realized in the following way:
– A real signal field strength was measured by means of selective microvoltmeter in each of four receiving stations under attenuator’s fading S = 0; and the amount of BER after decoder Viterbi was fixed by DVB stream’s spectrograph.
– The amount of BER for each value Eeq was measured under step-by-step attenuation increase S (signal voltage reduction at the microvoltmeter’s entrance), i.e. equivalent field intensity Eeq reduction.
– The reduction of Eequ was done before picture’s fall, i.e. before the value of BER > 2 × 10⁻⁴.
– The diagram of BER in the function Eeq was schemed according to the results of the measurements.
Measurement results are given in Fig. 2. At this picture the numbers of curves correspond to the numbers of the paths; points enclosed in the brackets are places conditionally – the device showed “BER < 10−8” at the same time, because 10–8 is its lower-range value.
6 Conclusions
Path 1 – The threshold value Eeq comes to 38-40 dB for open single-beam paths (curves 1 and 2) whereas it amounts to 58 dB and more under multibeam (dispersed) signal Eeq.
Path 2 – In an open path, located, even partially (especially the end part of it), over a water surface, another beam comparable in strength to the direct one can be created by the water surface in the receiving point. Resulting from the accidentally unfavourable rate of Eeq phases, the summation of two antenna currents can cause a random value, which, in this case, will be slightly higher than the value of the currents on open land paths (curves 1 and 2).
Path 3 – The results show that multibeam transmission plays an important role in the DVB-T broadcasting zone. That is why when planning certain networks and estimating correction’s value with respect to a minimum field strength of a signal Emin
2 in use it is better to pay attention to this fact.
For the detailed information see Dotolev et al. [2002].
2 The Chester 1997 Multilateral Coordination Agreement relating to Technical Criteria, Coordination Principles and Procedures for the introduction of Terrestrial Digital Video Broadcasting (DVB-T). Chester, 25 July 1997.

Rep. ITU-R BT.2143-2 9
FIGURE 3
Razmetelevo
Path 3
Path 4
Mobile station
Strelna Gulf of Finland
Razmetelevo
Mobile station
Mobile station
Mobile stationMoyka
Sestroretsk
Path 1
Path 2
Sestroretsk
Strelna
Gulf of Finland
1
2
3
4
Moyka
DVB-Ttransmitter
St. Petersburg
From DVB-T transmitter

10 Rep. ITU-R BT.2143-2
FIGURE 4
( )
( )
( )
( )
40 50 60
BE
R
Path 1
Path 2
Path 3
Path 4
BER = 2 x 10 –4
10–2
10–4
10–6
10–8
10–10
10–12
Е (dB( V/m))μ
References
DOTOLEV, V. G., JILTSOV, A. U., KOLESNIKOV, C. V. et al. [2002] Some measurement results of digital ground-based broadcasting in the experimental area. NIIR Proc., M.

Rep. ITU-R BT.2143-2 11
Appendix 2
The usage of a spectrum analyzer for field-strength measurements
1 Introduction
As a result of terrestrial digital video broadcasting introduction now there is a necessity for carrying out measurements of digital signal parameters for bringing into service new radio stations, their repairing and for performing spectrum monitoring and scientific/technical tasks.
Leading world companies have developed specialized test receivers for performance of these operations. However these test receivers have not spread yet wildly in a number of countries because of their high cost. Nevertheless, some digital signal parameters (voltage levels on a path of the transmitter, a degree of spectrum uniformity, field strength in a coverage area, etc.) can be measured by widespread conventional instruments such as spectrum analyzer.
2 Digital signal voltage measurement technique
The process of field-strength value, E, determination in the test reception point by means of a spectrum analyzer consists of measuring integrated voltage, UΣ, at the output of calibrated antenna feeder and addition of calibration factor, KA, to digital signal integrated voltage value:
E = UΣ + kA (1)
The example of digital signal spectrogram on the screen of a spectrum analyzer is shown on Fig. 5, with decryption of some reductions.
Such picture presents when spectrum analyzer is connected through attenuator to an output of the fault-free transmitter or during off-air reception of a digital TV signal on a single-beam path without reflections from an underlying surface, nearby structures and constructions. In the presence of multibeam propagation the signal spectrum can undergo different sort of distortions (see example on Fig. 6) which complicate signal analysis.
Specialized equipment (for example, in test digital receiver EFA-40 from Rohde and Schwarz) for an estimation of an integrated level of such signal “uΣ” uses the principle of the automated splitting of all bandwidth of a spectrum on “n” narrow equal parts, Bn, with the subsequent measurement of “ui” with peak detector:
When the equipment bandwidth, ВRBW, is less than Bn it is necessary to add the correction factor Δu to the metered values:
Δu = 10 log(Вn/ВRBW) (2)
Then an affective voltage of each interval Bn:
U1 = u1 + Δu; U2 = u2 + Δu; … Un = un + Δu

12 Rep. ITU-R BT.2143-2
FIGURE 5
*
1
CLRWR Bsign = 7610 kHz
Span 10 MHz1 MHz/Center 658 MHz
1 RM
* RBW 30 kHz
*VBW 100 kHz*SWT 2 sAtt 10 dBRef 52.8 dB Vμ
5
10
15
20
25
30
35
40
45
50
FIGURE 6
Att 10 dB
* RBW 30 kHz
Ref 72 dB Vμ
Vision carrier 33 Ch
Sound carrier 31 Ch
Center 562.5 MHz 1 MHz/
Bsign = 7610 kHz
* VBW 1 kHz*SWT 1 s
1 RMAVG
-20
-10
0
10
20
30
40
50
60
70
Span 10 MHz
And a final equation is:
22
22
1 ... nUUUU +++=Σ (3)
Value UΣ is shown on the display of the test receiver.
In the case of absence of a specialized instruments for measuring digital signal level it is proposed to determine UΣ of digital signal using a spectrum analyzer according the method presented above (i.e. in accordance with equations (1) to (3)), but with manual processing. As a spectrum analyzer gives only a picture of a signal spectral distribution it is necessary to make integration of signal level in all bandwidth of a digital television signal.
For this purpose it is necessary to break down a signal bandwidth on several frequency intervals (a large number of intervals gives more precise result). From an experience point of view, optimum quantity of intervals are 8-10; and it isn't necessary to make intervals equal.
The next step is calculation of median voltage level Umed for each interval.
Then it is necessary to convert median values Umed into linear units of measure (µV or mV) then to take a square root from the sum of squares of Umed (see equation (3)) and translate the result back into logarithmic units of measure. Further it is necessary to add the correction factor according to value of an equipment passband ВRBW according to (2).
When spectrum has a simple form (see Fig. 5) it is possible not to break down it into intervals and directly determine median value in dB and add to it the correction factor for a difference between instrument and signal bandwidths.
During experimental estimation of accuracy of proposed technique for measuring digital signal integrated voltage level and comparison it with test receiver measurements it was found that the difference in results does not exceed 1 dB even in complex cases [Jiltsov et al., 2007].
It is necessary to add, that a number of modern spectrum analyzers already have a function with similar calculations implemented by means of built-in programs.

Rep. ITU-R BT.2143-2 13
References
JILTSOV, A. U., PYATYSHEV, Y. A. and SHEPETKOV, N. P. [2007] Using of a spectrum analyzer in practice of Terrestrial Digital Video Broadcasting signals parameters measurements. NIIR Proc., M. (in the print).
Appendix 3
The impact of signal parameters variation on DVB-T reception quality
Dependence between the quality of DVB-T programs reception and such parameters as field strength, S/N, BER in real conditions indicates threshold effect of digital system reception. This fact has significant impact in establishing the criterion for acceptable quality reception. It may be also important to establish a clear definition of digital terrestrial broadcasting service area for planning and regulatory purposes.
1 Low or not present external interference conditions
In case of low or not present external interference, coverage area tends to be maximum possible and limited only by performance of the digital system itself, taking into account presence of natural and human-made noise in used RF channel. Results are shown in Figs 7 to 9.
E and BER used in digital terrestrial broadcasting planning are shown in the figures by red lines.
FIGURE 7
Received signal quality as function of field strength
100
90
80
70
60
50
40
30
20
10
0
Qua
lity,
per
cent
age
of ti
me
of id
eal
pict
ure
40 43 46 49 52 55 58 61 64 67 70
E (dB( V/m))μ
E = 55.5(dB( V/m))μ
High qualityreceptioncoverage

14 Rep. ITU-R BT.2143-2
FIGURE 8
Received signal quality as function of BER after Viterbi decoder
1
0.9
0.8
0.7
0.6
0.5
0.4
0.3
0.2Qua
lity
, per
cent
age
of ti
me
of id
eal
pict
ure
BER after Viterbi decoder
BER = 2×10⁻⁴
0.1
01 10
–9× 1 10–8× 1 10
–7× 1 10–6× 1 10
–5× 1 10–4× 1 10
–3× 1 10–2× 1 10
–1×
High-qualityreceptioncoverage
Figures 7 to 9 clearly indicate that reception quality has a threshold nature and depends on reception/demodulation parameters. At the same time threshold values of measured parameters which provide a high-quality reception are close to the values recommended in GE-06.
Figure 7 contains data averaged on several digital receivers. Therefore the figures in the threshold area are a little bit more flat in comparison with theoretical model.
Mention should be made of the fact that measurements were carried out of the city, this provided characteristics of the channel close to Rice distribution. Further researches are necessary for determination of reception quality dependence in urban and SFN conditions.
2 Presence of external interference
In case of external interference, several (or all) sub-carriers of DVB-T signal affected by interfering signal components.
Results are shown in Figs 10 to 11.

Rep. ITU-R BT.2143-2 15
FIGURE 9
Received signal quality as function of BER after RS decoder
100
90
80
70
60
50
40
30
20
Qua
lity
BER after RS decoder
10
01 10× –9
1 10–8× 1 10
–7× 1 10–6× 1 10
–5× 1 10–4× 1 10
–3× 1 10–2×
99
FIGURE 10
Received signal quality as function of BER after Viterbi decoder
100
80
70
60
50
40
30
20
Qua
lity
BER after Viterbi decoder
10
01 10
–4× 2 10–4× 1 10
–3× 1 10–2×
99
90

16 Rep. ITU-R BT.2143-2
FIGURE 11
Received signal quality as function of BER after Reed-Solomon decoder
100
80
70
60
50
40
30
20
Qua
lity
BER after RS decoder
10
01 10
–8× 1 10
–5× 1 10
–2×
99
90
1 10–7
× 1 10–6
× 1 10–4
× 1 10–3
×
FIGURE 12
Received signal quality as function of measured C/N ratio
Qua
lity
C N/
99100
80
70
60
50
40
30
20
10
0
90
20.2 20.3 20.4 20.5 20.6 20.7 20.8 20.9 21 21.1 21.2

Rep. ITU-R BT.2143-2 17
Appendix 4
The impact of mountainous area conditions on reception quality of digital TV broadcasting
1 The impact of propagation path on useful signal field strength
Dependence between useful signal field strength and propagation path has a complex character due to several factors:
– reduction of useful signal field strength due to loss conditioned by natural barriers;
– diffraction at the edges of ground relsief obstacles;
– presence of additional beams reflected from barriers situated out of straight path from transmitter to receiving end.
For mathematical modeling of field strength the following methods were used:
– Recommendation ITU-R P.1546-3;
– Recommendation ITU-R P.1812.
Results of modeling were compared with results of measurements.
Measurements of field strength from different transmitting stations in different environmental conditions were made during the research of test SFN near the city of Sochi in March 2009. The results of signal level measurements were combined for the analysis by the type of propagation paths. The results of signal level measurements were combined for the analysis by the type of propagation paths.
Three diagrams (for line of sight, semi-line-of-sight and non-line-of-sight paths) are presented in Figs 13, 14 and 15. These diagrams will help analyse differences in the process of signal levels prediction for different propagation paths.
Figure 13 shows the comparison of measured field-strength values (marked as Em) for line of sight propagation paths with predicted values based on Recommendations ITU-R P.1812 and ITU-R P.1546. For line of sight paths both propagation prediction methods give the results close to measured values.

18 Rep. ITU-R BT.2143-2
FIGURE 13
Line-of-sight propagation paths
Em E(1546) E(1812)
120
110
100
90
80
70
601 2 3 4 5 6 7 8 9 10 11 12
E (
dB(µ
V/m
))
0 1 2 3
100
200
300
(km)
(m)
Example of line of sight path:

Rep. ITU-R BT.2143-2 19
Figure 14 shows the comparison of measured field-strength values for semi-line-of-sight propagation paths.
FIGURE 14
Semi-line-of-sight propagation paths
70
72
74
76
78
80
82
84
86
88
90
E (
dB(µ
V/m
))
1 2 3 4 5 6
Em E(1546) E(1812)
Example of semi-line-of-sight path:
500
400
300
200
100
0 1 2 3 4 5 6
(m)
(km)
It is seen that calculated values based on both Recommendations in general give results more or less similar to measured ones.

20 Rep. ITU-R BT.2143-2
Figure 15 shows the comparison of measured field-strength values for non-line-of-sight propagation paths.
FIGURE 15
Non-line-of-sight propagation paths
95
85
75
65
55
45
35
251 3 5 7 9 11 13 15 17 19 21 23 25 27 29 31 33 35 37 39 41 43 45
Em E(1546) E(1812)
E (
dB(µ
V/m
)
Example of non-line-of-sight path:
400
300
200
100
0 2 4 6 8 10 12 14
(m)
(km)

Rep. ITU-R BT.2143-2 21
It is seen that both methods do not give correct predictions on non-line-of-sight paths. Model based on Recommendation ITU-R P.1546 in most cases give overstated values while model based on Recommendation ITU-R P.1812 in many cases predict smaller values in comparison with ones which were really received. But it can’t be stated what last method can be used as “worse case” prediction estimation for mountains areas conditions, because sometimes estimation exceed measured values. Of course, it is worth while to say that model based on Recommendation ITU-R P.1546 gives more correct predictions.
Conclusions
Prediction of useful and interference field strength at reception point is the basis for terrestrial broadcasting network planning. Analysing diagrams for different types of propagation paths mentioned above it is not safe to say that model based on Recommendation ITU-R P.1812 can be used for predicting of coverage area as “pessimistic” estimation, taking into account that in some cases predicted field strength exceeds real ones. Model based on Recommendation ITU-R P.1546 in mountainous area conditions as a rule gives slightly overstated values for semi-line-of-sight and non-line-of-sight paths. This model can be used as an upper estimate of field strength except for fully line of sight paths because it frequently gives understated values for such paths in mountainous areas. The conclusion is what in mountainous areas it’s may be right thing when planning broadcasting network, to combine measurements with prediction estimation at least for some specific paths. Another option may be development of deterministic propagation model, what takes into account specific of local conditions. In latter case a set of measurements also required to “calibrate” deterministic propagation model for typical propagation paths.
It’s important to say what examples in this chapter deals only with main beam, coming directly from transmitter site. In mountainous at most reception places “multi-beam” conditions detected, when a set of signals coming to receiving site from different directions, even if only one transmitter in network at operation. This happens because of presence of beams, reflected from surfaces of the mountains and hills.
2 The impact of reflected signals on reception quality
In mountainous area conditions DVB-T programme reception quality depends not only on field strength but also on other signal characteristics, such as MER, BER and frequency-selective interference of signal spectrum. Many reflected and multiple-reflected signals having impact on all listed characteristics were found during test works at transmitting networks in mountainous areas. Appearance of reflected signal depends on physical characteristics of underlying terrain and relief features. In this section it was attempted to determine conditions leading to reflected signals appearance and draw a conclusion on the impact of reflected signals on digital broadcasting programmes reception.
Measurements were carried out in winter (snow) and spring periods (trees began to send out leaves) at average and high ground humidity.
The example of conditions under which measurements of reflected signal in mountainous area are carried out is given in Fig. 16.

22 Rep. ITU-R BT.2143-2
FIGURE 16
Measurements of reflected signal
Bottom mountain ridge (12-16 km)
Top mountain ridge (18-21 km)

Rep. ITU-R BT.2143-2 23
FIGURE 17
Location features and conditions for reflected signals appearance
FIGURE 18
Time diagram and constellation of received signal

24 Rep. ITU-R BT.2143-2
According to the time diagram maximum delays correspond to signal run distance of about 38 km that corresponds to distance to the top mountain ridge.
FIGURE 19
Spectrum and received signal characteristics
Received signal can be demodulated by the receiver though low signal level and spectrum interference of received signal as it is seen from Fig. 19. The example of more difficult reception conditions at the boundary of coverage area is given below.

Rep. ITU-R BT.2143-2 25
FIGURE 20
Reception of reflected signals at the boundary of coverage area
Mountain ridge
FIGURE 21
Characteristics and spectrum of received signal

26 Rep. ITU-R BT.2143-2
In these conditions good reception is failed because settings of receiver work window correspond to the most powerful signal (see Fig. 21).
FIGURE 22
Time diagram and characteristics of received signal
In such conditions signal demodulation by one of test receivers was impossible.
By changing receiving antenna position the direction which gives an opportunity to demodulate signal by all receivers was found. But this direction was different from the maximum signal level one.
FIGURE 23
Time diagram and constellation of received signal after changing of receiving antenna direction

Rep. ITU-R BT.2143-2 27
Other typical conditions of reflected signal reception in mountainous area are river-valleys located in ground folds.
FIGURE 24
Conditions of reflected signal reception in river-valleys
Reflected beam
Direct beam
Reflected beam
Direct beam
FIGURE 25
Reception of reflected signals in ground folds

28 Rep. ITU-R BT.2143-2
In the process of measurements directional antenna was used. It was placed at 10 m height in blind zone of useful station in the direct beam and was directed to the maximum of reflected signal (against direction to transmitter).
Reception places where best results were received in the process of receiving antenna orientation towards reflected signal rather than towards transmitting station (2-1, 2-2, 3-1, 4-1) are marked with light-green colour. Coverage area calculated according to Recommendation ITU-R P.1812 is marked with green colour.
In all cases directional receiving antenna is oriented towards receiving signal maximum. Reception place was in a low ground therefore signal attenuated due to natural barriers. Thus, maximum level of received signal can be achieved when receiving antenna is oriented towards reflected beam.
Time variations of reflected signals
Field-strength instability of reflected signals is well-known. At same time, correlation of level changes between different COFDM sub-carriers is not large. As far as COFDM signal is broadband, changes at some frequencies partly compensate each other leading to reduction of general signal level changes at receiver input and less impact on the reception. During measurements short-term (less than one minute) variations of measured DVB-T signal level of reflected beam in any cases do not exceed 5.5 dB.

Rep. ITU-R BT.2143-2 29
Within the limits of diurnal cycle time changes of reflected signal level are not large. The example of time variations measurements of signal reflected from breast of a hill covered with young spring forest (without leaves) at average ground humidity is shown in Fig. 26.
FIGURE 26
Time variations of reflected signal field in reception place
End of evening twilightLevelSunset
In the process of measurements directional antenna was used. It was placed at 10 m height in blind zone of useful station in the direct beam and was directed to the maximum of reflected signal (against direction to transmitter).
The sunset and the end of evening twilight are given in accordance with astronomical calendar. Due to shadow of mountains a real sunset in reception place came about 20 min earlier.
Conclusions
Depending on conditions and network operation mode, reflected signals can be both useful and interfering. When the choice of SFN characteristics is right (first of all guard interval) reflected signals from network stations can improve reception conditions. In MFN by contrast reflected signals can lead to interference. For exact estimation of coverage area in mountainous area conditions it makes sense to take into account reflected signals and their impact on digital TV broadcasting reception quality.
Mention should be made of the fact that none of propagation models mentioned above take into account the presence and the impact of reflected signals. Under development of such model it is necessary to take into account the following:
– errors of reflective surfaces modeling, first of all – ground surface;
– reflective surfaces characteristics;
30 Rep. ITU-R BT.2143-2
– changes of reflective surface characteristics depending on weather and climate conditions;
– distortion (error) of phase and polarization of reflected signals.
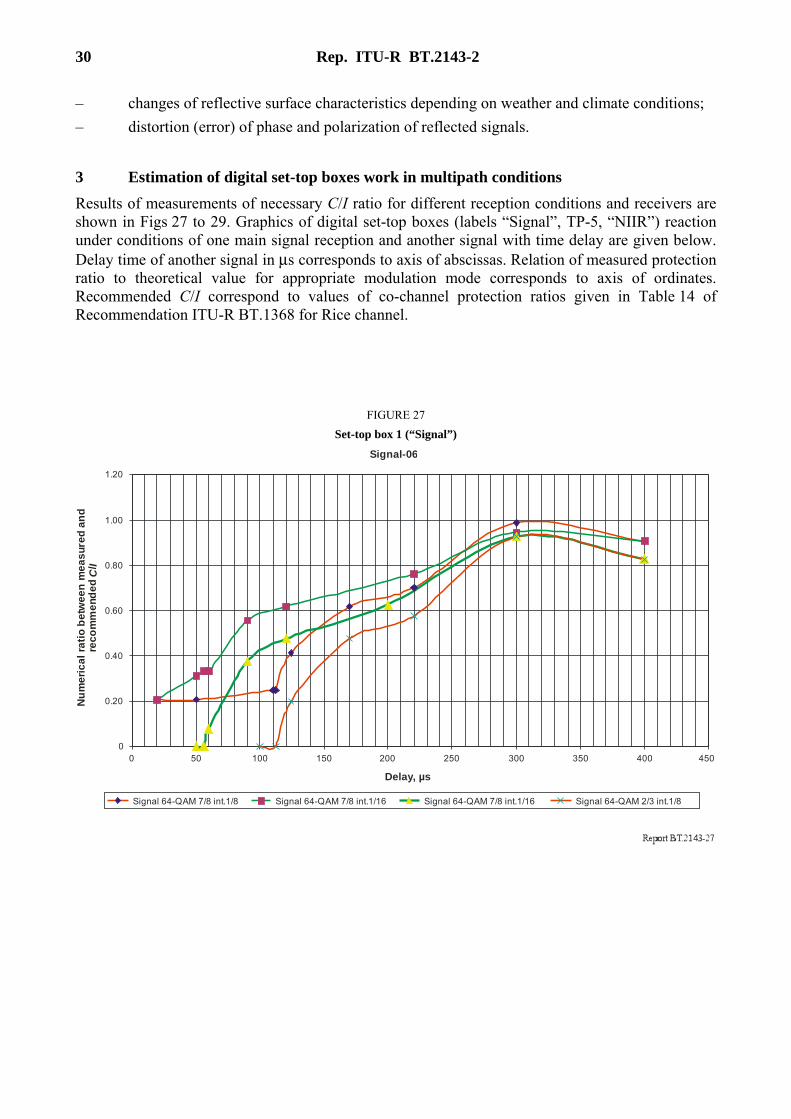
3 Estimation of digital set-top boxes work in multipath conditions
Results of measurements of necessary C/I ratio for different reception conditions and receivers are shown in Figs 27 to 29. Graphics of digital set-top boxes (labels “Signal”, TP-5, “NIIR”) reaction under conditions of one main signal reception and another signal with time delay are given below. Delay time of another signal in μs corresponds to axis of abscissas. Relation of measured protection ratio to theoretical value for appropriate modulation mode corresponds to axis of ordinates. Recommended C/I correspond to values of co-channel protection ratios given in Table 14 of Recommendation ITU-R BT.1368 for Rice channel.
FIGURE 27
Set-top box 1 (“Signal”)
Signal-06
1.20
0
Delay, µs
Num
eric
al ra
tio b
etw
een
mea
sure
d an
d re
com
men
ded
/C
I
Signal 64-QAM 7/8 int.1/8
1.00
0.80
0.60
0.40
0.20
050 100 150 200 250 300 350 400 450
Signal 64-QAM 7/8 int.1/16 Signal 64-QAM 7/8 int.1/16 Signal 64-QAM 2/3 int.1/8

Rep. ITU-R BT.2143-2 31
FIGURE 28
Set-top box 2 (“TP-5”)
0.00
0.20
0.40
0.60
0.80
1.00
1.20
0 50 100 150 200 250 300 350 400 450
Rela
tion
to
/C
Ire
com
men
ded
TP-5 64-QAM 7/8 int.1/8 Signal 7/8 1/8
Delay, s μ
TP-5 64-QAM 7/8 int.1/16 TP-5 64-QAM 2/3 int.1/8 TP-5 64-QAM 2/3 int.1/16
FIGURE 29
Set-top box 3 (“NIIR”)
0.00
0.20
0.40
0.60
0.80
1.00
1.20
0 50 100 150 200 250 300 350 400 450
Rel
atio
n to
/
CI
reco
mm
ende
d
Delay, s μ
NIIR 7/8 1/8 1М NIIR 7/8 1/16 2МNIIR 7/8 1/8 2М NIIR 7/8 1/16 1М

32 Rep. ITU-R BT.2143-2
Measurements carried out by means of set-top box 3 for one modulation mode: 64-QAM 7/8 are shown in Fig. 29. Different conditions were: guard interval (1/8 and 1/16), difference between levels of main and delayed signals (“1M” – means that main signal is more powerful, “2M” – means that delayed signal is more powerful).
Conclusion
Measurements show that set-top boxes of different manufactures have different characteristics. In general set-top boxes characteristics are better than reference model, because reception is possible even when protection ratio between useful and delayed signals is failed. At the same time further changes of set-top box constructive features may require new measurements.
Attachment 1 to Appendix 4
Detailed information on measurements
1 Measurement location
Measurements were carried out in North Caucasus near populated areas Sochi-Lazarevskoe (seashore and mountainous parts of Bolshoi Sochi), Krasnaya Polyana.
Mountain-hilly relief of middle or low height with rich forest flora without ascents and existence of sea signal propagation paths is typical for this location. Populated areas are located both in lows and in down-hills and at tops of hills.
2 Measurement technique
2.1 Measurement of received signal level
This parameter is measured by test DVB-T receiver or spectrum analyser on arbitrary frequency inside a received channel. Levels of carriers are practically identical because frequency spectrum is more or less flat. Possible number of spectrum interference has to be assessed by spectrum analyzer connected to input signal in parallel to test receiver (see Figs 33 and 34).
2.2 Measurement of S/N
Test DVB-T receiver can be used for S/N measuring. But the results of these measurements are not usually accurate with regard to the use of frequency filtering (separation) of carrier power and interference. Spectrum analyzer with RMS detector can be used for more successful S/N measurement.

Rep. ITU-R BT.2143-2 33
2.3 Measurement of BER
There are four BER (before and after Viterbi decoding, before and after Reed Solomon decoding). BER before Viterbi decoding provides information on transmitted signals. BER after Viterbi can be compared with a limit value mentioned in DVB specification (2*10−4), this value provides information on receiver work. From theoretical point of view BER after Reed Solomon decoding can impact on reception quality. BER can be measured by test DVB-T receiver (measurement range of BER is usually 1.10−8–1.10−2).
2.4 Determination of reception quality
To estimate the impact of conditions changes and measured characteristics on reception quality a set of 3 different digital receivers (set top boxes) was used. These receivers were connected to monitor equipped with recording device consequently one after another, reception quality was determined for each set-top box. Later, during the analysis received results were processed to find an average value among these receivers.
Due to complex nature of digital modulation, coding and compression techniques it isn't easy to give a subjective quality mark (“1” – “5”), especially intermediate ones (“2”…”4”), for digital TV/sound reception as it was with analogue TV. Taking into account a need in simple and clear criterion for carrying out tests, “percentage of time 100% quality reception” criterion was chosen.
Reception quality was featured by percent of time during which DVB-T programme picture and sound displayed without any interference (“ideal reception”). The presence of “ideal” reception not less than 99% of observation time considered as acceptable reception quality. This criterion closely corresponds to planning method (99% of time) at a particular measurement point.
3 Description of transmitting network
Test network with transmitters of average power was created for carrying out measurements. These transmitters have the following characteristics:
– Power: 0.1-1.2 kW.
– Antenna suspension high: from 10 -180 m.
– Antenna directivity: changeable (1 and 2 panels).
– Modulation mode: 8K, 16-QAM 2/3, 3/4, 5/6, 64-QAM 2/3, 3/4, 5/6.
– Radio frequency channel: 46.
– Work mode: MFN and SFN.
Measurements were carried out for fixed reception at 10 m high above ground level.
Places of measurements were chosen in the distance of 10-90 km from transmitting side, not far from boundary coverage area, in different directions. Some changes were made in Moscow, 32 channel, QPSK 1/2.
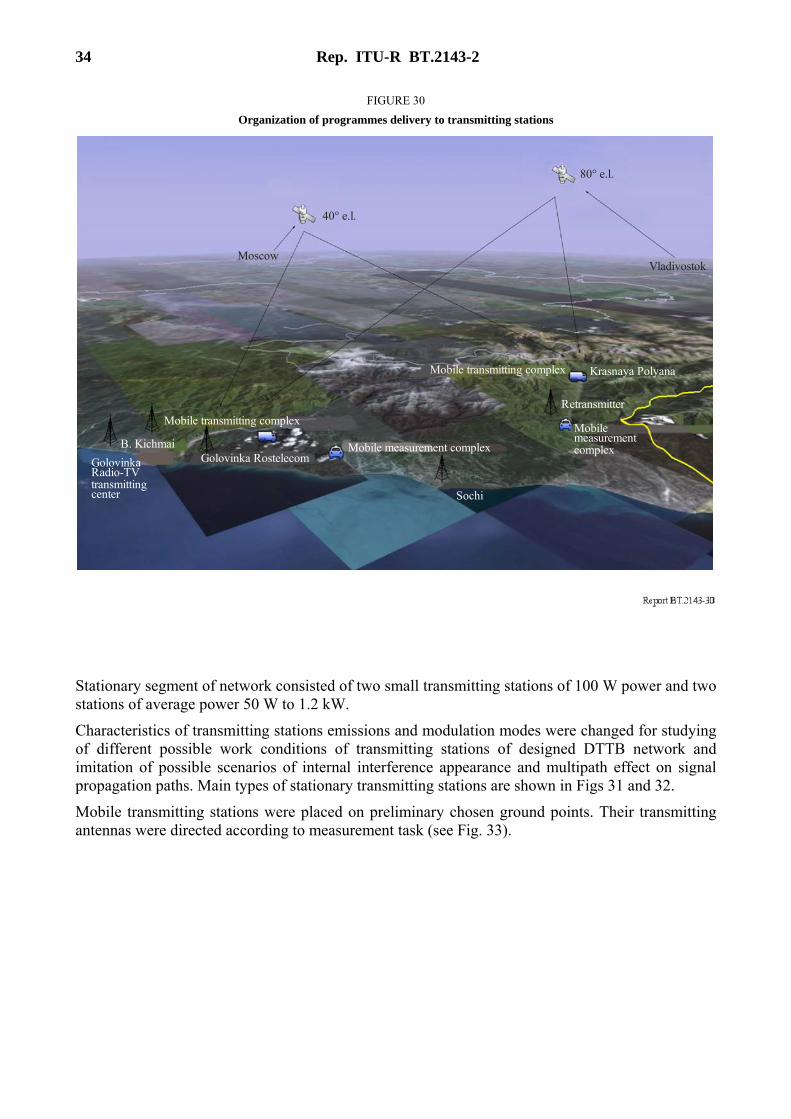
Organization of measurements at transmitting network is shown on Fig. 30.
34 Rep. ITU-R BT.2143-2
FIGURE 30
Organization of programmes delivery to transmitting stations
B. Kichmai
GolovinkaRadio-TVtransmittingcenter
Golovinka Rostelecom
Mobile transmitting complex
Mobile measurement complex
Sochi
Mobile transmitting complex Krasnaya Polyana
Retransmitter
Mobile measurement complex
40° e.l.
Moscow
80° e.l.
Vladivostok
Stationary segment of network consisted of two small transmitting stations of 100 W power and two stations of average power 50 W to 1.2 kW.
Characteristics of transmitting stations emissions and modulation modes were changed for studying of different possible work conditions of transmitting stations of designed DTTB network and imitation of possible scenarios of internal interference appearance and multipath effect on signal propagation paths. Main types of stationary transmitting stations are shown in Figs 31 and 32.
Mobile transmitting stations were placed on preliminary chosen ground points. Their transmitting antennas were directed according to measurement task (see Fig. 33).

Rep. ITU-R BT.2143-2 35
FIGURE 31
Small transmitting stations and main transmitting station of test network
FIGURE 32
Transmitting station at radio-relay line mast

36 Rep. ITU-R BT.2143-2
FIGURE 33
Mobile transmitting station at site
4 Measuring equipment
Measurements were carried out by means of two mobile measurement complexes. Each of them was equipped with identical set of special receiving equipment, measurement and common (meet the requirements of all Union State Standard) receiving antennas and set-top boxes of different producers. In each measurement not less than 3 different digital set-top boxes were used.
Measurement complexes were equipped with computers having special software used for automated documentation of measurement results. They were also equipped with satellite navigation system used for fixing of measurement point coordinates to the location and displaying them on digital map.

Rep. ITU-R BT.2143-2 37
FIGURE 34
Mobile measurement laboratory structure
Commu-nicationline
Controland datastorageunit
Power supplywith filter, stabilizerand backup functions
AC battery
GPSreceiver
GPS antenna
Directional fixed TV antenna
10 m telescoping mast
DTTBSet-top boxesSelector
TV receiver
Test receiver
Spectrum analyser
TABLE 2
Measuring equipment
Equipment Producer Model
1 Test receiver Rohde & Schwarz ETL
1 Test receiver Rohde & Schwarz EFA-40
2 Spectrum analyzer Rohde & Schwarz FSQ
3 Decoder Radio manufacturing plant “Signal” TLS2006TFTA
4 Telecom-project 5 Ltd. TP5-3800TSD
5 NIIR FSUE NIIR Terminal multifunctional
6 General satellite (assembled in Saint-Petersburg)
TE-8310
7 Receiving antenna NIIR FSUE 21/69
8 Measurement antenna Rohde & Schwarz HL223
9 TV receiver Philips 19PFL4322

38 Rep. ITU-R BT.2143-2
Mobile measurement laboratory was equipped with telescoping mast of 10 m height and calibrated receiving antenna for fixed reception. At the beginning of measurement campaign receiving antennas were checked for meeting the requirements of Recommendation ITU-R BT.419-3 for fixed receiving antennas.
In the process of measurements receiving antenna was oriented in horizontal plane in direction to maximum receiving signal level, then – in direction to transmitters.
Appendix 5
Digital terrestrial television broadcasting reception conditions in the urban environment
1 The impact of the propagation path on useful signal field strength
In urban conditions, the relationship between the field strength and the propagation path has a complex character due to several factors:
− the reduction of useful signal field strength due to loss caused by the presence of obstacles, such as buildings, within the propagation path;
− the diffraction effects on the edges of obstacles resulting from buildings and terrain;
− the presence of additional rays reflected from obstacles located outside the direct route from the transmitter to the point of reception.
During studies of experimental single-frequency networks in Moscow in October-December 2010, a series of measurements of the field strength were taken in different parts of the city. A comparison of measured and calculated models, which is an estimate of the difference of the measured field strength with the predicted value by different propagation models, was part of these studies.
All models for forecasting can be divided into two groups: statistical models and deterministic models. In this analysis, the following models were considered:
– A propagation model based on propagation curves, representing statistically averaged results of many measurements (Recommendation ITU-R P.1546);
– An Okamura-Hata model (in this study, the basic variant);
– A propagation model based on Recommendation ITU-R P.1812 not taking into account any buildings (a path-specific propagation prediction method with terrain profile data only);
– A propagation model based on Recommendation ITU-R P.1812 with 3D building models (a path-specific propagation prediction method with both terrain profile and building data).
Predicted results were compared with results of measurements.
Rep. ITU-R BT.2143-2 39
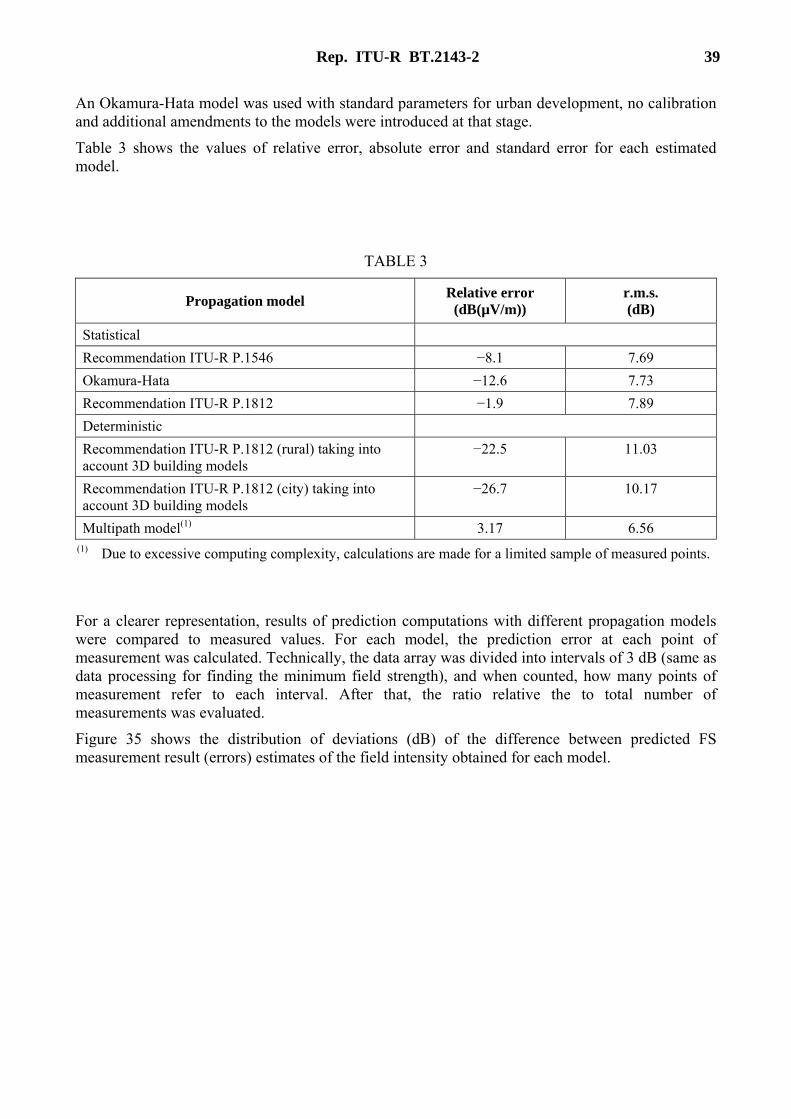
An Okamura-Hata model was used with standard parameters for urban development, no calibration and additional amendments to the models were introduced at that stage.
Table 3 shows the values of relative error, absolute error and standard error for each estimated model.
TABLE 3
Propagation model Relative error
(dB(µV/m)) r.m.s. (dB)
Statistical
Recommendation ITU-R P.1546 −8.1 7.69
Okamura-Hata −12.6 7.73
Recommendation ITU-R P.1812 −1.9 7.89
Deterministic
Recommendation ITU-R P.1812 (rural) taking into account 3D building models
−22.5 11.03
Recommendation ITU-R P.1812 (city) taking into account 3D building models
−26.7 10.17
Multipath model(1) 3.17 6.56 (1) Due to excessive computing complexity, calculations are made for a limited sample of measured points.
For a clearer representation, results of prediction computations with different propagation models were compared to measured values. For each model, the prediction error at each point of measurement was calculated. Technically, the data array was divided into intervals of 3 dB (same as data processing for finding the minimum field strength), and when counted, how many points of measurement refer to each interval. After that, the ratio relative the to total number of measurements was evaluated.
Figure 35 shows the distribution of deviations (dB) of the difference between predicted FS measurement result (errors) estimates of the field intensity obtained for each model.

40 Rep. ITU-R BT.2143-2
FIGURE 35 Distribution of difference between predicted and measured field strength

Rep. ITU-R BT.2143-2 41
Figures 36 to 39 are diagrams of the standard deviation calculated from the measured values for each type of zone. Figure 36 shows the total results of calculations on Recommendation ITU-R P.1546 excluding construction, Fig. 37 – Recommendation ITU-R P.1812 excluding construction, Fig. 38 – Recommendation ITU-R P.1812 and taking into account the development of the city, Fig. 39 – Okamura-Hata model.
FIGURE 36
Recommendation ITU-R P.1546, building data not taken into account

42 Rep. ITU-R BT.2143-2
FIGURE 37
Recommendation ITU-R P.1812, building data not taken into account
FIGURE 38
Recommendation ITU-R P.1812, building data taken into account
0
2
4
6
8
10
12
14
16
row 8.7 10.9 8.3 7.7 15.7 12.6
1 2 3 4 5 6
0
5
10
15
20
25
30
35
row1 20.2 21.2 28.7 22.7 33.8 29.9
1 2 3 4 5 6

Rep. ITU-R BT.2143-2 43
FIGURE 39
Okamura-Hata model
Column 1 – green structures without building;
Column 2 – low-rise buildings in part;
Column 3 – the industrial zone, and hangar;
Column 4 – highways, located outside the building;
Column 5 – the highway, surrounded by buildings;
Column 6 – other areas.
As seen in the figures, results closest to the measurement data are obtained when evaluating the field strength in accordance with Recommendation ITU-R P.1546 excluding buildings. With the Recommendation ITU-R P.1812 method, variation of the difference between measured and predicted results is larger. Moreover, the model calculation based on ITU-R P.1812 development, has shown for urban areas (except parks), the worst result among the studied models. This method can probably show more adequate results when used in a multibeam model.
It is important to note that the results of the study, the calculated values for all methods on average, are slightly lower than the experimentally determined field strength. This suggests that virtually all methods do not fully take into account the nature of the multipath propagation in urban environments.
Figure 40 displays the example of the channel impulse response (black vertical lines). Red lines show the estimation of signals from other stations of the network. Each of them has its own time delay and amplitude. The zero position corresponds to the beginning of the receiver working window.
0
2
4
6
8
10
12
14
row1 10.6 12.9 10 8.6 8.8 9.51 2 3 4 5 6

44 Rep. ITU-R BT.2143-2
Vertical green lines show the boundaries of safety intervals for a given regime. Since the single-frequency network is optimal for the standard DVB-H mode 8K (6 817 active carriers, useful part of the symbol 896 ms), each segment in the graph corresponds to a certain guard interval:
− 28 ms – 1/32;
− 56 ms – 1/16;
− 112 ms – 1/8.
FIGURE 40
Multibeam echo in urban conditions (Rice distribution)
It should be noted that in the real channel response, the number of rays (black) at the receiver input far exceeds the number of estimated rays with a typical non-multibeam propagation model (red) from transmitting stations of the network. This excess indicates the presence of a large number of reflected rays in a real urban environment. In dense urban areas, there are many ways to spread the signal from the transmitter to the receiver. The picture also shows that as the response time delay increases, its amplitude decreases. Those delayed responses are typically results of re-reflection from various objects, buildings, resulting in loss of part of the energy and changes phase. Figure 40 can be considered as an example similar to the Rice distribution, because useful signal amplitude has a maximum value, and the measurements were taken relatively close to the transmitting station. At the same time, it was a direct line-of-sight between the transmitter and the measurement site. The example in Fig. 41 can be considered more related to the Rayleigh distribution. The absence of the most powerful by amplitude beam is a consequence of shading on the signal propagation path.

Rep. ITU-R BT.2143-2 45
FIGURE 41
Multibeam echo in urban conditions (Rayleigh distribution)
The figure shows that prediction (red lines) in both cases does not fully reflect the measurements (black lines). Development of multipath propagation models is desirable, but usage of such models with a 3D building database in large cities require extremely high computing resources. For networks consisting of a large number of stations, operating in the real world with external interference, coverage computation definitely requires distributed computing.
In addition to the factors listed above, to obtain good accuracy of field-strength prediction, attention should be given, as much as possible, to accuracy of the initial input data, in particular – the parameters of transmitting stations, as well as the three-dimensional model of natural obstacles on the path of signal propagation (terrain, vegetation) and man-made objects (buildings, bridges, etc.). The errors inherent in the preparation of input data can disable all the advantages of a complex propagation model. Therefore, when choosing a model, it is important to assess in advance the possible magnitude of prediction ambiguities that arise when using input data with insufficient detail and precision.
One of the main parameters that have great impact on the propagation factors in the city are the presence of reflected signals from buildings and large objects, diffraction of radio waves, dissipation of energy on the ground, the Doppler effect, characteristics of a fast-moving receiver. The most reliable result can only be given by the model, which takes proper account of the above-mentioned physical effects. In particular, as seen before, in city areas, it is preferable to use the so-called “multibeam” propagation models. However, the use of such sophisticated models may require extremely large computing resources. This creates mentionable difficulties when using such models – including the need to use a super computer or a large number of computers for distributed processing. Thus, the search for a more simple solution that provides prediction with sufficient accuracy remains to be the actual task.

46 Rep. ITU-R BT.2143-2
There are several “deterministic” models providing good accuracy, if applied properly. A special feature and at the same time – limitation – of these models is the need for calibration, requiring extensive measurements on the designed network or a similar one (which also may not always be possible).
For a more accurate field-strength prediction in the city, propagation models need to be adjusted, including the change of certain numerical parameters responsible for the accounting of relevant propagation effects. Therefore, when designing new networks, no measurements can be done before the network (or part of it) starts to operate, and usage of such models without calibration may not give a good prediction. In that case, after the network starts to operate, it turns out that propagation models have to be corrected, and the network structure or some parameters have to be changed to achieve the intended coverage because the FS prediction method was not good enough during the design phase.
For the purposes of the large city-wide networks frequency planning and initial networks design, the models based on Recommendations ITU-R P.1546 and ITU-R P.1812 give statistically corresponding results for all city areas without the usage of detailed clutter or 3D building models data. In that case, there is no need to consider buildings as signal attenuation due to artificial barriers to a large single-frequency network, to a large extent offset by the presence of multiple signal arrival directions and the effects of multiple reflections from the lateral surfaces of buildings.
2 Conclusions
Among the statistical propagation models, Recommendation ITU-R P.1546 gives the value of standard deviation equal to 7.7 dB. Due to the large number of stations (over 30) and the reflections in urban environments often exhibiting a characteristic picture of “multipath” reception, which significantly reduces the impact of surrounding development to receive the signal. Extensive transmitting network, consisting of many transmitting stations, provides multipath reception, significantly decreasing the impact of propagation loss, caused by surrounding buildings, on reception conditions. It can be concluded that the relatively good results obtained with the help of statistical models suggest that the principle of constructing a single frequency network with a large number of transmitting stations is adequate for big cities.
For deterministic prediction models it can be concluded that the accuracy of such models depends strongly on the calibration complexity and accuracy. The Recommendation ITU-R P.1812 model, when propagation path profile takes into account 3D building models, gives significantly underestimated results, owing to the fact that the measured field is a result of receiving the reflected rays of different stations, which this model does not account for. For urban areas, the use of multi-models is recommended. Accounting multipath quite expensive in terms of computing power process, however, processing of several routes of measurements based on the multipath model gives better results. In the study on a limited sample of points, the multipath model standard deviation is equal to 6.56 dB.
If a more detailed picture concerning details on separate reception locations has to be prepared, clutter data or 3D building models and multipath propagation effects both should be taken into consideration.

Rep. ITU-R BT.2143-2 47
Attachment 1 to Appendix 5
Detailed information on measurements
1 Measurement location
Research and field tests were conducted on two networks, digital broadcasting standard DVB-H, designed to serve the territory of Moscow city using 26 TV channels (35 transmitters) and 36 TV channels (34 transmitters).
Two DVB-H networks for different frequency channels have been constructed at the transmitter and the average low-power – 100 or 400 W, with each network is a powerful station – 1 and 2.5 kW.
The chosen structure of networks has a large number of stations (34 stations operating in one network and 35 in another) due to the need for admission to the premises and transport in the territory of Moscow.
The city of Moscow has an area of 1 081 km2, with buildings of different heights. The central areas are built up with buildings from 2 to 7-8 floors with a small number of high-rise buildings located at great distances from each other. Outlying areas usually have high-rise buildings with average density (buildings of 16-20 storeys and above). In addition, the city has several large industrial zones.
2 Measurement technique
2.1 Measurement of received signal level
This parameter is measured by the test DVB-H receiver or spectrum analyzer on arbitrary frequency inside a received channel. Levels of carriers are practically identical because the frequency spectrum is more or less flat. The possible number of spectrum interference has to be assessed by the spectrum analyzer connected to the input signal in parallel to the test receiver.
2.2 Determination of reception quality
To estimate the impact of condition changes and measured characteristics on reception quality, a set of three different digital portable and car-mounted receivers was used. These receivers were observed with recording of any distortions in sound and picture. Reception quality was determined for each one. Later, during the analysis, received results were processed to find a representative value among these receivers.
Due to the complex nature of digital modulation, coding and compression techniques, it is not easy to give a subjective quality mark (“1” – “5”), especially intermediate ones (“2”… “4”), for digital TV/sound reception as it was with analogue TV. Taking into account the need for a simple and clear criterion for carrying out tests, a “percentage of time 100% quality reception” criterion was chosen. Reception quality was featured by percentage of time during which the DVB-H program picture and sound displayed without any interference (“ideal reception”). The presence of “ideal” reception during not less than 99% of the observation time was considered to be an acceptable reception quality. This criterion closely corresponds to the planning method (99% of time) at a particular measurement point.

48 Rep. ITU-R BT.2143-2
Measurements of the parameters of the signal were carried out using the test receiver DVB-H or a spectrum analyzer connected to the omnidirectional measurement antenna, mounted on the roof of the car.
During the measurements, the following equipment was used:
– TV Analyser R & S ETL – as a measuring signal receiver;
– Spectrum Analyser Rohde & Schwarz FSQ26;
– calibrated measuring antenna interdigital type;
– GPS-receiver Garmin.
Visual assessments of the quality of the decision-television programmes were carried out on the following terminals:
– Samsung P960 (mobile phone with DVB-H receiver using separate pull-out UHF antenna);
– Personal Multimedia Player INVIX\TBTEC;
– prefix QTM TV with external diversity antenna.
An evaluation of the image quality for a software decoder monitoring system of the company Rohde & Schwarz R & S DVM50 was also conducted.
The scheme of the measuring system of a mobile radio laboratory is shown in Fig. 42.
FIGURE 42
Scheme of the measuring system
6-256-01
Computer
TV analyser R & S ETL
Omnidirectional pencil antenna
GPS receiver

Rep. ITU-R BT.2143-2 49
FIGURE 43
Mobile radio measurement laboratory
Before and after measuring the radio laboratory calibration, measurements were performed using a test transmitter operating in a controlled environment with known parameters of the radio channel.
The measurements were made in motion, and data were recorded at intervals of 2 s. To eliminate the influence of the Doppler effect, measurements were made at a rate of not more than 40 km/h. At each of the tracks, measurements were carried out at least twice while driving in opposite directions. When the car stops, the recording of the measurements is interrupted.
3 Measurement routes
For measurements, different routes were selected to include the characteristic types of buildings in the city and major highways. The measurement results are stored and processed in digital format.
Figure 44 shows the route measurements. Different colours in the figure indicate the paths of the three involved in the measurements of the measuring car.

50 Rep. ITU-R BT.2143-2
FIGURE 44
Measurement routes


