
Boudouard carbon deposition on nickel cermet … Tunold et al. 2002; Weber, Sauer et al. 2002; Jiang...
26
1. CHEMICAL ENGINEERING SCIENCE 64(10):2291-2300 15 May 2009 The effect of current density and temperature on the degradation of nickel cermet electrodes by carbon monoxide in solid oxide fuel cells Offer, G. J.*, Brandon, N. P. Department of Earth Science Engineering, Imperial College London, SW7 2BP, UK * corresponding author: [email protected] ; tel: +44 (0)20 7594 5018; fax: +44 (0)20 7594 7444 Keywords Accelerated Degradation, Catalysis, Catalyst deactivation, Electrochemistry, Energy, Fuel Cell, Kinetics, Solid Oxide, Thermodynamics 1 Abstract The oxidation of dry Carbon Monoxide (CO) in Intermediate Temperature Solid Oxide Fuel Cells (IT-SOFCs) has been studied using a three electrode assembly. Ni/CGO:CGO:LSCF/CGO three electrode pellet cells at 500, 550 and 600C were exposed to dry carbon monoxide for fixed periods of time, at open circuit and under load at 50 and 100 mA cm -2 , in an aggressive test designed to accelerate electrode degradation. It is shown that if the anode is kept under load during exposure to dry CO, degradation in anode performance can be minimised, and that under most conditions the anode showed significant irreversible degradation in performance after subsequent load cycling on dry H 2 . Only at 500C and at 100 mA cm -2 was the degradation in performance after operation on dry CO and subsequent load cycling on dry H 2 within the background degradation rates measured. Where anode performance was compromised, this appeared to be caused by a reduction in the exchange current density for hydrogen oxidation, and the relatively large degradation after load cycling on dry H 2 was primarily caused by an increase in the series resistance of the anode. It is suggested that this increase in series resistance is associated with the removal of carbon deposited in the non-electrochemically active region of the electrode during operation on dry CO, and that operation under load inhibits carbon deposition in the active region. 2 Introduction Investigations of Ni cermet anodes operating on CO or CO/CO 2 mixtures have been reported by a number of authors (Mizusaki, Aoki et al. 1990; Eguchi, Setoguchi et al. 1993;
-
Upload
trinhtuyen -
Category
Documents
-
view
215 -
download
0
Transcript of Boudouard carbon deposition on nickel cermet … Tunold et al. 2002; Weber, Sauer et al. 2002; Jiang...

1.
CHEMICAL ENGINEERING SCIENCE 64(10):2291-2300 15 May 2009
The effect of current density and temperature on the degradation of
nickel cermet electrodes by carbon monoxide in solid oxide fuel cells
Offer, G. J.*, Brandon, N. P.
Department of Earth Science Engineering, Imperial College London, SW7 2BP, UK
* corresponding author: [email protected]; tel: +44 (0)20 7594 5018; fax: +44 (0)20 7594
7444
Keywords
Accelerated Degradation, Catalysis, Catalyst deactivation, Electrochemistry, Energy, Fuel
Cell, Kinetics, Solid Oxide, Thermodynamics
1 Abstract
The oxidation of dry Carbon Monoxide (CO) in Intermediate Temperature Solid Oxide Fuel
Cells (IT-SOFCs) has been studied using a three electrode assembly. Ni/CGO:CGO:LSCF/CGO
three electrode pellet cells at 500, 550 and 600C were exposed to dry carbon monoxide for fixed
periods of time, at open circuit and under load at 50 and 100 mA cm-2, in an aggressive test
designed to accelerate electrode degradation. It is shown that if the anode is kept under load
during exposure to dry CO, degradation in anode performance can be minimised, and that under
most conditions the anode showed significant irreversible degradation in performance after
subsequent load cycling on dry H2. Only at 500C and at 100 mA cm-2 was the degradation in
performance after operation on dry CO and subsequent load cycling on dry H2 within the
background degradation rates measured. Where anode performance was compromised, this
appeared to be caused by a reduction in the exchange current density for hydrogen oxidation, and
the relatively large degradation after load cycling on dry H2 was primarily caused by an increase in
the series resistance of the anode. It is suggested that this increase in series resistance is
associated with the removal of carbon deposited in the non-electrochemically active region of the
electrode during operation on dry CO, and that operation under load inhibits carbon deposition in
the active region.
2 Introduction
Investigations of Ni cermet anodes operating on CO or CO/CO2 mixtures have been
reported by a number of authors (Mizusaki, Aoki et al. 1990; Eguchi, Setoguchi et al. 1993;

2.
Mizusaki, Tagawa et al. 1994; Yoshida, Yamamoto et al. 1994; Aaberg, Tunold et al. 1996;
Holtappels, De Haart et al. 1999; Matsuzaki, Hishinuma et al. 1999; Matsuzaki and Yasuda 2000;
Lauvstad, Tunold et al. 2002; Weber, Sauer et al. 2002; Jiang and Virkar 2003; Gemmen and
Trembly 2006; Sukeshini, Habibzadeh et al. 2006). However these have so far been limited to YSZ
containing anodes, and temperatures of 700C and above. Furthermore, thermodynamics predict
that in both dry fuels and at temperatures of 600C and below, which are of interest for IT-SOFC
operation, carbon deposition is a significant problem. This requires dilution of carbon containing
fuel streams with the products of oxidation, or oxygen.
The steam to carbon ratio is often used to predict the propensity of carbon deposition under
such conditions, most often presented in the form of C-H-O diagrams as shown by Sasaki and
Teraoka (2003). However, thermodynamic predictions are only applicable in ideal conditions, and
in an operating fuel cell the reaction kinetics must also be considered. In addition it is also known
that; maintaining a fuel cell at reasonable currents can have a protective effect by reducing carbon
deposition in the electrochemically active region of the anode (Weber, Sauer et al. 2002; Gunji,
Wen et al. 2004); and that novel anode materials can help prevent carbon deposition demonstrated
by Brett, Atkinson et al. (2005); and even that some carbon deposition can be beneficial as
suggested by Mallon and Kendall (2005). In this paper we explore further the effect of current on
carbon deposition via the Boudouard reaction as shown in equation 1, expanding on work
presented previously by Offer and Brandon (2008).
CCOCO 22 Equation 1
When conducting investigations into carbon monoxide oxidation at temperatures below
700C it is very difficult to decouple effects caused by carbon deposition, and effects caused by
changes in the electrochemical performance of the anode. A complete decoupling of these effects
is not achieved in this paper, nor is a discussion of the mechanism of the carbon monoxide
electrochemical oxidation reaction (COOR) at intermediate temperatures; instead an empirical
comparison of fuel cell performance after subjection to aggressive testing in dry CO is presented
and discussed. In further papers we will publish results for an SOFC using Ni/CGO anodes
operating on CO/CO2 mixtures at temperatures between 500 and 600C, the use of ex-situ Raman
spectroscopy, and comments on the mechanism of the COOR.
3 Experimental
Gadolinium doped ceria (CGO) pellets were prepared by pressing CGO (CGO-10,
FuelCellMaterials, USA) powder at 1 Tonne pressure for 30 s, before firing at 1400C for 3 hours at
a ramp rate of 2C min-1. The pellets were polished to ensure uniform thickness (average 1mm)
before nickel oxide cermet ink (50:50 NiO/CGO, FuelCellMaterials, USA) as the anode and

3.
strontium cobalt doped lanthanum ferrite ink (50:50 La0.6Sr0.4Co0.2Fe0.8O3 / CGO, FuelCellMaterials,
USA) as the cathode were screen printed (error of ±125 μm in the placement of electrode
geometries) and fired sequentially at 1300C and 1125C respectively. The electrodes were
approximately 20 μm thick as produced. The anode was a circular disk 11 mm in diameter with a
surface area of 0.95 cm2 and the cathode was an identical circular disk, surrounded by a ring with
an internal diameter of 17 mm, and an external diameter of 19 mm. All data was collected using a
three electrode configuration with the anode as the working electrode and a full description of the
three electrode experimental apparatus and the correction procedure used to calculate the
polarisation characteristics of the pellets is described in previous work by Offer, Shearing et al.
(2008). This is necessary because there are limitations when using a reference electrode in a
pellet cell configuration that under certain conditions can cause large errors (Winkler, Hendriksen
et al. 1998; Adler, Henderson et al. 2000). In summary the correction procedure applied involves
measuring the potential response at a series of current densities, and correcting for the
uncompensated ohmic resistance (Rs) at that current density to calculate the overpotential, and
build up an i- curve. An example of this correction procedure is presented below. The cell was
taken up to the operating temperature at a ramp rate of 2C min-1 with the anode side exposed to a
2.5% H2O, 48.75% N2 / 48.75% H2 atmosphere. During testing the atmosphere was either dry 50%
N2 / 50% H2 or dry 50% N2 / 50% CO. For the electrochemical measurements, an Autolab
PGSTAT302 (Eco Chemie BV, The Netherlands) with an FRA module was used. The
electrochemical impedance spectroscopy (EIS) response was measured in the frequency range
0.01 Hz to 100 kHz with one point measured at each decade and a stimulus potential amplitude of
10 mV(rms) used throughout. Autolab NOVA 1.3 software was used to log and analyse the
measurements. The EIS data was fitted with a standard electrochemical circuit incorporating a
resistor (Rs), in series with a resistor (Rp) and a constant phase element in parallel.
In these experiments, the fuel cell anodes were maintained at a range of currents and
temperatures and exposed to dry CO, the fuel utilisation was low (<1%) such that the reaction
products from the electrochemical reactions would not be expected to have a large effect
(assuming thermodynamic equilibrium and no diffusion limitations within the anode). Therefore any
differences are attributed to local effects caused by surface species, significant residence times of
reaction products within the cermet electrodes, or inadequacies in assuming thermodynamic
equilibrium within a cermet electrode.
The experimental procedure was as follows:
1. The cell was characterised under operation on wet H2 overnight with a 40 point
characterisation i- curve with EIS at each point from 0 to 100 mA cm-2.

4.
2. The cell was characterised under operation on wet H2 with a 5 point characterisation i-
curve with EIS at each point from 0 to 100 mA cm-2. Comparison with the performance
measured in step 1 at identical current densities enabled a background degradation rate to
be estimated.
3. The cell was switched over to dry H2 and purged for 2 hours.
4. The cell was characterised under operation on dry H2 with a 5 point characterisation i-
curve with EIS at each point from 0 to 100 mA cm-2.
5. The carbon monoxide experiment was performed, see below.
6. The cell was characterised under operation on dry H2 with a 5 point characterisation i-
curve with EIS at each point from 0 to 100 mA cm-2.
7. The fuel stream was switched to dry N2 and the furnace allowed to cool to room
temperature as quickly as possible without cracking the pellet.
The cells were exposed to carbon monoxide according to the following procedure:
5.a. The cell was polarised at the specified current on dry H2.
5.b. The cell was held at this current for 1 hour, and the fuel stream was then switched over
to dry CO.
5.c. During operation upon CO an EIS spectra was taken approximately every 10 minutes
whilst maintaining the current.
5.d. After 1 hour the fuel stream was switched back to dry H2 and the current maintained for
a further 60 minutes whilst continuing to collect EIS spectra approximately every 10
minutes.
In order to assess the performance of the cells before and after carbon monoxide exposure
an i- curve with EIS at each point is needed (steps 4 and 6), however, for the experiments at zero
current this will produce some water at the anode which may not be entirely removed during the
hour equilibration step prior to the introduction of carbon monoxide.
In addition the nature of CGO as a mixed ionic/electronic conductor means there will
always be some leakage current, and therefore in a H2 atmosphere a small amount of water will
always be present, which could effect the rate of carbon deposition.
The conditions studied here were at temperatures of 500 C, 550 C, and 600 C and
current densities of 0 mA cm-2 (zero), 50 mA cm-2 (low), and 100 mA cm-2 (high).

5.
3.1 Example correction procedure
The dataset before exposure to CO at 600 C for the pellet exposed at 100 mA cm-2 is
arbitrarily selected here to demonstrate the importance of applying the correct procedure when
calculating anode overpotentials from current potential curves obtained using pellet cells.
The data shown in 0 (a) is the potential between the anode and the reference electrode as
a function of current density. In order to begin the correction procedure this must first be converted
into overpotentials by subtracting the open circuit potential, as shown in 0 (b). It should be noted
that the overpotential at this point is a function of the anode polarisation resistance, and some
portion of the electrolyte resistance. Therefore, in order to subtract the uncompensated resistance
between the working and reference electrodes it is normal to determine the series resistance (Rs)
using impedance spectroscopy at open circuit, and to subtract this from the overpotentials using V
= IR. This is acceptable if the series resistance between the working and reference electrodes
does not change with current density. However, this is not true in the majority of pellet cell
configurations used by SOFC investigators, and the errors that can be introduced by this effect can
be considerable (Winkler, Hendriksen et al. 1998; Adler, Henderson et al. 2000). To mitigate this, it
is possible to create a i-η curve by determining the Rs at multiple points using impedance
spectroscopy at load, and then use the correct Rs values to compensate for the uncompensated
resistance at that current and therefore current distribution. In this work we perform a 5 point
characterisation measurement for the results presented. Figure 2 shows the anode overpotentials
calculated using the single Rs value and the overpotentials calculated correctly using the different
Rs values at load. The data presented in Figure 4 is the corrected data calculated using this
procedure, and it is worth noting that if the correction procedure had not been applied the
overpotentials of the anodes would have been overestimated by almost an order of magnitude, as
shown in Figure 2.
The corrected results shown in Figure 4 are then fitted to the Butler-Volmer equation
(equation 2) to extract the anode exchange current density and transfer coefficient.
4 Results
Images of the anodes investigated are shown in Figure 3. Features to note in Figure 3 are
the different regions characterised by the presence or absence of a 1mm wide flow channel which
was positioned horizontally across the pellets as depicted, and a central region where the fuel
impinged upon the pellet. It is clear that the different regions of the pellet have experienced
different operating conditions and have been affected in different ways. This is likely to have an
effect upon the electrochemical performance of the different regions, and as such the
electrochemical performance reported here is an average of these. Effects of this type should be
avoided if at all possible, although it was not possible in the present work. However, it is worth

6.
noting that these effects are likely to occur in a real operating fuel cell, and as such will be
investigated further in a future study.
Figure 4 shows an analysis of the i- performance of the anodes before and after exposure
to dry CO, shown as a comparison of the exchange current density for hydrogen oxidation on the
anodes.
Example chrono-amperometric data and EIS spectra for the experiments conducted at
500C and 100 mA cm-2 are shown in 0, and an analysis of the series resistance (Rs) and the low
frequency polarisation resistance (Rp) from the EIS spectra for all the experiments shown in Figure
6.
Visually inspecting Figure 4 suggests that the electrochemical performance of the anodes is
worse for those that were exposed to dry CO at the lowest current densities. The damage to the
electrochemical performance of the anodes held at 100 mA cm-2 appears to be minimised, and at
500C the damage is negligible. The results shown in Figure 4 were fitted using the Butler-Volmer
equation 2 below, and the results are presented in Table 1.
RT
F
RT
Fjj
1expexp0 Equation 2
Where j is the current density, jo is the exchange current density, T is the temperature, α is
the transfer coefficient and η is the overpotential. R and F have their usual values of 8.314 J K-1
mol-1 and 96485 C mol-1 respectively.

7.
500C 0 mA cm-2 50 mA cm-2 100 mA cm-2 Average
Before After Before After Before After Before
jO / A cm-2 0.055 0.045 0.054 0.047 0.044 0.043 0.051
α 0.47 0.23 0.51 0.32 0.48 0.52 0.49
Variance jO 27% 28% 5.00% 8.30% 25% 27% n/a
Variance α 37% 38% 6.70% 11.50% 32% 33% n/a
Rct / Ω cm2 1.15 1.42 1.17 1.35 1.44 1.48 1.25
550C 0 mA cm-2 50 mA cm-2 100 mA cm-2 Average
Before After Before After Before After Before
jO / A cm-2 0.118 0.033 0.244 0.124 0.082 0.073 0.148
α 0.5 * 0.5 * 0.5 * 0.5 * 0.5 * 0.5 * 0.5
Variance jO 7.64% 8.54% 3.01% 2.08% 6.40% 4.00% n/a
Variance α n/a n/a n/a n/a n/a n/a n/a
Rct / Ω cm2 0.60 2.16 0.29 0.57 0.87 0.97 0.59
600C 0 mA cm-2 50 mA cm-2 100 mA cm-2 Average
Before After Before After Before After Before
jO / A cm-2 0.133 0.05 0.086 0.064 0.257 0.175 0.158
α 0.49 0.39 0.45 0.36 0.5 * 0.5 * 0.48
Variance jO 24.50% 21.50% 14.60% 8.40% 1.80% 3.80% n/a
Variance α 78.80% 29.50% 32.70% 20.20% n/a n/a n/a
Rct / Ω cm2 0.57 1.5 0.87 1.18 0.29 0.43 0.47
Table 1. Table comparing the fits at 500, 550 and 600C to the Butler-Volmer equation 2
using Origin 6.1 non-linear curve fitting function for the results shown in Figure 4,
showing extracted electrode parameters for hydrogen oxidation before and after
exposure to dry CO for one hour, at 0, 50, and 100 mA cm-2. (* Where the error
values for the transfer coefficient were too large, a value of 0.5 was assumed).
From Table 1 it is possible to state that, whilst there is some scatter in the electrochemical
performance of the anodes before testing there is a clear improvement in the performance of the
anodes as the temperature increases, with the exchange current density (j0) increasing from an
average of 51 mA cm-2 at 500C to 158 mA cm-2 at 600C. The transfer coefficient (α) did not
appear to change, suggesting that the mechanism of the hydrogen oxidation reaction does not
change across this temperature range, with values approaching 0.5. At times the scatter in the
data did not permit the transfer coefficient value to be extracted and instead a value of 0.5 had to

8.
be assumed. It should be noted that for anodes exposed to CO at 0 mA cm-2 the subsequent
characterisation of the anode may remove some of the deposited carbon, either by direct oxidation
to CO2 or CO, or via reforming reactions with product water. We suggest that this results in the
performance of the anode decreasing over the timescale of the characterisation, resulting in an
lower apparent transfer coefficient because of levelling off of the i- curve over time. This also
occurred for some results at load. This was unavoidable, and further discussion of the transfer
coefficient is therefore avoided.
It was demonstrated that direct oxidation of deposited carbon to CO2 or CO was possible
by repeating an experiment and switching to dry N2 after exposure to CO and then drawing current.
Significant current densities were possible for many minutes with the initial performance
approaching that on dry H2 but with continuous irreversible degradation in performance which was
not recoverable upon switching to dry or wet H2. The anode had effectively become a carbon
battery.
After testing it can be seen that the performance is worse for all the anodes except 100 mA
cm-2 at 500C, with the exchange current density decreasing significantly. Statistical significance
was taken to be outside the bounds of errors calculated using Origin 6.1, although the tests at 0
mA cm-2 are discounted because of large errors caused by experimental noise. However, from
Figure 4 it is clear that the performance is worse after exposure at OCP. Therefore the only anode
for which the performance is not worse is the one which was maintained at 100 mA cm-2 at 500C.
For all anodes for which the exchange current density has been affected it is suggested
that this is associated with a reduction in the number of percolated three phase boundaries. In this
paper we suggest the most plausible explanation is that the deposition and subsequent removal of
the carbon has caused stresses in the anode which are proportional to the destruction of the
mechanical integrity (and concomitant electrical interconnectivity) of the anode. In addition it is
possible that carbon deposits remaining on or in the anode have modified the nickel surface such
that the surface diffusion of species involved in the hydrogen oxidation reaction are inhibited.
The charge transfer resistance Rct can be estimated from the exchange current using
equation 3.
0Fj
RTRct Equation 3
The charge transfer resistance calculated using equation 3 for the nine anodes before and
after dry CO exposure is also shown in Table 2. In order to assess the extent of degradation
caused by the exposure to dry CO, the increase in charge transfer resistance for the anodes after
testing is plotted in Figure 7.
9.
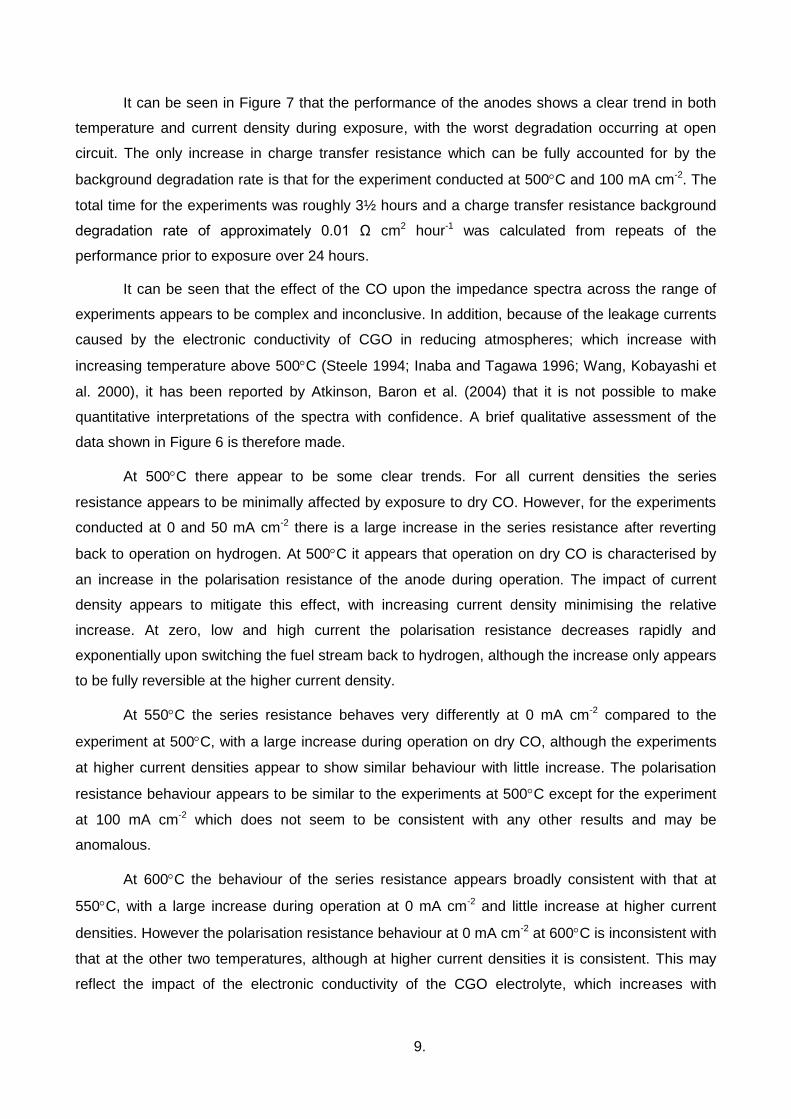
It can be seen in Figure 7 that the performance of the anodes shows a clear trend in both
temperature and current density during exposure, with the worst degradation occurring at open
circuit. The only increase in charge transfer resistance which can be fully accounted for by the
background degradation rate is that for the experiment conducted at 500C and 100 mA cm-2. The
total time for the experiments was roughly 3½ hours and a charge transfer resistance background
degradation rate of approximately 0.01 Ω cm2 hour-1 was calculated from repeats of the
performance prior to exposure over 24 hours.
It can be seen that the effect of the CO upon the impedance spectra across the range of
experiments appears to be complex and inconclusive. In addition, because of the leakage currents
caused by the electronic conductivity of CGO in reducing atmospheres; which increase with
increasing temperature above 500C (Steele 1994; Inaba and Tagawa 1996; Wang, Kobayashi et
al. 2000), it has been reported by Atkinson, Baron et al. (2004) that it is not possible to make
quantitative interpretations of the spectra with confidence. A brief qualitative assessment of the
data shown in Figure 6 is therefore made.
At 500C there appear to be some clear trends. For all current densities the series
resistance appears to be minimally affected by exposure to dry CO. However, for the experiments
conducted at 0 and 50 mA cm-2 there is a large increase in the series resistance after reverting
back to operation on hydrogen. At 500C it appears that operation on dry CO is characterised by
an increase in the polarisation resistance of the anode during operation. The impact of current
density appears to mitigate this effect, with increasing current density minimising the relative
increase. At zero, low and high current the polarisation resistance decreases rapidly and
exponentially upon switching the fuel stream back to hydrogen, although the increase only appears
to be fully reversible at the higher current density.
At 550C the series resistance behaves very differently at 0 mA cm-2 compared to the
experiment at 500C, with a large increase during operation on dry CO, although the experiments
at higher current densities appear to show similar behaviour with little increase. The polarisation
resistance behaviour appears to be similar to the experiments at 500C except for the experiment
at 100 mA cm-2 which does not seem to be consistent with any other results and may be
anomalous.
At 600C the behaviour of the series resistance appears broadly consistent with that at
550C, with a large increase during operation at 0 mA cm-2 and little increase at higher current
densities. However the polarisation resistance behaviour at 0 mA cm-2 at 600C is inconsistent with
that at the other two temperatures, although at higher current densities it is consistent. This may
reflect the impact of the electronic conductivity of the CGO electrolyte, which increases with

10.
temperature, but which is offset as current density increases as reported by Leah, Brandon et al.
(2005).
It is clear that the impedance results confirm the problems with performing such
measurements under reducing conditions using CGO as reported by Atkinson, Baron et al. (2004)
and with non steady-state conditions, and the difficulties in interpretation therein. The use of more
carefully defined conditions at open circuit (i.e. with a defined partial pressure of CO2), faster
electrochemical impedance analysers, and nickel CGO cermet anodes on YSZ pellets will be
explored in future work, as although no firm conclusions could be made from the EIS here there is
clearly the potential for future insight into CO reaction kinetics using this methodology.
It is noted that at open circuit potential (OCP) the nature of the reversible electrochemical
couple is ill defined in dry CO with no CO2. However, the nature of the CGO electrolyte means that
some leakage current exists even under conditions of no external load, such that it is likely that
some CO2 is formed. A stable OCP is therefore possible, although its relationship to the
electrochemical species composition is not known. It should also be noted that this set of
experiments was specifically chosen to investigate the effect of the formation of carbon by the
Boudouard reaction and not to establish equilibrium conditions with a well defined CO:CO2 couple,
experiments of this type will be reported in a further paper.
To summarise, the results presented in this paper suggest that maintaining the anode at
load during exposure to dry CO appears to mitigate the damaging effects of carbon deposition on
the anode, with higher loads and lower temperatures offering the best protection against
degradation. Although the Rp and Rs values are affected during operation it was not possible to
fully interpret the EIS results. However, further work using multi-frequency impedance analysers
should enable more reliable data to be obtained, shortening the data collection time and therefore
minimising changes in the anode during the data collection period. It is suggested that it is not the
carbon deposition but the removal of the carbon that causes the most damage, at least over the
timescale of these experiments, and this irreversibly damages the electrochemical performance of
the anode.
5 Discussion
Applying equilibrium calculations to reforming reactions may be straightforward (Sasaki and
Teraoka 2003; Sasaki and Teraoka 2003) but is often misleading as reported by Walters, Dean et
al. (2003), requiring the kinetics of the various reactions to be considered. However, as soon as the
step is taken to include the kinetics a large number of reactions all occurring simultaneously must
be considered. As described by Van Hook (1980), these reactions include hydrocarbon cracking,
polymerization, steam reaction with surface carbon hydrogen residues, methanation,
hydrocracking (hydrogenolysis), dehydrogenation, carbon monoxide disproportionation (Boudouard

11.
reaction), water-gas shift, and even dehydrocyclization reactions. The most important aspect to
consider is that all of these reactions are associated with a steady state concentration of carbon-
hydrogen-oxygen residues on the catalyst surface. Some reactions are "carbon" producing and
others are "carbon" removing reactions, and considerable attention must be given to the catalyst
and operating variables in order to maintain an acceptable level of steady-state "carbon" on the
catalyst. In the experiments conducted in this paper the choice of dry CO was made over CO/CO2
mixtures in order to investigate the formation of carbon from a single reaction; the Boudouard
reaction, under harsh conditions. The purpose was in part to establish a baseline for conditions
that could represent an accelerated degradation test for SOFC anodes that need to be resistant to
conditions where carbon formation is favoured. Therefore the only CO2 present is produced by the
electrochemical oxidation of CO or C, and the carbon formation inhibition or carbon removal effect
of current density could therefore be investigated directly. This could also be achieved by providing
a known CO/CO2 mixture and monitoring changes in the oxygen content at different operating
conditions. When using yttrium stabilised zirconia (YSZ) electrolyte such conditions give rise to
unstable open circuit potentials (OCP), however when using gadolinium doped ceria (CGO) some
CO2 may be produced at open circuit because of the leakage currents arising from the mixed
conductivity of CGO under reducing conditions and at elevated temperatures; hence a stable OCP
is possible.
In order to test the electrochemical performance of the anodes under ‘ideal’ steady state
and comparable conditions the pellets were tested on dry hydrogen before and after the exposure
to CO. An unavoidable consequence of this is that a significant percentage of the carbon deposited
within or on the anode will be removed by either direct electrochemical oxidation of the carbon, or
removal via various reforming reactions. This means that steady state conditions cannot be
guaranteed. However, once the carbon has been removed, steady state conditions should be
achievable and for this reason the anodes were maintained at their specified current density for an
hour after exposure to CO. This appeared to result in stable operation for all anodes except those
held at OCP, where further degradation occurred during the characterisation procedure. Apart from
the results at OCP, this was considered acceptable because the experiments accurately reflect the
conditions that nickel anodes have to endure, both carbon formation and carbon removal reactions,
although the carbon formation and removal reactions have been separated.
Previous experiments had demonstrated that exposure to dry CO at OCP was particularly
detrimental to anode performance, and therefore the experiments had to be designed to ensure
that anodes exposed at load were not exposed to CO at OCP. Hence it was necessary to switch
from H2 to CO and back again under load, with the unavoidable consequence of water being
produced within the anode, such that residual H2 and or H2O may have an impact on the
subsequent exposure to dry CO. Initially it was thought that this would reduce the amount of

12.
damage, however the opposite was shown by Yoshida, Yamamoto et al. (1994) who studied the
role of hydrogen in carbon deposition on Ni at 425 C by determining the respective rates of the
carbon formation reactions, the reverse water gas shift (WGS) reaction, equation 4, and the
Boudouard reaction, equation 1.
OHCHCO 22 Equation 4
The most interesting and relevant (for this work) conclusions were that equation 1, as
expected, increased in proportion to the partial pressure of H2, however, equation 4 was catalysed
by the addition of an extremely small amount of H2, such that the rate became about eight times
that for pure CO but hardly varied as more H2 was added. They interpreted their results in terms of
a surface OH species proposed as an intermediate for both of the carbon forming reactions
studied. In the second reaction, the presence of the OH species promotes the removal of carbon
layers covering the catalyst, which exposes fresh active sites enabling further carbon deposition to
occur. The background rate of carbon deposition was associated with the progressive separation
of Ni particles from the surface. They noted that as the H2 concentration increases, excess
hydrogen can remove carbonaceous deposits to form methane and this must be considered at
high H2 partial pressures (>0.01 bar).
It is known that the WGS and the Boudouard reaction are both significant at the
temperatures of operating SOFCs, and the temperatures studied in this paper, therefore it is not
unreasonable to suspect that H2 should have a similar effect on the Boudouard reaction in our
experiments. Therefore, if this mechanism is also occurring at the temperatures studied in this
paper, then we should see results that are worse under wet CO than dry CO.
In order to test this hypothesis the experiment at 50 mA cm-2 and 550C was repeated but
in wet H2 and CO (3% H2O) rather than dry. The images of the two pellets are shown in Figure 8. It
can clearly be seen that the amount of carbon deposited under wet conditions is far higher than
dry, with significant delamination of the anode and visible carbon deposits. The electrochemical
performance for the pellet exposed under wet conditions, as shown in 0 is also much worse with
the exchange current density under wet CO changing from 193 mA cm-2 to 44 mA cm-2,
corresponding to an increase in the Rct of 1.25 Ω cm2 compared to an increase of 0.28 Ω cm2
under dry CO. This result is therefore consistent with the above mechanism.
Mallon and Kendall (2005) reported that the propensities of nickel cermet anodes towards
carbon formation when operating on methane were very sensitive to the anode reduction
conditions. Differences in performance when operating on methane were observed to be related to
reduction temperature with better performance possible when reduction was commenced at low
temperature (300 C) compared to high temperature (850 C). The explanation offered for this
13.
behaviour was that, following a low temperature reduction the nickel particles are small and
separated, with poor electronic conductivity. After operation under methane the carbon deposits
form linkages between the particles improving the conductivity, and the nickel has a high surface
area which is not readily blocked by carbon deposits. The explanation offered for the improvement
in performance caused by an increase in conductivity by carbon deposits for the nickel seems
reasonable, although to be conclusive this would need to be verified by an observed difference in
particle size. However, it is not adequately explained why the differently reduced nickel anodes
show different propensities towards the irreversible site blocking carbon deposited by methane.
Nor is it adequately proved that there are two different types of carbon formation, although the data
is suggestive.
In summary it is clear that the reduction method can influence the performance of a nickel
cermet anode, and that under certain conditions some carbon deposition can be beneficial.
However, the exact mechanism of these effects need further study in order to be independently
verified. That low temperature reduction increases the triple phase boundary length could be
verified by ex-situ analysis techniques (Wilson, Kobsiriphat et al. 2006; Shearing, Chater et al.
2008) using 3-D reconstruction from focused ion beam milling. However, equally plausible is that
differences in the microstructure of the anode could influence the transport properties of the anode
such that gas composition gradients within the anode occur under certain conditions, allowing
some regions of the anode to be free of carbon deposition permitting stable performance. It is likely
that the reduction procedure and the oxidation state and morphology of the nickel anodes will have
an effect upon the effect of CO as well as methane, therefore the present study would benefit from
such validation too. In these experiments the anodes were reduced by being taken up to the
operating temperature at a ramp rate of 2C min-1 with the anode side exposed to a 2.5% H2O,
48.75% N2 / 48.75% H2 atmosphere throughout. This was found to give the best and most
reproducible results. However, the end point of the ramp rate was different for the different
temperatures, and therefore differences in the oxidation state and morphology of the nickel anode
at the different temperatures studied is likely and could explain the lack of observable trends in the
EIS data. Further studies where the anodes were all taken up to the highest temperature and
allowed to equilibrate before the operational temperature was selected would be needed to verify
this.
6 Conclusion
In this paper we have shown that the effect of both temperature and current density upon
carbon deposition from exposure to dry CO is significant. The results show that, under moderate
current density, carbon formation does not appear to damage the electrochemical performance of
the anode, at least over the timescale of one hour, until it is removed by switching back to

14.
hydrogen, whereupon large changes can occur to the anodes resulting in irreversible damage to
performance. It is demonstrated that, by operating at a current density of 100 mA cm-2 at 500C,
carbon formation can be minimised and that the anode can be protected from these otherwise
harsh conditions, such that the anode performance before and after operating on dry CO for an
hour can be maintained within the background degradation limits measured here. The operation of
SOFC pellet cells on CO under conditions where carbon deposition is favourable can therefore
irreversibly affect the performance of the anodes, indicating that any investigations into the CO
oxidation reaction mechanism are also likely to be affected. It is therefore important to decouple
these effects when investigating CO oxidation under conditions where carbon deposition is
favourable. However, as long as the cell is maintained at reasonable current densities (100 mA cm-
2 or above) then the damage does not affect the electrochemical performance of the cell, and
investigations into the CO oxidation reaction mechanism in an intermediate temperature SOFC
should be possible.
7 Acknowledgements
This work was supported by the EPSRC Supergen Fuel Cells Consortium.
8 References
Aaberg, R. J., R. Tunold, et al. (1996). Oxidation of CO and H-2 on Ni/YSZ cermet electrodes. High Temperature Electrochemistry: Ceramics and Metals: 511-518.
Adler, S. B., B. T. Henderson, et al. (2000). Reference electrode placement and seals in electrochemical oxygen generators. Solid State Ionics 134(1-2): 35-42.
Atkinson, A., S. A. Baron, et al. (2004). AC impedance spectra arising from mixed ionic electronic solid electrolytes. Journal of the Electrochemical Society 151(5): E186-E193.
Brett, D. J. L., A. Atkinson, et al. (2005). Methanol as a direct fuel in intermediate temperature (500-600 degrees C) solid oxide fuel cells with copper based anodes. Chemical Engineering Science 60(21): 5649-5662.
Eguchi, K., T. Setoguchi, et al. (1993). Science and Technology of Zirconia. S. P. S. Badwal, M. J. Bannister and R. H. J. Hannink. Basel, Tecnomic Publishing Co: 694-704.
Gemmen, R. S. and J. Trembly (2006). On the mechanisms and behavior of coal syngas transport and reaction within the anode of a solid oxide fuel cell. Journal of Power Sources 161(2): 1084-1095.
Gunji, A., C. Wen, et al. (2004). Carbon deposition behaviour on Ni-ScSZ anodes for internal reforming solid oxide fuel cells. Journal of Power Sources 131(1-2): 285-288.
Holtappels, P., L. G. J. De Haart, et al. (1999). Reaction of CO/CO2 gas mixtures on Ni-YSZ cermet electrodes. Journal of Applied Electrochemistry 29(5): 561-568.
Inaba, H. and H. Tagawa (1996). Ceria-based solid electrolytes - Review. Solid State Ionics 83(1-2): 1-16.
Jiang, Y. and A. V. Virkar (2003). Fuel composition and diluent effect on gas transport and performance of anode-supported SOFCs. Journal of the Electrochemical Society 150(7): A942-A951.

15.
Lauvstad, G. O., R. Tunold, et al. (2002). Electrochemical oxidation of CO on Pt and Ni point electrodes in contact with an yttria-stabilized zirconia electrolyte - I. Modeling of steady-state and impedance behavior. Journal of the Electrochemical Society 149(12): E497-E505.
Leah, R. T., N. P. Brandon, et al. (2005). Modelling of cells, stacks and systems based around metal-supported planar IT-SOFC cells with CGO electrolytes operating at 500-600 degrees C. Journal of Power Sources 145(2): 336-352.
Mallon, C. and K. Kendall (2005). Sensitivity of nickel cermet anodes to reduction conditions. Journal of Power Sources 145(2): 154-160.
Matsuzaki, Y., M. Hishinuma, et al. (1999). Electrochemical characteristics of a Ni-YSZ cermet electrode on YSZ in a H-2-H2O-CO-CO2 system. Solid Oxide Fuel Cells (Sofc Vi) 99(19): 560-567.
Matsuzaki, Y. and I. Yasuda (2000). Electrochemical oxidation of H-2 and CO in a H-2-H2O-CO-CO2 system at the interface of a Ni-YSZ cermet electrode and YSZ electrolyte. Journal of the Electrochemical Society 147(5): 1630-1635.
Mizusaki, J., M. Aoki, et al. (1990). Response and Electrode-Reaction of Zirconia Sensors in Co-Co2 Gas Atmospheres. Denki Kagaku 58(12): 1169-1177.
Mizusaki, J., H. Tagawa, et al. (1994). Kinetics of the Electrode-Reaction at the H2-H2o Porous Pt Stabilized Zirconia Interface. Journal of the Electrochemical Society 141(6): 1674-1683.
Offer, G. J. and N. P. Brandon (2008). A Study of CO Oxidation in Intermediate Temperature SOFCs. 8th European SOFC Forum. U. Bossel. Lucerne, Switzerland, SOFC Forum: A0405.
Offer, G. J., P. Shearing, et al. (2008). Using electrochemical impedance spectroscopy to compensate for errors when measuring polarisation curves during three-electrode measurements of solid oxide fuel cell electrodes. Electrochimica Acta 53(26): 7614-7621.
Sasaki, K. and Y. Teraoka (2003). Equilibria in fuel cell gases - I. Equilibrium compositions and reforming conditions. Journal of the Electrochemical Society 150(7): A878-A884.
Sasaki, K. and Y. Teraoka (2003). Equilibria in fuel cell gases - II. The C-H-O ternary diagrams. Journal of the Electrochemical Society 150(7): A885-A888.
Shearing, P. R., R. J. Chater, et al. (2008). 3D Reconstruction of SOFC Electrodes using Focused Ion Beam Techniques. 8th European SOFC Forum, Lucerne Switzerland.
Steele, B. C. H. (1994). OXYGEN-TRANSPORT AND EXCHANGE IN OXIDE CERAMICS. Journal of Power Sources 49(1-3): 1-14.
Sukeshini, A. M., B. Habibzadeh, et al. (2006). Electrochemical oxidation of H-2, CO, and CO/H-2 mixtures on patterned Ni anodes on YSZ electrolytes. Journal of the Electrochemical Society 153(4): A705-A715.
Van Hook, J. P. (1980). Methane-Steam Reforming. Catalysis Reviews 21(1): 1 - 51. Walters, K. M., A. M. Dean, et al. (2003). Homogeneous kinetics and equilibrium predictions of
coking propensity in the anode channels of direct oxidation solid-oxide fuel cells using dry natural gas. Journal of Power Sources 123(2): 182-189.
Wang, S. R., T. Kobayashi, et al. (2000). Electrical and ionic conductivity of Gd-doped ceria. Journal of the Electrochemical Society 147(10): 3606-3609.
Weber, A., B. Sauer, et al. (2002). Oxidation of H-2, CO and methane in SOFCs with Ni/YSZ-cermet anodes. Solid State Ionics 152: 543-550.
Wilson, J. R., W. Kobsiriphat, et al. (2006). Three-dimensional reconstruction of a solid-oxide fuel-cell anode. Nature Materials 5(7): 541-544.
Winkler, J., P. V. Hendriksen, et al. (1998). Geometric requirements of solid electrolyte cells with a reference electrode. Journal of the Electrochemical Society 145(4): 1184-1192.
Yoshida, N., T. Yamamoto, et al. (1994). Effect of Hydrogen on Carbon Deposition from Carbon-Monoxide on Nickel-Catalyst. Catalysis Letters 23(3-4): 237-243.

16.
Figure 1. Graph showing the cyclic voltammogram (solid line) and 5 characterisation points (X) measured using chrono-amperometry for the pellet at 600
oC before exposure to CO at 100
mA cm-2
(a), and the same data presented as overpotentials (b)

17.
Figure 2. Graph showing the anode overpotentials for the cyclic voltammogram data (solid line) and 5 characterisation point data (X) incorrectly corrected using the single Rs measurement calculated from the EIS measurement at open circuit. The overpotentials for the 5 characterisation point data correctly corrected using the Rs measurements calculated from the EIS measurements at load are also shown (■).

18.
Figure 3. Images of the nickel cermet electrodes after testing on carbon monoxide for 60 minutes at different temperatures and current

19.

20.
Figure 4. Graph showing the electrochemical performance for hydrogen oxidation of the anodes before and after exposure to dry CO for an hour at different current densities at 500, 550 and
600C

21.
Figure 5. Example chrono-amperometric data (a) and EIS spectra (b) taken during and after exposure
to dry CO for 1 hour at 500C and 100 mA cm-2
. Spectra were taken every 10 minutes and took approximately 3 minutes to collect with indicative dotted lines shown; time zero was the initial exposure to CO and at 60 minutes the fuel gas is switched back to H2. Frequency used was from 100 mHz to 100 MHz.

22.

23.

24.
Figure 6. Graphs showing the changes in series and polarisation resistances of the anodes at 500,
550, and 600C and at 0 mA cm-2
(○), 50 mA cm-2
(Δ), and 100 mA cm-2
(□). The cell was first exposed to CO at zero minutes and the dotted line at 60 minutes represents the time when the CO was switched back to H2.

25.
Figure 7. Graph showing the increase in charge transfer resistance versus current density during exposure for hydrogen oxidation of the anodes after exposure to dry CO for an hour at 500
(■), 550 (●), and 600C (▲).
Figure 8. Images of the nickel cermet electrodes exposed to dry and wet CO for 1 hour at 550C and 50 mA cm
-2

26.
Figure 9. Graph showing the electrochemical performance for hydrogen oxidation of the anodes
before and after exposure to dry and wet CO for an hour at 50 mA cm-2
at 550C


![Infacon proceedings DVD - pyro.co.za · Boudouard reaction (1), is very important. This reaction is endothermic and undesirable due to its effects on process energy consumption [1].](https://static.fdocuments.net/doc/165x107/5bcaf01e09d3f2f9588d92a9/infacon-proceedings-dvd-pyrocoza-boudouard-reaction-1-is-very-important.jpg)
