Boubacar Djibo Director, Air Transport Bureau, ICAO · Boubacar Djibo Director, Air Transport...
24
Session 1 Regulatory Framework of Air Transport: Update on ICAO’s 39th Assembly and the United Nations Efforts Towards Sustainable Development Boubacar Djibo Director, Air Transport Bureau, ICAO
-
Upload
nguyenthien -
Category
Documents
-
view
213 -
download
0
Transcript of Boubacar Djibo Director, Air Transport Bureau, ICAO · Boubacar Djibo Director, Air Transport...

Session 1 Regulatory Framework of Air Transport: Update on ICAO’s 39th Assembly and the United Nations Efforts Towards Sustainable Development
Boubacar Djibo Director, Air Transport Bureau, ICAO

Value of Aviation
A39 Outcomes
Sustainable Development Agenda

Growth of air transport
Scheduled commercial traffic Total (international and domestic) services
3 Source: ICAO Annual Report of the Council
-
50
100
150
200
250
0
1000
2000
3000
4000
5000
6000
7000
19
45
19
47
19
49
19
51
19
53
19
55
19
57
19
59
19
61
19
63
19
65
19
67
19
69
19
71
19
73
19
75
19
77
19
79
19
81
19
83
19
85
19
87
19
89
19
91
19
93
19
95
19
97
19
99
20
01
20
03
20
05
20
07
20
09
20
11
20
13
20
15
Re
ven
ue
Pas
sen
ger-
Kilo
me
tre
s (b
illio
n)
Oil
cri
sis
Gu
lf w
ar
Asia
n c
risis
Iran
-Ira
q
war
SA
RS
9/1
1 t
err
ori
st
att
ack
Wo
rld
re
cessio
n
Freigh
t Ton
ne
-Kilo
me
tres
(billio
n)
198 billion FTK
+1.7% growth rate vs. 2014
6.6 trillion RPK
+7.1% growth rate vs. 2014
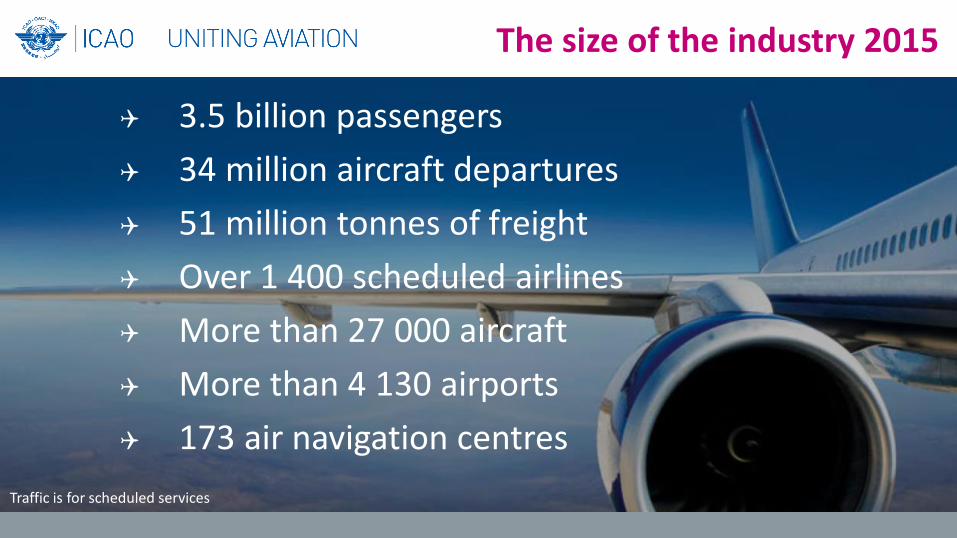
Traffic is for scheduled services
The size of the industry 2015
3.5 billion passengers
34 million aircraft departures
51 million tonnes of freight
Over 1 400 scheduled airlines
More than 27 000 aircraft
More than 4 130 airports
173 air navigation centres

5
Air route network 2015
Source: ICAO

Source: ICAO Annual Report of the Council Scheduled commercial traffic
International and domestic passenger traffic
-
500
1,000
1,500
2,000
2,500
3,000
3,500
4,000
4,500
2006 2007 2008 2009 2010 2011 2012 2013 2014 2015
Domestic and International Revenue Passenger-Kilometres (RPK) (in billion)
International RPK Domestic RPK
+7.0% in 2016 (ICAO projection)
+7.3% in 2016 (ICAO projection)
6

Economic benefits of aviation in 2015
63.5million
Jobs supported by aviation worldwide
Source: ICAO
$2.7 trillion
Global economic impact
10.0million
Direct jobs supported by aviation worldwide
$718billion
Direct Global economic impact
Direct economic contribution of the aviation sector
Direct, indirect, induced and tourism economic contribution of the aviation sector
In collaboration with the United Nations, States and international organizations, ICAO is developing a universally-accepted methodology to measure aviation’s gross domestic product (GDP) relative to overall economic activity, to better showcase the economic
benefits of aviation to the public.

Source: ICAO
Share of Revenue Passenger-Kilometres by region in 2015
8

Traffic rankings in 2014-15
9
International Scheduled Revenue Tonne-Kilometres (RTK)

International capacity growth – Top 20 in terms of ASK
Rank State Percentage Increase in
ASK
1 China 17%
2 United Arab Emirates 15%
3 Turkey 17%
4 Qatar 19%
5 Canada 11%
6 Spain 12%
7 Ireland 8%
8 Germany 4%
9 United States 2%
10 Japan 8%
11 Republic of Korea 5%
12 Mexico 22%
13 United Kingdom 2%
14 India 8%
15 Oman 37%
16 Hungary 18%
17 Philippines 10%
18 Brazil 14%
19 Ethiopia 16%
20 France 3%
Top 20 new routes in ASK in 2015 City Pair Country Pair
Istanbul - San Francisco Turkey – United States
Abu Dhabi - Brisbane United Arab Emirates - Australia
Taipei - Istanbul China - Turkey
Istanbul - Jakarta Turkey - Indonesia
Dubai - Denpasar-Bali United Arab Emirates - Indonesia
Hong Kong - Boston China - United States
Melbourne - Beijing Australia - China
Houston - Taipei United States - China
Edinburgh - Abu Dhabi United Kingdom - United Arab Emirates
Orlando - Dubai United States - United Arab Emirates
Dallas - Beijing United States - China
Brisbane - Tokyo Australia - Japan
Istanbul - Manila Turkey - Philippines
Sao Paulo - Addis Ababa Brazil - Ethiopia
Salt Lake City - Amsterdam United States - Netherlands
Guangzhou - San Francisco China - United States
Vancouver - Osaka Canada - Japan
San Jose - Beijing United States - China
Nairobi - Hanoi Kenya - Vietnam
Osaka - Los Angeles Japan - United States
Capacity growth stimulating traffic
10 Source: ICAO ASK: Available Seat-Kilometres
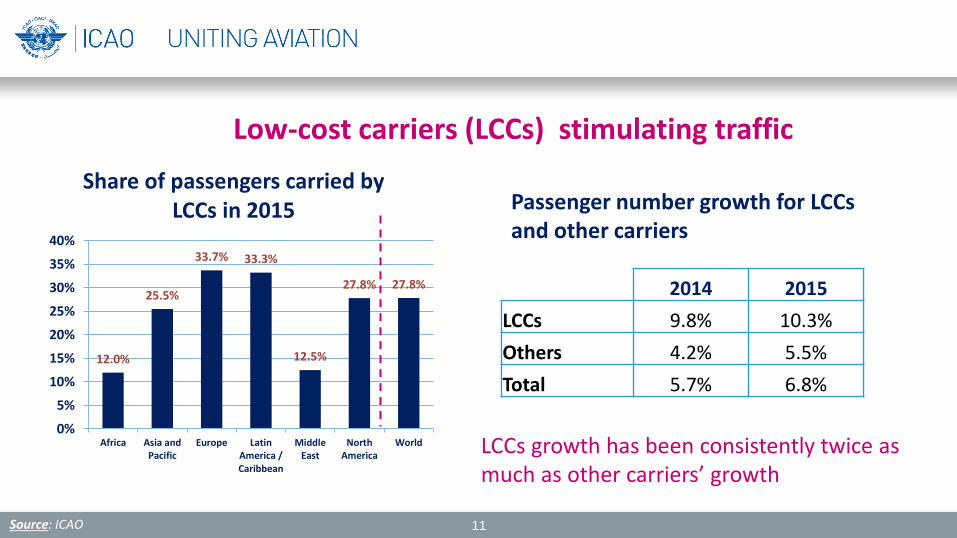
Low-cost carriers (LCCs) stimulating traffic
Source: ICAO
12.0%
25.5%
33.7% 33.3%
12.5%
27.8% 27.8%
0%
5%
10%
15%
20%
25%
30%
35%
40%
Africa Asia andPacific
Europe LatinAmerica /Caribbean
MiddleEast
NorthAmerica
World
Share of passengers carried by LCCs in 2015
2014 2015
LCCs 9.8% 10.3%
Others 4.2% 5.5%
Total 5.7% 6.8%
Passenger number growth for LCCs and other carriers
LCCs growth has been consistently twice as much as other carriers’ growth
11

Source: World Tourism Organization (UNWTO)
More than half of international inbound tourist arrived by air in 2015
Air 54%
Road 39%
Rail 2%
Water 5%

Volume of world international cargo shipment
Value of world international cargo shipment
Aviation
Aviation
Surface modes
Surface modes
13 Source: Air Transport Action Group (ATAG), 2014
One third of the value of world trade
is shipped by air
0.5% 34.6%
$6.4 trillion

0 200 400 600 800 1000 1200 1400 1600 1800
Latin America/Caribbean --> Africa
Africa --> Latin America/Caribbean
Africa --> Africa
Africa --> Asia/Pacific
Africa --> Middle East
Africa --> North America
North America --> Africa
Middle East --> Africa
Asia/Pacific --> Africa
Europe --> Africa
Africa --> Europe
Parcel Count (thousands)
Africa E-Commerce* Activity 2015 (one Way)
0
500
1,000
1,500
2,000
2,500
3,000
3,500
4,000
Inbound Outbound
Par
cel C
ou
nt
(th
ou
san
ds)
Africa Overall E-commerce Activity 2015
E-commerce to/from Africa and other Regions
Source: ICAO and Universal Postal Union (UPU)

0
2,000
4,000
6,000
8,000
10,000
12,000
1995 2000 2005 2010 2015 2020 2025 2030 2035 2040
Re
ven
ue
Pas
sen
ger
Kilo
mtr
es*
(b
illio
ns)
Long-term air traffic forecasts Scheduled international passenger traffic
Forecasts Historical 6.0%
CAGR** 4.2%
CAGR**
*Scheduled Services **Compound Average Annual Growth Rate
Rank 2040
Rank 2015
Long Term Forecast Route Group Share 2040
Share 2015
1 4 Central Southwest Asia - Pacific South East
Asia 11.9% 5.4%
2 1 Intra Europe 11.5% 15.8%
3 8 Central Southwest Asia - Middle East 11.3% 3.9%
4 2 Europe - North America 9.0% 11.8%
5 3 Central Southwest Asia - Europe 7.3% 5.8%
6 5 Intra Pacific South East Asia 6.1% 4.5%
7 7 Central Southwest Asia - North America 5.9% 4.1%
8 18 Central Southwest Asia- North Asia 4.6% 1.9%
9 6 Europe - Middle East 3.6% 4.5%
10 9 Europe - Pacific South East Asia 3.5% 3.6%
Projected Top 10 Routes 2040
15
60%
of total traffic
63%
of total traffic

16
ICAO 2016 preliminary results
Number of passengers: +6.0% in 2016, 3.7 billion pax carried in 2016 (+6.8% in 2015) Revenue Passenger-Kilometres: +6.3% in 2016 (+7.1% in 2015)
International scheduled passenger traffic growth in 2016
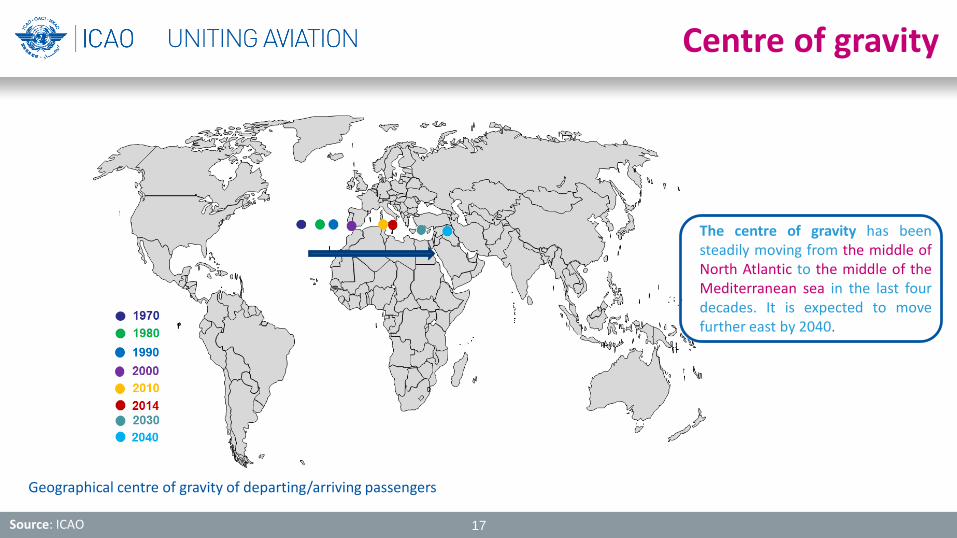
Centre of gravity
Geographical centre of gravity of departing/arriving passengers
Source: ICAO 17
The centre of gravity has been steadily moving from the middle of North Atlantic to the middle of the Mediterranean sea in the last four decades. It is expected to move further east by 2040.

Value of Aviation
A39 Outcomes
Sustainable Development Agenda

Economic Development of Air Transport
• Acknowledgement of need to consider a new ICAO Global Air Transport Plan.
• Endorsement of action plan for the finalization of the international agreements being developed by ICAO for the liberalization of market access, air cargo and air carrier ownership and control.
• Endorsement of the action plan for further customization of long term traffic forecasts for global and regional forecasts for aviation personnel (Doc 9956) to meet the requirements of the ICAO Next Generation Aviation Professional (NGAP) programme.

Economic Development of Air Transport
• Promote the strengthening of partnerships in the area of data sharing and analysis with the UN,
its agencies, international, regional organizations and academia to increasing financing and
investments for the development of air transport activities.
• Increased awareness and promotion of various updated policy guidance and tools.
• Increased awareness and promotion of the ICAO long-term vision for air transport liberalization
and core principles on consumer protection.
• Increased awareness and promotion of various tools and analysis jointly developed by partners.

Value of Aviation
A39 Outcomes
Sustainable Development Agenda

• assist States in implementing ICAO Standards and Recommended Practices (SARPs)
• ensure that SARP implementation is better harmonized globally
• all States to have access to the significant socio-economic benefits of safe and reliable air transport
• Ultimately contribute to the achievement of the UN Sustainable Development Goals (UN SDGs)
No Country Left Behind

Sustainable Development Goals
Goal 9. Build resilient infrastructure, promote inclusive and sustainable industrialization and foster innovation 9.1 Develop quality, reliable, sustainable and resilient infrastructure, including regional and trans-border infrastructure, to support economic development and human well-being, with a focus on affordable and equitable access for all.

Sustainable Development Goals 9.1.2 Passenger and freight volumes, by mode of transport (by ICAO)
2014 -Passenger and Freight Volumes for Air Transport
Total passengers Share of passenger Total freight tonnes carried
Share of freight tonnes carried
World 3,303,349,219 50,351,508
Developing Regions 1,488,317,905 45.05% 26,087,125 51.81%
Northern Africa 27,465,990 0.83% 167,082 0.33%
Sub-Saharan Africa 44,853,931 1.36% 612,980 1.22%
Latin America and the Caribbean 240,229,220 7.27% 1,922,358 3.82%
Eastern Asia 522,639,082 15.82% 12,444,007 24.71%
Southern Asia 114,948,811 3.48% 1,247,289 2.48%
South-Eastern Asia 279,378,708 8.46% 3,584,099 7.12%
Western Asia 244,116,326 7.39% 5,984,751 11.89%
Oceania 4,172,294 0.13% 56,351 0.11%
Caucasus and Central Asia 10,513,543 0.32% 68,208 0.14%
Developed regions 1,815,031,314 54.95% 24,264,383 48.19%
Least Developed countries 26,381,089 0.80% 514,474 1.02%
Landlocked developing countries 97,713,083 2.96% 667,942 1.33%
Small island developing States 54,464,259 1.65% 1,276,418 2.54%