Botswana: 2013 Article IV Consultation; IMF Country Report 13/296
72
©2013 International Monetary Fund IMF Country Report No. 13/296 BOTSWANA 2013 ARTICLE IV CONSULTATION Under Article IV of the IMF’s Articles of Agreement, the IMF holds bilateral discussions with members, usually every year. In the context of the 2013 Article IV consultation with Botswana, the following documents have been released and are included in this package: Staff Report for the 2013 Article IV consultation, prepared by a staff team of the IMF, following discussions that ended on July 11, 2013, with the officials of Botswana on economic developments and policies. Based on information available at the time of these discussions, the staff report was completed on August 19, 2013. The views expressed in the staff report are those of the staff team and do not necessarily reflect the views of the Executive Board of the IMF. Informational Annex prepared by the staff of the International Monetary Fund. Debt Sustainability Analysis prepared by the staff of the International Monetary Fund Press Release dated September 13, 2013 Statement by the Executive Director for Botswana The policy of publication of staff reports and other documents allows for the deletion of market-sensitive information. Copies of this report are available to the public from International Monetary Fund Publication Services 700 19 th Street, N.W. Washington, D.C. 20431 Telephone: (202) 623-7430 Telefax: (202) 623-7201 E-mail: [email protected] Internet: http://www.imf.org Price: $18.00 a copy International Monetary Fund Washington, D.C. September 2013
Transcript of Botswana: 2013 Article IV Consultation; IMF Country Report 13/296

©2013 International Monetary Fund
IMF Country Report No. 13/296
BOTSWANA 2013 ARTICLE IV CONSULTATION
Under Article IV of the IMF’s Articles of Agreement, the IMF holds bilateral discussions with members, usually every year. In the context of the 2013 Article IV consultation with Botswana, the following documents have been released and are included in this package: Staff Report for the 2013 Article IV consultation, prepared by a staff team of the IMF, following discussions that ended on July 11, 2013, with the officials of Botswana on economic developments and policies. Based on information available at the time of these discussions, the staff report was completed on August 19, 2013. The views expressed in the staff report are those of the staff team and do not necessarily reflect the views of the Executive Board of the IMF.
Informational Annex prepared by the staff of the International Monetary Fund.
Debt Sustainability Analysis prepared by the staff of the International Monetary Fund
Press Release dated September 13, 2013
Statement by the Executive Director for Botswana
The policy of publication of staff reports and other documents allows for the deletion of market-sensitive information.
Copies of this report are available to the public from
International Monetary Fund Publication Services 700 19th Street, N.W. Washington, D.C. 20431
Telephone: (202) 623-7430 Telefax: (202) 623-7201 E-mail: [email protected] Internet: http://www.imf.org
Price: $18.00 a copy
International Monetary Fund
Washington, D.C.
September 2013
BOTSWANA STAFF REPORT FOR THE 2013 ARTICLE IV CONSULTATION
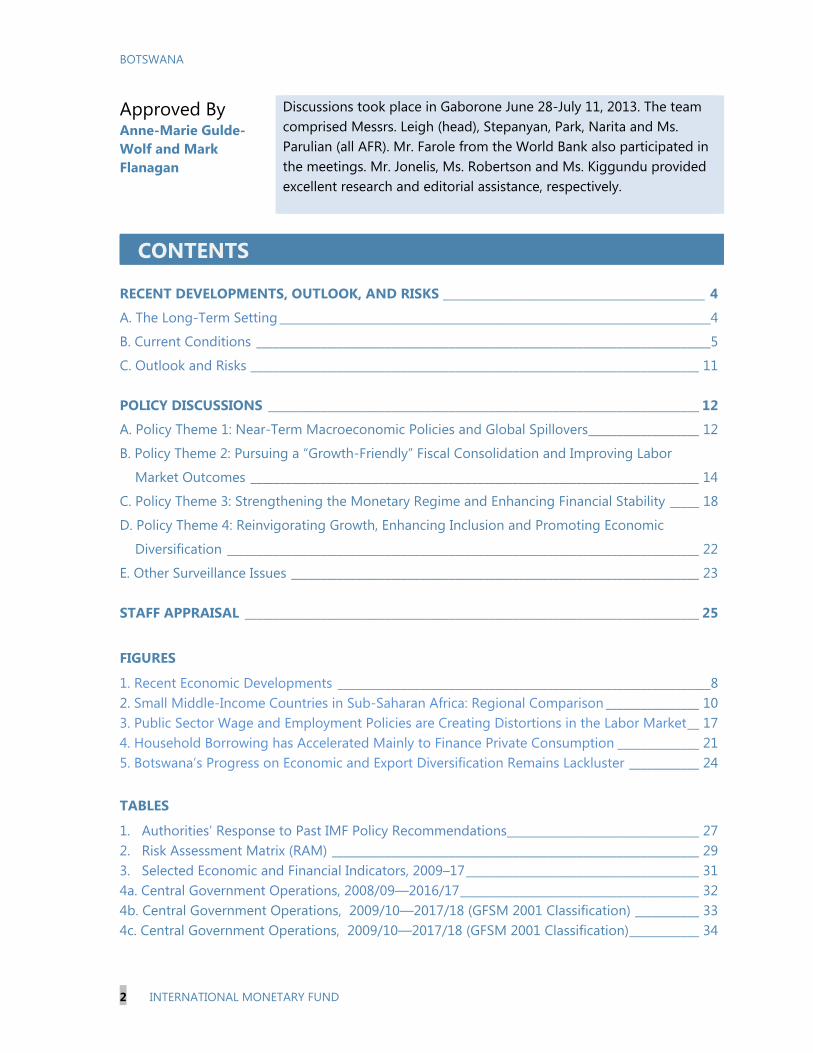
KEY ISSUES Setting: Botswana’s economic performance over the last few decades has been impressive. At the same time, however, as in many other small middle-income countries (SMICs) in the region, trend growth has softened in recent years, which has exacerbated the long-term challenge of persistent unemployment and high income inequality.
Outlook and risks: Output growth is expected to remain broadly unchanged in 2013 as strong non-mining sector growth would offset the subdued mining output. Inflation (average) is projected to converge to the Bank of Botswana’s objective range (3-6 percent) in 2013. The uncertainties in the global economy pose downside risks to mineral export demand.
Near-term macro-policy mix: A “growth-friendly” fiscal consolidation strategy adopted in the FY2013/14 budget is appropriate. Staff advocates for a broadly neutral monetary policy stance in the near term. In the event of further adverse global spillovers, staff advises the authorities to allow the automatic stabilizers to operate on the revenue side.
Financial stability: Botswana’s banking system is profitable and well-capitalized with relatively low nonperforming loans. Banks’ high exposure to households and the acceleration in the growth of unsecured lending are, however, potential vulnerabilities. The authorities should continue to bolster their surveillance capacity to monitor financial sector developments and consider implementing macroprudential measures to temper the rate of growth of household borrowing.
Medium-term fiscal consolidation: Reining in unproductive current spending, while protecting growth-promoting capital spending is the main pillar of the authorities’ fiscal consolidation strategy. The government’s commitment to rebuild the fiscal buffers, improve the quality of spending, and limit labor market distortions stemming from public wage and employment policies are also appropriate.
Reinvigorating growth, enhancing inclusion and economic diversification: Returning to an era of strong growth would require a set of efficiency-driven reforms to reinvigorate productivity drivers. Policies should target inequality more effectively, including fostering high quality investment in health and education and supporting financial inclusion. The government is pursuing a multi-pronged approach to enhancing economic diversification that leverages Botswana’s areas of comparative advantage.
Past advice: There is broad agreement between the Fund and the authorities on macroeconomic policy and structural reform priorities. Consistent with staff’s advice, the authorities have published both the weights of the Pula’s currency basket and its rate of crawl. Furthermore, the ongoing fiscal consolidation is focused on reining in unproductive current spending, as recommended during past consultations.
August 19, 2013
BOTSWANA
2 INTERNATIONAL MONETARY FUND
Approved By Anne-Marie Gulde-Wolf and Mark Flanagan
Discussions took place in Gaborone June 28-July 11, 2013. The team comprised Messrs. Leigh (head), Stepanyan, Park, Narita and Ms. Parulian (all AFR). Mr. Farole from the World Bank also participated in the meetings. Mr. Jonelis, Ms. Robertson and Ms. Kiggundu provided excellent research and editorial assistance, respectively.
CONTENTS
RECENT DEVELOPMENTS, OUTLOOK, AND RISKS _____________________________________________ 4
A. The Long-Term Setting __________________________________________________________________________4
B. Current Conditions ______________________________________________________________________________5
C. Outlook and Risks _____________________________________________________________________________ 11
POLICY DISCUSSIONS __________________________________________________________________________ 12
A. Policy Theme 1: Near-Term Macroeconomic Policies and Global Spillovers ___________________ 12
B. Policy Theme 2: Pursuing a “Growth-Friendly” Fiscal Consolidation and Improving Labor
Market Outcomes _____________________________________________________________________________ 14
C. Policy Theme 3: Strengthening the Monetary Regime and Enhancing Financial Stability _____ 18
D. Policy Theme 4: Reinvigorating Growth, Enhancing Inclusion and Promoting Economic
Diversification _________________________________________________________________________________ 22
E. Other Surveillance Issues ______________________________________________________________________ 23
STAFF APPRAISAL ______________________________________________________________________________ 25
FIGURES
1. Recent Economic Developments ________________________________________________________________8 2. Small Middle-Income Countries in Sub-Saharan Africa: Regional Comparison ________________ 10 3. Public Sector Wage and Employment Policies are Creating Distortions in the Labor Market __ 17 4. Household Borrowing has Accelerated Mainly to Finance Private Consumption ______________ 21 5. Botswana’s Progress on Economic and Export Diversification Remains Lackluster ____________ 24
TABLES
1. Authorities’ Response to Past IMF Policy Recommendations _________________________________ 27 2. Risk Assessment Matrix (RAM) _______________________________________________________________ 29 3. Selected Economic and Financial Indicators, 2009–17 ________________________________________ 31 4a. Central Government Operations, 2008/09—2016/17 _________________________________________ 32 4b. Central Government Operations, 2009/10—2017/18 (GFSM 2001 Classification) ___________ 33 4c. Central Government Operations, 2009/10—2017/18 (GFSM 2001 Classification) ____________ 34

BOTSWANA
INTERNATIONAL MONETARY FUND 3
4d. Botswana: Central Government Operations, 2008/09—2016/17 _____________________________ 35 4e. Botswana: Central Government Operations, 2007/08—2016/17 _____________________________ 36 5. Botswana: Balance of Payments, 2008-2017 __________________________________________________ 37 6. Botswana: Monetary Survey, 2008–2017 _____________________________________________________ 38 7. Botswana: Banking System Prudential Indicators, 2007–2013 ________________________________ 39
APPENDIXES
I. Managing Inward Global Spillovers ___________________________________________________________ 40 II. External Stability and Competitiveness Assessment ___________________________________________ 43 III. Balancing Financial Inclusion and Stability—Policy Challenges from Household Debt ________ 46
BOTSWANA
4 INTERNATIONAL MONETARY FUND
RECENT DEVELOPMENTS, OUTLOOK, AND RISKS
A. The Long-Term Setting
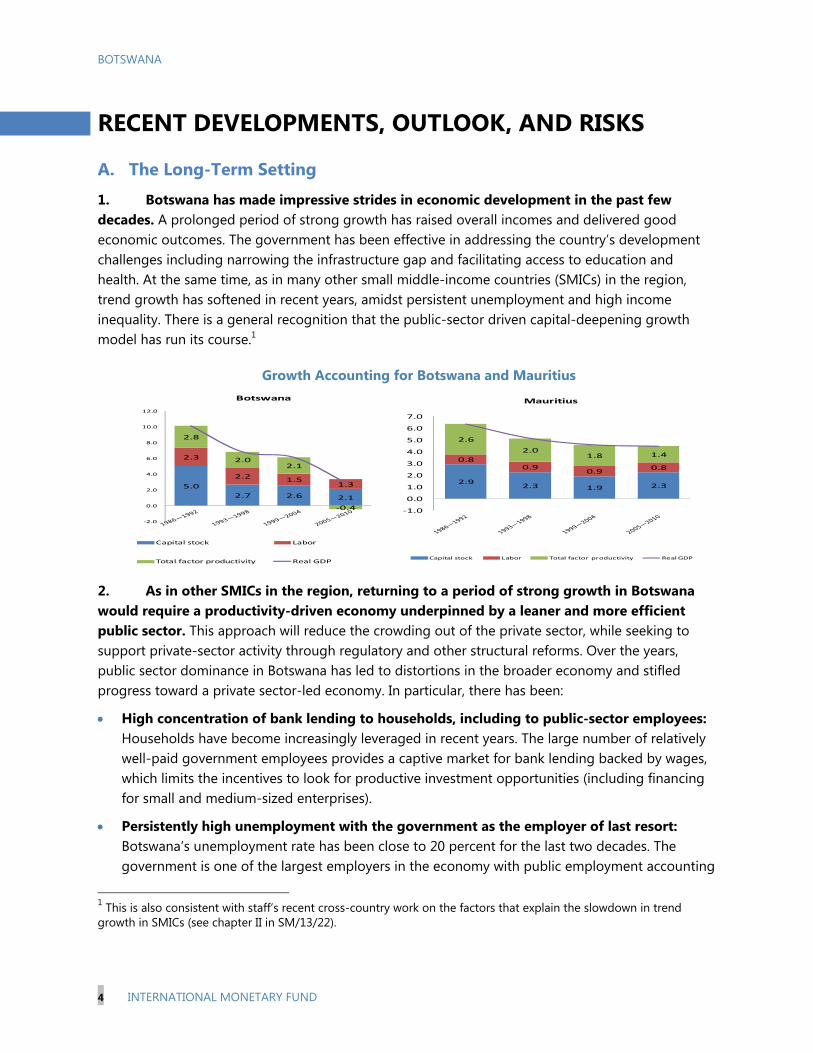
1. Botswana has made impressive strides in economic development in the past few decades. A prolonged period of strong growth has raised overall incomes and delivered good economic outcomes. The government has been effective in addressing the country’s development challenges including narrowing the infrastructure gap and facilitating access to education and health. At the same time, as in many other small middle-income countries (SMICs) in the region, trend growth has softened in recent years, amidst persistent unemployment and high income inequality. There is a general recognition that the public-sector driven capital-deepening growth model has run its course.1
Growth Accounting for Botswana and Mauritius
2. As in other SMICs in the region, returning to a period of strong growth in Botswana would require a productivity-driven economy underpinned by a leaner and more efficient public sector. This approach will reduce the crowding out of the private sector, while seeking to support private-sector activity through regulatory and other structural reforms. Over the years, public sector dominance in Botswana has led to distortions in the broader economy and stifled progress toward a private sector-led economy. In particular, there has been:
High concentration of bank lending to households, including to public-sector employees: Households have become increasingly leveraged in recent years. The large number of relatively well-paid government employees provides a captive market for bank lending backed by wages, which limits the incentives to look for productive investment opportunities (including financing for small and medium-sized enterprises).
Persistently high unemployment with the government as the employer of last resort: Botswana’s unemployment rate has been close to 20 percent for the last two decades. The government is one of the largest employers in the economy with public employment accounting
1 This is also consistent with staff’s recent cross-country work on the factors that explain the slowdown in trend growth in SMICs (see chapter II in SM/13/22).
5.0
2.7 2.6 2.1
2.3
2.2 1.51.3
2.8
2.02.1
-0.4
-2.0
0.0
2.0
4.0
6.0
8.0
10.0
12.0
Botswana
Capital stock Labor
Total factor productivity Real GDP
2.92.3 1.9 2.3
0.80.9
0.90.8
2.6
2.01.8 1.4
-1.0
0.0
1.0
2.0
3.0
4.0
5.0
6.0
7.0
Mauritius
Capital stock Labor Total factor productivity Real GDP
BOTSWANA
INTERNATIONAL MONETARY FUND 5
for more than 20 percent of total employment and 40 percent of formal employment. Government sector wages are high relative to the private sector with average wages in the government exceeding private-sector wages by 21 percent in 2011, which is high compared with other SMICs. Over the years, government employment and wage policies has attracted a large share of the labor force into the public sector, raised reservation wages and influenced schooling decisions which have contributed to the skill mismatch in the labor market. 2
Lackluster progress in economic diversification: The fact that the public sector occupies a large segment of the economy has hindered the private sector from becoming a significant driver of growth in Botswana. As in many other SMICs, the concentration on household credit coincides with the economy’s reliance on consumption for growth relative to investment (Figure 4). Thus, the mining sector and government services are occupying significant shares of GDP, which yields less broad-based growth, increases exposure to external shocks and thus macroeconomic volatility.
Reducing the relative size of the government (as a share of GDP) would contribute to the creation of more productive investment opportunities for the financial sector, improve labor market outcomes and enhance prospects for greater economic diversification.
3. These long-term challenges dovetail with the government’s own policy priorities as laid out in the recent Mid-Term Review (MTR) of the 10th National Development Plan (NDP10). The MTR of NDP 10 reemphasizes the policy thrust to reduce the size of government relative to GDP so that the private sector can take the lead in returning Botswana to a period of strong and robust growth. Within this broad remit, the MTR of NDP 10 identified the following policies as priorities: (i) making the government more effective and efficient, (ii) tackling the high level of unemployment, (iii) enhancing more inclusive growth and (iv) boosting prospects for greater economic diversification.
B. Current Conditions
4. A strong post-crisis growth has moderated—reflecting a combination of decelerating net external demand partly offset by a solid contribution from domestic demand.
Output growth slowed down from about 6 percent in 2011 to about 4 percent in 2012. This deceleration was driven by the decline in mining sector growth due to the subdued global demand for diamonds. Construction and service sectors grew fast, offsetting the negative impact of the mining sector on the overall GDP (Figure 1 and Table 1). From the expenditure side of GDP, domestic demand was relatively strong in 2012, with private consumption and investment growing by about 9 and 13 percent respectively in real terms, with net external demand declining by 7 percent.
Preliminary data suggest that the growth moderation continued in the first quarter of 2013 with real GDP growing by about 3 percent. This reflects the continued weak
2 See staff’s analysis in chapter 6 on closing the jobs gap in the Southern Africa Customs Union of the recently published book “Building a Common Future in Southern Africa,” Mongardini, J., (ed. 2013), IMF, Washington, D.C.

BOTSWANA
6 INTERNATIONAL MONETARY FUND
0
2
4
6
8
10
12
2010M1 2010M7 2011M1 2011M7 2012M1 2012M7 2013M1
Inflation
Core inflation
Botswana Inflation(Percent, year-on-year)
Sources: Country authorities.
Inflation objective range
performance of the diamond sector and the slowdown in the construction sector. The latter is probably a consequence of the ongoing phasing out of the big government construction projects such as Morupule B power plant. However, services sector growth remained quite brisk.
5. The acceleration in household borrowing supported the solid growth in domestic demand. The increase, however, is from a low base, because the level of financial intermediation remains low in Botswana relative to other emerging and developing economies. Private-sector credit (in percent of GDP) is about 30 percent in Botswana compared with above 80 percent in emerging and developing Asia. That said, private-sector credit, on average, grew by an annual 26 percent last year, driven mainly by the expansion in credit to households (with mortgages accounting for about fourteen percent, while unsecured credit about forty percent). Banks’ nonperforming loans (NPLs) which were 2.6 percent at end-December 2012 increased by about 30 percent in March 2013. The deterioration in the quality of banks’ loan portfolio to households accounts for the increased NPLs.
6. Meanwhile, the fiscal withdrawal has not significantly dampened non-mineral sector growth. The budget was balanced in FY2012/13 for the first time since the 2008 global financial crisis. A “growth-friendly” consolidation was implemented through reining in nonproductive current spending, which was supported by the windfall revenues from the Southern Africa Customs Union (SACU).3 However, spending on wages in percent of GDP, increased by about a half percentage point in FY2012/13 despite the authorities’ plans of a 5 percent targeted reduction in the wage bill in the original FY2012/13 budget (Table 4d). The increase was driven by the “temporary recession allowance” granted to civil servants at the lower end of the wage ladder to mitigate the effects of the recession. Execution of capital spending was below budget owing to problems in the implementation process that delayed the commencement of some government projects. On the revenue side, non-mineral income tax and mineral revenue underperformed, reflecting subdued economic activity.
7. Monetary policy was eased as inflation decelerated towards the upper end of the Bank of Botswana’s (BoB) 3–6 percent objective range. Consumer price inflation declined steadily in recent months and stood at 5.8 percent at end-June from about 7.4 percent at end-2012. Core inflation, which excludes administered prices, also declined. The BoB reduced its policy rate by 100 basis points during April—June, 2013.
3 The SACU revenue windfall which explains a large part of the fiscal adjustment in FY2012/13 is due to the backward looking nature of the SACU revenue sharing formula (the 2-year lagged adjustment mechanism).

BOTSWANA
INTERNATIONAL MONETARY FUND 7
-3,000
-2,000
-1,000
0
1,000
2,000
3,000
4,000
-3,000
-2,000
-1,000
0
1,000
2,000
3,000
4,000
2003 2004 2005 2006 2007 2008 2009 2010 2011 2012
Trade balance Services IncomePrivate transfers Official transfers CAB
Sources: Botswana authorities and IMF staff estimates.
Current Account Balance (Millions of US dollars)
8. The external current account has been in deficit since the 2008–09 global financial crisis. The combination of subdued diamond exports and fast import growth continues to drive the trade deficit. The high import growth reflected the large scale government construction projects, most notably the Morupule B power plant, cost of fuel import related to electricity supply, and to some extent strong private consumption growth financed by the rapid increase in household borrowing (Appendixes II and III). Net service balance also turned negative reflecting lower tourism receipts. Official transfers, mainly SACU revenues, have also contributed to the narrowing of the current account deficit from its 2009 level. As a result, the overall external position continues to be relatively strong with official reserves coverage standing at about 11 months of import cover at end-June 2013.
9. The real effective exchange rate (REER) continues to be broadly stable under the crawling peg arrangement (Figure 1). Since 2005, the authorities have pursued a crawling peg regime with the aim of preserving external competitiveness through real exchange rate stability. The regime is implemented through a continuous adjustment of the nominal effective exchange rate of the Pula, based on the differential between the medium-term inflation objective and trading partners’ inflation forecasts. The authorities published both the Pula currency basket weights and its rate of crawl in the FY 2013/14 budget, which has improved the transparency of the crawling peg regime. Staff’s econometric analysis, using CGER methods, which incorporate features appropriate for a mineral-based economy like Botswana, shows that the REER is broadly in line with fundamentals from a medium-term perspective (Appendix II). While Botswana’s external position continues to be strong and there are no external stability concerns, high export concentration creates potential risks for external stability (Appendix II).

BOTSWANA
8 INTERNATIONAL MONETARY FUND
Figure 1. Botswana: Recent Economic Developments The fiscal withdrawal did not dampen non-mineral sector growth
GDP growth has moderated… …driven by the negative growth of mining…
…while nonmining sector growth was strong. Inflation, while generally receding, is still at the upper end of BOB’s medium term objective range.
The fiscal balance continues to improve… … thanks to higher SACU revenues and expenditure restraint.
-6
-4
-2
0
2
4
6
8
10
12
2007 2008 2009 2010 2011 2012
Namibia Chile Malaysia South Africa MIC average Botswana
Real GDP Growth(Annual percent change)
Sources: IMF WEO
-30
-25
-20
-15
-10
-5
0
5
10
15
GDP
Mining GDP
Non-mining GDP
Real GDP Growth: Quarterly Annualized Rates (Percent)
Sources: Botswana authorities and IMF staff estimates.
-1 -0.5 0 0.5 1 1.5 2 2.5
Agriculture
Manufacturing
Water and electricity
Construction
Trade, hotels & restaurants
Transport
Financial & business services
General government
Social and personal services
Non-Mining GDP: Contributions to Growth, 2012(Percent)
Sources: Botswana authorities and IMF staff estimates.
-25-20-15-10
-505
10152025
Food Transport Total
Consumer Price Inflation, Jan 09–May 13 (Twelve-month percent change)
Source: Haver Analytics.
-40
-30
-20
-10
0
10
20
30
Overall balance Non-mineral primary balance
Fiscal Balances, FY08/09–FY11/12(Percent of GDP)
Sources: Botswana authorities and IMF staff estimates.
0
10
20
30
40
50
60Current expenditure Capital expenditure
Total revenue
Revenue and Expenditure, FY08/09–FY11/12(Percent of GDP)
Sources: Botswana authorities and IMF staff estimates.
BOTSWANA
INTERNATIONAL MONETARY FUND 9
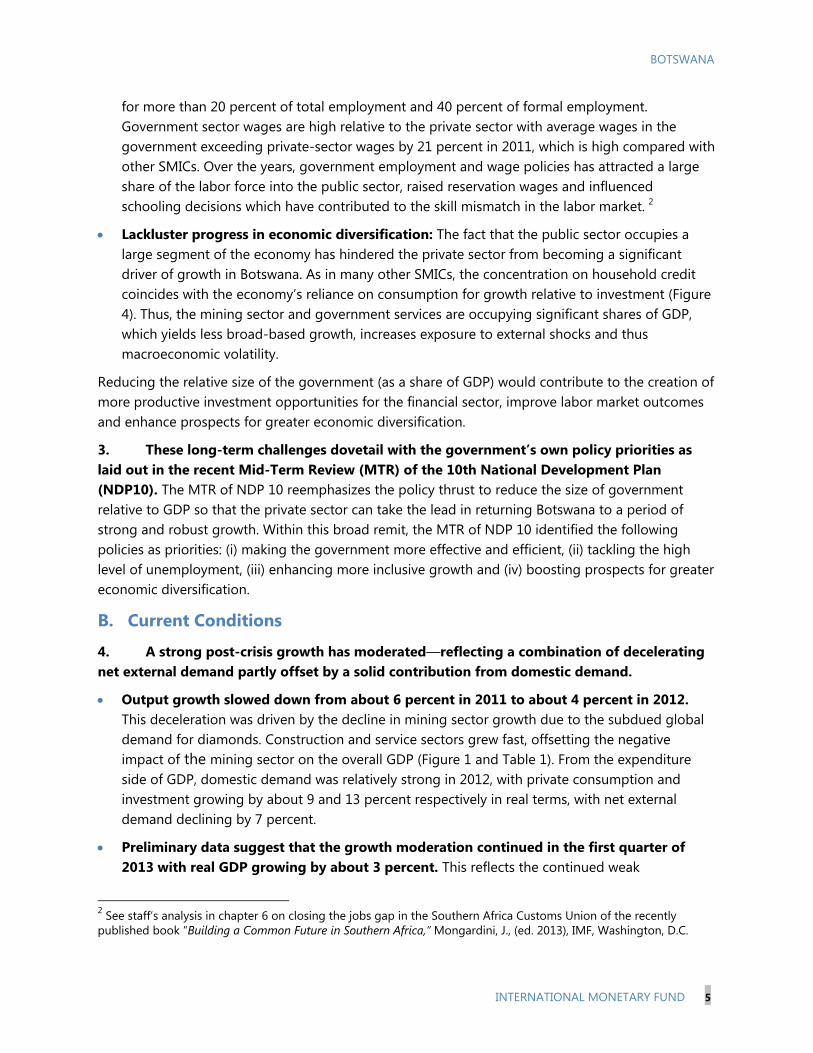
Figure 1. Botswana: Recent Economic Developments (concluded) Accelerated household borrowing supported the strong import growth.
Botswana’s real interest rates are the lowest in the region,…
…thus private-sector credit growth is among the highest in the region…
…driven by the credit to households. The real effective exchange rate has remained broadly
stable.
Strong import growth widened the trade deficit … … and slightly reduced the import coverage of foreign reserves.
-13
-8
-3
2
7
12
2007M1 2007M11 2008M9 2009M7 2010M5 2011M3 2012M1 2012M11
Botswana Namibia MauritiusLesotho Cape Verde South Africa
Real Deposit Rate(Percent)
Sources: IMF International Financial Statistics.
-10
0
10
20
30
40
50
2007M12 2008M8 2009M4 2009M12 2010M8 2011M4 2011M12 2012M8
South Africa Botswana NamibiaMauritius Lesotho Cape Verde
Sub-Saharan Africa Middle-Income Countries, Credit Growth(Percent, year-on-year)
Sources: IMF International Financial Statistics.
0
10
20
30
40
50
60
Households Total
Bank Credit Growth, 2009–2012 (Q/Q annualized, percent)
Sources: Botswana authorities and IMF staff estimates.
60
70
80
90
100
110
120
REER NEER
Effective Exchange Rates, Jan 09 –Mar 13(Index, 2005=100)
Sources: International Financial Statistics.
0
5000
10000
15000
20000
25000
Exports Imports
Trade Balance (Millions of Pula)
Sources: Botswana authorities and IMF staff estimates.
0
5
10
15
20
25
30
0
2,000
4,000
6,000
8,000
10,000
12,000
2007 2008 2009 2010 2011 2012
Millions of dollars
Months of imports (right scale)
Foreign Exchange Reserves, 2007–12
Sources: Botswana authorities and IMF staff estimates.

BOTSWANA
10 INTERNATIONAL MONETARY FUND
Figure 2. Small Middle-Income Countries in Sub-Saharan Africa: Regional Comparison (Average 2002-2012, unless otherwise indicated)
Prudent macro-management helped Botswana to build up large policy buffers relative to peers. Although Botswana’s economic growth was belowemerging markets average growth….
…its inflation remained elevated compared with middle-income peers.
High diamond revenue combined with prudent macro-management helped to build up policy buffers….
…and enabled Botswana to maintain higher–than-averageexpenditure….
… while maintaining a low level of public debt, … ….and accumulating significant foreign reserves.
Source: Country authorities, IMF staff estimates, and IMF World Economic Outlook. Note: Comparison bar refers to the WEO "Emerging and Developing Markets" analytical group.
0
1
2
3
4
5
6
7
Real GDP Growth(Annual percent change)
0123456789
10
CPI Inflation(Annual percent change)
-7-6-5-4-3-2-101234
Central Government Balances(Percent of GDP)
0
10
20
30
40
50
60
General Government Expenditure(Percent of GDP)
0102030405060708090
100
Total Public Debt, End-2011(Percent of GDP)
0
2
4
6
8
10
12
14
Gross Foreign Reserves, End-2011(Months of imports)
BOTSWANA
INTERNATIONAL MONETARY FUND 11
C. Outlook and Risks
10. Outlook
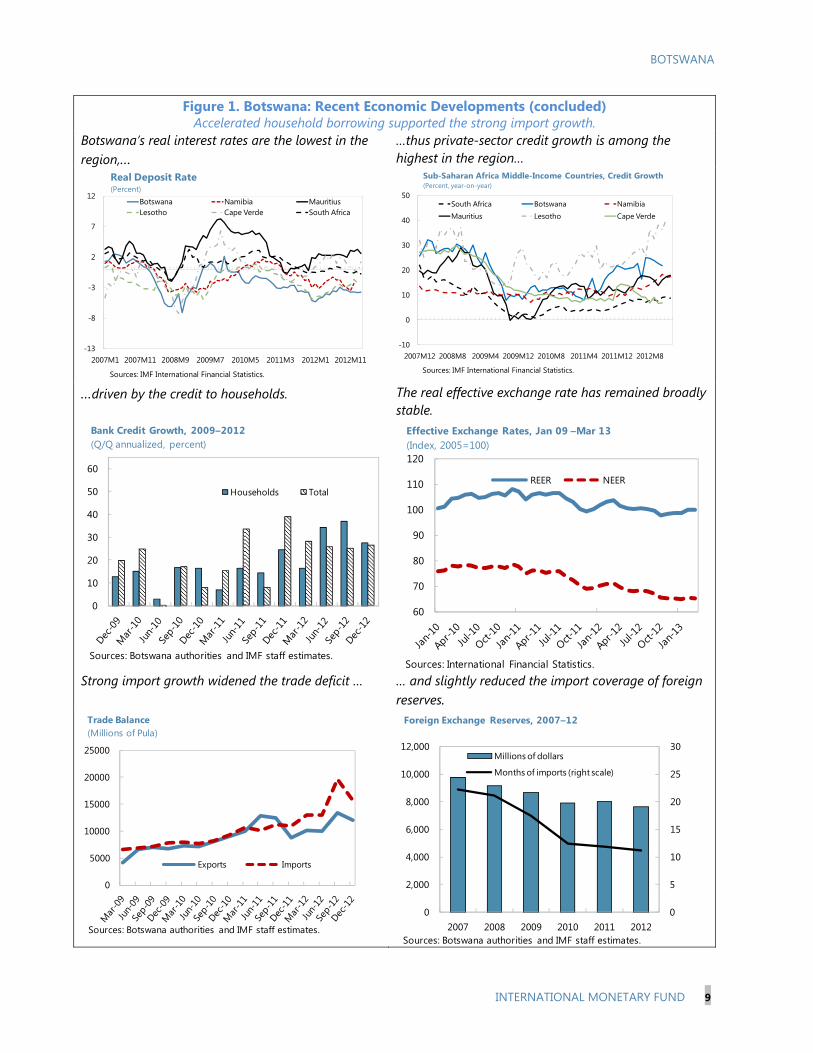
Output: Staff projects that real GDP will grow by about 4 percent in 2013 on the back of a strong non-mineral GDP growth and an anemic mining sector (Table 1). Growth is expected to pick up slightly to 4.4 percent in 2015 supported by the base effect of increased electricity production and a recovery in the mining sector and subsequently stabilize at around 4 percent.
Inflation: Headline inflation is likely to remain close to the upper end of BoB’s medium-term objective range in the remainder of 2013. However, below normal rainfall for the region, poses a potential upside risk to food prices. At the same time, fiscal consolidation, underpinned by government wage restraint, should help to contain demand-push inflationary pressures.
External position: The current account deficit is expected to narrow in the coming years supported by the public sector savings generated by the planned fiscal consolidation and the expected recovery in diamond exports along with global recovery. As measures by the government result in tempering the rate of growth of household borrowing, import growth should slow down. This combined with a stable electricity supply by Moropule B power plant, will contribute to closing the current account deficit. More broadly, success toward export diversification and an improvement in competitiveness, underpinned by the implementation of regulatory and structural reforms should help the return to a current account surplus and enhance external sustainability over the long term.
11. Risks
The main near-term risk relates to the uncertain external environment, which poses significant downside risks to diamond export demand4, and on the domestic front potential delays in the full commencement of the Morupule B power plant. Under some adverse scenarios, output growth could be lower by 1–1½ percentage points compared with the baseline forecast. Botswana is also exposed to spillovers through strong economic and financial linkages with South Africa, where recent developments and outlook suggest sluggish growth (Appendix I). Banks’ high exposure to households and rapid increase in the growth of unsecured lending is an emerging policy challenge. A key medium-term risk relates to the sustainability of long-term growth as trend growth has softened in the last decade requiring new growth drivers. Another medium-term risk is that, like other countries in SACU, Botswana faces the prospect that SACU revenues may decline either because of a prolonged period of low global growth or changes in the SACU revenue-sharing formula.
4 Diamonds constitute about 75 percent of Botswana’s exports—other minerals represent a tiny part of the export base. While the recent sharp decline in commodity prices may to some extent rub off on diamond prices, the storable nature of diamonds that allows buffering of shocks by adjusting inventories will likely limit the price decline. Indeed since the 2008-09 global financial crisis, Debswana has been keeping production volumes stable while using inventories in respond to global demand changes. The distinction between diamonds and other commodities is also reflected in the market structures. There are no international diamond markets in the same sense that other commodities are traded. Diamonds are sold through various channels (auctions, tenders and, of course, the Diamond Trading Company, as well as various trading "networks") and the various price indices are based on assessments of current trends by industry analysts, rather than any independently verifiable benchmark.
BOTSWANA
12 INTERNATIONAL MONETARY FUND
POLICY DISCUSSIONS The authorities largely agreed with the staff’s assessment of recent economic developments, outlook, and prospects. They reiterated the need to pursue a “growth-friendly” fiscal consolidation plan and reduce the size of the government (as a share of GDP). Consistent with the Fund’s surveillance of SMICs in sub-Saharan Africa, the need to address the policy gaps, and the authorities’ policy priorities as laid out in the recent MTR of the NDP10, this year’s consultation focused on four main themes: (i) global economic spillovers; (ii) fiscal policy implications for labor market outcomes; (iii)the implications of rising household indebtedness for financial stability; and (iv) how to return the economy to an era of strong growth, enhance job creation and boost prospects for economic diversification.
A. Policy Theme 1: Near-Term Macroeconomic Policies and Global Spillovers
12. Near-term macroeconomic policy stance
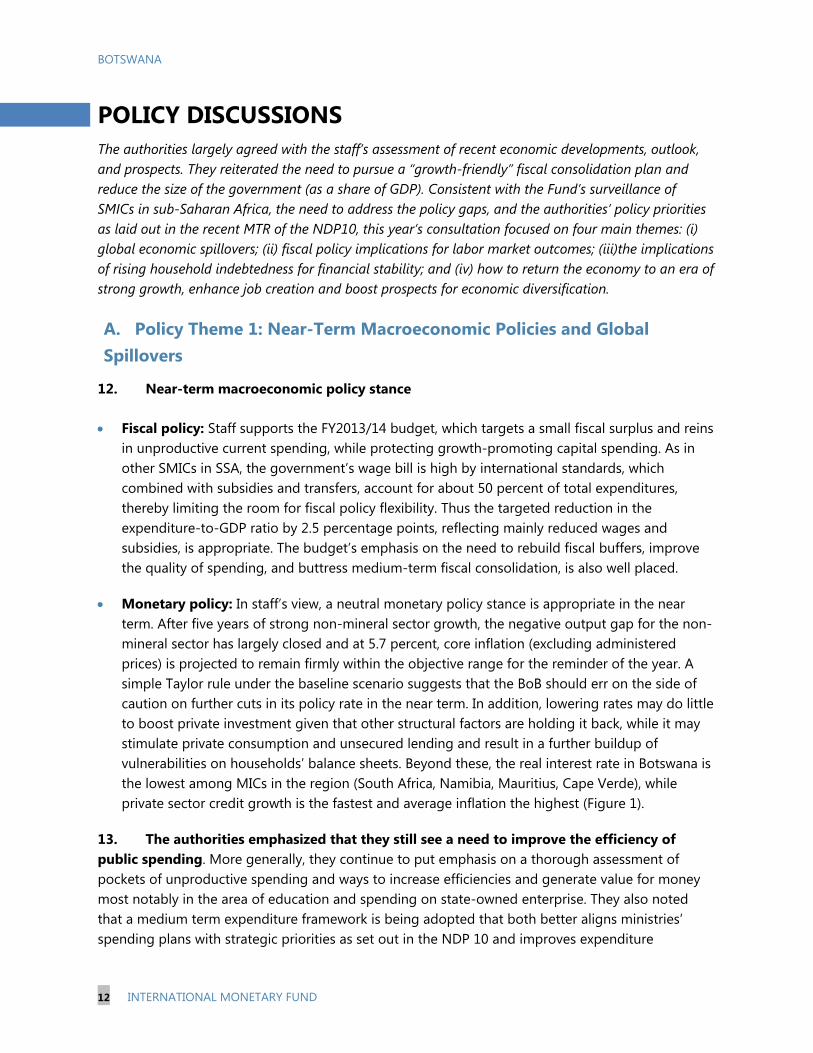
Fiscal policy: Staff supports the FY2013/14 budget, which targets a small fiscal surplus and reins in unproductive current spending, while protecting growth-promoting capital spending. As in other SMICs in SSA, the government’s wage bill is high by international standards, which combined with subsidies and transfers, account for about 50 percent of total expenditures, thereby limiting the room for fiscal policy flexibility. Thus the targeted reduction in the expenditure-to-GDP ratio by 2.5 percentage points, reflecting mainly reduced wages and subsidies, is appropriate. The budget’s emphasis on the need to rebuild fiscal buffers, improve the quality of spending, and buttress medium-term fiscal consolidation, is also well placed.
Monetary policy: In staff’s view, a neutral monetary policy stance is appropriate in the near term. After five years of strong non-mineral sector growth, the negative output gap for the non-mineral sector has largely closed and at 5.7 percent, core inflation (excluding administered prices) is projected to remain firmly within the objective range for the reminder of the year. A simple Taylor rule under the baseline scenario suggests that the BoB should err on the side of caution on further cuts in its policy rate in the near term. In addition, lowering rates may do little to boost private investment given that other structural factors are holding it back, while it may stimulate private consumption and unsecured lending and result in a further buildup of vulnerabilities on households’ balance sheets. Beyond these, the real interest rate in Botswana is the lowest among MICs in the region (South Africa, Namibia, Mauritius, Cape Verde), while private sector credit growth is the fastest and average inflation the highest (Figure 1).
13. The authorities emphasized that they still see a need to improve the efficiency of public spending. More generally, they continue to put emphasis on a thorough assessment of pockets of unproductive spending and ways to increase efficiencies and generate value for money most notably in the area of education and spending on state-owned enterprise. They also noted that a medium term expenditure framework is being adopted that both better aligns ministries’ spending plans with strategic priorities as set out in the NDP 10 and improves expenditure

BOTSWANA
INTERNATIONAL MONETARY FUND 13
projections and the relevance of budget ceilings, while reinforcing the integrity of the development budget through enhanced project evaluation and prioritization.
14. On monetary policy they noted that further adjustment in the policy rate will be guided by the medium-term outlook on inflation. The BoB pointed to evidence from recent Business Expectations Surveys, which suggests that inflation expectations are on a downward trend as well as the benign inflation outlook. They noted that the lower rate of crawl of the pula based on inflation forecast differentials compared with the actual inflation differential contributed to the reduction in inflationary pressures.
15. Managing global spillovers
If further adverse global spillovers beyond the staff’s baseline scenario lead to a decline in diamond prices and a significant loss of revenues, staff advised the authorities to allow the automatic stabilizers to work on the revenue side (Appendix I). Although this will slightly delay the fiscal consolidation path envisaged under the FY2013/14 budget by at most 1 percentage point of GDP, in staff’s view, it should not undermine medium-term fiscal sustainability. A more accommodative monetary policy stance would be appropriate in this adverse scenario, because lower domestic demand and the benign external inflation environment would reduce inflationary pressures. More generally, with increased policy uncertainty in South Africa, such spillovers call for policy response to be measured, carefully calibrated, and proportional to risks and pressures coming from the global economic environment.
The authorities agreed with staff’s view that the potential global spillovers to Botswana would be limited and short-lived. Although China and India’s shares in diamond consumption have been growing in recent years, they are still not the major player among Botswana’s trading partners. In addition, they expect the growth slowdown in South Africa to have limited spillover effects in Botswana. Over 85 percent of Botswana’s exports go to countries outside South Africa, and the funding base of banks is largely domestic. The authorities don’t expect demonstration effects of large wage demands in South Africa’s mines on Botswana’s mining sector as industrial relations in Botswana are less confrontational. However, there would be significant impact on business and economic activity if the recurring labor strikes were to disrupt the transportation of goods from South Africa to Botswana. They underscored their commitment to continue to rebuild the fiscal policy buffers, which have served them well in the past, to respond to such adverse shocks.
BOTSWANA
14 INTERNATIONAL MONETARY FUND
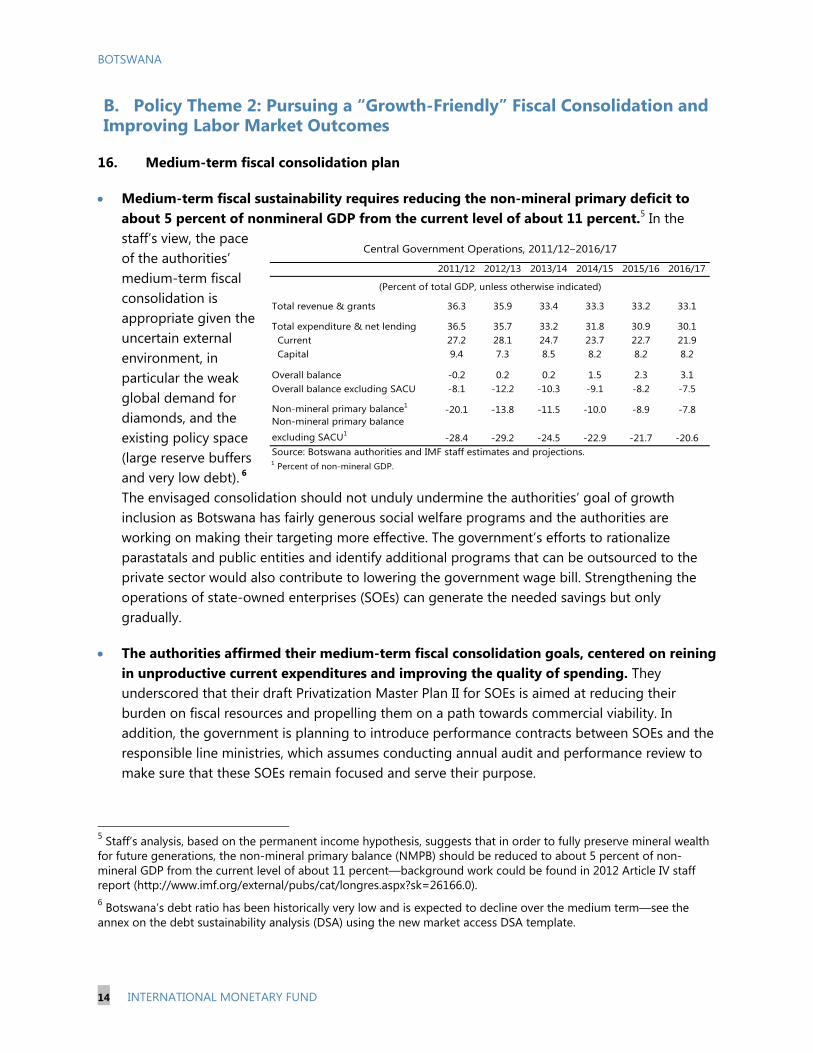
2011/12 2012/13 2013/14 2014/15 2015/16 2016/17
Total revenue & grants 36.3 35.9 33.4 33.3 33.2 33.1
Total expenditure & net lending 36.5 35.7 33.2 31.8 30.9 30.1 Current 27.2 28.1 24.7 23.7 22.7 21.9 Capital 9.4 7.3 8.5 8.2 8.2 8.2
Overall balance -0.2 0.2 0.2 1.5 2.3 3.1Overall balance excluding SACU -8.1 -12.2 -10.3 -9.1 -8.2 -7.5
Non-mineral primary balance1 -20.1 -13.8 -11.5 -10.0 -8.9 -7.8Non-mineral primary balance
excluding SACU1 -28.4 -29.2 -24.5 -22.9 -21.7 -20.6Source: Botswana authorities and IMF staff estimates and projections.1 Percent of non-mineral GDP.
Central Government Operations, 2011/12–2016/17
(Percent of total GDP, unless otherwise indicated)
B. Policy Theme 2: Pursuing a “Growth-Friendly” Fiscal Consolidation and Improving Labor Market Outcomes
16. Medium-term fiscal consolidation plan
Medium-term fiscal sustainability requires reducing the non-mineral primary deficit to about 5 percent of nonmineral GDP from the current level of about 11 percent.5 In the staff’s view, the pace of the authorities’ medium-term fiscal consolidation is appropriate given the uncertain external environment, in particular the weak global demand for diamonds, and the existing policy space (large reserve buffers and very low debt). 6 The envisaged consolidation should not unduly undermine the authorities’ goal of growth inclusion as Botswana has fairly generous social welfare programs and the authorities are working on making their targeting more effective. The government’s efforts to rationalize parastatals and public entities and identify additional programs that can be outsourced to the private sector would also contribute to lowering the government wage bill. Strengthening the operations of state-owned enterprises (SOEs) can generate the needed savings but only gradually.
The authorities affirmed their medium-term fiscal consolidation goals, centered on reining in unproductive current expenditures and improving the quality of spending. They underscored that their draft Privatization Master Plan II for SOEs is aimed at reducing their burden on fiscal resources and propelling them on a path towards commercial viability. In addition, the government is planning to introduce performance contracts between SOEs and the responsible line ministries, which assumes conducting annual audit and performance review to make sure that these SOEs remain focused and serve their purpose.
5 Staff’s analysis, based on the permanent income hypothesis, suggests that in order to fully preserve mineral wealth for future generations, the non-mineral primary balance (NMPB) should be reduced to about 5 percent of non-mineral GDP from the current level of about 11 percent—background work could be found in 2012 Article IV staff report (http://www.imf.org/external/pubs/cat/longres.aspx?sk=26166.0). 6 Botswana’s debt ratio has been historically very low and is expected to decline over the medium term—see the annex on the debt sustainability analysis (DSA) using the new market access DSA template.

BOTSWANA
INTERNATIONAL MONETARY FUND 15
17. The contribution of revenue mobilization to fiscal consolidation
In staff’s view, broadening the tax base should be an integral pillar of a balanced medium-term fiscal consolidation process. Measures in this regard include an increase in the effective tax rates on income and value added taxes through a judicious rationalization of the large tax expenditures and improvements in tax administration. Tax compliance should also be improved by reducing tax evasion and eliminating loopholes in the tax system. Staff recommends integrating tax expenditure quantifications into the budget process and maintaining tax incentives that provide fast recovery of investments (in the form of accelerated depreciation regime for productive assets) as they are most cost-effective relative to tax holidays.
The authorities noted that their strategy for achieving a balanced fiscal consolidation focuses on improving tax administration combined with expenditure restraint. They are fully cognizant of expected reduction of revenues due to depletion of diamond mines in the long run. Their primary focus is on strengthening the administrative capacity of the Botswana Unified Revenue Service (BURS) and simplifying the tax system to encourage tax compliance. Given that their revenue mobilization efforts through making the tax system more efficient, most likely will not fill expected revenue gap to the full extent, they will complement these with putting more emphasis on curtailing expenditures. While they concurred that the negative externalities of tax incentives outweigh their marginal benefits, their rationalization would require more time. Their medium-term expenditure framework, which is expected to be in place by 2016, should also assist their broader goal of a balanced fiscal consolidation.
18. The distortions created by public employment and wage policies in the labor market
Staff’s analysis suggests that reforms aimed at reducing rents of public employees and the size of public employment would improve labor market outcomes.7 The cumulative growth of average government sector wages for the period 2001—09 was about 126 percent, much higher than the 75 percent cumulative growth of nominal GDP per worker for the same period. Staff urged the government to articulate a clearer set of measures that would underpin the reduction of the wage bill to improve labor market outcomes. Staff advocated for the government to limit public sector wage awards below nominal GDP per capita growth, which takes into account both inflation and economy-wide productivity gains.8 Given that there is no wage premium at the medium to senior level civil servants, going forward, to cope with the
7 See chapter 1 of the accompanying selected issues paper. This paper, which looks at the impact of public sector employment and wage policies on labor market outcomes for MICs, was also presented at the Fund-wide Small Islands Club on July 25th, 2013. 8 Other policy measures that staff have recommended to the authorities include short-term—streamlining the system of nonwage payments, including tighter eligibility criteria for allowances; medium-term—rationalizing the size and structure of government, tightening the link between pay and performance; and strengthening payroll systems (see 2012 Article IV consultation report http://www.imf.org/external/pubs/cat/longres.aspx?sk=26166.0 ).

BOTSWANA
16 INTERNATIONAL MONETARY FUND
intense regional competition for scarce skilled labor at those levels, the government could use wage decompression, which will give higher wages to high-skilled civil servants.
The focus of the authorities’ MTR of NDP 10 is to reduce the size of the government (as a share of GDP) and increase its efficiency. While the authorities took note of the staff’s advice to achieve targeted reduction of the wage bill, they highlighted a potential risk of social tensions when dealing with wages and public employment in an environment of relatively low growth, high unemployment, with labor disputes in the region. They reiterated that, given the complexities in this area, reforms would need to be implemented gradually. They also pointed out that the wage premium of the government is largely concentrated at the lower end of the wage ladder, while the middle and senior civil servants earn relatively lower wages compared with their private sector peers. In the last few years, public sector wage growth has moderated significantly following a three-year wage freeze. With regards to public employment, in some critical areas, the government may need to recruit more staff. Specifically while they have reduced the employment in some sectors of the government, they had to allow an increase in the employment in the Administration of Justices, Attorney General’s office, and in the Corruption Court to help pursue the government’s zero tolerance policy on corruption and deal with the large backlog of important legislative bills. In addition, the process of outsourcing some of the government services to the private sector was slow. To address the issue of skill mismatch in the labor market, the government is reviewing the Botswana Qualification Authority act and is continuing its work on the Internship Program and the Youth Development Fund.

BOTSWANA
INTERNATIONAL MONETARY FUND 17
Figure 3. Public Sector Wage and Employment Policies are Creating Distortions in the Labor Market
Botswana’s share of public employment in total employment is high relative to peers (MICs)…
…and it pays high wage premium to public employees compared with the private sector...
… which inflated the wage bill… … contributed to skills mismatch…
… and resulted in a persistently high level of unemployment ….
… particularly among the youth.
0
5
10
15
20
25
30
35
Nam
ibia
Seyc
he
lles
Bo
tsw
ana
Mau
riti
us
Sou
th A
fric
a
Mal
aysi
a
Bra
zil
Ch
ile
Per
u
Thai
lan
d
Ru
ssia
n F
ede
rati
on
Co
lom
bia
Kaza
khst
an
Mex
ico
Do
min
ican
Rep
ub
lic
Share of Public Employment in total(Average, 1995–2011)
0
20
40
60
80
100
120
140
Public Sector Wages Relative to Private Sector
0
2
4
6
8
10
12
14
0
5
10
15
20
25
30
35
40
45
Central Government Expenditure and Wage Bill, 2007–11 (Percent of GDP)
Expenditure percent of GDP
Wage bill percent of GDP (RHS)
Chile
Malaysia
Trinidad & Tobago
India
Jamaica
Mauritius
Botswana
Lesotho
Namibia
South Africa
Swaziland
y = 0.6642x + 3.2447
0
5
10
15
20
25
30
0 5 10 15 20 25 30 35
Un
em
plo
ym
en
t ra
te
Skill Mismatch
0
5
10
15
20
25
Unemployment Rate(Average 1995–2011)
0
5
10
15
20
25
30
35
40
45
50
12--19 20--29 30--39 40--49 50--60 60--65+
The share of unemployed people in total by age

BOTSWANA
18 INTERNATIONAL MONETARY FUND
C. Policy Theme 3: Strengthening the Monetary Regime and Enhancing Financial Stability
19. The current exchange rate regime
The authorities noted that the crawling peg arrangement continues to serve Botswana well and merits continued support. They noted that the current policy framework remains appropriate given the circumstances, and a major review would only be necessary if and when there is a reason to believe that this is no longer the case.
The staff concurred. The current crawling peg regime minimizes the distortions associated with a hard peg while providing some flexibility in the exchange rate to absorb shocks. A shift to a strict peg to the South African rand will hinder the relative price adjustment required for terms of trade shocks given the lack of full price flexibility in both product and factor markets. At the same time, the characteristics of Botswana’s foreign exchange market, in particular “lumpy” diamond revenues that arrive periodically but in very large amounts on “diamond days,” and the lack of institutional readiness are constraints to a fully floating exchange rate regime. Thus, a more liquid foreign exchange market, combined with well developed derivative markets to help hedge volatilities, would be a prerequisite prior to adopting a floating exchange rate regime.
Staff encouraged the authorities to continuously look for opportunities to further strengthen the operational aspects of the regime. Staff welcomed the disclosure by the authorities on the Pula currency weights and the rate of crawl. The banks noted that the publication of the weights of the Pula’s currency basket and its rate of crawl has improved trading in the foreign exchange market. The authorities should also regularly assess the optimality of the Pula’s currency basket based on the changes in the underlying trade pattern and structural parameters of the economy. Going forward, staff encourages the authorities to continue to refine their analytic tools for monetary policy analysis and facilitate the deepening of the interbank market including for foreign exchange. These steps toward capacity building would, in their own ways, contribute more broadly to the strengthening of monetary management.
20. Financial sector developments
Botswana’s banking system is profitable and well-capitalized with relatively low NPLs.9 However, there are potential vulnerabilities stemming from the high concentration of banks’ loans to households and the recent acceleration in the growth of unsecured lending (Appendix III). Loans to households amount to about 60 percent of total loans in the banking system. The increase in household debt partly reflects the authorities’ desire for enhancing greater financial inclusion. Coming from a relatively low base, and largely backed by public sector wages, which limits the associated credit risk, at this stage, household lending by itself does not pose major
9 Like many SMICs in the region, financial access remains relatively low for both individuals as well as small and mid-sized enterprises. According to Finscope’s 2009 study, more than half of Botswana’s population is unbanked.
BOTSWANA
INTERNATIONAL MONETARY FUND 19
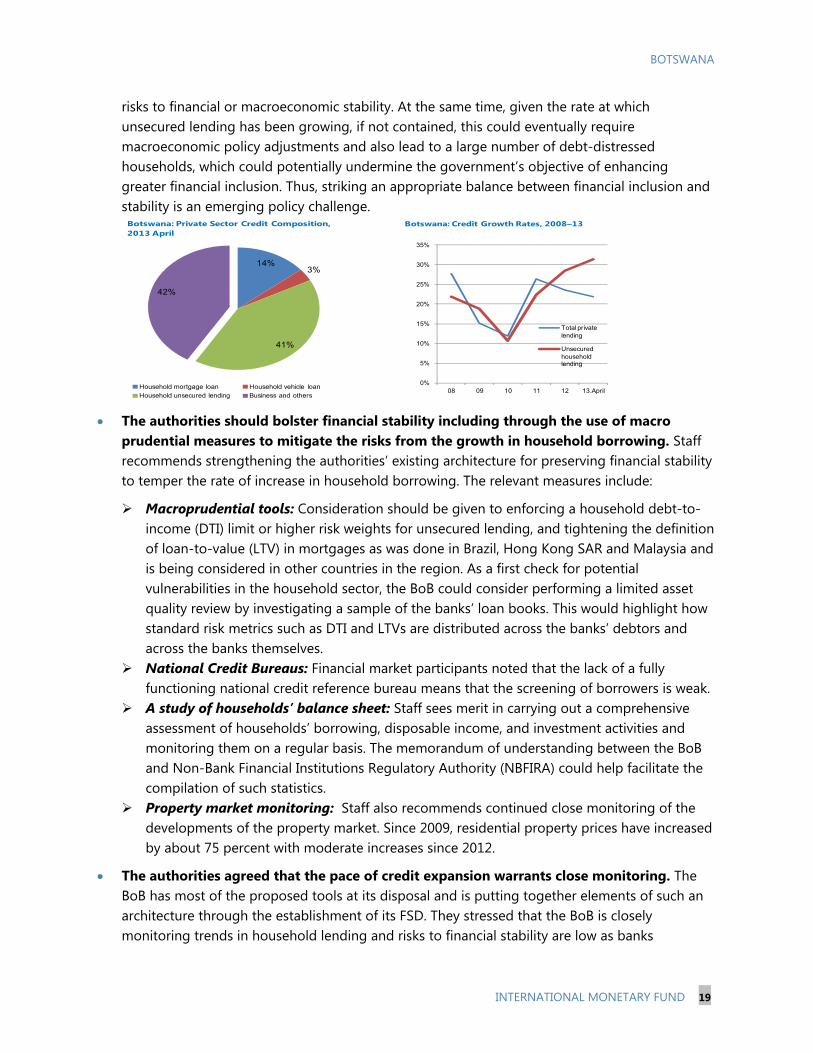
risks to financial or macroeconomic stability. At the same time, given the rate at which unsecured lending has been growing, if not contained, this could eventually require macroeconomic policy adjustments and also lead to a large number of debt-distressed households, which could potentially undermine the government’s objective of enhancing greater financial inclusion. Thus, striking an appropriate balance between financial inclusion and stability is an emerging policy challenge.
The authorities should bolster financial stability including through the use of macro prudential measures to mitigate the risks from the growth in household borrowing. Staff recommends strengthening the authorities’ existing architecture for preserving financial stability to temper the rate of increase in household borrowing. The relevant measures include:
Macroprudential tools: Consideration should be given to enforcing a household debt-to-income (DTI) limit or higher risk weights for unsecured lending, and tightening the definition of loan-to-value (LTV) in mortgages as was done in Brazil, Hong Kong SAR and Malaysia and is being considered in other countries in the region. As a first check for potential vulnerabilities in the household sector, the BoB could consider performing a limited asset quality review by investigating a sample of the banks’ loan books. This would highlight how standard risk metrics such as DTI and LTVs are distributed across the banks’ debtors and across the banks themselves.
National Credit Bureaus: Financial market participants noted that the lack of a fully functioning national credit reference bureau means that the screening of borrowers is weak.
A study of households’ balance sheet: Staff sees merit in carrying out a comprehensive assessment of households’ borrowing, disposable income, and investment activities and monitoring them on a regular basis. The memorandum of understanding between the BoB and Non-Bank Financial Institutions Regulatory Authority (NBFIRA) could help facilitate the compilation of such statistics.
Property market monitoring: Staff also recommends continued close monitoring of the developments of the property market. Since 2009, residential property prices have increased by about 75 percent with moderate increases since 2012.
The authorities agreed that the pace of credit expansion warrants close monitoring. The BoB has most of the proposed tools at its disposal and is putting together elements of such an architecture through the establishment of its FSD. They stressed that the BoB is closely monitoring trends in household lending and risks to financial stability are low as banks
14%3%
41%
42%
Household mortgage loan Household vehicle loanHousehold unsecured lending Business and others
Botswana: Private Sector Credit Composition, 2013 April
0%
5%
10%
15%
20%
25%
30%
35%
08 09 10 11 12 13.April
Total private lending
Unsecured household lending
Botswana: Credit Growth Rates, 2008–13

BOTSWANA
20 INTERNATIONAL MONETARY FUND
themselves are applying prudential measures including on households’ DTI ratio. The BoB has assigned higher risk weight on both unsecured credit and residential mortgage loans compared with Basel II. The authorities acknowledged that while their surveillance is constrained by the paucity of information on household debt outside the banking system, the non-bank regulator is monitoring the activities of the key micro lenders with the remainder forming a very small part of the overall household debt. At the same time, they argued that it is important to acknowledge that this credit expansion, at least in part, also reflects the continued broadening of the banking industry in Botswana to include more households. Moreover, it should not be presumed that such borrowing is purely for consumption purposes. To prevent debt distress households from turning to another financial institution for borrowing, the government with the ongoing technical assistance from the World Bank is working to establish an integrated credit bureau to serve as the formal repository for both banks and non-banks on households’ credit history and profile. The BoB is also strengthening its capacity to monitor the property market and the Real Estate Institute of Botswana is working toward compiling an index of property prices. The BoB is also increasingly infusing financial stability analysis (disaggregated credit trends/ratios and property market developments) into monetary policy discussions.
21. NBFIRA’s capacity to supervise the rapidly growing NBFIs
NBFIs (non-bank financial institutions) have been growing rapidly in recent years and their assets account for about 50 percent of GDP. Furthermore, the cross linkages between NBFIs and the commercial banks have increased. Thus, any large shock to the non-banking system could reverberate through the banking system and pose systemic stress across the financial system and the broader economy. This said, NBFIRA is not yet fully equipped to discharge its mandate due to delays in building a skilled and experienced staff, and a legal and regulatory infrastructure that is not fully in place. Staff advocates for continued strengthening of the regulations on NBFIs, drawing on recommendations of the ongoing technical assistance from the Fund. To prevent less creditworthy households from turning to non-bank lenders at a higher cost, the BoB and NBFIRA should consider addressing regulatory arbitrage gaps between banks and non-banks.10 Staff recommends that NBFIRA steps up its efforts in monitoring the activities of micro lenders and other unregulated financial institutions. The BoB and NBFIRA should conduct a mapping exercise on the inter-linkages between the banking system and the NBFIs. The exercise could cover deposits in banks by NBFIs, loans from banks to NBFIs, off-balance sheet exposures (such as non-life credit insurance sold to banks), cross ownership, common exposures to the property sector and how NBFIs use banks for payments services.
The authorities are aware of the capacity issues in NBFIRA and continue to strengthen its skill base and regulatory infrastructure. In addition, the government is putting in place the supporting enabling legislation for pension fund and life insurance institutions, which would include parameters such as minimum capital requirements for non-banks, maximum concentration by borrower and sector, and relevant solvency indicators.
10 The current regulatory framework provides the legal force to implement macroprudential measures when needed.
BOTSWANA
INTERNATIONAL MONETARY FUND 21
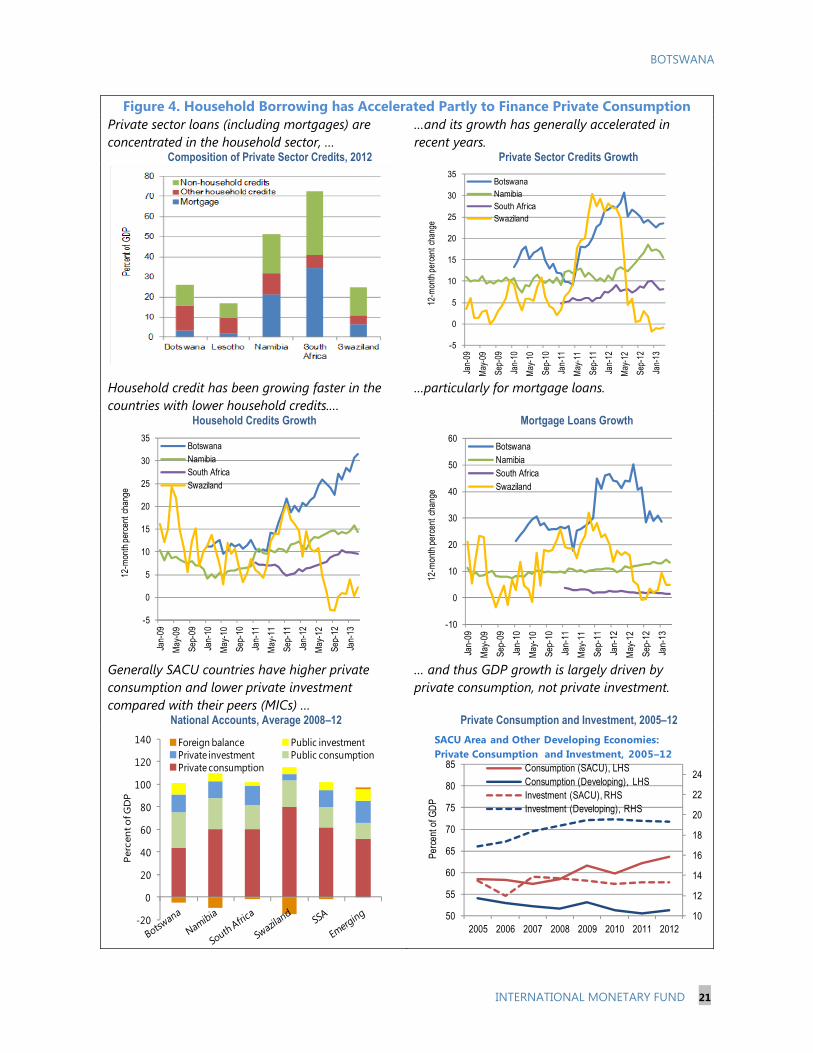
Figure 4. Household Borrowing has Accelerated Partly to Finance Private Consumption Private sector loans (including mortgages) are concentrated in the household sector, …
…and its growth has generally accelerated in recent years.
Composition of Private Sector Credits, 2012 Private Sector Credits Growth
Household credit has been growing faster in the countries with lower household credits.…
…particularly for mortgage loans.
Household Credits Growth Mortgage Loans Growth
Generally SACU countries have higher private consumption and lower private investment compared with their peers (MICs) …
… and thus GDP growth is largely driven by private consumption, not private investment.
National Accounts, Average 2008–12 Private Consumption and Investment, 2005–12
-5
0
5
10
15
20
25
30
35
Jan-
09
May
-09
Sep-
09
Jan-
10
Ma y
-10
Sep-
10
Jan-
11
May
-11
Sep-
11
Jan-
12
May
-12
Sep-
12
Jan-
13
BotswanaNamibiaSouth AfricaSwaziland
12-m
onth
per
cent
cha
nge
-5
0
5
10
15
20
25
30
35
Jan-
09
May
-09
Sep-
09
Jan-
10
May
-10
Sep-
10
Jan-
11
May
-11
Sep-
11
Jan-
12
May
-12
Sep-
12
Jan-
13
BotswanaNamibiaSouth AfricaSwaziland
12-m
onth
per
cent
cha
nge
-10
0
10
20
30
40
50
60
Jan-
09
May
-09
Sep-
09
Jan-
10
May
-10
Sep-
10
Jan-
11
May
-11
Sep-
11
Jan-
12
May
-12
Sep-
12
Jan-
13
BotswanaNamibiaSouth AfricaSwaziland
12-m
onth
per
cent
cha
nge
-20
0
20
40
60
80
100
120
140 Foreign balance Public investmentPrivate investment Public consumptionPrivate consumption
Perc
ento
f GD
P
10
12
14
16
18
20
22
24
50
55
60
65
70
75
80
85
2005 2006 2007 2008 2009 2010 2011 2012
Consumption (SACU), LHSConsumption (Developing), LHSInvestment (SACU), RHSInvestment (Developing), RHS
Perc
ento
f GD
P
SACU Area and Other Developing Economies: Private Consumption and Investment, 2005–12
BOTSWANA
22 INTERNATIONAL MONETARY FUND
0
5
10
15
20
25
30
35
40
45
Botswana South Africa Kenya Rwanda Chile Mauritius
Services Trade Restrictive Index(Higher Index=More Restrictive)
Sources: World Bank.
0 20 40 60 80 100
Botswana
Argentina
Chile
Malaysia
Namibia
Lesotho
South Africa
Swaziland
Average Total Factor Productivity(Percent of South Africa)
Sources: World Bank.
D. Policy Theme 4: Reinvigorating Growth, Enhancing Inclusion and Promoting Economic Diversification
22. Returning to a period of strong growth and enhancing economic diversification 11
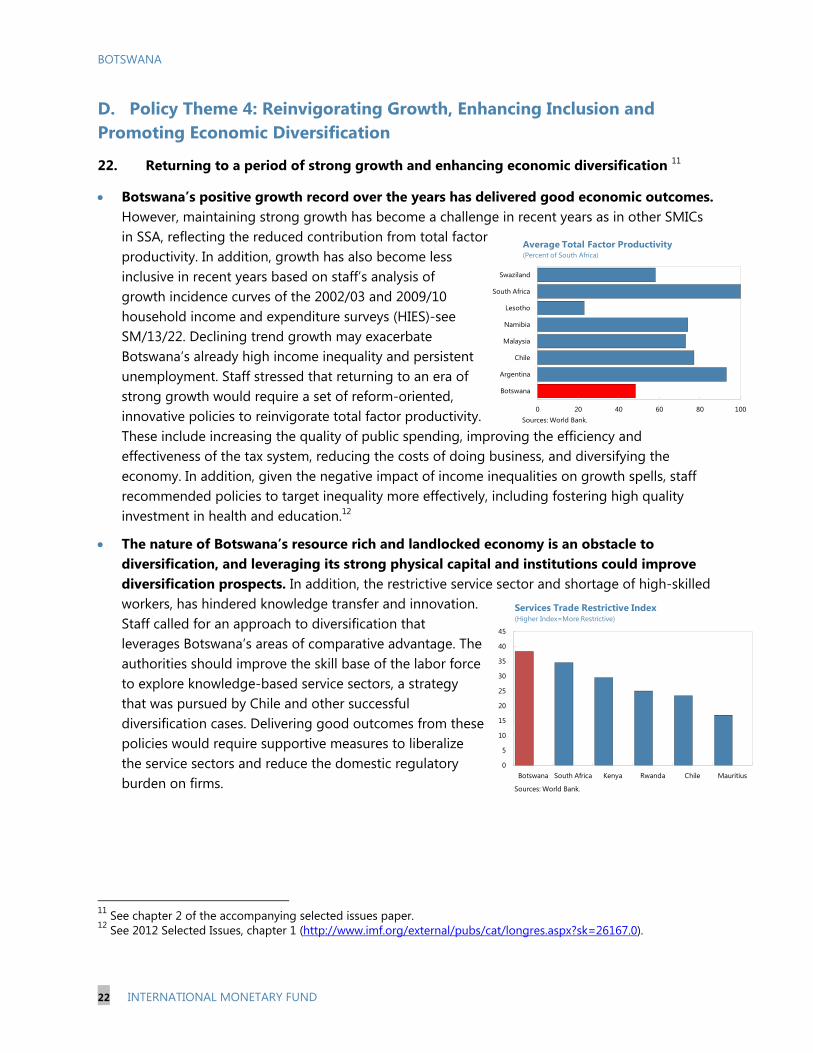
Botswana’s positive growth record over the years has delivered good economic outcomes. However, maintaining strong growth has become a challenge in recent years as in other SMICs in SSA, reflecting the reduced contribution from total factor productivity. In addition, growth has also become less inclusive in recent years based on staff’s analysis of growth incidence curves of the 2002/03 and 2009/10 household income and expenditure surveys (HIES)-see SM/13/22. Declining trend growth may exacerbate Botswana’s already high income inequality and persistent unemployment. Staff stressed that returning to an era of strong growth would require a set of reform-oriented, innovative policies to reinvigorate total factor productivity. These include increasing the quality of public spending, improving the efficiency and effectiveness of the tax system, reducing the costs of doing business, and diversifying the economy. In addition, given the negative impact of income inequalities on growth spells, staff recommended policies to target inequality more effectively, including fostering high quality investment in health and education.12
The nature of Botswana’s resource rich and landlocked economy is an obstacle to diversification, and leveraging its strong physical capital and institutions could improve diversification prospects. In addition, the restrictive service sector and shortage of high-skilled workers, has hindered knowledge transfer and innovation. Staff called for an approach to diversification that leverages Botswana’s areas of comparative advantage. The authorities should improve the skill base of the labor force to explore knowledge-based service sectors, a strategy that was pursued by Chile and other successful diversification cases. Delivering good outcomes from these policies would require supportive measures to liberalize the service sectors and reduce the domestic regulatory burden on firms.
11 See chapter 2 of the accompanying selected issues paper. 12 See 2012 Selected Issues, chapter 1 (http://www.imf.org/external/pubs/cat/longres.aspx?sk=26167.0).

BOTSWANA
INTERNATIONAL MONETARY FUND 23
The authorities are aware of the economy’s long-term challenges, and the recent MTR of NDP 10 aims to address them. The MTR of NDP 10 stressed the government’s intention to reinvigorate reforms and lay the foundations for greater private sector development in Botswana. The government’s multi-pronged approach to diversification (through the Economic Diversification Drive-EDD) leverages Botswana’s areas of comparative advantage to support new engines of growth. Given the country’s well-established infrastructure for mineral development, the focus is on expanding the mineral product space beyond diamonds, including downstream sectors which have relatively large employment multipliers, as well as cost-effective service sectors. In addition, the authorities noted that policy coordination among government agencies that was initiated in the thematic working groups for the MTR of NDP 10 was to ensure macro-micro congruence and overall consistency of the policy initiatives for boosting job creation and diversification. The authorities are also focusing on improving the business climate in the country in response to Botswana’s reduced rankings in the doing business indicators.
E. Other Surveillance Issues
23. Data quality is broadly adequate for surveillance, although there is room for improvement. While steady progress has been made by Statistics Botswana most notably for rebasing the country’s national income accounts, challenges remain in the compilation of some of the components of the national accounts. In this respect, staff sees merit for further Fund technical assistance in the area of national accounts. There is also room for improvement in the compilation of the balance of payments statistics, including data on trade in services. Following the relocation of the aggregation and sales functions of the Diamond Trading Company (DTC, a De Beers subsidiary) from London to Gaborone, the BoB has introduced detailed new tables for import and export of diamonds to present the rising re-exports trade for diamonds. The BoB and Statistics Botswana are also working closely on the appropriate treatment of diamond related re-export trade both in the national accounts and balance of payments. Staff also welcomed the BoB’s efforts to collect information on property prices. Finally, in line with some of its upper-middle income country peers, staff commends Botswana’s plan to move towards subscribing to the IMF’s Special Data Dissemination Standard.

BOTSWANA
24 INTERNATIONAL MONETARY FUND
Figure 5. Botswana’s Progress on Economic and Export Diversification Remains Lackluster While Botswana’s economy has diversified somewhat over time….
… its export base remains concentrated and export market share broadly unchanged.
Diversification of Botswana’s trading partners has also improved over time…
… while its trade sector is still undiversified relative to its peers (MICs)
Botswana has not succeeded in improving the margins of its export portfolio…
… and market penetration index remains stagnant.
0
0.2
0.4
0.6
0.8
1
2000 2005 2011
Agriculture
Construction
Financial services
Hotels and restaurantsManufacturing
Mining
Public administrationTransport and communicationsUtilities
Botswana Sectoral Share to GDP(Percent of GDP)
Sources: Country desk.
00.10.20.30.40.50.60.70.80.9
1
2000 2002 2004 2006 2008 2010 2012
Share of world exports Herfindahl IndexExport diversification
Botswana Share of World Exports and Diversification Index
Sources: WITS Database.
00.10.20.30.40.50.60.70.80.9
1
2000 2001 2002 2003 2004 2005 2006 2007 2008 2009 2010
Botswana Lesotho Namibia
Swaziland Chile Malaysia
Diversification of Trade Partners(HFI Index, lower = greater diversification)
Sources: World Integrated Trade Solution (WITS) Database.
0
0.1
0.2
0.3
0.4
0.5
0.6
0.7
0.8
1995 1997 1999 2001 2003 2005 2007 2009
Botswana Lesotho Namibia
Swaziland Chile Malaysia
Diversification of Trade Sector(HFI Index, lower = greater diversification)
Sources: WITS Database.
Botswana 2000
Botswana 2012
Chile 2000
Chile 2011
Malaysia 2000
Malaysia 2012
0
1
2
3
4
5
6
0
0.1
0.2
0.3
0.4
0.5
0.6
96.7 96.8 96.9 97 97.1
Inte
nsi
vem
argi
n
Extensive margin
Evolution of Intensive and Extensive Margins of Export Portfolio
Sources: WITS Database.
0
10
20
30
40
50
60
0
5
10
15
20
25
30
35
2000 2002 2004 2006 2008 2010
Ind
ex
of
exp
ort
mar
ket
pe
ne
trat
ion
Botswana Chile
Namibia Mauritius
Cape Verde Swaziland
Malaysia (RHS)
Export Market Penetration Index
Sources: WITS Database.

BOTSWANA
INTERNATIONAL MONETARY FUND 25
STAFF APPRAISAL 24. Botswana has made impressive strides in economic development over the past two decades. The positive growth record registered by the country has raised overall incomes and delivered good economic outcomes.
25. However, in recent years, Botswana’s trend growth has softened in the midst of persistent unemployment and high income inequality. Reducing the relative size of the government (as a share of GDP) would improve labor market outcomes, create more productive investment opportunities for the financial sector, and enhance economic diversification.
26. The recent mid-term review (MTR) the 10th National Development Plan (NDP10) serves as the authorities’ blueprint for structural transformation. Staff welcomes the MTR of NDP 10, which stressed the government’s intention to reinvigorate the implementation of reforms to lay the foundations for greater private sector development in Botswana.
27. The uncertain global economic environment and the potential spillovers to Botswana call for a delicate balancing act in the implementation of macroeconomic policies in the near term. Botswana’s fiscal and external positions are very strong, thanks to the government’s prudent macroeconomic management. A “growth-friendly” fiscal consolidation strategy adopted in the FY2013/14 budget is appropriate. In the near term, staff advocates for a broadly neutral monetary policy stance. In a more adverse scenario, the authorities should allow the automatic stabilizers to work on the revenue side. In such adverse scenarios, there might be some scope to ease monetary policy given that inflationary pressures would likely decline.
28. The authorities’ medium-term fiscal strategy adopted in the FY2013/14 budget should help to rebuild the policy buffers. In the staff’s view, the pace of the government’s medium term fiscal consolidation strategy is appropriate.
29. Staff urges the government to articulate a clearer set of measures to underpin the reduction of the wage bill as a share of GDP, which should help improve labor market outcomes. Botswana’s public employment and wage policies lead to high reservation wages and attract a larger share of labor force into public sector at the expense of the private sector.
30. Broadening the tax base would make the process of fiscal adjustment more balanced. This would require enhanced efforts in streamlining the existing large and discretionary tax expenditures. Staff welcomes efforts by the authorities toward a simplified tax system with high compliance and a low cost of administration as articulated in the recent mid-term review of NDP 10.
31. Botswana’s exchange rate regime has served the country well. The government’s publication of the weights of the Pula currency basket and its rate of crawl bodes well for enhancing the transparency of the exchange rate regime.

BOTSWANA
26 INTERNATIONAL MONETARY FUND
32. The government’s emphasis on greater financial inclusion through its financial sector development strategy, while preserving the stability of the financial system, is appropriate. Staff recommends that the authorities strengthen their existing architecture for monitoring financial sector developments to temper the rate of increase in household borrowing and thereby help minimize the associated vulnerabilities. In this context, staff welcomes efforts by the Bank of Botswana in strengthening the work of its Financial Stability Division.
33. Returning to an era of strong growth would require a set of reform-oriented, innovative policies to reinvigorate economy-wide productivity growth. These include increasing the quality of public spending, improving the efficiency and effectiveness of the tax system, including by fighting tax evasion, reducing the cost of doing business, and diversifying the economy.
34. The government’s multi-pronged approach to diversification that leverages Botswana’s areas of comparative advantage is a step in the right direction. Delivering good outcomes from these policies would require supportive measures to liberalize the service sectors and reduce the domestic regulatory burden on firms.
35. Staff recommends that the next Article IV consultation with Botswana take place on the standard 12-month cycle.

BOTSWANA
INTERNATIONAL MONETARY FUND 27
Table 1. Botswana: Authorities’ Response to Past IMF Policy Recommendations1 IMF 2011 & 2012 Article IV Recommendations
Authorities’ Response
Fiscal Policy
- consolidate fiscal policy and rebuild the fiscal buffers.
- contain the wage bill
Broadly consistent The FY2013/14 Budget targets a small fiscal surplus, and is centered on further expenditure restraint, while improving the quality of spending. Mid-term review of the authorities NDP10 envisages fiscal surpluses in the next three year. Despite the authorities’ announcement of a 5 percent targeted reduction in the original FY2012/13 budget, spending on wages in percent of GDP increased by about a half percentage point in FY2012/13.
- delink fiscal policy stance from volatile mining revenue
Inconsistent The fiscal stance is not formally delinked from volatile mining revenues. While the authorities recognize the need to delink the fiscal stance from volatility in the mining revenue, they are of the view that their sustainable budget index rule provides enough ground to deal with this volatility.
- broaden the tax base Partially consistent One of the key objectives of the MTR of NDP 10 is to achieve a simplified tax system with high compliance and a low cost of administration.
Monetary Policy
- increase transparency of the crawling peg regime through publishing currency weights of the Pula basket and rate of crawl.
- reestablish the traditional link between its policy rate and short-term interest rates.
- increase issuance of government securities.
Broadly consistent Consistent with staff’s advice during the October 2012 mission, the authorities published both the Pula currency basket weights and its rate of crawl in the FY 2013/14 budget. During 2010 the BoB used reverse repo operations to mop up intra-auction liquidity. The government highlighted in the 2013/14 budget speech about their plans to issue more treasury bills and

BOTSWANA
28 INTERNATIONAL MONETARY FUND
government bonds for promoting the growth of the capital market and reducing reliance on Bank of Botswana Certificates.
Financial Sector Policy
-strengthen regulation and supervision of nonbank financial institutions
-keep a balance between financial inclusion and stability
-enhance monitoring of commercial banks’ exposure to households and mortgage lending and consider pre-emptive measures to enhance banks’ capacity to absorb shocks.
- develop a reliable property market index to help monitor price developments and take appropriate regulatory steps where needed.
Partially consistent The government has put the appropriate regulation in place to allow the NBFIRA to collect supervisory levees from NBFIs to address some aspects of its funding problems. The BoB has subscribed a quarterly report on property market that includes information on price development.
1 Scale — fully consistent, broadly consistent, partially consistent, marginally consistent, or inconsistent.

BOTSWANA
INTERNATIONAL MONETARY FUND 29
Table 2. Botswana: Risk Assessment Matrix (RAM)1
Sources of Risk Relative
Likelihood Impact if Realized
Staff Advice on Policy Response
External Risks
Shor
t te
rm
Global oil shock triggered by geopolitical events
Low Medium Oil prices could increase beyond the cyclical levels for geopolitical considerations. Because Botswana imports all fuel requirements, terms of trade shocks from the fuel price hike would adversely affect domestic demand and also inflation in Botswana.
The authorities have traditionally allowed a full pass-through of the oil shock accommodating its first round effects on inflation while containing second-round effects if generalized price pressures begin to emerge.
Shor
t/M
ediu
m t
erm
Re-emergence of financial stress in the euro area and a protracted period of slower European growth
Medium/High Medium to High As a result of incomplete delivery of policy commitments in the euro area, financial stress could re-emerge and bank-sovereign-real economy links could re-intensify. The consequences would include further financial fragmentation and negative shocks to growth that could lead to a protracted period of slower European growth. This would directly affect Botswana’s mineral exports, which count for almost 75 percent of total exports.
See paragraph 15
Deeper-than-expected slowdown in emerging market economies
Medium Medium to High Disappointing activity in emerging markets would primarily affect commodity prices, which, combined with the increased share of China and India in Botswana’s foreign trade, would have a particularly significant impact on Botswana’s export earnings.
See paragraph 15
Emerging markets capital flow reversal and distortions from unconventional monetary policy
Medium Medium While Botswana has not been significantly affected by the recent surge in capital inflows, a reversal of these inflows would raise the risk premium and could have large macroeconomic consequences for South Africa. The impact could spillover to Botswana, given Botswana’s strong economic and financial linkages with South Africa, including a significant share of South African rand in
See paragraph 15

BOTSWANA
30 INTERNATIONAL MONETARY FUND
Botswana’s currency basket.
Growth slowdown and persistent labor unrest in South Africa
Medium/Low
Low Key channels of impact could arise from the rand being part of Botswana’s currency basket and from the close financial linkages—both banks and nonbanks. In the real sector, the disruptions of supply of inputs from South Africa, including electricity, could negatively affect domestic production. The resultant slower activity in South Africa would have an indirect impact on Botswana’s fiscal position through the risk of lower SACU transfers.
See paragraph 15
Domestic Risks
Shor
t te
rm
Delayed commencement of the Morupule B power plant
Medium
Medium to High A delay in the full commencement of the Morupule B power plant would weigh heavily on the domestic economy going forward, lowering electricity output and extending to the general private sector that bears the opportunity cost of power shortages. In addition, import bills for electricity and fuel will remain at record-high levels.
See paragraph 15
Shor
t/M
ediu
m t
erm
Deterioration of credit portfolio of unsecured lending
Low Medium to High A deterioration of the credit portfolio of unsecured lending could undermine the soundness of Botswana’s banking system because the bulk of household credit—which counts for more than 55 percent of banks’ total loans—is unsecured loans. In addition, this shock could easily propagate through the nonbank sector given the strong linkages between banks and non-banks.
See paragraph 20
1 The RAM shows events that could materially alter the baseline path—the scenario most likely to materialize in staff’s view. The relative
likelihood of risks listed is the staff’s subjective assessment of the risks surrounding the baseline (“low” is meant to indicate a probability below
10 percent, “medium” a probability between 10 and 30 percent, and “high” a probability of 30 percent or more). The RAM reflects staff views on
the source of risks and overall level of concern at the time of discussions with the authorities.
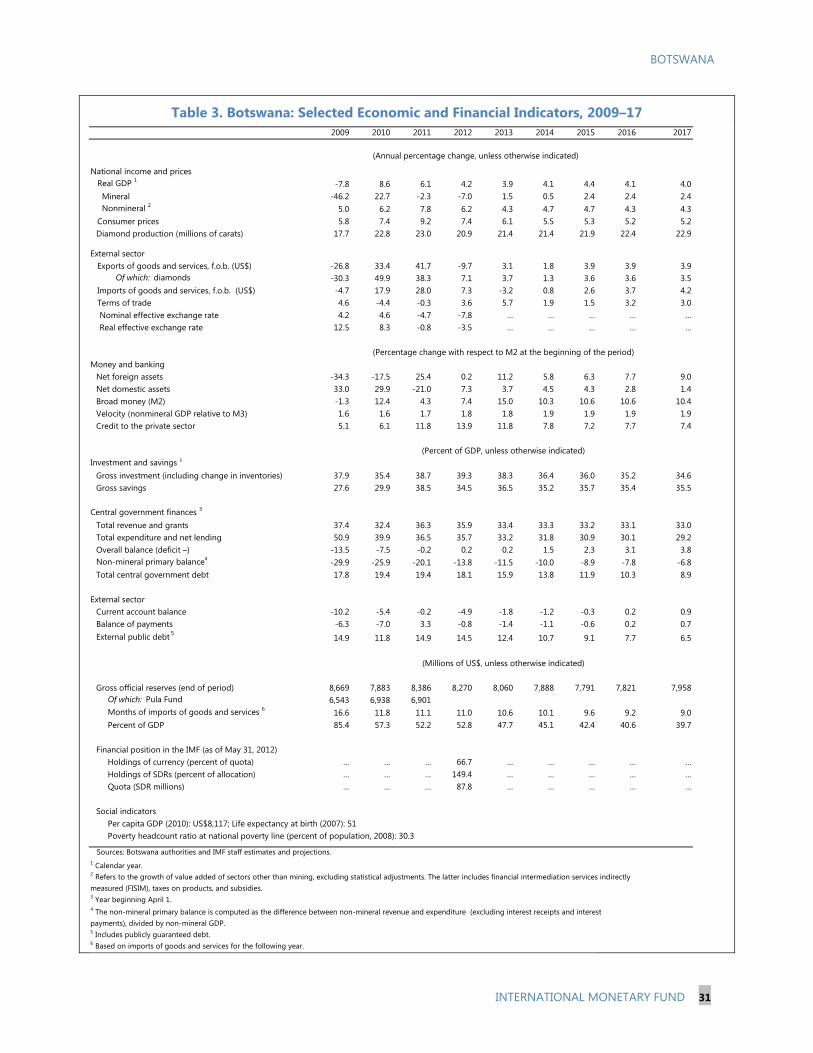
BOTSWANA
INTERNATIONAL MONETARY FUND 31
Table 3. Botswana: Selected Economic and Financial Indicators, 2009–17 2009 2010 2011 2012 2013 2014 2015 2016 2017
National income and prices Real GDP 1 -7.8 8.6 6.1 4.2 3.9 4.1 4.4 4.1 4.0
Mineral -46.2 22.7 -2.3 -7.0 1.5 0.5 2.4 2.4 2.4Nonmineral 2 5.0 6.2 7.8 6.2 4.3 4.7 4.7 4.3 4.3
Consumer prices 5.8 7.4 9.2 7.4 6.1 5.5 5.3 5.2 5.2Diamond production (millions of carats) 17.7 22.8 23.0 20.9 21.4 21.4 21.9 22.4 22.9
External sector Exports of goods and services, f.o.b. (US$) -26.8 33.4 41.7 -9.7 3.1 1.8 3.9 3.9 3.9
Of which: diamonds -30.3 49.9 38.3 7.1 3.7 1.3 3.6 3.6 3.5 Imports of goods and services, f.o.b. (US$) -4.7 17.9 28.0 7.3 -3.2 0.8 2.6 3.7 4.2 Terms of trade 4.6 -4.4 -0.3 3.6 5.7 1.9 1.5 3.2 3.0 Nominal effective exchange rate 4.2 4.6 -4.7 -7.8 … … … … … Real effective exchange rate 12.5 8.3 -0.8 -3.5 … … … … …
Money and bankingNet foreign assets -34.3 -17.5 25.4 0.2 11.2 5.8 6.3 7.7 9.0Net domestic assets 33.0 29.9 -21.0 7.3 3.7 4.5 4.3 2.8 1.4Broad money (M2) -1.3 12.4 4.3 7.4 15.0 10.3 10.6 10.6 10.4Velocity (nonmineral GDP relative to M3) 1.6 1.6 1.7 1.8 1.8 1.9 1.9 1.9 1.9Credit to the private sector 5.1 6.1 11.8 13.9 11.8 7.8 7.2 7.7 7.4
Investment and savings 1
Gross investment (including change in inventories) 37.9 35.4 38.7 39.3 38.3 36.4 36.0 35.2 34.6Gross savings 27.6 29.9 38.5 34.5 36.5 35.2 35.7 35.4 35.5
Central government finances 3
Total revenue and grants 37.4 32.4 36.3 35.9 33.4 33.3 33.2 33.1 33.0Total expenditure and net lending 50.9 39.9 36.5 35.7 33.2 31.8 30.9 30.1 29.2Overall balance (deficit –) -13.5 -7.5 -0.2 0.2 0.2 1.5 2.3 3.1 3.8Non-mineral primary balance4 -29.9 -25.9 -20.1 -13.8 -11.5 -10.0 -8.9 -7.8 -6.8Total central government debt 17.8 19.4 19.4 18.1 15.9 13.8 11.9 10.3 8.9
External sectorCurrent account balance -10.2 -5.4 -0.2 -4.9 -1.8 -1.2 -0.3 0.2 0.9Balance of payments -6.3 -7.0 3.3 -0.8 -1.4 -1.1 -0.6 0.2 0.7External public debt 5 14.9 11.8 14.9 14.5 12.4 10.7 9.1 7.7 6.5
Gross official reserves (end of period) 8,669 7,883 8,386 8,270 8,060 7,888 7,791 7,821 7,958Of which: Pula Fund 6,543 6,938 6,901Months of imports of goods and services 6 16.6 11.8 11.1 11.0 10.6 10.1 9.6 9.2 9.0Percent of GDP 85.4 57.3 52.2 52.8 47.7 45.1 42.4 40.6 39.7
Financial position in the IMF (as of May 31, 2012)Holdings of currency (percent of quota) … … … 66.7 … … … … …Holdings of SDRs (percent of allocation) … … … 149.4 … … … … …Quota (SDR millions) … … … 87.8 … … … … …
Social indicatorsPer capita GDP (2010): US$8,117; Life expectancy at birth (2007): 51Poverty headcount ratio at national poverty line (percent of population, 2008): 30.3
Sources: Botswana authorities and IMF staff estimates and projections.
2 Refers to the growth of value added of sectors other than mining, excluding statistical adjustments. The latter includes financial intermediation services indirectly measured (FISIM), taxes on products, and subsidies.3 Year beginning April 1. 4 The non-mineral primary balance is computed as the difference between non-mineral revenue and expenditure (excluding interest receipts and interest payments), divided by non-mineral GDP.5 Includes publicly guaranteed debt.6 Based on imports of goods and services for the following year.
1 Calendar year.
(Annual percentage change, unless otherwise indicated)
(Percentage change with respect to M2 at the beginning of the period)
(Percent of GDP, unless otherwise indicated)
(Millions of US$, unless otherwise indicated)

BOTSWANA
32 INTERNATIONAL MONETARY FUND
Table 4a. Botswana: Central Government Operations, 2008/09–2016/17 1
2008/09 2009/10 2010/11 2011/12 2012/13 2013/14 2014/15 2015/16 2016/17
Total revenue and grants 29,563 29,023 31,210 38,487 40,985 43,522 48,018 52,859 58,138Total revenue 28,941 28,254 30,881 37,954 40,881 43,086 47,533 52,323 57,572
Tax revenue 20,455 20,045 20,505 24,847 29,470 31,741 34,692 38,290 42,222Income taxes 8,059 7,921 9,362 11,249 9,237 12,997 13,896 15,316 16,869
Mineral 3,451 2,360 2,949 5,136 3,262 4,029 3,921 4,273 4,664Nonmineral 4,608 5,561 6,413 6,113 5,975 8,968 9,975 11,042 12,204
Taxes on goods and services 2 4,377 3,943 4,638 4,851 5,716 4,747 5,280 5,845 6,460Customs Union receipts 3 7,750 7,931 6,207 8,424 14,216 13,683 15,166 16,743 18,466Other 268 250 298 323 301 314 349 387 427
Nontax revenue 8,486 8,209 10,375 13,107 11,411 11,345 12,841 14,033 15,351Mineral royalties and dividends 6,731 6,729 9,111 10,687 8,814 9,225 10,597 11,549 12,606Interest 52 32 37 31 38 42 46 51 56Property income -202 211 131 158 116 211 121 134 149
Of which: BoB transfers 856 0 0 864 1,490 0 0 0 0Fees and charges 1,049 1,237 1,097 1,367 952 1,867 2,076 2,299 2,540
Grants 623 769 329 533 104 436 485 537 566
Total expenditure and net lending 35,150 39,490 38,417 38,668 40,719 43,242 45,920 49,252 52,775Current expenditure 23,889 25,732 27,089 28,836 32,087 32,194 34,117 36,190 38,396
Wages and salaries 8,701 9,252 11,899 12,941 14,550 14,481 15,325 16,156 17,009Interest 282 370 524 587 672 778 702 689 732Other 14,906 16,110 14,667 15,308 16,865 16,935 18,091 19,344 20,655
Of which: grants and subsidies 7,058 8,106 8,348 7,192 7,193 7,193 7,720 8,254 8,814Capital expenditure 11,458 13,006 11,372 9,956 8,278 11,103 11,861 13,123 14,447Net lending -197 752 -44 -124 354 -55 -58 -61 -68
Primary balance (deficit -) -6,213 -10,129 -6,721 -489 -590 1,016 2,753 4,246 6,038Overall balance -5,587 -10,467 -7,208 -181 266 280 2,098 3,607 5,363
Financing 4,696 10,467 7,208 181 -266 -280 -2,098 -3,607 -5,363Foreign (net) -174 6,852 3,621 871 -1,329 -72 -836 -974 -944
Drawing 139 7,195 3,754 1,118 0 265 204 61 61Amortization -255 -343 -201 -166 -1,266 -275 -977 -972 -942IMF transactions (net)4
-58 0 68 -80 -63 -63 -63 -63 -63Domestic 4,870 3,615 3,587 -690 1,063 -208 -1,262 -2,633 -4,419
Of which:Issuance 1,954 1,050 3,605 2,824 1,940 2,000 2,000 2,000 2,000Amortization -600 0 -2,101 -2,201 -2,160 -2,000 -2,000 -2,000 -2,000Change in cash balance (- increase) 4,607 6,788 2,046 2,275 1,796 -208 -1,262 -2,633 -4,419
Memorandum items:Non-mineral primary balance 5 -16,395 -19,218 -18,781 -16,312 -12,666 -12,238 -11,766 -11,576 -11,232Sources: Ministry of Finance and Development Planning; and IMF staff estimates and projections.1 Fiscal year begins on April 1. 2 Refers to sales tax and VAT.
5 The non-mineral primary balance is computed as the difference between non-mineral revenue and expenditure. (excluding interest payments and receipts, which are roughly proxied by BoB transfers and interest).
3 SACU receipts consist of external trade and excises on imported goods as well as a development component derived from excises.
(Millions of pula)
4 These transactions reflect Botswana’s SDR allocation and contribution to the IMF’s General Resource Account (GRA).

BOTSWANA
INTERNATIONAL MONETARY FUND 33
Table 4b. Central Government Operations, 2009/10–2017/18 (GFSM 2001 Classification)1
2010/11 2011/12 2012/13 2013/14 2014/15 2015/16 2016/17 2017/18
Revenue 29,023 31,210 38,487 40,985 43,522 48,018 52,859 58,138 63,915Taxes 20,045 20,505 24,847 29,470 31,741 34,692 38,290 42,222 46,533
Taxes on income, profits, and capital gains 7,921 9,362 11,249 9,237 12,997 13,896 15,316 16,869 18,574Payable in the mineral economy 2,360 2,949 5,136 3,262 4,029 3,921 4,273 4,664 5,101Payable in the non-mineral economy 5,561 6,413 6,113 5,975 8,968 9,975 11,042 12,204 13,472
Taxes on property 27 35 60 51 38 42 47 52 57Taxes on goods and services 4,166 4,900 5,113 5,964 5,023 5,586 6,184 6,835 7,545
Value added and sales tax 3,943 4,638 4,851 5,716 4,747 5,280 5,845 6,460 7,131Motor vehicle taxes 189 229 232 220 224 249 276 305 337Other 34 33 30 29 51 57 63 70 77
Taxes on international trade 7,931 6,209 8,425 14,218 13,684 15,167 16,743 18,467 20,357
Customs Union receipts 27,931 6,207 8,424 14,216 13,683 15,166 16,743 18,466 20,356
Taxes on exports 1 2 1 2 1 1 1 1 1Grants 769 329 533 104 436 485 537 566 566Other receipts 8,209 10,375 12,243 9,921 11,345 12,841 14,033 15,351 16,817
Property income 6,972 9,279 10,876 8,969 9,478 10,765 11,734 12,810 14,012Mineral royalties and dividends 6,729 9,111 10,687 8,814 9,225 10,597 11,549 12,606 13,786Interest 243 168 189 155 253 168 186 205 226
Property interest income 3211 131 158 116 211 121 134 149 164
Other Interest 32 37 31 38 42 46 51 56 62Fees and charges 1,237 1,097 1,367 952 1,867 2,076 2,299 2,540 2,804
Expense 25,732 27,089 28,836 32,087 32,194 34,117 36,190 38,396 40,791Compensation of employees 9,252 11,899 12,941 14,550 14,481 15,325 16,156 17,009 17,898Purchases of goods and services 8,004 6,319 8,116 9,672 9,742 10,372 11,090 11,842 12,638Interest 370 524 587 672 778 702 689 732 849Grants and subsidies 8,106 8,348 7,192 7,193 7,193 7,720 8,254 8,814 9,406
Gross Operating Balance 3,291 4,120 9,651 8,897 11,328 13,900 16,669 19,742 23,124
Net adquisition of nonfinancial assets 13,006 11,372 9,956 8,278 11,103 11,861 13,123 14,447 15,847
Net lending/borrowing -9,715 -7,252 -305 620 225 2,039 3,546 5,295 7,277
Transactions in financial assets and liabilities -9,715 -7,252 -305 622 225 2,039 3,546 5,295 7,277Net adquisition of financial assets -6,036 -2,089 -2,399 -1,440 153 1,203 2,572 4,351 6,330
Domestic -6,036 -2,089 -2,399 -1,440 153 1,203 2,572 4,351 6,330Currency and deposits -6,788 -2,046 -2,275 -1,796 208 1,262 2,633 4,419 6,404Loans (net lending) 752 -44 -124 354 -55 -58 -61 -68 -75
Foreign 0 0 0 0 0 0 0 0 0Net incurrence of liabilities 3,679 5,162 -2,094 -2,062 -72 -836 -974 -944 -948
Domestic -3,173 1,541 -2,965 -733 0 0 0 0 0Loans 1,050 3,605 2,824 1,940 2,000 2,000 2,000 2,000 2,000Amortization 0 -2,101 -2,201 -2,160 -2,000 -2,000 -2,000 -2,000 -2,000Other -4,223 37 -3,588 -513 0 0 0 0 0
Foreign 6,852 3,621 871 -1,329 -72 -836 -974 -944 -948Loans 7,195 3,754 1,118 0 265 204 61 61 61Amortization due (paid) -343 -201 -166 -1,266 -275 -977 -972 -942 -946Other 0 68 -80 -63 -63 -63 -63 -63 -63
Memo items:Overall balance -10,467 -7,208 -181 269 280 2,098 3,607 5,363 7,352
Non-mineral primary balance 4-19,218 -18,781 -16,312 -12,666 -12,238 -11,766 -11,576 -11,232 -10,749
Source: Ministry of Finance and Development Planning and Fund staff estimates.1 Fiscal year begins on April 1.
2 SACU receipts consist of taxes on international trade and excise on imported goods as well as the impact of a development component derived from excises.
2009/10
4 The non-mineral primary balance is computed as the difference between non-mineral revenue and expenditure (excluding interest payments and
receipts, which are roughly proxied by BoB transfers and interest).
3 Includes transfers received from the Bank of Botswna (BoB) on account of interest income on government investments made by the BoB on behalf of
the government.
(Millions of pula)

BOTSWANA
34 INTERNATIONAL MONETARY FUND
Table 4c. Central Government Operations, 2009/10–2017/18 (GFSM 2001 Classification)1
2010/11 2011/12 2012/13 2013/14 2014/15 2015/16 2016/17 2017/18
Revenue 37.4 32.4 36.3 35.9 33.4 33.3 33.2 33.1 33.0Taxes 25.8 21.3 23.5 25.8 24.4 24.1 24.0 24.0 24.0
Taxes on income, profits, and capital gains 10.2 9.7 10.6 8.1 10.0 9.6 9.6 9.6 9.6Payable in the mineral economy 3.0 3.1 4.9 2.9 3.1 2.7 2.7 2.7 2.6Payable in the non-mineral economy 7.2 6.7 5.8 5.2 6.9 6.9 6.9 6.9 7.0
Taxes on property 0.0 0.0 0.1 0.0 0.0 0.0 0.0 0.0 0.0Taxes on goods and services 5.4 5.1 4.8 5.2 3.9 3.9 3.9 3.9 3.9
Value added and sales tax 5.1 4.8 4.6 5.0 3.6 3.7 3.7 3.7 3.7Motor vehicle taxes 0.2 0.2 0.2 0.2 0.2 0.2 0.2 0.2 0.2Other 0.0 0.0 0.0 0.0 0.0 0.0 0.0 0.0 0.0
Taxes on international trade 10.2 6.5 8.0 12.5 10.5 10.5 10.5 10.5 10.5
Customs Union receipts 210.2 6.5 8.0 12.5 10.5 10.5 10.5 10.5 10.5
Taxes on exports 0.0 0.0 0.0 0.0 0.0 0.0 0.0 0.0 0.0Grants 1.0 0.3 0.5 0.1 0.3 0.3 0.3 0.3 0.3Other receipts 10.6 10.8 11.6 8.7 8.7 8.9 8.8 8.7 8.7
Property income 9.0 9.6 10.3 7.9 7.3 7.5 7.4 7.3 7.2Mineral royalties and dividends 8.7 9.5 10.1 7.7 7.1 7.3 7.3 7.2 7.1Interest 0.3 0.2 0.2 0.1 0.2 0.1 0.1 0.1 0.1
Property interest income 30.3 0.1 0.1 0.1 0.2 0.1 0.1 0.1 0.1
Other Interest 0.0 0.0 0.0 0.0 0.0 0.0 0.0 0.0 0.0Fees and charges 1.6 1.1 1.3 0.8 1.4 1.4 1.4 1.4 1.4
Expense 33.2 28.2 27.2 28.1 24.7 23.7 22.7 21.9 21.1Compensation of employees 11.9 12.4 12.2 12.8 11.1 10.6 10.1 9.7 9.2Purchases of goods and services 10.3 6.6 7.7 8.5 7.5 7.2 7.0 6.7 6.5Interest 0.5 0.5 0.6 0.6 0.6 0.5 0.4 0.4 0.4Grants and subsidies 10.4 8.7 6.8 6.3 5.5 5.4 5.2 5.0 4.9
Gross Operating Balance 4.2 4.3 9.1 7.8 8.7 9.6 10.5 11.2 11.9
Net adquisition of nonfinancial assets 16.8 11.8 9.4 7.3 8.5 8.2 8.2 8.2 8.2
Net lending/borrowing -12.5 -7.5 -0.3 0.5 0.2 1.4 2.2 3.0 3.8
Transactions in financial assets and liabilities -12.5 -7.5 -0.3 0.5 0.2 1.4 2.2 3.0 3.8Net adquisition of financial assets -7.8 -2.2 -2.3 -1.3 0.1 0.8 1.6 2.5 3.3
Domestic -7.8 -2.2 -2.3 -1.3 0.1 0.8 1.6 2.5 3.3Currency and deposits -8.7 -2.1 -2.1 -1.6 0.2 0.9 1.7 2.5 3.3Loans (net lending) 1.0 0.0 -0.1 0.3 0.0 0.0 0.0 0.0 0.0
Foreign 0.0 0.0 0.0 0.0 0.0 0.0 0.0 0.0 0.0Net incurrence of liabilities 4.7 5.4 -2.0 -1.8 -0.1 -0.6 -0.6 -0.5 -0.5
Domestic -4.1 1.6 -2.8 -0.6 0.0 0.0 0.0 0.0 0.0Loans 1.4 3.7 2.7 1.7 1.5 1.4 1.3 1.1 1.0Amortization 0.0 -2.2 -2.1 -1.9 -1.5 -1.4 -1.3 -1.1 -1.0Other -5.4 0.0 -3.4 -0.4 0.0 0.0 0.0 0.0 0.0
Foreign 8.8 3.8 0.8 -1.2 -0.1 -0.6 -0.6 -0.5 -0.5Loans 9.3 3.9 1.1 0.0 0.2 0.1 0.0 0.0 0.0Amortization due (paid) -0.4 -0.2 -0.2 -1.1 -0.2 -0.7 -0.6 -0.5 -0.5Other 0.0 0.1 -0.1 -0.1 0.0 0.0 0.0 0.0 0.0
Memo items:Overall balance -13.5 -7.5 -0.2 0.2 0.2 1.5 2.3 3.1 3.8
Non-mineral primary balance 4-24.8 -19.5 -15.4 -11.1 -9.4 -8.2 -7.3 -6.4 -5.6
Source: Ministry of Finance and Development Planning and Fund staff estimates.1 Fiscal year begins on April 1.
2 SACU receipts consist of taxes on international trade and excise on imported goods as well as the impact of a development component derived from excises.
2009/10
(Percent of GDP)
3 Includes transfers received from the Bank of Botswna (BoB) on account of interest income on government investments made by the BoB on behalf of
the government.4 The non-mineral primary balance is computed as the difference between non-mineral revenue and expenditure (excluding interest payments and
receipts, which are roughly proxied by BoB transfers and interest).

BOTSWANA
INTERNATIONAL MONETARY FUND 35
Table 4d. Botswana: Central Government Operations, 2008/09–2016/17 1
2008/09 2009/10 2010/11 2011/12 2012/13 2013/14 2014/15 2015/16 2016/17
Total revenue and grants 39.4 37.4 32.4 36.3 35.9 33.4 33.3 33.2 33.1Total revenue 38.6 36.4 32.1 35.8 35.9 33.1 33.0 32.9 32.8
Tax revenue 27.3 25.8 21.3 23.5 25.8 24.4 24.1 24.0 24.0Income taxes 10.7 10.2 9.7 10.6 8.1 10.0 9.6 9.6 9.6
Mineral 4.6 3.0 3.1 4.9 2.9 3.1 2.7 2.7 2.7Nonmineral 6.1 7.2 6.7 5.8 5.2 6.9 6.9 6.9 6.9
Taxes on goods and services 2 5.8 5.1 4.8 4.6 5.0 3.6 3.7 3.7 3.7Customs Union receipts 3 10.3 10.2 6.5 8.0 12.5 10.5 10.5 10.5 10.5Other 0.4 0.3 0.3 0.3 0.3 0.2 0.2 0.2 0.2
Nontax revenue 11.3 10.6 10.8 12.4 10.0 8.7 8.9 8.8 8.7Mineral royalties and dividends 9.0 8.7 9.5 10.1 7.7 7.1 7.3 7.3 7.2Interest 0.1 0.0 0.0 0.0 0.0 0.0 0.0 0.0 0.0Property income -0.3 0.3 0.1 0.1 0.1 0.2 0.1 0.1 0.1
Of which: BoB transfers 1.1 0.0 0.0 0.8 1.3 0.0 0.0 0.0 0.0Fees and charges 1.4 1.6 1.1 1.3 0.8 1.4 1.4 1.4 1.4
Grants 0.8 1.0 0.3 0.5 0.1 0.3 0.3 0.3 0.3
Total expenditure and net lending 46.9 50.9 39.9 36.5 35.7 33.2 31.8 30.9 30.1Current expenditure 31.9 33.2 28.2 27.2 28.1 24.7 23.7 22.7 21.9
Wages and salaries 11.6 11.9 12.4 12.2 12.8 11.1 10.6 10.1 9.7Interest 0.4 0.5 0.5 0.6 0.6 0.6 0.5 0.4 0.4Other 19.9 20.8 15.2 14.5 14.8 13.0 12.5 12.1 11.8
Of which: grants and subsidies 9.4 10.4 8.7 6.8 6.3 5.5 5.4 5.2 5.0Capital expenditure 15.3 16.8 11.8 9.4 7.3 8.5 8.2 8.2 8.2Net lending -0.3 1.0 0.0 -0.1 0.3 0.0 0.0 0.0 0.0
Primary balance (deficit -) -8.3 -13.1 -7.0 -0.5 -0.5 0.8 1.9 2.7 3.4Overall balance -7.5 -13.5 -7.5 -0.2 0.2 0.2 1.5 2.3 3.1
Financing 6.3 13.5 7.5 0.2 -0.2 -0.2 -1.5 -2.3 -3.1Foreign (net) -0.2 8.8 3.8 0.8 -1.2 -0.1 -0.6 -0.6 -0.5
Drawing 0.2 9.3 3.9 1.1 0.0 0.2 0.1 0.0 0.0Amortization -0.3 -0.4 -0.2 -0.2 -1.1 -0.2 -0.7 -0.6 -0.5IMF transactions -0.1 0.0 0.1 -0.1 -0.1 0.0 0.0 0.0 0.0
Domestic 6.5 4.7 3.7 -0.7 0.9 -0.2 -0.9 -1.7 -2.5Of which:
Issuance 2.6 1.4 3.7 2.7 1.7 1.5 1.4 1.3 1.1Amortization -0.8 0.0 -2.2 -2.1 -1.9 -1.5 -1.4 -1.3 -1.1Change in cash balance (- increase) 6.1 8.7 2.1 2.1 1.6 -0.2 -0.9 -1.7 -2.5
Memorandum items:Non-mineral primary balance 4 -28.5 -29.9 -25.9 -20.1 -13.8 -11.5 -10.0 -8.9 -7.8Nominal GDP (in current of local currency) 75 78 96 106 114 130 144 159 176Sources: Ministry of Finance and Development Planning; and IMF staff estimates and projections.1 Fiscal year begins on April 1. 2 Refers to sales tax and VAT.
(Percent of GDP)
4 The non-mineral primary balance is computed as the difference between non-mineral revenue and expenditure (excluding interest payments and receipts, which are roughly proxied by BoB transfers and interest).
3 SACU receipts consist of external trade and excises on imported goods as well as a development component derived from excises.

BOTSWANA
36 INTERNATIONAL MONETARY FUND
Table 4e. Botswana: Central Government Operations, 2007/08–2016/17 1
2007/08 2008/09 2009/10 2010/11 2011/12 2012/13 2013/14 2014/15 2015/16 2016/17
Total revenue and grants 57.6 51.3 45.1 43.0 47.4 44.6 41.1 40.7 40.5 40.3Total revenue 56.4 50.2 43.9 42.6 46.8 44.4 40.7 40.3 40.1 39.9
Tax revenue 34.7 35.5 31.2 28.3 30.6 32.0 30.0 29.4 29.3 29.3Income taxes 12.8 14.0 12.3 12.9 13.9 10.0 12.3 11.8 11.7 11.7
Mineral 4.9 6.0 3.7 4.1 6.3 3.5 3.8 3.3 3.3 3.2Nonmineral 7.8 8.0 8.6 8.8 7.5 6.5 8.5 8.5 8.5 8.5
Taxes on goods and services 2 5.7 7.6 6.1 6.4 6.0 6.2 4.5 4.5 4.5 4.5Customs Union receipts 3 15.8 13.5 12.3 8.6 10.4 15.5 12.9 12.9 12.8 12.8Other 0.5 0.5 0.4 0.4 0.4 0.3 0.3 0.3 0.3 0.3
Nontax revenue 21.7 14.7 12.8 14.3 16.2 12.4 10.7 10.9 10.8 10.6Mineral royalties and dividends 17.2 11.7 10.5 12.6 13.2 9.6 8.7 9.0 8.9 8.7Interest 0.1 0.1 0.0 0.1 0.0 0.0 0.0 0.0 0.0 0.0Property income 0.4 -0.4 0.3 0.2 0.2 0.1 0.2 0.1 0.1 0.1
Of which: BoB transfers 1.8 1.5 0.0 0.0 1.1 1.6 0.0 0.0 0.0 0.0Fees and charges 2.1 1.8 1.9 1.5 1.4 1.0 1.8 1.8 1.8 1.8
Grants 1.2 1.1 1.2 0.5 0.7 0.1 0.4 0.4 0.4 0.4
Total expenditure and net lending 49.9 61.0 61.4 52.9 47.7 44.3 40.8 39.0 37.7 36.6Current expenditure 37.4 41.5 40.0 37.3 35.5 34.9 30.4 28.9 27.7 26.6
Wages and salaries 13.8 15.1 14.4 16.4 16.0 15.8 13.7 13.0 12.4 11.8Interest 0.5 0.5 0.6 0.7 0.7 0.7 0.7 0.6 0.5 0.5Other 23.1 25.9 25.0 20.2 18.9 18.3 16.0 15.3 14.8 14.3
Of which: grants and subsidies 9.8 12.2 12.6 11.5 8.9 7.8 6.8 6.5 6.3 6.1Capital expenditure 13.2 19.9 20.2 15.7 12.3 9.0 10.5 10.1 10.1 10.0Net lending -0.6 -0.3 1.2 -0.1 -0.2 0.4 -0.1 0.0 0.0 0.0
Primary balance (deficit -) 6.2 -10.8 -15.7 -9.3 -0.6 -0.6 1.0 2.3 3.3 4.2Overall balance 7.7 -9.7 -16.3 -9.9 -0.2 0.3 0.3 1.8 2.8 3.7
Memorandum items:Non-mineral revenue 35.4 33.6 31.0 26.4 27.9 31.4 28.6 28.4 28.4 28.3Non-mineral primary balance 4 -16.0 -28.5 -29.9 -25.9 -20.1 -13.8 -11.5 -10.0 -8.9 -7.8Non-mineral GDP (fiscal year; millions of pula) 49,708 57,621 64,320 72,574 81,123 91,980 105,967 117,864 130,477 144,205Sources: Ministry of Finance and Development Planning; and IMF staff estimates and projections.1 Fiscal year begins on April 1. 2 Refers to sales tax and VAT.
4 The non-mineral primary balance is computed as the difference between non-mineral revenue and expenditure (excluding interest payments and receipts, which are roughly proxied by BoB transfers and interest).
3 SACU receipts consist of external trade and excises on imported goods as well as a development component derived from excises.
(Percent of non-mineral GDP)

BOTSWANA
INTERNATIONAL MONETARY FUND 37
Table 5. Botswana: Balance of Payments, 2008–2017
Est.2008 2009 2010 2011 2012 2013 2014 2015 2016 2017
Current account balance 39.7 -1,040.9 -744.4 -36.7 -703.0 -272.5 -188.1 -57.7 36.3 167.4Trade balance -340.1 -1,206.4 -926.9 -732.9 -1,879.5 -1,404.1 -1,351.3 -1,303.3 -1,332.1 -1,361.6
Exports, f.o.b. 4,835.9 3,449.9 4,635.5 6,449.5 6,016.7 6,204.9 6,316.8 6,559.9 6,816.2 7,079.9Diamonds 3,068.7 2,139.5 3,207.8 4,435.2 4,748.3 4,923.6 4,986.1 5,167.3 5,352.3 5,541.2Other raw materials 948.8 582.3 686.2 574.9 530.5 515.9 531.8 551.4 573.7 595.8Other 818.5 728.2 741.5 1,439.4 737.8 765.3 799.0 841.2 890.2 942.9
Imports, f.o.b -5,176.0 -4,656.3 -5,562.5 -7,182.4 -7,896.2 -7,609.0 -7,668.1 -7,863.2 -8,148.3 -8,441.5Services -208.7 -428.6 -432.7 -338.6 -457.4 -458.0 -455.6 -469.5 -488.4 -556.5
Transportation -67.6 -77.4 -44.6 -117.3 -172.3 -164.0 -156.3 -163.7 -170.0 -207.6Travel 6.3 -27.2 -10.1 -48.3 -74.7 -77.1 -78.4 -76.5 -80.1 -101.4Other services -147.4 -324.0 -378.0 -172.9 -210.4 -216.9 -220.8 -229.3 -238.3 -247.5
Income -636.7 -262.7 -554.5 -59.6 -40.7 -167.8 -169.4 -189.2 -138.3 3.6Current transfers 1,225.2 856.8 1,169.7 1,094.3 1,674.5 1,757.5 1,788.2 1,904.3 1,995.0 2,081.9
SACU receipts 1,146.9 1,107.5 977.7 1,153.9 1,677.4 1,694.4 1,688.9 1,775.3 1,859.8 1,940.8
Capital and financial account 725.2 1,142.2 -404.1 807.1 300.6 62.6 16.7 -39.3 -6.6 -30.6Capital account 0.0 0.0 3.4 0.4 0.0 0.0 0.0 0.0 0.0 0.0Financial account 725.2 1,142.2 -407.4 806.8 300.6 62.6 16.7 -39.3 -6.6 -30.6
Direct investment 616.9 123.6 -7.4 425.7 302.9 325.0 308.1 296.1 284.1 272.7Portfolio investment 531.7 -331.7 -402.4 -213.9 -84.8 -94.6 -93.0 -93.3 -93.6 -93.5Other investment -423.4 1,350.3 2.3 594.9 82.4 -167.9 -198.4 -242.0 -197.1 -209.8
Assets -355.6 338.7 -222.5 82.3 -64.4 -184.2 -162.8 -173.9 -123.9 -128.1Liabilities -67.8 1,011.6 224.9 512.7 146.8 16.3 -35.7 -68.1 -73.2 -81.7
Net government long-term borrowing -13.4 899.3 -74.8 450.7 -100.0 -45.6 -71.8 -95.2 -91.6 -86.3Other net private long-term borrowing -106.7 448.0 53.6 138.4 151.0 162.1 138.0 133.5 129.7 120.7Short-term borrowing 52.3 50.1 358.9 -80.8 -98.7 -100.3 -101.9 -106.5 -111.3 -116.1
Reserve assets (increase –) -1,089.3 639.3 960.4 -503.1 116.5 209.9 171.4 97.0 -29.6 -136.8
Net errors and omissions 324.5 -740.6 188.1 -267.3 286.0 0.0 0.0 0.0 0.0 0.0
Memorandum items:
Balance of payments 9.7 -6.3 -7.0 3.3 -0.8 -1.4 -1.1 -0.6 0.2 0.7Current account 0.4 -10.2 -5.4 -0.2 -4.9 -1.8 -1.2 -0.3 0.2 0.9
Trade balance -3.0 -11.9 -6.7 -4.8 -13.0 -9.0 -8.4 -7.7 -7.5 -7.4Exports of goods 43.2 34.0 33.7 42.1 41.7 40.0 39.4 38.9 38.6 38.4
Of which: diamonds 27.4 21.1 23.3 28.9 32.9 31.7 31.1 30.7 30.3 30.1Imports of goods 46.2 45.8 40.4 46.8 54.7 49.0 47.8 46.7 46.1 45.8
Services balance -1.9 -4.2 -3.1 -2.2 -3.2 -2.9 -2.8 -2.8 -2.8 -3.0Income and transfers balance 5.3 5.8 4.5 6.7 11.3 10.2 10.1 10.2 10.5 11.3
Financial account 6.5 11.2 -3.0 5.3 2.1 0.4 0.1 -0.2 0.0 -0.2Direct investment 5.5 1.2 -0.1 2.8 2.1 2.1 1.9 1.8 1.6 1.5Portfolio investment 4.7 -3.3 -2.9 -1.4 -0.6 -0.6 -0.6 -0.6 -0.5 -0.5Other investment -3.8 13.3 0.0 3.9 0.6 -1.1 -1.2 -1.4 -1.1 -1.1
Export volumes -15.9 -29.0 17.6 25.2 -6.4 2.1 0.6 2.6 2.7 2.6Import volumes 22.8 -6.5 0.2 15.6 14.4 0.8 1.5 2.8 5.6 5.4Terms of trade 4.2 4.6 -4.4 -0.3 3.6 5.7 1.9 1.5 3.2 3.0
End-of-year reserves (US$ millions) 9,115.6 8,668.8 7,883.1 8,386.1 8,269.6 8,059.8 7,888.4 7,791.4 7,821.0 7,957.8(Months of imports of goods and services) 1 20.5 16.6 11.8 11.1 11.0 10.6 10.1 9.6 9.2 9.0
Source: Bank of Botswana; IMF staff estimates.1 Months of prospective imports.
(Annual percentage change, unless otherwise indicated)
(Percent of GDP, unless otherwise indicated)
(US$ millions, unless otherwise indicated)
Projections

BOTSWANA
38 INTERNATIONAL MONETARY FUND
Table 6. Botswana: Monetary Survey, 2008–2017
2008 2009 2010 2011 2012 2013 2014 2015 2016 2017
Net foreign assets 72,781 59,312 52,550 63,596 63,682 69,170 72,421 76,315 81,616 88,405 Bank of Botswana 68,364 56,823 49,585 58,885 57,884 61,870 63,695 65,988 70,087 75,563
Assets 68,541 57,847 50,776 60,201 59,223 63,209 65,034 67,327 71,426 76,902 Liabilities -127 -421 -612 -641 -1,339 -1,339 -1,339 -1,339 -1,339 -1,339
Commercial banks 4,416 2,489 2,965 4,710 5,799 7,300 8,726 10,327 11,529 12,842 Assets 6,059 3,855 5,838 5,524 7,115 8,617 10,043 11,644 12,846 14,158 Liabilities -1,642 -1,365 -2,873 -813 -1,317 -1,317 -1,317 -1,317 -1,317 -1,317
Net domestic assets -33,553 -20,596 -9,016 -18,174 -14,880 -13,067 -10,538 -7,850 -5,910 -4,843Net domestic credit -11,721 -2,251 7,956 8,177 16,356 22,734 26,422 28,855 30,461 30,516 Net claims on the government -29,730 -22,404 -14,580 -22,726 -20,963 -20,670 -21,668 -23,958 -27,930 -33,838 Bank of Botswana -31,768 -23,252 -14,882 -24,075 -22,279 -21,986 -22,984 -25,274 -29,246 -35,154 Commercial banks 2,038 848 302 1,349 1,316 1,316 1,316 1,316 1,316 1,316
Claims on parastatals 102 303 386 1,021 1,072 1,236 1,372 1,515 1,671 1,842 Claims on nongovernment 17,907 19,850 22,150 29,882 36,247 42,167 46,718 51,298 56,720 62,512 Claims on the private sector 19,268 21,254 23,622 28,781 35,091 40,833 45,237 49,663 54,917 60,525 Other financial institutions -1,361 -1,404 -1,472 1,101 1,156 1,334 1,480 1,635 1,803 1,988 Other items (net) 2 -21,832 -18,345 -16,972 -26,351 -31,293 -35,515 -36,393 -35,839 -35,181 -33,814
Money plus quasi-money (M2) 39,228 38,717 43,534 45,422 48,802 56,104 61,883 68,466 75,706 83,561 Money 7,768 7,108 9,938 9,334 10,555 12,157 13,170 14,738 16,271 17,910 Currency 1,103 1,145 1,916 2,089 1,558 1,590 1,561 1,703 1,857 2,021 Current deposits 6,666 5,963 8,023 7,244 8,997 10,567 11,608 13,035 14,414 15,889 Quasi-money 31,459 31,609 33,596 36,088 38,247 43,947 48,713 53,728 59,435 65,651Other monetary liabilities 3 0.0 0.0 0.0 0.0 0.0 0.0 0.0 0.0 0.0 0.0Broad money (M3) 39,227.8 38,716.8 43,534.4 45,421.8 48,802.0 56,103.8 61,883.0 68,465.8 75,706.2 83,561.3
Net foreign assets 37.8 -34.3 -17.5 25.4 0.2 11.2 5.8 6.3 7.7 9.0 Bank of Botswana 30.9 -29.4 -18.7 21.4 -2.2 8.2 3.3 3.7 6.0 7.2 Commercial banks 6.9 -4.9 1.2 4.0 2.4 3.1 2.5 2.6 1.8 1.7
Net domestic assets -16.1 33.0 29.9 -21.0 7.3 3.7 4.5 4.3 2.8 1.4Net domestic credit 6.0 24.1 26.4 0.5 18.0 13.1 6.6 3.9 2.3 0.1 Net claims on the government -5.9 18.7 20.2 -18.7 3.9 0.6 -1.8 -3.7 -5.8 -7.8 Of which: Bank of Botswana -12.1 21.7 21.6 -21.1 4.0 0.6 -1.8 -3.7 -5.8 -7.8 Claims on nongovernment 12.1 5.0 5.9 17.8 14.0 12.1 8.1 7.4 7.9 7.7 Claims on parastatals -0.2 0.5 0.2 1.5 0.1 0.3 0.2 0.2 0.2 0.2 Claims on the private sector 12.6 5.1 6.1 11.8 13.9 11.8 7.8 7.2 7.7 7.4Other items (net) -22.1 8.9 3.5 -21.5 -10.9 -8.7 -1.6 0.9 1.0 1.8
Memorandum items:Nominal GDP (calendar year) 75,867 72,316 93,390 104,573 109,799 126,643 140,570 155,218 171,234 188,732Nominal non-mineral GDP (calendar year) 56,077 62,252 70,522 78,732 88,296 103,030 114,780 127,116 140,559 155,143Velocity (GDP relative to broad money, M2) 1.9 1.9 2.1 2.3 2.2 2.3 2.3 2.3 2.3 2.3Velocity (non-mineral GDP relative to broad money, M2) 1.4 1.6 1.6 1.7 1.8 1.8 1.9 1.9 1.9 1.9Private sector credit to GDP 25.4 29.4 25.3 27.5 30.6 30.8 31.6 32.4 33.2 34.3Private sector credit to non-mineral GDP 34.4 34.1 33.5 36.6 38.0 37.9 38.7 39.6 40.5 41.7
Sources: Bank of Botswana and IMF staff estimates and projections.
(Millions of pula, end of period)
(Contribution to growth in M2)
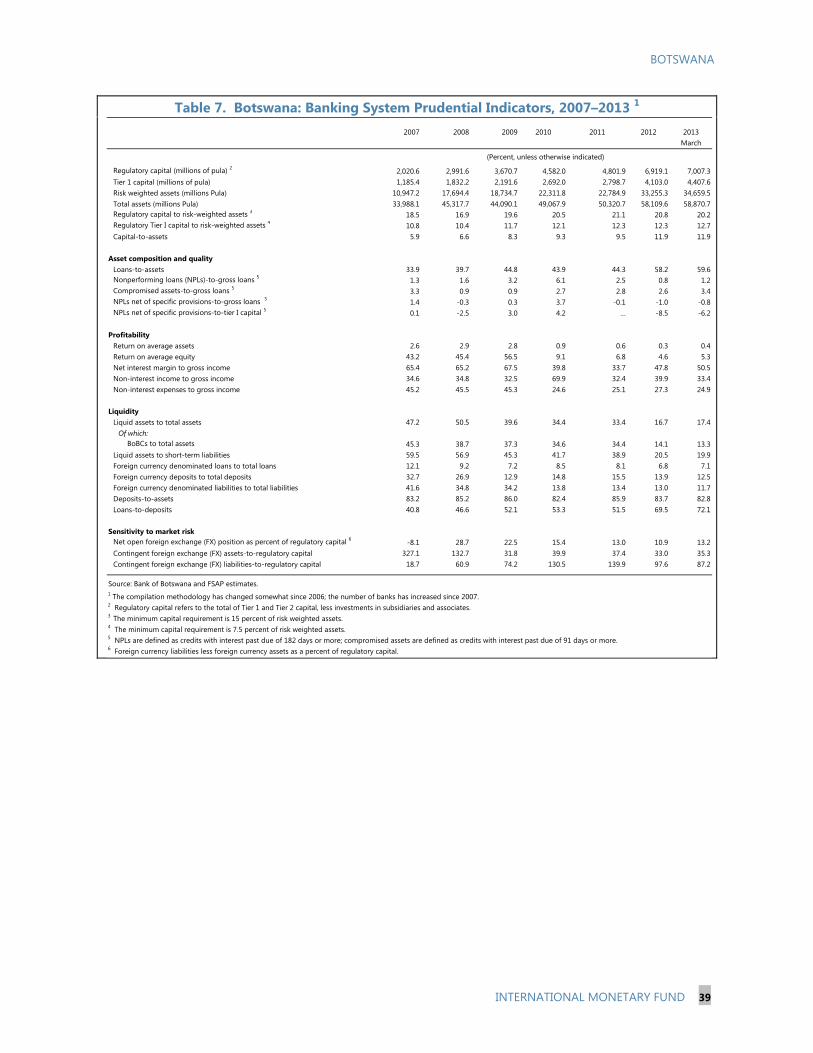
BOTSWANA
INTERNATIONAL MONETARY FUND 39
Table 7. Botswana: Banking System Prudential Indicators, 2007–2013 1
2007 2008 2009 2010 2011 2012 2013March
Regulatory capital (millions of pula) 2 2,020.6 2,991.6 3,670.7 4,582.0 4,801.9 6,919.1 7,007.3Tier 1 capital (millions of pula) 1,185.4 1,832.2 2,191.6 2,692.0 2,798.7 4,103.0 4,407.6Risk weighted assets (millions Pula) 10,947.2 17,694.4 18,734.7 22,311.8 22,784.9 33,255.3 34,659.5Total assets (millions Pula) 33,988.1 45,317.7 44,090.1 49,067.9 50,320.7 58,109.6 58,870.7Regulatory capital to risk-weighted assets 3 18.5 16.9 19.6 20.5 21.1 20.8 20.2Regulatory Tier I capital to risk-weighted assets 4 10.8 10.4 11.7 12.1 12.3 12.3 12.7Capital-to-assets 5.9 6.6 8.3 9.3 9.5 11.9 11.9
Asset composition and qualityLoans-to-assets 33.9 39.7 44.8 43.9 44.3 58.2 59.6Nonperforming loans (NPLs)-to-gross loans 5 1.3 1.6 3.2 6.1 2.5 0.8 1.2Compromised assets-to-gross loans 5 3.3 0.9 0.9 2.7 2.8 2.6 3.4NPLs net of specific provisions-to-gross loans 5 1.4 -0.3 0.3 3.7 -0.1 -1.0 -0.8NPLs net of specific provisions-to-tier I capital 5 0.1 -2.5 3.0 4.2 … -8.5 -6.2
ProfitabilityReturn on average assets 2.6 2.9 2.8 0.9 0.6 0.3 0.4Return on average equity 43.2 45.4 56.5 9.1 6.8 4.6 5.3Net interest margin to gross income 65.4 65.2 67.5 39.8 33.7 47.8 50.5Non-interest income to gross income 34.6 34.8 32.5 69.9 32.4 39.9 33.4Non-interest expenses to gross income 45.2 45.5 45.3 24.6 25.1 27.3 24.9
LiquidityLiquid assets to total assets 47.2 50.5 39.6 34.4 33.4 16.7 17.4
Of which: BoBCs to total assets 45.3 38.7 37.3 34.6 34.4 14.1 13.3Liquid assets to short-term liabilities 59.5 56.9 45.3 41.7 38.9 20.5 19.9Foreign currency denominated loans to total loans 12.1 9.2 7.2 8.5 8.1 6.8 7.1Foreign currency deposits to total deposits 32.7 26.9 12.9 14.8 15.5 13.9 12.5Foreign currency denominated liabilities to total liabilities 41.6 34.8 34.2 13.8 13.4 13.0 11.7Deposits-to-assets 83.2 85.2 86.0 82.4 85.9 83.7 82.8Loans-to-deposits 40.8 46.6 52.1 53.3 51.5 69.5 72.1
Sensitivity to market riskNet open foreign exchange (FX) position as percent of regulatory capital 6 -8.1 28.7 22.5 15.4 13.0 10.9 13.2Contingent foreign exchange (FX) assets-to-regulatory capital 327.1 132.7 31.8 39.9 37.4 33.0 35.3Contingent foreign exchange (FX) liabilities-to-regulatory capital 18.7 60.9 74.2 130.5 139.9 97.6 87.2
(Percent, unless otherwise indicated)
4 The minimum capital requirement is 7.5 percent of risk weighted assets.5 NPLs are defined as credits with interest past due of 182 days or more; compromised assets are defined as credits with interest past due of 91 days or more.6 Foreign currency liabilities less foreign currency assets as a percent of regulatory capital.
Source: Bank of Botswana and FSAP estimates.1 The compilation methodology has changed somewhat since 2006; the number of banks has increased since 2007.2 Regulatory capital refers to the total of Tier 1 and Tier 2 capital, less investments in subsidiaries and associates.3 The minimum capital requirement is 15 percent of risk weighted assets.

BOTSWANA
40 INTERNATIONAL MONETARY FUND
Appendix I. Managing Inward Global Spillovers1
1. Context: Natural-resource based and highly open economies like Botswana’s are vulnerable to global economic shocks. The global demand for diamonds—Botswana’s main export—highly depends on developments in advanced economies, and to a lesser extent in key emerging market economies—in particular, China and India, whose share of diamond consumption increased in recent years albeit coming from a low base. Botswana is also exposed to spillovers through strong economic and financial linkages with South Africa, where recent developments and outlook suggest sluggish growth.
2. An estimated vector autoregressive model indicates a significant but short-lived impact of a growth slowdown in advanced economies on diamond prices and hence Botswana’s output growth.1A one standard deviation decline in output growth in advanced economies would decrease diamond prices by 1.2 percentage points (q-o-q) on impact (Figure 1). The price decline would reflect lower global diamond demand. The growth slowdown in advance economies would decrease Botswana’s output growth by 0.9 percentage points (q-o-q) on impact (Figure 2). Given Botswana’s high dependency on diamond exports, the decline would largely reflect lower diamond demand associated with an output decline in advanced economies, although according to our analysis the effect of lower diamond demand from other spillover effects cannot be formally separated. The effect would dissipate within two years. Although China’s and India’s shares in diamond consumption are growing at a fast pace, they are still not a major player in the global diamond market. Thus, our analysis shows that diamond prices would not significantly respond to a growth decline in emerging market economies.
3. South Africa has strong ties with other countries in the region, including its partners in the Southern African Customs Union (SACU)—Botswana, Lesotho, Namibia, and Swaziland (BLNS). South Africa’s economy is by far the largest—it accounts for about 90 percent of the region’s GDP at market exchange rates. It is also tightly integrated with the economies of its neighbors, while also being exposed to global shocks. It is often described as an “engine of growth” for the region. Thus, it is reasonable to expect that South Africa’s business cycle and its long-term growth rate will affect its neighbors. While there are multiple linkages (trade, investment, financial, institutional) that appear plausible, formal econometric analysis has found their net spillover impact
1 Prepared by Futoshi Narita.
-3
-2
-1
0
1
2
-3
-2
-1
0
1
2
1 2 3 4 5 6 7 8
Figure 1. Response to an output decline in advanced economies (Quarterly percent change)
Sources: WEO, Bloomberg, and IMF staff estimates.
-3
-2
-1
0
1
2
-3
-2
-1
0
1
2
1 2 3 4 5 6 7 8
Figure 2. Response to an output decline in advanced economies (Quarterly percent change)
Sources: WEO, Bloomberg, and IMF staff estimates.

BOTSWANA
INTERNATIONAL MONETARY FUND 41
to be statistically insignificant. This reflects the fact that Botswana’s trade linkage with South Africa is mainly through imports rather than diamond exports. South Africa appears to channel global economy shocks to the regional economy, rather than directly affecting countries in the region.2 Overall, a possible explanation is that the multiple spillover channels operate in ways that offset each other, so their net impact is relatively small.3
4. Staff also conducted a simulation analysis using the Global Integrated Monetary and Fiscal model (GIMF), tailored to Botswana’s specific economic circumstances. Four regions are included to capture Botswana, the United States, the euro area, and the rest of the world, which includes emerging market economies and South Africa. The model includes the financial sector and the natural resource sector set up as the diamond sector. Monetary policy is modeled as a Taylor rule, and, for Botswana, the crawling peg regime is captured by some weights in an interest rate reaction function on exchange rate differential to the rest of the world. The share of liquidity-constrained households who do not have access to finance is calibrated to 60 percent in Botswana, based on data from the 2009 Finscope survey.
5. The simulations suggest that global spillovers to Botswana would be limited and short-lived in adverse scenarios beyond the baseline (Figure 3). The adverse scenarios are based on a selected set of external risks in the Risk Assessment Matrix (Table 2). They consist of (i) re-emergence of financial stress in the euro area, (ii) a deeper-than-expected slowdown in emerging market economies, and (iii) capital flow reversal from emerging markets.4 Botswana’s output growth would be lower by 1–1½ percentage points than the baseline, and the impact would dissipate in about one year. The transmission works mainly through the trade channel as lower global demand for diamonds results in a decline in Botswana’s diamond exports. The resulting limited and transitory spillover impact reflects the storable nature of diamonds that allows Debswana (Botswana's joint venture with De Beers) to smooth shocks by adjusting inventories, and also stems from the transitory impact of the initial shocks on the global economy.
6. In light of the assessment that global spillovers to Botswana would be limited and short-lived, staff believes that in the event of such an adverse scenario beyond the baseline, an appropriate response would be to let the automatic stabilizers work on the revenue side. Pursuing more active discretionary fiscal stimulus measures would not be recommended owing to the need to re-build the fiscal buffers and the likelihood that the effect of fiscal expansion would leak abroad through imports in an open economy like Botswana. Consumer price inflation would be 2 A bulk of Botswana’s exports goes to countries other than South Africa. See also Canales-Kriljenko, Gwenhamo, and Thomas, 2013, IMF Working Paper, WP/13/31 (Washington: International Monetary Fund). 3 This explanation is based on ongoing work by staff in the IMF African Department’s Southern II Division (Olivier Basdevant, Andrew Jonelis, Borislava Mircheva, Slavi Slavov) on the impact of the growth slowdown in South Africa on Botswana and other SACU members. 4 Specific shocks in the model are: (i) an increase in credit spreads, reaching 3.4 percentage points after two years (2.4 percentage points in the first year) combined with a 100 basis point increase in the sovereign risk premium for the euro area, (ii) a 25 percentage point investment shock in the rest of world with a 10 percentage point commodity price shock, and (iii) a 200 basis point increase in the sovereign risk premium for the rest of the world.

BOTSWANA
42 INTERNATIONAL MONETARY FUND
lower than the baseline scenario, as economic activity decelerates, which would provide space for further easing of monetary policy in such an adverse scenario.
Figure 3. Simulated Adverse Scenario Compared to the Baseline Using the GIMF Model Adverse Scenario 1: Re-Emergence of Financial Stress in the Euro Area
Adverse Scenario 2: Deeper-than-Expected Slowdown in Emerging Market Economies
Adverse Scenario 3: Capital Flow Reversal in Emerging Markets
Sources: WEO, COMTRADE, and IMF staff estimates.
-3
-2
-1
0
1
2
3
-3
-2
-1
0
1
2
3
0 1 2 3 4 5 6 7 8 9 10
Botswana Euro area Rest of the world United States
Spillovers to Real GDP Growth(Annual percent change)
-15
-10
-5
0
5
10
15
-3
-2
-1
0
1
2
3
0 1 2 3 4 5 6 7 8 9 10
World diamond prices (LHS)
Botswana's net diamond exports (RHS)
Spillovers to diamond prices and exports(Annual percent change)
-4
-3
-2
-1
0
1
2
3
4
-4
-3
-2
-1
0
1
2
3
4
0 1 2 3 4 5 6 7 8 9 10
Botswana Euro area Rest of the world United States
Spillovers to Real GDP Growth(Annual percent change)
-3
-2
-1
0
1
2
3
-3
-2
-1
0
1
2
3
0 1 2 3 4 5 6 7 8 9 10
World diamond prices (LHS)
Botswana's net diamond exports (RHS)
Spillovers to diamond prices and exports(Annual percent change)
-4
-3
-2
-1
0
1
2
3
4
-4
-3
-2
-1
0
1
2
3
4
0 1 2 3 4 5 6 7 8 9 10
Botswana Euro area Rest of the world United States
Spillovers to Real GDP Growth(Annual percent change)
-15
-10
-5
0
5
10
15
-3
-2
-1
0
1
2
3
0 1 2 3 4 5 6 7 8 9 10
World diamond prices (LHS)
Botswana's net diamond exports (RHS)
Spillovers to diamond prices and exports(Annual percent change)

BOTSWANA
INTERNATIONAL MONETARY FUND 43
Appendix II. External Stability and Competitiveness Assessment1
1. Context: Botswana’s external position remains strong with a high level of international reserves and low external debt, even though the current account has been in deficit since the 2008–09 financial crisis (Figure 1). Since 2008, imports grew faster than diamond exports, resulting in trade deficit (Figure 2). The fast import growth was in line with strong household consumption, partly associated with the rapid growth in lending to household (Appendix III). The import growth in 2012 also reflected the need to increase energy imports owing to electricity supply shortages. Official transfers, mainly SACU revenue, have largely contributed to the narrowing of the current account deficit. As a result, the overall external position continues to be relatively strong with official reserve coverage standing at about 11 months of import cover at end-June 2013. Botswana has not been significantly affected by the recent surge in capital inflows from advanced economies as portfolio flows remain relatively small because foreign direct investment constitutes a bulk of the inflows in the balance of payments.
2. The current account balance is projected to return to a surplus over the medium term. This will be driven by the planned fiscal consolidation and the expected recovery in diamond exports along with the global recovery. As measures by the government succeed in tempering the rate of growth of household borrowing, import growth should slow. This, combined with a stable electricity supply from the Morupule B power plant, will contribute to closing the current account deficit.
3. Botswana’s crawling peg arrangement has been largely resilient against external shocks, underpinned by a strong external position. Since 2005, the authorities have pursued a crawling peg regime to preserve external competitiveness through real exchange rate stability. While the regime has evolved over the years, exchange rate policy has revolved around two main objectives: (i) contain imported inflation and provide a nominal anchor for prices, and (ii) support
1 Prepared by Futoshi Narita.
-3,000
-2,000
-1,000
0
1,000
2,000
3,000
4,000
-3,000
-2,000
-1,000
0
1,000
2,000
3,000
4,000
2003 2004 2005 2006 2007 2008 2009 2010 2011 2012
Trade Balance Services IncomePrivate Transfers Official Transfers CAB
Sources: Botswana authorities and IMF staff estimates
Figure 1. Current Account Balance (In millions of US dollars)
-10,000
-8,000
-6,000
-4,000
-2,000
0
2,000
4,000
6,000
8,000
10,000
-10,000
-8,000
-6,000
-4,000
-2,000
0
2,000
4,000
6,000
8,000
10,000
2003 2004 2005 2006 2007 2008 2009 2010 2011 2012
Non-mining exports Mining export, excl. diamondsDiamonds exports Imports, excl. diamondsDiamond imports Trade balanceTrade balance, excl. diamonds
Sources: Botswana authorities and IMF staff estimates
Figure 2. Trade Balance and Diamond Trade (In millions of US dollars)

BOTSWANA
44 INTERNATIONAL MONETARY FUND
the broader national competitiveness goal, export promotion, and economic diversification. The regime is implemented through a continuous adjustment of the nominal effective exchange rate (NEER) of the pula, based on the differential between the inflation objective and trading partners’ inflation forecast. The pula is pegged to a basket of currencies comprising SDR currencies and the South African rand.
4. The pula is broadly in line with medium-term fundamentals. The estimates of exchange rate misalignments in Botswana, based on four CGER methodologies, are diverse, and their confidence intervals are wide (Table 1).2 Overall, staff analysis shows the REER is broadly in line with macroeconomic fundamentals from a medium-term perspective. However, the external sustainability approach, which takes into account the temporary nature of non-renewable mineral income, suggests a need for depreciation over the medium term to help rebalance the economy toward the nonmining sector. The high dependency on diamond exports makes the economy vulnerable to fluctuations of international diamond demand and prices. A higher degree of export diversification would help reduce the risks to Botswana’s external stability and support a broad-based and sustainable long-term growth.
5. Non-price competitiveness indicators suggest that Botswana performs well relative to its peers, but important challenges remain (Figure 5). Botswana performs better than other middle-income countries in terms of strength of institutions, financial market development, and
2 Staff took into account the Botswana-specific circumstances by using a target path of net foreign assets (NFAs), 77 percent of GDP in 2017, estimated in a fiscal sustainability analysis for Botswana, in the external sustainability approach. Also, staff applied Botswana-specific elasticities of imports and exports in calculating the REER misalignments. The resulting elasticity of the current account balance to the REER for Botswana is -0.5—more elastic than standard—reflecting high price-elasticity of mineral exports.
Lower Bound Mean Upper Bound
Macroeconomic Balance -8.7 -4.6 -38.9
Equilibrium Real Effective Exchange Rate -10.7 10.6 45.4
External Sustainability … 6.1 …
Purchasing Power Parity -3.2 9.2 25.3
Table 1. Estimated Real Exchange Rate Misalignments
Source: IMF staff estimates.
60
70
80
90
100
110
120
130
140
60
70
80
90
100
110
120
130
140NEER REER
Sources: IMF staff estimates.
Figure 3. Effective Exchange Rates(Index, monthly, 2005=100)
60
70
80
90
100
110
120
130
140
150
160
60
70
80
90
100
110
120
130
140
150
160
2001 2002 2003 2004 2005 2006 2007 2008 2009 2010 2011 2012
REER (ULC based) REER (CPI based) NEERRelative ULC Relative CPI
Figure 4. Unit Labor Cost and Effective Exchange Rates (Index, annual, 2005=100)
Sources: IMF staff estimates.

BOTSWANA
INTERNATIONAL MONETARY FUND 45
labor market efficiency. However, Botswana has been consistently lagging its peers on health and education. These indicators reinforce the need to prioritize investments in human capital to address constraints to improvements in competitiveness. Sustained effort on structural reforms geared toward reducing the regulatory burden on firms and reducing the costs of doing business would also help to boost competitiveness.
Figure 5. Botswana and Other Middle-Income Countries: Competitiveness Indicators, 2008 and 2012 (Score from 1 [less competitive] to 7 [more competitive])
0
1
2
3
4
5
6Institutions
Infrastructure
Macroeconomic environment
Health and primary educationHigher education and training
Labor market efficiency
Financial market development
Botswana Middle-income countries Botswana 2008 Middle-income countries 2008
Source: World Economic Forum.
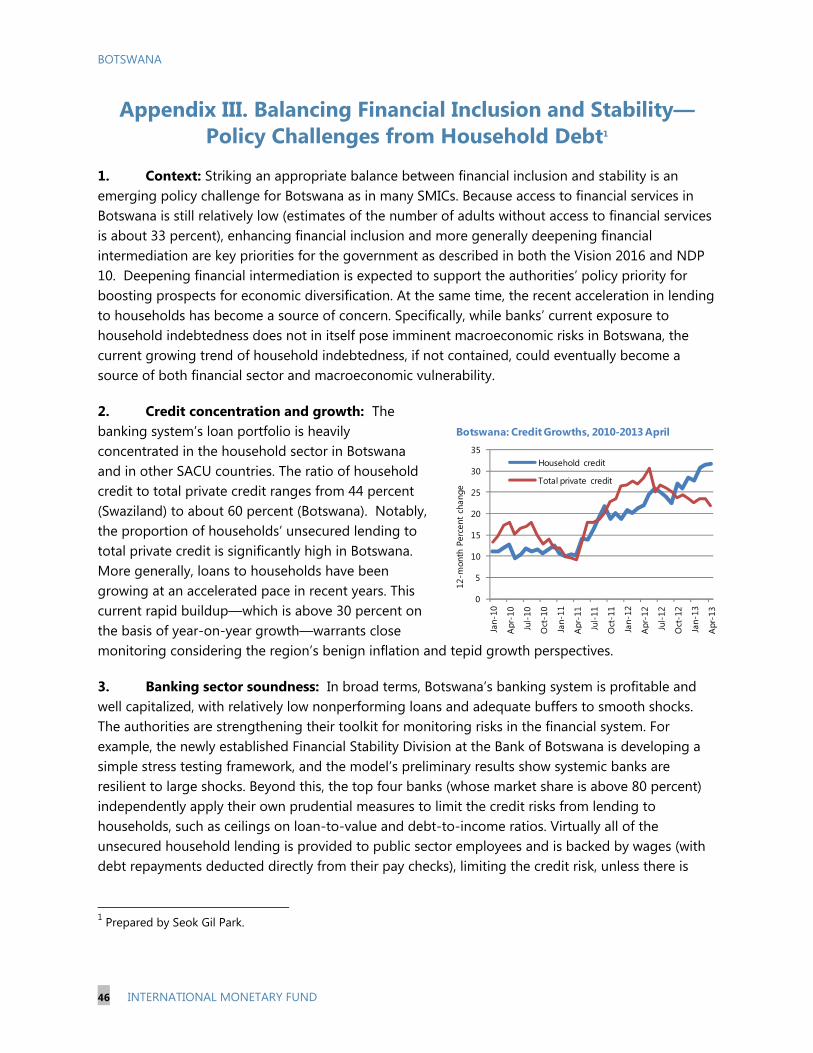
BOTSWANA
46 INTERNATIONAL MONETARY FUND
Appendix III. Balancing Financial Inclusion and Stability—Policy Challenges from Household Debt1
1. Context: Striking an appropriate balance between financial inclusion and stability is an emerging policy challenge for Botswana as in many SMICs. Because access to financial services in Botswana is still relatively low (estimates of the number of adults without access to financial services is about 33 percent), enhancing financial inclusion and more generally deepening financial intermediation are key priorities for the government as described in both the Vision 2016 and NDP 10. Deepening financial intermediation is expected to support the authorities’ policy priority for boosting prospects for economic diversification. At the same time, the recent acceleration in lending to households has become a source of concern. Specifically, while banks’ current exposure to household indebtedness does not in itself pose imminent macroeconomic risks in Botswana, the current growing trend of household indebtedness, if not contained, could eventually become a source of both financial sector and macroeconomic vulnerability.
2. Credit concentration and growth: The banking system’s loan portfolio is heavily concentrated in the household sector in Botswana and in other SACU countries. The ratio of household credit to total private credit ranges from 44 percent (Swaziland) to about 60 percent (Botswana). Notably, the proportion of households’ unsecured lending to total private credit is significantly high in Botswana. More generally, loans to households have been growing at an accelerated pace in recent years. This current rapid buildup—which is above 30 percent on the basis of year-on-year growth—warrants close monitoring considering the region’s benign inflation and tepid growth perspectives.
3. Banking sector soundness: In broad terms, Botswana’s banking system is profitable and well capitalized, with relatively low nonperforming loans and adequate buffers to smooth shocks. The authorities are strengthening their toolkit for monitoring risks in the financial system. For example, the newly established Financial Stability Division at the Bank of Botswana is developing a simple stress testing framework, and the model’s preliminary results show systemic banks are resilient to large shocks. Beyond this, the top four banks (whose market share is above 80 percent) independently apply their own prudential measures to limit the credit risks from lending to households, such as ceilings on loan-to-value and debt-to-income ratios. Virtually all of the unsecured household lending is provided to public sector employees and is backed by wages (with debt repayments deducted directly from their pay checks), limiting the credit risk, unless there is
1 Prepared by Seok Gil Park.
0
5
10
15
20
25
30
35
Jan-
10
Apr
-10
Jul-
10
Oct
-10
Jan-
11
Apr
-11
Jul-
11
Oct
-11
Jan-
12
Apr
-12
Jul-
12
Oct
-12
Jan-
13
Apr
-13
Household credit
Total private credit
12-m
onth
Per
cent
cha
nge
Botswana: Credit Growths, 2010-2013 April

BOTSWANA
INTERNATIONAL MONETARY FUND 47
generalized unemployment. Finally, a part of the unsecured lending is reportedly used for building houses in rural and urban areas, thus some of the loans are indirectly supported by real assets.2
4. Emerging vulnerabilities: However, there are emerging vulnerabilities stemming from the high concentration of banks’ loans to households and the acceleration in the growth of unsecured lending. The level of household debt has arguably increased with declined real incomes and increased access to credit from various sources—banks and nonbanks such as microlenders and retail stores. Although the asset sizes are relatively small compared to banks, microlenders provide unsecured lending to less creditworthy households with limited due diligence and at often punitive interest rates. Another source of vulnerability is lack of a comprehensive database on the overall level of household indebtedness. Commercial banks exchange debtors’ (negative) credit information through a credit bureau, but such monitoring does not cover lending from nonbank sources. Also, the households’ exposure to interest rate risk can be a source of stress on their balance sheets. Most of unsecured lending is contracted at variable-rate terms with relatively short maturities, and household credit growth was partly fueled by the recent years’ low interest rate environment as the policy rate was cut from 15 percent (in 2008) to the current level of 8.5 percent.
5. Macroeconomic dimensions: Besides financial stability concerns, the concentration of credit to the household sector could potentially crowd out resources for other productive economic sectors. The heavy concentration on household credit in Botswana, and more generally the SACU region, coincides with the economies’ reliance on consumption instead of investment for growth (main text Figure 4). The combination of lack of sound investment opportunities for local businesses, which partly reflects the public sector’s dominance in the economy in SACU, and the concentration of lending to households could further reinforce the region’s low savings and more generally consumption-based growth. To promote economic diversification and strengthen the foundation for future growth, policies would need to consider measures to reduce the size of the government (as a share of GDP), improve financial intermediation, and direct scarce resources to productive sectors.
6. Policy challenges: To minimize financial sector vulnerabilities and help direct resources to business investments, the authorities should implement measures to temper the rate of increase in household borrowing. One of the measures to consider is macroprudential policy, including the limit on loan-to-value and debt-to-income ratios, and higher risk weights for unsecured household lending. Additional policy tools would complement macroprudential measures in tempering the growth of household lending. First, a fully functioning national credit bureau should record households’ indebtedness, including debt to nonbanks, and other aspects of households’ profiles. Second, a comprehensive database on households’ balance sheets and disposable income would facilitate effective monitoring on household indebtedness and risk profiles. Finally, the Non-Bank Financial Institutions Regulatory Authority (NBFIRA) would need to strengthen its capacity to supervise the non-banks and avoid regulatory arbitrage between the bank and nonbank sector.
2 Banks do not take certain types of land ownership deeds (tribal land) as collateral for mortgage loans in rural areas. Thus, debtors often take unsecured lending to finance housing projects on such land.
BOTSWANA STAFF REPORT FOR THE 2013 ARTICLE IV CONSULTATION—INFORMATIONAL ANNEX Prepared By
African Department
FUND RELATIONS _________________________________________________________________________________ 2 JOINT WORLD BANK AND IMF WORK PROGRAM _____________________________________________ 5 STATISTICAL ISSUES ______________________________________________________________________________ 7 TABLE 1. BOTSWANA: COMMON INDICATORS REQUIRED FOR SURVEILLANCE _____________________ 9
August 20, 2013
CONTENTS
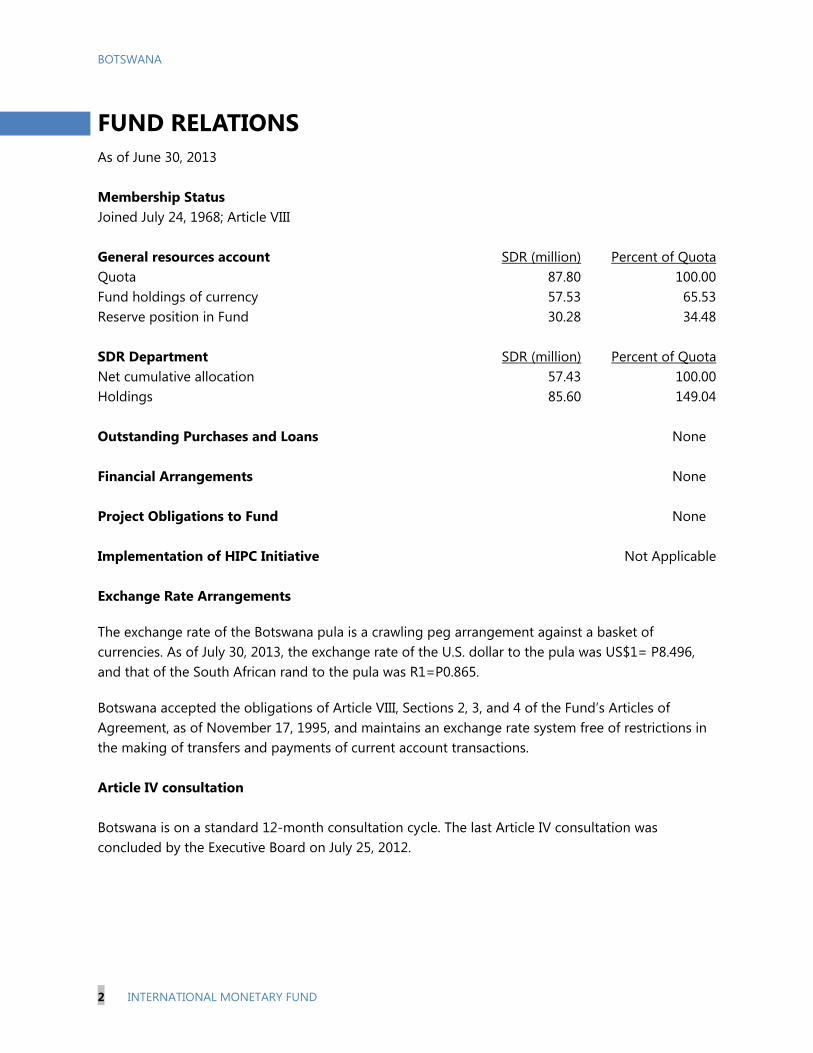
BOTSWANA
2 INTERNATIONAL MONETARY FUND
FUND RELATIONS As of June 30, 2013 Membership Status Joined July 24, 1968; Article VIII General resources account SDR (million) Percent of QuotaQuota 87.80 100.00Fund holdings of currency 57.53 65.53Reserve position in Fund 30.28 34.48 SDR Department SDR (million) Percent of QuotaNet cumulative allocation 57.43 100.00Holdings 85.60 149.04 Outstanding Purchases and Loans None Financial Arrangements None Project Obligations to Fund None Implementation of HIPC Initiative Not Applicable Exchange Rate Arrangements
The exchange rate of the Botswana pula is a crawling peg arrangement against a basket of currencies. As of July 30, 2013, the exchange rate of the U.S. dollar to the pula was US$1= P8.496, and that of the South African rand to the pula was R1=P0.865.
Botswana accepted the obligations of Article VIII, Sections 2, 3, and 4 of the Fund’s Articles of Agreement, as of November 17, 1995, and maintains an exchange rate system free of restrictions in the making of transfers and payments of current account transactions. Article IV consultation Botswana is on a standard 12-month consultation cycle. The last Article IV consultation was concluded by the Executive Board on July 25, 2012.

BOTSWANA
INTERNATIONAL MONETARY FUND 3
Technical assistance Department Dates Purpose FAD September 2000 Implementation of VAT next steps February 2002 Tax administration (Southern Africa Development Community
Region November 2004 Public expenditure management February 2010 Public financial management (scoping mission September 2010 Macro-fiscal framework, asset management, and accrual
accounting January 2013 Overall Tax Policy Review with Emphasis on Tax Expenditures April 2013 Needs Assessment June—July 2013 Follow-up on Cash Management LEG January 2006 Review of amended VAT provisions July 2006 Review of central bank law June 2007 Review of VAT laws July 2010 Technical assistance in Fiscal Law STA May 2001 Inspection for visit of long-term balance of payments advisor October 2001 Report on Standards and Code (ROSC) data module July 2002; Feb. 2003 BOP statistics: peripatetic visit August 2003 Monetary and financial statistics using the General Data
Dissemination Standard (GDDS) March 2004 GDDS project for Anglophone Africa: Government Finance Stat. June 2004 GDDS project for Anglophone Africa: National accounts statistics August 2004 Follow-up mission: Money and banking statistics Oct. 2004; May 2005 GDDS project for Anglophone Africa: National accounts mission June 2005 Follow-up on monetary and financial statistics using the GDDS August 2005 Follow-up mission: GDDS quarterly balance of payments statistics December 2005 Technical assistance evaluation mission March 2006 GDDS project for Anglophone Africa: national accounts statistics October 2006 ROSC data module covering GDDS and Data Quality Assessment
Framework (DQAF) October 2007 Monetary and financial statistics Nov. 2007 – Nov.
2008 Real sector statistics (resident regional advisor)
November 2008 Money and banking statistics February 2009 Phase II Special Data Dissemination
Standard (SDDS)—Balance of Payments Statistics June 2009 – June
2010 Real sector statistics (resident regional advisor)
February 2010 Money and banking statistics
BOTSWANA
4 INTERNATIONAL MONETARY FUND
February 2010 Regional Data Harmonization February 2013 Price Statistics March 2013 National Accounts Statistics MCM January 2001 Banking supervision advisor February 2001 Monetary operations December 2001 Macroeconomic and Financial Management Institute MEFMI—
Monetary operations August 2002 Banking supervision, anti-money laundering July 2004 Non-bank Financial Institution (NBFI) supervision August 2004 Money and banking statistics follow-up January, March 2007
Program (FSAP) IMF-World Bank Financial Sector Assessment
March, September, December 2004 July 2006 December 2008 December 2009
Inflation forecasting and modeling
January 2009 Risk management framework February 2009 Payments systems (LT Resident Expert Assignment) June 2009 Risk management July 2009 Monetary operations January 2011 Risk management February 2011 Continuation of support on inflation forecasting and modeling April 2011 Implementation of central bank risk management July 2012 Strengthening Financial Stability Framework July—August 2012 Modernizing Payment Systems September 2012 Risk Management Function and Financial Reporting Issues April 2013 Modernizing Payment Systems April 2013 Strengthening Financial Stability Framework

BOTSWANA
INTERNATIONAL MONETARY FUND 5
JOINT WORLD BANK AND IMF WORK PROGRAM As of July 30, 2013
Title Products
Provisional Timing of Missions
Expected Delivery Date
A. Mutual Information on Relevant Work Programs
World Bank indicative work program in the next 12 months
1. Morupule B Generation and Transmission Power Project (SIL/PCG
Approved in FY10; ongoing
2. HIV/AIDS Project Approved FY09; ongoing
3. Integrated Transport Project Approved FY09; ongoing
4. Northern Botswana Human-Wildlife Coexistence (Global Environment Facility)
Approved FY10; ongoing
5. Public Expenditure Review FY11; completed
6. Development Policy Review (DPR): Competitiveness, Diversification and Growth
FY12; completed
7. Fee-Based Technical Advisory Services for Water Sector Reform (Phase 3)
FY13 ; ongoing
8. Fee-Based Technical Advisory Services for Economic Diversification and Competitiveness
FY13 (preparation)
9. Skills for Economic Diversification FY12; completed
10. Social Safety Net Assessment for Botswana
FY13; ongoing
11. Poverty Assessment for Botswana FY13 (preparation)
12. Public Sector Management- Justice and Law System TA
FY12; ongoing
13. Wealth Accounting and Valuation of Ecosystem Services for Botswana
FY12; ongoing

BOTSWANA
6 INTERNATIONAL MONETARY FUND
Title Products
Provisional Timing of Missions
Expected Delivery Date
IMF work program in the next 12 months
STA TA on balance of payments, national accounts, consumer price index, and standardized reporting
Ongoing FY 2012
MCM TA on financial stability,nonbank supervision, central bank risk management, payment system modernization, and reviewing banking legislation.
Ongoing FY 2012
FAD TA PFM, overall tax policy review,cash management and trade facilitation
Expected FY 2012
FAD Macro-fiscal advisor May 2012-May 2013
LEG TA on banking and fiscal laws FY 2012
Article IV Consultation June 2013

BOTSWANA
INTERNATIONAL MONETARY FUND 7
STATISTICAL ISSUES I. Assessment of Data Adequacy for Surveillance
General: On November 30, 2010, the government of Botswana gazetted the commencement of the Statistics Act of 2009. Under the Act, the Central Statistics Office (CSO), which had been a department of the Ministry of Finance and Development Planning, was transformed into Statistics Botswana (SB), responsible for the country’s statistical system. SB will operate independently of the Ministry of Finance and Development Planning, with its own board of Directors.
Macroeconomic data are adequate for surveillance, but some shortcomings exist in terms of accuracy and reliability of the source data and the statistical techniques used in the compilation of national accounts, government finance, and balance of payments statistics. The timeliness of the central bank survey and detailed government expenditure data by economic classification needs to be increased to better support economic analysis and prepare Botswana for an eventual subscription to the Special Data Dissemination Standard (SDDS). Further improvements would include dissemination of readily available information on monthly production of diamonds and quarterly aggregate financial soundness indicators.
The authorities are working on a number of fronts to improve data quality and dissemination: (i) source data and methodologies are being reviewed for those data with obvious estimation problems/gaps, (ii) stronger collaboration is being sought among source data producers to secure consistency and reconcile discrepancies across data sets; (iii) the production of leading economic indicators is currently underway; and (iv) staff shortages are being addressed within budget constraints. National Accounts: In October 2012, the Statistics Botswana announced revised time series of GDP rebased to 2006 as a new benchmark year. However, there are some weaknesses and areas for further improvements, which at this stage can be considered as limitations for proper use of the revised national accounts data. The Labor Force Survey (2005/06) is out of date. More frequent surveys would support a better understanding of poverty and unemployment. Price Statistics: The official monthly consumer price index (CPI) is available on a timely basis in the SB’s website. The index is comprehensive and provides breakdowns between urban and rural price data, and between prices of tradable (domestic and imported) and nontradable goods and services. Currently SB is working to update the CPI weights based on the recent Household Income and Expenditure Survey. Compilation challenges include the eventual inclusion of owner-occupied housing price data in the CPI. Compilation of producer or wholesale prices has been discontinued. Government Finance Statistics: The concepts and definitions used in compiling government finance statistics generally follow the guidelines of the IMF’s 1986 Government Finance Statistics Manual (GFSM 1986) but cover only budgetary central government activities. No fiscal statistics are compiled for extra budgetary institutions, consolidated central government, or consolidated general government. No decision has been made by the authorities on adopting a “migration path” to the GFSM 2001 methodology, although the authorities are working with the Fund Statistics Department (STA) toward that endeavor. Recurrent and development expenditure data are published in an aggregate form. Development spending comprises a mixture of current and capital spending.
Monetary and Financial Statistics: Compilation practices are consistent with the Fund’s Monetary and Financial Statistics Manual. The central bank survey is currently available with a lag of usually about

BOTSWANA
8 INTERNATIONAL MONETARY FUND
three months, which is well short of the two-week period recommended in the SDDS. STA’s recommendation is to make preliminary data available with clear identification of data status. The authorities prefer a more cautious approach to data dissemination to avoid reputation damage if the data require revisions. The BoB is seeking to expand the coverage of financial statistics to include the operations of nonbank financial intermediaries (NBFI), such as pension funds, insurance companies, and other financial corporations, such as unit trusts, finance companies, and financial auxiliaries. STA’s recommendation is to focus on data collection in a handful of large institutions within each NBFI category. Balance of Payments and International Investment Position Statistics: Annual and quarterly balance of payments data are published in the Botswana Financial Statistics (BF) and the BoB’s Annual Report. Preliminary data are generally disseminated within two months of the end of the reporting period, while revised (final) data are available after nine months. The concepts, structure, and definitions of the balance of payments statistics follow the fifth edition of the Balance of Payments Statistics Manual (BPM5). Source data are adequate, but the International Transaction Reporting System (ITRS) data—as opposed to alternative survey data on services and transfer items in the current account—has become unreliable. Data compilation, estimation, and adjustments mostly employ sound techniques, but the methods used for estimating missing data (for example, unrecorded trade), f.o.b. /c.i.f. adjustment factors to import values, and flows from stock data are inadequate. Discrepancies exist in national accounts data concerning: (i) the valuation of diamond exports and (ii) imports, exports, and payments related to settlements within the Southern African Customs Union (SACU). Following the relocation of De Beers’ London operations, the BoB has introduced detailed new forms for import and export of diamonds to present the rising re-exports trade for diamonds. Compilation challenges include appropriate treatment of diamond related re-export trade both in the national accounts and balance of payments.
The BoB conducts an annual survey of Botswana’s investment and international investment position (IIP). A quarterly IIP survey is also produced for internal use with data from the ITRS.
External Debt: Public external debt data are of good quality and but timeliness could be improved. II. Data Standards and Quality
Botswana has participated in the GDDS since late 2002. A Data ROSC and its updates were published in April 2002, March 2004, and April 2007, respectively.
III. Reporting to STA Monetary data are reported for publication in International Financial Statistics using Standardized Report Forms and Botswana reports annual balance of payments and IIP data to STA. No government financial statistics are currently reported for publication in the Government Finance Statistics Yearbook.

BOTSWANA
INTERNATIONAL MONETARY FUND 9
Table 1. Common Indicators Required for Surveillance (As of July 30, 2013)
Date of
Latest
Observation
Date
Received
Frequency
of
Data 1
Frequency
of
Reporting 1
Frequency
of
Publication 1
Memo Items
Data Quality—
Methodological
Soundness 2
Data Quality—
Accuracy and
Reliability 3
Exchange rates 7/30/2013 7/30/2013 D D D
International reserve assets and
reserve liabilities of the monetary
authorities 4 Mar 2013 May 2013 M M M
Reserve/base money Mar 2013 May 2013 M M M O, O, LO, O LNO, O, LO, LO, LO
Broad money Mar 2013 June 2013 M M M
Central bank balance sheet Mar 2013 April 2013 M M M
Consolidated balance sheet of the
banking system Mar 2013 June 2013 M M
Interest rates 5 7/30/2013 7/30/2013 D D D
Consumer price index June 2013 July 2013 M M M O, LO, O, O LO, LO, LO, LO, O
Revenue, expenditure, balance, and
composition of financing 6—general
government 7 NA NA LO, LNO, LNO, LO LO, O, LO, LO, LNO
Revenue, expenditure, balance, and
composition of financing 6—central
government Mar 2013 July 2013 A/Q/M Q Q
Stocks of central government and
central government-guaranteed
debt 8 March 2013 July 2013 A A A
External current account balance 2012 Q4 May 2013 A/Q A A O, O, O, LO LO, LO, LNO, O, LO
Exports and imports of goods March 2013 May 2013 M M M
GDP/GNP 2012 Q4 April 2013 A/Q A/Q A/Q LO, LO, LNO, LO LO, LO, LNO, LO, LO
Gross external debt March 2013 May 2013 A/Q A A
1 Daily (D), weekly (W), monthly (M), quarterly (Q), annually (A), irregular (I), and not available (NA). 2 Reflects the assessment provided in the data ROSC published on April 6, 2007, and based on the findings of the mission that took place from October 31 to November 13, 2006, for the data set corresponding to the variable in each row. The assessment indicates whether international standards concerning (respectively) concepts and definitions, scope, classification/sectorization, and basis for recording are fully observed (O), largely observed (LO), largely not observed (LNO), not observed (NO), or not available (NA). 3 Same as footnote 2, except referring to international standards concerning (respectively) source data, assessment of source data, statistical techniques, assessment and validation of intermediate data and statistical outputs, and revision studies. 4 Includes reserve assets pledged or otherwise encumbered as well as net derivative positions. 5 Both market-based and officially determined, including discount, money market, treasury bill, note, and bond rates. 6 Foreign, domestic bank, and domestic nonbank financing. 7The general government consists of the central government (budgetary funds, extra budgetary funds, and social security funds) and state and local governments.
8 Including currency and maturity composition.

BOTSWANA STAFF REPORT FOR THE 2013 ARTICLE IV CONSULTATION—DEBT SUSTAINABILITY ANALYSIS
Approved By Anne-Marie Gulde-Wolf and Mark Flanagan
Prepared by the Staff Representatives for the 2013
Consultation with Botswana
August 20, 2013

BOTSWANA
2 INTERNATIONAL MONETARY FUND
MEDIUM–TERM PUBLIC DEBT SUSTAINABILITY Botswana’s gross public debt was broadly unchanged in pula values but decreased slightly relative
to GDP in 2012/13 compared with 2011/12. The increase in external debt was compensated for by
the decline in domestic debt. As a result, the share of external debt in total debt increased slightly to
68 percent in 2012/13.
Botswana’s historically low level of public debt reflects the authorities’ prudent macroeconomic
policies. This resulted in a significant reserve accumulation, which allowed them to face the Great
Recession with strong policy buffers. Therefore, countercyclical policies were successfully
implemented without much debt accumulation.
Staff’s analysis, based on the permanent income hypothesis, suggests that in order to fully preserve
mineral wealth for future generations, the non-mineral primary balance (NMPB) should be reduced
to about 5 percent of non-mineral GDP from the current level of about 11 percent. 1
The baseline scenario, underlying the staff’s macroeconomic framework, assumes continuing fiscal
consolidation with the primary surplus amounting about 2.4 percent of GDP on average for
2013/14–18/19. The main burden of fiscal adjustment falls on primary expenditure. By 2018/19, the
stock of gross public debt is projected at about 10 percent of GDP (Table 1).
Figure 1 shows two alternative scenarios:
• The first scenario aims to demonstrate what would be the fiscal outcome if the main macro-
variables are maintained at their historical 10-year averages. In this scenario, debt-to-GDP ratio
increases and stabilizes at a level higher than suggested by the baseline scenario. The main driver
of this kind of dynamics is the deteriorated primary balances due to countercyclical fiscal policy
response to the 2008-09 financial crisis.
• The second scenario assumes no change in the policy and holds the primary fiscal balance
constant at its 2013/14 level (0.8 percent of GDP) throughout the medium-term. In this case, public
debt also stabilizes at a level higher than suggested by the baseline scenario, because the baseline
scenario assumes further fiscal consolidation.
1 The associated background work can be found in the 2012 Article IV staff report (http://www.imf.org/external/pubs/cat/longres.aspx?sk=26166.0).

BOTSWANA
INTERNATIONAL MONETARY FUND 3
Table1. Botswana Public Sector Debt Sustainability Analysis (DSA) - Baseline Scenario
As of April 30, 20132011 2012 2013 2014 2015 2016 2017 2018 Sovereign Spreads
Nominal gross public debt 10.6 19.1 18.8 16.9 15.4 13.9 12.7 11.6 10.6 Spread (bp) 2/ NAPublic gross financing needs 1.2 4.1 2.7 2.4 2.0 1.7 1.2 0.8 3.8 CDS (bp) NA
Real GDP growth (in percent) 4.4 6.1 3.7 3.8 4.0 4.3 4.1 4.0 4.0 Ratings Foreign LocalInflation (GDP deflator, in percent) 8.2 5.6 1.3 10.5 6.6 5.8 6.0 6.0 6.1 Moody's Aa3 Aa3Nominal GDP growth (in percent) 13.0 12.0 5.0 14.7 10.9 10.4 10.3 10.2 10.3 S&Ps A- A-
Effective interest rate (in percent) 3/ 5.6 3.3 3.3 3.3 4.2 4.8 5.5 6.3 7.4 Fitch n.a. n.a.
2011 2012 2013 2014 2015 2016 2017 2018 cumulativeChange in gross public sector debt 1.1 0.50 -0.36 -1.9 -1.5 -1.5 -1.2 -1.1 -1.0 -8.1
Identified debt-creating flows -4.4 -0.32 -2.35 -1.8 -1.4 -1.4 -1.2 -1.0 -0.9 -7.7Primary deficit -0.1 1.3 -0.7 -0.8 -1.6 -2.5 -3.3 -4.0 -2.3 -14.5
Primary (noninterst) revenue and grants 40.5 35.0 36.7 34.0 33.5 33.4 33.3 33.3 31.9 199.5Primary (noninterest) expenditure 40.4 36.4 36.0 33.2 31.9 31.0 30.1 29.2 29.6 185.0
Automatic debt dynamics 4/ -0.9 0.5 0.1 -0.8 -0.5 -0.3 -0.2 -0.1 0.0 -1.9Interest rate/growth differential 5/ -0.7 -1.4 -0.3 -1.9 -1.0 -0.8 -0.6 -0.4 -0.3 -5.0
Of which: real interest rate -0.3 -0.4 0.4 -1.2 -0.4 -0.2 -0.1 0.0 0.1 -1.8Of which: real GDP growth -0.4 -1.0 -0.7 -0.6 -0.6 -0.6 -0.5 -0.5 -0.4 -3.2
Exchange rate depreciation 6/ -0.2 1.9 0.4 … … … … … … …Other identified debt-creating flows -3.4 -2.1 -1.7 -0.2 0.7 1.4 2.3 3.1 1.4 8.8
Privatization receipts (negative) -3.4 -2.1 -1.7 -0.2 0.7 1.4 2.3 3.1 1.4 8.8Contingent liabilities 0.0 0.0 0.0 0.0 0.0 0.0 0.0 0.0 0.0 0.0Other debt-creating flows (specify) 0.0 0.0 0.0 0.0 0.0 0.0 0.0 0.0 0.0 0.0
Residual, including asset changes 7/ 5.5 0.8 2.0 1.0 0.5 0.4 0.3 0.3 0.2 2.7
Source: IMF staff.
1/ Public sector is defined as general government.
2/ Bond Spread over U.S. Bonds.
3/ Defined as interest payments divided by debt stock at the end of previous year.
4/ Derived as [(r - p(1+g) - g + ae(1+r)]/(1+g+p+gp)) times previous period debt ratio, with r = interest rate; p = growth rate of GDP deflator; g = real GDP growth rate;
a = share of foreign-currency denominated debt; and e = nominal exchange rate depreciation (measured by increase in local currency value of U.S. dollar).
5/ The real interest rate contribution is derived from the denominator in footnote 4 as r - π (1+g) and the real growth contribution as -g.
6/ The exchange rate contribution is derived from the numerator in footnote 2/ as ae(1+r).
7/ For projections, this line includes exchange rate changes during the projection period.
8/ Assumes that key variables (real GDP growth, real interest rate, and other identified debt-creating flows) remain at the level of the last projection year.
1.4balance 8/
primary
(in percent of GDP unless otherwise indicated)
Debt, Economic and Market Indicators 1/
2002-2010Actual
Projections
Contribution to Changes in Public DebtProjections
2002-2010Actual
debt-stabilizing
-25
-20
-15
-10
-5
0
5
10
15
cumulative-25
-20
-15
-10
-5
0
5
10
15
20
25
2002 2003 2004 2005 2006 2007 2008 2009 2010 2011 2012 2013 2014 2015 2016 2017 2018
Debt-Creating Flows
Primary deficit Real GDP growth Real interest rate Exchange rate depreciation
Other debt-creating flows Residual Change in gross public sector debt
projection
(in percent of GDP)

BOTSWANA
4 INTERNATIONAL MONETARY FUND
Figure 1. Botswana Public DSA - Composition of Public Debt and Alternative Scenarios
Baseline Scenario 2013 2014 2015 2016 2017 2018 Histocial Scenario 2013 2014 2015 2016 2017 2018Real GDP growth 3.8 4.0 4.3 4.1 4.0 4.0 Real GDP growth 3.8 4.3 4.3 4.3 4.3 4.3Inflation 10.5 6.6 5.8 6.0 6.0 6.1 Inflation 10.5 6.6 5.8 6.0 6.0 6.1Primary Balance 0.8 1.6 2.5 3.3 4.0 2.3 Primary Balance 0.8 0.4 0.4 0.4 0.4 0.4Effective interest rate 3.3 4.0 4.4 4.8 5.4 6.2 Effective interest rate 3.3 4.0 4.4 4.8 5.2 5.6
Constant Primary Balance ScenarioReal GDP growth 3.8 4.0 4.3 4.1 4.0 4.0Inflation 10.5 6.6 5.8 6.0 6.0 6.1Primary Balance 0.8 0.8 0.8 0.8 0.8 0.8Effective interest rate 3.3 4.0 4.4 4.8 5.3 5.7
Source: IMF staff.
Underlying Assumptions(in percent)
Alternative Scenarios
Composition of Public Debt
Baseline Historical Constant Primary Balance
0
5
10
15
20
25
2011 2012 2013 2014 2015 2016 2017 2018
Gross Nominal Public Debt(in percent of GDP)
projection
-2
-1
0
1
2
3
4
5
6
2011 2012 2013 2014 2015 2016 2017 2018
Public Gross Financing Needs(in percent of GDP)
projection
-5
0
5
10
15
20
25
2002 2004 2006 2008 2010 2012 2014 2016 2018
By Maturity
Medium and long-term
Short-term
(in percent of GDP)
projection
-5
0
5
10
15
20
25
2002 2004 2006 2008 2010 2012 2014 2016 2018
By Currency
Local currency-denominated
Foreign currency-denominated
(in percent of GDP)
projection

BOTSWANA
INTERNATIONAL MONETARY FUND 5
MEDIUM–TERM EXTERNAL DEBT SUSTAINABILITY Botswana’s gross external debt was broadly stable at US$3.4 billion in 2013 but increased relative
to GDP due to depreciation of Pula against USD. The government’s external borrowing was mainly
from multilateral organizations, including from International Bank for Reconstruction and
Development and African Development Bank.
The stock of Botswana’s gross external debt is projected to decline gradually from about 23 percent
of GDP in 2012 to about 13 percent of GDP in 2018 (Table 2). Ongoing fiscal consolidation
supported by a steady improvement in international terms of trade, and stable FDI inflows should
support a reduction in the external debt ratio.
An alternative scenario, with key debt-creating variables at their historical levels, suggests that
Botswana could become a net creditor vis-à-vis the rest of the world over the medium-term. This is
a notable improvement over the baseline projections (Figure 2).
Simulations suggest that Botswana’s external debt-to-GDP ratio is sensitive only to a current
account shock. A real depreciation shock, while it increases the debt-to-GDP ratio initially, has only
a marginal impact on the medium-term debt dynamics. Moreover, Botswana’s external debt is not
very sensitive to a shock in interest rates and economic activity.

Table 2. Country: External Debt Sustainability Framework, 2008-2018
Projections2008 2009 2010 2011 2012 2013 2014 2015 2016 2017 2018 Debt-stabilizing
non-interest current account 6/
Baseline: External debt 9.9 26.1 21.3 21.8 23.4 20.9 19.4 17.6 15.9 14.4 13.0 -0.9
Change in external debt -1.6 16.2 -4.8 0.5 1.6 -2.5 -1.5 -1.8 -1.7 -1.5 -1.4Identified external debt-creating flows (4+8+9) -5.8 9.9 -1.4 -4.6 4.2 -1.3 -1.8 -2.4 -2.7 -3.2 -4.6
Current account deficit, excluding interest payments -1.3 9.1 5.1 -1.0 3.5 0.1 -0.6 -1.4 -1.8 -2.4 -3.9Deficit in balance of goods and services 4.9 16.1 9.9 7.0 16.2 11.8 11.1 10.3 10.1 10.2 10.6
Exports 45.0 36.3 35.8 45.4 43.6 42.0 41.4 41.0 40.6 40.5 40.2Imports 49.9 52.4 45.6 52.4 59.8 53.8 52.5 51.3 50.7 50.7 50.8
Net non-debt creating capital inflows (negative) -5.2 -1.4 0.0 -2.7 -2.0 -2.0 -1.9 -1.7 -1.5 -1.4 -1.3Automatic debt dynamics 1/ 0.7 2.1 -6.5 -0.9 2.8 0.6 0.7 0.6 0.6 0.6 0.6
Contribution from nominal interest rate 1.0 1.1 0.3 1.3 1.4 1.4 1.5 1.4 1.3 1.2 1.1Contribution from real GDP growth -0.4 0.9 -1.7 -1.2 -0.9 -0.8 -0.8 -0.8 -0.7 -0.6 -0.5Contribution from price and exchange rate changes 2/ 0.2 0.2 -5.2 -1.0 2.2 ... ... ... ... ... ...
Residual, incl. change in gross foreign assets (2-3) 3/ 4.2 6.4 -3.4 5.1 -2.6 -1.1 0.3 0.6 1.0 1.7 3.2
External debt-to-exports ratio (in percent) 21.9 71.8 59.5 48.0 53.6 49.7 46.8 42.9 39.1 35.6 32.3
Gross external financing need (in billions of US dollars) 4/ -3.7 1086.0 779.3 62.4 833.2 299.0 237.8 116.9 12.7 -125.6 -435.4in percent of GDP 0.0 10.7 5.7 0.4 5.8 10-Year 10-Year 1.9 1.5 0.7 0.1 -0.7 -2.3
Scenario with key variables at their historical averages 5/ 20.9 11.9 3.7 -3.8 -10.7 -16.3 -2.4Historical Standard
Key Macroeconomic Assumptions Underlying Baseline Average Deviation
Real GDP growth (in percent) 3.9 -7.8 8.6 6.1 3.7 4.3 4.8 3.8 4.0 4.3 4.1 4.0 4.0GDP deflator in US dollars (change in percent) -1.5 -1.6 24.7 5.1 -9.3 6.5 13.6 3.1 -0.7 0.6 0.7 0.3 0.4Nominal external interest rate (in percent) 8.5 10.2 1.7 6.6 6.1 7.2 2.6 6.6 7.5 7.7 7.9 8.0 8.1Growth of exports (US dollar terms, in percent) -16.2 -26.8 33.4 41.7 -9.7 10.5 22.8 3.1 1.8 3.9 3.9 3.9 3.8Growth of imports (US dollar terms, in percent) 18.0 -4.7 17.9 28.0 7.3 15.9 16.3 -3.7 0.7 2.6 3.6 4.2 4.8Current account balance, excluding interest payments 1.3 -9.1 -5.1 1.0 -3.5 5.3 10.2 -0.1 0.6 1.4 1.8 2.4 3.9Net non-debt creating capital inflows 5.2 1.4 0.0 2.7 2.0 3.0 1.7 2.0 1.9 1.7 1.5 1.4 1.3
1/ Derived as [r - g - r(1+g) + ea(1+r)]/(1+g+r+gr) times previous period debt stock, with r = nominal effective interest rate on external debt; r = change in domestic GDP deflator in US dollar terms, g = real GDP growth rate, e = nominal appreciation (increase in dollar value of domestic currency), and a = share of domestic-currency denominated debt in total external debt.2/ The contribution from price and exchange rate changes is defined as [-r(1+g) + ea(1+r)]/(1+g+r+gr) times previous period debt stock. r increases with an appreciating domestic currency (e > 0) and rising inflation (based on GDP deflator). 3/ For projection, line includes the impact of price and exchange rate changes.4/ Defined as current account deficit, plus amortization on medium- and long-term debt, plus short-term debt at end of previous period. 5/ The key variables include real GDP growth; nominal interest rate; dollar deflator growth; and both non-interest current account and non-debt inflows in percent of GDP.6/ Long-run, constant balance that stabilizes the debt ratio assuming that key variables (real GDP growth, nominal interest rate, dollar deflator growth, and non-debt inflows in percent of GDP) remain at their levels of the last projection year.
Actual
(In percent of GDP, unless otherwise indicated)
6 IN
TERNATIO
NAL M
ON
ETARY FUN
D
BOTSW
ANA
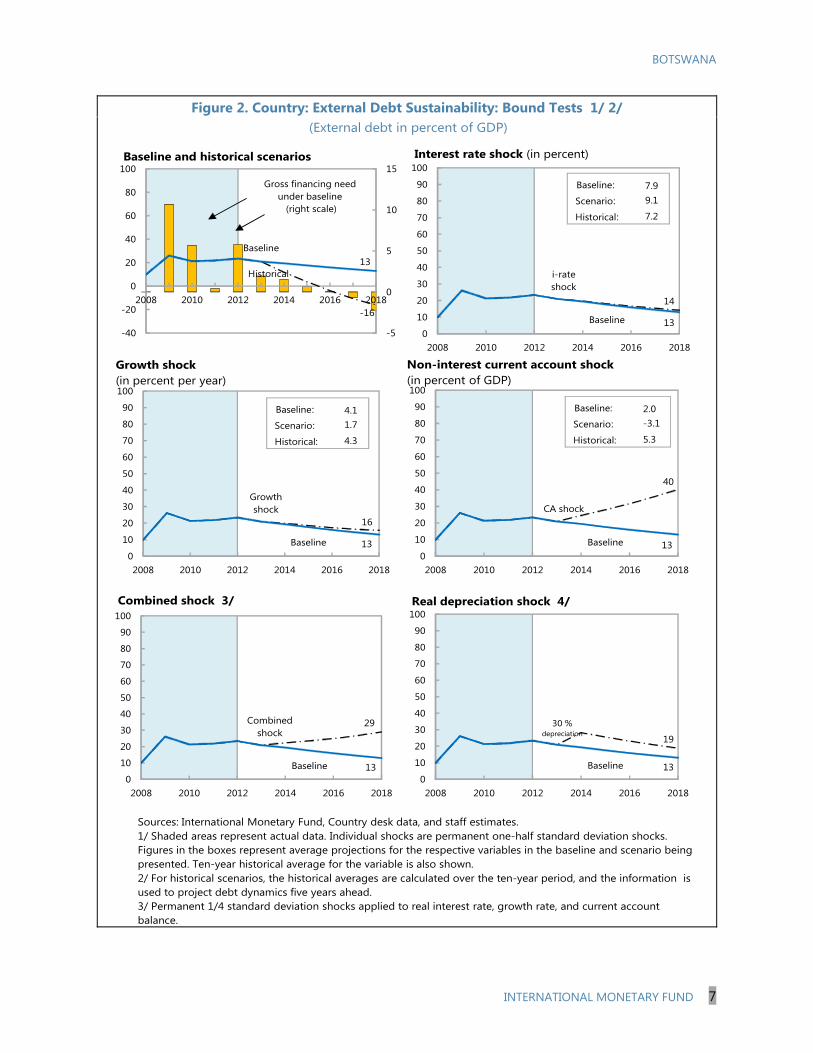
BOTSWANA
INTERNATIONAL MONETARY FUND 7
Figure 2. Country: External Debt Sustainability: Bound Tests 1/ 2/
i-rate shock
14
Baseline 130
10
20
30
40
50
60
70
80
90
100
2008 2010 2012 2014 2016 2018
Interest rate shock (in percent)
(External debt in percent of GDP)
Sources: International Monetary Fund, Country desk data, and staff estimates.1/ Shaded areas represent actual data. Individual shocks are permanent one-half standard deviation shocks. Figures in the boxes represent average projections for the respective variables in the baseline and scenario being presented. Ten-year historical average for the variable is also shown. 2/ For historical scenarios, the historical averages are calculated over the ten-year period, and the information is used to project debt dynamics five years ahead.3/ Permanent 1/4 standard deviation shocks applied to real interest rate, growth rate, and current account balance.
Historical
-16
Baseline13
-5
0
5
10
15
-40
-20
0
20
40
60
80
100
2008 2010 2012 2014 2016 2018
Baseline and historical scenarios
CA shock
40
Baseline 130
10
20
30
40
50
60
70
80
90
100
2008 2010 2012 2014 2016 2018
Combined shock
29
Baseline 130
10
20
30
40
50
60
70
80
90
100
2008 2010 2012 2014 2016 2018
Combined shock 3/
30 % depreciation
19
Baseline 130
10
20
30
40
50
60
70
80
90
100
2008 2010 2012 2014 2016 2018
Real depreciation shock 4/
Gross financing need under baseline
(right scale)
Non-interest current account shock (in percent of GDP)
Growth shock
16
Baseline 130
10
20
30
40
50
60
70
80
90
100
2008 2010 2012 2014 2016 2018
Baseline:
Scenario:
Historical:
7.99.1
7.2
Baseline:
Scenario:
Historical:
4.11.7
4.3
Baseline:
Scenario:
Historical:
2.0-3.1
5.3
Growth shock (in percent per year)

Press Release No. 13/341 FOR IMMEDIATE RELEASE September 13, 2013
IMF Executive Board Concludes 2013 Article IV Consultation with Botswana
On September 9, 2013, the Executive Board of the International Monetary Fund (IMF) concluded the Article IV consultation with Botswana.1 After two consecutive years of strong post-crisis growth, Botswana’s output growth slowed down from about 6 percent in 2011 to about 4 percent in 2012. The deceleration was driven by the decline in the mining sector growth owing to the subdued global demand for diamonds, which continued during the first quarter of 2013. On the expenditure side, domestic demand was strong in 2012, with private consumption and investments growth at about 9 and 13 percent, respectively, in real terms. Consumer price inflation decelerated markedly to 5.8 at end June 2013, just below the upper end of Bank of Botswana’s (BoB) medium-term objective range of 3–6 percent. Inflation deceleration was in part due to a base effect of increased administrated prices during last year. Core inflation, which excludes administered prices, has also declined. The BOB reduced its policy rate by 100 basis points during April – June 2013 motivated by its positive medium-term inflation outlook. Although Botswana’s banking system is profitable and well-capitalized with relatively low nonperforming loans; there are potential vulnerabilities stemming from the high concentration of banks’ loans to household and the acceleration in growth of unsecured lending. While there is no comprehensive data on the overall level of household indebtedness, due mainly to the paucity of information on household credit from the non-banking sector, the level of household leverage has increased significantly in recent years.
1 Under Article IV of the IMF's Articles of Agreement, the IMF holds bilateral discussions with members,
usually every year. A staff team visits the country, collects economic and financial information, and discusses
with officials the country's economic developments and policies. On return to headquarters, the staff prepares a
report, which forms the basis for discussion by the Executive Board. At the conclusion of the discussion, the
Managing Director, as Chairman of the Board, summarizes the views of Executive Directors, and this summary
is transmitted to the country's authorities. An explanation of any qualifiers used in summing up can be found
here: http://www.imf.org/external/np/sec/misc/qualifiers.htm.
International Monetary Fund Washington, D.C. 20431 USA
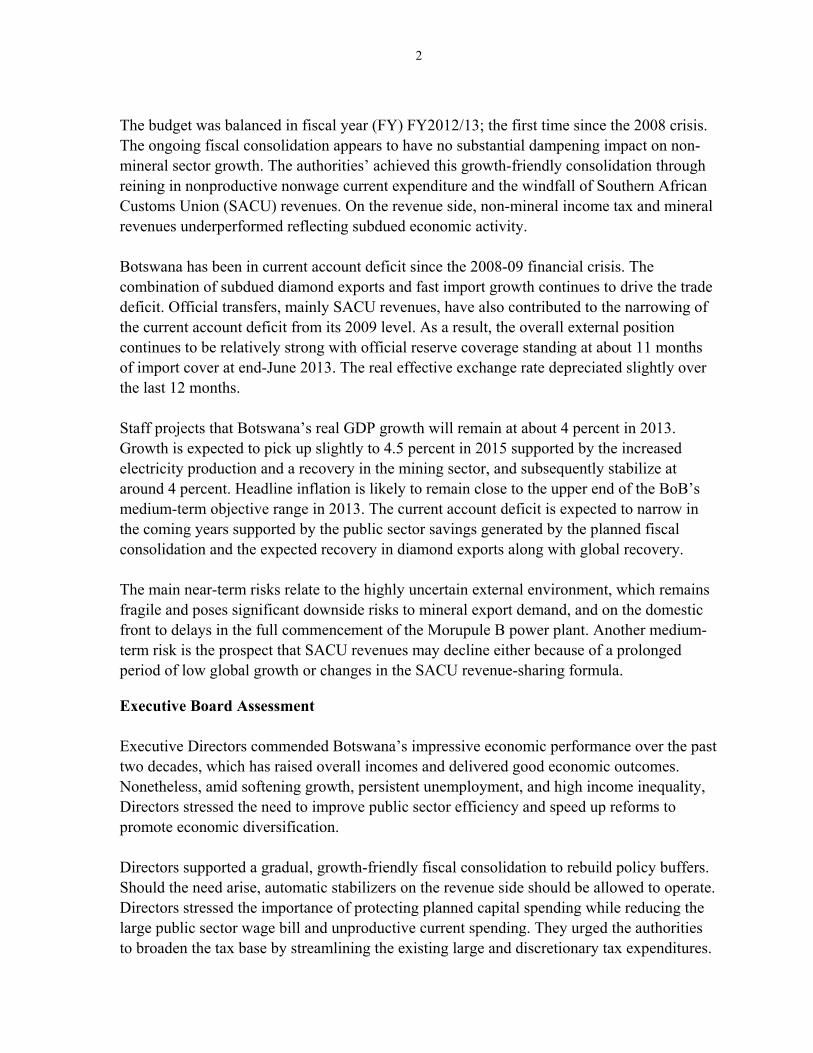
2
The budget was balanced in fiscal year (FY) FY2012/13; the first time since the 2008 crisis. The ongoing fiscal consolidation appears to have no substantial dampening impact on non-mineral sector growth. The authorities’ achieved this growth-friendly consolidation through reining in nonproductive nonwage current expenditure and the windfall of Southern African Customs Union (SACU) revenues. On the revenue side, non-mineral income tax and mineral revenues underperformed reflecting subdued economic activity. Botswana has been in current account deficit since the 2008-09 financial crisis. The combination of subdued diamond exports and fast import growth continues to drive the trade deficit. Official transfers, mainly SACU revenues, have also contributed to the narrowing of the current account deficit from its 2009 level. As a result, the overall external position continues to be relatively strong with official reserve coverage standing at about 11 months of import cover at end-June 2013. The real effective exchange rate depreciated slightly over the last 12 months. Staff projects that Botswana’s real GDP growth will remain at about 4 percent in 2013. Growth is expected to pick up slightly to 4.5 percent in 2015 supported by the increased electricity production and a recovery in the mining sector, and subsequently stabilize at around 4 percent. Headline inflation is likely to remain close to the upper end of the BoB’s medium-term objective range in 2013. The current account deficit is expected to narrow in the coming years supported by the public sector savings generated by the planned fiscal consolidation and the expected recovery in diamond exports along with global recovery. The main near-term risks relate to the highly uncertain external environment, which remains fragile and poses significant downside risks to mineral export demand, and on the domestic front to delays in the full commencement of the Morupule B power plant. Another medium-term risk is the prospect that SACU revenues may decline either because of a prolonged period of low global growth or changes in the SACU revenue-sharing formula. Executive Board Assessment Executive Directors commended Botswana’s impressive economic performance over the past two decades, which has raised overall incomes and delivered good economic outcomes. Nonetheless, amid softening growth, persistent unemployment, and high income inequality, Directors stressed the need to improve public sector efficiency and speed up reforms to promote economic diversification.
Directors supported a gradual, growth-friendly fiscal consolidation to rebuild policy buffers. Should the need arise, automatic stabilizers on the revenue side should be allowed to operate. Directors stressed the importance of protecting planned capital spending while reducing the large public sector wage bill and unproductive current spending. They urged the authorities to broaden the tax base by streamlining the existing large and discretionary tax expenditures.

3
They welcomed the authorities’ efforts to create a simplified tax system with high compliance and low administration costs.
Directors supported a broadly neutral monetary policy stance in the near term. They welcomed the government’s publication of the weights of the pula currency basket and its rate of crawl, which will enhance the transparency of the exchange rate regime and facilitate the development of the foreign currency market. They stressed the importance of continuing to strengthen the operational modalities of the crawling peg regime.
Directors concurred with the government’s strategy of keeping a right balance between financial inclusion and financial system stability. They encouraged the authorities to enhance their existing mechanisms for monitoring financial sector developments to temper the growth in household borrowing and unsecured lending. They welcomed efforts by the Bank of Botswana to strengthen the work of its Financial Stability Division, and urged the authorities to continue to enhance the skill base and regulatory infrastructure of the Non-Bank Financial Institutions Regulatory Authority.
Directors highlighted the need to raise economy-wide productivity, including through fostering private sector development and economic diversification. Priorities include reducing the domestic regulatory burden on firms and increasing investments in health and education. Directors welcomed the authorities’ multi-pronged approach to promoting diversification, leveraging Botswana’s areas of comparative advantage.

4
Botswana: Selected Economic and Social Indicators, 2010–2013
2010 2011 2012 2013
Prel. Proj. (Annual percentage change, unless otherwise indicated)
National income and prices Real GDP 1 8.6 6.1 4.2 3.9
Mineral 22.7 -2.3 -7.0 1.5 Nonmineral 2 6.2 7.8 6.2 4.3
Consumer prices 7.4 9.2 7.4 6.1 Diamond production (millions of carats) 22.8 23.0 20.9 21.4
External sector Exports of goods and services, f.o.b. (US$) 33.4 41.7 -9.7 3.1
Of which: diamonds 49.9 38.3 7.1 3.7 Imports of goods and services, f.o.b. (US$) 17.9 28.0 7.3 -3.2 Terms of trade -4.4 -0.3 3.6 5.7 Nominal effective exchange rate 4.6 -4.7 -7.8 … Real effective exchange rate 8.3 -0.8 -3.5 …
(Percentage change with respect to M2 at the beginning of the period)
Money and banking Net foreign assets -17.5 25.4 0.2 11.2 Net domestic assets 29.9 -21.0 7.3 3.7 Broad money (M2) 12.4 4.3 7.4 15.0 Velocity (nonmineral GDP relative to M3) 1.6 1.7 1.8 1.8 Credit to the private sector 6.1 11.8 13.9 11.8
(Percent of GDP, unless otherwise indicated)
Investment and savings 1
Gross investment (including change in inventories) 35.4 38.7 39.3 38.3 Gross savings 29.9 38.5 34.5 36.5
Central government finances 3
Total revenue and grants 32.4 36.3 35.9 33.4 Total expenditure and net lending 39.9 36.5 35.7 33.2 Overall balance (deficit –) -7.5 -0.2 0.2 0.2 Nonmineral primary balance4 -25.9 -20.1 -13.8 -11.5 Total central government debt 19.4 19.4 18.1 15.9
External sector
Current account balance -5.4 -0.2 -4.9 -1.8 Balance of payments -7.0 3.3 -0.8 -1.4 External public debt 5 11.8 14.9 14.5 12.4
(Millions of US$, unless otherwise indicated)
Gross official reserves (end of period) 7,883 8,386 8,270 8,060 Of which: Pula Fund 6,938 6,901 Months of imports of goods and services 6 11.8 11.1 11.0 10.6 Percent of GDP 57.3 52.2 52.8 47.7
Sources: Botswana authorities and IMF staff estimates and projections. 1 Calendar year. 2 Refers to the growth of value added of sectors other than mining, excluding statistical adjustments. The latter includes financial intermediation services indirectly measured (FISIM), taxes on products, and subsidies. 3 Year beginning April 1. 4 The nonmineral primary balance is computed as the difference between nonmineral revenue and expenditure (excluding interest receipts and interest payments), divided by non-mineral GDP. 5 Includes publicly guaranteed debt. 6 Based on imports of goods and services for the following year.

Statement by Mr. Saho on Botswana September 9, 2013
My authorities in Botswana are grateful for the constructive discussions they had with staff during the recent Article IV Consultations. Generally, my authorities agree with the main thrust of the staff report, particularly with respect to the assessment of important policy and institutional developments. Furthermore, my authorities are of the view that the report provides a fair account of recent economic performance and prospects. There is a general consensus between my authorities and staff that the previous strong economic performance driven by the mining industry, especially, diamonds has tapered off, and that time has come for a more diversified private sector to take a lead in growing the economy. To be sure, my authorities have long recognized the need to diversify the economic base in order to transition from a diamond dependent economy to a broader based one. To this end, my authorities have implemented a number of initiatives such as the publication of “Botswana Excellence – A Strategy for Economic Diversification and Sustainable Growth”, and the launch of the Economic Diversification Drive, meant to guide the economy in addressing challenges that hamper the diversification of the economy. As reflected in the views of my authorities, the staff report has adequately covered most of the issues; hence this statement will reiterate important developments and highlight those that transpired after the release of the staff report and some areas of different stand points between staff and authorities. Recent Economic Developments Real Growth The Botswana economy grew by 4.2 percent in 2012, down from 6.1 percent in 2011, as mining output continued to decline, mainly reflecting a slack in the global demand for diamonds, the country’s major export commodity. According to the latest GDP data, the domestic economy grew by 3.2 percent (unseasonalized) in the first quarter of 2013, reflecting another contraction in mining output, after the sector posted a substantial growth in the previous quarter. Overall, growth in the first half of 2013 remained subdued, and both staff and authorities expect the economy to grow by about 4 percent during the year. However, this is subject to continued resilience of the non-mineral sector which has been driving growth in recent years. Furthermore, additional ventures in mining, particularly in the coal and copper industries are expected to complement performance of the non-mineral sector in spurring growth in the remainder of 2013. However, the prognosis also points to downside risks, predicated on the continued fragilities that hamper the pace of economic recovery in the global markets, hence the demand for Botswana’s mineral exports. The latter is among the largest single sectoral contributors to aggregate output hence, sets the tone for the country’s economic growth, making the economy vulnerable to external pressures. This prompted the Minister of Finance, in the

2
2013 Budget Speech, to advocate for the development of the potential of the non-mining sector to counter uncertainties surrounding performance in mining. Inflation Domestic inflation averaged 7.5 percent for the whole of 2012, and this average was maintained from January 2013 to April 2013. However, annual inflation dropped to 6.1 percent in May, 5.8 percent in June and 5.7 percent in July, and thus falling within the Bank of Botswana’s (BoB) inflation objective range of 3-6 percent. This is in line with predictions made during the launch of the 2013 Monetary Policy Statement earlier in the year. The reason for the decline in inflation was the dissipation of inflationary pressures arising from an increase in administered prices during the first half of 2012. A generally subdued increase in prices of most categories of goods and services during the period, also contributed to the declining inflation. After accounting for all the upside and downside risks, the Mid Term Review of the 2013 Monetary Policy Statement anticipates the sustenance of inflation within the objective range of 3-6 percent for the rest of the year. Fiscal Policy The 2013 National Budget Speech reiterated government’s commitment to fiscal consolidation and returning the budget balance to a surplus. The same sentiment was repeated in the mid-term review of the National Development Plan 10, which aims for surpluses throughout the remaining years of the Plan period ending in 2015/16. Already, the revised budget estimates for 2012/13 recorded a modest surplus, while the preliminary budget for 2013/14 also predicts a small surplus, and this is expected to improve in 2014/15 and 2015/16. To help achieve the envisaged balanced budgets, my authorities recognize that as public expenditure cuts continue, there is a need to return economic growth to pre-global crises levels through improvements in productivity and competitiveness to raise additional revenues. Doing so would also minimize negative effects of austerity measures on the nation. Furthermore, additional revenue would allow fiscal policy to continue stimulating the economy when the need arises, and thus pursue a ‘growth friendly’ fiscal consolidation strategy referred to by staff in their report. My authorities are also committed to rationalizing and prioritizing expenditure to high return and self-liquidating projects. The resultant efficient expenditure would pave a way for a leaner public sector, and enable government to facilitate a conducive environment for the private sector to ultimately play a paramount role in driving the economy. In addition, through privatization and divestiture of state owned enterprises and outsourcing of non-core duties, direct role of government in economic activity will be reduced as private sector participation improves. Monetary Policy and Exchange Rates The medium term monetary policy objective of the BoB is to achieve price stability, by maintaining an inflation level that falls within the range of 3 – 6 percent, which is supportive of a sustainable long run growth and development of the domestic economy. In pursuit of this

3
objective, BoB uses interest rates and open market operations to influence domestic demand conditions and, hence, the rate of price changes. Throughout 2013, monetary policy has been used to invigorate the economy, as the continued public spending restraint implied limited ability of fiscal policy to pursue that role, as was the case during the pre financial crisis period. The prevalent international environment of slow growth in both demand and commodity prices, provided an opportune time for the Bank of Botswana to pursue an accommodative policy stance to support economic growth, whilst inflationary pressures remained benign. Similarly, domestic pressures on inflation were fairly weak, reflecting the slowdown in growth of both household income and government expenditure, and an economy operating below capacity. The developments, further allowed the BoB to inject a non-inflationary stimulus to the economy. Accordingly, BoB reduced the bank rate by 50 basis points in April from 9.5 percent to 9 percent, and again in June to 8.5 percent. A further 50 basis points reduction was effected in August bringing the policy rate to 8 percent, as the international and domestic conditions remained conducive for such a stimulus. The Exchange Rate The BoB policy objective range of 3-6 percent, which roughly matches inflation in trading partners, is also intended to support external competitiveness, through maintenance of a stable real effective exchange rate (REER), in the context of a crawling peg exchange rate regime adopted in 2005. For the first time the rate of crawl, which is -0.16 for 2013, and the composition of the Pula currency basket (55% South Africa Rand and 45% SDR), were published in the 2013 Budget Speech. Staff welcomed this as a positive development towards transparency in the country’s exchange rate policy. During the first half of 2013, the real effective exchange rate of the Pula appreciated by 0.1 percent. Financial Sector Stability As reflected in the staff report, the Botswana banking system remains profitable and well capitalized, with a relatively low incidence of non-performing loans (NPLs). Household credit, mainly unsecured debt, constitutes the largest share of total commercial bank lending. Credit to households increased sharply, by about 30 percent, between 2011 and 2012, following another high increase of almost 20 percent between 2010 and 2011. A high proportion of household debt is due to unsecured borrowing, at about 70 percent of total household credit. Despite the high rise in unsecured household credit between 2011 and 2012, the NPLs ratio increased negligibly from 2.6 percent to 2.8 percent in the period. Therefore, staff and authorities agreed that the ballooning unsecured lending does not pose an immediate threat to financial sector stability. My authorities will continue to monitor the developments in the credit market and shall not hesitate to take requisite macroprudential policy measures, should the need arise.

5
Conclusion The economy of Botswana has performed very well in the past decades, driven by diamond exports. The recent global crises have revealed vulnerabilities of the domestic economy, thus calling for an urgent diversification of the economy, reduction of government, empowering the private sector and nurturing alternative sources of government revenue through measures such as tax efficiency and effectiveness. A successful diversification strategy would also help to address persistent challenges of unemployment and lack of inclusive growth.