BOSTON UNIVERSITY INVESTIGATING THE MIGRATION AND … · This volume is dedicated to my Grammy,...
219
BOSTON UNIVERSITY GRADUATE SCHOOL OF ARTS AND SCIENCES Dissertation INVESTIGATING THE MIGRATION AND FORAGING ECOLOGY OF NORTH ATLANTIC RIGHT WHALES WITH STABLE ISOTOPE GEOCHEMISTRY OF BALEEN AND ZOOPLANKTON by NADINE STEWART J LYSIAK B.A., Gustavus Adolphus College, 2003 M.A., Boston University, 2007 Submitted in partial fulfillment of the requirements for the degree of Doctor of Philosophy 2009
Transcript of BOSTON UNIVERSITY INVESTIGATING THE MIGRATION AND … · This volume is dedicated to my Grammy,...

BOSTON UNIVERSITY
GRADUATE SCHOOL OF ARTS AND SCIENCES
Dissertation
INVESTIGATING THE MIGRATION AND FORAGING ECOLOGY OF
NORTH ATLANTIC RIGHT WHALES WITH STABLE ISOTOPE
GEOCHEMISTRY OF BALEEN AND ZOOPLANKTON
by
NADINE STEWART J LYSIAK
B.A., Gustavus Adolphus College, 2003 M.A., Boston University, 2007
Submitted in partial fulfillment of the
requirements for the degree of
Doctor of Philosophy
2009

UMI Number: 3334550
Copyright 2008 by
Lysiak, Nadine Stewart J.
All rights reserved.
INFORMATION TO USERS
The quality of this reproduction is dependent upon the quality of the copy
submitted. Broken or indistinct print, colored or poor quality illustrations and
photographs, print bleed-through, substandard margins, and improper
alignment can adversely affect reproduction.
In the unlikely event that the author did not send a complete manuscript
and there are missing pages, these will be noted. Also, if unauthorized
copyright material had to be removed, a note will indicate the deletion.
®
UMI UMI Microform 3334550
Copyright 2008 by ProQuest LLC.
All rights reserved. This microform edition is protected against
unauthorized copying under Title 17, United States Code.
ProQuest LLC 789 E. Eisenhower Parkway
PO Box 1346 Ann Arbor, Ml 48106-1346

© Copyright by NADINE STEWART J LYSIAK 2008
Approved By
First Reader Valiela, Ph.D.
Professor of Biology Boston University
Second Reader Michael J. Moore, Ph.D. Adjunct Professor of Biology Boston University
•--y
Third Reader Mark F. Baumgartner, Ph.D. Assistant Scientist Woods Hole Oceanographic Institution

DEDICATION
Jessie Evelyn Willett Stewart
June 18,1917 - February 16, 2007
This volume is dedicated to my Grammy, Jessie Stewart. She was never able to attend
college, despite a strong lifelong desire to do so. I am grateful to have had the
opportunity to live out one of her dreams through my own pursuit of higher education.
The memory of her unfailing optimism and appreciation for all of the beauty in the world
continues to be an inspiration to me.
iv

ACKNOWLEDGEMENTS
I would like to acknowledge the many collaborators with whom I have worked
with over the course of this study; from those who clawed through mountains of decaying
right whale flesh to salvage some baleen plates, to the museum curators who let me drill
into their historical treasures, to those who braved the high seas to collect zooplankton for
me. Thank you all for your support, efforts, and the samples you brought back with you.
The members of the New England Aquarium's Right Whale Research Group
provided critical advice and data at several stages of this project. They also curate the
North Atlantic Right Whale Catalog, which is an incredibly time consuming and often
thankless endeavor. Without that resource, much of this study would not have been
possible.
David Harris and his staff at the University of California Davis Stable Isotope
Facility conducted the stable isotope analysis of my samples with great precision and
care.
Fred Wenzel (National Marine Fisheries Service) provided me with a multi-year
zooplankton sampling platform in the Great South Channel, and the chance to observe
right whales in the wild. He was a constant supporter of me and my work, and for better
or worse, taught me everything I know about going to sea.
My graduate committee provided me with advice, encouragement, and
constructive criticism during my journey to this point. Thank you so much, Drs. Anne
Giblin, Vince Dionne, Simon Thorrold, Ivan Valiela, Mark Baumgartner, and Michael
Moore.
v

I was lucky enough to be part of two labs: the Valiela Lab at the Boston
University Marine Program and the Moore Lab at the Woods Hole Oceanographic
Institution. Thank you to all [human and canine] lab members, past and present. Your
camaraderie and advice has been much appreciated.
Dr. Regina Campbell-Malone and Master Andrea Bogomolni (a.k.a. Angel 1 and
Angel 2), were both so supportive of me and my ideas. From being sounding boards for
theories large and small, to knowing exactly when we needed to escape to the Landfall -
thank you both for being such wonderful friends.
Thanks to Dr. Carolyn Miller Angell, who early on, gave me some sage advice
regarding the most important words in a dissertation.
Dr. Mark Baumgartner has been a wonderful mentor and friend throughout my
graduate career. I would like to thank him wholeheartedly for his numerous intellectual
contributions to my project, enthusiastic participation in all Team Zooplankton activities
(which usually took place in sloppy weather), and for all the running commentary from
the ThunderDome.
Dr. Michael Moore (a.k.a. Charlie), eternal dabbler in the Curiosity Business and
challenger of the unknown; you are the best "ideas man" that I know. Thank you so
much for taking this quiet neophyte masters student seriously, for giving me the resources
to get the job done, and for encouraging me though absolutely every road block along the
way. Truly, none of this would have been possible without you, and I wish words existed
to convey the depths of my gratitude.
vi

To my family (Didee, G-Pup, Aunt Mary, Pequita, Donger, and Thor) and friends
who have become my second family (especially Dr. Jennifer S. H. Culbertson, Julia G.
Markoff, Megan English-Braga and Rob Kubitschek, Chris Tremblay, Ingrid Biedron,
Alicia Roth, Brian Buczkowski, H. Carter Esch, C.T. Harry, and Dr. Jennifer Bowen):
thank you for all the love, laughter, understanding, and perspective you have given me
over the last few years. The avalanche cascades...
vii

INVESTIGATING THE MIGRATION AND FORAGING ECOLOGY OF
NORTH ATLANTIC RIGHT WHALES WITH STABLE ISOTOPE
GEOCHEMISTRY OF BALEEN AND ZOOPLANKTON
(Order No. )
NADINE STEWART J LYSIAK
Boston University Graduate School of Arts and Sciences, 2009
Major Professor: Ivan Valiela, Professor of Biology
ABSTRACT
The foraging grounds of the endangered North Atlantic right whale (Eubalaena
glacialis) are protected under management rulings, but several datasets suggest that right
whales use habitats far beyond these areas. In 2005, the National Marine Fisheries
Service published a Right Whale Recovery Plan citing the "characterization and
monitoring of important habitats" as high research priorities.
Stable isotopes ratios in animal tissue are intrinsic tags of migration, as they vary
regionally in the environment, and are assimilated via trophic transfer. This dissertation
describes carbon, nitrogen, oxygen, and hydrogen stable isotope ratios in baleen and
zooplankton collected in the Gulf of Maine, and their application in determining the
migration patterns and foraging ecology of E. glacialis.
The Gulf of Maine stable isotope landscape was examined through analysis of
zooplankton samples from seven E. glacialis habitats. Cape Cod Bay, Great South
Channel, and the Bay of Fundy represent distinct isotope sources to right whales. All
viii

other habitat areas were statistically indistinguishable, and seasonal right whale
movements between these areas cannot be resolved with stable isotope geochemistry.
Isotope records in E. glacialis baleen, like those of other large whale species,
contain annual oscillations that correspond to broad-scale north/south migrations. To
examine right whale movement patterns at seasonal time scales, baleen isotope records,
the North Atlantic Right Whale Catalog sighting records, and habitat-specific
zooplankton stable isotope values were compared. Poor correlations were found between
observed and expected baleen isotope values, likely because of the confounding
contribution of body nutrient pools that were de-coupled from diet (i.e. non-essential
amino acids).
Comparisons of recently collected E. glacialis baleen data with isotope records
from late 19 t h- early 20th century baleen revealed a long-term decrease in carbon and
increase in nitrogen isotopes. The observed trends are attributed to increasing
anthropogenic inputs of carbon dioxide and nitrogen species, climatic forcing from the
North Atlantic and Pacific Decadal Oscillations, and poor overall health in the present-
day right whale population.
The results of this study revealed that right whales use "historic habitat" areas
more frequently than currently assumed, and demonstrates both the spatial/temporal
limitations of the stable isotope method and the confounding effect of fluctuating
biogeochemical signals in the environment.
ix

DEDICATION
TABLE OF CONTENTS
IV
ACKNOWLEDGEMENTS v
ABSTRACT viii
TABLE OF CONTENTS x
LIST OF TABLES xiii
LIST OF FIGURES xiv
LIST OF ABBREVIATIONS xvi
CHAPTER 1: INTRODUCTION 1
Figures 12
CHAPTER 2: VARIABILITY IN THE STABLE ISOTOPE RATIOS OF GULF OF MAINE ZOOPLANKTON AND THEIR UTILITY IN STUDYING BALEEN WHALE MIGRATION 14
Abstract 15
Introduction 17
Materials and Methods 22
Results 28
Discussion 31
Conclusions 38
Acknowledgements 39
Tables 40
Figures 46
x

CHAPTER 3: STABLE ISOTOPE RATIOS OF BALEEN AS INTRINSIC MARKERS OF NORTH ATLANTIC RIGHT WHALE MIGRATION 55
Abstract 56
Introduction 58
Materials and Methods 64
Results 71
Discussion 75
Conclusions 84
Acknowledgements 85
Tables 87
Figures 92
CHAPTER 4: EXAMINING LONG-TERM HABITAT USE AND THE INFLUENCE OF ENVIRONMENTAL CHANGE ON STABLE ISOTOPE RECORDS IN NORTH ATLANTIC RIGHT WHALE BALEEN 108
Abstract 109
Introduction I l l
Materials and Methods 112
Results and Discussion 117
Conclusions 126
Acknowledgements 128
Tables 129
xi

Figures 133
APPENDIX 1: ZOOPLANKTON STABLE ISOTOPE RATIOS 149
APPENDIX 2: RIGHT WHALE BALEEN STABLE ISOTOPE
RECORDS 158
LITERATURE CITED 178
CURRICULUM VITAE 195
xii

LIST OF TABLES
Chapter 2
Table 2.1
Table 2.2
Table 2.3
Table 2.4
Chapter 3
Table 3.1
Table 3.2
Table 3.3
Table 3.4
Chapter 4
Table 4.1
Table 4.2
Table 4.3
Overview of zooplankton tows 40
Spatial variation in Gulf of Maine zooplankton stable isotope
ratios 42
Temporal variation of Gulf of Maine zooplankton isotopes 43
Trophic enrichment of zooplankton: oxygen 45
Right whale life history data and baleen sampling plan 87
Elemental abundances and stable isotope ratios in right whale
baleen 89
Growth rates of adult right whale baleen 90
Trophic enrichment between right whales and zooplankton, by habitat 91
Right whale life history data and baleen sampling plan 129
Elemental abundances and stable isotope ratios in right whale baleen 130
Statistical comparisons of historical and present-day right whale baleen isotope ratios 131
xni

LIST OF FIGURES
Chapter 1
Figure 1.1 Map of primary right whale habitats and timeline of seasonal habitat use 12
Chapter 2
Figure 2.1a-b The Gulf of Maine: study area and tow locations ..46
Figure 2.2 d13C lipid normalization of zooplankton samples 48
Figure 2.3 Spatial trends in Gulf of Maine zooplankton: carbon and nitrogen isotopes 49
Figure 2.4 Spatial trends in Gulf of Maine zooplankton: oxygen an hydrogen
isotopes 51
Figure 2.5a-f Contour maps of the Gulf of Maine isotope landscape 53
Chapter 3
Figure 3.1 Map of right whale habitat areas in the northwest Atlantic 92
Figure 3.2 Adult right whale baleen stable isotope records 94
Figure 3.3 Immature right whale stable isotope records 96
Figure 3.4 Calf right whale stable isotope records 98
Figure 3.5 Habitat-specific trophic enrichment between zooplankton and right whales: d13C and d15N 100
Figure 3.6 Trophic enrichment between lactating females and right whale
calves 102
Figure 3.7 Stable isotopes as a tracer of right whale migration 104
Figure 3.8 Demographic separation of stable isotope ratios in right whales 106
xiv

Chapter 4
Figure 4.1 Nitrogen and carbon stable isotope ratios in right whale baleen, 1882-2005 133
Figure 2.2 Carbon and nitrogen stable isotope values of historical (1882-
1915) vs. present-day (1986-2005) baleen plates 135
Figure 4.3 Atmospheric carbon dioxide concentrations: 1832-2005 137
Figure 4.4 Nitrogen and carbon stable isotope measurements of right whale
baleen: 1986-2005 139
Figure 4.5 Trends in atmospheric and oceanic carbon dixoide 141
Figure 4.6 Right whale migration patterns 143
Figure 4.7 Right whale reproductive success 145
Figure 4.8 Climatic oscillations: NAO, AMO, PDO, ENSO 147
xv

LIST OF ABBREVIATIONS
AMO
ANOVA
BoF
°C
C
C5
CCB
C. finmarchicus
cm
CO
CO2
CPR
CTD
D
DIC
E. glacialis
ENSO
GC
GoM
GSC
GSL
Atlantic Multi-decadal Oscillation
Analysis of variance
Bay of Fundy
Celsius
Carbon
Calanus finmarchicus, fifth stage copepodite
Cape Cod Bay
Calanus finmarchicus
Centimeter
Carbon monoxide
Carbon dioxide
Continuous Plankton Recorder
Conductivity-Temperature-Depth instrument
Deuterium
Dissolved inorganic carbon
Eubalaena glacialis
El Nino Southern Oscillation
Gas chromatograph
Gulf of Maine
Great South Channel
Gulf of St. Lawrence
XVI

H Hydrogen
H2O Water
IRMS Isotope ratio mass spectrometer
JL Jeffrey's Ledge
km Kilometers
LSW Labrador Slope Water
m Meter
(ig Microgram
mg Milligram
ml Milliliter
mm Millimeter
MOCNESS Multiple Opening and Closing Net Environmental Sensing System
n Sample size
N Nitrogen
N2 Atmospheric nitrogen
NAO North Atlantic Oscillation
NEGB Northeast peak of Georges Bank
O Oxygen
PDB PeeDee Belemnite
PDO Pacific Decadal Oscillation
RB Roseway Basin
SD Standard deviation
xvii

SE Standard error
SEUS Southeast United States
SLW Slope water
SST Sea surface temperature
SSW Scotian Shelf Water
VSMOW Vienna Standard Mean Ocean Water
WSW Warm Slope Water
yr Year
xvm

1
CHAPTER 1
INTRODUCTION

2
Motivation
Despite protection from targeted commercial whaling, North Atlantic right whales
(Eubalaena glacialis) remain one of the world's most endangered species (IWC 2001a).
Studies of North Atlantic right whale demography have shown that, given its small
population size, even single mortality events are significant. Therefore preventing the
deaths of two females per year could considerably reduce the species' mortality rate and
extinction probability (Fujiwara and Caswell 2001). In light of this analysis, a string of
right whale mortalities that occurred between February 2004 and May 2005 greatly
alarmed researchers (see Kraus et al. 2005). In that sixteen month period, eight whales
were found dead, three of which were carrying full term fetuses (Right Whale
Consortium 2008a). Five of these cases could be attributed to human activities, as
diagnostic necropsies demonstrated that the whales were killed by vessel strike or fishing
gear entanglements (Moore et al. 2006, Campbell-Malone et al. 2008).
Vessel strikes and entanglement in fishing gear are the primary forms of large
whale anthropogenic mortality (Knowlton and Kraus 2001, Moore et al. 2005, Nelson et
al. 2007), and these sources account for 64% of documented right whale mortalities1
(Right Whale Consortium 2008a). Additionally, 75.6% of right whales bear scars
indicative of interactions with fishing gear (Knowlton et al. 2005), suggesting that few
right whales have escaped an encounter with gear and that entanglements are likely
under-reported. In addition to the conservation risk they pose, these forms of
anthropogenic mortality are also issues of animal welfare. For example, observations of
1 Statistic calculated from post-mortem examinations of 42 right whale carcasses betweenl970 and 2007 (Right Whale Consortium 2008a).

3
free-ranging whales and post-mortem examinations of carcasses have demonstrated that
whales can die slowly from both classes of mortality, especially gear entanglements
(Moore et al. 2005, Moore et al. 2006, Campbell-Malone et al. 2008).
Researchers and managers agree that reducing anthropogenic mortalities is of the
highest priority for right whale recovery plans (Kraus et al. 2005, NMFS 2005). Yet, the
implementation of effective conservation measures has been slow given the socio
economic impact of regulating the activities of fishing and shipping industries. In order
to draft effective management plans mat can reconcile the interests of these industries
with the ultimate goals of whale conservation, accurate and detailed information
regarding where and when right whales occur is needed.
With respect to our understanding of right whale ecology, significant knowledge
gaps in the areas of migratory connectivity and habitat use exist despite directed research
effort since the 1980s. Given the population's small size and high anthropogenic
mortality rate, this is concerning. Since conservation and management initiatives are
only as sound as the science upon which they are based, these knowledge gaps are a
significant hindrance to successful right whale conservation efforts. In an attempt to
close this knowledge gap, a multi-year study was conducted to describe the stable isotope
geochemistry of baleen in order to infer patterns of right whale migration. By way of
general introduction to this study, the following chapter outlines important information
about North Atlantic right whales and stable isotope geochemistry as a method for
studying animal migration.

4
Right Whales: Worldwide Status and Taxonomy
Right whales (genus Eubalaena) are a group of mysticete cetaceans characterized
by a robust body, broad paddle-like flippers, a narrow and arched upper jaw with a
deeply curved jawline, long (~2 m) baleen plates, and a large head relative to their body
size (which comprises 30% of their total length) (Kenney 2002). Three right whale
species are currently recognized: Eubalaena australis (Southern right whales), Eubalaena
japonica (North Pacific right whales), and Eubalaena glacialis (North Atlantic right
whales) (Rosenbaum et al. 2000). All three species were targeted in various commercial
whaling efforts, and were prized for their high yield of oil and baleen, coastal
distribution, and fairly slow swimming speeds. Each species was heavily exploited, such
that all were significantly depleted by the beginning of the twentieth century (Tormosov
et al. 1998, Clapham et al. 2004, Reeves et al. 2007).
The recovery success of right whales since targeted whaling activities ceased has
been species dependent. The different degrees of recovery likely stem from: the varied
intensity and timing of exploitation, the degree of industrialization in each species'
primary habitat areas, each population's pre- and post-exploitation genetic diversity, the
occurrence and severity of disease within each population, and regional differences in
food availability (IWC 2001a). Southern right whales have demonstrated the strongest
recovery; and the extant population is estimated at 7,500 individuals with a 7-8 % annual
growth rate (IWC 2001b). By contrast, North Pacific right whales are so rare (with a
population estimate in the dozens to low hundreds) that individual sightings are worthy of
publication (e.g. Rowntree et al. 1980, Tynan et al. 2001). Although North Atlantic right

5
whales were once prolific on both sides of the Atlantic, today right whales in the eastern
Atlantic are scarce (Brown 1986). A small relict population, estimated at 400 individuals
(Right Whale Consortium 2007), is found in the western North Atlantic. Given these
approximations of population size, North Pacific and North Atlantic right whales are
considered the most endangered species of large whales in the world due to their apparent
lack of recovery despite several decades of international protection from commercial
harvest (Clapham et al. 1999).
North Atlantic Right Whales2
Population Biology
In addition to a high anthropogenic mortality rate, a reduced reproductive rate is a
major factor hindering right whale recovery (Kraus et al. 2005). Right whale
reproductive and population biology are characterized by a low overall reproductive rate,
high degree of variability in annual calf production and inter-annual calving intervals,
and a significant number of nulliparous adult females (Kraus et al. 2007). Although
stereotypical right whale calving events occur on three year cycles (including one year of
gestation (Best 1994), approximately one year of lactation (Hamilton et al. 1995), and a
year of rest before a subsequent pregnancy) female right whales have experienced longer
calving intervals on average. The mean calving interval for the population has also been
variable It is hypothesized that limitations in food availability, disease, and the
consequences of low genetic variability are potential factors contributing to the poor
2 Given the focus of this dissertation, the term "right whale" will herein refer to the northwest Atlantic stock of Eubalaena glacialis

6
reproductive success of the right whale population (Greene and Pershing 2004, Frasier et
al. 2007, Kraus et al. 2007).
Foraging Ecology
Right whales are zooplankton specialists, and feed primarily on the calanoid
copepod Calanus finmarchicus (Murison and Gaskin 1989, Mayo and Marx 1990,
Beardsley et al. 1996, Baumgartner and Mate 2003). C. finmarchicus is the dominant
copepod species of the boreal North Atlantic, and is characterized by a life history cycle
that includes a resting stage known as diapause. In preparation for diapause, late stage
copepodites sequester lipids in a membrane-bound organelle (oil sac). The oil sac grows
as lipids accumulate, and can eventually fill over half of the volume of the body (Miller
et al. 1998), making C. finmarchicus and energy rich prey item. During diapause, fifth
stage copepodites (C5) migrate to depth and enter a state of arrested development which
allows them survive periods of low food availability (Hirche 1996).
In contrast to other mysticete cetaceans, right whales exhibit no behaviors that
serve to corral their food; instead they rely completely on the environment (or the
zooplankton themselves) to concentrate their prey into dense, exploitable patches
(Baumgartner et al. 2007). Right whale feeding behavior is quite basic; an individual
simply opens its mouth and swims forward. The hundreds of baleen plates in a whale's
mouth filter zooplankton from the water column in a very efficient manner (Werth 2007).
Right whales have been observed feeding in this manner at the surface (known as skim
feeding, Mayo and Marx 1990) or at various depths below the surface. Using suction-cup

7
mounted time-depth-recorder tags, Baumgartner and Mate (2003) demonstrated that
during sub-surface feeding bout, right whales foraged on thin dense layers of C5s, which
were often concentrated at the bottom mixed layer. In both surface and sub-surface
feeding scenarios, right whales seem highly attuned to the density of plankton in their
feeding path and modify their depth or trajectory in order to exploit the densest patches of
plankton.
Distribution and Migration
For a significant portion of each year, North Atlantic right whales are found in the
coastal waters of the eastern United States and Canada. Four primary feeding habitats are
used seasonally by a large proportion of the right whale population (Fig. 1.1). These
include: Cape Cod Bay (CCB, from January - April), the Great South Channel (GSC,
from April - July), the lower Bay of Fundy (BoF, from July - October), and Roseway
Basin (RB, from July - October) (Kraus et al. 1986a, Winn et al. 1986, Murison and
Gaskin 1989, Hamilton and Mayo 2001 Hamilton et al. 2007). Right whales are also
found, in fewer numbers, in: Chaleur Bay/Gulf of St. Lawrence (GSL, in the summer and
fall, Y. Guilbault, pers. comm.); Jeffrey's Ledge (JL, from October - November,
Weinrich et al. 2000); the northeastern flank of Georges Bank (NEGB, in the summer
months, Niemeyer et al. 2008); and the central GoM (winter months, Cole et al. 2007).
The only known calving ground is located in the southeast US (SEUS), in the coastal
waters off Georgia and Florida, and is occupied from November - February (Kraus et al.
1986a, Hamilton et al. 2007).

8
Analyses of multiple datasets (including survey, photo-ID/mark-recapture, and
genetic) suggest that right whales may use areas which are ancillary to their recognized
habitats. Five right whale habitats (Cape Cod Bay, Great South Channel, Bay of Fundy,
Roseway Basin, and southeast US) are protected, to various degrees, by management
rulings such as vessel speed restrictions, re-routed shipping lanes, or fishing gear
modifications. The characterization and monitoring of additional habitats has been cited
as a research priority by managers (NMFS 2005). Given the high level of anthropogenic
mortality that is already observed in the North Atlantic right whale population, a better
understanding of right whale distribution, and the threats they face therein, is urgently
needed to improve their conservation and recovery potential.
Stable Isotope Geochemistry
Stable isotope analysis has become an established method for examining the flow
of nutrients through ecosystems (Peterson and Fry 1987), and many studies utilize it to
reconstruct trophic relationships (Kelly 2000). Organisms acquire stable isotope
signatures from their diet and the isotopic value of animal tissues are predictably enriched
compared to those of their food source (DeNiro and Epstein 1978,1981). Additionally,
stable isotope values in the environment, which are controlled by a variety of abiotic
factors, are incorporated into food webs by producers (Rubenstein and Hobson 2004).
Therefore, stable isotope data can provide a metric of what and where an animal has
recently eaten.

9
The tissue that is chosen for stable isotope analysis determines what kinds of
ecological questions a study can answer. Since the degree of a tissue's metabolic activity
dictates its isotopic turnover rate, tissues like blood and liver having fast turnovers (on
the order of days to weeks) representing short feeding histories, and tissues like skin and
muscle having slower turnovers (weeks to months) and integrating longer feeding
histories. In contrast, the stable isotope values of metabolically inactive tissues, such as
keratin structures, do not change after they are formed (Hobson 2005). New growth is
tagged by the most recently acquired food source. Accreting keratin structures, such as
hair, baleen, claws, and feathers, can therefore become temporal records of stable isotope
ratios if they are sampled incrementally (Bowen et al. 2005b).
Baleen, composed of keratin, is an ideal tissue for stable isotope analysis. It is
metabolically inactive, and is formed from blood metabolites (amino acids) and thus new
growth responds relatively quickly to dietary changes (Ayliffe et al. 2004). It accretes
continuously over each year (Lubetkin et al. 2008) yet also wears away at the tip such
that the longest plates in some species contain over ten years of isotope data, thus
providing a decadal-scale record of migration behavior.
Large whales are well suited for isotope studies because they consume large
amounts of prey over extensive areas, thereby incorporating the seasonal and geographic
variations of stable isotopic ratios of their prey into their own tissues as they move from
one region to another. Previous studies have applied stable isotope analysis to the baleen
of gray (Caraveo-Patino and Soto 2005, Caraveo-Patino et al. 2007), minke (Mitani et al.
2006), bowhead (Schell et al. 1989, Schell and Saupe 1993), and Southern right whales
10
(Best and Schell 1996); and have demonstrated the utility of this approach for describing
annual movement patterns. In all mysticete species studied to date, annual oscillations in
the carbon and nitrogen stable isotope ratios of baleen have been observed. These
oscillations can be differentiated into seasonal nutritional sources, corresponding to
observed annual migrations by each whale species between high and low latitude
habitats. Stable isotope measurements have been useful in determining residence time or
the relative amount of nutrition each whale species derives from its respective seasonal
habitats (Lee et al. 2005).
Two preliminary studies measured stable isotope ratios in baleen collected from a
total of six individual North Atlantic right whales (Wetmore 2001, Summers et al. 2006).
Both studies observed annual oscillations in baleen carbon and nitrogen stable isotope
ratios, but were unable to resolve right whale migration behavior at small spatial or short
temporal scales. Akin to previous studies with the baleen from other species, these
analyses were only been able to differentiate movement of individuals between winter
and summer habitats. In die following study, additional stable isotope ratios will be
measured in baleen collected from a greater number and diversity of individuals, and
migration behavior will be examined at finer scales.
Dissertation Overview
This dissertation examines stable isotope ratios in baleen and zooplankton, as they
relate to North Atlantic right whale migration and habitat use. It is composed of four

11
sections: (1) Characterization of the spatial and temporal variability in the C, N, O, and H
stable isotope values of zooplankton collected in the Gulf of Maine; (2) Examination of
the trends and patterns of stable isotope ratios in right whale baleen plates; (3)
Comparison of baleen stable isotope signatures with right whale biological data such as
age, reproductive events, and sighting records; (4) Comparison of baleen stable isotope
signatures collected from present-day and historical specimens.

12
Figure 1.1: Map of Primary Right Whale Habitats and Timeline of Seasonal Habitat
Use. Four habitats in the Gulf of Maine (Cape Cod Bay, Great South Channel, Bay of
Fundy, and Roseway Basin) and the only known calving ground (southeast US) are
demarcated by polygons. Two other important habitat areas, Jeffreys Ledge Chaleur
Bay, and the northeast peak of Georges Bank, are shown with arrows. The timeline
below the map outlines the seasonal occupation of these habitats by right whales. Cape
Cod Bay (CCB) is used from January - April, Great South Channel (GSC) is used from
April - July, the Bay of Fundy/Roseway Basin/NE Georges Bank are used from July -
October, Jeffreys Ledge (JL) is used from October - November, and the southeast US
(SEUS) is used from November - February.

13
Figure 1.1: Map of primary right whale habitats and timeline of seasonal habitat use
5TW 52eW i i
26'M
SEUS SEUS -GSC- -JL-
-CCB BoF/RB/NEGB
F M A M J J A S O N

14
CHAPTER 2
VARIABILITY IN THE STABLE ISOTOPE RATIOS OF GULF OF MAINE
ZOOPLANKTON AND THEIR UTILITY IN STUDYING BALEEN WHALE
MIGRATION

15
ABSTRACT
Stable isotope analysis of animal tissues can be used as an intrinsic marker of
migration, but this method relies on the unambiguous identification of the isotopic
landscape over which an animal roams and derives nutrition. Several basin-scale carbon,
nitrogen, oxygen, and hydrogen stable isotope landscapes have been described for the
greater North Atlantic, demonstrating the large isotope gradients present in the marine
environment. While these gradients can be exploited to examine the high-low latitude
migrations of many nektonic species, it is unclear if there is enough variation between
individual seasonal feeding habitats for resolving animal movement patterns at smaller
spatial/temporal scales using stable isotopes. The zooplanktivorous North Atlantic right
whale (Eubalaena glacialis) and its foraging habitats in the Gulf of Maine (northwest
Atlantic) were examined as a system with which to assess the utility and limitations of
stable isotope analysis as a method to assess seasonal baleen whale migration.
To examine the spatial and temporal variation of the Gulf of Maine stable isotope
landscape, zooplankton samples were collected from 1998-2007 at seven sites, four of
which are recognized E. glacialis seasonal feeding habitats. Carbon and nitrogen stable
isotopes were measured in all samples, while oxygen and hydrogen isotopes were
measured in a subset of the samples. Of the seven areas samples, three habitat areas
(Cape Cod Bay, Great South Channel, and the Bay of Fundy) represented isotopically
distinct habitats, and these differences were more pronounced when examining multiple
isotopes. The results of this study demonstrate that habitat-specific zooplankton isotope
values can be differentiated within the Gulf of Maine feeding ground. However, within

16
habitat inter-annual temporal variation in the stable isotope ratios was greater than the
differences between mean regional isotope values in some areas. This points to the need
to temporally couple animal and diet/environmental isotope measurements when
conducting stable isotope investigations of animal migration for accurate assessments of
habitat use.
17
INTRODUCTION
Stable isotope analysis has proven to be a practical method for describing trophic
dynamics in various food webs (Michener and Schell 1995), and as an intrinsic marker of
animal migration (Hobson 2007). To that end, studies utilizing stable isotope
geochemistry to track the migration habits of wildlife, especially in the marine
environment, have increased substantially in recent decades. This method has enhanced
our understanding of the movement patterns and foraging ecology of often cryptic marine
predators such as sharks (Kerr et al. 2006), cetaceans (Schell et al. 1989a, Best and Schell
1996, Mitani et al. 2006, Caraveo-Patino et al. 2007), pinnipeds (Burton and Koch 1999,
Kurle and Worthy 2001, Tucker et al. 2007), and seabirds (Hobson et al. 2004, Kakela et
al. 2007).
Since stable isotope values of most consumer tissues are derived from their diet,
the identification of the isotopic landscape over which an individual roams and derives
nutrition is necessary for the successful application of stable isotope analysis in animal
migration studies (Rubenstein and Hobson 2004). Delineating unambiguous stable
isotope values to an animal's specific foraging habitats can be difficult, as these signals
may vary over several spatial and/or temporal scales (Matthews and Mazumder 2005).
Previous studies using stable isotopes as migration tracers in the marine environment
have been most successful in cases where habitat areas exhibit a high degree of isotopic
contrast (e.g. marine vs. estuarine, inshore vs. offshore, high vs. low latitude; Hobson
2007).

18
Several broad-scale carbon, nitrogen, oxygen, and hydrogen stable isotope
landscapes have been described recently for the North Atlantic (Schmidt et al. 1999,
Englebrecht and Sachs 2005, McMahon et al. in prep.), each of which demonstrate that
large gradients are present. Given the high degree of spatial variation in stable isotope
ratios found in the marine environment, either in seawater or at low trophic levels such as
plankton, it is reasonable to hypothesize that an animal feeding and traveling over large
geographic distances in the North Atlantic would encounter a significant range of isotope
values along its migration route. Therefore, migration studies using stable isotope
analysis might be successfully implemented in the North Atlantic ecosystem.
The conservation plans for several threatened marine mammal, fish, and seabird
species hinge on the understanding of their habitat range and migration behavior. In the
case of marine mammals, specifically baleen whales (mysticetes), many populations
exhibit complex migration patterns that can be examined at multiple spatial and temporal
resolutions. At large spatial (1000s of km) and temporal (annual) scales, several
mysticete species feed in the productive coastal waters of the North Atlantic during the
spring and summer months, and then migrate to lower latitudes for calving during the
winter (Bowen and Siniff 1999). At smaller spatial (100s of km) and temporal (seasonal)
scales, baleen whales often migrate between habitat areas within a "feeding ground"
(Kraus et al. 1986, Winn et al. 1986, Clapham 2000). Although observational studies
have given much insight into the migration behavior of whales at both of these spatial
and temporal scales, the movement of these animals at even finer scales has been difficult
to resolve.

19
While the basin-scale variation in North Atlantic stable isotope ratios can be
exploited to examine the high-low latitude migrations of baleen whales, it is unclear if
there is enough variation between individual seasonal feeding habitats for resolving the
movement patterns of cetaceans at smaller spatial/temporal scales with stable isotopes.
The zooplanktivorous North Atlantic right whale (Eubalaena glacialis) and its foraging
habitats in the Gulf of Maine (northwest Atlantic) were used as a system with which to
examine the utility and limitations of stable isotope analysis as a method to study baleen
whale migration. This dissertation chapter describes an investigation of the carbon,
nitrogen, oxygen, and hydrogen stable isotope landscape present in zooplankton collected
from several regions, including known right whale seasonal feeding habitats, within the
Gulf of Maine.
Study Area
The Gulf of Maine (GoM), a semi-enclosed continental shelf sea situated between
the northeastern United States and southwest Nova Scotia (Fig. la), is the primary
feeding ground for North Atlantic right whales (Winn et al. 1986). The majority of the
right whale population migrates between several habitats within the Gulf from the late
winter to early fall (March - October). Right whales feed exclusively on zooplankton,
primarily Calanus finmarchicus, a calanoid copepod which dominates the zooplankton
biomass in the North Atlantic (Meise and O'Reilly 1996). Specifically, right whales
target fifth stage C. finmarchicus copepodites (C5) and their occupation of seasonal
habitats within the GoM often coincides with peak C5 abundance (Baumgartner et al.

2007). C5s are known to sequester lipids in a membrane-bound oil sac in preparation for
a resting state known as diapause (Hirche 1996). The oil sac becomes larger as lipids
accumulate, and the sac can eventually fill to over half of the volume of a copepod's
body (Miller et al. 1998). Zooplankton samples collected near feeding right whales in
several habitats within the GoM have been near mono-specific C. finmarchicus and they
represent a significant caloric energy source (Murison and Gaskin 1989, Wishner et al.
1995, Baumgartner et al. 2003, Michaud and Taggart 2007).
The average bottom depth in the GoM is 150m, while several basins exceed
200m. These basins are relatively isolated from one another below the 200m isobath
(O'Reilly and Zetlin 1998). Numerous shoals and banks restrict flow between the GoM
and the greater North Atlantic, thereby making the GoM a nearly self-contained
oceanographic system (Townsend 1998). The prevailing currents move counterclockwise
around the Gulf. This circulation pattern is driven by shallow freshwater inputs, the
advection of deep water through the Northeast Channel, and amplified tides (Garrett et al.
1978, Smith 1983, Butman and Beardsley 1987). Shallow water entering the GoM is
composed of freshwater originating from the Gulf of St. Lawrence (which flows in over
the Scotian Shelf) and run-off from numerous rivers in Maine and the Bay of Fundy
(Smith et al. 2001). Slope water is the primary deep water mass that enters the Gulf
through the Northeast Channel, at depths greater than 100m (Brooks 1985). This
circulation scheme may establish differences in the stable isotope signatures specific to
"upstream" vs. "downstream" sub-regions within the GoM.
21
The Gulf of Maine is also situated in a highly dynamic oceanographic transition
zone (MERCINA 2001), resulting in physical and biological variability at multiple
temporal scales. At relatively long temporal scales (decadal to inter-annual), circulation
into the GoM is associated with fluctuating climatic modes such as the North Atlantic
Oscillation (NAO, Greene and Pershing 2003). Changes in the relative contribution of
slope water sources (Warm Slope Water, WSW vs. Labrador Slope Water, LSW) to the
GoM have been associated with phase changes in the NAO such that during positive
NAO phases, relatively warm and salty WSW enters the Gulf through the Northeast
Channel, while colder and fresher LSW dominates the deep water inflow in during
negative NAO phases (Greene and Pershing 2003).
The dominant slope water source to the GoM may result in differential advection
of C. finmarchicus into the Gulf (MERCINA 2004). A recent decrease in the abundance
of C. finmarchicus, from 1996 - 2000, has been attributed to a sudden drop in the NAO
Index and associated changes in slope water inputs to the GoM (Greene and Pershing
2000). Additionally, variable contributions of warm/salty or cold/fresh slope water may
establish oceanographic conditions that cause differential survival of other zooplankton
species (MERCINA 2001). Significant changes in zooplankton community composition
resulting from variable slope water input could influence the year-to-year stable isotope
data collected in each habitat area, especially if the community is altered in such a way
that trophic dynamics or the relative trophic level of the zooplankton changes.
At shorter temporal scales (months to weeks), stable isotope values of GoM
zooplankton may be affected by events that change the balance of nutrients available to

22
the food web. These include pulses of new nutrients to the upper ocean, such as
increased river runoff, upwelling mixing processes, anthropogenic inputs, and changes in
nitrogen sources/sinks (Townsend 1998, McMahon et al. in press.). Given the dynamic
nature of the GoM, temporal variation in stable isotope ratios of zooplankton should be
expected.
Study Aims
The aims of the study were (1) to characterize the extent of spatial variation in
carbon, nitrogen, oxygen, and hydrogen stable isotope ratios within GoM zooplankton
and (2) to describe temporal stability of habitat-specific zooplankton stable isotope values
at inter-annual scales.
MATERIALS AND METHODS
Field Sampling
Net tows to collect zooplankton were conducted at seven sites in the northwest
Atlantic, including several known right whale feeding habitats: Cape Cod Bay, Great
South Channel, lower Bay of Fundy, Roseway Basin, Nova Scotian Shelf, the northeast
peak (NE) of Georges Bank, and Jeffreys Ledge (Fig. la). The sampling plan was
designed to incorporate ecological parameters relevant to North Atlantic right whales,
since the results of this study will be used to inform an investigation into right whale
migration using stable isotope analysis. Tows for zooplankton were linked spatially and
temporally with right whale occupation of each area. Furthermore, zooplankton samples
23
were collected with dual 333 urn mesh nets, which best replicate the capture efficiency of
right whale baleen (Mayo et al. 2001).
At six sites (Great South Channel, lower Bay of Fundy, Roseway Basin, Nova
Scotian Shelf, NE Georges Bank, and Jeffreys Ledge), double oblique tows were
performed using dual nets mounted on 61 cm diameter bongo frame A Seabird model
SBE19 conductivity-temperature-depth instrument (CTD) was affixed to the tow wire
approximately 1 m above the bongo nets to relay the sampling depth back to the research
vessel in real time. A General Oceanics helical flowmeter was mounted at the center of
each bongo to estimate the volume of water filtered during the tow. The nets were
lowered at 0.50 ms"1 to near bottom (within 5 m) and then hauled in at 0.33 ms"1. The
research vessel steamed at 1.5-2.0 knots during the tows. Once on deck, all nets were
rinsed into a sieve, and zooplankton were gently removed from the screen. The contents
from one net were placed into 50 ml Nalgene jars, which were subsequently frozen. The
contents from the second net were preserved in a 10% borate-buffered formalin seawater
solution and were archived for later sorting and enumeration.
In addition to the sampling described above, five tows in the Great South Channel
(3 in 2005,2 in 2006) were collected via a single oblique tow to near bottom with a 0.25
m2 multiple opening-closing net and environmental sensing system (MOCNESS, Wiebe
et al. 1976) outfitted with 150 um mesh nets. Once on deck, the nets were rinsed and the
concentrated zooplankton were removed from the mesh in the cod end. These samples
were placed into 50 ml Nalgene jars, which were subsequently frozen.

24
In order to sample from within the most likely right whale prey field, surface tows
were conducted in Cape Cod Bay as right whales primarily exhibit skim feeding behavior
(Mayo and Marx 1990). These tows were collected with a single 333 urn net mounted on
a 30 cm diameter metal ring. The net was towed behind the research vessel at
approximately 2 knots for 5 minutes. Once on deck, all nets were rinsed into a sieve, and
zooplankton were gently removed from the screen. The net contents were placed into 50
ml Nalgene jars, which were subsequently frozen.
Zooplankton samples were collected opportunistically in each habitat area, often
in conjunction with other research institutions. This resulted in uneven sampling
coverage of each habitat area. Zooplankton collections that took place between 1998-
2001 are referenced from an existing thesis (Wetmore 2001), no collections occurred
from 2002-2003, and samples from 2004-2007 were collected specifically for this study.
Laboratory Techniques
The samples from each tow were packaged in aluminum foil and dried at 60-80°C
until sufficiently desiccated (after approximately 5 days). Each dried sample was then
homogenized with a mortar and pestle, and the resulting powder was stored at room
temperature in a sterile glass vial. Prior to carbon (813C) and nitrogen (815N) isotope
analysis, 0.8-1.2 mg of each sample was packaged into a 4 X 6 mm tin capsule and
crimped shut. All samples were sent to a stable isotope laboratory for 813C and 815N
analysis (1998-2001 samples to the Boston University Stable Isotope Laboratory; 2004-
2007 samples to the University of California Davis Stable Isotope Facility).

25
The samples were loaded into an autosampler and analyzed using an elemental
analyzer interfaced to an isotope ratio mass spectrometer (IRMS). Instrumentation at the
Boston University laboratory included a Fisons NA1500 elemental analyzer and Finnigan
Conflo II interfaced to a Finnigan Delta S IRMS. Instrumentation at the UC Davis
laboratory included a PDZ Europa ANCA-GSL elemental analyzer interfaced to a PDZ
Europa 20-20 IRMS. Each sample was pyrolyzed into CO2 and N2 gas and then
separated on a gas chromatograph (GC) column. The gases were conveyed to the IRMS
with a continuous flow of helium carrier gas. Each sample isotope ratio was compared to
a secondary gas standard, whose isotope ratio had been calibrated to international
standards (PeeDee Belemnite (PDB) for 813C, Craig 1957; and atmospheric nitrogen (N2)
for 815N, Mariotti 1985).
The total C and N content of each sample were reported along with stable isotope
data. C:N ratios and % C and N were calculated from the reported measurements of total
C and N content in each sample.
Prior to oxygen (5180) and hydrogen (deuterium, 8D) isotope analysis, 0.45-0.55
mg of each sample was weighed and packaged in duplicate into 3.5 X 5 mm silver
capsules and crimped shut. All samples were sent to the University of California Davis
Stable Isotope Facility for analysis. In order to control for issues related to hydrogen
atom exchange, our samples were "air equilibrated" with ambient laboratory air moisture
for 2 weeks prior to combustion (Wassenaar and Hobson 2003, Bowen et al. 2005a).
After this incubation, samples were analyzed using a Heckatech HT Oxygen Analyzer
interfaced to a PDZ Europa 20-20 IRMS. Samples were combusted to CO and H2O, and

26
separated chromatographically, as described above. Each sample isotope ratio was
compared to a secondary gas standard, whose isotope ratio had been calibrated to the
international standard Vienna Standard Mean Ocean Water (VSMOW, Coplen 1994).
All samples are reported relative to international reference standards: carbon
isotope values relative to PDB, nitrogen values relative to N2, and oxygen and hydrogen
values relative to VSMOW. Stable isotope measurements are expressed in standard delta
(8) notation, as parts per thousand (per mil, %6), by the following:
513C, 815N, 5180, or SD (%o) = [(R^mpfe/Rw^H] X 1,000
where Rsampie and Rstamhrd are the ratios of 13C/12C, 15N/14N, 180/160, or W H of the sample
and standard, respectively (McKinney et al. 1950).
Analytical precision was determined with laboratory working standards of
glycine (513C and 515N), cellulose (5I80), and polyethylene (SD), which were analyzed
after every 12 zooplankton samples. These standards were calibrated against NIST
Standard Reference Materials. Precisions based on the standard deviation of the series of
reference checks used in the analysis are as follows: 513C (0.05%o); 815N (0.20%o); 8180
(0.43%o); and 8D(4.0%o)3.
To control for issues related to hydrogen atom exchange (Bowen et al. 2005a), all
sample hydrogen isotope measurements were corrected relative to a laboratory standard,
3 These measurements of precision apply to samples collected from 2004-2007, analyzed at the UC Davis Stable Isotope Facility. Samples collected between 1998 and 2001 were analyzed at the Boston University Stable Isotope Laboratory, which reports an analytical precision of < 0.1 %o for carbon and nitrogen isotope measurements.

27
bowhead whale baleen (BWB2, -105%c). This standard was calibrated against NIST
Standard Reference Materials. One BWB2 sample was run for every 24 zooplankton
samples.
Data Analysis
813C data were lipid normalized to examine the potential confounding effect of
variable lipid content in our samples, as lipids are depleted in 13C relative to proteins
(DeNiro and Epstein 1978). The data were corrected by C:N ratio, which is positively
correlated with lipid content (Schmidt et al. 2003). The following equations were used to
determine a lipid normalized 813C value for each zooplankton sample (813CLN).
L = 93 / [1 + (0.246 C:N - 0.775)1]
813CLN(%O) = 813Craw (%0) + D [-0.207 + 3.90 / (1 + 287 / L)]
where L is a calculation of tissue lipid content, D is the isotopic difference between lipid
and protein (estimated at 6 %o) and 813Craw refers to uncorrected 813C data (McConnaughey
and McRoy 1979).
Statistical analysis was conducted with JMP IN software for Windows.
Zooplankton stable isotope and C:N ratios were compared using one-way ANOVA
coupled with Tukey-Kramer HSD post hoc tests or Student's t-tests. Differences in
zooplankton stable isotope and C:N ratios among all habitat areas, as well as differences
between years within individual habitats were examined.

28
Referenced Datasets
The NASA Global Seawater Oxygen-18 Database
(http://data.giss.nasa.gov/ol8data/, Schmidt et al. 1999) was referenced in order to
investigate trophic fractionation of oxygen isotopes from seawater to zooplankton. Data
associated with seawater samples collected near the Gulf of Maine were acquired from
this database, and then compared to zooplankton collected in the Gulf.
RESULTS
The stable isotope ratios of 128 zooplankton tows, collected at seven distinct sites
from 1998-2007, were examined in this study (Table 2.1, Fig. 2.1b). The areas identified
as seasonal right whale habitats (Cape Cod Bay, Great South Channel, Bay of Fundy, and
Roseway Basin) received multi-year sampling coverage, while other areas (Nova Scotian
Shelf, NE Georges Bank, and Jeffreys Ledge) were sampled with less frequency. The
stable isotope values of samples from all collection habitats/years ranged from -26.86 to -
19.46%0 (513Gaw), -25.15 to -18.13%0 (813CLN), 4.56 to 10.35%o (815N), 15.07 to 31.55%o
(8180), and -183.06 to -101.32%0 (5D).
Lipid Content and Normalization
Zooplankton C:N ratios from all habitats/years ranged from 3.37 to 11.68, and
significant differences between regions were measured (one way ANOVA, F = 3.36, p =
0.004, Table 2.2). Bay of Fundy zooplankton had higher C:N ratios than Nova Scotian

29
Shelf zooplankton, and all other areas were statistically indistinguishable. After lipid
normalization, zooplankton 513CLN values were enriched relative to S13Craw values in cases
where the C:N ratio was > 4 (98% of all cases). 813CLN were depleted relative to 513Craw in
3 cases, where the sample C:N ratio was < 4 (denoting a lower than normal lipid content
of the sample, McConnaughey & McRoy 1979). The difference between 813CLN and
813Crawwas positively related to C:N ratio (Fig. 2.2).
Inter-annual variation in zooplankton C:N ratios within each habitat area were
examined, and Cape Cod Bay (one way ANOVA, F = 3.87, p = 0.044), the Bay of Fundy
(one way ANOVA, F = 41.43, p = < 0.0001), and Roseway Basin (one way ANOVA, F =
17.23, p = 0.0008) exhibited statistically different values between collection years (Table
2.3, Appendix 1).
Spatial Variation
Data from multiple sampling years, within each habitat area, were pooled to
identify regional 813Cnw, S13CLN, 815N, 8180, and 8D signatures. There were significant
differences in zooplankton stable isotope values between several regions sampled (Table
2.2). Zooplankton 813C values from Cape Cod Bay, the Great South Channel and the Bay
of Fundy were statistically different (one way ANOVA, 813Gaw: F = 11.94, p < 0.0001;
S13CLN: F = 15.89, p < 0.0001; Fig. 2.3). Roseway Basin, Nova Scotian Shelf, and NE
Georges Bank 813C values were indistinguishable from Great South Channel/Bay of
Fundy (however, note that the zooplankton S13Craw of the Nova Scotian Shelf was grouped
with the Bay of Fundy while 813CLN was grouped with Great South Channel/Bay of

Fundy, Fig. 2.3). Jeffreys Ledge 8 C was statistically indistinguishable from all habitats
areas (Fig. 2.3). There were no differences in the zooplankton 815N values among all
habitats sampled (one way ANOVA, F = 1.36, p = 0.24, Fig. 2.3). 5180 values in Great
South Channel were significantly lighter than those in Cape Cod Bay/Bay of
Fundy/Roseway Basin/NE Georges Bank, while those from Jeffreys Ledge were
indistinguishable from all other habitats (one way ANOVA, F = 7.07, p < 0.0001, Fig.
2.4). SD values in the Great South Channel/NE Georges Bank were statistically different
than the Bay of Fundy, while Roseway Basin was similar to all areas sampled (one way
ANOVA, F = 6.92, p = 0.0004, Fig. 2.4). These data are also presented as color contour
maps, which illustrate the interpolated spatial variation of stable isotope and C:N ratios
across the entire GoM (Fig. 2.5a-f).
Oxygen Fractionation
The mean of GoM seawater 8180 values referenced for this study was -1.2%o (n =
22, SD = 0.6), while the mean of GoM zooplankton 6180 values was 21.7%o (n = 58, SD
= 3.1). The net trophic enrichment (518OzooPiankton - 8180seawater) for this system was 22.9%o
(Table 2.4).
Temporal Variation
The inter-annual variation in zooplankton stable isotope values was examined in
habitats where multiple years of sampling occurred, and statistically significant
differences between years existed in multiple habitat areas (Table 2.3). Comparisons of

31
the zooplankton 513Gaw values show inter-annual differences in Cape Cod Bay (2001 >
2006), the Bay of Fundy (2000 > 1999,2006 > 2005) and Roseway Basin (1998 > 1999 >
2000,2005) (Tables 2.1,2.3). When lipid-normalized 813CLN data were examined, only
the Bay of Fundy and Roseway Basin isotope values were significantly different among
collection years. Zooplankton 815N values were also significantly different among
collection years in the Great South Channel4 (2006 > 2007) and the Bay of Fundy (1999,
2005 > 2000,2006), while all other habitat-year combinations were statistically
indistinguishable (Tables 2.1,2.3). Zooplankton 8180 values were significantly different
among collection years in the Great South Channel (2005,2006 > 2007) and the Bay of
Fundy (2005 > 2006), while all other habitat-year combinations were statistically
indistinguishable (Tables 2.1, 2.3). For the majority of isotope-habitat-year combinations
described in this study (12 of 21 cases), annual variability in zooplankton 813C, 815N,
8I80, and 8D stable isotope signatures within each habitat area was statistically
insignificant (Tables 2.1,2.3). For further examination, the habitat-specific zooplankton
stable isotope data is shown graphically in Appendix 1.
DISCUSSION
Zooplankton Lipid Content
High lipid content (proxied by C:N ratios) depletes whole animal 813C values and
may be a confounding factor in isotope studies of zooplankton, which are known to
change their lipid content seasonally (Matthews and Mazumder 2005). An examination
4 Samples collected from the Great South Channel during 2004 (n = 1), although represented graphically, were omitted from statistical comparisons of temporal variation.

of the spatial distribution of lipid content in GoM zooplankton demonstrated that
zooplankton in most habitats sampled have similar mean C:N ratios (Table 2.2).
Zooplankton in the Bay of Fundy have C:N ratios that are significantly higher than those
from the Nova Scotian Shelf, while all other areas were statistically indistinguishable
from either of these two habitats. This is presumably because lipid-rich C5 Calanus
finmarchicus (in diapause) were more abundant in Bay of Fundy habitat, as compared to
the Nova Scotian Shelf. When examining inter-annual patterns within individual habitat
areas, significant variability existed in habitats that were sampled over the longest time
intervals. The Bay of Fundy and Roseway Basin habitats were both sampled in the late
1990s and then again in the mid-2000s. The samples in these areas, collected in 1998-
2000, had significantly lower C:N ratios than those collected in 2005-2006 (Tables 2.1,
2.3). These measurements coincide with an observed decrease in the abundance of the
usually dominant copepod, Calanus finmarchicus, during the late 1990s followed by a
subsequent increase in the early 2000s (Greene et al. 2003). Abundance data from
Continuous Plankton Recorder surveys in the North Atlantic suggest that less lipid-rich
copepod genera (i.e. Oithona spp., Centropages spp., and Pseudocalanus spp.) increased
in the late 1990s (Pershing et al. 2005), and the water column C:N ratio (as measured in
the tows collected for this study) decreased accordingly during this event.
Carbon Isotopes
Cape Cod Bay, Great South Channel, and the Bay of Fundy have statistically
different 513C isotope signatures, while other habitats are statistically similar to these

33
three areas (Fig. 2.3). The differences between these regions remain after the data are
lipid-normalized, suggesting that the habitats are characterized by different isotope
source values and/or biological parameters which result in diverging stable isotope
signatures.
Dissolved inorganic carbon (DIC) is the carbon isotope source for marine food
webs. Following a basin-wide survey, Kroopnick (1985) reported a paltry (~ \%o) range
of variation in 513C values of dissolved inorganic carbon (813CDIC) throughout the
Atlantic. This observed lack of spatial variation is reasonable considering that 813CDIC is
derived from the ubiquitous, well-mixed stable isotope signature of atmospheric CO2 (via
the equilibrium exchange of between the atmosphere and surface ocean (Sharp 2007).
While we cannot discount that variation in GoM 813CDIC might contribute to the observed
spatial separation between Cape Cod Bay, Great South Channel, and the Bay of Fundy, it
is unlikely that variations in isotope source value alone could explain the 1.36-3.2 l%o
differences measured between the regional 813C values of the three habitats.
Rather than spatial variation in carbon isotope source values, the differences in
GoM regional zooplankton 813C values are likely influenced predominately by biological
characteristics of local plankton assemblages. In contrast to the distribution of 813CDIC,
phytoplankton 813C values show significant spatial variability and generally decrease with
increasing latitude (Rau et al. 1982, Goericke and Fry 1994). As phytoplankton utilize
DIC during photosynthesis, several temperature, [CO2] "aq, or species dependent processes
fractionate the 813C DIC source, ultimately resulting in phytoplankton bulk 813C values.
(Hinga et al. 1994, Laws et al. 1995). Net primary production and cell growth rates

34
influence 813C, and higher plankton 813C values are found in coastal regions, especially in
upwelling areas or during phytoplankton blooms (Fry and Wainright 1991, Schell et al.
1998, Burton and Koch 1999). Inshore-offshore gradients also exist, since nearshore
waters are typically 13C enriched as a result of higher nutrient concentrations, greater
overall productivity and inputs from 13C-heavy benthic macrophytes, while pelagic waters
are 13C deplete from less nutrient availability, lower productivity and slower
phytoplankton growth rates (Kelly 2000, Rubenstein and Hobson 2004). The regional
513C values of the three regions in this study exhibit the inshore-offshore phenomenon:
Cape Cod Bay (the shallowest, most inshore habitat) has the highest 813C value, the Bay
of Fundy (which contains a deep basin, yet is near the coast) is intermediate, and the
Great South Channel (the furthest offshore habitat) has the lowest 813C value (Fig. 2.5c-
d).
Characteristics such as plankton species composition could also cause the 813C
value of habitats within the GoM to differentiate regionally. At the level of
phytoplankton, for example, fast-growing species such as diatoms typically have higher
S13C signatures as compared to other species (Fry and Wainright 1991). In this study,
given that zooplankton samples were collected from each habitat area in different
months, different phytoplankton species could have been supporting each local food web.
For example, tows from Cape Cod Bay (collected in March) may have been supported to
a larger extent by spring blooming diatoms, while tows from the Bay of Fundy (collected
in August) may have been supported by dinoflagellates which typically become abundant
after the spring bloom (Tiselius and Kuylenstierna 1996). The zooplankton community

35
likely differed between the three major habitat areas, specifically those of Cape Cod Bay
vs. Great South Channel/Bay of Fundy. During the late winter and early spring,
zooplankton in Cape Cod Bay is characterized by a mixed community including
Pseudocalanus spp., Centropages typicus, and C. finmarchicus (Costa et al. 2006). The
abundance of C. finmarchicus in my samples from Cape Cod Bay (collected in March)
was relatively low, with this species comprising only 0-17% of the community (D.
Osterberg and M. Bessinger, unpublished data). In contrast, C. finmarchicus dominated
the samples collected from the Great South Channel (in April/May) and the Bay of Fundy
(in August). Tows collected in the Bay of Fundy contained 45-92% C. finmarchicus
(Baumgartner et al. 2003). Changes in species composition between habitat areas may
therefore explain a component of the variation in 813C.
Nitrogen Isotopes
No significant spatial variation was measured in the nitrogen stable isotope values
of zooplankton collected at seven sites in the GoM (Table 2.2, Fig. 2.3). Given that
nitrogen isotopes are a robust indicator of trophic position (Michener and Schell 1995),
these data confirm that similar trophic levels were sampled in each habitat. There were
significant differences in 8I5N values between years in the Great South Channel and Bay
of Fundy (Tables 2.1, 2.3), though these differences were not consistent between the two
habitats. Sampling effort overlapped in these areas in 2005 and 2006, and in Great South
Channel zooplankton 815N values were statistically equivalent in these two years, while
Bay of Fundy zooplankton 815N was greater in 2005 than in 2006. This suggests that

36
local physical or biological characteristics in each habitat resulted in inter-annual 815N
differences. These parameters likely included differences in phyto- or zooplankton
community composition, or local fluctuations of nitrogen sources and sinks (McMahon et
al. in prep.).
Oxygen Isotopes
Oceanic 8180 is affected by the same processes as salinity - including
evaporation, precipitation, advection, mixing, and river runoff - and 8180 has a positive
linear correlation with salinity (Craig and Gordon 1965). Oxygen isotope values of ocean
water reflect a mass balance between these processes (Houghton and Fairbanks 2001,
Benway and Mix 2004). In this study, zooplankton S180 values separated into two
distinct statistical groups, the Great South Channel and Cape Cod Bay/Bay of
Fundy/Roseway Basin/NE Georges Bank, with values from the Great South Channel
being significantly lower than other areas (Figs. 2.4, 2.5e). The isotope separation of the
Great South Channel from the other habitats is likely due to the formation of a seasonal
low-salinity surface plume, derived from spring run-off, which forms off of Cape Cod
and moves to the Great South Channel each spring (Wishner et al. 1995). An increase in
low-salinity water would reduce the regional source 5180 value, thereby tagging
phytoplankton and zooplankton within the Great South Channel with lower 8180 values.
The transfer pathways of oxygen isotopes from seawater to animal tissue is not
well understood, and little information is available regarding the trophic fractionation of
8180 or 8180 variation in animal protein (Koch 2007). Animals (here, zooplankton) could

37
acquire their 5180 value from ambient seawater, from their diet (here, primarily
phytoplankton), or from a combination of both sources. Schmidt et al. (1997) report 8180
values of 30.4%o for diatoms collected in Norwegian-Greenland Sea, with surface water
values being ~ 0.1-0.5%o (Schmidt et al. 1999). Similarly, large enrichments (~ 26%o)
have been reported in the cellulose of submerged aquatic plants, relative to ambient
seawater (Cooper and DeNiro 1989). Zooplankton collected for this study in the GoM
show an enrichment over seawater of a similar magnitude (22.65%o, Table 2.4), which
suggests that after the isotope fractionation between phytoplankton and seawater, there is
little trophic fractionation between zooplankton and phytoplankton.
Hydrogen Isotopes
The physical and chemical processes that affect the spatial distribution of marine
oxygen isotopes similarly affect hydrogen isotopes, but result in variability at larger
scales (McMahon et al. in prep.; Figs. 2.4, 2.5f). Despite the co-variance of meteoric
oxygen and hydrogen stable isotope values, the zooplankton SD values measured in the
GoM show different spatial patterns than those observed for zooplankton 8180. Bay of
Fundy/Roseway Basin zooplankton are significantly lighter than zooplankton from the
Great South Channel/NE Georges Bank (Figs. 2.4, 2.5f). The 8D data conform to the
expected spatial structure of surface ocean hydrogen isotopes: a general pattern of lower
values at higher latitudes (Englebrecht and Sachs 2005). The lower SD values observed
over the Nova Scotian Shelf are also expected, as this is where low-salinity water,
derived from the Gulf of St. Lawrence, enters the GoM.

The lack of consistency between 5D and 5 O is puzzling, given the similar
physical and chemical mechanisms that establish each source value. Given that
fractionation and trophic transformation of both isotopes are not well understood in
mammals (Koch 2007), it is difficult to resolve the lack of consistency between
zooplankton 6D and 8180 ratios. While questions regarding the metabolic
transformations of SD and 8180 were beyond the scope of this study, the data produced
here demonstrate a need to further explore trophic fractionation as a potential
confounding factor to animal migration studies with stable isotopes.
CONCLUSIONS
Previous studies have utilized stable isotope ratios in large whale baleen to
examine annual movement patterns, but the spatial and temporal scope of these studies
has been limited to broad-scale movements between summer/winter grounds. Finer scale
tracking of habitat use (i.e. movement between areas within the spring/summer feeding
season) have not been reported. The goal of this study was to describe the isotope
landscape of the Gulf of Maine, through analysis of zooplankton, to determine if high
resolution migration tracking is possible with this method.
To test the spatial and temporal variation of the stable isotope landscape in the
Gulf of Maine, carbon, nitrogen, oxygen, and hydrogen stable isotope ratios were
measured in zooplankton collected from several sites within the Gulf of Maine. Of the
seven habitats investigated, three areas (Cape Cod Bay, Great South Channel, and the
Bay of Fundy) represented isotopically distinct habitats, and these differences were more

39
pronounced by examining multiple isotopes. The results of this study demonstrate that
habitat-specific zooplankton isotope values can be differentiated within the Gulf of
Maine feeding ground. However, inter-annual temporal variation was present in many
habitats, which was greater than the differences between mean regional isotope values in
some areas. This points to the need to temporally couple animal and diet/environmental
isotope measurements when conducting stable isotope investigations of animal migration
for accurate assessments of habitat use. The results of this study suggest the stable
isotope landscape of the Gulf of Maine, while not ideal for tracking higher resolution,
intra-seasonal movements, does contain spatial differences that should be transferred to
right whales as they feed in and move between habitat areas.
ACKNOWLEDGEMENTS
The officers and crew of the NOAA Ships Albatross TV and Delaware II and the
R/V Tioga assisted with the logistics of sample collection. Chris Tremblay, Fred Wenzel,
Richard Pace, Andrew Westgate, Zach Swaim, David Osterberg, Mason Weinrich, Jon
Hare, Jerry Prezioso, Maureen Taylor, Tamara Davis, and Melissa Patrician provided
field assistance. David Harris and Robert Michener oversaw stable isotope analysis.
Sara Wetmore, Joseph Kane, Joseph Montoya, Dave Osterberg, Moriah Bessinger,
Charles Mayo, and Julie Finzi provided unpublished data. Chris Linder wrote the
MATLAB program used to create the color contour maps. Brian Buczkowski and Kelton
McMahon assisted with cartography. Mark Baumgartner assisted with sample collection
and provided advice on statistical analysis and computer programming.

Table 2.1: Overview of Zooplankton Tows. Tow locations, year/month of collection,
and sampling frequency of zooplankton within right whale foraging habitats. C:N and
stable isotope ratios are presented as annual mean ±1 SD for each habitat/year
combination. (--) denotes no data. Habitat codes are as follows: Cape Cod Bay (CCB);
Great South Channel (GSC); Bay of Fundy (BoF); Roseway Basin (RB); Nova Scotian
Shelf (NSS); Northeast Georges Bank (NE GB); Jeffreys Ledge (JL).

41
O 00
I / )
2
S5
!
!
•* m. °°. © co © +1 +1 +1
CO N0 O ON *-- © ' ^ N M
bq rt NO t -n o o o fc» o o o P N N M
0 0 r^
•
d ^H
+1
CS
-*
NO +1 co NO
0 0 - H
d d +1 +1
0 0 CO cs • * cs cs
25.2
o <N
+1 • * .
^ CS
i n ^ H
+1 00 ON
en r--
+1 NO r^
*
r^ cs +1
in 0 0 CS
^f cs' +1
CO CS-
CM
+1 00 ON NO
d +1
CO in cs
0 0 ^ >0 ON ^ CO ON CO • * CO CM
c c
I15-* < s f t a §> « ^
§3 i t 3 - 3 > < f <
ts « | a
a a ^ a 3 3 - 3 < < f <
to §b
a3 3 . "3
cs
+1 in
^ cs' +1 , -f '
cs
CO cs +1 CO cs' cs
r f ON • "
d ~ o +1 +1 +1
• i oo m r-~ t-^ oo'
r- o \ r-
ro ° ' ° ' °' ^ +1 +1 +1 ON " * q t~ od t~
O N -*f i n • *
d d d d +1 +1 +1 +1
NO oo "*f cs od r~ ON od
«-) 0 0 CN • *
-H' d d d +1 +1 +1 +1
0 0 ON CO NO od od r- ON
NO CN * - H * - H
+1 +1 00 CS r~ od
N O • *
d d +1 +1
cs - f od r~
CO cs +1
r-r~
P-; NO —;
3 ° *7i cs • * • * r-.
' CO CS- CS cs cs cs
NO CO CO CO © o d d +1 +1 +1 +1
r- ON r- - f
cs cs cs cs
- • * T f M o d d © +1 +1 +1 +1
t - ; t - ; i n CS cs d co cs' CS CS CNI CS
CS CO
-H d +1 +1
T-H O N
cs — cs cs
o m - H d +1 +1
ON NO - H ' CS' cs cs
r-d +1
CO
cs
in NO -H d co d +1 +1 +1 in co q d co —< cs cs cs
oo Tf in
5 *+) +i +1 cs co ON •* 1 in co •*'
CS CS CS
ON co co r--d d d d +1 +1 +1 +1
- H ON 0 0 t~-CO - H ^ CO CS CS CS CS
CS CO Tf - H
d d d d +1 +1 +1 +1 —< cs •* q co cs •*' in cs cs cs cs
CO f--5 d +1 +1 00 ON CS CS cs cs
oo r-—' d +1 +1 q ON T f CO
cs cs
~-» ~* +1 in cs cs
t-~ r- ON
o d d +1 +1 +1
- * i n cs in NO i n
O N O N ON
in °" °* °' l} +1 +1 +1 <=>. ~. •*. r~ NO NO'
in co ° i r-d © ° -+1 +1 +l +1
O N CS " ^ CO i n i n JIJ od
CS • * CO ~
d - ; © 7; +i +i +i +l
CO CO -H "*.
•=f NO in 2
NO i n
d d +1 +1 r-; cs • * i n
CS NO
cs' d +1 +1 oo r-r~* i n
CO ^f •H r-NO
• * i n NO r~ O O O Q
.w O O O O NJ CS CS CS CS
O N O in NO ON O O O
M- ON O O O - H CS CS CS
o g 00 ON Q in ON ON O O ON ON O O —i -* CS CS
05 oo a r/N ON ON rS ON ON C H *-H I—(
ft
pa a g o e s s
-1 S CS

Tab
le 2
.2:
Spat
ial V
aria
tion
in G
ulf
of M
aine
Zoo
plan
kton
Sta
ble
Isot
ope
Rat
ios.
Res
ults
of
one-
way
AN
OV
A t
ests
(F
ratio
and
p va
lue)
exa
min
ing
the
diff
eren
ces
betw
een
the
zoop
lank
ton
stab
le is
otop
e va
lues
(m
ean
± 1
SD)
from
eac
h ha
bita
t ar
ea
sam
pled
(a
= 0
.05)
. (-
) in
dica
tes
no d
ata.
Hab
itat
code
s ar
e as
fol
low
s:
Cap
e C
od B
ay (
CC
B);
Gre
at S
outh
Cha
nnel
(G
SC);
Bay
of
Fund
y (B
oF);
Ros
eway
Bas
in (
RB
); N
ova
Scot
ian
Shel
f (N
SS);
Nor
thea
st G
eorg
es B
ank
(NE
GB
); J
effr
eys
Led
ge
(JL
).
Reg
ion
C:N
513
Cr
CC
B
GSC
B
oF
RB
N
SS
NE
GB
JL
n 18
32
32
12
20
8 3
Mea
n ±
1 SD
5.
6 ±
0.8
6.3
± 1.
0 6.
8 ±
2.2
6.2
± 2.
3 5.
0 ±
0.6
6.8
± 1.
9 6.
7 ±
4.3
F 3.36
P
0.00
4
n 18
32
32
12
20
8 3
Mea
n ±
1 SD
-2
1.2
± 2.
0 -2
4.4
±1.
4 -2
3.0
±1.
1 -2
3.4
±1.
1 -2
3.1
± 1.
1 -2
4.0
±1.
2 -2
2.5
±1.
1
11.9
4 <
0.0
01
n 18
32
32
12
20
8 3
51
3C
LN
Mea
n ±
1 SD
-1
9.9
±1.
7 -2
2.8
±1.
1 -2
1.3
±0.
5 -2
2.2
±1
.2
-22.
0 ±
0.9
-22.
2 ±
0.8
-21.
3 ±
0.7
F
15.8
9
P
< 0
.001
Reg
ion
CC
B
GSC
BoF
RB
NSS
N
EG
B
JL
815N
n M
ean
± 1
SD
18
32
32
12
20
8 3
7.7
± 0.
9
8.0
±1
.0
8.3
± 0.
8
8.6
±1
.1
8.0
±1.
3
7.8
± 0.
6 7.
7 ±
2.3
1.36
0.
238
6 32
12
2 4 2
8lsO
Mea
n ±
1 SD
23.3
± 1
.0
20.1
±2
.2
23.8
± 3
.7
25.3
± 0
.4
24.4
± 2
.4
22.3
± 2
.6
7.07
<
0.0
01
9 3 2
8D
Mea
n ±
1 SD
-139
.4 ±
12.
5
-176
.3 ±
6.7
-169
.8 ±
3.0
-135
.4 ±
24.4
F 6.92
0.
004

43
Table 2.3: Temporal Variation of Gulf of Maine Zooplankton Isotopes. Results of one
way ANOVA tests examining the differences between zooplankton stable isotope values
among years within individual habitat areas. Gray boxes highlight significant
relationships (a = 0.05), (-) indicates no data. *Student's t-tests were performed when
only 2 years of data were available. Habitat codes are as follows: Cape Cod Bay (CCB);
Great South Channel (GSC); Bay of Fundy (BoF); Roseway Basin (RB); Nova Scotian
Shelf (NSS); NE Georges Bank (GB); Jeffreys Ledge (JL)

Reg
ion
Yea
r n
™i
5^
™
8^C
LN
8
^ 8
^0
F R
atio
* p
F R
atio
* P
F
Rat
io*
p F
Rat
io*
p F
Rat
io*
p 20
01
12
CC
B
2006
4
3.87
0.
044
4.15
0.
037
3.10
0.
075
0.97
0.
401
2007
2
2005
8
GSC
20
06
17
2.69
0.
085
3.00
0.
066
2.54
0.
097
6.87
0.
004
7.67
0.
002
2007
6
1999
9
BoF
2
00°
U
41.4
3 <
0.0
01
22.3
1 <
0.0
01
7.66
0.
001
7.01
0.
001
20
05
3 t =
3.7
9 0.
004
2006
9
1998
3
1999
4
RB
_
17.2
3 0.
001
63.3
0 <
0.0
01
42.7
2 <
0.0
01
3.07
0.
091
2000
3
2005
2
1998
11
N
SS
Z°
„ t =
-1.
95
0.06
7 t =
0.1
5 0.
884
t =
-0.
68
0.50
8 t =
-0.
52
0.61
0 19
99
9
NE
GB
2
^5
4 t=
1.8
2 0.
118
t =
-0.
05
0.96
2 t=
1.2
1 0.
271
t = 2
.13
0.07
8 20
07
4

45
Table 2.4: Trophic Enrichment of Zooplankton: Oxygen. Mean (± 1 SD) oxygen stable
isotope signatures of zooplankton and seawater from the Gulf of Maine are shown, (n)
denotes sample size. Net trophic enrichment of zooplankton (A, %o) as compared to
seawater was calculated for zooplankton samples collected in the Gulf of Maine. Trophic
enrichment was calculated after: A = Azoopiankton - Aseawater.
Group n 8wO (%o) A(%o) Reference
Zooplankton 58 21.7 + 3.1 This study 22.9
Seawater 22 -1.2 ±0.7 Schmidt et al. 1999

Figure 2.1a-b: The Gulf of Maine: Study Area and Tow Locations, (a) The Gulf of
Maine with relevant topographical features and bathymetry (50 fathom/9 lm and 200m
isobaths). Inset shows the area that is enlarged, (b) Locations of individual zooplankton
tows (A) and seawater samples (•). Boxes surround recognized seasonal feeding
habitats of the North Atlantic right whale. Habitat codes represent: Cape Cod Bay
(CCB), Great South Channel (GSC), Bay of Fundy (BoF), Roseway Basin (RB), Nova
Scotian Shelf (NSS), Northeast Georges Bank (NE GB), and Jeffreys Ledge (JL).

47
70'W
46°N'
44° H
42* N>
40*N

48
Figure 2.2: 813C Lipid Normalization of Zooplankton Samples. Zooplankton carbon
isotope values were normalized by C:N ratio to account for the confounding effects of
tissue lipids, which deplete the carbon isotope ratio in raw samples. This plot illustrates
the relationship between C:N ratio and enrichment of 813CLN relative to 813Craw.
^ 3 ^
o CO 2 -
1 -
CO 0 -
-1
CO
O CO
I+*
- i 1 ' r—
4 6 -" 1 —
8 — i 1 1 —
10 12 14
C:N

49
Figure 2.3: Spatial Trends in Gulf of Maine Zooplankton: Carbon and Nitrogen
Isotopes. Timeline describes North Atlantic right whale seasonal habitat use in the Gulf
of Maine. Habitat-specific zooplankton carbon and nitrogen stable isotope values (mean
± 1 SD) are plotted by the month in which collections occurred. Zooplankton samples
from the Bay of Fundy, Roseway Basin, Nova Scotian Shelf, and northeast Georges Bank
were all collected in August, and these data are jittered to enhance visibility. Numbers
above the stable isotope data illustrate statistical relationships between regions, with
unique numbers denoting statistically significant differences (a = 0.05), and the "x" label
denotes statistically similar groups. Timeline and symbol labels are as follows: Cape
Cod Bay (CCB, C), Great South Channel (GSC, G), Bay of Fundy (BoF, B), Roseway
Basin (RB, R), Nova Scotian Shelf (NSS, N), Northeast Georges Bank (NEGB, GB), and
Jeffreys Ledge (JL, J).

50
SEUS
-CCB--GSC-
BoF/RB/NEGB
SEUS -JL—
M M N
o
CO
o CO
*~eO
J
o CO
'"to
18 -20 -22 :
24 :
26
1
(
(
X
- 3 -
1 ' x-L X
18 -
20 -22 :
24 •
26 •
J i
F M
(
A M
< X
J J t
A i
— 3 -
t X X
s 1
0 1
N i
1
D

51
Figure 2.4: Spatial Trends in Gulf of Maine Zooplankton: Oxygen, and Hydrogen
Isotopes. Top panel illustrates the shallow and deep water circulation schemes for the
Gulf of Maine (redrawn from Bigelow 1927, Brown & Beardsley 1978) with
zooplankton sampling locations labeled as 0-6 according to their relative distance
"downstream" in the surface circulation mode. Bottom panel shows regional stable
isotope values (mean ± 1 SD) for zooplankton collected in seasonal right whale foraging
habitats. Numbers above the stable isotope data illustrate statistical relationships
between regions, with unique numbers denoting statistically significant differences (a =
0.05), and the "x" label denotes statistically similar groups. X-axis labels are as follows:
Nova Scotian Shelf (NSS, 0); Roseway Basin (RB, 1); Bay of Fundy (BoF, 2); Jeffreys
Ledge (JL, 3); Cape Cod Bay (CCB, 4); Great South Channel (GSC, 5); and NE Georges
Bank (NE GB, 6).

0
NSS O O I
d 28 :
0 ° 24: CO 20 -
16
RB i
m
BoF •
1
i i
-L
JL i
I X
CCB
S
GSC
2
I X
NEGB
1
i
1 2 3 4 5
Relative Distance Downstream
-100 • o
££ -120 " •—*• '
Q -140 -1 0 -160 -
-180 :
_9nn -
1
I
2
I ] I

53
Figure 2.5a-f: Contour Maps of the Gulf of Maine Isotope Landscape, (a) C:N and (b-
f) stable isotope ratios of zooplankton collected in the Gulf of Maine.

40°N 70°W
a)C:N b) d15N (%.)
eaPw eePw 64°w 62°w 70°W eePw etfw M°W «E°W
45°N
C)d13Cw(%„)
70°W 68PW 6tf"W 84°W 62°W
46PN
44°N
43°N
42°N
40°N
d) d"CLN (%•)
70°W fflPW 6tfW 64°W 62°W
42°N
e) d180 (%«)
70°W eePw 6S°w 64°w e£°w
f) dD (%.)
70°W 6SPw 66°W 64°W 62°W

55
CHAPTER 3
STABLE ISOTOPE RATIOS IN RIGHT WHALE BALEEN: INDICATORS OF
TROPHIC POSITION AND MIGRATION PATTERNS

56
ABSTRACT
Although right whales are observed seasonally along the eastern coasts of the
United States and Canada, several datasets suggest that they use additional habitat areas.
Rare, present-day sightings of right whales in historical whaling grounds offer clues as to
the location of such habitats. In 2005, the National Maine Fisheries Service published a
Recovery Plan for the critically endangered North Atlantic right whale (Eubalaena
glacialis), and cited as a high research priority the "characterization and monitoring of
important habitats." Here stable isotopes ratios in right whale baleen are utilized as
intrinsic tags of migration, as these isotopes vary regionally within the marine
environment and are assimilated via trophic transfer.
This chapter describes carbon, nitrogen, oxygen, and hydrogen stable isotope
ratios in baleen plates and zooplankton collected from several right whale foraging sites
in the Gulf of Maine, and their application in determining the migration patterns and
foraging ecology of E. glacialis. Trophic fractionation of carbon, nitrogen, oxygen, and
hydrogen between right whales and their zooplankton prey were calculated for baleen
formed in the Gulf of Maine. On average, right whales are enriched approximately 2%o
(carbon and nitrogen), -2.3%o (oxygen), and 30.6%o (hydrogen) relative to their diet, but
trophic enrichment was variable between habitats.
Isotope records in E. glacialis baleen, like those of other large whale species,
contain oscillations that correspond to annual broad-scale north/south migrations. To
examine right whale movement patterns at seasonal time scales, baleen isotope records,
the North Atlantic Right Whale Catalog sighting records for individual whales, and

57
habitat-specific zooplankton stable isotope values were compared. Poor correlations
were found between the latitude of sighting and baleen isotope signature, likely because
of the confounding contribution of body nutrient pools that were de-coupled from diet
(i.e. non-essential amino acids) and rapid movement by the whales between habitat areas.

58
INTRODUCTION
Broad-scale survey effort along the east coasts of the United States and Canada
have demonstrated that the majority of North Atlantic right whales right whales
{Eubalaena glacialis) utilize several seasonal feeding habitats in the Gulf of Maine
(GoM) (including Cape Cod Bay, Great South Channel, lower Bay of Fundy, Roseway
Basin, and Jeffreys Ledge), while primarily mother/calf pairs occupy a calving ground off
the southeast United States coast (SEUS) during the winter months (Kraus et al. 1986b,
Winn et al. 1986, Weinrich et al. 2000, Brown et al. 2007; Fig. 3.1). Right whales are
also observed (in smaller densities) in the Gulf of St. Lawrence/Chaleur Bay (Y.
Guilbault, pers. comm.) and the northeastern flank of Georges Bank in the summer and
early fall (Niemeyer et al. 2008).
North Atlantic right whales can be individually identified by raised cornified
patches of skin on the rostrum (called callosities) and unique body scars which are easily
photo-documented (Kraus et al. 1986a). This led to the creation of a photographic
catalog of individuals (herein referred to as the Catalog), which has grown over time to
contain thousands of photographs and multi-year sighting records for hundreds of
individual right whales. Whales in the Catalog are given four digit identification
numbers, preceded by an "Eg" (denoting the species' binomial nomenclature, Eubalaena
glacialis). In recent years, genetic analysis of skin and fecal samples has added an
additional component to the Catalog, such that the majority of cataloged individuals also
have a high resolution genetic profile. The Catalog facilitates estimates of population

59
size, and is frequently referenced for studies of right whale demography, reproductive
parameters, and habitat use (Hamilton et al. 2007).
Alternative Habitat Use Hypothesis
Several lines of evidence support an underlying hypothesis of this study: that right
whales use habitats that are ancillary to their major feeding and calving grounds in the
Gulf of Maine and southeast US (the "alternative habitat use hypothesis"). The most
basic forms of these are present-day, opportunistic sightings of right whales on historic
whaling grounds. These rare, but intriguing sightings have occurred in the waters off
Newfoundland (Lein et al. 1989, Knowlton et al. 1992), Norway (Jacobsen et al. 2004),
and in the Cape Farewell Ground (between Greenland and Iceland; Knowlton et al. 1992,
Brown et al. 2007). Given that survey effort in these areas has been quite limited, it is
unknown if these sightings are indicators of alternative habitats or if they are of
individuals occasionally moving through the original range of this population.
The mark-recapture data contained in the Catalog demonstrates that after right
whales leave their summer feeding grounds, a large proportion of the non-calving
population is not sighted during the winter months (Right Whale Consortium 2008b).
Given that the peak in right whale calving occurs in January (Knowlton et al. 1994), and
that the gestation period is estimated at one year (Best 1994), it is likely that mating
activities occur in the winter months. Recent aerial surveys flown over the central Gulf
of Maine during the winter have documented individuals and small surface active groups
of right whales (Cole et al. 2007, T. Cole, pers. comm.), and a small number of right

60
whales (tens) can be seen in Cape Cod Bay in the late winter (in January and February,
(Hamilton and Mayo 2001). However, a centralized wintertime foraging and/or breeding
habitat containing a high density of right whales has not been identified.
The Catalog sighting records of many individual whales are characterized by gaps
between sighting events which vary in duration from months to several years (Right
Whale Consortium 2008b). The longest documented sighting gap is 17 years, although
99% of cataloged whales have gaps of 6 years or less (Hamilton et al. 2007). Survey
effort has remained nearly consistent over the past 25 years, so these sighting gaps cannot
be solely attributed to variable survey effort (Brown et al. 2007). Although it is possible
that whales used the Gulf of Maine/southeast US habitats during these sighting gap years
and were simply missed by researchers, the frequency of sighting gaps in a large
proportion of cataloged right whales lends further support to the alternative habitat use
hypothesis.
Recent genetic analyses also substantiate the alternative habitat use hypothesis.
Paternity tests using right whale genetic profiles have demonstrated that genetically
profiled males (roughly 70% of all cataloged males) were responsible for paternities of
only 51% of the sampled calves (Frasier et al. 2007a). Therefore, to account for the un-
sampled (and likely un-cataloged) males responsible for the other 49% of paternities, the
population must be larger than currently estimated (Frasier et al. 2007a). Given the level
of survey and sampling effort in the GoM and SEUS seasonal habitat areas, it is likely
that these additional males are primarily using other habitat areas.

61
Analysis of genetic and observational data has also revealed that right whales
exhibit maternally directed site fidelity, which has resulted in genetic sub-structuring
within the population (Malik et al. 1999). Most new mothers bring their calves to the
Bay of Fundy habitat in the summer months, such that this area is considered a nursery
habitat. These whales are known as Fundy mothers. In contrast, some mothers never
bring their new calves to the Bay of Fundy (non-Fundy mothers), while others bring
some but not all of their new calves to the Bay of Fundy (Fundy-some mothers). It is
unclear whether non-Fundy and Fundy-some mothers congregate at an alternative nursery
habitat, or if several areas are used. One study documented a mother/calf pair in the
Labrador Basin in August 1989 (Knowlton et al. 1992), but such sightings of mother/calf
pairs in non-Bay of Fundy in the summer and early fall are rare. If there are one or more
centralized alternative nursery habitats, they have yet to be identified.
Migration Potential
Long-distance movements of right whales have been studied using satellite-
monitored radio tags. Right whales were tagged in the Bay of Fundy in the summers of
1989-1991 and 2000 (Mate et al. 1997, Baumgartner and Mate 2005). These tracking
studies have effectively invalidated the assumption that right whales are slow-moving,
exclusively coastal animals (Mate et al. 2007). For example, after leaving the Bay of
Fundy habitat two tagged individuals traveled thousands of km, at high speeds, to "new"
habitat areas (Mate et al. 1997). One animal swam offshore to a Gulf Stream warm-core
ring, while a mother/calf pair traveled south to the coast of New Jersey. Perhaps the most
62
surprising result of these tracking studies was the discovery that right whales are highly
mobile. After leaving the Bay of Fundy, the tagged right whales ranged widely through
the GoM, Scotian Shelf, northern mid-Atlantic bight, and continental slope. Tagged
animals moved at an average speed of 79 km day"1. At this rate, a right whale could
effectively circumnavigate the Gulf of Maine and return to the Bay of Fundy in as little as
15 days (Baumgartner and Mate 2005). Right whales were previously thought to have
substantial residence times within seasonal habitats, but satellite tag data demonstrated
that right whales make frequent excursions in and out of the Bay of Fundy within a
season (Mate et al. 1997). In short, we must be careful in generalizing the movement
patterns of right whales, as they do not necessarily adhere to our simplistic perception of
their migration behavior.
Sighting data from the Catalog and position data acquired from satellite telemetry
demonstrate that right whales have plastic migration behaviors, such that significant
variability in habitat use patterns may exist between individuals as well as inter-annually
within individuals. Continuous, multi-year tags of the migration behavior of multiple
individuals would be ideal to determine the geographic extent of North Atlantic right
whale distribution as well as the degree of inter-annual variability of habitat use within
individuals. Although satellite telemetry delivers invaluable results with successful
deployments, it is also at the mercy of low encounter rates with one of the rarest of large
whales, technological malfunctions, and relatively short attachment periods (< 1 year).
An alternative method, stable isotope analysis of baleen, can provide a continuous long-

63
term record of intrinsic geochemical markers which can be translated into a whale's
multi-year migration patterns.
Stable Isotope Geochemistry of Baleen
Stable isotope analysis is used widely in animal foraging and migration studies
(Hobson 1999b, Rubenstein and Hobson 2004, Hobson 2007) as animals incorporate the
stable isotope signature of their prey and water source into their own tissues, and are
enriched by predicable factors relative to their diet (Michener and Schell 1995). Isotope
gradients in the marine environment - formed by abiotic factors such as temperature,
salinity, and nutrient concentration - are also transferred from the ambient environment
to an animal's tissues via food webs (Rubenstein and Hobson 2004, McMahon et al. in
prep.). Therefore, new growth is given a regional tag which allows interpretation of an
animal's feeding location and, by extension, its movement patterns.
Accreting keratin structures, such as hair, baleen, claws, and feathers, can become
temporal records of stable isotope ratios if they are sampled incrementally (Bowen et al.
2005b). Baleen is composed of keratin, an ideal tissue for stable isotope analysis. It is
metabolically inactive, and is formed from blood metabolites (amino acids) and thus new
growth responds relatively quickly to dietary changes (Ayliffe et al. 2004). It accretes
continuously over each year (Lubetkin et al. 2008) yet also wears away at the tip such
that the longest plates in some species contain over ten years of isotope data, thus
providing a decadal-scale record of migration behavior.

64
Study Aims
The aims of this study were to (1) characterize the carbon, nitrogen, oxygen, and
hydrogen stable isotopes in right whale baleen collected from multiple individuals, (2)
determine trophic fractionation between right whales and their prey by comparing stable
isotope values of baleen to Gulf of Maine zooplankton, and (3) examine right whale
migration patterns through a comparison of baleen stable isotope measurements with
right whale sighting records.
MATERIALS AND METHODS
Baleen plates were collected during diagnostic necropsies from 17 North Atlantic
right whale carcasses that had either stranded or been recovered at sea. In the laboratory,
all connective tissue was removed and each baleen plate was cleaned with a coarse brush
and soap to remove oil and surface dirt. All plates were sampled down the midline, at 2
cm intervals, with a multi-speed drill. The resulting powder shavings from each
sampling interval were collected on a clean square of weighing paper, and placed into a
sterile 20 ml scintillation vial for storage. The baleen and drill were cleaned thoroughly
with ethanol in between each sampling interval.
In preparation for carbon (813C) and nitrogen (615N) stable isotope analysis, 0.8-
1.2 mg of each sample was packaged into a 4 X 6 mm tin capsule and crimped shut. All
samples were sent to the University of California Davis Stable Isotope Facility for
analysis. During 813C and 815N analysis, the samples were loaded into an autosampler
and were individually analyzed using a PDZ Europa ANCA-GSL elemental analyzer

65
interfaced to a PDZ Europa 20-20 isotope ratio mass spectrometer (IRMS). Each sample
was pyrolyzed into CO2 and N2 gas and then separated on a gas chromatograph (GC)
column. The gases were conveyed to the IRMS with a continuous flow of helium carrier
gas. Each sample isotope ratio was compared to a secondary gas standard, whose isotope
ratio had been calibrated to international standards (PeeDee Belemnite (PDB) for 8I3C,
Craig 1957; and atmospheric nitrogen (N2) for 815N, Mariotti 1985). The total C and N
content of each sample were reported along with stable isotope data. C:N ratios and % C
and N were calculated from the reported measurements of total C and N content in each
sample.
Prior to oxygen (8180) and hydrogen (deuterium, 8D) isotope analysis, 0.45-0.55
mg of each sample was weighed and packaged in duplicate into 3.5 X 5 mm silver
capsules and crimped shut. All samples were sent to the University of California Davis
Stable Isotope Facility for analysis. In order to control for issues related to hydrogen
atom exchange, our samples were "air equilibrated" with ambient laboratory air moisture
for 2 weeks prior to combustion (Wassenaar and Hobson 2003, Bowen et al. 2005a).
After this incubation, samples were analyzed using a Heckatech HT Oxygen Analyzer
interfaced to a PDZ Europa 20-20 IRMS. Samples were combusted to CO and H2O, and
separated chromatographically, as described above. Each sample isotope ratio was
compared to a secondary gas standard, whose isotope ratio had been calibrated to the
international standard Vienna Standard Mean Ocean Water (VSMOW, Coplen 1994).
All samples are reported relative to international reference standards: carbon
isotope values relative to PDB, nitrogen values relative to N2, and oxygen and hydrogen

66
values relative to VSMOW. Stable isotope measurements are expressed in standard delta
(8) notation, as parts per thousand (per mil, %o), by the following:
813C, 815N, 8180, or 8D (%o) = [(R™,WR^«0-1] X 1,000
where Rsampie and Rstmdard are the ratios of 13C/12C, 15N/14N, 180/160, or 2H/JH of the
sample and standard, respectively (McKinney 1950).
Analytical precision was determined with laboratory working standards of glycine
H K 1 O
(81JC and 81JN), cellulose (S100), and polyethylene (8D), which were analyzed after
every 12 baleen samples. These standards were calibrated against NIST Standard
Reference Materials. Precisions based on the standard deviation of the series of reference
checks used in the analysis are as follows: 813C (0.05%o); 815N (0.20%o); 8180 (0.43%o);
and 8D (4.0%o).
To control for issues related to hydrogen atom exchange (Bowen et al. 2005b), all
sample hydrogen isotope measurements were corrected relative to a laboratory standard,
bowhead whale baleen (BWB2, -105%o) after analysis. This standard was calibrated
against NIST Standard Reference Materials. One BWB2 sample was run for every 24
right whale baleen samples.
Temporal Context
The stable isotope records derived from North Atlantic right whale baleen were
assigned temporal context using two methods. First, the endpoint of each time series (the
whale's date of death) was determined/estimated using the necropsy report and field

67
notes associated with all individuals sampled in this study (Right Whale Consortium
2008a).
Based on studies of other balaenid whales, baleen stable isotope records form
oscillating patterns that are annual in nature (Schell et al. 1989, Best and Schell 1996,
Hobson and Schell 1998, Wetmore 2001). The period, or annual growth rate, was
estimated using both qualitative and quantitative methods. First, the number of data
points (i.e. distance) between the annually-occurring "peaks" in each baleen isotope time
series was determined as a qualitative estimate of annual growth rate. This technique was
conducted on the 815N baleen records, as these showed the most pronounced periodicity
of all available isotopes. The period of each isotope time series was also determined
statistically, and non-parametric estimators of the annual growth rate were generated for
the baleen data from eight adult whales (Hall et al. 2000). For each whale's baleen time
series, the data considered under the following parameters: g denotes a periodic function
with period 8o, and (Xi, Yi), are successive observations for 1 < i < n, and 0 < XI < ... <
Xn, and ei represents independent random variables with zero means and finite variance.
Yi = g(Xi) + si
To estimate 0o and g, a nonparametric estimator (g) was constructed, and the function S
was minimized to 0:
S(9)= £ { R - g ( X i | 9 ) } 2
From the many possible iterations of this function, the best estimation of period for each
time series was determined using a goodness-of-fit test.

68
Sighting and Calving Records
Several of the whales that were sampled in this study were able to be visually or
genetically matched to animals recorded in the North Atlantic Right Whale Catalog
(http://rwcatalog.neaq.org/). Sighting and calving records associated with these animals
were obtained from researchers at the New England Aquarium (Right Whale Consortium
2008b). These records included the date and latitude/longitude of sighting, associated
behaviors, presence of a calf, and other relevant observations (such as the presence of
entangled gear or a satellite tag). The sighting records from the Catalog were used to
give each baleen isotope value spatial and biological context.
Sighting events were assigned to the corresponding temporally-resolved baleen
isotope data point. In some cases, a data point represented a period of time for which an
individual was sighted multiple times. In such situations, the mean latitude/longitude of
the whale was computed by pooling sighting records for the data point. In all of the cases
where multiple sighting events were encompassed by a single data point, the sightings
were all located within a single habitat area. Therefore, the average positions that were
computed can still be considered reliable indicators of habitat use (i.e. if a whale had
been sighted in the southeast US and Gulf of Maine within a single isotope data point, the
average position of the whale would appear to be in the mid-Atlantic, and would not be
an accurate reflection of the animal's actual habitat use).
The ages of the whales sampled for this study were determined/estimated from
sighting records in the Catalog, and were then used to create demographic categories
with which to compare baleen isotope data points. Several individuals were documented

69
as new calves in the southeast US calving ground, and their ages were then computed
accordingly. Other individuals were first observed as juveniles or adults, and so their age
is given as minimum estimate. These estimates were determined by the date of the
whale's first sighting, its body length and other morphometries, and the date of the first
observation of the animal in surface active groups. In the case of adult females, calving
events also aid in determining estimates of minimum age, as sexual maturity is estimated
to occur at 9 years (Kraus et al. 2001).
The baleen isotope data were labeled with one of several categories, depending on
the whale's age. Baleen isotope data points were categorized as FETUS if they were laid
down before the animal was born. Birth (and subsequent nursing) is indicated
prominently in the isotope records by a sharp increase in 813C and 815N. Baleen isotope
data points were then categorized as CALF at the initiation of nursing, or if the animal
was less than one year old (age = 0) when the isotopes were laid down. It was assumed
that the animal was nursing during most its first year, as weaning is estimated to occur at
8-12 months (Hamilton et al. 1995). Baleen isotope data points were categorized as
YEARLING if they corresponded to the period following the animal's weaning through
its second year (age =1). The tell-tale isotopic indication of weaning (a sharp decrease in
813C and 815N ratios) was used to mark the transition from the calf to yearling states. The
next category was JUVENILE, which encompasses baleen isotope values that were laid
down during the intervening years before sexual maturity (age = 2-8). After sexual
maturity, separate categories were used to differentiate males and females. Male whales
9 years and older were categorized as [mature] MALE. Although the age of sexual

70
maturity for males is not well understood (some studies suggest that 9 years might be an
underestimate, Frasier et al. 2007a), for the purposes of this study, 9 years was used as a
threshold for maturity.
Mature female whales (age > 9) were labeled as NULLIPAROUS, PREGNANT,
LACTATING, or RESTING given their individual reproductive status. For the adult
females sampled in this study, sighting records from the Catalog were used to determine
an individual's reproductive state associated with each baleen isotope data point. In most
cases, calving events were characterized by a sighting of the female with a young calf in
the southeast US calving ground. The mother/calf pairs were then usually sighted in the
spring feeding habitats in the Gulf of Maine, or during the summer in the Bay of Fundy.
The right whale gestation period is estimated at one year, so female right whales were
categorized as PREGNANT in the 12 months preceding a calving event. Given the
estimated timing of weaning, females were categorized as LACTATING in the 12
months following a calving event. Females that could not be classified as pregnant or
lactating were categorized as RESTING if they had calved in the past or
NULLIPAROUS if they had never calved. Data points that were formed when whales
were calves, yearlings, and juveniles were excluded from statistical comparisons of
reproductive state.
Trophic Fractionation
Right whale baleen and Gulf of Maine zooplankton data (Chapter 2) were
compared to examine food web relationships and to determine trophic fractionation

71
between right whales and their prey. Trophic fractionation (or enrichment: A13C, A15N,
A180, and AD) was determined by calculating the difference between the mean isotope
value of zooplankton collected in the Gulf of Maine and right whale baleen data that
could be connected to a sighting in the Gulf of Maine (A = 8 whales — Ozooplankton).
Furthermore, habitat-specific trophic enrichment was determined for Cape Cod Bay,
Great South Channel, and the Bay of Fundy. The trophic enrichment between lactating
females and calves was also examined, using only the data that could be classified as
LACTATING or CALF (after A= Scaif - 8iactatmgfemaie). This comparison resulted in pooled
data from multiple whales during multiple years. Given the sample population, direct
comparison between mother/calf pairs was not possible.
RESULTS
Stable Isotope Ratios
Baleen plates from 17 North Atlantic right whales were sampled for stable isotope
analysis in this study (Table 3.1). Carbon, nitrogen, oxygen, and hydrogen stable isotope
ratios ranged widely in right whale baleen: 513C (-21.8 to -16.7%o), 515N (7.0-12.1%o),
5180 (14.8-35.8%o), and 8D (-154.5 to -71.2%0) (Table 3.2). Elemental abundances (mean
± 1 SD) of carbon (adults = 47.1 ± 2.2%, juveniles = 47.1 ± 2.3, and calves = 46.7 ± 3.3),
nitrogen (adults = 14.1 ± 0.8, juveniles = 14.4 ± 0.9, and calves = 14.0 ±1.1), and C:N
ratios (adults = 3.35 ± 0.13, juveniles = 3.27 ± 0.14, and calves = 3.35 ± 0.14) were
similar among all three demographic groups (Table 3.2).

72
The carbon, nitrogen, oxygen, and hydrogen stable isotope records of adult right
whale baleen were characterized by multiple oscillations, which are hypothesized to be
annual in nature (Fig. 3.2). Although intra-individual variability was present regarding
the exact location (i.e. Julian Day) of the peaks and valleys in the isotope records, peaks
generally occurred in the winter and valleys occurred in the spring (Fig. 3.2). These
patterns were most highly visible in the nitrogen data, which contained oscillations
spanning several per mil units in single years. Carbon data showed similar periodicity,
but oscillated to a smaller vertical extent. In several individuals, carbon isotope data
demonstrated a sustained decrease, while maintaining the seasonal oscillating pattern
(discussed at length in Chapter 4). Oxygen data also followed the periodicity seen in
nitrogen and carbon data, but was highly variable with some timeseries containing
multiple peaks in a single year. Hydrogen data was available for two individual whales,
and the observed range and patterns in the data varied greatly between animals. One
whale (Eg 1004) did not have marked oscillations in its baleen hydrogen data, while the
hydrogen data from another whale (Eg2143) contained dramatic oscillations. When
comparing all available isotope records from each adult right whale (n = 8), intra- and
inter-individual variability in the location of peaks/valleys as well as the amplitude of
these features were observed (Fig. 3.2, all other whales shown in Appendix 2).
Stable isotope records from immature right whales were characterized by several
indications of ontogenetic diet switches, including a transition into a long flat section
(indicative of birth and the commencement of nursing), and a dramatic decrease in
nitrogen isotopes (marking weaning and the transition to planktonic prey) followed by

73
one or more oscillations near the end of the record (Fig. 3.3, Appendix 2). Calf baleen
isotope records contained no repetitive oscillations, and were characterized by the
isotopic indication of birth and the commencement of nursing (an increase in nitrogen
isotope value and transition to a long flat section in the baleen record, Fig. 3.4, Appendix
2).
Baleen Growth Rates
Two independent estimates of annual baleen growth were generated for the
isotope time series for each adult whale (n = 8, Table 3.3): one by counting the distance
between isotope peaks in the 615N data, and another using a non-parametric estimator of a
periodic function. In seven of the eight cases examined, the two estimates of annual
growth rate were in close agreement. In one case (Eg2301), there was an 8.5 cm yr"1
difference between the estimations derived from the two methods. The non-parametric
estimator was used as the measure of annual growth rate for the Eg2301 data, since the
statistical method is assumed to be more robust than the counting method. In general,
immature whales had faster annual baleen growth rates than adults. Baleen growth
appears to plateau in adulthood, at approximately 24 cm yr"1.
Trophic Enrichment
Trophic enrichment (A) between right whales and their zooplankton prey was
calculated by comparing the stable isotope value of zooplankton collected in the Gulf of
Maine and right whale baleen data that were associated with a sighting in the Gulf of

74
Maine. On average, right whale 8I3C, 815N, and 8D were enriched relative to Gulf of
Maine zooplankton (A13C = 2.1%0, A15N = 2.2%0, and AD = 30.6%o; Table 3.4). Right
whale 8180 was depleted relative to zooplankton (A180 = -2.3%o, Table 3.4). Habitat-
specific trophic enrichment between right whales and zooplankton was also calculated in
Cape Cod Bay (A13C = 0.8%o, A15N = 2.8%0, A
180 = -4.3%o), the Great South Channel
(A13C = 2.7%0, A15N = 1.7%0, A
180 = -0.2%0, and AD = 33.3%o), and the Bay of Fundy
(A13C = 1.7%o, A15N = 2.7%o, A180 = -5.0%o, and AD = 57.9%o) (Table 3.4, Fig. 3.5).
The trophic enrichment between calves and lactating females was small, with calves
being enriched relative to females by only 03%o (A13C) and 0.5%o (A15N) (Fig. 3.6).
Migration and Habitat Use
Right whale baleen data (S13C, 815N, 8180 and 8D) that encompassed a Catalog
sighting record in the Gulf of Maine were regressed against the latitude of that sighting
(Fig. 3.7) in order to examine trends in migration. Weak correlations were present for all
four isotopes when the data from adult whales was examined together. The data were
further compared by examining the baleen 8 values by latitude of corresponding data by
individual and by reproductive categories (NULLIPAROUS, PREGNANT,
LACTATING, RESTING, and MALE). These comparisons were unremarkable, resulted
in similarly weak correlations, and are not shown here.
Differential habitat use by age and reproductive classes was examined by pooling
all available data and determining a mean 813C and 815N value for each category (Fig.
3.8), such that the value assigned to each life history category contains data from multiple

75
whales while they could be assigned to each relevant category. The top panel of Figure
3.8 displays the mean ± 1 SD of these categories, and shows the large degree of overlap
between groups. For enhanced visibility, the same data are shown as means ± 1 SE, with
a smaller vertical and horizontal scale. In general, calves and yearlings were enriched in
carbon and nitrogen relative to adults, and males were enriched in carbon and nitrogen
relative to females. Reproductive females (lactating and pregnant) were lighter in carbon
but heavier in nitrogen than resting or nulliparous females. An adult that was chronically
entangled in fishing gear was enriched in nitrogen, but depleted in carbon. This animal
was emaciated at death as a result of its entanglement, and its high nitrogen isotope
values should be considered the result of starvation and chronic stress.
DISCUSSION
Baleen Isotope Records
Like other consumers, right whales acquire their stable isotope ratios from their
diet (Michener and Schell 1995). After ingesting their zooplankton prey, the stable
isotopic values of that zooplankton are fractionated via right whale metabolic activity,
and the modified zooplankton isotope signature is then incorporated into right whale
tissue. In the case of baleen, which grows continuously, new growth obtains the isotope
signature of what has been recently ingested while old baleen continues to carry the
isotope signature of the prey that was ingested when it was formed. As right whales
move to new habitat areas that carry distinct isotope signatures (see Chapter 2), they
obtain variable isotope values along the length of their baleen. One can see the

76
manifestation of this process when the incremental stable isotope records of right whale
baleen are examined (Fig. 3.2). The oscillating patterns are formed as whales move
through several feeding habitats (that represent different stable isotope sources) along
their migration route. For example, as whale feed in Cape Cod Bay in the late winter (the
most 13C enriched habitat area, Chapter 2) their carbon baleen isotope ratios are relatively
high. Then, as the whales move offshore in the spring to feed in the Great South Channel
(the most 13C deplete habitat area, Chapter 2), their carbon baleen isotope values fall and
approach the valley of the annual oscillation. Into the summer months, as the whales
move north into Canadian waters, their isotope signatures rise in concordance with the
zooplankton collected in the Bay of Fundy/Roseway Basin/Nova Scotian Shelf/northeast
Georges Bank (Chapter 2). Finally, as the whales cope with limited food during the
winter months (while migrating to the southeast US to calve, or continuing to feed in the
Gulf of Maine or elsewhere) their baleen stable isotope signature is composed of a
combination of zooplankton-derived and internally-derived isotope sources. This
migration/foraging process structures each the isotope signature of each element
examined, with regional differences among habitat areas influencing the range of isotopic
variation observed in each baleen time series.
When the baleen stable isotope records of multiple whales were examined for this
study, a high degree of inter- and intra-individual variability was observed. If the stable
isotope signature of whale baleen is indeed primarily structured by whales changing their
foraging location, then this variability is to be expected. Analysis of sighting records in
the Catalog demonstrate that although right whales follow stereotypical migration
77
patterns through the Gulf of Maine (Fig. 3.1), there are also many exceptions to this rule.
Appendix 2 shows individual whale baleen records in detail, with their sighting records
denoted over the isotope data. For many individuals, there are multiple years where there
are no sighting events (e.g. Eg 1004, Egl014, and Egl623), or years where the whale is
sighted in only one of the seasonal habitat areas (e.g. all adult whales). By contrast, there
are also individuals that are seen every year, in almost every habitat (e.g. Eg2143,
Eg2301, and Eg2617). The commonality between all of these whales is their common
tendency to migrate seasonally; the differences are their individual variations in habitat
choice, arrival/departure, and associated life history parameters. Therefore, this study
provides further evidence that mysticete whales obtain the basic structure observed in
baleen stable isotope records from foraging along an extensive migration route.
It can be argued that male and female right whales have remarkably different
agendas: females are subject to major physiological demands associated with
reproduction (including putting on enough fat storage to support a calf, carrying a
growing fetus, nursing a young calf, and sustaining their own metabolic needs) and
exhibit a remarkable change in body condition to correspond with this process (Angell
2005); while males simply need to maintain their metabolic needs. Observational studies
of right whales have noted differences in habitat use among adult whales, such that
resting females (which are in theory feeding at an accelerated rate to prepare for
pregnancy) are sighted with less frequency than other adult right whales in the primary
Gulf of Maine habitats (Brown et al. 2001).

78
To demonstrate how these different agendas (based on life history status) might
affect stable isotope ratios, I first compared baleen carbon and nitrogen data that was
associated with sighting events in the southeast US habitat. The data that fit these
constraints were from 2 males (Eg 123 8 and Eg 1623) and 4 females (Eg 1004, Eg 1223,
Eg2143, and Eg2301). Of the available sample population, no resting females were
sighted in the southeast US. Males sighted in the southeast US calving ground had a
mean (±1 SD) 513C value of -19.3 ± 0.02 and 815N value of 11.4 ± 0.8. Similarly,
nulliparous females in the southeast US (Eg2143 and Eg 1223) had a mean (±1 SD) S13C
value of -19.3 ± 0.6 and 815N value of 11.4 ± 0.2. Conversely, reproductively active
(pregnant or lactating) females sighted in the southeast US (Egl004, Egl223, Eg2143,
and Eg2301) had had a mean (±1 SD) 813C value of -20.5 ± 0.9 and 515N value of 9.7 ±
0.9. These results suggest that whales not involved in calving (males and nulliparous
females) had higher carbon and nitrogen values; while reproductively active females (still
pregnant and recent mothers) had lower carbon and nitrogen values. In isotopic studies
of humans, Fuller et al. (2004) found that during pregnancy the nitrogen value of hair
decreased substantially during pregnancy, independent of the mother's diet. These
authors suggest that during periods of rapid tissue anabolism (such as pregnancy), amino
acids are redirected to tissue synthesis rather than excretion, and 815N subsequently
decreases.
To examine isotopic differences (and potential indicators of variable habitat use)
among all life history groups, the mean baleen carbon and nitrogen signature of these
groups were calculated. Resting females had the lowest observed nitrogen values, putting

79
them in the closest proximity to the stable isotope value of their zooplankton prey. As
consumers ingest a higher proportion of prey, the isotope value of their tissues should
more closely approach that of their prey (Lee et al. 2005). As described above, during
times of rapid tissue anabolism (also occurring in resting females), their positive nitrogen
balance could result in a decreased 815N signature, independent of diet (Fuller et al. 2004)
or habitat use.
Despite the fact that all adult whales are feeding on zooplankton, these findings
suggest that other life history classes are supplementing their diet, to some degree, with
internal stores of carbon and nitrogen, which would result in a slightly elevated nitrogen
signature (Hobson et al. 1993). This is supported by the isotopic observations from an
entangled whale, which has a substantially higher nitrogen isotope value than other life
history categories. The data from the entangled whale should be considered an isotopic
manifestation of a stress response.
Trophic Enrichment
The dogma of stable isotope analysis is that "you are what you eat plus \%o (813C)
and 3%e (815N)" (Fry 2006). Recent reviews of trophic fractionation within a variety of
species and ecosystems has reinforced this notion, but also demonstrated that there is
considerably variability in the amount of species-dependent isotope enrichment between
trophic steps (Vander Zanden and Rasmussen 2001, Vanderklift and Ponsard 2003).
Given the uncertainty surrounding estimates of trophic fractionation, the importance of
ground-truthing a study using controlled diet experiments has become clear (Gannes et al.

80
1997). In the case of large whales, it is not possible to control upon what and where
animals are feeding. To circumvent this issue, this study utilized Catalog sighting
records of right whales along with baleen stable isotope data. This method facilitated the
comparison of a habitat-specific whale baleen isotope value and a zooplankton isotope
value. Carbon and nitrogen trophic fractionation between right whales and zooplankton
in the Gulf of Maine was approximately 2%o (Table 3.4), which is above (513C) and
below (815N) the range of currently established estimates in other animals (Michener and
Schell 1995).
Interestingly, when examining trophic fractionation between whales and
zooplankton in specific habitat areas (Cape Cod Bay, Great South Channel, and Bay of
Fundy), different estimates of trophic enrichment were found for each habitat (Table 3.4,
Fig. 3.5). The estimate of A13C was highest in the Great South Channel and Bay of
Fundy, while it was lowest in Cape Cod Bay. This may be evidence of isotopic routing,
which occurs when specific fractions of the diet are sent to build specific consumer
tissues (Koch 2007). In the case of whales, amino acids and other carbon skeletons
derived from the diet may be used to build baleen, while diet-derived lipid is shunted
directly to the blubber. Zooplankton from the Great South Channel and Bay of Fundy
habitats have higher lipid content than those from Cape Cod Bay (Chapter 2), so if diet-
derived lipids are more available to right whales in these two habitats we would expect a
higher degree of isotopic routing (and a larger offset between whales and zooplankton) to
occur.

81
Trophic fractionation of oxygen was approximately -2.5%o, with right whales
being depleted relative to their zooplankton food source (Table 3.4). Hydrogen trophic
fractionation was large (AD = 30.6%o), and right whales were heavier than zooplankton
from their Gulf of Maine habitats (Table 3.4). The transformation of oxygen and
hydrogen within animal proteins is not well understood (Koch 2007), and the large
contribution of body water to an animal's oxygen isotope signature has recently been
described (Podlesak et al. 2008). As discussed in Chapter 2, there is a large fractionation
between the seawater stable isotope value and that of zooplankton, and most of this
fractionation is likely by phytoplankton (Cooper and DeNiro 1989, Schmidt et al. 1997).
The uncertain nature of oxygen and hydrogen fractionation in animals makes the
interpretation of foraging location difficult with these elements.
Trophic fractionation associated with a known diet switch (from milk to plankton)
could be examined in right whale calves and juveniles. Depending on its age and timing
of weaning, most juvenile right whale baleen plates carry the record of this switch (Fig.
3.3). Many of the baleen plates examined had a small hump in the record, not far from
the end (left). This was interpreted to be the animal's birth, when it switched from
maternally-derived nutrition in utero to nursing. The subsequent flat, long phase of the
stable isotope record is hypothesized to represent nursing, as the animal is receiving a
stable lipid rich diet at that time. This period is followed by a decrease in 813C and 815N,
which represents weaning, when the animal begins to feed at a lower trophic level
(zooplankton rather than its mother's tissue). Calf baleen plates only contain the fetal
growth and nursing component of baleen (Fig. 3.4). Although nursing calves are

82
technically feeding at a higher trophic level than the rest of the population, they are not
significantly enriched relative to lactating females (A13C = 0.3%o and A15N = 0.5%o; Fig.
3.6). This has been noted in other marine mammal species, as milk is isotopically lighter
in 813C and 815N than other maternal tissues (Jenkins et al. 2001). This results in no
perceived trophic enrichment even though a trophic shift has occurred.
Isotopes As Migration Tracers
Studies of the isotopic landscape of the Gulf of Maine (Chapter 2) demonstrated
that there are three isotopically distinct habitats within the Gulf that could be resolved
with stable isotope analysis. The poor separation between habitat-specific baleen stable
isotope signatures and the latitude of a whale's sighting within the particular habitat
suggests that other factors influence right whale baleen isotope signatures, besides the
variation created via the whale's migration (Fig. 3.7). Within the whales themselves, the
effects of amino acid pool turnover may have a significant impact on the bulk isotope
value of keratin. Keratin is composed of a mixture of amino acids, some of which are
derived directly from the diet (essential) and some of which are synthesized by the body
(non-essential). Essential amino acids have a short residence time in the body, that is,
once they are ingested, they are quickly used in building new tissue. Non-essential amino
acids, by comparison, can have longer residence times in the body and thus more
opportunities to fractionate and carry a slightly heavier isotope signature.
As a whale moves into a new habitat to feed, it garners essential amino acids from
its zooplankton prey that carry the specific isotope value of the foraging habitat. Baleen

83
that is synthesized at that moment will be made of a mixture of the newly acquired
essential amino acids, as well as a smaller fraction of non-essential amino acids that have
been cycling through the body and carry a slightly different signature. As whales
supplement their zooplankton diet with internal stores of carbon and nitrogen, the amino
acids (now exclusively derived from the whale rather than zooplankton) fractionate
during metabolism and tissue synthesis, resulting in a different isotopic signature of the
bulk tissue. Further study of the stable isotope ratios of amino acids within the bulk
baleen tissue would be useful for determining the degree to which zooplankton vs. whale
carbon and nitrogen sources change along the baleen isotope records.
Besides issues with internal fractionation of habitat-specific zooplankton
signatures, short term right whale movement patterns may also serve to confound the
interpretation of foraging location from isotope data. As described in an earlier section,
right whales are highly mobile. Although a right whale may have been documented in a
particular habitat on a particular date, it does not mean that it did not travel extensively
before or after that sighting. The resolution of this study is such that each baleen isotope
data point in adult whales represents approximately two weeks of data. Satellite tagging
studies have shown that right whales are capable of making excursions on the order of
100s to 1,000s of kms in that amount of time (Baumgartner and Mate 2005). If an animal
did travel extensively within a baleen isotope data point, the resulting signature would be
an average of all the isotope sources that the animal had encountered recently.
At the start of this dissertation chapter, several lines of evidence were outlined as
support of an "alternative habitat use hypothesis." Although I did not observe a direct

84
correlation between foraging location and baleen stable isotope ratios, this study does
give some evidence to the alternative habitat use hypothesis. Within the adult baleen
isotope records, sighting events rarely occur at the extreme peaks and valleys of the
stable isotope records (Appendix 2). Baleen stable isotope data points that are associated
with sightings in the Gulf of Maine tend to occur in the middle values contained in the
stable isotope signatures. For the "unknown" baleen isotope values, those that are not
connected to a sighting event, the majority of these data points fall into the range
represented by isotope data that we know was formed in the Gulf of Maine. The
observation that the remaining "outlier" isotope values are not connected with a sighting
record or an extrapolated Gulf of Maine isotope signature suggests that these data points
were likely formed elsewhere. Based on a meta-analysis of zooplankton stable isotope
values throughout the North Atlantic (McMahon et al. in prep.), zooplankton located off
the coast of the United Kingdom, Spain, and northern Africa carry stable isotope
signatures which could account for the extreme carbon peaks observed in baleen.
Likewise, zooplankton collected off the coasts of Iceland, Greenland, and Norway carry
stable isotope signatures that could account for the extreme valleys observed in right
whale baleen. These areas also happen to be historical right whale habitat areas (Smith et
al. 2006, Reeves et al. 2007). Therefore, right whale baleen stable isotope records lend
further support to the alternative habitat use hypothesis.
CONCLUSIONS

85
Due to the high anthropogenic mortality rate observed in the right whale
population, it is essential to determine when and where right whales occur in order to
establish effective conservation measures. The primary goal of this study was to employ
stable isotope ratios as migration tracers. Isotope records in E. glacialis baleen, like
those of other large whale species, contain annual oscillations that correspond to broad-
scale north/south migrations. To examine right whale movement patterns at seasonal
time scales, baleen isotope records, the North Atlantic Right Whale Catalog sighting
records for individual whales, and habitat-specific zooplankton stable isotope values were
compared. Poor separation was seen between the latitude of sighting and baleen isotope
signature, likely because of variable trophic enrichment between habitat areas, the
confounding contribution of body nutrient pools that were de-coupled from diet (i.e. non
essential amino acids), and rapid movement by the whales between habitat areas.
Baleen stable isotope values were observed that could have been formed in historical
habitat areas. To improve right whale fisheries management, future exploratory surveys
should be conducted in historical habitat areas.
ACKNOWLEDGEMENTS
This study was funded by the Woods Hole Oceanographic Institution's Ocean
Life Institute, National Marine Fisheries Service (#NA04NMF4720403), Quebec
Labrador Foundation, Norcross Wildlife Foundation, American Museum of Natural
History, and Boston University Marine Program. Michael Moore, Andrea Bogomolni,
William McLellan, Sue Barco, Jamison Smith, Scott Kraus, Jerry Conway, Phil Clapham,

86
Mark Omura, Don McAlpine, Bob Bonde, George Liles, Charley Potter, Dee Allen, Chris
Tremblay, and Owen Nichols helped secure baleen plates for this study. Philip Hamilton
and Heather Pettis supplied Catalog data, and the entire Right Whale Research Group at
the New England Aquarium assisted by providing feedback and suggestions. Andrew
Solow and Mark Baumgartner assisted with statistical analysis. David Harris oversaw
the stable isotope analysis at the UC Davis Stable Isotope Facility.

87
Table 3.1: Right Whale Life History Data and Baleen Sampling Plan. (a) Whale ID
number corresponds to the whale's individual identification number in the North Atlantic
Right Whale Catalog (Eg#), Smithsonian Institute (NMNH#) or Harvard Museum of
Comparative Zoology (HMCZ#) database number, or necropsy field number (MH-#-#-Eg
or EgNEFL#); (b) Age (in years) or the estimate of whale's minimum age, (J) denotes
juvenile; (c) Year of the whale's death; (d) Relevant notes about each case, including
cause of death and reproductive status. Table also shows which isotope ratios were
measured in each baleen plate; (X) denotes sampled, (-) denotes not sampled.

88
Whale IDa Ageb Sex Yearc 513C 815N 8180 5D Notes"
EgNEFL0603
EgNEFL0602
Eg2617
Eg2301
Eg2143
Eg1004
Eg1238
Egl014
Egl623
Eg2220
Eg2366 (HMCZ 62052)
Eg 1223
Calf 2006 X
Calf M 2006
12
14
34
Egl504 1
Egll28 2
MH-79-026-Eg (NMNH 504886)
MH-76-056-Eg p , f
(NMNH 504343)
MH-75-044-Eg (NMNH 504257)
2005 X
2005 X
2005 X
2004 X
19 M 2001
2.5 M 1995
12
X
30 F 1999 X
12 M 1996 X
M 1996 X
X
X
X
X
X
X
X
X
X
X
X
X
F
F
M
M
M
M
1992
1986
1983
1979
1976
1975
X
X
X
X
X
X
X
X
X
X
X
X
X
X
X
X
A.
X
X
X
X
X
X
-
_
Fishing Gear Entanglement
Vessel Collision
Vessel Collision
Chronic Fishing Gear Entanglement
Vessel Collision, Pregnant
Vessel Collision, Pregnant
Acute Fishing Gear Entanglement
Vessel Collision
Vessel Collision
Vessel Collision & Fishing Gear Entanglement
Chronic Fishing Gear Entanglement
Vessel Collision, Nursing
Vessel Collision
Vessel Collision
Vessel Collision
Vessel Collision
Undetermined

89
Table 3.2: Elemental Abundances and Stable Isotope Ratios in Right Whale Baleen.
Range and mean ± 1 SD of elemental abundances (expressed as % dry weight), stable
isotope ratios measured and standards used, and the range and mean ± 1 SD of stable
isotope ratios (8, %o) measured in the baleen from adult, immature, and calf North
Atlantic right whales, (n) denotes number of whales / number of isotope data points
collected, (-) denotes no data.
Element
Carbon
Nitrogen
Oxygen
Hydrogen
Carbon
Nitrogen
Composition (%) (Mean ± 1 SD)
Isotope Ratio (Standard)
Adult Whales (> 9
34.8 to 64.4 (47.1 ±2.2)
10.1 to 19.2 (14.1 ±0.8)
-
-
13C/12C (PDB)
15N/14N (Air)
1 8 0 / . 6 0
(VSMOW)
2H/'H (VSMOW)
Immature Whales (1 -
35.4 to 63.8 (47.1 ±2.3)
9.9 to 21.1 (14.4 ±0.9)
13C/12C (PDB)
13N/14N (Air)
5 Range (%o) (Mean ± 1 SD)
years)
-21.8 to-16.7 (-19.7 + 0.9)
7.0 to 12.1 (10.3 ±0.9)
14.8 to 35.8 (19.2 ± 1.9)
-154.5 to-71.2 (-105.5 ±18.0)
- 8 years)
-21.5 to-17.4 (-19.4 ±0.6)
8.2 to 13.2 (11.1 ±1.0)
n
8/799
8/799
5/486
2/211
6/306
6/306
Calves (0 years)
Carbon
Nitrogen
Oxygen
Hydrogen
27.6 to 59.6 (46.7 ±3.3)
8.3 to 17.2 (14.0 ± 1.1)
-
-
13C/12C (PDB)
15N/14N (Air)
18Q/16Q
(VSMOW)
2H/'H (VSMOW)
-20.9 to-18.8 (-19.8 ±0.5)
8.8 to 12.4 (10.6 ± 0.9)
13.7 to 16.9 (15.1 ±1.3)
-114.4 to-104.5 (-108.7 ±4.1)
3 /82
3 /82
2 / 5
2 / 5

90
Table 3.3: Growth rates of adult right whale baleen. The annual growth rates (period)
are reported for the baleen isotope time series collected from eight adult right whales.
The periods were estimated by determining the average distance between annually-
occurring peaks in the baleen isotope records, and by using a statistical non-parametric
estimation. These estimates of period were based on N isotope records (counting
method) and all available isotope records were used for the statistical estimation (denoted
by C, N, O, or H). The mean and best-fit period, in cm yr"1, are reported for each
individual.
Whale ID Age Period (cm yr'1)
Sex Isotopes Average distance
between peaks Statistical estimate
Egl004
Egl014
Eg1238
Eg2143
Eg1623
Eg 1223
Eg2301
Eg2617
34
30
19
14
12
12
12
9
F
F
F
F
M
F
M
F
CNOH
CN
CNO
CNOH
CN
CN
CNO
CN
24.9
24.0
34.0
29.7
29.0
29.6
30.7
33.6
24.2
24.0
32.0
28.8
30.2
29.6
22.2
35.6

91
Table 3.4: Trophic Enrichment Between Right Whales and Zooplankton, by Habitat
Mean carbon and nitrogen stable isotope signature (8, %o) of right whale baleen formed
and zooplankton collected in the Gulf of Maine, and trophic enrichment (A, %o) of right
whales are reported. Trophic enrichment was calculated after: A — Owhale — Ozooplankton. 1 l i e
same data are also reported by habitat areas (Cape Cod Bay, the Great South Channel,
and the Bay of Fundy).
Gulf of Maine Whale Zooplankton A -19.6 -21.7 2.1 10.2 8.0 2.2 19.2 21.7 -2.5
-115.1 -148.0 306 Cape Cod Bay
d Ratio Whale Zooplankton A d13C -19.1 -19.9 0.8 dlsN 10.5 7.7 2.8 d180 19.0 23.3 -4.3
Great South Channel d Ratio d13C d15N d lsO dD
Whale -20.0 9.7 20.0
-139.4
Zooplankton -22.7 8.0 19.8
-106.1
A 2.7 1.7
-0.2 33.3
Bay of Fundy Whale -19.7 10.4 18.8
-118.4
Zooplankton -21.3 8.3
23.8 -176.3
A 1.7 2.1 -5.0 57.9
d Ratio d13C dlsN d180 dD
d Ratio d13C d15N d lsO dD

92
Figure 3.1: Map of Right Whale Habitat Areas in the Northwest Atlantic. Critical
habitats and conservation areas are denoted with black polygons. Below the map, a
timeline outlines the seasonal progression of right whale habitat use in the North Atlantic.
Habitat codes are as follows: Cape Cod Bay (CCB), Great South Channel (GSC), Bay of
Fundy (BoF), Roseway Basin (RB), northeast peak of Georges Bank (NEGB), Jeffreys
Ledge (JL), and southeast United States (SEUS).

93
84*W 8Q'W 76*W 72*W 68* W W W 60oW 56'W 52*W i i
-SEUS
CCB
SEUS— -GSC -JL—
-BoF/RB/NEGB-
M M N

94
Figure 3.2: Adult Right Whale Baleen Stable Isotope Records. Carbon (a), nitrogen (b),
oxygen (c), and hydrogen (d) stable isotope records from the baleen of an adult right
whale (Egl004). The endpoint of each timeseries was assigned as per the whale's date
of death, and the dashed gray lines (denoting the January of each year) were placed
according to each whale's annual baleen growth rate.

95
«*-o o v ~ O)
L±J
„ v—«———*___ o •^S^ ° < y^^
c* ^*"V*-*=-«
T- JL*^ O ^r^^^ O ^^~~~~""G^.
* ^ f -O) »——-^ Q) ^ O) •"" - # - ^
•^r^*334
"T^z^^*' O) ^ a l O) y .
« = £ ^ ^ ^ ^ = ^ = : * «
03 ^T O) ^ » - A ^
1 1 1 | — H F 1 1 1 1 1 1 1 1
CO CM
(°%) Ng^
i - CM CM CM
(°%) Q 9
00 CM
CD CM
• * CM
CM CM
O CM
(°%) 0et2 (°%) Q2l9

96
Figure 3.3: Immature Right Whale Stable Isotope Records. Carbon (o) and nitrogen (•)
isotope records from the baleen of an immature right whale. Dataset is from Egl 128.
The endpoint of each timeseries was assigned as per the whale's date of death, and the
horizontal grayscale lines above the data delineate ontogenetic diet shifts that occurred
with birth and weaning (designated by vertical dashed gray lines).
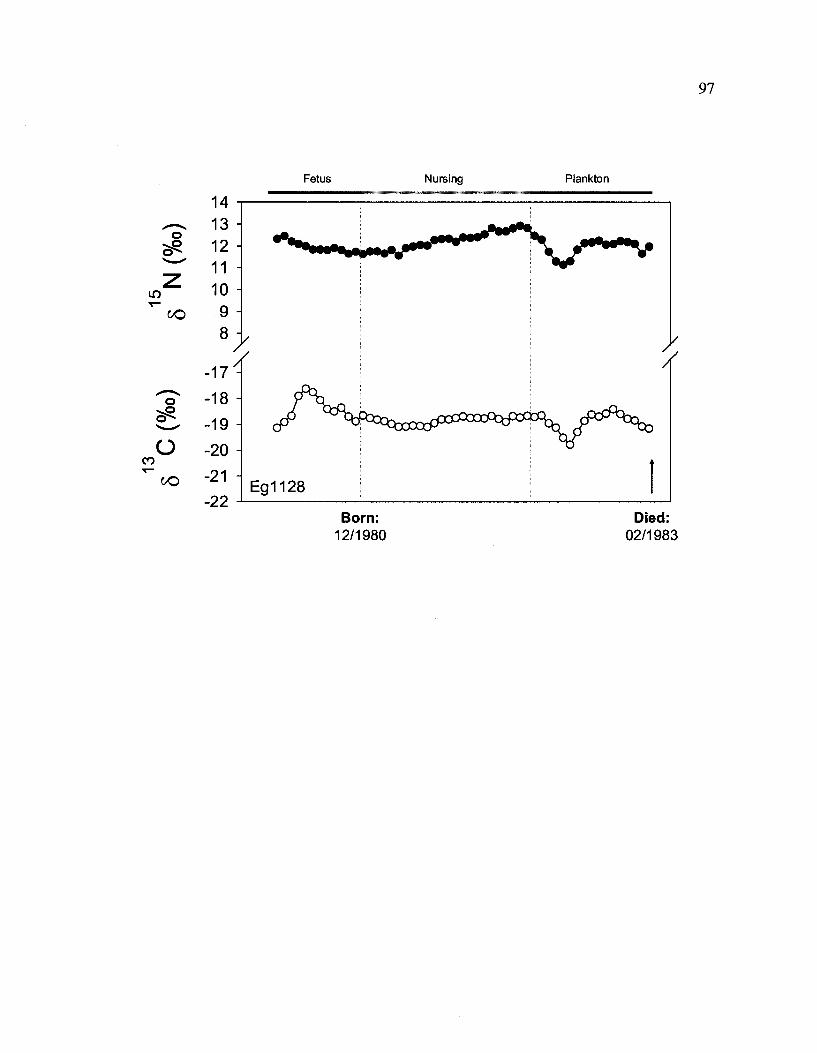
97
Fetus
J
in
CO
CO
J o CO
Nursing Plankton
Born: 12/1980
Died: 02/1983
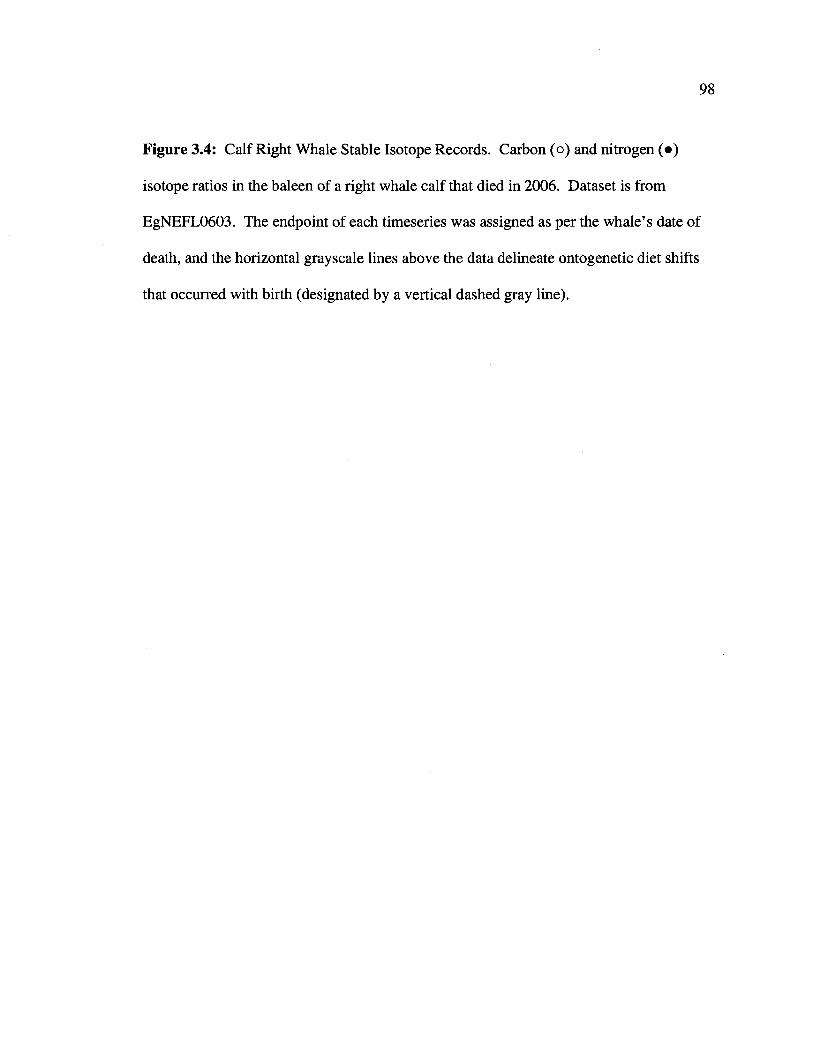
98
Figure 3.4: Calf Right Whale Stable Isotope Records. Carbon (o) and nitrogen (•)
isotope ratios in the baleen of a right whale calf that died in 2006. Dataset is from
EgNEFL0603. The endpoint of each timeseries was assigned as per the whale's date of
death, and the horizontal grayscale lines above the data delineate ontogenetic diet shifts
that occurred with birth (designated by a vertical dashed gray line).

99
Fetus Nursing
Born Dec. 2005
Died Jan. 21 2006

Figure 3.5: Habitat-Specific Trophic Enrichment Between Zooplankton and Right
Whales: 813C and 815N. 8I3C and 815N ratios of zooplankton (triangles) and right whale
baleen (circles) that were collected or formed in Cape Cod Bay, the Great South
Channel, or the Bay of Fundy. The right whale data are color-coded by life history
status: immature (o), female (•), and male (•). Trophic enrichment (A, %o) was
calculated after: A = 8whaies - 8 zooplankton.

101
m oo
z in
in
14
12
10
8
6 -I
A13C = 0.8%o A15N = 2.8%o
-
• Male Whales • Female Whales
. o Immature Whales (M & F) v Zooplankton
Cape Cod Bay
©0@ Q 0 o
• , 5 o 0® o o v v v
© v
>7 W
1 ' 1 '
-26 -24 -22 -20 -18 -16 I t - •
12 •
10 -
8
6 -
4 •
A13C = A lbN =
V V
= 2 8% Great South Channel
= 1.7%o
@ ©
V
• •
•o °
$ ° 0
o °
< I '
-26 -24 -22 -20 -18 -16 14
12
10
8
A13C = 1.7%o A15N = 2.1%o
Bay of Fundy
V V V
-26 -24 -22 -20 -18 -16
513C

102
Figure 3.6: Trophic Enrichment Between Lactating Females and Right Whale Calves.
813C and 815N ratios of lactating females (•) and calves (o). Trophic enrichment (A, %o)
was calculated after: A = 8caives - 8fe,a;es.

103
13
12
J 11
1o ? 10
9
8
7
• Lactating Female ' o Calf
• •
.
. A13C = 0.3%o A15N = 0.5%»
° »o°f ° -~ °o <?• °
o c9 CP o
o * % • •
•
1 1 ' 1 — '
-22 -21 -20
513C (%o)
•19 -18

104
Figure 3.7: Stable Isotopes as a Tracer of Right Whale Migration. Baleen stable
isotope ratios (%o) plotted against the latitude of sighting (°N). Linear regression, best-fit
equation, and r2 value are presented.

105
y = 0.0228X - 20.57 r2 = 0.0135
Z m to
14
12
10
6
# • •
v. •
•
V * s
#* 1
•
y = 0.008x+10.71 r2 = 0.0018
28 32 36 40 44 48 52 28 32 36 40 44 48 52
-v-i :
y=0.009x +19.45 r2 = 0.0008
28 32 36 40 44 48
/On
52
Latitude f N)
Q CO
-80
-100
-120
-140
-160
y = 0.501 x- 93.89 r2 = 0.0197
28 32 36 40 44 48 52
Latitude ( N)

106
Figure 3.8: Demographic Separation of Stable Isotope Ratios in Right Whales. Baleen
stable isotope data were coupled with North Atlantic Right Whale Catalog data to
examine isotope separation between demographic groups within the population. Top
panel shows mean ± 1 SD for each demographic category. Symbol letters represent the
following categories: F = Fetus, C = Calf, Y = Yearling, J = Juvenile, M = Male, N =
Nulliparous, P = Pregnant, L = Lactating, R = Resting, EA= Entangled Adult, EJ =
Entangled Juvenile. Bottom panel is an enlargement of the data, plotted as the mean ± 1
SE for visibility.

5 1 3 C (%o)
12.0
o
11.5 A
11.0 A
10.5 A
10.0 H
Entangled Adult
4 — i
Calf
Fetus H]H Yearling
Male
H Entangled Juvenile
jPregnant
Lactating Null T
Resting
IS Juvenile
9.5 -21.5 -21.0 -20.5 -20.0 -19.5 -19.0 -18.5
5 1 3 C (%o)

108
CHAPTER 4
LONG-TERM HABITAT USE AND THE INFLUENCE OF ENVIRONMENTAL
CHANGE ON STABLE ISOTOPE RECORDS IN NORTH ATLANTIC RIGHT
WHALE BALEEN
109
ABSTRACT
Animal stable isotope records that include historical samples can be used as
baselines with which to examine changes in a population's habitat use. To examine long-
term ecological trends in North Atlantic right whale (Eubalaena glacialis) migration and
habitat use, carbon and nitrogen stable isotope records were measured from the baleen
plates of 12 whales, spanning the period from 1882 to 2005. Two distinct categories
were used for data analysis: whales that were alive during the historical (1882-1915) and
present-day (1986-2005) period. The nitrogen stable isotope signature of historical right
whales was significantly lighter than that of present-day whales, while the carbon isotope
signature of historical whales was heavier that that of present-day whales. These
differences were attributed to a generally poorer state of health in the present-day
population, and the isotopic dilution of atmospheric carbon dioxide due to increasing
anthropogenic inputs throughout the study period. The shifts in the stable isotope value
between the historical and modern right whales were attributed to factors independent of
right whale migration behavior, thereby adding support to the hypothesis that present-day
right whales continue to utilize historical habitat areas in the North Atlantic.
Additionally, a rapid 2.25%o decrease in the carbon stable isotope ratios of the
present-day whales was observed. Concurrent to this decrease, which began in 1998, the
Pacific Decadal Oscillation switched from a warm to a cool phase, and Southern
Oscillation changed from a historically strong El Nino event to a La Nina year. During
the baleen 513C decline, right whale calving rates increased, inter-birth intervals
decreased, and the abundance of Calanus finmarchicus (a major right whale food source)

110
increased in the Gulf of Maine, yet observed right whale habitat use remained consistent.
While the 813C decrease observed in present-day baleen could not be directly attributed to
any one factor or event, the results of this study demonstrate that environmental isotopic
signals provide variation to animal stable isotope ratios, and should be considered when
interpreting stable isotope records.

I l l
INTRODUCTION
It is well established that stable isotopes of animal tissue are indicators of animal
foraging location and diet (Hobson 2007). Stable isotope ratios in the environment are
influenced by biological and biogeochemical processes, and the regionally-specific stable
isotope ratios that are formed become integrated into food webs by producers
(Rubenstein and Hobson 2004). Consumers derive their stable isotope signature from
their food source (Michener and Schell 1995), so as animals move between foraging
locations, they acquire the stable isotope signature of their diet and, by extension, the
local environment. As a result, two major sources for the stable isotope value of animal
tissues are changes in feeding location (e.g. migration) or changes in diet. Stable isotope
records, created by sampling many individuals from a population over time, can be used
to study long-term trends in a population's foraging ecology and habitat use.
The significance of observed ecological shifts can be evaluated using historical
data as a baseline, and these data may then guide contemporary conservation efforts
(Newsome et al. 2007a). Studies utilizing pinniped bone and teeth (Hirons 2001, Hobson
et al. 2004, Newsome et al. 2007b, Hirons and Potter 2008), fish otoliths (Gao and
Beamish 2003), seabird feathers (Hobson et al. 2004), and cetacean baleen plates (Schell
2000) have been used to create such records, some of which represent 50-100 years of
data. The goal of the current study was to create a stable isotope record from baleen
plates with which to examine long-term trends in right whale habitat use. When
compiling a large dataset of baleen carbon and nitrogen records collected to meet this
objective, isotope shifts between the historical and present-day samples became apparent,

112
as did shifts within the present-day samples themselves. To make sense of the dramatic
changes in stable isotope signatures in recent years, climatic, physical, and biological
datasets were consulted.
MATERIALS AND METHODS
Stable isotope ratios were measured in the baleen of 12 adult North Atlantic right
whales (Table 4.1), eight of which were collected recently and represent "j>resent-day"
data (PD, 1986-2005). The other four baleen plates were sampled at museums in the
United States and United Kingdom, and were collected in the late 19th or early 20th
century (Table 4.1). These four plates represent "historical" data (H, 1882-1915).
Previous genetic analysis, using mtDNA sequences, confirmed that these baleen plates
are from E. glacialis (Rosenbaum et al. 2000). Sample collection, processing, and
analysis of the PD baleen plates are described in Chapter 3.
Stable Isotope Analysis of Historical Baleen
Four North Atlantic right whale baleen plates were acquired from archived
collections at the Smithsonian Natural History Museum (Washington, D.C., USA),
British Natural History Museum (London, UK), and National Museum of Scotland
(Edinburgh, UK). Each baleen plate was cleaned thoroughly with repeated ethanol swabs
until all surface contaminants were removed. The baleen plates were then sampled down
the midline, at 2 cm intervals, with a multi-speed drill. The resulting powder shavings
from each sampling interval were collected on a square of clean weighing paper, and
113
placed into a sterile 20 ml scintillation vial for storage. In preparation for stable isotope
analysis, 0.8-1.2 mg of each sample was packaged into a 4 X 6 mm tin capsule and
crimped shut.
All samples were sent to the University of California Davis Stable Isotope Facility
for 813C and 815N analysis. During analysis, the samples were loaded into an autosampler
and were individually dropped into an elemental analyzer interfaced to an isotope ratio
mass spectrometer (IRMS). Instrumentation included a PDZ Europa ANCA-GSL
elemental analyzer interfaced to a PDZ Europa 20-20 IRMS. Each sample was pyrolyzed
into CO2 and N2 gas and then separated on a gas chromatograph (GC) column. The gases
were conveyed to the IRMS with a continuous flow of helium carrier gas. Each sample
isotope ratio was compared to a secondary gas standard, whose isotope ratio had been
calibrated to international standards (PeeDee Belemnite (PDB) for 813C, Craig 1957; and
atmospheric nitrogen (N2) for 815N, Mariotti 1985). The total C and N content of each
sample were reported along with stable isotope data. C:N ratios and % C and N were
calculated from the reported measurements of total C and N content in each sample.
All samples are reported relative to international reference standards: carbon
isotope values relative to PDB, and nitrogen values relative to N2. Stable isotope
measurements are expressed in standard delta (8) notation, as parts per thousand (per mil,
%o), by the following:
8 1 3 C Or 8 1 5 N (%o) = [(RsamptefRsmndard)-!] X 1 , 0 0 0
where Rsampie and Rstandard are the ratios of 13C/12C or 15N/14N of the sample and standard,
respectively (McKinney 1950). Analytical precision was determined with laboratory

114
working standards of glycine, which were analyzed after every 12 baleen samples. These
standards were calibrated against NIST Standard Reference Materials. Precisions based
on the standard deviation of the series of reference checks used in the analysis were
0.05%0 (513C) and 0.20%o (815N).
Baleen Time Series
The temporal context of the PD baleen isotope records was established using the
date of each whale's death as an endpoint and two independent estimations of annual
baleen growth rate (Chapter 3). The endpoint of the H whale isotope records (i.e. the
whale's date of death) could not be determined with the same confidence as in the PD
whales, since the month and day of death was not readily available for H whales. The H
baleen plates did have an associated collection year within each respective museum's
database, and this date was the first order estimate of when the isotope record should end
in time. A detailed study of the PD baleen plates revealed that the annual peaks in baleen
isotope records occur in the winter, so the annual peaks in the H baleen records were
arbitrarily assigned as the starting point of each subsequent year.
To examine shifts in isotope value between H and PD baleen, mean 8I3C and 815N
values were computed for each individual, and then individuals were used as replicates to
statistically test for differences between the grand means of the H and PD categories.
The H and PD means were also compared to mean 813C and 815N values for an Entangled
whale (Eg2301). Although this entangled whale is a part of the PD dataset, the portion of
the baleen isotope record that encompassed the entanglement (Sept. 2004 - March 2005)
115
were compared removed from the PD dataset for analysis. All groups (H, PD, E) were
compared using a one-way ANOVA test.
Carbon Dioxide
Measurements of atmospheric CO2 concentrations were collected from the Law
Dome Ice Cores (Antarctica, 1832-1978, Etheridge et al. 1998) and at the Barrow
Observatory (Alaska, USA, 1971-2005). Data were acquired from the Carbon Dioxide
Information Analysis Center (www.cdiac.ornl.gov) and the National Oceanic and
Atmospheric Administration Earth System Research Laboratory (www.esrl.noaa.gov)
websites, respectively. 813C ratios of atmospheric CO2 were determined from air samples
collected at the Barrow Observatory. These stable isotope samples were analyzed by
researchers at the University of Colorado/INSTAAR Stable Isotope Laboratory.
Surface seawater collections took place on research cruises in the waters off
Bermuda, associated with the Bermuda Atlantic Time-series Study (BATS, Steinberg et
al. 2001). Water from 0-10m was collected in Niskin bottles and analyzed for total CO2
(ECO2, umol kg"1). Data from 1985-2005 were downloaded from the Bermuda Institute
of Ocean Sciences website (http://www.bios.edu/research/bats.html).
Right Whale Migration and Reproduction
Several of the PD whales were able to be visually or genetically matched to
animals recorded in the North Atlantic Right Whale Catalog (http://rwcatalog.neaq.org/)
(Table 4.1). The sighting records associated with these animals were obtained from the

116
New England Aquarium. Additionally, population-wide measures of annual reproductive
rates (calving rate and mean calving interval) were compiled by researchers at the New
England Aquarium, using Catalog data. The calving rate (calves yr"1) is the observed
number of calves born each year. The mean calving interval (yr) represents an annual
measure of the average number of years between calving events for reproductive females.
Stereotypically, female right whales exhibit an inter-birth interval of three years: one year
for lactation of a new calf, a year of recovery, and a subsequent year of a new pregnancy,
although this has been much higher for North Atlantic right whales in recent years
(Knowlton et al. 1994, Kraus et al. 2001, Kraus et al. 2007). All right whale sighting and
demographic data were used with permission from the North Atlantic Right Whale
Consortium (Right Whale Consortium 2008b).
Climatic Oscillations
Four major climatic oscillations known to influence ocean circulation,
temperature, and biological productivity were referenced in this study. The North
Atlantic Oscillation (NAO) Index is a measure of the difference in sea-level pressure
between the Icelandic Low and the Azores High, and controls the strength of storms and
westerly winds in the North Atlantic (Hurrell 1995). An NAO Index was acquired from
the National Center for Atmospheric Research website
(www.cgd.ucar.edu/cas/jhurrell/indices.html). The Atlantic Multi-Decadal Oscillation
(AMO) Index is known as the mode of natural variability occurring in the North Atlantic,
and is manifested primarily in sea surface temperature (Kerr 2005). An AMO Index was
117
acquired from the National Atmospheric and Oceanic Administration Earth System
Research Laboratory website (http://www.cdc.noaa.gov/Timeseries/AMO/). The El Nino
Southern Oscillation (ENSO) Index is calculated from the monthly fluctuations in air
pressure difference between Tahiti and Darwin, Australia (Stenseth et al. 2002).
Sustained negative phases of the ENSO Index are often deemed El Nino events, while
sustained positive phases are La Nina events. The ENSO Index was acquired from the
National Center for Atmospheric Research website
(http://www.cgd.ucar.edu/cas/catalog/climind/ENSO.html). The Pacific Decadal
Oscillation (PDO) Index is defined as the leading principal component of North Pacific
SST variability (Bond and Harrison 2000). It is similar to the ENSO, though its
periodicity is much longer (i.e. approximately 20-30 years between events, rather than <
2 years; Zhang et al. 1997). The PDO Index was acquired from the University of
Washington Climate Impacts Group website
(http://jisao.washington.edu/pdo/PDO.latest). Correlation coefficients were computed
between mean annual baleen carbon and nitrogen records and each climatic index at zero,
one, two, and three year lags of the isotope data behind the oscillation index.
RESULTS AND DISCUSSION
Baleen Stable Isotope Record
A long-term biogeochemical record, from 1882-2005, was created using right
whale baleen stable isotope ratios (Fig. 4.1). Due to a lack of available baleen plates, one
small gap (from 1885-1904) and one large gap (from 1915-1986) exist in the record. The

118
H (1882-1915) and PD (1986-2005) baleen had similar elemental compositions
(expressed as % dry weight, Table 4.2) and C:N ratios (H = 3.39 and PD = 3.35). The
similarities in these measurements suggest that degradation or diagenesis, which could
compromise the stable isotope data (Ambrose and DeNiro 1986), did not occur in the H
baleen. The mean 815N value of H baleen was significantly lighter than PD baleen (one
way ANOVA, F = 7.41, p = 0.01), while the mean 513C value of H baleen was
significantly heavier than PD baleen (one-way ANOVA, F = 50.34, p<0.001) (Table 4.3,
Fig. 4.2). The entangled whale had a significantly lighter 813C signature than both H and
PD whales (one-way ANOVA, F = 50.34, p<0.001), and had a 815N signature that was
heavier than that of H whales but not significantly different than that of PD whales (one
way ANOVA, F = 7.41, p = 0.01) (Table 4.3, Fig. 4.2). A large, rapid 513C decrease also
occurred within the PD baleen record itself. The baleen 813C record decreased 2.25%o in
only 6 years (from -18.84%0 in 1999 to -21.09%o in 2005; Figs. 4.1, 4.4). This decrease is
measured in the carbon isotope records of 4 adult right whales (Eg 1004, Eg2143,
Eg2301, and Eg2617). In addition to the negative trend, all 4 whales maintain the
seasonal patterns/oscillations along the length of their baleen plates.
Nitrogen Isotope Records
In stable isotope studies, S15N is considered to be a marker of trophic position
since it increases several per mil units with every trophic step (Minagawa and Wada
1984, Michener and Schell 1995). Therefore, if the 815N value of a species or population
increases significantly over time, it is often suggested that a dietary shift to a higher

119
trophic level has occurred (Hirons 2001, deHart 2006, Tucker et al. 2007). In this case, a
large shift (~ 1.9%o) in 815N occurred between the H whales (mean = 8.4%o) and the PD
whales (mean = 10.3%o). While this increase could be interpreted as a trophic shift in the
PD population (Vander Zanden et al. 2001), this seems unlikely given that right whales
are so highly specialized to feed on mesoplankton (Baumgartner et al. 2007).
815N values also increase in animal tissue during periods of physiological stress,
when animals are in negative N balance and are forced to catabolize their own tissue
(Hobson et al. 1993, Fuller et al. 2005). Several lines of evidence suggest that PD right
whales are in poor health overall: they are thinner than southern right whales, a sister
species (Angell 2005); they are highly inbred (Waldick et al. 2002, Frasier et al. 2007b);
they exhibit a depressed reproductive rate (Kraus et al. 2007); and outbreaks of lesions
and other external indicators of poor health have been observed in the population (Pettis
et al. 2004, Rolland et al. 2007). Some researchers also hypothesize that right whales
may be food limited (Reeves 1978). If the present-day right whale population is
chronically stressed, their overall 815N signature would increase, despite their foraging at
a similar trophic level to the historical population. This assertion is supported by the
statistical similarity between the entangled whale (which shows isotopic evidence of
nutritional stress) and PD whales.
Carbon Isotope Records
Previous studies of long-term isotope records in marine mammal tissue have
reported long-term (50-70 year) sustained decreases in 813C. Several of these studies

120
have analyzed marine mammal tissue originating from the North Pacific, specifically the
Gulf of Alaska and Bering Sea regions (e.g. bowhead whales, Schell 2000; Steller sea
lions and harbor seals, Hirons 2001, Hobson et al. 2004; and northern fur seals, Newsome
et al. 2007a-b). The mechanism(s) behind these sustained decreases is a matter of
contention in the scientific literature (for example, see Schell 2000, Cullen et al. 2001,
and Schell 2001); with either a decline regional primary productivity or isotopic dilution
of atmospheric carbon dioxide being most common explanations. This study provides a
potential litmus test for determining which parameter is causing the decline in marine
mammal carbon isotope records - as here the geographical scope is widened to include
the Atlantic. If similar trends are seen across ocean basins, then North Pacific-specific
regional trends in primary productivity would likely not be the cause of observed 813C
declines in marine mammals.
Concurrent to long-term decreases in marine mammal 813C records, atmospheric
carbon dioxide concentrations have been steadily increasing (Keeling et al. 1998). The
majority of this increase in CCte can be attributed to anthropogenic inputs and impacts
(e.g. fossil fuel burning and land use changes; IPCC 2007). Fossil-fuel derived CChis
depleted in 13C relative to ambient, which effectively dilutes the atmospheric carbon pool
as its concentrations increase (known as the Suess Effect, Tans 1979). In the sub-polar
oceans, this dilution results in a 813C decrease of -0.1%o decade"1 (Sonnerup et al. 1999).
During the 123 year period represented by the right whale baleen isotope record,
atmospheric carbon dioxide concentrations increased from approximately 293 ppm to 380
ppm (Etheridge et al. 1998; Fig. 4.3). Over this period, the mean 813C of the baleen

121
record decreased from -19.93%0 in 1882 to -21.02%0 in 2005 (difference = 1.09%o). The
expected dilution of marine carbon due to the Suess Effect (over the period represented
by the baleen isotope record) is -l.23%o, thereby accounting for the majority of the 813C
decrease seen over the extent of the baleen record.
The rapid 813C decrease that occurred within the PD baleen record is not easily
explained by the Suess Effect, however. The baleen 813C record decreased 2.25%e in only
6 years (from -18.84%o in 1999 to -21.09%o in 2005; Figs. 4.1,4.4). Concurrent to this
observed decrease, atmospheric CO2 concentrations increased steadily (from 347 ppm in
1986 to 380 ppm in 2005) and 813C measurements of atmospheric CO2 decreased steadily
(from -7.9 to -8.4%o) (Fig. 4.5). Similarly, total CO2 (ug kg"1) measured in the surface
ocean near Bermuda increased slowly during the PD isotope record (Fig. 4.5). From
these three records of environmental carbon (atmospheric [CO2] and 813C, and ocean
XCO2), there is no evidence of a sudden increase in the input of carbon dioxide to the
marine environment. According to published estimates of the contribution of the Suess
Effect, < -0.2%o of the observed change over the 20 year PD record can be attributed to
this phenomenon. To account for the PD baleen 513C decrease, other contributing factors
must be considered.
North Atlantic Right Whales
In other studies examining long-term carbon isotope declines in marine mammals,
some authors have suggested that the observed isotope declines could be caused by
populations foraging progressively farther offshore (Hirons 2001). In general, inshore
122
waters are more C enriched than offshore waters (Hobson 1999, McMahon et al. in
prep.). Factors such as phytoplankton species composition and growth rate (Fry &
Wainright 1991), inputs from I3C enriched benthic macrophytes, higher nutrient
concentrations, and greater overall productivity lead to higher 8 C values in coastal
regions, especially in upwelling areas or during phytoplankton blooms (Schell et al. 1989;
Burton & Koch 1999). By contrast, pelagic waters are 12C enriched, and are
characterized by less nutrient availability, lower productivity and phytoplankton growth
rates, and an absence of macrophytes. If a marine mammal population increases their
reliance on offshore habitats, one would expect an overall decrease in corresponding
tissue 813C.
To examine trends in right whale movement and habitat use patterns, sighting
records of the PD whales from the Catalog were examined before and during the 813C
decline. In general, PD whales were sighted in similar habitat areas at similar times of
year before and during the 813C decline (Fig. 4.6). While this simple comparison does not
address if right whales were present in greater densities at alternative habitats (i.e. not
their primary habitats in the Gulf of Maine, where survey effort is focused) during one of
the two periods, it does demonstrate that the sampled whales were not wholly absent
from their primary foraging habitats in the Gulf of Maine before or during the 813C
decline.
In the years before the 813C decline, anomalous migration behavior in the right
whale population was documented on two occasions. Right whales abandoned two of
their seasonal foraging habitats in the Gulf of Maine; Great South Channel in 1992, and

123
Roseway Basin from 1993-1999 (Kenney 2001, Patrician 2005). Lower concentrations
of Calanus finmarchicus, the favored prey of right whales, were noted in these habitats
during the abandonment periods, suggesting that right whales modified their distribution
in years when zooplankton resources were limited (Kenney 2001, Patrician 2005).
Two measures of right whale reproductive rate, mean calving or inter-birth
interval (yr) and annual calving rate (calves yr"1), were examined for evidence of changes
in population dynamics before and during the 813C decline. In the 1990s, the population-
wide calving interval increased steadily, and began to decline in 1999 (Right Whale
Consortium 2008b, Fig. 4.7). Annual calving rate was highly variable throughout the
entire study period, 1986-2005 (Kraus et al. 2007, Fig. 4.7). Calving rates were lowest in
the early and late 1990s (1993-1995 and 1998-2000). In 2001, calving reached a record
high, presumably because a large number of females who were unable to calve in
previous years were available to do so (Greene et al. 2003, Greene and Pershing 2004).
Since females must accumulate sufficient storages of body fat to support a fetus and
nursing calf in order to successfully reproduce, food limitation is speculated as a likely
factor in die low calving success of right whales in the late 1990s (Greene et al. 2003).
Acoustic measurements of right whale blubber thickness, a proxy for body condition,
showed that whales were thinner overall during years when their copepod prey was less
abundant in the water column (Angell 2005).
Data from Continuous Plankton Recorder (CPR) surveys conducted in and around
the primary right whale foraging grounds in the Gulf of Maine demonstrate that [lipid
rich, isotopically light] late stage C. finmarchicus copepods increased in abundance

124
beginning in 1998 (Pershing et al. 2005). These data suggest that foraging conditions
improved overall for right whales at the onset of the 813C decline. Acoustic
measurements of right whale blubber thickness collected from 1998-2002 increased
progressively over this period (Angell 2005), presumably as a direct result of improving
foraging conditions in the Gulf of Maine. Given the cycle of right whale reproduction, a
one to three year lag would occur before the banner foraging conditions translated into an
increase in calves born into the population. This was observed in PD right whales, as
calving rate increased three years following the 1998 increase in Gulf of Maine C.
finmarchicus abundance (Fig. 4.6).
Climatic Oscillations
The PD baleen nitrogen and carbon stable isotope records were compared to four
climatic indices: the North Atlantic Oscillation Index (NAO), Atlantic Multi-Decadal
Oscillation Index (AMO), Pacific Decadal Oscillation Index (PDO), and the Southern
Oscillation Index (ENSO) (Fig. 4.8). Correlation coefficients were determined for each
isotope-oscillation index combination, and correlations were tested with a zero, one, two,
and three year lag of the isotope data behind the oscillation index (Table 4.4). Poor direct
correlations were found between the isotope data and climate oscillations, but
correlations between 815N and the NAO (lag = 0), AMO (lag = 0, 1, 2), and PDO (lag =
3) were statistically significant. Two oscillations changed phase in the year prior to the
813C decline; in 1998 PDO changed from a warm phase to a cool phase, while the ENSO
was characterized by a very strong El Nino event that switched to a La Nina in 1998.

125
Prevailing climate and atmospheric fluctuations influence a variety of marine
ecological processes (Saether 1997). Marine animals are indirectly affected by these
fluctuations; temperature, ocean circulation, and weather patterns changes associated
with natural climate cycles influence the abundance and distribution of their prey
(Stenseth et al. 2002). As seen in this study, direct correlations between animals and
climate fluctuation are difficult to quantify, but recent studies have identified linkages
between marine mammal reproductive parameters and climate patterns such as the
Southern Oscillation (Leaper et al. 2006, Vergani et al. 2008) and the North Atlantic
Oscillation (Greene and Pershing 2004).
Climatic fluctuations can induce changes in the physical characteristics of the
marine environment (such as temperature, salinity, CO2 concentration ([C02]aq), and N
cycling), which are important factors that determine the stable isotope baseline of an
environment (see Chapter 2). Given the trophic transfer mechanism of stable isotope
ratios, these climate-derived changes would be incorporated into local food webs and
then into animal tissues. Climatic oscillations induce physical changes into environment
at variable temporal scales. Oscillations such as the PDO is characterized by a long
periodicity (20-30 years, Zhang et al. 1997), and phase changes are usually known as
regime shifts due to their immense ecosystem impacts and restructuring (Overland et al.
2008). Through analysis of a 60 year (1945-2005) carbon and nitrogen isotope record of
northern fur seal teeth, Newsome et al. (2007b) correlated oscillations in the dentin
isotope record (characterized by a 22 year period) to PDO phase changes. In the Atlantic,

126
the NAO is the dominant climate oscillation mode, and it changes phase at shorter time
scales.
Given the periodicity of the NAO, we should expect that marine mammal isotope
records derived from North Atlantic populations to respond at equally short temporal
scales. At semi-decadal or inter-annual temporal sales, circulation into the GoM has been
associated with NAO fluctuations (Greene and Pershing 2003). Changes in the relative
contribution of slope water sources (Warm Slope Water, WSW vs. Labrador Slope
Water, LSW) to the GoM have been associated with phase changes in the NAO such that
during positive NAO phases, relatively warm and salty WSW enters the Gulf through the
Northeast Channel, while colder and fresher LSW dominates the deep water inflow in
during negative NAO phases (Greene and Pershing 2003).
The dominant slope water source to the GoM may result in differential advection
of C. finmarchicus into the Gulf (MERCINA 2004). The recent decrease in the
abundance of C. finmarchicus, from 1996 - 2000, and aforementioned subsequent
increase in 1998, has been attributed to a sudden drop in the NAO Index and associated
changes in slope water inputs to the GoM (Greene and Pershing 2000). To further
examine the influence of the NAO on right whale baleen 513C, the isotope record needs to
be extended to present.
CONCLUSIONS
Historical and present-day isotope records, derived from baleen plates, were
examined to address long-term trends in right whale habitat use. Significant differences

127
in the carbon and nitrogen stable isotope signatures were found between historical and
present-day right whales, but these differences could be accounted for by prolonged
anthropogenic inputs of carbon dioxide and an overall lower health condition in the
present-day population.
A dramatic decrease in carbon stable isotopes was measured in the latter portion
of the present-day baleen record. Sighting records confirmed that this isotopic decrease
was not due to a significant change in habitat use by the right whale population. Records
of zooplankton abundance and right whale calving records provide evidence that foraging
conditions improved in the Gulf of Maine just prior to the decline in baleen carbon
isotopes. The Pacific Decadal Oscillation and Southern Oscillation both changed phases
just prior to the observed decline, yet poor direct correlations were seen between the PDO
and ENSO indices and mean annual baleen isotope values. Also, the swift recovery of
the NAO following a historical low in 1996 established conditions that facilitated an
increase in Gulf of Maine C. finmarchicus (a lipid rich, isotopically light copepod
species) abundance, and a [lagged] increase in right whale reproductive success. The
increase in C. finmarchcus and right whale calving success occurred in tandem with the
baleen 813C decline.
Several studies have observed similar 813C declines in the stable isotope records
of marine mammals (including: northern fur seals, Newsome et al. 2007a-b; Steller sea
lions, Hirons 2001, Hobson et al. 2004; Hawaiian monk seals, Hirons 2008; and bowhead
whales, Schell 2000, Lee et al. 2005), although the duration of the record and magnitude
of the decline vary by species. The interpretation of these studies also varies, but

128
commonly cited explanations are: a change in foraging/migration behavior from coastal
to more offshore habitats (Hirons 2001, Hirons and Potter 2008), an ecosystem-wide
decrease in primary production (Schell 2000, Hirons 2001, Newsome et al. 2007b), or the
impact of the Pacific Decadal Oscillation (Newsome et al. 2007b). This study adds to the
rising number of observed dramatic and rapid decreases in marine mammal 813C records.
The wide geographic range represented by these studies (North Atlantic, North Pacific,
equatorial Pacific) suggests that a multiple phenomena (both regional (i.e. climatic
oscillations and changes in primary productivity) and global (i.e. environmental isotope
dilution from anthropogenic inputs) are influencing marine mammal foraging ecology in
a variety of marine ecosystems.
ACKNOWLEDGEMENTS
This work was funded by the Woods Hole Oceanographic Institution's Ocean
Life Institute, National Marine Fisheries Service (#NA04NMF4720403), and Boston
University Graduate School of Arts and Sciences. Don McAlpine, Charley Potter, James
Meade, Dee Allen, Richard Sabin, and Jerry Herman assisted with the museum sampling.
David Harris oversaw the stable isotope analysis of baleen samples at the UC Davis
Stable Isotope Laboratory. Philip Hamilton at the New England Aquarium provided data
from the North Atlantic Right Whale Catalog.

129
Table 4.1: Right Whale Life History Data and Baleen Sampling Plan. Whale
identification numbers correspond to the sample's code in the following museum
databases: Smithsonian National Museum of Natural History (NMNH), British Museum
of Natural History (BMNH), and National Museum of Scotland (NMS).; or the host
whale's identification number in the North Atlantic Right Whale Catalog (Eg#). U =
unknown.
Whale ID
NMNH 22640
BMNH ZD.1891.9.12.1
NMS 1907.117.1
NMS 1915.86.1
Eg1223
Eg1623
Egl014
Eg1238
Egl004
Eg2143
Eg2301
Eg2617
Age
U
A
U
A
12
12
30
19
34
14
12
9
Sex
U
M
U
U
F
M
F
M
F
F
F
F
Collection Year
1885
1892
1907
1915
1992
1996
1999
2001
2004
2005
2005
2005
Notes
Whaling - Long Island, NY (USA)
Whaling - Iceland
Whaling - Hebrides (Scotland)
Whaling - Hebrides (Scotland)
Vessel Collision, Nursing
Vessel Collision
Vessel Collision
Acute Fishing Gear Entanglement
Vessel Collision, Pregnant
Vessel Collision, Pregnant
Chronic Fishing Gear Entanglement
Vessel Collision

130
Table 4.2: Elemental abundances and stable isotope ratios in right whale baleen. Range
and mean ± 1 SD of elemental abundances (expressed as % dry weight), stable isotope
ratios and standards used, and range and mean ± 1 SD of stable isotope ratios (8)
measured in the baleen from historical and present-day North Atlantic right whales, (n)
denotes the number of whales samples / number of isotope data points collected.
Historical Whales (1882 - 1915)
„. Composition Isotope Ratio S Range (%o) n-iement ( M e a n ± 1 S D ) (Standard) (Mean±lSD) n
Carbon 25.8 to 68.1% (48.9 ± 2.9%)
3C/12C (PDB) -20.7 to-16.9 (-19.0 + 0.6) 4/344
Nitrogen 4.8 to 11.2 (8.4 ±1.5)
5N/14N (Air) 7.4 to 19.9% (13.8 ±1.0%) 4/344
Present-Day Whales (1986 - 2005)
Element Composition Isotope Ratio
(Mean ± 1 SD) (Standard) 5 Range (%c)
(Mean ± 1 SD)
Carbon 34.8 to 64.4% (47.1 ±2.2%)
3C/12C (PDB) -21.8 to-16.7 (-19.7 ±0.9) 8/793
Nitrogen 10.1 to 19.2% (14.1 ±0.8%)
5N/14N (Air) 7.0 to 12.1 (10.3 ±0.9) 8/793

131
Table 4.3: Statistical Comparison of Historical and Present-Day Right Whale Baleen
Isotope Ratios. Mean ± 1 SD of Historical, Present-Day, and Entangled right whale
baleen 513C and 515N are shown in upper section. Below, results of a one-way ANOVA
comparing the 813C and 815N values of H (n=4) and PD (n=8) whale baleen, as well as an
entangled right whale (n=l) are shown. The entangled right whale is from the PD group,
but the data that encompass the entanglement were treated separately for this analysis
(and removed from the PD group).
Group H
PD E
n 4 8 1
d u C -19.0 ±( -19.7 ±(
-21.0
3.2 3.2
d*N 8.7 ±1 10.2 ±
11.2
1.2 0.5
d u C Source
Between Groups Within Groups
Total
DF 2 10 12
Sum of Squares 3.57 0.35 3.93
Mean Square 1.79 0.04
F Ratio 50.34
Prob > F < 0.0001
d , sN Source
Between Groups Within Groups
Total
DF 2 10 12
Sum of Squares 7.90 5.33 13.23
Mean Square 7.89 0.53
F Ratio 7.41
Prob > F 0.01

132
Table 4.4: Correlation of Baleen 813C and 515N Data with Climatic Oscillation Indices.
Correlation coefficients (r) and p-value of correlations between annual mean baleen 813C
and 815N records and climate oscillation indices. Statistically significant correlations (a =
0.05) are highlighted in bold. Codes are as follows: NAO, North Atlantic Oscillation
Index; AMO, Atlantic Multi-decadal Oscillation Index; PDO, Pacific Decadal Oscillation
Index; and ENSO, El Nino Southern Oscillation Index.
813C 615N S13C 815N NAO PDO
LagO 0.15 0.54 0.45 0.05 LagO -0.19 0.42 0.19 0.43
Lagl 0.25 0.29 0.21 0.37 Lag 1 0.03 0.91 0.18 0.44
Lag 2 0.11 0.65 0.04 0.87 Lag 2 0.19 0.43 0.42 0.07
Lag 3 0.07 0.80 -0.01 0.97 Lag 3 0.43 0.06 0.45 0.05
AMO ENSO
LagO -0.41 0.08 -0.55 0.01 LagO 0.29 0.21 -0.17 0.47
Lagl -0.27 0.24 -0.52 0.02 Lagl 0.05 0.85 -0.10 0.75
Lag 2 -0.24 0.30 -0.50 0.02 Lag 2 -0.29 0.21 -0.09 0.71
Lag 3 -0.23 0.33 -0.42 0.07 Lag 3 -0.36 0.12 -0.11 0.67

133
Figure 4.1: Nitrogen and Carbon Stable Isotope Ratios in Right Whale Baleen, 1882 -
2005. 815N and 813C stable isotope records collected from the baleen of 12 North Atlantic
right whales, with each color representing data from an individual whale. Vertical
dashed lines are biennial in frequency.

12
10 1
8
7(A
1883
1887
1891
1895
1899
1903
1907
1911
1915
1987
1991 1995
1999
2003
.-ig
.,—i
1 1—i
1 1
1 1
1 1
1 1
1 1
1 1 1—-//-
-18
i
-20 H
-22 -f

135
Figure 4.2: Carbon and Nitrogen Stable Isotope Values of Historical (1882 - 1915) vs.
Present-day (1986 - 2005) Baleen Plates. Mean (± 1 SD) carbon and nitrogen stable
isotope values of baleen: (•) = Historical, 1882-1915 and (o) = Present-Day, 1986-2005.
(•) denotes the mean carbon and nitrogen isotope signature of an Entangled whale
(Eg2301), which was entangled for 6-9 months in 2004-2005. The entangled whale data,
although formed during the PD period, was removed from the PD group for analysis.

136
14
12
10 * .
8
6 • E (2004- 2005)
oPD (1986-2005)
• H (1882-1915)
d1 3C:H>PD>E(p<0.0001)
d1 5N:H<PD = E(p = 0.01)
-22 -20 -18
513C(%o)
•16

Figure 4.3: Atmospheric Carbon Dioxide Concentrations: 1832-2005. Annual mean
atmospheric carbon dioxide concentrations (ppm) analyzed from the Law Dome Ice
Cores (Antarctica, 1832-1978) and collected at the Barrow Observatory (Alaska, USA,
1971-2005).

138
400
E Q. Q_
N — '
CM o o o 0 r Q . C/)
O E A—»
380
360
340
320
300
280
260
Law Dome Ice Cores Barrow Observatory
1840 1880 1920 1960 2000

Figure 4.4: Nitrogen and Carbon Stable Isotope Measurements of Right Whale Baleen:
1986-2005. 815N and 513C baleen values, fit with a running mean, representing baleen
formed from 1986-2005. Lower panel illustrates the demographic contingency
represented in each year of baleen stable isotope data.

140
10 '"to
86 88 90 92 94 96
' " to -•
CO
-16
17
18
19
20
•21
22
•23
7 6 5 H 4 3 2 1 0
•o
;\
- \V "
t o
• ^ B
©*
e «
*
I 1 1
0
e %
«• A<
•
e
% a
8 •
:>*£ **£%
« •e ; 0
* * vA • >* #*V • ;
r ! • ! i . ; v ©
• •
v • •»
%
.*•• *?•<
1
•
86 88 — i —
90
Immature (M, F) Nulliparous (F) Reproductive (F) Male

Figure 4.5: Trends in Atmospheric and Oceanic Carbon Dioxide. Annual means of
atmospheric CO2 concentrations ( • , ppm) and 813C (o, %0) from 1986-2005.
Atmospheric CChwas measured from air samples collected at the Barrow Observatory
(Alaska, USA). Total dissolved CO2 (umol kg"1) was measured from surface (0-10m)
bottle samples at Bermuda Atlantic Time Series Stations (Bermuda).

142
340
2100
2080
1988 1992 1996 2000 2004
^ "o E 3.
O O
2060
2040
2020
2000
* ' • * * ' * * • ' *
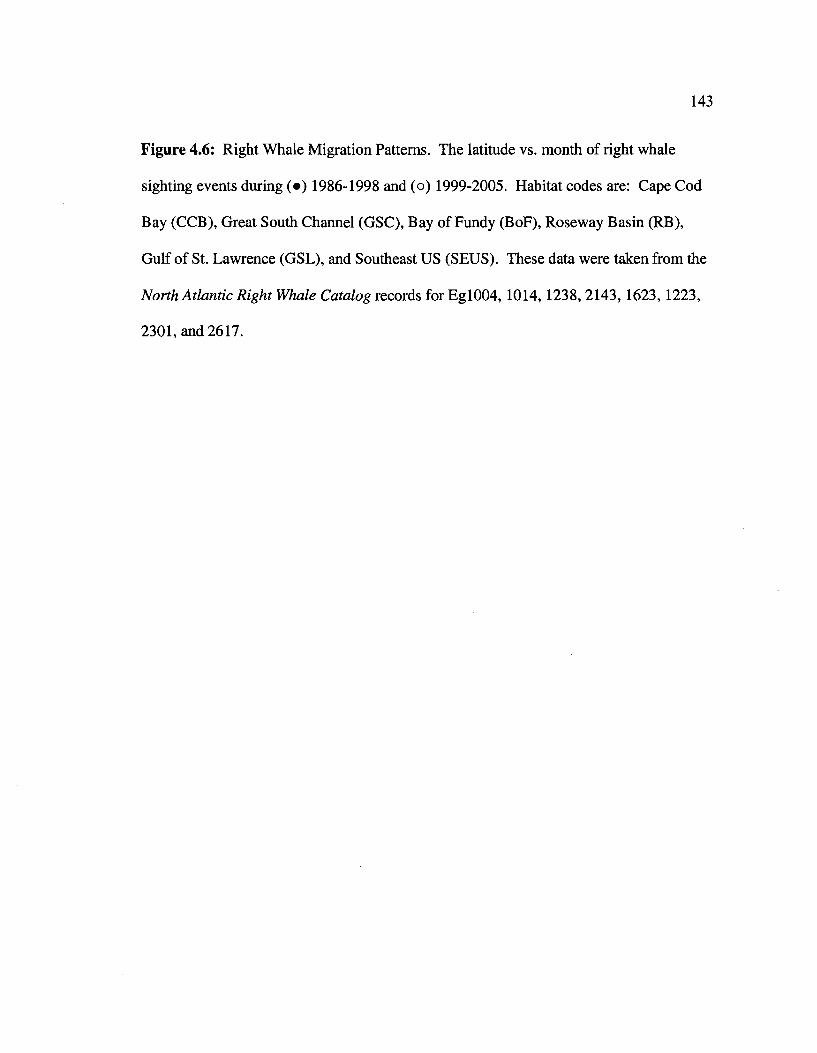
Figure 4.6: Right Whale Migration Patterns. The latitude vs. month of right whale
sighting events during (•) 1986-1998 and (o) 1999-2005. Habitat codes are: Cape Cod
Bay (CCB), Great South Channel (GSC), Bay of Fundy (BoF), Roseway Basin (RB),
Gulf of St. Lawrence (GSL), and Southeast US (SEUS). These data were taken from the
North Atlantic Right Whale Catalog records for Egl004,1014,1238, 2143,1623,1223,
2301, and 2617.
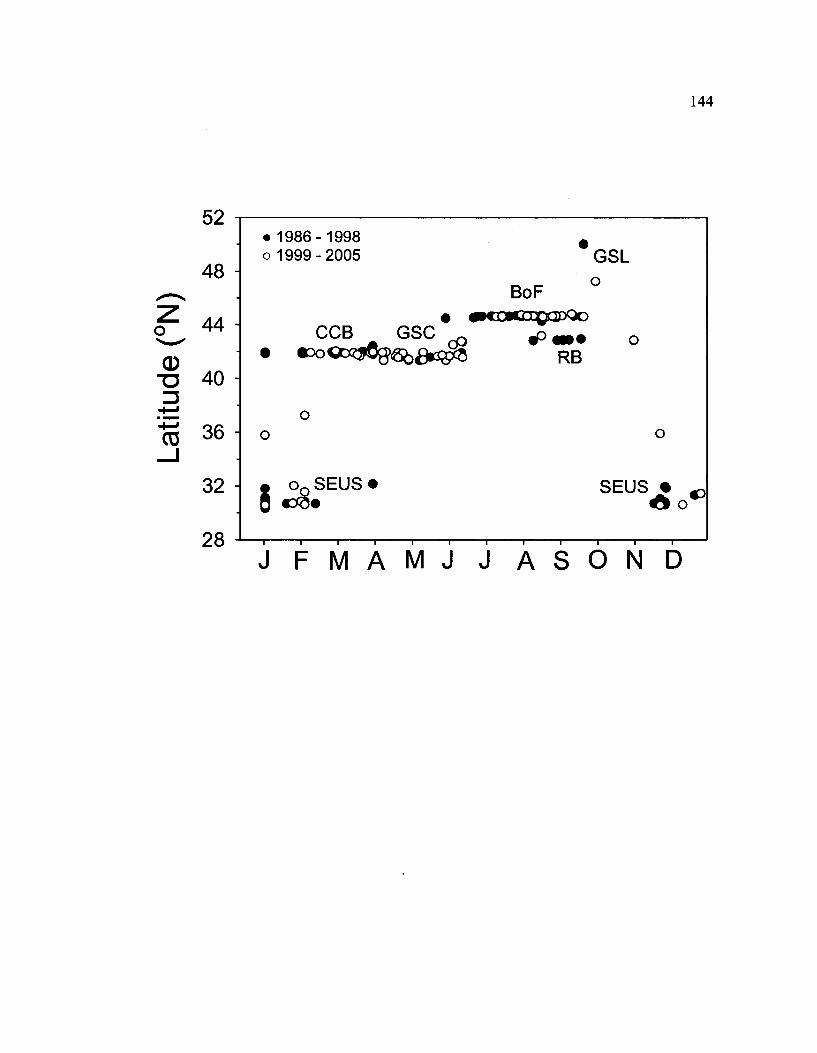
144
52
48 -\
C L 4 4
CD T5 40 ]
• 1986-1998 o 1999-2005 GSL
CCB GSC
BoF
cP •Doa^jO^gfc^KXgg RB
CO 36 -\
32
28
S OQ SEUS • SEUS » o «
-i r -i 1 1 r -i r
J F M A M J J A S O N D

Figure 4.7: Right Whale Reproductive Success. Measures of population-wide
reproductive success: Inter-birth interval (•) is an annual count of the mean number of
years between calving events for reproductively active females. Error bars represent ± 1
SE. Calving rate (•) is the number of tallied recruits to the population each year. Mean
(± 1 SE) inter-birth interval and calving rate are shown for 1986 - 1998 and 1999 - 2005
at the top of each panel.

146
^ 6 CO
CD 5
CD 3
jc = 4.38 ± 0.20 x = 4.42 ± 0.44
— i 1 1 1 1 1 1 1 1 1 1 —
1986 1988 1990 1992 1994 1996 1998 2000 2002 2004 2006
^ 35
30 ]
> 25]
CO CD >
CO
o £ "co
CO
O
20 H
15
10
0
3c= 11.36 ±1.44 x= 19.33 ±4.33
— i 1 1 1 1 1 1 1 1 1 1 —
1986 1988 1990 1992 1994 1996 1998 2000 2002 2004 2006

Figure 4.8: Climatic Oscillations: NAO, AMO, PDO, ENSO. The North Atlantic
Oscillation Index (NAO), Atlantic Multi-Decadal Oscillation Index (AMO), Pacific
Decadal Oscillation Index (PDO), and El Nino Southern Oscillation Index (ENSO) are
shown from 1986-2005. Horizontal bars over the oscillation indices represent the warm
(black) and cool (gray) phase of the PDO, and El Nino (black) and La Nina (gray) events
in the ENSO.

148
86 88 90 94 96 98

149
APPENDIX 1
HABITAT-SPECIFIC ZOOPLANKTON STABLE ISOTOPE RATIOS

Appendix la-g: Habitat-Specific Temporal Trends in Zooplankton Isotope and C:N
Ratios. The upper left panels in each figure are maps of zooplankton tows at individual
sampling sites and bathymetry (50 fathom/9lm and 200m isobaths). The locations of
zooplankton tows are shown by sampling year: 1998 (•), 1999 (•), 2000 (A), 2001 (•),
2004 (•), 2005 (•), 2006 (•), 2007 (A). The remaining panels display C:N and stable
isotope ratios (%o) for individual tows from the each collection year, within each
sampling site (•, x-axis plotted with random jitter). The regional mean (—) and 95%
confidence interval ( ) are shown for the pooled data from each sampling area.

Appendix la: Cape Cod Bay.
151
42'3ff-
42*-
41*30"
41*-
71-30'
Hip v5
*
•IV
B?«v
MBMr**
^^"^Ji "*$&
-70*30' -70*
M * m ^ k
fe ' * * - nk
II^^T mil s
0510 20 30 40 D O K = H Kilometers
Tow Locations: 2001 fl ), 2006 (•), 2007 (A)
-18
12
10
8
6
4 -
-•
- *
H h -
—II—
«» . • _ -
C:N
•
•
1 '
2001 2006 2007 2001 2006 2007

Appendix lb : Great South Channel.
152
43'-
42*30'-
42'-
irw-
iV-
WSO'-
-70'
' " ^aw
01020 40 60
-69'30 -69-
« • » »
•i • » • • » •>
• • • • » » • -
80 H I Kilometers
•WW
*
•
-68' -e?'30'
Tow Locations: 2004 (•), 2005 (| ), 2006 (•), . 2007(A)
12
10 •
8 -
6 -
4 -
• •
_ _ • • . — •
•
•
~ «_: .... —^—
«
C:N
• #*-
•
18
20 -
22
24 -
26 -* — <
•
»
•*•» 4 . .
«» •
*
813C raw
•
-».
• • •
-18
-20 ^
-22
-24
-26
- •- -
„ $ •
i **
•
513CLN
• • • •
• • •
2004 2005 2006 2007 2004 2005 2006 2007

Appendix lc: Bay of Fundy.
153
-87*30' -67* -68Q30' -6(3°
1999 2000 2005 2006 1999 2000 2005 2006

Appendix Id: Roseway Basin.
154
+»••
43'3ff'
43* •
42 '30 ' .
42 ' .
-66* -65*30'
.*
-65* -64*30'
01020 40 60
-64*
-..,
eo Milometers
Tow Locations: 1998 (•), 1999 (•), 2000 (A), 4
2005 (| )
-18
-20
-22
-24
-26
> ~ ~
I ,
* <•»
1
-
_ _ • _
•»
\—
813C raw
-
• •
HI .
3 2 i
28
24
20
16
I II-5 1 s O
•
1998 1999 2000 2005 1998 1999 2000 2005

Appendix le: Nova Scotian Shelf.
155
4 5 ' 30' '
45*-
44" 30' '
44* •
43'30'-
43'•
«*30-
42" •
-65* -64*30' -64* -63*30' -63*
• *
•
0
-62*30'
•
; -
• •
20 40 80
62 -@1930' - e r
•
120 160 i-zMMMKifometers
Tow Locations: 1998 (•), 1999 (*)
12
10
8
6
4
— * - » « * — -^r** • * •
C:N
* * «
•
-18
-20
-22
-24
-26
• «
~ t T •
8"CL N
" «, * - • . ; _ -
1998 1999
1998 1999

Appendix If: Northeast Georges Bank.
156
43°-
42*3ff'
« * •
41*30'
41'-
-157-30' -67* $$'w
/'
• ' " '
-ee*
-
m
1
01020 40
-65'30'
, , <„ ; ' "
60 80 = • • Kilometers
Tow Locations: 2005 (| ), 2007 (A).
2005 2007 2005 2007

Appendix lg: Jeffreys Ledge
157
Tow Locations: 2006 (•)
C:N
2006 2006

158
APPENDIX 2
NORTH ATLANTIC RIGHT WHALE CASE HISTORIES AND BALEEN
STABLE ISOTOPE RECORDS

159
CASE HISTORIES
The available life history data and case histories of each whale sampled in this study are
described in the following section. Necropsy reports for each whale were referenced
(Moore et al. 2005, Right Whale Consortium 2008a), as were individual sighting and
calving records contained in the North Atlantic Right Whale Catalog (Right Whale
Consortium 2008b). All baleen isotope records for each whale are reported here, with the
sighting records displayed over the isotope data such that the colored triangles represent
an isotope data point that contained a sighting event. In all of the subsequent figures, the
color-coding designates the following habitat areas:
T = Cape Cod Bay • = Great South Channel T =Bay ofFundy T = Roseway Basin • = Jeffreys Ledge • = Mid-Atlantic V = Southeast US (GA/FL coast)
= Gulf of St. Lawrence
Life history is also denoted on the baleen isotope records. Reproductive events such as
calving (C) and the year of pregnancy (P) preceding and year of lactation (L) following
calving events are noted. For immature whales and calves, ontogenetic diet shifts are
associated with birth (commencement of nursing) and weaning (commencement of a
planktonic diet) are denoted by grayscale bars over the isotope record. Birth and weaning
are denoted by vertical dashed gray lines. The month/year of death are shown at the end
of each time series. Since baleen growth in young whales is highly variable, no attempts
were made to assign individual baleen isotope data points a Julian Day value, nor were

160
sighting records applied to the data. The year of birth was calculated retroactively given
the estimated age of the immature whales and calves, and the structure of their isotope
records. The month of December was arbitrarily assigned as the month of birth, based on
observations of peak right whale calving in the southeast US.

161
o o D)
LU
(°°/o) N g ^ (°%)0Bl9
(°%) O e ^

162
CM O O CM
CO
-i 1 1 1 1 1 1 1 1 1 1 1 r
C O C M t - O O C O I ^ C O 00 CM
CO CM
•"si-CM
CM CM
O CM
(°%) NslS (»%)08l9
CO
UJ
(°%) 0e i§ (00/o)Q§
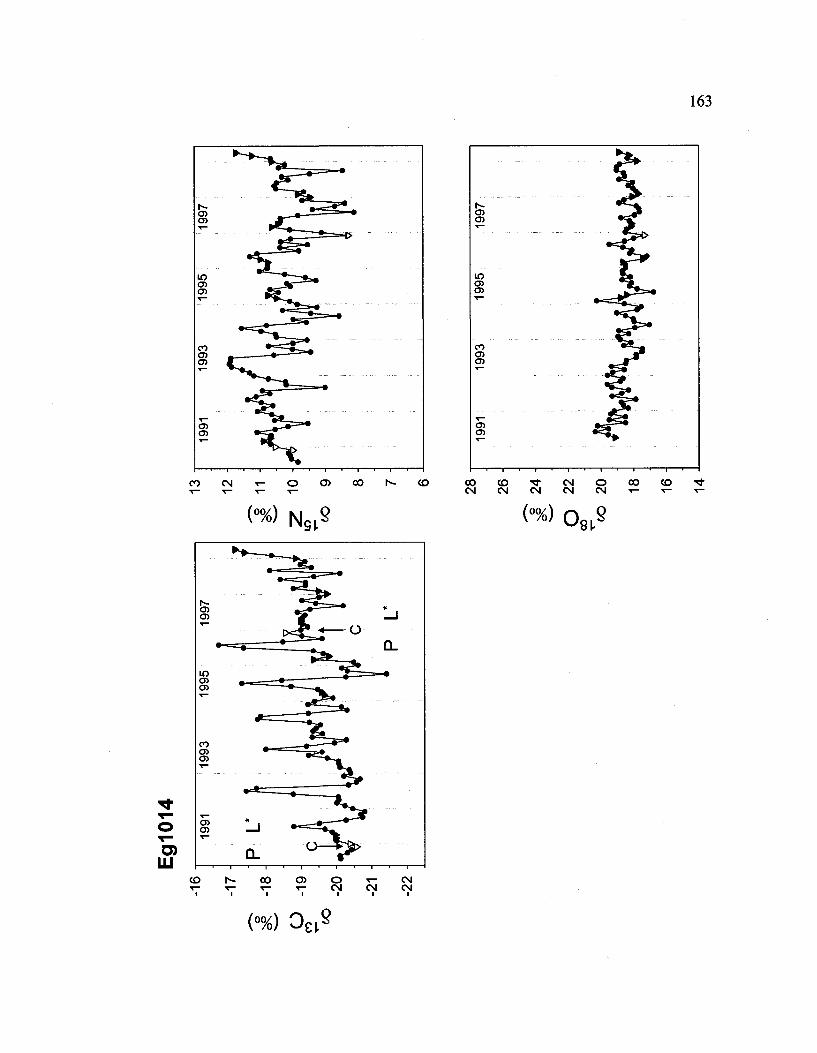
163
00 CM
CO CM
• * -
CM CM CM
O CM
CO T —
(°%) N g l 9 (°%) Q 8 ^
o
LU
(To) 0 e ^

164
(•») Ns,9 K> 08l9
o CO CM O)
HI
2004
CM
200:
20
00
998
T— •
996
T~~
994
1
_ l
Q.
» " T - ' • '
^ .
O —£T*£=*
—i 1 1 1 1 1 1
CO 00 o> O T -C\| CM
CM CM
(°%) Q_,9 'ei.

165
CO CM O O) 00 I s - CD CO CM
CO CM
• *
CM CM CM
O CM
CO T —
(°%) N g l 9 (»%) o8,§
00 CO CM
LU
(°%) o e t 8

166
(°%) Hgi9
to CM O) LU
(°%) Oei2

167
CO CM
<**> Ns lS
CO CM CM
O) LU
992
990
988
986
1 1
_ l
Q_
1 1
O —*%~
~ fc
i 1 1 1 • 1 ' 1
CO 00 O) o CM
(°%) 0£L§
CM CM CM

168
CO CM
<o
w
CO CM
(°%) Ngi9
(°%) Q a §

3
m CO
Eg
2220
14
13 ]
12
11
H
10 9 8
o
^p
0
s
O
CO
^C
O
-17'
--1
8 :
-19
:
-20
:
-21
--2
2 -
Fet
us
Nur
sing
P
lank
ton
ON

J
10 C
O
3 o
CO
Eg
2366
F
etus
N
ursi
ng
Pla
nkto
n
Bor
n:
12/1
992
Die
d:
07/1
995
o

171
(°%)N 2 (°%)0 § ei.

172
LLI
(00/o) NslS (°%) Oc,8

o •N
©
ON
ID CO
ON
o
CO
MH
-79-
02 6
-Eg
F
etus
N
ursi
ng
Pla
nkto
n
Bo
rn:
12/1
977
Die
d:
03/1
979

174
D) HI
•
© •
m
^ CO CM T - O O) 00 S CO O) O T - CM
(°%) Ng t2 (oo/o) 0 ^ §

175
.x\
C
e 3
I
CO o CD o
LJJ
^ ^" 00 CN 0 0 ) 0 0 0 0 0 ) O T - C M
v- r r M M (V i i i i i
(•%) N9 l8 (°°/o)oct9

176
c
CO
o LL
CM O <0
lil
z m
^ 00 CM
(°%) NQL2 (°%) Q C I 9 ei.

177
C
3 Z
(A 3 * - »
UJ •
CD
o CD
00 O) O <«- CN T - T - CM CM CM
i i i i i
(°°/o)Ngi§ (°%)Qa9

178
LITERATURE CITED
Ambrose, S. H., and M. J. DeNiro. 1986. Reconstruction of African human diet using bone collagen and nitrogen isotope ratios. Nature 319:321-324.
Angell, C. A. 2005. Body fat condition of free-ranging right whales, Eubalaena glacialis and Eubalaena australis. Ph.D. dissertation, Boston University, Boston, MA.
Ayliffe, L. K., T. E. Ceding, T. Robinson, A. G. West, M. Sponheimer, B. H. Passey, J. Hammer, B. Roeder, M. D. Dearing, and J. R. Ehleringer. 2004. Turnover of carbon isotope in tail hair and breath CO2 of horses fed an isotopically varied diet. Oecologia 139:11-22.
Baumgartner, M. F., T. V. N. Cole, P. J. Clapham, and B. R. Mate. 2003. North Atlantic right whale habitat in the Bay of Fundy and on the SW Scotian Shelf during 1999-2001. Marine Ecology Progress Series 264:137-154.
Baumgartner, M. F., and B. R. Mate. 2003. Summertime foraging ecology of North Atlantic right whales. Marine Ecology Progress Series 264:123-135.
Baumgartner, M. F., and B. R. Mate. 2005. Summer and fall habitat of North Atlantic right whales {Eubalaena glacialis) inferred from satellite telemetry. Canadian Journal of Fisheries and Aquatic Sciences 62:527-543.
Baumgartner, M. F., C. A. Mayo, and R. D. Kenney. 2007. Enormous carnivores, microscopic food, and a restaurant that's hard to find. In: S. D. Kraus and R. M. Rolland (eds). The Urban Whale. Harvard University Press, Cambridge, MA. 576 pages.
Beardsley, R. C , A. W. Epstein, C. Chen, K. F. Wishner, M. C. Macaulay, and R. D. Kenney. 1996. Spatial variability in zooplankton abundance near feeding right whales in the Great South Channel. Deep-Sea Research II 43:1601-1625.
Benway, H. M., and C. Mix. 2004. Oxygen isotopes, upper-ocean salinity, and precipitation sources in the eastern tropical Pacific. Earth and Planetary Science Letters 224:493-507.
Best, P. B. 1994. Seasonality of reproduction and length of gestation in southern right whales, Eubalaena australis. Journal of Zoology 232:175-189.
Best, P. B., and D. M. Schell. 1996. Stable isotopes in southern right whale (Eubalaena australis) baleen as indicators of seasonal movements, feeding and growth.

179
Marine Biology 124:483-494.
Bigelow, H. B. 1926. Plankton of the offshore waters of the Gulf of Maine. Bulletin of the Bureau of Fisheries 40:1-509.
Bigelow, H. B. 1927. Physical oceanography of the Gulf of Maine. Bulletin of the United States Commerce Bureau 40:511-1027.
Bond, N. A., and D. E. Harrison. 2000. The Pacific Decadal Oscillation, air-sea interaction and central North Pacific winter atmospheric regimes. Geophysical Research Letters 27:731-734.
Bowen, G. J., L. Chesson, K. Nielson, T. E. Ceding, and J. R. Ehleringer. 2005a. Treatment methods for the determination of 82H and 8180 of hair keratin by continuous-flow isotope-ratio mass spectrometry. Rapid Communications in Mass Spectrometry 19:2371-2378.
Bowen, G. J., L. I. Wassenaar, and K. A. Hobson. 2005b. Global applications of stable hydrogen and oxygen isotopes to wildlife forensics. Oecologia 143:337-348.
Bowen, W. D., and D. B. Siniff. 1999. Distribution, population biology, and feeding ecology of marine mammals. In: J. E. Reynolds III and S. E. Rommel (eds). Biology of Marine Mammals. Smithsonian Institution Press, Washington, D.C. 578 pages.
Brooks, D. A. 1985. Vernal circulation in the Gulf of Maine. Journal of Geophysical Research 90:4687-4705.
Brown, W. S., and R. C. Beardsley. 1978. Winter Circulation in the Western Gulf of Maine: Parti . Cooling and water mass formation. Journal of Physical Oceanography 8:265-277.
Brown, S. G. 1986. Twentieth-century records of right whales (Eubalaena glacialis) in the Northeast Atlantic Ocean. Reports of the International Whaling Commission Special Issue 10:121-127.
Brown, M. W., S. Brault, P. K. Hamilton, R. D. Kenney, A. R. Knowlton, M. K. Marx, C. A. Mayo, C. K. Slay, and S. D. Kraus. 2001. Sighting heterogeneity of right whales in the western North Atlantic: 1980-1992. Journal of Cetacean Research and Management Special Issue 2: 245-250.
Brown, M. W., S. D. Kraus, C. K. Slay, and L. P. Garrison. 2007. Surveying for discovery, science, and management. In: S. D. Kraus and R. M. Rolland (eds). The Urban Whale. Harvard University Press, Boston. 576 pages.

180
Burton, R. K., and P. L. Koch. 1999. Isotopic tracking of foraging and long-distance migration in northeastern Pacific pinnipeds. Oecologia 119:578-585.
Butman, B., and R. Beardsley. 1987. Physical oceanography. In: R. H. Backus and D. W. Bourne (eds). Georges Bank. MIT Press, Cambridge, MA.
Campbell-Malone, R., S. G. Barco, P. Y. Daoust, A. R. Knowlton, W. A. McLellan, D. S. Rotstein, and M. J. Moore. 2008. Gross and histologic evidence of sharp and blunt trauma in North Atlantic right whales (Eubalaena glacialis) killed by vessels. Journal of Zoo and Wildlife Medicine 39:37-55.
Caraveo-Patino, J., K. A. Hobson, and L. A. Soto. 2007. Feeding ecology of gray whales inferred from stable-carbon and nitrogen isotopic analysis of baleen plates. Hydrobiologia 586:17-25.
Caraveo-Patino, J., and L. A. Soto. 2005. Stable carbon isotope ratios for the gray whale (Eschrichtius robustus) in the breeding grounds of Baja California Sur, Mexico. Hydrobiologia 539:99-107.
Clapham, P. J., C. Good, S. E. Quinn, R. R. Reeves, J. E. Scarff, and R. L. Brownell. 2004. Distribution of North Pacific right whales {Eubalaena japonica) as shown by 19th and 20th century whaling catch and sighting records. Journal of Cetacean Research and Management 6:1-6.
Clapham, P. J. 2000. The humpback whale: seasonal feeding and breeding in a baleen whale. In: J. Mann, R. C. Connor, P. L. Tyack, and H. Whitehead (eds). Cetacean Societies. University of Chicago Press, Chicago, IL. 433 pages.
Clapham, P. J., S. B. Young, and R. L. Brownell. 1999. Baleen whales: conservation issues and the status of the most endangered populations. Mammal Review 29:35-60.
Cole T. V. N., P. Gerrior, R. L. Merrick. 2007. Methodologies and preliminary results of the NOAA National Marine Fisheries Service aerial survey program for right whales (Eubalaena glacialis) in the northeast U.S., 1998-2006. U.S. Department of Commerce, Northeast Fisheries Science Center Reference Document 07-02; 11 P-
Cooper, L. W., and M. J. DeNiro. 1989. Oxygen-18 content of atmospheric oxygen does not affect the oxygen isotope relationship between environmental water and cellulose in a submerged aquatic plant, Egeria densa Planch. Plant Physiology 91:536-541.

181
Coplen, T. B. 1994. Reporting of stable hydrogen, carbon, and oxygen isotopic abundances. Pure and Applied Chemistry 168:273-276.
Costa, A. D., E. G. Durbin, and C. A. Mayo. 2006. Variability in the nutritional value of the major copepods in Cape Cod Bay (Massachusetts, USA) with implications for right whales. Marine Ecology 27:109-123.
Craig, H. 1957. Isotopic standards for carbon and correction factors for mass spectrometric analysis of carbon dioxide. Geochimica Cosmochimica Acta 12:133-149.
Craig, H., and L. I. Gordon. 1965. Deuterium and oxygen-18 variations in the ocean and the marine atmosphere. Marine Geochemistry 3:277-374.
Cullen, J. T., Y. Rosenthal, and P. G. Falkowski. 2001. The effect of anthropogenic CO2 on the carbon isotope composition of marine phytoplankton. Limnology and Oceanography 46:996-998.
deHart, P. A. P. 2006. A multiple stable isotope study of Steller sea lions and bowhead whales: signals of a changing northern environment. Ph.D. dissertation, University of Alaska Fairbanks, Fairbanks, AK.
DeNiro, M. J., and S. Epstein. 1978. Influence of diet on the distribution of carbon isotopes in animals. Geochimica et Cosmochimica Acta 42:495-506.
DeNiro, M. J., and S. Epstein. 1981. Influence of diet on the distribution of nitrogen isotopes in animals. Geochimica et Cosmochimica Acta 45:341-351.
Doney, S. C , N. Mahowld, I. Lima, R. A. Feely, F. T. Mackenzie, J. F. Lamarque, and P. J. Rasch. 2007. Impact of anthropogenic atmospheric nitrogen and sulfur deposition on ocean acidification and the inorganic carbon system. Proceedings of the National Academy of Sciences 104:14580-14585.
Durbin, E. G., R. G. Campbell, M. C. Casas, M. D. Ohman, B. Niehoff, J. Runge, and M. Wagner. 2003. Interannual variation in phytoplankton blooms and zooplankton productivity and abundance in the Gulf of Maine during winter. Marine Ecological Progress Series 254:81-100.
Englebrecht, A. C , and J. P. Sachs. 2005. Determination of sediment provenance at drift sites using hydrogen isotopes and unsaturation ratios in alkenones. Geochimica Cosmochimica Acta 69:4253-4265.
Etheridge, D. M., L.P. Steele, R.L. Langenfelds, R.J. Francey, J.-M. Barnola and V.I. Morgan. 1998. Historical CO2 records from the Law Dome DE08, DE08-2, and

182
DSS ice cores. In: Trends: A Compendium of Data on Global Change. Carbon Dioxide Information Analysis Center, Oak Ridge National Laboratory, U.S. Department of Energy, Oak Ridge, TN, U.S.A.
Frasier, T. M., P. K. Hamilton, M. W. Brown, L. A. Conger, A. R. Knowlton, M. K. Marx, C. K. Slay, S. D. Kraus, and B. N. White. 2007. Patterns of male reproductive success in a highly promiscuous whale species: the endangered North Atlantic right whale. Molecular Ecology 16:5277-5293.
Frasier, T. M., B. A. McLeod, R. M. Gillett, M. W. Brown, and B. N. White. 2007b. Right whales past and present as revealed by their genes. In: S. D. Kraus and R. M. Rolland (eds). The Urban Whale. Harvard University Press, Cambridge, MA. 576 pages.
Fry, B. 2006. Stable Isotope Ecology. Springer, New York, NY. 308 pages.
Fry, B., and S. C. Wainright. 1991. Diatom sources of 13C-rich carbon in marine food webs. Marine Ecological Progress Series 76:149-157.
Fujiwara, M., and H. Caswell. 2001. Demography of the endangered North Atlantic right whale. Nature 414:539-541.
Fuller, B. T., J. L. Fuller, N. E. Sage, D. A. Harris, T. C. O'Connell, and R. E. M Hedges. 2004. Nitrogen balance and 515N: why you're not what you eat during pregnancy. Rapid Communications in Mass Spectrometry 18:2889-2896.
Fuller, B. T., J. L. Fuller, N. E. Sage, D. A. Harris, T. C. O'Connell, and R. E. M. Hedges. 2005. Nitrogen balance and 815N: why you're not what you eat during nutritional stress. Rapid Communications in Mass Spectrometry 19:2497-2506.
Gannes, L. Z., D. M. O'Brien, C. Martinez Del Rio. 1997. Stable isotopes in animal ecology : assumptions, caveats, and a call for more laboratory experiments. Ecology 78:1271-1276.
Gao, Y. and R. J. Beamish. 2003. Stable isotope variations in otoliths of Pacific halibut (Hippoglossus stenolepis) and indications of the possible 1990 regime shift. Fisheries Research 60:393-404.
Garrett, C. J. R., J. R. Keeley, and D. A. Greenberg. 1978. Tidal mixing versus thermal stratification in the Bay of Fundy and Gulf of Maine. Atmosphere-Ocean 16:403-423.
Goericke, R., and B. Fry. 1994. Variations of marine plankton 513C with latitude, temperature, and dissolved CO2 in the world ocean. Global Biogeochemical
183
Cycles 8:85-90.
Greene, C. H., and A. J. Pershing. 2000. The response of Calanus finmarchicus populations to climate variability in the Northwest Atlantic: basin-scale forcing associated with the North Atlantic Oscillation. ICES Journal of Marine Science 57:1536-1544.
Greene, C. H., and A. J. Pershing. 2003. The flip-side of the North Atlantic Oscillation and modal shifts in slope-water circulation patterns. Limnology & Oceanography 48:319-322.
Greene, C. H., A. J. Pershing, R. D. Kenney, and J. W. Jossi. 2003. Impact of climate variability on the recovery of endangered North Atlantic right whales. Oceanography 16:98-103.
Greene, C. H., and A. J. Pershing. 2004. Climate and the conservation biology of North Atlantic right whales: the right whale at the wrong time? Frontiers in Ecology and the Environment 2:29-34.
Greene, C. H., A. J. Pershing, A. Conversi, B. Planque, C. Hannah, D. Sameoto, E. Head, P. C. Smith, P. C. Reid, J. Jossi, D. Mountain, M. C. Benfield, P. H. Wiebe, and E. Durbin. 2003. Trans-Atlantic responses of Calanus finmarchicus populations to basin-scale forcing associated with the North Atlantic Oscillation. Progress in Oceanography 58:301-312.
Hall, P., J. Reimann, and J. Rice. 2000. Nonparametric estimation of a periodic function. Biometrika 87:545-557.
Hamilton, P. K., M. K. Marx, and S. D. Kraus. 1995. Weaning in North Atlantic right whales. Marine Mammal Science 11:386-390.
Hamilton, P. K., and C. A. Mayo. 2001. Population characteristics of right whales {Eubalaena glacialis) observed in Cape Cod and Massachusetts Bays, 1978-1986. Journal of Cetacean Research and Management Special Issue 2:203-208.
Hamilton, P. K., A. R. Knowlton, and M. K. Marx. 2007. Right whales tell their own stories: the photo-identification Catalog. In: S. D. Kraus and R. M. Rolland (eds). The Urban Whale. Harvard University Press, Cambridge, MA. 576 pages.
Hinga, K. R., M. A. Arthur, M. E. Q. Pilson, and D. Whitaker. 1994. Carbon isotope fractionation by marine phytoplankton in culture: The effects of CO2 concentration, pH, temperature, and species. Global Biogeochemical Cycles 8:91-102.

184
Hirche, H. J. 1996. Diapause in the marine copepod, Calanus finmarchicus - a review. Ophelia 44:129-143.
Hirons, A. C , D. M. Schell, and B. P. Finney. 2001. Temporal records of 813C and 815N in North Pacific pinnipeds: inferences regarding environmental change and diet. Oecologica 129:591-601.
Hirons, A. C. and C. W. Potter. 2008. Contribution of commercial fishing to the decline in Hawaiian monk seals (Monachus schauinslandi). American Society of Limnology and Oceanography Ocean Sciences Meeting. March 2-7, Orlando, FL. Abstract.
Hobson, K. A., R. T. Alisauskas, and R. G. Clark. 1993. Stable-nitrogen isotope enrichment in avian tissues due to fasting and nutritional stress: implications for isotopic analysis of diet. Condor 95:388-394.
Hobson, K. A. 1999. Tracing origins and migration of wildlife using stable isotopes: a review. Oecologia 120:314-326.
Hobson, K. A., L. Atwell, and L. I. Wassenaar. 1999. Influence of drinking water and diet on the stable hydrogen isotope ratios of animal tissues. Proceedings of the National Academy of Sciences 96:8003-8006.
Hobson, K. A., E. H. Sinclair, A. E. York, J. R. Thomason, and R. E. Merrick. 2004. Retrospective isotopic analyses of Steller sea lion tooth annuli and seabird feathers: a cross-taxa approach to investigating regime and dietary shifts in the Gulf of Alaska. Marine Mammal Science 20:621-638.
Hobson, K. A. 2005. Using stable isotopes to trace long-distance dispersal in birds and other taxa. Diversity and Distributions 11:157-164.
Hobson, K. A. 2007. Isotopic tracking of migrant wildlife. In: R. Michener and K. Lajtha (eds). Stable Isotopes in Ecology and Environmental Science. Blackwell Publishing, Maiden, MA. 566 pages.
Houghton, R. W., and R. G. Fairbanks. 2001. Water sources for Georges Bank. Deep-Sea Research II 48:95-114.
Hurrell, J. W. 1995. Decadal trends in the North Atlantic Oscillation: Regional temperatures and precipitation. Science 269:676-679.

185
Intergovernmental Panel on Climate Change (IPCC). 2007. IPCC Fourth Assessment Report: Climate Change 2007. A. Allali et al. (eds.) Cambridge University Press, Cambridge, http://www.ipcc.ch/ipccreports/assessments-reports.html.
International Whaling Commission (IWC). 2001a. Report of the workshop on status and trends of western North Atlantic right whales. Journal of Cetacean Research and Management Special Issue 2:61-87.
International Whaling Commission (IWC). 2001b. Report of the workshop on the comprehensive assessment of right whales: a worldwide comparison. Journal of Cetacean Research and Management Special Issue 2:1-60
Jacobsen, K. O., M. K. Marx, and N. Oien. 2004. Two-way trans-Atlantic migration of a North Atlantic right whale (Eubalaena glacialis). Marine Mammal Science 20:161-166.
Jamieson, R. E., H. P. Schawarcz, and J. Brattey. 2004. Carbon isotopic records from the otoliths of Atlantic cod (Gadus morhua) from eastern Newfoundland, Canada. Fisheries Research 68:83-97.
Jenkins, S. G., S. T. Partridge, T. R. Stephenson, S. D. Farley, and C. T. Robbins. 2001. Nitrogen and carbon isotope fractionation between mothers, neonates, and nursing offspring. Oecologia 129:336-341.
Kakela, A., R. W. Furness, A. Kelly, U. Strandberg, S. Waldron, and R. Kakela. 2007. Fatty acid signatures and stable isotopes as dietary indicators in North Sea seabirds. Marine Ecological Progress Series 342:291-301.
Kelly, J. F. 2000. Stable isotopes of carbon and nitrogen in the study of avian and mammalian trophic ecology. Canadian Journal of Zoology 78:1-27.
Kendall, C , E. M. Elliott, and S. D. Wankel. 2007. Tracing anthropogenic inputs of nitrogen to ecosystems. In: R. Michener and K. Lajtha (eds). Stable Isotopes in Ecology and Environmental Science. Blackwell Publishing, Maiden, MA. 566 pages.
Kenney, R. D. 2001. Anomalous 1992 spring and summer right whale {Eubalaena glacialis) distributions in the Gulf of Maine. Journal of Cetacean Research and Management Special Issue 2: 209-223.
Kenney, R. D. 2002. North Atlantic, North Pacific, and southern right whales. In: W. F. Perrin, B. Wursig, and J. G. M. Thewissen (eds). Encyclopedia of Marine Mammals. Academic Press, San Diego, CA.

186
Kerr, L. A., A. H. Andrews, G. M. Cailliet, T. A. Brown, and K. H. Coale. 2006. Investigations of A14C, 513C, and 815N in vertebrae of white shark (Carcharodon carcharias) from the eastern North Pacific Ocean. Environmental Biology of Fishes 77:337-353.
Knowlton, A. R., J. Sigurjosson, J. N. Ciano, and S. D. Kraus. 1992. Long-distance movements of North Atlantic right whales (Eubalaena glacialis). Marine Mammal Science 8:397-404.
Knowlton, A. R., S. D. Kraus, and R. D. Kenney. 1994. Reproduction in North Atlantic right whales (Eubalaena glacialis). Canadian Journal of Zoology 72:1297-1305.
Knowlton, A. R., and S. D. Kraus. 2001. Mortality and serious injury of northern right whales (Eubalaena glacialis) in the western North Atlantic. Journal of Cetacean Research and Management Special Issue 2:193-208.
Knowlton, A. R., M. K. Marx, H. M. Pettis, P. K. Hamilton, and S. D. Kraus. 2005. Analysis of scarring on North Atlantic right whale (Eubalaena glacialis): Monitoring rates of entanglement interactions: 1980-2002. Final Report to the National Marine Fisheries Service. 20 pp.
Koch, P. L. 2007. Isotopic study of the biology of modern and fossil vertebrates. In: R. Michener and K. Lajtha (eds). Stable Isotopes in Ecology and Environmental Science. Blackwell Publishing, Maiden, MA. 566 pages.
Kraus, S. D., J. H. Prescott, A. R. Knowlton, and G. S. Stone. 1986a. Migration and calving of right whales (Eubalaena glacialis) in the Western North Atlantic. Reports of the International Whaling Commission Special Issue 10:139-144.
Kraus, S. D., K. E. Moore, C. E. Price, M. J. Crone, W. A. Watkins, H. E. Winn, and J. H. Prescott. 1986b. The use of photographs to identify North Atlantic right whales (Eubalaena glacialis). Reports of the International Whaling Commission Special Issue 10: 145-151.
Kraus, S. D., P. K. Hamilton, R. D. Kenney, A. R. Knowlton, and C. K. Slay. 2001. Reproductive parameters of the North Atlantic right whale. Journal of Cetacean Research and Management Special Issue 2:231-236.
Kraus, S. D., M. W. Brown, H. Caswell, C. W. Clark, M. Fujiwara, P. K. Hamilton, R. D. Kenney, A. R. Knowlton, S. Landry, C. A. Mayo, W. A. McLellan, M. J. Moore, D. P. Nowacek, D. A. Pabst, A. J. Read, and R. M. Rolland. 2005. North Atlantic right whales in crisis. Science 309:561-562.
Kraus, S. D., R. M. Pace, and T. M. Frasier. 2007. High investment, low return: the

187
strange case of reproduction in Eubalaena glacialis. In: S. D. Kraus and R. M. Rolland (eds). The Urban Whale. Harvard University Press, Cambridge, MA. 576 pages.
Kroopnick, P. M. 1985. The distribution of 13C of CO2 in the world oceans. Deep-Sea Research 32:57-84.
Kurle, C. M., and G. A. J. Worthy. 2001. Stable isotope assessment of temporal and geographic differences in feeding ecology of northern fur seals (Callorhinus ursinus) and their prey. Oecologia 126:254-265.
Laws, E. A., B. N. Popp, R. R. Bidigare, M. C. Kennicutt, and S. A. Macko. 1995. Dependence of phytoplankton carbon isotopic composition on growth rate and [CCh]aq: Theoretical considerations and experimental results. Geochimica Cosmochimica Acta 59:1131-1138.
Leaper, R., J. Cooke, P. Trathan, K. Reid, V. Rowntree, and R. Payne. Global climate drives southern right whale (Eubalaena australis) population dynamics. Biology Letters doi:10.1098/rsbl.2005.0431, 3 pages.
Lee, S. H., D. M. Schell, T. L. McDonald, and W. J. Richardson. 2005. Regional and seasonal feeding by bowhead whales Balaena mysticetus as indicated by stable isotope ratios. Marine Ecological Progress Series 285:271-287
Lein, J., R. Sears, G. B. Stenson, P. W. Jones, and I. H. Ni. 1989. Right whale, Eubalaena glacialis, sightings in waters off Newfoundland and Labrador and the Gulf of St Lawrence, 1978-1987. The Canadian Field Naturalist 103:91-93.
Lubetkin, S. C , J. E. Zeh, C. Rosa, and J. C. George. 2008. Age estimation for young bowhead whales (Balaena mysticetus) using annual baleen growth increments. Canadian Journal of Zoology 86:525-538.
Malik, S., M. W. Brown, S. D. Kraus, A. R. Knowlton, P. K. Hamilton, and B. N. White. 1999. Assessment of mitochondrial DNA structuring and nursery use in the North Atlantic right whale (Eubalaena glacialis). Canadian Journal of Zoology 77:1217-1222.
Mariotti, A. 1985. Natural 15N abundance measurements and atmospheric nitrogen standard calibration. Nature 311:251-252.
Mate, B. R., S. L. Nieukirk, and S. D. Kraus. 1997. Satellite-monitored movements of northern right whales. Journal of Wildlife Management 61:1393-1405.

188
Mate, B., R. Mesecar, and B. Lagerquist. 2007. The evolution of satellite-monitored radio tags for large whales: One laboratory's experience. Deep Sea Research II 54:224-247.
Matthews, B., and A. Mazumder. 2005. Temporal variation in body composition (C:N) helps explain seasonal patterns of zooplankton 813C. Freshwater Biology 50:502-515.
Mayo, C. A., B. H. Letcher, and S. Scott. 2001. Zooplankton filtering efficiency of the baleen of a North Atlantic right whale, Eubalaena glacialis. Journal of Cetacean Research and Management Special Issue 2:225-229.
Mayo, C. A., and M. K. Marx. 1990. Surface foraging behaviour of the North Atlantic right whale, Eubalaena glacialis, and associated zooplankton characteristics. Canadian Journal of Zoology 68:2214-2220.
McConnaughey, T., and C. P. McRoy. 1979. Food-web structure and the fractionation of carbon isotopes in the Bering Sea. Marine Biology 53:257-262.
McKinney, C. R., J. M. McCrea, S. Epstein, H. A. Allen, and H. C. Urey. 1950. Improvements in mass-spectrometers for the measurement of small differences in isotope abundance ratios. Reviews of Scientific Instrumentation 21:724-230.
McMahon, K. W., N. S. Lysiak, L. Brin, K. Buckman, J. Kneeland, F. Gibbons, and S. R. Thorrold. in prep. Ocean ecogeochemistry applied to connectivity analyses in marine populations. Estuarine, Coastal, and Shelf Science.
Meise, C. J., and J. E. O'Reilly. 1996. Spatial and seasonal patterns in abundance and age-composition of Calanus finmarchicus in the Gulf of Maine and on Georges Bank: 1977-1987. Deep-Sea Research II 43:1473-1501.
MERCINA. 2001. Oceanographic responses to climate in the northwest Atlantic. Oceanography 14:76-82.
MERCINA. 2004. Supply-side ecology and the response of zooplankton to climate driven changes in North Atlantic Ocean circulation Oceanography 17:60-71.
Michaud, J., and C. T. Taggart. 2007. Lipid and gross energy content of North Atlantic right whale food, Calanus finmarchicus, in the Bay of Fundy. Endangered Species Research 3:77-94.
Michener, R. H., and D. M. Schell. 1995. Isotope ratios as tracers in marine and aquatic food webs. In: K. Lajtha and R. Michener (eds). Stable Isotopes

189
in Ecology and Environmental Science. Blackwell Scientific Publications, London.
Miller, C. B., C. A. Morgan, F. G. Prahl, and M. A. Sparrow. 1998. Storage lipids of the copepod Calanus finmarchicus from Georges Bank and the Gulf of Maine. Limnology and Oceanography 43:488-497.
Minagawa, M., and E. Wada. 1984. Stepwise enrichment of 15N along food chains: Further evidence and the relationship between 815N and animal age. Geochimica Cosmochimica Acta 48:1135-1140.
Mitani, Y., T. Bando, N. Takai, and W. Sakamoto. 2006. Patterns of stable carbon and nitrogen isotopes in the baleen of common minke whale Balaenoptera acutorostrata from the western North Pacific. Fisheries Science 72:69-76.
Moore, M. J., A. Bogomolni, R. Bowman, P. K. Hamilton, C. T. Harry, A. R. Knowlton, S. Landry, D. S. Rotstein, and K. Touhey. 2006. Fatally entangled right whales can die extremely slowly. In: Oceans '06 MTS/IEEE, Boston, MA.
Moore, M. J., A. R. Knowlton, S. D. Kraus, W. A. McLellan, and R. K. Bonde. 2005. Morphometry, gross morphology and available histopathology in North Atlantic right whale (Eubalaena glacialis) mortalities (1970-2002). Journal of Cetacean Research and Management 6:199-214.
Murison, L. D., and D. E. Gaskin. 1989. The distribution of right whales and zooplankton in the Bay of Fundy, Canada. Canadian Journal of Zoology 67:1411-1420.
National Marine Fisheries Service (NMFS). 2005. Recovery Plan for the North Atlantic Right Whale {Eubalaena glacialis). National Marine Fisheries Service, Silver Spring, MD.
Nelson M., M. Garron, R. L. Merrick, R. M. Pace III, T. V. N. Cole. 2007. Mortality and serious injury determinations for baleen whale stocks along the United States eastern seaboard and adjacent Canadian Maritimes, 2001-2005. U.S. Department of Commerce, Northeast Fisheries Science Center Reference Document 07-04; 18 pages.
Newsome, S. D., M. A. Etnier, D. Gifford-Gonzalez, D. L. Phillips, M. van Tuinen, E. A. Hadley, D. P. Cost, D. J. Kennett, T. P. Guilderson, and P. L. Koch. 2007a. The shifting baseline of northern fur seal ecology in the northeast Pacific Ocean. Proceedings of the National Academy of Sciences 104:9709-9714.
Newsome, S. D., M. A. Etnier, C. M. Kurle, J. R. Waldbauer, C. P. Chamberlain, and P. L. Koch. 2007b. Historic decline in primary productivity in the western Gulf of

Alaska and eastern Bering Sea: isotopic analysis of northern fur seal teeth. Marine Ecological Progress Series 332:211-224.
Niemeyer M., T. V. N. Cole, C. L. Christman, P. Duley, A. H. Glass. 2008. North Atlantic Right Whale Sighting Survey (NARWSS) and Right Whale Sighting Advisory System (RWSAS) 2007 results summary. US Department of Commerce Northeast Fisheries Science Center Reference Document 08-06; 6 pages.
O'Reilly, J. E., and C. Zetlin. 1998. Seasonal, horizontal, and vertical distribution of phytoplankton chlorophyll a in the Northeast U.S. continental shelf ecosystem. U.S. Department of Commerce, Seattle.
Overland, J., S. Rodionov, S. Minobe, and N. Bond. North Pacific regime shifts: definitions, issues and recent transitions. Progress in Oceanography 77:92-102.
Patrician, M. R. 2005. An investigation of the factors underlying the abandonment of the Roseway Basin feeding ground by the North Atlantic right whale {Eubalaena glacialis): 1993-1999. M.S. thesis, University of Rhode Island, Narragansett, RI.
Pershing, A. J., C. H. Greene, J. W. Jossi, L. O'Brein, J. K. T. Brodziak, and B. A. Bailey. 2005. Interdecadal variability in the Gulf of Maine zooplankton community, with potential impacts on fish recruitment. ICES Journal of Marine Science 62:1511-1523.
Peterson, B. J., and B. Fry. 1987. Stable isotopes in ecosystem studies. Annual Review of Ecology and Systematics 18:293-320.
Pettis, H. M., R. M. Rolland, P. K. Hamilton, S. Brault, A. R. Knowlton, and S. D. Kraus. 2004. Visual health assessment of North Atlantic right whales {Eubalaena glacialis) using photographs. Canadian Journal of Zoology 82:8-19.
Podlesak, D. W., A. M. Torregrossa, J. R. Ehleringer, M. D. Dearing, B. H. Passey, and T. E. Cerling. 2008. Turnover of oxygen and hydrogen isotopes in the body water, CO2, hair, and enamel of a small mammal. Geochimica Cosmochimica Acta 72:19-35.
Rau, G. H., R. E. Sweeney, and I. R. Kaplan. 1982. Plankton 13C:12C ratio changes with latitude: differences between northern and southern oceans. Deep-Sea Research 29:1035-1039.
Reeves, R. R., T. D. Smith, and E. A. Josephson. 2007. Near-annihilation of a species: right whaling in the North Atlantic. In: S. D. Kraus and R. M. Rolland (eds). The Urban Whale. Harvard University Press, Cambridge, MA. 576 pages.

191
Right Whale Consortium. 2007. North Atlantic Right Whale Consortium 2007 Report Card, http://www.rightwhaleweb.org/papers/pdf/NARWC_Report_Card2007.pdf. (New England Aquarium, Boston, MA, USA).
Right Whale Consortium. 2008a. North Atlantic Right Whale Consortium Necropsy Database, 04/22/2008, (New England Aquarium, Boston, MA, U.S.A.).
Right Whale Consortium. 2008b. North Atlantic Right Whale Consortium Identification Database 04/22/2008, (New England Aquarium, Boston, MA, U.S.A.).
Rolland, R. M., P. K. Hamilton, M. K. Marx, H. M. Pettis, C. M. Angell, and M. J. Moore. 2007. External perspectives on right whale health. In: S. D. Kraus and R. M. Rolland (eds). The Urban Whale. Harvard University Press, Cambridge, MA. 576 pages.
Rosenbaum, H. C , R. L. Brownell, M. W. Brown, C. Schaeff, V. Portway, B. N. White, S. Malik, L. A. Pastene, N. J. Patenaude, C. S. Baker, M. Goto, P. B. Best, P. J. Clapham, P. Hamilton, M. Moore, R. Payne, V. Rowntree, C. T. Tynan, J. L. Bannister, and R. DeSalle. 2000. World-wide genetic differentiation of Eubalaena: questioning the number of right whale species. Molecular Ecology 9:1793-1802.
Rowntree, V., J. Darling, G. Silber, and M. Ferrari. 1980. Rare sighting of a right whale {Eubalaena glacialis) in Hawaii. Canadian Journal of Zoology 58:309-312.
Rubenstein, D. R., and K. A. Hobson. 2004. From birds to butterflies: animal movement patterns and stable isotopes. Trends in Ecology and Evolution 19:256-263.
Saether, B. E. 1997. Environmental stochasticity and population dynamics of large herbivores: a search for mechanisms. Trends in Ecology and Evolution 12:143.
Schell, D. M. 2001. Carbon isotope ratio variations in Bering Sea biota: the role of anthropogenic carbon dioxide. Limnology and Oceanography 46:999-1000.
Schell, D. M. 2000. Declining carrying capacity in the Bering Sea: Isotopic evidence from whale baleen. Limnology and Oceanography 45:459-462.
Schell, D. M., B. A. Barnett, and K. A. Vinette. 1998. Carbon and nitrogen isotope ratios in zooplankton of the Bering, Chukchi and Beaufort seas. Marine Ecology Progress Series 162:11-23.
Schell, D. M., and S. M. Saupe. 1993. Feeding and growth as indicated by stable isotopes. In: J. J. Burns, J. J. Montague, and C. J. Cowles (eds). The Bowhead Whale. The Society of Marine Mammalogy, Lawrence, KS.

192
Schell, D. M., S. M. Saupe, and N. Haubenstock. 1989. Bowhead whale (Balaena mysticetus) growth and feeding as estimated by 813C techniques. Marine Biology 103:433-443.
Schmidt, G. A., G. R. Bigg, and E. J. Rohling. 1999. Global seawater oxygen-18 database, http://data.giss.nasa.g0v/018data/.
Schmidt, K., A. Atkinson, D. Stiibing, J. W. McClelland, J. P. Montoya, and M. Voss. 2003. Trophic relationships among Southern Ocean copepods and krill: Some uses and limitations of a stable isotope approach. Limnology and Oceanography 48:277-289.
Sharp, Z. 2007. Principles of Stable Isotope Geochemistry. Pearson Prentice Hall, Upper Saddle River, NJ.
Smith, P. C , R. W. Houghton, R. G. Fairbanks, and D. G. Mountain. 2001. Interannual variability of boundary fluxes and water mass properties in the Gulf of Maine and on Georges Bank: 1993-1997. Deep-Sea Research II 48:37-70.
Sonnerup, R. R, P. D. Quay, A. P. McNichol, J. L. Bullister, T. A. Westby, and H. L. Anderson. 1999. Reconstructing the oceanic 13C Suess effect. Global Biogeochemical Cycles 13:857-872.
Steinberg, D. K., C. A. Carlson, N. R. Bates, R. J. Johnson, A. F. Michaels, and A. H. Knap. 2001. Overview of the US JGOFS Bermuda Atlantic Time-series Study (BATS): a decade-scale look at ocean biology and biogeochemistry. Deep-Sea Research II 48:1405-1447.
Stenseth, N. C , A. Mysterud, G. Ottersen, J. W. Hurrell, K. S. Chan, and M. Lima. 2002. Ecological effects of climate fluctuations. Science 297:1292-1296.
Stenseth, N.C., G. Ottersen, J. W. Hurrell, A. Mysterud, M. Lima, K. S. Chan, N. G. Yoccoz, B. Adlandsvik. 2003. Studying climate effects on ecology through the use of climate indices: the North Atlantic Oscillation, El Nino Southern Oscillation, and beyond. Proceedings of the Royal Society of London Series B -Biological Sciences 270:2087-2096.
Summers, E. L., J. A. Estrada, and S. I. Zeeman. 2006. A note on geographic and seasonal fluctuations in the composition of baleen in four North Atlantic right whales (Eubalaena glacialis). Journal of Cetacean Research and Management 8:241-245.

193
Tans, P. P., A. F. M. de Jong, and W. G. Mook. 1979. Natural atmospheric C variation and the Suess effect. Nature 280:826-828.
Tiselius, P., and B. Kuylenstierna. 1996. Growth and decline of a diatom spring bloom: phytoplankton species composition, formation of marine snow, and the role of heterotrophic dinoflagellates. Journal of Plankton Research 18:133-155.
Townsend, D. W. 1998. Sources and cycling of nitrogen in the Gulf of Maine. Journal of Marine Systems 16:283-295.
Tucker, S., W. D. Bowen, and S. J. Iverson. 2007. Dimensions of diet segregation in grey seals Halichoerus grypus revealed through stable isotopes of carbon (813C) and nitrogen (815N). Marine Ecological Progress Series 339:271-282.
Tormosov, D. D., Y. A. Mikhaliev, V. A. Zemsky, K. Sekiguchi, and R. L. Brownell. 1998. Soviet catches of southern right whales Eubalaena australis, 1951-1971. Biological data and conservation implications. Biological Conservation 86:185-197.
Tynan, C. T., D. P. DeMaster, and W. T. Peterson. 2001. Endangered right whales on the Southeastern Bering Sea shelf. Science 294:1894.
Waldick, R. C , S. D. Kraus, M. W. Brown, and B. N. White. 2002. Evaluating the effects of historic bottleneck events: an assessment of the microsatellite variability of the endangered North Atlantic right whale. Molecular Ecology 11:2241-2249.
Wassenaar, L. I., and K. A. Hobson. 2003. Comparative equilibration and online technique for determination of non-exchangeable hydrogen of keratins for use in animal migration studies. Isotopes in Environmental and Health Studies 39:211-217.
Weinrich, M. T., R. D. Kenney, and P. K. Hamilton. 2000. Right whales (Eubalaena glacialis) on Jeffrey's Ledge: A habitat of unrecognized importance? Marine Mammal Science 16:326-337.
Werth, A. J. 2007. Models of hydrodynamic flow in the bowhead whale filter feeding apparatus. Journal of Experimental Biology 207:3569-3580.
Wetmore, S. 2001. Stable isotopic investigations into the foraging ecology of North Atlantic right whales. M.S. thesis, University of Massachusetts, Boston, MA.
Wiebe, P., K. Burt, S. Boyd, and A. Morton. 1976. A multiple opening/closing net and environmental sensing system for sampling zooplankton. Journal of Marine

Research 34:313-326.
Winn, H. E., C. A. Price, and P. W. Sorenson. 1986. The distributional biology of the right whale (Eubalaena glacialis) in the western North Atlantic. Reports of the International Whaling Commission Special Issue 10:129-138.
Wishner, K. F., J. R. Schoenherr, R. Beardsley, and C. Chen. 1995. Abundance, distribution and population structure of the copepod Calanus finmarchicus in a springtime right whale feeding area in the southwestern Gulf of Maine. Continental Shelf Research 15:475-507.
Vander Zanden, M. J., and J. B. Rasmussen. 2001. Variation in 515N and 813C trophic fractionation: Implications for aquatic food web studies. Limnology and Oceanography 46:2061-2066.
Vanderklift, M. A. and S. Ponsard. 2003. Sources of variation in consumer-diet 815N enrichment: a meta-analysis. Oecologia 136:169-182.
Vergani, D. F., J. C. Labraga, Z. B. Stanganelli, and M. Dunn. 2008. The effects of El Nino-La Nina on reproductive parameters of elephant seals feeding in the Bellingshausen Sea. Journal of Biogeography 35: 248-256.

195
CURRICULUM VITAE
Nadine Stewart J Lysiak Woods Hole Oceanographic Institution
Mail Stop #50, Woods Hole, MA, 02543, USA T: 508-289-2589 F: 508-457-2089 E: [email protected]
EDUCATION
Ph.D. (January 2009) Boston University, Boston, MA, USA Biology, Marine Program
M.A. (May 2007) Boston University, Boston, MA, USA Biology, Marine Program
B.A. Cum Laude (June 2003) Gustavus Adolphus College, St. Peter, MN, USA Biology and History with Honors
ADDITIONAL STUDIES
Massachusetts Institute of TechnologyAVoods Hole Oceanographic Institution Joint Program, Woods Hole, MA, USA Graduate course audits: Applied Statistics (2004) and Scientific Programming (2008)
University of Utah, Salt Lake City, UT, USA Graduate course audit: Stable Isotope Ecology (2004)
University of Queensland, Brisbane, Australia Undergraduate semester abroad, emphasis in Marine Science (2002)
RESEARCH EXPERIENCE
Graduate Research Assistant, 2003 - 2008. Woods Hole Oceanographic Institution, 2005 - 2008. Supervisor: Dr. Michael Moore, Marine Mammal Forensics Laboratory
Boston University Marine Program, 2003 - 2006. Supervisor: Dr. Ivan Valiela* Marine Ecology Laboratory, 2004 - 2006.

Supervisor: Dr. Gabrielle Gerlach, Molecular Ecology Laboratory, 2003.
Marine Mammal Observer, 2004 - 2008. Woods Hole Oceanographic Institution. 2005 - 2008. Supervisor: Dr. Mark Baumgartner, Biology Department
NOAA Fisheries, Northeast Fisheries Science Center, 2004 - 2007. Supervisor: Fred Wenzel, Protected Species Branch
Undergraduate Research Assistant, 2001 - 2002. Gustavus Adolphus College. 2001 - 2002. Supervisor: Dr. Nancy Butler, Aquatic Ecology Laboratory
SEA DUTY
2008 Marine Mammal Observer and Oceanographer, Pacific Right Whale Evaluation Study (PRIEST) Cruise: Southeast Bering Sea, FN Ocean Olympic. August 2 - 15.
2007 Marine Mammal Observer, Humpback Whale Tagging & Bioacoustics Cruise: Stellwagen Bank National Marine Sanctuary, R/V Tioga. July 18-20.
Marine Mammal Observer, North Atlantic Right Whale Foraging Ecology Cruise IV: Great South Channel, NOAA Ship Albatross IV. May 7 - June 10.
2006 Marine Mammal Observer, North Atlantic Right Whale Tagging & Habitat Modeling Cruise: Jeffrey's Ledge, R/V Tioga. December 4 - 6 .
Marine Mammal Observer, North Atlantic Right Whale Foraging Ecology Cruise III: Great South Channel, NOAA Ship Albatross IV. May 1 - May 26.
Marine Mammal Observer, North Atlantic Right Whale Tagging & Habitat Modeling Cruise: Cape Cod Bay, R/V Tioga. March 13.
2005 Oceanographer, Large Whale Foraging Ecology Cruise: Northern Gulf of Maine, NOAA Ship Delaware II. July 27 - August 19.
Marine Mammal Observer, North Atlantic Right Whale Tagging & Habitat Modeling Cruise: Great South Channel, R/V Tioga. July 15.

Marine Mammal Observer, North Atlantic Right Whale Foraging Ecology Cruise II: Great South Channel, NOAA Ship Albatross IV. April 28 - May 20.
2004 Marine Mammal Observer, North Atlantic Right Whale Foraging Ecology Cruise I: Great South Channel, NOAA Ship Albatross IV. April 26 - May 21.
TEACHING EXPERIENCE
Research Mentor - Marine Biological Laboratory, Woods Hole, Summer 2007. Advised an undergraduate intern for the NSF Research Experiences for Undergraduates (REU) Program.
Guest Lecturer, Massachusetts Marine Educators Annual High School Marine Science Symposiums, March 2007 and 2008. "North Atlantic Right Whales: Can We Save Them?"
Teaching Assistant & Guest Lecturer, Boston University Marine Program. Fall Semester 2005 & 2006. Course: Global Coastal Change. Instructor: Dr. Ivan Valiela.
Teaching Assistant, Gustavus Adolphus College. Fall Semester 2002. Course: Invertebrate Zoology. Instructor: Dr. Shannon Fisher.
AWARD AND HONORS
American [Dissertation] Fellowship, American Association of University Women. 2007. Fellowship in support of dissertation completion, awarded for scholarly excellence and an active commitment to helping women through service in one's community, profession, or field of research.
Graduate Research Abroad Fellowship, Boston University. 2006. Fellowship in support of novel research conducted at museums in Scandinavia and the United Kingdom.
SEASPACE Scholarship, Houston Underwater Club. 2006. Awarded for academic excellence in the study of marine sciences.
Rainer Voight Memorial Award (First Place), Boston University Marine Program. 2005. Scholarship in support of the pursuit of innovative research at the master's level: Developing Multi-Isotope Tracers to Determine North Atlantic Right Whale Habitat Use

DeNault Award, Gustavus Adolphus College. 2002. Awarded for outstanding writing in history.
Barry M. Goldwater Scholarship, Barry M. Goldwater Foundation. 2002. Awarded for academic excellence and continuing undergraduate science research.
Charles C. Hamrum Scholarship, Gustavus Adolphus College. 2002 & 2003. Awarded for excellence in academics and independent research.
Dean's List, Gustavus Adolphus College. 2001
MANUSCRIPTS IN PREPARATION
McMahon, K.W., N.S. Lysiak, L.D. Brin, K. Buckman, J. Kneeland, F. Gibbons, and S.R. Thorrold. Ocean ecogeochemistry applied to connectivity analyses in marine populations. Estuarine, Coastal, and Shelf Science.
PEER-REVIEWED PUBLICATIONS
Gerlach, G. and N. S. Lysiak. 2006. Kin recognition and inbreeding avoidance in zebrafish, Danio rerio, is based on phenotype matching. Animal Behaviour 71:1371-1377.
PUBLISHED ABSTRACTS
Lysiak, N.S., M.J. Moore, and A.R. Knowlton. 2008. Interpreting a Long-Term Stable Isotope Record Derived from North Atlantic Right Whale Baleen (poster). ISOSCAPES 2008 Meeting, Santa Barbara, CA.
Lysiak, N.S., M J. Moore, A.R. Knowlton, and I. Valiela. 2008. Interpreting a Long-Term Stable Isotope Record Derived from North Atlantic Right Whale Baleen: Implications for Ecosystem-Level Changes in the Gulf of Maine? (poster). American Society of Limnology & Oceanography Ocean Sciences Meeting, Orlando, FL.
Lysiak, N.S., M.J. Moore, A.R. Knowlton, A.R. Solow. 2007. Deciphering Stable Isotope Records in Right Whale Baleen. 17th Biennial Conference on the Biology of Marine Mammals, Cape Town, South Africa.
Lysiak, N.S., M.J. Moore, B.A. McLeod, T.R. Frasier, C.R. Hammerschmidt, A.P. McNichol, and R. Lochen. 2007. Biogeochemical analysis of baleen fragments

discovered within Viking Era ships. North Atlantic Right Whale Consortium Annual Meeting, New Bedford, MA.
Lysiak, N.S., M.J. Moore, I. Valiela, A R. Knowlton, and C.W. Potter. 2007. Tracking the Migration Patterns and Habitat Use of North Atlantic Right Whales with Stable Isotopes. American Society of Limnology & Oceanography Aquatic Sciences Meeting, Santa Fe, NM.
Lysiak, N.S., M.J. Moore, I. Valiela, A.R. Knowlton, and C.W. Potter. 2006. Biogeochemistry of Baleen: Creating Long-Term Records of Right Whale Movement Patterns With Stable Isotope Analysis. North Atlantic Right Whale Consortium Annual Meeting, New Bedford, MA.
Hammerschmidt, C , N.S. Lysiak, M. Saito, and M.J. Moore. 2006. Northern Right Whale Foraging and Metabolism Inferred from Stable Isotope and Methylmercury Analysis of Baleen (poster). 8th International Conference on Mercury as a Global Pollutant, Madison, WI.
Lysiak, N.S., M.J. Moore, I. Valiela, and A.R. Knowlton. 2006. Seasonal Movement and Trophic Status of Right Whales in the Northwest Atlantic Assessed with Stable Isotope Analysis of Baleen and Zooplankton. 86th American Society of Mammalogists Annual Meeting, Amherst, MA.
Lysiak, N.S., M.J. Moore, I. Valiela, and A.R. Knowlton. 2005. Stable Isotopes Analysis Utilized to Create Multi-annual Records of Right Whale Migration Patterns. 16th Biennial Conference on the Biology of Marine Mammals, San Diego, CA.
Lysiak, N. S., M. J. Moore, I. Valiela, and A. R. Knowlton. 2005. Stable Isotopes of North Atlantic Right Whale Baleen as Indicators of Foraging and Migration Patterns. North Atlantic Right Whale Consortium Annual Meeting, New Bedford, MA.
Lysiak, N. S., M. J. Moore, I. Valiela, and A. R. Knowlton. 2005. Stable Isotopes of North Atlantic Right Whale Baleen as Indicators of Foraging and Migration Patterns. American Society of Limnology & Oceanography Summer Meeting, Santiago de Compostela, Spain.
Lysiak, N.S., A.A. Hamp, and N.M. Butler. 2002. The Phototactic Behavior of Marine and Freshwater Zooplankton as Influenced by Habitat and Light Quality. American Society of Limnology & Oceanography Ocean Sciences Meeting, Honolulu, HI.
Hamp, A.A., N.S. Lysiak, and N.M. Butler. 2002. Investigations into the Phototactic Behaviors of Marine and Freshwater Mysids. American Society of Limnology & Oceanography Ocean Sciences Meeting, Honolulu, HI.

200
Ortenblad, M., K.N. Howe, N.S. Lysiak, and N.M. Butler. 2001. Field and Laboratory Investigations of the Phototactic Behaviors of Diaptomus and Daphnia in Response to Four Wavelengths of Light. National Conference on Undergraduate Research, Louisville, KY.
COMMUNITY SERVICE
Marine Mammal Stranding Responder/Necropsy Participant. Cape Cod Stranding Network. Yarmouth, MA. 2005 - present.
Volunteer Aquarist. NOAA Woods Hole Aquarium, Woods Hole, MA. 2004 - 2007.
PROFESSIONAL AFFILIATION
Society for Marine Mammalogy American Society of Mammalogists American Society of Limnology and Oceanography Association of Women in Science North Atlantic Right Whale Consortium Tri Beta Biological Honor Society, Iota Rho Chapter
COLLABORATORS
Collaborators: Michael Moore, Mark Baumgartner, Andrew Solow, Simon Thorrold (Woods Hole Oceanographic Institution); Amy Knowlton (New England Aquarium); Fred Wenzel, Jerry Prezioso (NOAA Northeast Fisheries Science Center); Chad Hammerschmidt (Wright State University); Brenna McLeod, Timothy Frasier (Trent University); R. Clay George (Georgia Department of Natural Resources); Heather Koopman, Andrew Westgate (Grand Manan Whale and Seabird Research Station); William McLellan (University of North Carolina, Wilmington); Jean-Francois Blouin (Centre for the Study and Protection of the Black Whale of St. Lawrence, CEPBan); David Harris (University of California, Davis); Ragnar Lochen, Knut Paasche (Oslo Viking Ship Museum); Charles Potter (Smithsonian/National Museum of Natural History); Richard Sabin (British Museum of Natural History)
Graduate Committee: Michael Moore, Mark Baumgartner, and Simon Thorrold (Biology Department, Woods Hole Oceanographic Institution); Ivan Valiela and Anne Giblin (Ecosystems Center, Marine Biological Laboratory); Vincent Dionne (Biology Department, Boston University)