Boson peak and terahertz frequency dynamics of vitreous silica
49
Boson peak and terahertz frequency dynamics of vitreous silica This article has been downloaded from IOPscience. Please scroll down to see the full text article. 2002 Rep. Prog. Phys. 65 1195 (http://iopscience.iop.org/0034-4885/65/8/203) Download details: IP Address: 129.78.139.28 The article was downloaded on 14/09/2013 at 12:05 Please note that terms and conditions apply. View the table of contents for this issue, or go to the journal homepage for more Home Search Collections Journals About Contact us My IOPscience
-
Upload
tsuneyoshi -
Category
Documents
-
view
215 -
download
1
Transcript of Boson peak and terahertz frequency dynamics of vitreous silica

Boson peak and terahertz frequency dynamics of vitreous silica
This article has been downloaded from IOPscience. Please scroll down to see the full text article.
2002 Rep. Prog. Phys. 65 1195
(http://iopscience.iop.org/0034-4885/65/8/203)
Download details:
IP Address: 129.78.139.28
The article was downloaded on 14/09/2013 at 12:05
Please note that terms and conditions apply.
View the table of contents for this issue, or go to the journal homepage for more
Home Search Collections Journals About Contact us My IOPscience

INSTITUTE OF PHYSICS PUBLISHING REPORTS ON PROGRESS IN PHYSICS
Rep. Prog. Phys. 65 (2002) 1195–1242 PII: S0034-4885(02)18697-0
Boson peak and terahertz frequency dynamics ofvitreous silica
Tsuneyoshi Nakayama
Department of Applied Physics, Hokkaido University, Sapporo 060-8628, Japan
Received 16 April 2002, in final form 9 July 2002Published 29 July 2002Online at stacks.iop.org/RoPP/65/1195
Abstract
This paper describes the progress that has been made in the past decade in the investigation ofthe peculiar dynamic properties of vitreous silica (v-SiO2) and related glasses in the terahertz(THz) frequency range. The reason why we focus our attention on v-SiO2 is that it is one of theprincipal network glasses and exhibits all features typical of glasses. These are the increasedinelastic scattering of light and neutrons at THz frequencies, the so-called Boson or Bose peak,as well as unusual thermal properties such as specific heats and thermal conductivities at lowtemperatures. During the last decade, experimental techniques such as the inelastic scatteringof light, neutrons and x-rays have been greatly improved, and these have provided considerableexperimental information about the atomic vibrations in v-SiO2 and related glasses in the THzfrequency region. In addition, molecular dynamics simulations have proved successful forthese complex systems. They form the basis for this perspective on the major advances in thisdecade from a new and tutorial point of view.
0034-4885/02/081195+48$90.00 © 2002 IOP Publishing Ltd Printed in the UK 1195
1196 T Nakayama
1. Introduction
1.1. Brief history
Glasses behave in a way that is strikingly different in the terahertz (THz) frequency rangefrom conventional disordered systems. The history of the research is relatively old. The firstand perhaps obvious anomaly in glasses was discovered almost half a century ago by Berman(1949, 1950), who noticed the unexpected instance of the thermal conductivity anomaly forvitreous silica (v-SiO2). He measured the thermal conductivities of several samples of v-SiO2
in the temperature range between 2.2 and 90 K and found the plateau behaviour of thermalconductivities at around 10 K with a magnitude several orders smaller than those of crystals.However, these properties attracted little attention until the work by Zeller and Pohl (1971).
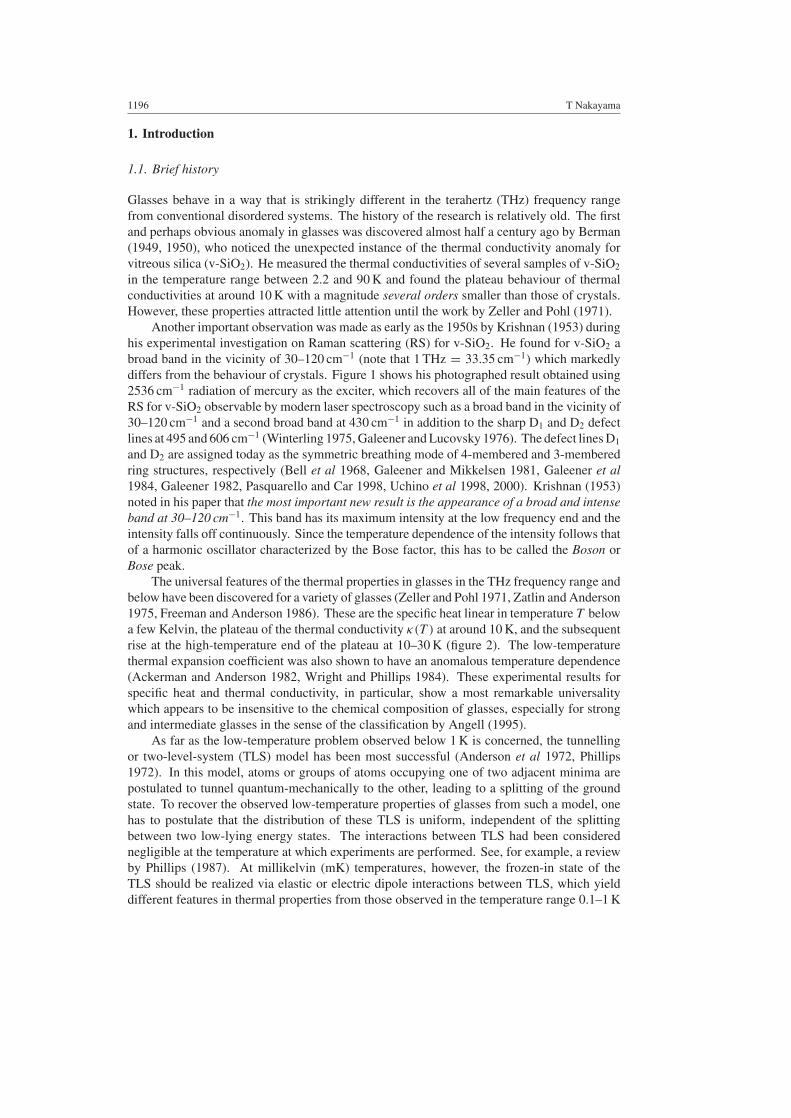
Another important observation was made as early as the 1950s by Krishnan (1953) duringhis experimental investigation on Raman scattering (RS) for v-SiO2. He found for v-SiO2 abroad band in the vicinity of 30–120 cm−1 (note that 1 THz = 33.35 cm−1) which markedlydiffers from the behaviour of crystals. Figure 1 shows his photographed result obtained using2536 cm−1 radiation of mercury as the exciter, which recovers all of the main features of theRS for v-SiO2 observable by modern laser spectroscopy such as a broad band in the vicinity of30–120 cm−1 and a second broad band at 430 cm−1 in addition to the sharp D1 and D2 defectlines at 495 and 606 cm−1 (Winterling 1975, Galeener and Lucovsky 1976). The defect lines D1
and D2 are assigned today as the symmetric breathing mode of 4-membered and 3-memberedring structures, respectively (Bell et al 1968, Galeener and Mikkelsen 1981, Galeener et al1984, Galeener 1982, Pasquarello and Car 1998, Uchino et al 1998, 2000). Krishnan (1953)noted in his paper that the most important new result is the appearance of a broad and intenseband at 30–120 cm−1. This band has its maximum intensity at the low frequency end and theintensity falls off continuously. Since the temperature dependence of the intensity follows thatof a harmonic oscillator characterized by the Bose factor, this has to be called the Boson orBose peak.
The universal features of the thermal properties in glasses in the THz frequency range andbelow have been discovered for a variety of glasses (Zeller and Pohl 1971, Zatlin and Anderson1975, Freeman and Anderson 1986). These are the specific heat linear in temperature T belowa few Kelvin, the plateau of the thermal conductivity κ(T ) at around 10 K, and the subsequentrise at the high-temperature end of the plateau at 10–30 K (figure 2). The low-temperaturethermal expansion coefficient was also shown to have an anomalous temperature dependence(Ackerman and Anderson 1982, Wright and Phillips 1984). These experimental results forspecific heat and thermal conductivity, in particular, show a most remarkable universalitywhich appears to be insensitive to the chemical composition of glasses, especially for strongand intermediate glasses in the sense of the classification by Angell (1995).
As far as the low-temperature problem observed below 1 K is concerned, the tunnellingor two-level-system (TLS) model has been most successful (Anderson et al 1972, Phillips1972). In this model, atoms or groups of atoms occupying one of two adjacent minima arepostulated to tunnel quantum-mechanically to the other, leading to a splitting of the groundstate. To recover the observed low-temperature properties of glasses from such a model, onehas to postulate that the distribution of these TLS is uniform, independent of the splittingbetween two low-lying energy states. The interactions between TLS had been considerednegligible at the temperature at which experiments are performed. See, for example, a reviewby Phillips (1987). At millikelvin (mK) temperatures, however, the frozen-in state of theTLS should be realized via elastic or electric dipole interactions between TLS, which yielddifferent features in thermal properties from those observed in the temperature range 0.1–1 K

Boson peak and THz frequency dynamics of v-SiO2 1197
Figure 1. Raman spectrum of v-SiO2. After Krishnan (1953).
(Yu and Leggett 1988, Grannan et al 1990). In this temperature range, investigations on TLSin glasses seem to be entering a new stage in the past few years since experiments at verylow temperatures around 1 mK present new unexpected phenomena (Rogge et al 1996, 1997a,1997b, Strehlow et al 1998, Hunklinger et al 1999, Kettemann et al 1999, Wohlfahrt et al2001, Ludwig et al 2002, Wurger 2002).
1.2. Purpose of this paper
The Boson peak refers to an excess contribution to the usual Debye density of states (DOS)observed by a variety of optical, neutron, and thermal measurements in the THz frequencyrange. The broad peaks are in fact observed in almost all glasses at frequencies about 10–100times smaller than the corresponding Debye frequency ωD. This definition of the Boson peak,however, is not sufficient to emphasize the peculiarity of the corresponding vibrational states,because there are a lot of non-glassy materials showing an excess DOS at ω/ωD ≈ 10−1–10−2
(Leadbetter 1969, Caplin et al 1973, Bilir and Phillips 1975), indicating that the comparisonwith only the Debye DOS as a base line is generally unjustified. As typical examples, wenote the experimental work of Bilir and Phillips (1975), who showed that the specific heatof α-cristobalite is not significantly different from that of v-SiO2, and similarly for neutron

1198 T Nakayama
Figure 2. Thermal conductivities κ(T ) for v-SiO2 and α-quartz. After Cahill and Pohl (1987).
Figure 3. Inelastic neutron scattering (INS) at energies E = 5 meV for α-cristobalite andE = 4.5 meV for v-SiO2. After Dove et al (1997).
scattering data for α-cristobalite and v-SiO2 by Leadbetter (1969) and Dove et al (1997) asshown in figure 3. Thus, it is not sufficient to explain only one aspect of the dynamics ofglasses, for example, the excess DOS observed at THz frequencies, in order to elucidate thephysical origin of the anomalous behaviour observed in the THz frequency region.
At first glance, the physical origin of the anomalous properties observed in the THzfrequency range in glasses seems not to be so complicated in comparison with that of the

Boson peak and THz frequency dynamics of v-SiO2 1199
quantum-mechanical low-temperature anomaly below a few Kelvin. However, no satisfactorymodel has been proposed to interpret a wide variety of the phenomena observed in the THzfrequency range in a consistent way, indicating the complexity of the physics involved. Infact, theoretical studies have not, until recently, provided a real understanding of the physicalorigin of the THz frequency dynamics in glasses. The main difficulty arises from the fact that,though a crystal possesses a single potential minimum yielding specific dynamic properties, aglass is characterized by a potential function with many local minima.
This paper deals with the investigations to elucidate the physical origin of the Bosonpeak and related phenomena observed in the THz frequency range, as well as the anomalousthermal properties such as phonon transport observed in a wide temperature range (Zeller andPohl 1971). v-SiO2 is one of the principal network glasses (that is, covalently bonded) andexhibits all the main features that are typical of glasses. For this reason, this paper treats v-SiO2
and related network glasses. Though several review articles have been recently published onthis subject (see, e.g. Buchenau 2001, Ruocco and Sette 2001), this paper is organized underdifferent and more general points of view.
2. Structures of v-SiO2 at atomic scales
2.1. Various phases of silica
Glasses, obtained by rapid cooling of corresponding liquid states, exhibit a large change ofspecific heat at the glass transition temperature Tg, and the entropy difference between a glassand the corresponding crystal below Tg remains approximately constant (see, e.g. Schulze1990). Thus, glasses definitely possess zero-point entropies S0 (finite entropies as T → 0)originating from quenched disorder in the low-temperature state. A simple analysis for v-SiO2
using the relation S0 = kB ln W suggests that there are of the order of W ≈ 2N metastablestates denoted by two-site potentials, where N is the number of SiO4 tetrahedra (Schulze 1990).Such large zero-point entropies have been observed in many types of glasses. The existenceof zero-point entropy is a hallmark of glasses.
Silica possesses a rich phase consisting of infinite network structures of SiO4 tetrahedraconnected by oxygen (O)-atoms. The shape of tetrahedra is quite rigid and not sensitive tothe condition of preparation, with the Si–O distance of 1.61 ± 0.01 Å. v-SiO2 differs fromits crystalline forms in only one aspect, namely, the tetrahedra are randomly oriented with abroad distribution of Si–O–Si angles around 145˚, with bond angle fluctuations of about 25˚ assuggested from the analysis of diffraction data (Mozzi and Warren 1969, Guissani and Guillot1996) and from nuclear magnetic resonance (NMR) studies (Devine et al 1987, Neuefeindand Bunsenges 1996). Various anomalous structural behaviours are observed in v-SiO2 suchas a softened structure under hydrostatic pressure (Bridgman 1948) and negative thermalexpansion (Gibbons 1959). These anomalous features are associated with the distributionof bent Si–O–Si configuration (Vukcevich 1972). However, there definitely exists medium-range order (MRO) (Elliott 1991) in v-SiO2, as confirmed by diffraction experiments (Phillips1981, Moss and Price 1985, Wright et al 1985, Chervinka 1987, Fowler and Elliott 1987,Wright et al 1991, Suzuya et al 2000, Kohara and Suzuya 2001), which imply the existenceof pseudo-periodicity characterized by the scale of the first sharp diffraction peak (FSDP)appearing at the wave number Q1 = 1.51 Å−1. The distance characterizing MRO is estimatedas R1 = 2π/Q1 ≈ 4.2 Å found from the position of the FSDP at Q1 = 1.51 Å−1 (see figure 4).The distance R1 is close to the average height of d1 ≈ 4.1 Å of ‘SiSi4’ tetrahedra decoratedwith O-atoms (see figure 5), namely, the (111) spacing in crystalline silica and cristobalite.Figure 4 shows the neutron diffraction data various densities of v-SiO2, exhibiting the FSDP

1200 T Nakayama
Figure 4. Neutron diffraction data for various densities of v-SiO2. After Inamura et al (2001).
Figure 5. Possible assignment of the typical length scales. (a) d2 represents the length scalebetween O-atoms. (b) d1 does the length scale of the correlation between Si–Si next nearestneighbours. After Taraskin and Elliott (1998).
and subsequent peaks. The FSDP may correspond to the average height of ‘SiSi4’ tetrahedradecorated with O-atoms as depicted in figure 5 (Taraskin and Elliott 1998).
The equilibrium sequence of phase transitions of crystalline states of silica, prior to meltingat 2000 K, is, first, α-quartz to β-quartz (via an incommensurate phase at 847.3 K), then toHP-tridymite (940 K), and finally to β-cristobalite (1743 K) (see, e.g. Aoki et al 2000). Thekinetics of these phase transitions can be extremely sluggish, and there are several othermetastable crystalline phases of lower symmetry derived from cooling HP-tridymite andβ-cristobalite. An example is α-cristobalite obtained from β-cristobalite below about 553 K(Kimizuka et al 2000). The structure of α-cristobalite is well understood (Pluth et al 1985).However, there is still much discussion as to the microscopic structure of the β-phase. Thesimilarity of the FSDP in v-SiO2 and β-cristobalite has led to the suggestion that there is aclose relationship over short-length-scales between these two phases (Le Bail 1995, Gaskel andWallis 1996, Keen and Dove 1999). Keen and Dove (1999) suggested that the instantaneouslocal atomic arrangements of HP-tridymite and β-cristobalite strikingly resemble that ofv-SiO2, unlike those of the two phases of quartz. The microscopic structures of β-cristobalite,HP-tridymite and v-SiO2 are similar over the length scale 10 Å, indicating the internal flexibilityof the cristobalite and tridymite structures. In these crystalline phases the disorder is dynamic

Boson peak and THz frequency dynamics of v-SiO2 1201
and driven by the need to avoid local configurations with linear Si–O–Si bonds, whereas thedisorder in v-SiO2 is static over conventional time-scales. See figure 8. The low temperatureα-phase does not have the same flexibility as the high-temperature crystalline phases. Thus, itis reasonable to assume that v-SiO2 shows similarities with the local structures of β-cristobaliteand HP-tridymite structures in which the tetrahedra easily rotate to change the bond angle toa more favourable value (Dove et al 1997, Keen and Dove 1999, Tucker et al 2001). Thestructural data on silica are given in table 1.
Ab initio molecular dynamics (MD) calculations have demonstrated that the network ofv-SiO2 consists of 6-membered rings together with 3-, 4-, 5-, and 7-membered rings (Sarntheinet al 1995, Pasquarello and Car 1998, Pasquarello et al 1998), where closed paths containingn-Si–O segments are referred to as n-membered rings. Though 6-membered rings dominate,the fraction of 5- and 7-membered rings are each about 10%, depending on the cooling rateof the system (see figure 6). Such evidence was obtained from the analysis of diffractionexperiments in terms of high-energy x-ray scattering in addition to neutron scattering (Suzuyaet al 2000, Kohara and Suzuya 2001). The existence of 3- and 4-membered rings are verifiedby RS experiments through the observation of D1 and D2 defect lines (see, e.g. Galeener andGeissberger 1983).
Embedded 5- and 7-membered rings may play a role in yielding ‘low-pressure’ bond-parts and ‘high-pressure’ bond-parts in v-SiO2. This situation is schematically illustratedin figure 7, which shows a pair-wise creation of 5- and 7-membered rings due to the bond-switching mechanism. It is important to note that Sokolov et al (1993) have estimated thatthe number density of modes contributing to the Boson peak is of the order of 10% for manytypes of glasses. This estimated number density is of the same order as that of mismatched5- or 7-membered rings in v-SiO2.
Table 1. Structural data for the ambient pressure phases of silica.
α-quartz α-cristobalite β-cristobalite v-SiO2 d-SiO2
T (˚C) 20 200 300 20 20ρ (g cm−3) 2.65 2.33 2.21 2.20 2.63Si–Si (Å) 3.06 3.08 3.11 3.12 3.04 ± 0.11Si–O (Å) 1.609 1.606 1.606 1.617 1.61O–O (Å) 2.632 2.623 2.623 2.626 2.63O–Si–O (˚) 109.8 109.5 109.5 108.6 109.7Si–O–Si (˚) 144 147 151 145 ± 25 142 ± 25
Figure 6. Ring statistics of v-SiO2. After Pasquarello and Car (1998).

1202 T Nakayama
Figure 7. Schematic illustration of topological bond switch from 6-membered rings to 5- and7-membered rings.
Figure 8. Schematic diagram representing buckled SiO4 tetrahedra at oxygen site.
It is suggestive to consider oxygen defects in Si crystals. As-grown Si crystals containoxygen as interstitial bridging Si atoms, being situated in a slightly off-axis position betweentwo nearest-neighbor Si atoms in the [111] direction, since the equilibrium spacing between Siatoms is smaller than the Si–Si bond length of the Si–O–Si segment. This leads to distortion atthe oxygen sites, which we call buckled sites (see also figure 8). The triangle consisting of theSi–O–Si segment provides new degrees of freedom for vibrations or rotations perpendicularto the Si–O–Si plane (Yamada-Kaneda et al 1993). There is experimental evidence frominfrared absorption experiments that reveal low-lying states due to oxygen impurities witheigenfrequencies at 29, 38, 43, and 49 cm−1 (Bosoworth et al 1970). The sequence of theselow-lying energy levels has also been confirmed by phonon spectroscopic technique (Lassmann1996). It should be noted that the observed frequency range 29–49 cm−1 is identical with thatfor the Boson peak in v-SiO2.
2.2. Effect of pressure on local structures
Irreversible densification of v-SiO2 occurs around 10 GPa (Bridgman 1949, Arndt 1969,1983). The structure factor S(Q) observed for normal and densified amorphous silica (d-SiO2)indicates that the change of the shape of the SiO4 tetrahedron with short-range-order is verysmall, but there is a substantial change in the FSDP (Sinclair et al 1980, Moss and Price 1985,Wright et al 1985, Chervinka 1987, Fowler and Elliott 1987, Meade et al 1992), indicating alarge modification in the MRO associated with the FSDP, as well as a significant reduction in

Boson peak and THz frequency dynamics of v-SiO2 1203
Figure 9. X-ray structure factor S(Q) of v-SiO2 in the range of pressure 0.1 MPa to 42 GPa.Dashed lines are the data at ambient pressure. After Inamura et al (1998).
the width of the Si–O–Si angle distribution (Hemley et al 1986, Susman et al 1991). Figure 9shows the density dependence of the total radial pair correlation function, in which the FSDPfor normal v-SiO2 clearly blue-shifts on densification (Inamura et al 1998). The pressure-induced changes in the FSDP are mainly due to the reduction in distances between Si atoms,related to the decrease in the Si–O–Si bond angles (see figure 5).
Mukherjee et al (2001) reported the direct verification of a first-order phase transitionin amorphous silica from the low-density amorphous (LDA) to the high-density amorphous(HDA) phase of silica glass with an apparent discontinuous volume change of about 20% at3.6 GPa and 680˚C. Lacks (1998, 2000) predicted in terms of MD simulations that a kineticallyhindered first-order amorphous-to-amorphous transition occurs in silica glass, suggesting thatLDA–HDA is apparently a first-order phase transition with a discontinuous volume change ofabout 20% in the pressure range 3–5 GPa. Note that the difference in mass density betweenv-SiO2 (ρ = 2.20 g cm−3) and crystalline β-cristobalite (ρ = 2.21 g cm−3) is only about 4%,whereas it is about 20% in the case of α-quartz (ρ = 2.65 g cm−3) similar to the HDA phaseof silica glass (d-SiO2) (ρ = 2.63 g cm−3). See table 1.
Hemley et al (1986) performed a high pressure Raman spectroscopic study for v-SiO2 atroom temperature. Figure 10 shows the Raman spectra of v-SiO2 as a function of pressure(Hemley et al 1986). They revealed a gradual irreversible change in the Raman spectrumbetween 80 and 30 GPa in addition to a broadening of the Raman band and a loss of intensityabove 30 GPa. There are also other types of experimental evidence (Grimsditch 1984, Polianand Grimsditch 1990) pointing to the existence of a gradual LDA to HDA phase transitionin v-SiO2 at pressures of 10–25 GPa, as well as in the case of amorphous ice (Mishima et al1985). Stone et al (2001) investigated the neutron diffraction profile for pressure-compactedvitreous GeO2 up to 6 GPa in order to examine their medium range structure. They founda strong dependence on pressure of the FSDP. The profile shown in figure 11 for d-GeO2 at1 atm shows the FSDP at Q1 = 1.6 Å−1. They suggested that changes in the first Ge–Gepeak with increasing density indicate a progressive reduction of the mean Ge–O–Ge bondangle.

1204 T Nakayama
Figure 10. Raman spectra of v-SiO2 as a function of pressure. After Hemley et al (1986).
3. Anomalous behaviours of v-SiO2 at THz frequency range
3.1. Excess densities of states
Flubacher et al (1959) was the first to find the excess specific heat for v-SiO2 in the temperaturerange 2.2–19 K, which he ascribed to be of the same origin as that observed by RS at30–120 cm−1 by Krishnan (1953). The relation between the specific heat C(T ) and thephonon DOS D(ω) is expressed by the formula, using the definition of the inverse temperatureβ = 1/kBT ,
C(T ) = − 1
kBT 2
∂
∂β
[∫ ∞
0n(βhω)hωD(ω) dω
], (1)
where n(βhω) is the BE distribution function. The DOS from the Debye theory is given by
D(ω) = 6πω2
ω3D
, (2)

Boson peak and THz frequency dynamics of v-SiO2 1205
Figure 11. Neutron diffraction patterns for d-GeO2, together with Lorentzian fit (- - - -) to theFSDP. After Stone et al (2001).
where the Debye frequency ωD is related to the velocities of transverse and longitudinalsound by
ω3D = 9N
32π4V
(2
v3t
+1
v3l
)−1
. (3)
Here N is the number of atoms in the volume V . The experimental values of velocities forv-SiO2 are vt = 3.767 × 105 cm s−1 and vl = 5.970 × 105 cm s−1, respectively, which gives aDebye frequency νD of 10.40 THz. Using the above relations, one has the Debye law,
C(T ) = 12π4NkB
5
(T
D
)3
, (4)
with the Debye temperature D = hωD/kB = 500 K for v-SiO2. One can obtain the DOSD(ω) by inverting equation (1) from the data of C(T ). There is an ambiguity when obtainingD(ω) from experimental data of C(T ) by the procedure of the inversion transformation.However, this type of thermal measurement is not affected by the mode-selection rule onexcited modes as in the case of optical spectroscopy measurements, in which case activemodes are different for infrared scattering, RS, and hyper-Raman scattering (HRS). The humpin the temperature dependence of C is realized by plotting as C/T 3 against T in the temperaturerange 10–30 K (Pohl 1981, von Loneysen et al 1985, Buchenau et al 1986). Sokolov et al(1997) analysed the excess specific heats of various glasses focusing on the concept of fragility(Angel 1995). They showed a strong dependence on fragility of the specific heats in the rangein which the excess vibrational contribution is present. Typical data for the ratio of specificheats C for both v-SiO2 and d-SiO2 are shown in figure 12 (Inamura et al 1999), in which thedata are compared with the predictions of the Debye theory.
The excess DOS of v-SiO2 observed as a hump in the specific heat has been confirmedby RS (Winterling 1975), INS (Buchenau et al 1984, 1986, 1988) and infrared absorption

1206 T Nakayama
Figure 12. Specific heat CP (T ) of v-SiO2 (——) and d-SiO2 (◦) plotted as CP (T )/T 3 against T .After Inamura et al (1999).
(Galeener et al 1983, Ohsaka and Oshikawa 1998, Ohsaka et al 1999), in addition to recenthyper-Raman experiments (Yamaguchi and Yagi 1999b, Helen et al 2000). The relationbetween the DOS and the RS intensity can be expressed as
I (ω) = (n + 1)
ωD(ω)C(ω), (5)
where D(ω) is the DOS and C(ω) is the Raman-coupling coefficient. Let us assume that theDOS D(ω) has a broad and almost constant spectral distribution at around the Boson peakenergy. Since the Bose factor (n + 1) is proportional to T/ω at temperatures larger than theBoson peak energy, the Raman intensity I (ω) should have the tail proportional to 1/ω2−α
provided that the Raman coupling coefficient C(ω) is proportional to ωα (α = 0–2). Notethat the frequency dependence I (ω) ∝ 1/ω for the case of α = 1 is the same with that of theBose distribution function n(βhω) at relevant temperatures. Malinovsky and Sokolov (1990)have pointed out that the Boson peak spectra obtained by RS experiments take the universalshape as mentioned above. In contrast, the shape of the second broad peak observed in theRS at around 430 cm−1 for v-SiO2 is different from that of the Boson peak. The intensitycontinuously increases with frequency above the Boson peak. The shape of the second broadpeak reflects the difference of the ω-dependence of C(ω) and D(ω) for relevant modes abovethe Boson peak.
Helen et al (2000) and Yamaguchi and Yagi (1999b) have performed HRS experimentsto investigate the modes relevant to the Boson peak in v-SiO2. Helen et al (2000) discoveredthat the Boson peak obtained from HRS is strong compared with those obtained from RS andinfrared absorption. See figure 13. The modes leading to the peak in HRS are essentially silentboth in infrared absorption and in RS. There is only one type of vibrational mode active in HRSthat is forbidden in infrared absorption and RS (Cyvin et al 1965). This is the F1 mode havingthe symmetry of the three infinitesimal rotation operators. This suggests that the Boson peakobtained by HRS is principally due to the mode involving rotational motion of SiO4 tetrahedra.This mode had been suggested by Buchenau et al (1984, 1986) from the analysis of their INSdata. The most striking result is the resemblance of the intensity I (ω) ∝ C(ω)(n + 1)D(ω)/ω

Boson peak and THz frequency dynamics of v-SiO2 1207
Figure 13. Light scattering and infrared spectra of v-SiO2. (a) Comparison of the intensities ofspectra between HRS and RS at 90˚ in (V + H). The ordinate scale is for the HRS signal. (b) Theimaginary part of the dielectric constant divided by ω obtained from infrared reflectivity. AfterHelen et al (2000).
Figure 14. S(Q, ω) from INS (◦) and scaled hyper-Raman intensity I (ω) (•). After Helen et al(2000).
obtained by HRS and the incoherent INS data S(ω) ∝ (n+1)D(ω)/ω (see figure 14), indicatingthe absence of a frequency dependence of the hyper-Raman coupling coefficient C(ω) ∝ ω0.From this evidence, Helen et al (2000) concluded that the main modes contributing to theBoson peak can be associated with those with a frequency-independent coupling coefficientC(ω). Their results lead to the following interpretation of the nature of the Boson peak: (i) Themodes that produce the Boson peak in HRS are optic modes and their spectral distribution isalmost identical with those measured by incoherent INS at the peak frequency of ν ≈ 1 THz.(ii) Those vibrations are non-polar and the coupling coefficient C(ω) is frequency-independent,as opposed to C(ω) ∝ ω2 for acoustic-like modes. (iii) The DOS for the Boson peak isdominated by modes with a flat dispersion relation.

1208 T Nakayama
4. Pressure dependence of the Boson peak
4.1. RS under high pressure
RS experiments at high pressure reveal some important features of the THz dynamics ofglasses. In order to interpret such features, Arai et al (1985) demonstrated the significanteffect of pressure on the Boson peak in a-As2S3. They found that the Boson peak centred at20 cm−1 is very sensitive to hydrostatic pressure. Hemley et al (1986) studied the pressuredependence of the Boson peak for v-SiO2 by means of RS. They found a remarkable effectof the pressure on the Boson peak at 8 GPa in addition to a significant reduction in the widthof the fluctuation of the Si–O–Si angle distribution. The RS spectrum of normal v-SiO2 showsthe profile given in figure 1. One sees that an entirely different pattern evolves on compression,as well as a marked shift of the Boson peak with pressure (Hemley et al 1997) (see figure 15).It should be emphasized that there is a collapse of the scattering intensity of the secondarydiffuse band at 430 cm−1 at a pressure of 8 GPa (Hemley et al 1986).
Yamaguchi et al (1998) and Yamaguchi and Yagi (1999a) performed RS experimentsunder pressures up to 2.6 GPa on the two-dimensional (2d)-network glass, a-GeS2. Hydrostaticpressure was applied to the sample with a diamond anvil cell, and was varied from ambientpressure to 2.6 GPa. Figure 16 shows typical scattering spectra in the vicinity of the Boson peakfor a-GeS2 on varying the hydrostatic pressure. Two apparent peaks are observed in thisfrequency region, namely, the Boson peak indicated by arrows and the secondary peaks inthe vicinity of 100–150 cm−1. The maximum frequency of the Boson peak shifts to higherfrequencies with increasing pressure. In particular, the Boson peak becomes broader andthe relative intensity of the Boson peak compared with the secondary peak decreases withpressure. All these effects were reversible within their pressure range. The reversibility of thesechanges indicates that the pressure effects on the Boson peak reflect the strong anharmonicityof the corresponding local potentials near their minima, in addition to the strong anharmoniccoupling between the modes relevant to the Boson peak and the long-wavelength acousticmodes corresponding to pressure waves.
RS spectra by Yamaguchi and Yagi (1999a) taken under conditions of hydrostatic pressureup to 2.6 GPa for a-GeS2 have generated values for the third-order vibrational anharmonicityassociated with the Boson peak modes some twenty times that associated solely with thelong-wavelength acoustic modes. This provides evidence for the strong anharmonicity of the
Figure 15. Pressure dependence of the maximum of the Boson peak and the FSDP Q1 for v-SiO2.After Hemley et al (1997).

Boson peak and THz frequency dynamics of v-SiO2 1209
Inte
nsity
(a.
u)
Figure 16. RS spectra of a-GeS2 in the low-frequency region at various hydrostatic pressures.After Yamaguchi and Yagi (1999a,b).
potentials associated with the Boson peak spectrum. They have estimated from the shift of theBoson peak the anharmonic coefficient arising from the coupling between the modes relevantto the Boson peak (S) and longitudinal acoustic (P) modes to be ,
CSSP ≈ −5.4 × 10¹³ dynes cm−2, (6)
while the third-order elastic coupling for longitudinal acoustic modes alone is, fromBrillouin data,
CPPP ≈ −2.2 × 10¹² dynes cm−2. (7)
These results clearly demonstrate the much larger anharmonicity associated with the Bosonpeak as compared to the acoustic vibrations, by nearly a factor of 25. Also, the observedRaman intensity of the Boson peak diminishes rapidly with increasing pressure, as comparedto the higher vibrational bands for which there is only a very small intensity change withincreasing pressure. Because the Raman intensity is proportional to the square of the relativeatomic displacement, this means that the relative atomic motions associated with the Bosonpeak are much more strongly reduced with increasing pressure than for the relative motionsassociated with the higher energy vibrational bands.
4.2. Boson peak of d-SiO2
Inamura et al (1998, 1999, 2000) demonstrated the excess DOS of d-SiO2 in INS experiments.They prepared samples of both normal v-SiO2 and d-SiO2 with densities 2.20 and 2.63 g cm−3.

1210 T Nakayama
Figure 17. Integrated S(Q, ω) in Q-range from 1 to 7 Å−1 for v-SiO2, d-SiO2, polycrstallineα-cristobalite, and polycrystalline α-quartz as a funcion of the energy transfer. After Inamura et al(1998) and Nakamura et al (2002).
Figure 17 shows their results for the integrated dynamic structure factor S(Q, ω) in Q-rangefrom 1 to 7 Å−1 for both samples in addition to α-cristobalite and α-quartz. The Boson peaksof both samples appear at 4 meV for normal SiO2 and 7.5 meV for d-SiO2, respectively. (Notethat 1 meV = 0.242 THz.) In particular, the peak intensity for v-SiO2 and d-SiO2 drasticallydecreases in the THz frequency region, where there is no observable difference between normaland densified v-SiO2 above 12 meV in the DOS. This indicates that the Boson peak in normalv-SiO2 is remarkably suppressed due to densification, and does not show a simple shift of thespectra to a higher energy region. The same tendency was observed for d-GeO2 by Suzuyaet al (2001). These works suggest that the Boson peak is very much affected by densification.
Mukherjee et al (2001) have carried out RS experiments for d-SiO2. They found that thediffuse spectrum observed for normal v-SiO2 at 430 cm−1 disappears in d-SiO2 apart from asmall hump at about 500 cm−1. It is natural to interpret the suppression of the DOS of the Bosonpeak due to densification as being related to the shrinkage of open structures of, say, 6- and7-membered rings in normal v-SiO2 (see figure 7). This view is consistent with the structuralinvestigations of pressurized d-SiO2 with Raman spectroscopy (Hemley et al 1986) and NMR(Devine et al 1987). Sugai and Onodera (1996) performed RS experiments for d-GeO2 andobtained similar tendencies to those for d-SiO2 mentioned above. We note that Novikov andSokolov (1991) and Sokolov et al (1992) had suggested the existence of a correlation betweenthe Boson peak and the FSDP.
5. Phonon transport in v-SiO2: the existence of the crossover frequency ν0 to phononlocalization
5.1. Thermal conductivities at the plateau temperature region
Thermal conductivity measurements provide valuable information on localization and/ordelocalization of excited phonons in glasses. The thermal conductivity κ(T ) is expressedby the formula for an isotropic material,
κ(T ) = 1
3
3∑j=1
∫ ωD
0Cj(ω)vj (ω)lj (ω) dω, (8)

Boson peak and THz frequency dynamics of v-SiO2 1211
where the sum is over the polarization j of propagating phonons, vj and lj are the phonon groupvelocity and mean-free-path of the polarization j , and Cj(ω) is its contribution to the phononspecific heat having angular frequency ω, respectively. The typical temperature dependenceof κ(T ) for α-quartz is shown by the upper curve in figure 2. In the temperature region belowaround 10 K, the phonon mean-free-path lj (ω) becomes mostly much longer than the samplesize. Combined with the constant velocities of acoustic phonons, κ for crystals should havethe same temperature dependence as that of the specific heat proportional to T 3 as shown infigure 2. Above about 10 K, phonons are scattered by intrinsic processes such as phonon–phonon and Umklapp processes (Peierls 1929), leading to a decrease of κ(T ) with increasingtemperature T . Since thermal conductivities at low temperatures are dominated by long-wavelength propagating phonons, it is natural to consider that there is no difference betweenglasses and crystals in this temperature regime. This is because long-wavelength phononsexcited below 10 K are insensitive to structure on microscopic length-scales smaller than thecorresponding wavelength λ. However, the observed thermal conductivities for glasses behavequite differently from those of crystals, as shown in figure 2.
The qualitative frequency dependence of the phonon mean-free-path ls(ω) in glassesis shown in figure 18, as estimated from experimental data of κ(T ) given in figure 2. Ifthe frequency dependence of ls(ω) given in figure 18 is correct, this leads to the followinginterpretation of κ(T ): (i) at low temperatures below a few Kelvin, propagating acousticphonons are scattered by the TLS, and one has the relation κ(T ) ∝ T 2, (ii) at highertemperatures (the plateau region), propagating acoustic phonons are exhausted at a crossoverfrequency ν0, leading to a κ(T ) = const. (the Dulong–Petit limit), and (iii) at temperaturesabove the plateau an additional heat transfer channel opens. Thus, glasses behave as a low-passfilter indicating that the heat is carried only by low-frequency phonons ν < ν0.
Zhu (1994) measured the thermal conductivity κ(T ) of d-SiO2 from 15 K to roomtemperature and found that κ(T ) displays a plateau at temperatures up to 60 K, and that themagnitude of the plateau becomes higher than that of normal v-SiO2. This experiment indicatesthat the plateau is severely affected by the densification. These results can be interpreted asbeing due to the crossover frequency ν0 of localization for acoustic phonons shifting to higherfrequencies and the total number of propagating acoustic phonons contributing to heat transferincreasing with densification.
Figure 18. Estimated frequency dependence of the phonon mean-free-path ls(ω) from the analysisof κ(T ) for v-SiO2. After Graebner et al (1986).

1212 T Nakayama
5.2. Kapitza thermal boundary conductance
Direct evidence that figure 18 can be qualitatively correct is obtained from the measurementsof the Kapitza thermal boundary conductance hK for the interface between a glass (G) anda non-glassy solid (S), which presents the transmission coefficient tGS(θ qj
) for an incomingpropagating phonon of wavevector qj with the polarization j incident at angle θ qj
across theinterface. How the transmission coefficient tGS(θ qj
) across the boundary is introduced in theconductance hK is shown below according to a text by Nakayama (1989). When a propagatingphonon with frequency hω is incident from a glass (G) onto a non-glassy solid (S), an energyhωtGS(θ qj
) is transmitted to the non-glassy solid. As a result, the heat flux QGS from a glass(G) to a non-glassy solid (S) is defined by
QGS(T ) = 1
(2π)3
3∑j=1
∫ qD
0n(ω)vj cos θ qj
hωtGS(θ qj) d3qj , (9)
where the angular integral θ qjshould be performed in a half space. At low temperatures the
BE distribution function n(βhω) becomes sharp and excited phonon frequencies ν = ω/h
are simply related to the temperature T by the formula ν = 4.8 × 2 × 1010T (Hz K−1) ≈0.1T (THz K−1). Assuming the Debye DOS for acoustic propagating phonons, the integral ofequation (9) yields (Nakayama 1989), under the approximation of average phonon velocities,
QGS(T ) = π2ρGvGk4BT 4
10ρSv3Sh
3 FGS, (10)
where vG and vS are the average phonon velocities in a glass (G) and a non-glassy solid (S),respectively. Also, ρG and ρS are the mass density of a glass and a solid, respectively. Thefactor FGS is given by
FGS = ρS
2ρG
(vS
vG
)3 ∫ 1
0tGS(θ) cos θ d(cos θ). (11)
If the transmission coefficient tGS(θ) on average is not a function of frequency ω, the heat fluxQGS will be proportional to T 4 as seen from equation (10).
The temperature jump �T between two materials arises because the probability tGS(θ) isless than unity. This limits the heat current out of the hotter medium, and so the interface acts asa thermal barrier across which a temperature difference can be sustained. The proportionalityconstant relating the temperature jump �T to heat flux Q between two materials is known asthe Kapitza conductance hK. Thus, one has
Q = hK�T, (12)
where the Kapitza conductance hK is defined by
hK = ∂QGS(T )
∂T, (13)
while the Kapitza resistance RK is defined by the relation RK = 1/hK. Defining the averagetransmission coefficient by
tGS = 2∫ 1
0tGS(θ) cos θ d(cos θ), (14)
the conductance hK can be expressed as, from equations (10) and (14),
hK
T 3= ctGS, (15)

Boson peak and THz frequency dynamics of v-SiO2 1213
where c takes a constant value determined by material constants, and where the quotienthK/T 3 has no adjustable parameters. This treatment is known as the acoustic mismatch theory(Khalatnikov 1952). It should be noted that Jackle (1983) theoretically investigated the thermalboundary resistance at the interface between a crystalline and a disordered solid with largescattering mismatch but negligible acoustic mismatch, and showed the former contribution isadditive to the acoustic mismatch channel.
Measurements of the Kapitza conductance hK = 1/RK were made, though not for v-SiO2,by Matsumoto et al (1977) for the case of epoxy resin glass and copper, where the epoxyglass plays a role as an adhesive. The epoxy layer had a well-defined thickness but wasvery thin, of the order of several tens of micrometres. Thermometers were placed on thecopper, in rod form, as close to the interface as possible, and the sum of the thermal boundaryresistances of the copper–epoxy and epoxy–copper interfaces was measured. Copper has avery high thermal conductivity, making the temperature drops inside it unimportant, and theelectrons thermalize the phonons so that the thermometers measure the appropriate temperaturedistributions. Moreover, the adhesion of the interface between the epoxy and the copper wasapparently quite good and the results were reproducible.
From the data plotted in figure 19, one sees that there are two distinct temperature regionsin which the physical properties of tGS are quite different in the two regimes T < 0.01 K andT > 1 K. There is a decrease by 3 orders of magnitude in the quantity tGS as the temperatureis increased from 1 to 10 K. This behaviour apparently indicates that only low-frequencyphonons can contribute to phonon transmission across the interface, suggesting that other highfrequency phonons are non-propagating and localized. The onset of localization plays a key
Figure 19. Measured transmission coefficients defined by equation (15) of copper–epoxy–coppersandwiches. Solid squares are for an epoxy layer of 80 µm and open circles for an epoxy layerof 16 µm. Schematic of the experimental geometry is shown in the inset. After Matsumoto et al(1977).

1214 T Nakayama
role for interpreting the plateau in the observed κ(T ). The question now arises as to themechanisms responsible for phonon localization.
6. Inelastic neutron and x-ray scattering measurements
A variety of scattering experiments sensitive to the vibrational modes of v-SiO2 in the THzfrequency range have been performed, among which INS and inelastic x-ray scattering (IXS)experiments are especially powerful for investigating the THz frequency dynamics. Thesetwo are complementary with their own advantages and limitations. It should be emphasizedat first that the quantity obtained by these scattering experiments, say, the dynamical structurefactor S(Q, ω), is the one projected onto plane-waves since it is defined through the spatialFourier transformation. Thus, one should clarify the meaning of energy width of localizedvibrational modes above the crossover frequency ν0. Obviously, exact eigenstates defined inenergy have no energy width. It is only when one projects them onto plane-wave states that alifetime is generated equally in frequency or wave vector space. When calculating an energywidth for the localized modes, it should be understood to be that width which a plane-wavewould experience, and Q loses its meaning as the wave vector.
6.1. INS for v-SiO2
The energy of neutrons of the appropriate wavelength λ for structural and dynamic studiescorresponds to thermal energies for temperatures from a few Kelvin to well above roomtemperature. Because of this wavelength–energy relation, neutron scattering is a powerfultechnique for the study of static and dynamic structure on the atomic scale (Lovesey 1984,Squires 1984, Bee 1988). The analysis and the interpretation of the data obtained by INSexperiments for glasses are not simple compared with those of crystals because of the lackof long-range order of the atomic positions (Carpenter and Pelizzari 1975, Carpenter andPrice 1985, Price and Carpenter 1987). Consequently, there is no complete destructive orconstructive interference for scattered waves of neutrons, giving rise to Bragg peaks in theelastic scattering, and to momentum-conserving selection rules in the one-phonon inelasticscattering as in the case for crystals. In glasses, one cannot work around Bragg peaks as incrystals since coherent INS in the appropriate Q–ω space is limited by kinematical conditionsdue to the conservation of energy and wave-vector. In addition, caution is needed to extractthe densities of states D(ω) from the observed dynamical structure factor S(Q, ω), especiallyfor the case of multicomponent systems such as v-SiO2.
The dynamic structure factor S(Q, ω) is proportional to the space-time Fourier transformof the density–density correlation function defined by G(|r − r′|, t) = 〈ρ(r, t)ρ(r′, 0)〉, whereρ(r, t) is the number density at time t and the angular brackets denote an equilibrium ensembleaverage. The atomic number density variations induced by atomic vibration with displacementum(t) is defined as
ρ(r, t) =∑m
δ(Rm + um(t) − r), (16)
where Rm denotes the equilibrium position of nucleus m. The Q-component of the spatialFourier transform becomes
ρ Q(t) =∑m
e−i Q· rm(t), (17)

Boson peak and THz frequency dynamics of v-SiO2 1215
where the definition is rm(t) = Rm + um(t). The dynamical structure factor S(Q, ω) isproportional to the differential cross section for neutron scattering through the formula,
d2σ
d� dE= kf
ki
σ
4πe−βhω/2S(Q, ω), (18)
where hki and hkf are the strength of the initial and final momenta of the neutron, hQ =h(kf −ki) and hω = (h2/2m)(k2
f −k2i ) are the changes of momentum and energy, respectively.
σ is an arbitrarily chosen microscopic scattering cross section. The dynamic structure factorS(Q, ω) is expressed by
S(Q, ω) = 1
2πhN
∫ ∞
−∞dte−iωt
N∑m,n
bm bn〈ei Q· rm(t)e−i Q· rn(0)〉, (19)
where bm is the neutron scattering length of atom m, and N is its total number. The bar overbm means spin and isotope averaging and the angular brackets indicate thermal averaging. Itis convenient to express each term in equation (19) as a weighted sum for coherent scattering,
S(Q, ω) = 4π
Nσ
N∑m,n
bmbnSmn(Q, ω), (20)
where the sum is taken over all atoms m, n (m = n) of the system. By expanding the atomicdisplacement um(t) in terms of eigenmodes λ, one has
um(t) =∑
λ
(h
2Mmωλ
)1/2
eλ
(ϕλ(Rm)b+
λ(t) + h.c.), (21)
where h.c. means the Hermitian conjugate, eλ is the polarization vector of the λ-mode, andϕλ(Rm) the associated vibrational wavefunction. The bλ
+(bλ) is the creation (annihilation)operator of the state λ. By expanding equation (17) in terms of small displacements um(t),one obtains for the first-order fluctuation
�ρ Q(t) =∑
λ
�ρλ(Q, t) + O(u2), (22)
where the first term is defined as
�ρλ(Q, t) = e−iωλt�ρλ(Q), (23)
which gives the process contributing to creation or annihilation of one phonon, and �ρλ(Q) isdefined by
�ρλ(Q) = −ih∑λ,m
Q · eλ
(2Mmωλ)1/2e−i Q · Rm
(ϕλ(Rm)b+
λ(t) + h.c.). (24)
O(u2) represents the contribution from the two-phonon process.By substituting equation (24) into equation (19), one has the coherent inelastic term for
the dynamic structure factor as
S(Q, ω) = n(βω) + 1
Nσ
∑λ
4πδ(ω − ωλ)
⟨∣∣∣∣∣∑m
bm
Q · eλϕλ(Rm)
(2Mmωλ)1/2e−i Q · Rm
∣∣∣∣∣2⟩
, (25)
where n(βω) is the Bose-Einstein (BE) distribution function and the brackets 〈· · ·〉 mean theorientational average of the direction of the vector Q. We see from equation (25) that S(Q, ω)
becomes a flattened dispersion independent of Q, if one takes a strongly localized (sl) form

1216 T Nakayama
Figure 20. Coupled rotation of SiO4 tetrahedra as deduced from INS experiments. After Buchenauet al (1986).
for ϕλ(Rm). The isotropic nature of glasses should be taken into account on performingorientational averages, and the differential cross section becomes a function of only themagnitude of the momentum transfer hQ = h|Q|. Carpenter and Pelizzari (1975) analyticallydemonstrated that the orientation-averaged S(Q, ω) for one-phonon scattering process shouldappear with pseudo-periodicity in Q-space as a form of the zeroth and second-order sphericalBessel functions if the system possesses definite short-range order, as for example, within SiO4
tetrahedra in v-SiO2 (see figure 20).Arai et al (1999a,b) performed INS experiments to investigate in detail the THz frequency
dynamics of v-SiO2 over a wide range of energy (hω) and momentum (Q) space using theMARI spectrometer in the ISIS facility at the Rutherford Appleton Laboratory. MARI is achopper spectroscopy covering a wide range of Q–ω space, and gives 2d data of S(Q, ω) inone measurement. Figure 21 gives S(Q, ω)E/Q, together with S(Q), in order to make theobserved intensity more sensitive to small intensity variations over a wide range of the Q–ω
space, since S(Q, ω) is proportional to Q2/E as shown in equation (25). Hence, this treatmentenhances the intensity in high-E regions and suppresses it in high-Q regions. The observeddata obtained at the incident energy hωi = 100 meV with an energy resolution of 0.7 meVshow clearly the pseudo-periodicity along the Q-axis as suggested by Carpenter and Pellizzari(1975) and by Carpenter and Price (1985). There clearly exist phonon pseudo-dispersioncurves extending up to 50 meV with slightly variable periodicity reflecting the periodicityof S(Q).
The Q-dependence of the Boson peak energy is depicted in figure 22. It is evident fromfigure 22 that the Boson peak does not show any dispersive behaviour in the Q range from 0.5to 6 Å−1 nor any of the pseudo-periodicity of the spherical Bessel function of Carpenter andPellizzari (1975). Note that the flattened dispersion is a necessary condition for the existence ofsl modes in the sense of its plane-wave Fourier transform. Another interesting feature noticedby Arai et al (1999a,b) is the existence of dispersive modes with the relation ω ∝ Q above

Boson peak and THz frequency dynamics of v-SiO2 1217
Figure 21. Contour map of S(Q, ω)E/Q of v-SiO2. After Arai et al (1999a).
Figure 22. S(Q, ω)E/Q at the Boson peak energy region. After Arai et al (1999b).
the Boson peak energy. The vibrations can be attributed to collective vibrations consisting ofmodes reflecting connected tetrahedra.
Nakamura et al (2001) performed INS experiments for v-SiO2, α-cristobalite and α-quartz.They found clear dispersive behaviour extending to 55 meV (1 THz = 4.14 meV) for thesesamples (see figure 23). In particular, the Q–E relations show a similar behaviour for v-SiO2

1218 T Nakayama
Figure 23. S(Q, ω)E/Q contour maps of (a) v-SiO2, (b) α-cristobalite, and (c) α-quartz. AfterInamura et al (2001).
and for α-cristobalite in the range of E � 7 meV, because of the similarity in local structure ofthese samples. The behaviour of the pseudo-dispersion relation observed in v-SiO2 suggeststhat Umklapp processes also exist (Buchenau et al 1999, Scopigno et al 2001) as well asin the case of glassy Se (Foret et al 1998). The flattening of the dispersion relation centred ataround 5 meV (Boson peak) shown in figure 24 is remarkable. S(Q, ω) for α-cristobalite hasa narrower band at around 5 meV and a number of Bragg peaks can be observed.
Harris et al (1999) obtained by means of coherent INS, S(Q, ω) for v-SiO2 andα-cristobalite over a wide range of wavevectors (Q = 0.4–7.3 Å−1) in the Boson peak energyrange. They suggested, by comparison with scattering data and from the similarity in the short-range order of both materials, that the Boson peak in v-SiO2 arises from the modes possessing atransverse nature (torsional motion of tetrahedra). A similar idea had been originally suggestedby Leadbetter (1969).
6.2. IXS for v-SiO2
IXS is a complementary method to INS for investigating acoustic modes in glasses at smallmomentum transfers Q. This method is based on a scattering process of a beam of photons, withenergy hωi , momentum hki, and polarization εi , impinging on a sample. Photons scattered witha specific energy hωf , momentum hkf , and polarization εf are detected, giving information onthe spectrum of the excitations of energy hω = hωi − hωf and momentum hQ = hki − hkf .The IXS technique has become possible through the use of the high x-ray spectral flux densityavailable from synchrotron radiation sources. An energy resolution of 1.54 ± 0.2 meV isobtained by energy analysis of typically 20 keV x-rays at the European Synchrotron Radiation

Boson peak and THz frequency dynamics of v-SiO2 1219
Figure 24. S(Q, ω) contour maps at around 5 meV of (a) v-SiO2 and (b) α-cristobalite. AfterNakamura et al (2001).
Facility in Grenoble. An incident wavelength λi = 0.5700 Å−1 is used, and other instrumentalparameters are a Q-resolution of ±0.02 Å−1 and a photon flux of about 2 × 10⁸ photons s−1
(Ruocco and Sette 2001).The differential cross section for incident photons with momentum hki is given by
first-order perturbation theory as
d2σ
d� dE= r2
0 (εi · εf )2 kf
hki
∑f
∣∣∣∣⟨f, kf
∣∣∣∣ ∑m
fm(Q)ei Q · Rm
∣∣∣∣i, ki
⟩∣∣∣∣2
δ(ω − ωf − ωi), (26)
where r0 = e2/mec2 is the classical electron radius, and |i, ki〉 and |f, kf〉 are the ket
representations of the intial and final state of the system, respectively. The fm(Q) is theform factor of the atom m whose centre of mass position is Rm. The form factor is the spatialFourier transform of the electron-density distribution, corresponding to equation (19) in thecase of INS. For the system consisting of atomic species κ and κ ′, a partial structure factorSκκ ′ is defined as
Sκκ ′(Q, ω) = 1
N
∑m,n
∫ ∞
−∞〈〈ei Q · rκ
m(t)ei Q · rκ′m (0)〉〉e−iωt dt, (27)
where 〈〈· · ·〉〉 means the thermal and orientational average. Using this definition, one has thescattering cross section given by
d2σ
d� dE= Nr2
0 (εi · εf )2 kf
hki
∑κ,κ ′
pκpκ ′fκ(Q)fκ ′(Q)Sκκ ′(Q, ω). (28)
Here fκ(Q) is the atomic form factor for the species κ and pκ is its concentration. In theQ → 0 limit, the form factor becomes the number of electrons Zκ of the atom κ . For v-SiO2,

1220 T Nakayama
ZSi = 14 and ZO = 8, and these are actually proportional to the atomic masses MSi = 28 andMO = 16. Therefore, in the small Q-limit, the scattering cross section for x-rays becomesproportional to the mass density–density correlation function (Ruocco and Sette 2001)
d2σ
d� dE= Nr2
0 (εi · εf )2 kf
hkiS(Q, ω), (29)
with the definition given by
S(Q, ω) =∑κ,κ ′
pκpκ ′MκMκ ′
M2tot
Sκκ ′(Q, ω). (30)
The quantity Mtot in equation (30) is the total mass of a molecular unit (Mtot = 2MO + MSi
for v-SiO2). The proportionality function between INS and IXS is different, since the thermalneutron scattering lengths are not proportional to the atomic masses as seen from equation (25).The IXS signal at low Q can be well approximated by the density–density dynamic structurefactor, but with increasing Q, other components, such as the charge–charge dynamic structurefactor, start to play a role. The IXS technique is sensitive to the motion of heavier atomsas seen from equation (30). INS does not depend on the number of electrons per atom, butdepends purely on a nuclear property. The main difference between IXS and INS is that IXScovers unlimited energy transfers in the accessible Q transfer range in Q–ω space. Providedthat the energy resolution is sufficient, the IXS technique becomes a complementary tool tothe INS method.
The Brillouin IXS spectra for v-SiO2 at T = 1055 K, where the anharmonicity of atomicvibrations become relevant, are illustrated in figure 25 from Q = 0.1 to 0.4 Å−1 (Bennassiet al 1996, 1997). Bennasi et al (1996, 1997), Masciovecchio et al (1999) (figure 26) andPilla et al (2000) analysed their data of IXS using the following damped harmonic oscillator(DHO) approximation:
F(ω) = 2
π
�2
(ω2 − �2)2 + ω2�2, (31)
taking the linear dispersion relation � = vQ with a broadening �.They concluded that the linear dispersion relation of phonon excitations holds up to
energies more than twice that of the Boson peak and that these are propagating modes. Thisstatement contradicts the finding of the absence of any observable Q-independent feature atthe Boson peak energy (Foret et al 1996, Arai et al 1999a). The use of the DHO function to fitthe spectral density does not indicate any particular physical significance of the nature of thevibrational excitations, since it can equally describe the damped behaviour of a localized modeor of a propagating collective mode. It should be regarded as a suitable empirical functionwith which to fit asymmetric peaks (Vacher et al 1998, 1999).
Foret et al (1996) employed the following function in order to analyse their Brillouin IXSand INS. The function is given by
F(Q, ω) = v2Q2
ω2
�
(ω2 + �2 − v2Q2)2 + 4�2v2Q2, (32)
where the width �(ω) takes the form
�(ω) = ω4
ω30
[1 +
(ω
ω0
)m]−3/m
, (33)
and the frequency dependence of the phonon velocity is defined by
v(ω) = v0
[1 +
(ω
ω0
)m]z/m
. (34)

Boson peak and THz frequency dynamics of v-SiO2 1221
Figure 25. IXS spectra of v-SiO2 at 1050 K taken at different Q values. After Bennasi et al (1996).
This function was successfully used to analyse the scattering data for sl modes in fractalstructures (see, e.g. Nakayama et al 1994). The use of a crossover frequency ω0 in the functionis crucial. Provided that the Boson peak modes consist of sl modes crossed over from extended(ex) acoustic phonons, the use of this type of function is reasonable. From the analysis of thedata of Brillouin INS and IXS experiments in terms of the scattering function of equation (32),Foret et al (1996) claimed that an acoustic localization edge exists at around 1 THz. We shouldmention in this respect that Foret et al (1997) re-analysed IXS data by Bennasi et al (1996)employing the scattering function of equation (32). They demonstrated excellent fits with theIXS data by taking a crossover frequency of ν0 ≈ 1 THz. Since the interpretation due to theDHO that the Boson peak consists of a propagating acoustic mode is not definite, Foret et al(1997) claimed that the propagation of acoustic modes at frequencies beyond the Boson peakof v-SiO2 is not conclusively demonstrated from IXS experiments.
It should be emphasized again that IXS is sensitive to the motion of Si-atoms. One ofthe plausible interpretations for the discrepancy between INS and IXS data is that the atomicmotions relevant to the flattened dispersion at the Boson peak can be attributed to the motion ofO-atoms (Arai et al 1999a, Harris et al 1999), whereas the linear dispersion above the Bosonpeak observed by IXS and INS arises mainly from the relative motion of Si atoms.
6.3. Crossover to strong scattering of acoustic phonons: Ioffe–Regel criterion
It has been believed that the localization of propagating acoustic phonon yields the universalplateau behaviour in the thermal conductivity of glasses around 10 K. However, the natureof the relation between the Boson peak and the plateau has been controversial. In the early

1222 T Nakayama
Figure 26. IXS spectra of v-SiO2 at Q = 1.6 nm−1 taken at different temperatures. AfterMasciovecchio et al (1999).
stages of the investigations, there were two pictures of the excess Boson peak: one is due tothe localization of acoustic phonons by disorder, the other is due to the resonant scatteringof acoustic phonons by the local potential. There exists experimental evidence that lineardispersion relations for longitudinal and transverse acoustic waves hold up to the highestmeasured ν ≈ 400 GHz, and that the linewidth � of these waves is proportional to ν2 due tointernal friction with a temperature dependence (Vacher et al 1981, Rothenfusser et al 1984,Zhu et al 1991, Marath and Maris 1996).
The length scale of domains associated with density fluctuation in v-SiO2 takes a value ofR ≈ 15 Å (Elliott 1991, 1992). Thus, the microscopic structure of v-SiO2 involves intrinsicstructural inhomogenieties owing to density fluctuation domains of diameter 2R. Such densityfluctuations strongly scatter acoustic phonons, resulting in a reduction in the mean-free-pathls of acoustic phonons. With increasing frequency of the acoustic phonons, the linewidthincreases according to the Rayleigh scattering law, � ∝ ν4. This should rapidly yield the strongscattering regime (see figure 18). That is, the Ioffe–Regel (IR) regime under the condition� ≈ 2πν holds for ν > ν0, where ν0 is the IR crossover frequency (Ioffe and Regel 1960).

Boson peak and THz frequency dynamics of v-SiO2 1223
The onset of localization is also expressed, in terms of the IR criterion, as qls ≈ 2π , Theminimum value for ls should correspond to the length-scale of domains 2R ≈ 30 Å associatedwith density fluctuations in v-SiO2. This value for scattering length ls agrees with the mean-free-path calculated using the data for the thermal conductivity of v-SiO2 (Zeller and Pohl1971, Graebner et al 1986, Vacher et al 1997) (see, e.g. figure 18).
One can estimate the mean-free-path owing to the Rayleigh scattering law. This can beobtained by adjusting the following theoretical law
l−1s = Aν4, (35)
to the observed mean-free-path ls(ω) of v-SiO2 given in figure 18. This yields A = 9 × 10⁻²
(Å−1 THz−4). The substitution of ν = 1 THz into equation (35) demonstrates that the mean-free-path becomes of the order of wavelengths of acoustic phonons. This crossover frequencyν0 ≈ 1 THz coincides with the estimation made in figure 18. Vacher et al (1997) found thatthis Rayleigh scattering should become dominant above about 300 GHz by extrapolating theBrillouin value of the mean-free-path with a ν2 law (see figure 27). Figure 27 shows the inversemean-free-path l−1
s against the frequency ν of acoustic phonons in v-SiO2 (Vacher et al 1997).Assuming the linear dispersion relation q = ω/vs for acoustic phonons, one has the relation
ν0 ≈ vs
2R. (36)
Thus, ν0 should increase with decreasing R, evidence for which was obtained by Zhu (1994) inthe course of thermal conductivity experiments on d-SiO2. If the IR criterion due to Rayleighscattering is the origin of the Boson peak, there should be no temperature dependence of theBoson peak spectra. However, Wischnewski et al (1998) found clearly a strong dependenceon temperature for the Boson peak spectra. It should be emphasized that there is no excessDOS at the crossover frequency from propagating to localized phonons for the case of fractal
Figure 27. Frequency dependence of the mean-free-path l−1s for v-SiO2. The full black circles
are the IR crossover frequency, corresponding to the upper limit of the Rayleigh scattering regime.The ω2 line represents the relaxational contribution obtained by the extrapolation of the Brillouinvalue. After Vacher et al (1997).

1224 T Nakayama
structures (Yakubo and Nakayama 1987, Bernasconi et al 1992). From this, it is natural toconclude that phonon localization is not a necessary condition for the appearance of the excessDOS (the Boson peak). The point is whether or not the onset of localization begins lower thanthe Boson peak energy. The situation is rather complicated because resonant vibrational stateswith the length scale of the MRO can become mixed with bare propagating phonon states.
Experimental data on v-SiO2 support the conclusion that the Boson peak energy regionalmost coincides with the crossover frequency ν0 of acoustic phonon localization. If thecrossover to strong scattering due to Rayleigh scattering occurs at ν0 at around 1 THz, theresonant states should be localized above ν > ν0. If not, the resonant states should be extended.This conclusion is due to the assertion of the non-coexistence of ex and sl modes at the samefrequency by Mott and Twose (1961).
Rat et al (1999) performed Brillouin XS experiments to observe the crossover frequencyν0 to strong scattering of acoustic phonons in d-SiO2. They used d-SiO2 to avoid the maskingby the wings of the intense elastic signal below about 4 meV. They analysed the data usingthe function (32) and concluded that longitudinal acoustic phonons are seen up to an energyhω ≈ 9 meV, corresponding to a scattering vector Q ≈ 0.22 Å−1. At higher Q, the nature ofthe signal changed rapidly, indicating a crossover to strong scattering.
This has led to an understanding that local extra-potentials are relevant to the structuralorigins of both the two-level tunnelling states (TLS) and the sl modes associated with theBoson peak spectrum. The local extra-potentials stemming from internal distortion play a keyrole in generating the peculiar low-energy dynamics in glasses.
7. MD simulations for v-SiO2
The first attempt at MD simulations for v-SiO2 was made by Bell and Dean (1972) usinga hand-made structural model. Later, it become possible to treat more sophisticated modelsbased on simulated structures due to the availability of ever faster computers. Such simulationsare likely to play an important role in laboratory experiments. However, for the THz frequencydynamics of glasses, the use of simulated structures is often unjustified due to a number offactors. Binder and Kob (1998) and Horbach et al (1999) pointed out several problems withMD simulations on v-SiO2. For MD simulations of realistic systems, the crucial point isthe validity of the chosen interatomic potentials and the size of the model. Tsuneyuki et al(1988) derived a pair-wise potential by fitting selected ab initio calculations, which has beenimplemented in many MD simulations of v-SiO2 (Swaison and Dove 1993, Della-Valla andVenutti 1994, Guillott and Guissani 1997). An improved potential was proposed by van Beestet al (1990) and applied to MD simulations of v-SiO2 (Vollmayr et al 1996, Horbach et al1998). Although these potentials yield structural properties which are consistent with thediffraction data S(Q), the agreement with the experimental DOS is less impressive. The bestmethod for creating a realistic structural model for v-SiO2 is in ab initio Car-Parrinello MDsimulations taking account of valence electrons explicitly. Though it is limited to small sizesup to 72 atoms (Sarnthein et al 1995a,b, 1997, Pasquarello and Car 1998, Pasquarello et al1998, Pasquarello 2000), the calculated results recover well the dynamic behaviour of v-SiO2
above about 5 THz.Taraskin and Elliott (1997a,b, 1998) have performed MD simulations for v-SiO2
employing the two types of potential functions proposed by Tsuneyuki et al (1988) and Beestet al (1990). The structural models of Taraskin and Elliott (1997a) consist of 216 silicon and432 O-atoms within a cube of length L = 21.4 Å with a density ρ = 2.2 g cm−3, employingthe periodic boundary condition. The wavelengths of the excited phonons were restricted in theregime λ < L. Assuming the velocity of transverse acoustic phonons to be 3.74 × 105 cm s−1,

Boson peak and THz frequency dynamics of v-SiO2 1225
one can estimate the minimum frequency of the system as νm = 1.78 THz. This minimumfrequency is higher than the main frequency region of the Boson peak of v-SiO2 at about1 THz observed by INS (Buchenau et al 1984, 1986) and HRS experiments (Helen et al 2000,Yamaguchi and Yagi 1999b). Thus, the results obtained by Taraskin and Elliott (1997a,b, 1998)only partly cover the region of the Boson peak, and similarly for the simulations performed byHorbach et al (2001).
The systems employed by Taraskin and Elliott (1997a,b, 1998) were quenched from theliquid state at 5000 K in 100 K steps to the temperature at which atomic diffusion stopped, andthen relaxed to a metastable state free of any coordination defects. This showed good agreementwith experimental diffraction data on S(Q). Their calculated Q–ω relation (figure 28)demonstrates the following: (i) Pseudo-periodicity exists for k2 ≈ 3 Å−1, corresponding tothe period of d2 = 2π/k2 ≈ 2 Å due to the average height of SiO4 tetrahedra (see figure 5).(ii) This coincides with the pseudo-periodicity 2π/Q2 found from the position of the secondsharp diffraction peak at Q2 ≈ 3 Å−1 in S(Q). (iii) Another important finding is that thetransverse acoustic branch apparently reaches a plateau at k1 ≈ 0.7–0.8 Å−1, correspondingto a period of d1 = π/k1 ≈ 3.9–4.4 Å. Simulated results suggest that excess modes originatefrom the lowest optic band states hybridized with transverse acoustic modes.
Figure 28. Dispersion relations for the structural model of v-SiO2 based on (a) the van Beestpotential and (b) the Tsuneyuki potential. After Taraskin and Elliott (1997a,b). Vertical barsrepresent half-widths of the peaks.

1226 T Nakayama
Swainson and Dove (1993, 1995) and Dove et al (1997) have performed MD simulationsfor cristobalite and v-SiO2 based on a rigid unit model. They claimed that the THz frequencydynamics of β-cristobalite is very similar to that found in v-SiO2. This is due to the existenceof rigid-unit modes arising from the underconstrained situation in silica (Thorpe 1983, He andThorpe 1985). In contrast, a-Si is overconstrained, having an average coordination numberz ≈ 2.4. This is the reason of the difficulty of achieving double-well potentials in a-Si.
Trachenko et al (1998, 2000) performed MD simulations using the split-atom algorithm,in which a strict constraint is assigned to a tetrahedron as a rigid unit (Giddy et al1993). Their structural models consist of defect-free configurations containing 216, 512,and 4096 tetrahedra. Their results show that v-SiO2 has the same degree of flexibilityas dynamically disordered β-cristobalite (Keen and Dove 1999), which undergoes suddenrotational rearrangement of the structure with little energy cost (Thorpe 1983). For this jumpmotion the partition ratio indicates that the number of tetrahedra involved is around 30. Thissuggests the existence of large-amplitude reorientational motions of SiO4 tetrahedra, that maybe identified as the origin of two-level tunnelling states (TLS) in v-SiO2 (Trachenko et al1998).
8. Construction of potential functions
8.1. Infinitesimal translational and rotational invariance
The difficulty associated with the theory of THz frequency dynamics in glasses lies inconstructing the potential functions from a variety of information on the atomic arrangementin glasses. This is a key element to formulate the theory as a starting point for investigation.The appearance of collective modes (phonons) is a consequence of infinitesimal translationaland rotational invariance (TRI) of the system. This leads to the concept of the zero-frequencymode corresponding to infinitesimal translation as a whole, whose eigenfunction should beorthogonal to all other eigenmodes with finite eigenfrequencies in the system (see figure 29).This follows from the theorem that the modes with non-zero eigenfrequencies are composed ofcollectively oscillating functions even in topologically disordered systems, while the isolatedvibrational states of single atoms or groups of atoms do not give a correct picture as in the caseof the Einstein oscillator (Einstein 1907). For example, specific heats of insulating crystalsdrop from a value close to that of 25 J mol−1 K−1 at room temperature and approach zero asT 3, in which crystals’ collective modes (acoustic phonons) play a role as explained by Debye(1912).
From a very general point of view, the total potential energy V of a solid, whether forcrystals or glasses, is expressed in terms of a small displacement ui (t) from the equilibriumposition of the atom i, since the potential energy V should be a function of the instantaneouspositions of all atoms (see, e.g. Born and Huang 1954). By expanding in a Taylor seriesin powers of the atom displacement ui (t) around an equilibrium configuration of the atomat ri , one obtains the Born–von Karman type force-constants from the second-order derivatives
Figure 29. Diagrams showing the orthogonality between (a) the infinitesimal translationalzero-frequency mode and (b) an excited vibrational mode with finite frequency.

Boson peak and THz frequency dynamics of v-SiO2 1227
of the potential V even for glasses with local distortion. However, this type of expansiondoes not guarantee automatically the TRI of the potential function as a whole. It is morenatural to expand the potential function V in terms of internal variables being invariant undertranslation (T) and rotation (R).
8.2. Valence force field in the normalized form
A transparent approach, expanding the potential V in terms of internal variables such as�rij , �θijk, �τijkl , c, is to use the valence force field (VFF) potential, which automaticallyguarantees the TRI. The VFF was initially introduced to describe vibrations of moleculesand later adopted for crystals of diamond structure (Keating 1966) and later applied tochalcogenides (Nakayama and Odajima 1972, 1973). This potential field is the most usefulphenomenological description of short-range valence forces and can also naturally describeinteratomic interactions governing the bonding which is predominantly covalent. Though theforce field can be expressed with the smallest possible number of force constants, its expansionfor glasses has nonvanishing terms for first-order derivatives associated with tension arisingfrom internal stress. This is the key difference between crystals and glasses.
The VFF potential expressed in terms of internal variables yields
VH(. . . , rij , θijk, τijkl, . . .) = V0(. . . , rij0, θijk0, τijkl0, . . .)
+∑ ∂V
∂rij
∣∣∣∣0
�rij +∑ ∂V
∂θijk
∣∣∣∣0
�θijk + · · ·
+1
2
∑ ∂2V
∂rij ∂rkl
∣∣∣∣0
�rij�rkl +1
2
∑ ∂2V
∂θijk ∂θklm
∣∣∣∣0
�θijkθklm
+1
2
∑ ∂2V
∂rij ∂θjkl
∣∣∣∣0
�rij θjkl
+ · · · + anharmonic terms, (37)
where V0 is the static potential energy in a quenched equilibrium state. In equation (37),rij0, θijk0, τijkl0 · · · are equilibrium values of the bond length, the bond angle, and the dihedralangle, · · · defined through the atoms i, j, k and l. The variables �rij , �θijk, �τijkl representthe deviation of the bond length, the bond angle, and the dihedral angle from their equilibriumvalues. The first-order derivative ∂V/∂rij |0 = Tij means the tension of the bond (that is, theelastic energy per unit length) between the atoms i and j at their equilibrium positions.
The tensions Tij should satisfy the equilibrium condition of forces, namely, the balanceof the forces upon the atom because of no flow of atoms in a quenched state (Treloar 1975,Alexander 1998). For example, by writing the tension between the atoms i and j as Tij , thecondition of the balance of forces at the atom i should be expressed as
fi =∑
Tij · rij = 0, (38)
where fi is the force at the atom i, and rij = rij /|rij | defined through rij = ri − rj is the unitvector along the bond i and j . In liquid states, the force fi does not vanish. Equation (37) canalways be rewritten in bilinear form, taking into account the condition of balance of forces inequation (38), as
�VH(. . . , �rij , �θijk, . . .) = 1
2
∑Krij
(�rij +
Tij
Krij
)2
+1
2
∑Kθijk
(�θijk +
Tik
Kθijk
)2
+ · · · , (39)

1228 T Nakayama
where Krij= ∂2V/∂r2
ij |0, Kθijk= ∂2V/∂θ2
ijk|0, Tij = ∂V/∂rij |0 and Tθijk= ∂V/∂θijk|0,
respectively. The dimension of the ratios T/K in the parentheses of equation (39) representsthat of displacement. Namely, the physical meaning of the terms Tij /Krij
or Tθijk/Kθijk
is thedisplacement of the atom from the position corresponding to the equilibrium bond length andangle due to local internal stresses satisfying the equilibrium condition of the forces (Nakayama1999). One sees from the normalized potential equation (39) that the same eigenfrequenciesand eigenvectors are created as in the case of the potential without the terms of tensionsbetween interacting atoms. As a result, this normalized potential equation (39) rewritten inthe quadratic form is equivalent to the dynamical system as representing ordinary disorderedsystems without internal stresses.
8.3. Buckling at atomic scales and local extra-potentials
Anderson and Bommel (1955) were the first to set forth the idea, in order to explain therelaxation process responsible for large acoustic loss, that bent Si–O–Si angles cause two ormore equivalent positions around the Si–O–Si straight line and small energy barriers separatingthe equivalent states. This is natural since the buckling should be produced at the site withsmall configurational number z, namely, at the sites of O (z = 2) compared with at the sites ofSi (z = 4) in v-SiO2, where buckled atoms are considered to be trapped in one of the doublewells. Note that the corresponding potentials are hardened with increasing external pressure,indicating that the Boson peak is very sensitive to pressure as mentioned in section 4.
By introducing a new variable, say, rotational motion of rigid units of tetrahedra, thegeneral form of local extra-potential �VE is expressed by
�VE(. . . , �Qjr, �Qjθ , . . .) =∑ (
TEjr�Qjr + 1
2KEjr(�Qjr)
2 + 13AEjr
(�Qjr)3
+ 14BEjr
(�Qrj )4 + 1
3A1jr(�Qjr)
2�rij + 13A2jr
(�Qjr)(�rij )2 + · · ·
+TEjθ�Qjθ + 1
2KEjθ(�Qjθ )
2 + · · · ), (40)
where �Qjθ = Qj − θi or �Qjr = Qj − ri . Note that �VE satisfies the TRI condition anddoes not represent isolated potentials. The potential relevant to the two-level-tunnelling states(TLS) with low-enough barrier heights should be derived from equation (40), as well as thecase of the local extra-potentials for the Boson peak.
The total Hamiltonian satisfying the TRI condition is written as
H =∑
i
− h2
2mi
∇2i + �VH + �VE, (41)
where �VH is a usual quadratic form of the potential given by equation (39). Each potentialplays a role for creating the peculiar dynamics at THz frequencies and below.
Recently, Nakamura et al (2002) have performed INS measurements for v-SiO2, d-SiO2,α-cristobalite and α-quartz to obtain the averaged mean-square displacements through anevaluation of the Debye–Waller factor. They found clear evidence that the averaged mean-square displacement relevant to the Boson peak of v-SiO2 are especially large at anytemperature from 20 to 300 K, indicating that anharmonic potentials in v-SiO2 such as double-well potentials with small barrier heights give rise to an excess DOS at around 5 meV, namely,the Boson peak.
8.4. T -linear specific heat below 1 K
Phillips (1972) and Anderson et al (1972) have postulated the existence of isolated asymmetricdouble-well potentials with low-enough barrier heights and short-enough distance, ignoring

Boson peak and THz frequency dynamics of v-SiO2 1229
the coupling with the vibrations of surrounding atoms. That is, their double-well potentials donot satisfy the TRI condition. In the following we give the reason why this simplified approachwas successful in describing the phenomena observed below 1 K.
Acoustic phonons excited at low temperatures below 1 K have wavelengths longer thanabout 2500 Å when taking the sound velocity vs ≈ 5 × 105 cm s−1. These wavelengths arelonger than the length scales of the local extra-potential �VE that is spatially localized in the10 Å range. This is one of the reasons why the adiabatic approximation for TLS is valid for localextra-potentials expressed by asymmetric double-well potentials reflecting the microscopicbuckling, where the potential barrier-height and the separation of the two local minima aredistributed according to such factors as the particular configuration of atoms surrounding thetwo minima and the internal stresses.
The number density n0 of the two-level-systems (TLSs) can be estimated using thefollowing theoretical expression for the T -linear specific heat (Anderson et al 1972, Phillips1972).
C(T ) =(
π2
6
)n0k
2BT . (42)
By substituting the observed magnitude of the specific heat of v-SiO2 into this, one has thenumber density n0 contributing to the TLS as n0 ∼ 1/250 of the total number of SiO4
groups. The TLS model (corresponding to a para state without correlation between TLSs)describes the thermal properties of glasses at low-temperatures, but not the properties at verylow temperatures around the mK temperature region where the interaction between TLSsvia elastic or electric dipole interactions become relevant. A characteristic temperature Tc
is estimated from elastic dipole interactions of the form g/r3, taking the average distance ofTLS’s r ≈ 100 Å and the coupling constant g ≈ 104 K Å3 (Carruzzo et al 1994). The frozen-instate of TLSs should be realized at very low temperature as a correlated configuration due tointeractions between TLSs, which should yield different features in thermal properties fromthose observed in the temperature range 0.01–1 K (Rogge et al 1996, 1997a,b, Strehlow et al1998, Hunklinger et al 1999, Kettemann et al 1999). It will be possible, due to interactionsbetween TLSs, to realize a macroscopic quantum state (S0 = 0) as T → 0 according to theNernst theorem. All of these features mentioned above are derived in principle from the localextra-potential equation (40) which fulfils the TRI condition incorporating the coupling withsurrounding atoms.
8.5. Relevance to the soft potential model
Karpov et al (1983) and Karpov and Parshin (1985) introduced the concept of the soft-potentialmodel (SPM) for describing THz frequency dynamics in glasses. See, for a review, Parshin(1994). The isolated SPM is really derived under an adiabatic approximation neglecting thecoupling with vibrations of surrounding atoms, which does not satisfy the TRI condition.
We describe the physical implications of the SPM. Expressing the amplitude of vibrationalmotions of atoms or groups of atoms in an extra-potential and that of surrounding atoms as Q
and q, respectively, one has the relation KE〈Q2〉 ≈ Kr〈q2〉 ≈ kBT at the temperature T fromthe principle of equipartition of energy, where 〈· · ·〉 means the thermal average. In the casethat the force constant Kr is larger than the force constant of the extra-potential KE , that is,Kr � KE , one has the relation 〈Q2〉 � 〈q2〉. Namely, the amplitudes of surrounding atomsare small compared with that of atoms or groups of atoms in the extra-potential. This makesus approximate equation (40) by neglecting the contribution of displacements of surrounding

1230 T Nakayama
atoms as
�VE =∑ (
12KEi
Q2i + 1
3AEiQ3
i + 14BEi
Q4i + · · · ). (43)
Although equation (43) is a crude approximation, it is possible to analyse numerousexperimental data by means of parameter fitting (Karpov et al 1983, Karpov and Parshin1985).
9. Model Hamiltonians reduced to the harmonic form
When describing the non-adiabatic effect, it is fruitful to reduce the potential to a simpleone, namely, by adopting a quasi-harmonic approximation. For this quadratic form of theHamiltonian, the main problem is reduced to that of obtaining eigenfrequencies ωi by solvinga set of classical equations of motion and their eigenvectors. This approach has been adoptedby several authors.
Laughlin and Joannopoulous (1977, 1978) presented a theory of atomic vibrations ofv-SiO2 based on the Bethe lattice model. They focused their attention on the role of theSi–O–Si angle distribution in the relatively high frequency regime. Properties of phonons inv-SiO2 are classified into those arising from short-range-order and to the disruptive effectsof the Si–O–Si bond angle disorder. Their results supported the viewpoint that rocking andbending can be distinguished from one another only by the presence of a Si–O–Si bend ofabout 145˚. It is surprising that the spectrum higher than 3 THz was described well by thissimplified model. The effects of the angular force constant (Kθ ) are crucial, giving rise tothe softening of the rocking bands. These bands (the Boson peak) are predominantly angle-distorting vibrations and are sensitive to changes in the angular force constant. Namely, theseare sensitive to external pressure. The results provide important insights: (i) The dynamicproperties v-SiO2 in the THz frequency region are completely dominated by local effects,particularly the values of the bond angles. (ii) The bond-angle distribution is important in thatit broadens features in the spectrum. (iii) The topology of v-SiO2 is not manifested in therelatively high frequency regime.
The sensitivity of the DOS to very large Si–O–Si bond angle distortions was investigated bySen and Thorpe (1977). They proposed a theoretical framework for the study of the vibrationalproperties of v-SiO2 using the VFF model, leading to the concept of floppy modes.
Schirmacher et al (1998) and Akita and Ohtsuki (1998) have investigated a three-dimensional (3d) simple-cubic system governed by a coupled harmonic model with a randomdistribution of force constants. They have found quite naturally an excess Boson peak comparedto the Debye behaviour in the DOS. The point of their result is that relevant modes for theBoson peak are not localized, as evidenced by an analysis of the level-distance-statistics ofthe spectra. This conclusion seems to be attributed to their use of a simple-cubic model withonly one length scale a0 of the lattice spacing, which makes the crossover frequency ν0 tolocalization at much higher frequencies than the eigenfrequencies corresponding to the Bosonpeak. This makes it possible for the modes relevant to the Boson peak not to be localized.
We should emphasize that localized resonant modes do not coexist with ex(propagating/acoustic) modes at the same eigenfrequency ω, according to the conjecture ofMott and Twose (1961). This is because the eigenfrequencies of the resonance states due tolocal extra-potentials are embedded in the continuous band of ex acoustic modes. However,provided that the onset of localization of acoustic modes occurs below these resonancefrequency distributions arising from the local extra-potentials, the existence of sl modes isguaranteed. Thus, it is necessary in order to have sl modes that the onset of phonon localization

Boson peak and THz frequency dynamics of v-SiO2 1231
occurs below these resonance frequencies. For v-SiO2, the IR criterion yields the crossoverfrequency from extended to localized acoustic phonons atν0 ≈ 1 THz as mentioned in section 7.This condition is automatically satisfied in the case of a one-dimensional (1d) disorderedsystem from the theorem of Anderson localization, stating that all excited modes are weaklylocalized in 1d systems and have a discrete eigenfrequency distribution. Anderson localizationof phonons in ordinary disordered systems depends on the dimensionality (Abrahams et al1979, John et al 1983). In contrast, the appearance of the Boson peak seems not to dependon the dimensionality of the system as observed in 1d polymer glasses (Kanaya et al 1988),folded proteins (Brown et al 1972, Genzel 1976, Cusack and Doster 1990, Leyser et al 1999),and 2d systems such as a-GeS2 (e.g. Yamaguchi et al 1999a), indicating that the Boson peakhas a quite different origin from that of Anderson localization.
The physical model proposed by Nakayama (1998a,b, 1999) represents a possible glassystate in a local minimum on the potential map in configuration space. Its topological featureof two length scales for the nearest neighbour distance a0 and the average size of network unitL is taken into account as shown in figure 30. This model consists of two main chains witha constant mass M of molecular units (tetrahedra), and these are connected to their nearestneighbours by linear springs with constant strength k. The central hypothesis of the modelis that there should be a certain number of local extra-vibrational states, which are attachedto each chain by linear springs with strength Kj at site j with mass M . The mass M andthe force constant Kj , where strength is of the order of bending or torsional force constantKθ or Kφ (see figure 8), are related to the characteristic frequency ω2
j = Kj/M of these
Figure 30. Schematic illustration of a physical model for network glasses in the centre-of-masssystem. The network structure is composed of unit cells with randomly distributed six or eightmolecular units (of 6- or 8-membered rings). The open circles represent a group of atoms trappedin extra-potentials arising from internal strain, which are randomly attached to the two main chains.After Nakayama (1998).

1232 T Nakayama
additional states, where the parameters ω2j are random quantities and assumed to be uniformly
distributed in the range between ω2min and ω2
max. We should emphasize that molecular unitsconnected by the spring constant Kj in figure 30 do not directly correspond to the true moleculararrangement in v-SiO2. It simply refers to some kinds of low-energy vibrational states. It isnot worthwhile giving a strict picture for these entities since it depends on such factors asthe particular configurations of the molecular units surrounding the local extra-vibrationalstates.
The Hamiltonian is expressed by
HR =∑i,j
(p2
i
2M+
P 2j
2M+
k
2(qi − qi−1 + ti)
2 +Kj
2(Qj − qi + ui)
2
), (44)
where the molecules have mass M , Qi , and qi are generalized coordinates representingdisplacements or changes of angle variables. The corresponding momenta are denoted by Pi
and pi , respectively. Lower letters denote quantities for the backbone network structure andcapital letters correspond to additional vibrations arising from extra-potentials. The symbolsti and ui express random displacements due to internal stress satisfying the balance of forces inequation (44). Though the phonon field is recognized as vector in nature, vibrations lose theirpure longitudinal and transverse character in glasses, so that a scalar model can be expected tocapture the essential features of the THz frequency dynamics of glasses. One sees, by fixing thedisplacement of qi of surrounding neighbours, that the reduced Hamiltonian equation (44) givesrise to the adiabatic extra-potential equation (43) under the quasi-harmonic approximation.This model provides a useful conceptional framework within which to discuss some of thedynamic properties at THz frequencies of v-SiO2. The key point of this quasi-1d model is thatlong-wavelength acoustic modes are weakly localized already; namely, the onset frequencycorresponding to the Anderson localization is at ν0 = 0, which makes it possible to have slmodes due to extra-potentials (see figure 31). Using a numerical method called the forcedoscillator method (see, e.g. Nakayama and Yakubo 2001), S(Q, ω) were calculated for thesystem size N = 14 000 in units of M = 1 and k = 1 in figure 32, where periodic boundaryconditions are taken and the orientational average is not performed. We have assumed auniform distribution of the frequency ωj = √
Kj/M between ωmin = 14 and ωmax = 1. In
addition, the force constant Kj , primarily representing a bending or torsional force constantKθ , should be smaller than k.
An important conclusion drawn from figure 32 is that there clearly appear two bands in thecalculated spectra. The lower peaks, with widths moderately increasing with wave number Q,
Figure 31. Schematic illustration of the role of the onset frequency ν0 for the localization of themodes relevant to the Boson peak. (a) The resonance frequencies stemming from extra-potentialsare embedded in discrete spectra in a 1d disordered system. Note that ν0 = 0 for a 1d disorderedsystem in the sense of the Anderson localization. (b) The 3d case where the onset frequency ν0exists in the excess DOS. A part of the modes stemming from extra-potentials are localized, whileothers are delocalized in the continuous band.

Boson peak and THz frequency dynamics of v-SiO2 1233
Figure 32. Calculated S(Q, ω) with the total site number N = 140 00. Characteristic frequenciesωi are distributed between ωmin = 1
4 and ωmax = 1. The system of units used is M = k = a = 1.After Nakayama (1999).
Figure 33. Three types of mode patterns: (a) weakly, (b) strongly, and (c) intermediately localizedmodes. The upper and lower plots in each panel show the displacements of side atoms. Thedisplacements of the main chains are given in the two central curves in each panel. (a) Theeigenmode with the eigenfrequency ω = 0.199 038. (b) The eigenmode with ω = 0.599 734.(c) The eigenmode with ω = 1.911 54. After Nakayama and Sato (1998).
are almost independent of Q (non-dispersive). The peak of the higher band depends stronglyon Q, indicating that the contributing modes are dispersive and reflect the short range order innetwork glasses.
Figure 33(b) shows the eigenmode with ωλ = 0.677 031 9 which provides evidence ofsl modes in the frequency region ωmin < ω < ωmax. It should be noted that atoms in extra-potentials and atoms belonging to main chains vibrate in antiphase optic modes. The stronglocalization in the range ωmin < ω < ωmax arises from the resonance between excitationsalong main chains and extra-vibrational states. Thus, the distributed ωi is the key elementfor the strong localization. Figure 33(c) is the eigenmode with ωλ = 1.709 546 2 belonging

1234 T Nakayama
to the higher band. The mode pattern possesses quite different characteristics from thosegiven in figures 33(a) and (b), indicating that only atoms in main chains vibrate significantly,and atoms belonging to extra-potentials do not follow the vibrations of the atoms in the mainchains. In addition, these modes are dispersive and intermediately localized. These twofeatures have been demonstrated by the high-flux and high-resolution INS experiments of Araiet al (1999a,b) (see figures 22 and 23). In particular, the feature on the intermediately localizedmodes, associated with the vibrations of the main chains, is responsible for the existence of thedispersive modes above the Boson peak (Bennasi et al 1996, Arai et al 1999a). It should benoted that this characteristic is well reproduced (Nakayama 1998a,b) in the calculated S(Q, ω)
as shown in figure 32.As shown in figure 32, though there exist dispersive modes above the Boson peak spectrum,
these are intermediately localized and constitute the part of the broad second band in RSexperiments, for example, at around 450 cm−1 for v-SiO2 (Winterling 1975). These modes arenot propagating, but rather, dispersive optic modes. This view is consistent with the evidencefrom thermal conductivity measurements κ(T ) for v-SiO2 (Zeller and Pohl 1971), which showthe temperature-independent plateau at the Boson-peak frequencies and the subsequent rise ofκ(T ) proportional to T , which cannot be explained by assuming the existence of propagatingmodes. These experimental features are in conflict with the assignment of the Boson peakspectrum as being due to propagating modes at around/above the Boson peak spectrum. Weemphasize again the non-coexistence of ex (propagating) and localized modes at the samefrequency (Mott and Twose 1961).
To summarize, the reduced Hamiltonian (Nakayama 1998a,b) for the so-called Bosonpeak ascribes this feature to a sl mode of optic mode character, with an energy and a lengthscale characterized by density fluctuation domain due to ring size distribution (see figure 30).Below this band, the vibrational states are found to be extended; above this band they are foundto be intermediately localized (ml) and dispersive, with length scales of the order of 10–100a0.These recover well the experimental features of the vibrational modes in v-SiO2.
10. Heat transport due to the hopping of sl modes
The thermal conductivity of glasses exhibits a broad, temperature-independent plateau ataround 10 K and, shows approximately linear behaviour at high temperatures (Zeller and Pohl1971, Cahill and Pohl 1987, Cahill et al 1992), as shown in figure 2. Thermal conductivitiesproportional to T 2 below 1 K have been interpreted by postulating TLS (Anderson et al 1972,Phillips 1972). The plateau is caused by the onset of acoustic phonon localization at aroundν0 ≈ 1 THz; namely, heat transport can only occur via already excited ex phonons below ν0.Such behaviour leads to a saturation in κ(T ) referred to as the plateau. In other words, thecontribution to κ(T ) from ex phonon sources will saturate as in the case of the specific heat inthe Dulong–Petit regime. The region in which κ(T ) is linearly proportional to T (Cahill andPohl 1987, 1992) above 10–30 K is much less well clarified (see figure 34). Nakayama andOrbach (1999) have explained quantitatively the rise of the thermal conductivity κhop(T ) abovethe plateau temperature region in terms of the ex phonon-assisted-hopping mechanism of thesl modes, which will be described below.
10.1. Anharmonic interaction between sl modes and propagating acoustic phonons
The extra-potential �VE should possess a large anharmonicity according to the experimentalevidence of RS under pressure (Hemley et al 1986, Yamaguchi et al 1998, Yamaguchiand Yagi 1999a). Use of these measurements enables us to calculate quantitatively

Boson peak and THz frequency dynamics of v-SiO2 1235
Figure 34. Thermal conductivities for temperatures above the plateau for v-SiO2. The straightline is drawn as a guide to the eye. After Cahill and Pohl (1987).
κhop(T ) by virtue of propagating phonons (ex) assisted by vibrational hopping of the slmodes.
The most important anharmonic interaction arises from the term ( 13 )A1jr
(�Qjr)2�rij in
equation (40), where �Qjr represents a variable associated with the sl mode and �rij that ofthe acoustic (ex) modes. The continuous version of this anharmonic interaction is given withthe definition of the third-order elastic stiffness coefficient as
VA = Ceff
∫(∇ · u)3 dr, (45)
where the atomic displacement u(r) is given by equation (21). The respective wavefunctionsin equation (21) can be expressed as ϕex
λ (r) = √1/V ei kλ· r for the ex λ-mode, and ϕsl
λ′(r) =√1/πl3
λ′e−r/ lλ′ for the sl λ′-mode with the localization length lλ′ . Substituting this intoequation (45), we have the second quantized anharmonic potential of the form
VA = Ceff
∑λ,λ′,λ′′
Aλλ′λ′′(b+λ′bλ′′bλ + h.c.). (46)
The explicit form for the coupling constant is given by
Aλλ′λ′′ =√
1
V
(h
2ρ
)3/2(ωλ
ωλ′ωλ′′
)1/2I
vslλ′ lλ′′. (47)
Here, ρ is the mass density, vs the velocity of sound and V the volume, respectively. The factorI is given by
I =∫
dr ei k · rϕλ′(r)ϕλ′′(r) ≈(
16
π
)e−Rλ′ /lλ′ +ik · Rλ′ , (48)
where ϕλ′(r) represents the exponentially damped wave function for the sl mode λ′, and Rλ′ isthe hopping distance associated with the sl mode λ′. To derive this, we have pulled out eikλ· r
from the integral by the use of eikλ· Rλ′ . This is because the wave number kλ for ex-phonons ismuch smaller than that for sl modes with kλr � r/ lλ′ .
The thermal conductivity arising from the vibrational hopping mechanism is given by(Alexander et al 1986)
κhop(T ) = kB
2V
∑λ′
R2(ωλ′)
τsl(ωλ′ , T ), (49)

1236 T Nakayama
Figure 35. Schematic illustration of the first-order process for the sl mode contribution to heatconduction. An ex mode (ωex < ω0) is denoted by a wavy line, while an sl mode (ω0 > ωex) isdenoted by a circle. Schematic illustration of the hopping transport of an sl mode due to a first-orderprocess. A ex mode is denoted by a wavy line. After Nakayama and Orbach (1999).
where R(ωλ′) is the hopping distance associated with the sl mode λ′, and τsl(ωλ′ , T ) is thehopping life-time of the sl mode λ′ caused by anharmonic interactions at temperature T , andV is the volume of the system (see figure 35). The temperature range over which equation (49)is evaluated includes the Boson peak frequency region. However, inherent localization of themodes above the Boson peak frequency does not allow them to contribute directly to κ(T ).
First-order perturbation theory gives the formula,1
τsl(ωλ′ , T )= 2π
h2
∑λλ′′
|Ceff |2|Aλ,λ′,λ′′ |2[1 + n(ωλ) + n(ωλ′′)]δ(ωλ + ωλ′′ − ωλ′), (50)
where n(ωλ) is the BE factor for the λ mode. The volume which contains at least one sl modeis given by
4π
3D(ωλ′)ω0[R(ωλ′)]3 = 1, (51)
where ω0 is the crossover frequency to localization and D(ωλ′) is the density of sl states per unitenergy. This condition ensures that, for an sl mode at the origin, a second sl mode can be foundwithin a (hopping) distance R(ωλ′).
Inserting Rλ′ from equation (51) into equation (50) and evaluating the double sum, onefinds,
1
τsl(ωλ′ , T )= 32C2
effkBT
π3v5s ρ
3lλ′ 4
(ω0
ωλ′
)2
e−aωλ′ /ω0 (52)
where vs is the speed of sound. Using the definition,∑λ′
= 3V
ξ 3M
∫ kBT/h
ω0
dωλ′
ω0, (53)
where ξ 3M is the volume for finding a single sl mode, the hopping contribution to the thermal
conductivity from equation (49) becomes, to within factors of order unity,
κhop(T ) = 433C2effkB
2T
π3v5s ρ
3ξ 3Ml2
λ
, (54)
where lλ is the average sl length scale of the mode ωλ′ . Another derivation of equation (54) isgiven in the paper by Nakayama (1999). Equation (54) has very few undetermined parameters.An analysis of scattering experiments and specific heat data indicates that the number densityof the sl mode should be about 10–20% of the total number density of acoustic modes (Sokolovet al 1993). By taking the number of sl modes to be about unity, within a volume ξ 3
M , thisnumber density leads to the length scale ξM introduced here of the same order of the lengthscale of domains of density fluctuation 15 Å for v-SiO2 (Elliott 1991).

Boson peak and THz frequency dynamics of v-SiO2 1237
Using the value of the anharmonic coupling equation (40) by Yamaguchi and Yagi (1999a)to calculate the sl contribution to κhop(T ) for a-GeS2, one has,
κhop(T ) ≈ 0.0065T W mK−1, (55)
using the known parameters for a-GeS2: vs = 2030 m s−1, ρ = 2.72 g cm−3, and ξM = 15 Å.This contribution to κ(T ) is quite comparable to that required for other network forming glassesabove the plateau value. For example, for v-SiO2, one requires an additional contributionabove the plateau, κ(T ) ≈ 0.006T (W mK−1) (Cahill and Pohl 1987, 1992), quite close tothat calculated for a-GeS2 using the anharmonic coupling appropriate to the sl modes.
Using the above values for the parameters for a-GeS2, one finds at T = 10 K,
ωexτsl(ωsl, T ) ≈ 2–3, (56)
showing that our calculation is self consistent. The linear temperature dependence of 1/τsl andequation (54) show that quantum effects will set in just in the range where they are observed.Beyond this temperature regime, one can no longer use equation (54) but must put in the finitelife time of the sl mode into the delta function in equation (50). As Simons (1964) showed,this leads to the hydrodynamic or Akhieser limit for vibrational scattering.
A possibility is that the ml modes could interact anharmonically with themselves, thereby,contributing to heat conduction above the plateau. However, such contributions would be smallbecause again CMMM ≈ CPPP � CSSP. Further, such processes would yield a much strongerpower dependence on T or a temperature dependence appropriate to Umklapp processes if thehigh frequency modes were extended (see, e.g. Landau and Lifshitz 1979).
The analysis given here leads to the following interpretation of κ(T ) for network glassesas exhibited in figure 2: (i) at low temperatures, the ex modes are scattered by the twolevel systems (TLS), and κ(T ) ∝ T 2, (ii) at higher temperatures (the plateau region) theex modes are exhausted at a crossover frequency ω0 associated with the sl modes, leading toκ(T ) = const., the Dulong–Petit limit, and (iii) at temperatures above the plateau an additionalchannel associated with sl mode hopping becomes important, accounting for the increase inκ(T ) ∝ T above the plateau temperature. In addition, (iv) the curving over of the lastcontribution as T continues to increase arises from the quantum condition, ωexτsl ≈ 1 (Simons1964).
11. Conclusions
The frequency range of around 1 THz of the Boson peak, i.e. the excess contribution to theusual Debye DOS, is almost the same as the relevant frequencies associated with the plateau inthe thermal conductivity of v-SiO2. These two features observed by different measurements,spectroscopy, and heat transport, are universal phenomena in network glasses, and appear to beinsensitive to the chemical composition of covalently bonded network glasses. The universalityof these phenomena has proved to be a great attraction for physicists and chemists who striveto provide a unified picture of the THz frequency dynamics of network glasses.
In this paper, we have critically examined various approaches by raising the followingquestions: What is the mechanism for the onset of the plateau in thermal conductivities? Is theBoson peak directly related to the plateau in thermal conductivities? Why is the Boson peaksensitive to pressure as well as the FSDP? Why does the Boson peak in d-SiO2 diminish andshift to higher frequencies? What modes are relevant to pseudo-phonon dispersion above theBoson peak? Why does the Boson peak possess a flat dispersion independent of Q? What isthe origin of the linear rise of κ(T ) with T above the plateau? Explanations for these questionsare given below.

1238 T Nakayama
There are two important length-scales in v-SiO2. One is the medium-range order betweena SiO4 tetrahedron and the other the correlation length R owing to density fluctuation domainsassociated with the ring-size distribution. The plateau in thermal conductivity κ(T ) of v-SiO2
is the consequence of a crossover from extended to localized vibrational excitations. Thelength scale R of domains plays a key role in the onset of the phonon localization as concludedfrom an analysis of the IR criterion. It is crucial for the case of v-SiO2 that the crossover fromex to localized modes occurs where the wavelength λ(ω0) of propagating acoustic phononsbecomes of the order of the length scale R of domains.
The onset of the localization of acoustic phonons is not a necessary condition for yieldingthe excess contribution to the DOS, the Boson peak, as demonstrated in the case of the phonon–fracton crossover (Yakubo and Nakayama 1987). It is not necessary that the modes relevant tothe excess contribution to the DOS are localized. However, the onset of localization is a neces-sary condition for the appearance of the plateau in the thermal conductivity. The point is thatthe onset of acoustic phonon localization due to the IR criterion is located in almost the sameenergy region of the excess DOS, the Boson peak, in the case of v-SiO2. This coincidence in en-ergy scale is the reason why the excess modes due to local extra-potentials relevant to the Bosonpeak are sl. This is a manifestation of the conjecture of Mott and Twose (1961), stating that thecoexistence of localized and ex modes at the same eigenfrequency is not allowed (see figure 32).
As shown by means of HRS experiments (Yamaguchi and Yagi 1999b, Helen et al 2000),the Boson peak for v-SiO2 mainly consists of the lowest transverse optic modes associatedwith the coupled rotational motions of tetrahedra (Buchenau et al 1984, 1986). Relevantmodes should be sl in local potentials satisfying the TRI and be hybridized with transverseacoustic phonons (Nakayama 1998, Nakayama and Sato 1998). Another important featurestemming from this physical model is that the modes above the Boson peak are dispersive andintermediately localized. The dispersive character has been observed by INS experiments(Arai et al 1999a,b).
If the localized nature of the vibrational excitations continued well above the plateauregion, the hopping of sl modes assisted by ex phonons might well be an important mechanismfor thermal transport above the region of the rise of κ(T ) proportional to T (see figure 34).This becomes quite possible because the local potential is soft and anharmonic, as verified bythe pressure dependence of the RS (Hemley et al 1986) and INS experiments on the Debye–Waller factor (Nakamura et al 2002). The rise of κ(T ) above the plateau proportional toT is quantitatively explained by the hopping mechanism assisted by ex acoustic phonons(Nakayama and Orbach 1999).
To sum up, the characteristic length scale R associated with the density fluctuation (localpressure fluctuation) due to the ring distribution plays a key role for the onset of localizationof acoustic phonons at around 1 THz in v-SiO2, and this leads to the plateau in the thermalconductivity. The local potentials stemming from randomly oriented buckled tetrahedra areresponsible for the excess DOS, the Boson peak, which consists of sl modes owing to coupledrotations of SiO4 tetrahedra with optic mode nature. The modes above the Boson peak possessoptic-mode nature as well, however, they are intermediately localized. This picture providesa consistent explanation for the thermal conductivity of v-SiO2 over the whole temperaturerange as well as the characteristic behaviours of S(Q, ω) observed by INS experiments.
Acknowledgments
The author is grateful to Professor O B Wright for a critical reading of the manuscript. Thiswork was supported in part by a Grant-in-Aid from the Japan Ministry of Education, Science,and Culture.

Boson peak and THz frequency dynamics of v-SiO2 1239
References
Abrahams E, Anderson P W, Licciardello D C and Ramakrishnan 1979 Phys. Rev. Lett. 42 690Ackerman D A and Anderson A C 1982 Phys. Rev. Lett. 49 1176Akita Y and Ohtsuki T 1998 J. Phys. Soc. Japan 67 2954Alexander S 1998 Phys. Rep. 296 65Alexander S, Entin-Wohlman O and Orbach R 1986 Phys. Rev. B 34 2726Anderson O L and Bommel H E 1955 J. Am. Ceram. Soc. 38 125Anderson P W, Halperin B I and Varma C M 1972 Phil. Mag. 25 1Angell C A 1995 Science 267 1924Aoki H, Syoho Y and Hemley R J 2000 Physics Meets Mineralogy: Condensed Matter Physics in Geosciences
(Cambridge: Cambridge University Press)Arai M, Inamura Y, Otomo T, Kitamura N, Bennington S M and Hannon A C 1999a Physica B 263–264 268Arai M, Inamura Y and Otomo T 1999b Philos. Mag. B 79 1733Arai T, Kataura H, Yasuoka H and Onari S 1985 J. Non-Cryst. Solids 77–78 1149Arndt J 1969 J. Am. Ceram. Soc. 52 285Arndt J 1983 Phys. Chem. Glasses 24 104Bee M 1988 Quasielastic Neutron Scattering (Bristol: Hilger)Bell R J, Bird NF and Dean P 1968 J. Phys. C 1 299Bell R J and Dean P 1972 Philos. Mag. 25 1381Bennasi P, Krisch M, Masciovecchio C, Mazzacurati V, Monaco G, Ruocco G, Sette F and Verbeni R 1966 Phys. Rev.
Lett. 77 3835Bennasi P et al 1997 Phys. Rev. Lett. 77 4670Berman R 1949 Phys. Rev. 76 315Berman R 1950 Proc. R. Soc. A 208 90Bernasconi A, Sleater T, Posselt D, Kjems J K and Ott H R 1992 Phys. Rev. B 45 10363Bilar and Phillips W A 1975 Philos. Mag. 32 113Binder K and Kob W 1998 Analysis of Composition and Structure of Glass, and Glass Ceramics ed H Bach and
D Kranse (Berlin: Springer)Born M and Huang H 1954 Dynamical Theory of Crystal Lattices (Oxford: Oxford University Press)Bosoworth D R, Hayes W, Spray A P L and Watkins G D 1970 Proc. R. Soc. A 317 133Bridgman P W 1948 Am. Acad. Arts. Sci. 76 55Brown K G et al 1972 Proc. Nat. Acad. Sci. USA 69 1467Buchenau U 2001 J. Phys.: Condens. Matter 13 7827Buchenau U, Nuecker N and Diamoux A J 1984 Phys. Rev. Lett. 53 2316Buchenau U, Prager M, Nuecker N, Dianoux A J, Ahmad N and Phillips W A 1986 Phys. Rev. B 34 5665Buchenau U, Zho H M, Nuecker N, Gilroy K S and Phillips W A 1988 Phys. Rev. Lett. 60 1318Buchenau U, Wischnewski A, Nonkenbusch M and Schmidt W 1999 Philos. Mag. B 79 2021Cahill D G and Pohl R O 1987 Phys. Rev. B 35 4067Cahill D G, Watson S K and Pohl R O 1992 Phys. Rev. B 46 6131Caplin D, Gruener G and Dunlop J B 1973 Phys. Rev. Lett. 30 1138Carpenter J M and Pelizzari C A 1975 Phys. Rev. B 12 2391Carpenter J M and Price D L 1985 Phys. Rev. Lett. 54 441Carruzzo H M, Grannan E R and Yu C C 1994 Phys. Rev. B 50 6685Chervinka L 1987 J. Non-Cryst. Solids 92 31Cusack S and Doster W 1990 Biophys. J. 58 1990Cyvin S J, Rauch J E and Decius J C 1965 J. Chem. Phys. 43 4083Debye P 1912 Ann. Physik 39 788Dell’Anna R, Ruocco G, Sampoli M and Villani G 1998 Phys. Rev. Lett. 80 1236Della Valle R G and Venutti E 1994 Chem. Phys. 179 411Devine R A B, Dupree R, Farnan I and Capponi J J 1987 Phys. Rev. B 35 2560Dove M T, Harris M J, Hannon A C, Parker J M, Swainson I P and Gambhir M 1997 Phys. Rev. Lett. 78 1070Einstein A 1907 Ann. Physik 22 180Elliott S R 1991 Phys. Rev. Lett. 67 711Elliott S R 1992 Europhys. Lett. 19 201Flubacher P, Leadbetter A J, Morrison J A and Stoicheff B P 1959 J. Phys. Chem. Solids 12 53Foret M, Courtens E, Vacher R and Suck J B 1996 Phys. Rev. Lett. 77 3831Foret M, Courtens E, Vacher R and Suck J B 1997 Phys. Rev. Lett. 78 4669

1240 T Nakayama
Foret M, Helen B, Taillade G, Cortens E, Vacher R, Casalta H and Dorner B 1998 Phys. Rev. Lett. 81 2100Fowler T G and Elliott S R 1987 J. Non-Cryst. Solids 92 31Freeman J J and Anderson A C 1986 Phys. Rev. B 34 5684Galeener F L 1982 J. Non-Cryst. Solids 49 53Galeener F L and Lucovsky G 1976 Phys. Rev. Lett. 29 1474Galeener F L, Leadbetter A J and Stringfellow M W 1983 Phys. Rev. B 27 1052Galeener F L and Mikkelsen J C Jr 1981 Phys. Rev. B 23 5527Galeener F L and Geissberger A E 1983 Phys. Rev. B 27 6199Galeener F L, Barrio R A, Martines E and Elliott R J 1984 Phys. Rev. Lett. 53 2429Gaskell P H and Wallis D J 1996 Phys. Rev. Lett. 76 66Genzel L et al 1976 Biopolymers 15 219Gibbons D F 1959 Phys. Chem. Solids 11 246Giddy A D, Dove M T, Pawley G S and Heine V 1993 Acta Crystallogr. Sect. A 49 697Graebner J E, Golding B and Allen L C 1986 Phys. Rev. B 34 5696Grannan E R, Randeria M and Sethna J P 1990 Phys. Rev. B 41 7784Grannan E R, Randeria M and Sethna J P 1990 Phys. Rev. B 41 7799Grimsditch M 1984 Phys. Rev. Lett. 52 2379Guillot B and Guissani Y 1997 Phys. Rev. Lett. 78 2401Guissani Y and Guillot B 1996 J. Chem. Phys. 104 7633Hannon A C, Arai M, Sinclair R N and Wright A C 1992 J. Non-Cryst. Solids 150 239Harris M J, Bennigton, Dove M T and Parker J M 1999 Physica BHe H and Thorpe M F 1985 Phys. Rev. Lett. 54 2107Helen B, Courtens E, Vacher R, Yamanaka A, Kataoka M and Inoue K 2000 Phys. Rev. Lett. 84 5355Hemley R J, Mao H K, Bell P M and Mysen B O 1986 Phys. Rev. Lett. 57 747Hemley R J, Meade C and Mao H K 1997 Phys. Rev. Lett. 79 1420Horbach J Kob W and Binder K 1998 J. Non-Cryst. Solids 235 320Horbach J, Kob W and Binder K 1999 J. Phys. Chem. B 103 4104Hunklinger S, Enss C and Strehlow S 1999 Physica B 263–264 248Horbach J, Kob W and Binder K 2001 Eur. Phys. J. B 19 531Inamura Y, Arai M, Yamamoto O, Inabe A, Kitamura N, Otomo T, Matusuo T, Bennington S M and Hannon A C
1998 Physica B 241–243 903Inamura Y, Arai M, Yamamoto O, Inabe A, Kitamura N, Otomo T, Matsuo T, Bennington S M and Hannon A C 1999
Physica B 263–264 299Inamura Y, Arai M, Otomo T, Kitamura N and Buchenau U 2000 Physica B 284–288 1157Inamura Y, Arai M, Nakamura M, Otomo T, Kitamura N, Bennington S M, Hannon A C and Buchenau U 2001
J. Non-Cryst. Solids 293–295 389Ioffe A F and Regel A R 1960 Prog. Semicond. 4 237Jackle J 1983 Z. Phys. B-Condens. Matter 52 133John S, Sompolinsky H and Stephen M J 1983 Phys. Rev. B 27 5592Kanaya K, Kaji K, Ikeda S and Inoue K 1988 Chem. Phys. Lett. 150 334Karpov V G, Klinger M I and Ignatiev F N 1983 Zh. Sov. Phys. JETP 57 439Karpov V G and Parshin D A 1985 Soviet Phys. JETP 61 1308Keating P N 1966 Phys. Rev. 153 774Keen D A and Dove M T 1999 J. Phys.: Condens. Matter 11 9263Kettermann S, Fulde P and Strehlow P 1999 Phys. Rev. Lett. 83 4325Khalatnikov I M 1952 Zh. Eksp. Teor. Fiz. 22 687Kimizuka H, Kaburaki H and Kogure Y 2000 Phys. Rev. Lett. 84 5548Kohara S and Suzuya K 2001 Phys. Chem. Glasses at pressKrishnan R S 1953 Proc. Indian Acad. Sci. A 37 377Lacks D J 1998 Phys. Rev. Lett. 80 5385Lacks D J 2000 Phys. Rev. Lett. 84 4629Landau L D and Lifshitz E M 1979 Physical Kinetics (Oxford: Pergamon) chapter 7Lassmann 1996 Physica B 219&220 730Laughlin R B and Joannopoulous J D 1977 Phys. Rev. B 16 2942Laughlin R B and Joannopoulous J D 1978 Phys. Rev. B 17 2790Leadbetter A J 1969 J. Chem. Phys. 51 779Le Bail A J 1995 J. Non-Cryst. Solids 185 39Leyser H, Doster W and Diehl M 1999 Phys. Rev. Lett. 82 2987
Boson peak and THz frequency dynamics of v-SiO2 1241
Lovesey S W 1984 Theory of Thermal Neutron Scattering (Oxford: Clarendon)Ludwig S Enss C Strehlow P and Hunklinger S 2002 Phys. Rev. Lett. 88 75501-1Marath C J and Maris H J 1996 Phys. Rev. B 54 203Malinovsky V K, Novikov V N, Parshin P P, Sokolov A P and Zemlyanov M G 1990 Europhys. Lett. 11 43Masciovecchio C et al 1997 Phys. Rev. B 55 8049Masciovecchio C et al 1999 Philos. Mag. B 79 2013Matsumoto D S, Reynolds C L and Anderson A C 1977 Phys. Rev. B 16 3303Meade C, Hemley R J and Mao H K 1992 Phys. Rev. Lett. 69 1387Mishima O, Calvert L D and Whalley E 1985 Nature 314 76Moss S C and Price D L 1985 Physics of Disordered Materials ed D Adler, H Fritzsche and S R Ovshinsky (New York:
Plenum) p 77Mott N F and Twose W P 1961 Adv. Phys. 10 107Mozzi R L and Warren B E 1969 J. Appl. Cryst. 2 164Mukherjee G D, Vaidya S N and Sugandhi V 2001 Phys. Rev. Lett. 87 195501Nakamura M, Arai M, Otomo T, Inamura Y and Bennington S M 2001 J. Non-Cryst. Solids 293–295 377Nakamura M, Arai M, Inamura Y and Otomo T 2002 Phys. Rev. B 66 024203Nakayama T 1989 Progress in Low Temperature Physics vol XII, ed D F Brewer (Amsterdam: Elsevier) p 166Nakayama T 1998a Phys. Rev. Lett. 80 1244Nakayama T 1999 J. Phys. Soc. Japan 68 3540Nakayama T and Odajima A 1972 J. Phys. Soc. Japan 33 12Nakayama T and Odajima A 1973 J. Phys. Soc. Japan 34 732Nakayama T, Yakubo K and Orbach R 1994 Rev. Mod. Phys. 66 381Nakayama T and Sato N 1998 J. Phys.: Condens. Matter 10 L41Nakayama T and Orbach R 1999 Europhys. Lett. 47 468Nakayama T and Yakubo K 2001 Phys. Rep. 349 239Neuefeind J Bunsenges K D 1996 Phys. Chem. 100 1341Novikov V N and Sokolov A P 1991 Solid State Commun. 77 243Ohsaka T and Oshikawa S 1998 Phys. Rev. B 57 4995Ohsaka T, Shoji T and Tanaka K 2000 J. Phys. Soc. Japan 69 3711Parshin D A 1994 Phys. Solid State 36 991Pasquarello A 2000 Phys. Rev. B 61 3951Pasquarello A and Car R 1998 Phys. Rev. Lett. 80 5145Pasquarello A, Sarnthein J and Car R 1998 Phys. Rev. B 57 14133Peierls R 1929 Ann. Phys. (Leipzig) 3 1055Phillips J C 1981 J. Non-Cryst. Solids 43 37Phillips W A 1972 J. Low Temp. Phys. 7 1657Phillips W A 1987 Rep. Prog. Phys. 50 1657Pilla O, Gunsolo A, Fontana A, Masciovecchio C, Montagna M, Puocco G, Scopigno T and Sette F 2000 Phys. Rev.
Lett. 85 2136Pluth J J, Smith J V and Faber J Jr 1985 J. Appl. Phys. 57 1045Pohl R O 1981 Amorphous Solids: Low Temperature Properties ed W A Phillips (Berlin: Springer) p 27Polian A and Grimsditch M 1990 Phys. Rev. B 41 6086Price D L and Carpenter J M 1987 J. Non-Cryst. Solids 92 153Rat E Foret, M Courtens, E Vacher R and Arai M 1999 Phys. Rev. Lett. 83 1355Rogge S, Natelson D and Osheroff D D 1996 Phys. Rev. Lett. 76 3136Rogge S, Natelson D, Tiger B and Osheroff D D 1997a Phys. Rev. B 55 11256Rogge S, Natelson D and Osheroff D D 1997b J. Low Temp. Phys. 106 717Rothenfusser M, Dietsche W and Kinder H 1984 Phonon Scattering in Condensed Matter ed W Eisenmenger et al
(Berlin: Springer) p 419Ruocco G and Sette F 2001 J. Phys.: Condens. Matter 13 9141Salce B and Boatner L A 1986 Phonon Scattering in Condensed Matter V (Berlin: Springer) p 272Sarnthein J, Pasquarello A and Car R 1995a Phys. Rev. Lett. 74 4682Sarnthein J, Pasquarello A and Car R 1995b Phys. Rev. B 52 12690Sarnthein J, Pasquarello A and Car R 1997 Science 275 1925Schirmacher W 1998 Phys. Rev. Lett. 81 136Schulze H 1990 Glass: Nature, Structure and Properties (Heidelberg: Springer)Scopigno T, D’astuto M, Krish M, Ruocco G and Sette F 2001 Phys. Rev. B 64 012301-1Sen P and Thorpe 1977 Phys. Rev. B 15 4030

1242 T Nakayama
Simons S 1964 Proc. Phys. Soc. 83 749Sinclair R N, Erwin-Desa J A, Etherington G, Johnson P A V and Wright A C 1980 J. Non-Cryst. Solids 42 107Sokolov A P, Kislink A, Soltwisch M and Quitmann D 1992 Phys. Rev. Lett. 69 1540Sokolov A P, Kislink A, Quitmann and Duval E 1993 Phys. Rev. B 48 7692Sokolov A P, Calemczuk R, Salce B, Kisliuk A, Quitmann D and Duval E 1997 Phys. Rev. Lett. 78 2405Squires G L 1984 Introduction to the Theory of Neutron Scattering (London: Cambridge University Press)Stone C E et al 2001 J. Non-Cryst. Solids 293–295 769Strehlow P, Enss C and Hunklinger S 1998 Phys. Rev. Lett. 80 5361Sugai S and Onodera A 1996 Phys. Rev. Lett. 77 4210Susman S et al 1991 Phys. Rev. B 43 1194Suzuya K, Kohara S, Yoneda Y and Umesaki N 2000 Phys. Chem. Glasses 41 282Suzuya K, Shibata K, Umesaki N, Kitamura N and Kohara S 2001 J. Phys. Soc. Jpn. Suppl. A 70 256Swainson I P and Dove M T 1993 Phys. Rev. Lett. 71 193Swainson I P and Dove M T 1995 J. Phys.: Condens. Matter 7 1771Taraskin S N and Elliott S R 1997a Phys. Rev. B 56 8605Taraskin S N and Elliott S R 1997b Europhys. Lett. 39 37Taraskin S N and Elliott S R 1998 Philos. Mag B 77 403Taraskin S N and Elliott S R 2000 Phys. Rev. B 61 12031Thorpe M F 1983 J. Non-Cryst. Solids 57 355Trachenko K, Dove M T, Hammonds K O, Harris M J and Heine V 1998 Phys. Rev. Lett. 81 3431Trachenko K, Dove M T, Harris M J and Heine V 2000 J. Phys.: Condens. Matter 12 8041Treloar L R 1975 The Physics of Rubber Elasticity (Oxford: Clarendon)Tsuneyuki S, Tsukada M, Aoki H and Matsui Y 1988 Phys. Rev. Lett. 61 869Tucker M G, Squires M P, Dove M T and Keen D A 2001 J. Phys.: Condens. Matter 13 403Uchino T, Tokuda Y and Yoko T 1998 Phys. Rev. B 58 5322Uchino T, Kitagawa Y and Yoko T 2000 Phys. Rev. B 61 234Vacher R, Pelous J, Plicque F and Zarembowitch A 1981 J. Non-Cryst. Solids 45 397Vacher R, Pelous J and Courtens E 1997 Phys. Rev. B 56 R481Vacher R, Foret M, Courtens E, Pelous J and Suck J-B 1998 Philos. Mag. B 77 523Vacher R, Courtens E and Foret M 1999 Philos. Mag. B 79 1763van Beest B W H, Kramer G J and Santen R A 1990 Phys. Rev. Lett. 64 1955von Lohneysen H, Ruesing H and Sander W 1985 Z. Phys B 60 323Vollmayr K, Kob W and Binder K 1996 Phys. Rev. B 54 15808Vukcevich M R 1972 J. Non-Cryst. Solids 11 25Winterling G 1975 Phys. Rev. B 12 2432Wischnewski A, Buchenau U, Dianoux A J, Kamitakahara W A and Zarestky J L 1998 Philos. Mag. B 77 579Wohlfahrt M, Strehlow P, Enss C and Hunklinger S 2001 Europhys. Lett. 56 690Wright A C, Sinclair R N and Leadbetter A J 1985 J. Non-Cryst. Solids 71 295Wright A C et al 1991 J. Non-Cryst. Solids 129 213Wright O B and Phillips W A 1984 Philos. Mag. 50 63Wurger A 2002 Phys. Rev. Lett. 88 75502-1Yakubo K and Nakayama T 1987 Phys. Rev. B 30 8933Yamada-Kaneda H, Kaneda C and Ogawa T 1993 Phys. Rev. B 47 9338Yamaguchi M, Nakayama T and Yagi T 1998 Physica B 263–264 258Yamaguchi M and Yagi T 1999a Europhys. Lett. 47 462Yamaguchi M and Yagi T 1999b Conf. Proc. Phys. Soc. Japan p 894Yu C C and Leggett A J 1988 Comments Condens. Matter Phys. 14 231Zeller R C and Pohl R O 1971 Phys. Rev. B 4 2029Zaitlin M P and Anderson A C 1975 Phys. Rev. B 12 4475Zhu T C, Maris H J and Tauc J 1991 Phys. Rev. B 44 4281Zhu D-M 1994 Phys. Rev. B 50 6053