Booz Allen Hamilton - · PDF fileSource: Booz Allen Hamilton SEC filings, CBO and OMB...
15
Booz Allen Hamilton First Quarter Fiscal 2015
Transcript of Booz Allen Hamilton - · PDF fileSource: Booz Allen Hamilton SEC filings, CBO and OMB...

Booz Allen Hamilton First Quarter Fiscal 2015

Disclaimers
1
Forward Looking Safe Harbor Statement
The following information includes “forward-looking statements” within the meaning of the Private Securities Litigation Reform Act of 1995. Examples of forward-looking statements include information concerning Booz Allen’s preliminary financial results, financial outlook and guidance, including projected Revenue, Diluted EPS, and Adjusted Diluted EPS, as well as any other statement that does not directly relate to any historical or current fact. In some cases, you can identify forward-looking statements by terminology such as “may,” “will,” “could,” “should,” “forecasts,” “expects,” “intends,” “plans,” “anticipates,” “projects,” “outlook,” “believes,” “estimates,” “predicts,” “potential,” “continue,” “preliminary,” or the negative of these terms or other comparable terminology. Although we believe that the expectations reflected in the forward-looking statements are reasonable, we can give you no assurance these expectations will prove to have been correct. These forward-looking statements relate to future events or our future financial performance and involve known and unknown risks, uncertainties and other factors that may cause our actual results, levels of activity, performance or achievements to differ materially from any future results, levels of activity, performance or achievements expressed or implied by these forward-looking statements. These risks and other factors include: cost cutting and efficiency initiatives, budget reductions, Congressionally mandated automatic spending cuts, and other efforts to reduce U.S. government spending, including automatic sequestration required by the Budget Control Act of 2011 (as amended by the American Taxpayer Relief Act of 2012 and the Consolidated Appropriations Act, 2014), which have reduced and delayed contract awards and funding for orders for services especially in the current political environment or otherwise negatively affect our ability to generate revenue under contract awards, including as a result of reduced staffing and hours of operation at U.S. government clients; delayed funding of our contracts due to uncertainty relating to and a possible failure of Congressional efforts to craft a long-term agreement on the U.S. government’s ability to incur indebtedness in excess of its current limits, or changes in the pattern or timing of government funding and spending (including those resulting from or related to cuts associated with sequestration or other budgetary cuts made in lieu of sequestration); current and continued uncertainty around the timing, extent, nature, and effect of Congressional and other U.S. government action to address budgetary constraints, including, but not limited to, uncertainty around the outcome of Congressional efforts to craft a long-term agreement on the U.S. government’s ability to incur indebtedness in excess of its current limits, and the U.S. deficit; any issue that compromises our relationships with the U.S. government or damages our professional reputation, including negative publicity concerning government contractors in general or us in particular; changes in U.S. government spending, including a continuation of efforts by the U.S. government to decrease spending for management support service contracts, and mission priorities that shift expenditures away from agencies or programs that we support; the size of our addressable markets and the amount of U.S. government spending
on private contractors; failure to comply with numerous laws and regulations; our ability to compete effectively in the competitive bidding process and delays or losses of contract awards caused by competitors' protests of major contract awards received by us; the loss of General Services Administration Multiple Award schedule contracts, or GSA schedules, or our position as prime contractor on government-wide acquisition contract vehicles; changes in the mix of our contracts and our ability to accurately estimate or otherwise recover expenses, time, and resources for our contracts; our ability to generate revenue under certain of our contracts; our ability to realize the full value of and replenish our backlog and the timing of our receipt of revenue under contracts included in backlog; changes in estimates used in recognizing revenue; an inability to attract, train, or retain employees with the requisite skills, experience, and security clearances; an inability to hire, assimilate, and deploy enough employees to serve our clients under existing contracts; an inability to timely and effectively utilize our employees; failure by us or our employees to obtain and maintain necessary security clearances; the loss of members of senior management or failure to develop new leaders; misconduct or other
improper activities from our employees or subcontractors, including the improper use or release of our clients' sensitive or classified information; increased insourcing by various U.S. government agencies due to changes in the definition of “inherently governmental” work, including proposals to limit contractor access to sensitive or c lassified information and work assignments; increased competition from other companies in our industry; failure to maintain strong relationships with other contractors; inherent uncertainties and potential adverse developments in legal or regulatory proceedings, including litigation, audits, reviews, and investigations, which may result in materially adverse judgments, settlements, withheld payments, penalties, or other unfavorable outcomes including debarment, as well as disputes over the availability of insurance or indemnification; continued efforts to change how the U.S. government reimburses compensation related and other expenses or otherwise limit such reimbursements, including recent rules that expand the scope of existing reimbursement limitations, such as a reduction in allowable annual employee compensation to certain contractors as a result of the Bipartisan Budget Act of 2013, and an increased risk of compensation being
deemed unallowable or payments being withheld as a result of U.S. government audit, review or investigation; internal system or service failures and security breaches, including, but not limited to, those resulting from external cyber attacks on our network and internal systems; risks related to changes to our operating structure, capabilities, or strategy intended to address client needs, grow our business or respond to market developments; risks associated with new relationships, clients, capabilities, and service offerings in our U.S. and international businesses; failure to comply with special U.S. government laws and regulations relating to our international operations; risks related to our indebtedness and credit facilities which contain financial and operating covenants; the adoption by the U.S. government of new laws, rules, and regulations, such as those relating to organizational conflicts of interest issues or limits; risks related to completed and future acquisitions, including our ability to realize the expected benefits from such acquisitions; an inability to utilize existing or future tax benefits, including those related to our stock-based compensation expense, for any reason, including a change in law; variable purchasing patterns under U.S. government GSA schedules, blanket purchase agreements and indefinite delivery, indefinite quantity contracts. Additional information concerning these and other factors can be found in our filings with the Securities and Exchange Commission (SEC), including our Annual Report on Form 10-K, filed with the SEC on May 22, 2014. All forward-looking statements attributable to Booz Allen or persons acting on Booz Allen’s behalf are expressly qualified in their entirety by the foregoing cautionary statements. All such statements speak only as of the date made and, except as required by law, Booz Allen undertakes no obligation to update or revise publicly any forward-looking statements, whether as a result of new information, future events or otherwise.
Note Regarding Non-GAAP Financial Data Information
Booz Allen discloses in the following information Adjusted Operating Income, Adjusted EBITDA, Adjusted Net Income, Adjusted Diluted EPS, and Free Cash Flow which are not recognized measurements under GAAP, and when analyzing Booz Allen’s performance or liquidity as applicable, investors should (i) evaluate each adjustment in our reconciliation of Operating and Net Income to Adjusted Operating Income, Adjusted EBITDA and Adjusted Net Income, and cash flow to free cash flow, and the explanatory footnotes regarding those adjustments, and (ii) use Adjusted EBITDA, Adjusted Net Income, Adjusted Operating Income, and Adjusted Diluted EPS in addition to, and not as an alternative to operating income, net income or Diluted EPS as a measure of operating results with cash flow in addition to and not as an alternative to net cash generated from operating activities as a measure of liquidity, each as defined under GAAP. The Financial Appendix includes a reconciliation of Adjusted Operating Income, Adjusted EBITDA, Adjusted Net Income, Adjusted Diluted EPS, and Free Cash Flow to the most directly comparable financial measure calculated and presented in accordance with GAAP. Booz Allen presents these supplemental performance measures because it believes that these measures provide investors and securities analysts with important supplemental information with which to evaluate Booz Allen’s performance, long term earnings potential, or liquidity, as applicable and to enable them to assess Booz Allen’s performance on the same basis as management. These supplemental performance and liquidity measurements may vary from and may not be comparable to similarly titled measures by other companies in Booz Allen’s industry. No reconciliation of the forecasted range for Adjusted Diluted EPS to Diluted EPS for any period during fiscal 2015 is included because we are unable to quantify certain amounts that would be required to be included in the GAAP measure without unreasonable efforts and we believe such reconciliations would imply a degree of precision that would be confusing or misleading to investors.
A Leader with a Long & Proud History
2 2
Company Overview
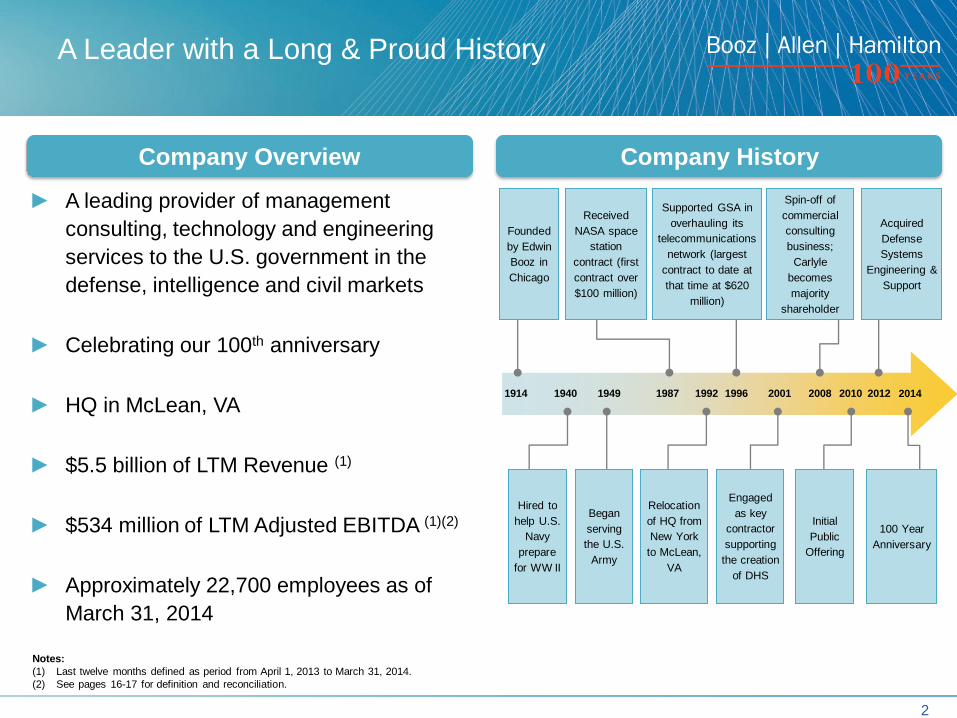
1914 1940 1949 1987 1992 1996 2001 2008
Received
NASA space
station
contract (first
contract over
$100 million)
Spin-off of
commercial
consulting
business;
Carlyle
becomes
majority
shareholder
Supported GSA in
overhauling its
telecommunications
network (largest
contract to date at
that time at $620
million)
2010 2012
Notes:
(1) Last twelve months defined as period from April 1, 2013 to March 31, 2014.
(2) See pages 16-17 for definition and reconciliation.
► A leading provider of management
consulting, technology and engineering
services to the U.S. government in the
defense, intelligence and civil markets
► Celebrating our 100th anniversary
► HQ in McLean, VA
► $5.5 billion of LTM Revenue (1)
► $534 million of LTM Adjusted EBITDA (1)(2)
► Approximately 22,700 employees as of
March 31, 2014
Founded
by Edwin
Booz in
Chicago
2014
Began
serving
the U.S.
Army
Relocation
of HQ from
New York
to McLean,
VA
Engaged
as key
contractor
supporting
the creation
of DHS
Initial
Public
Offering
Hired to
help U.S.
Navy
prepare
for WW II
100 Year
Anniversary
Acquired
Defense
Systems
Engineering &
Support
Company History
Differentiated Model
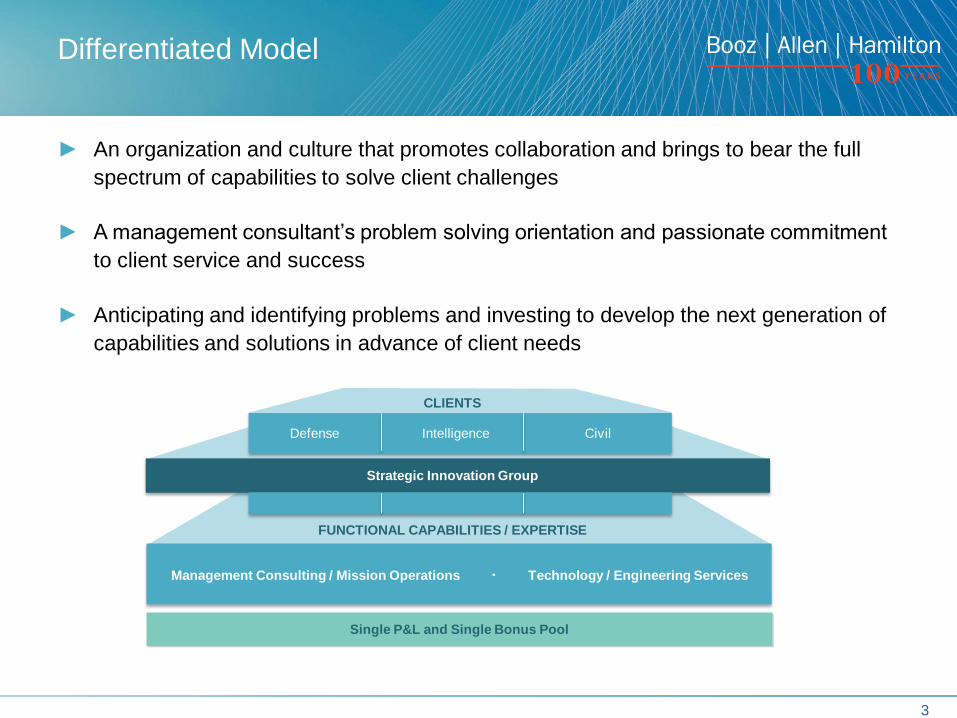
► An organization and culture that promotes collaboration and brings to bear the full
spectrum of capabilities to solve client challenges
► A management consultant’s problem solving orientation and passionate commitment
to client service and success
► Anticipating and identifying problems and investing to develop the next generation of
capabilities and solutions in advance of client needs
3 3
Defense Intelligence Civil
CLIENTS
FUNCTIONAL CAPABILITIES / EXPERTISE
Strategic Innovation Group
Management Consulting / Mission Operations Technology / Engineering Services
Single P&L and Single Bonus Pool
The Clients We Serve
4 4
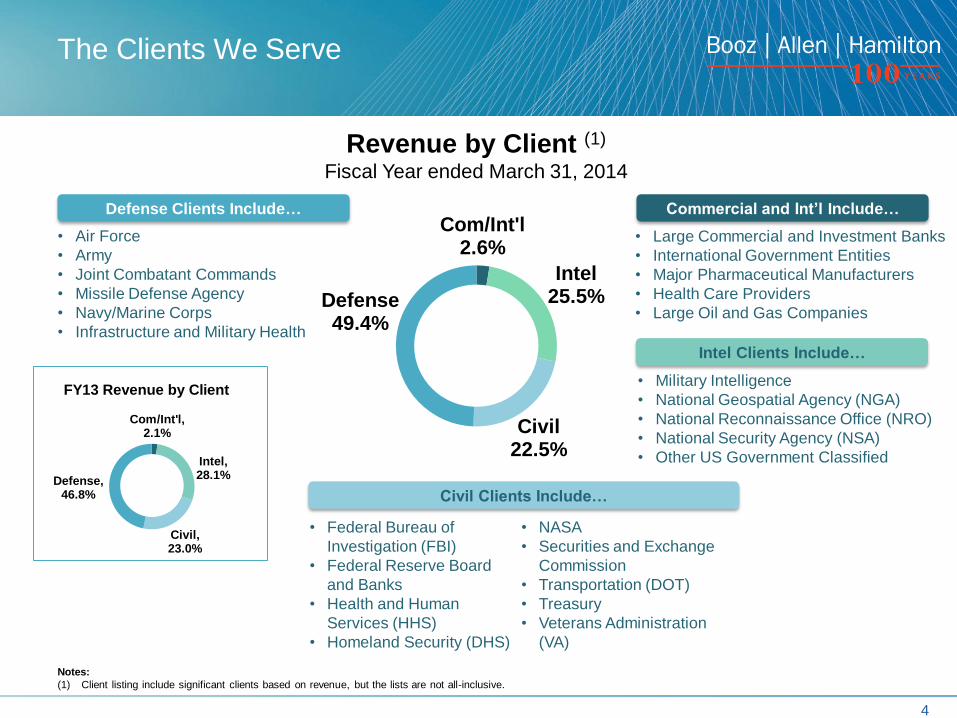
Com/Int'l 2.6%
Intel 25.5%
Civil 22.5%
Defense 49.4%
Revenue by Client (1)
Fiscal Year ended March 31, 2014
Notes:
(1) Client listing include significant clients based on revenue, but the lists are not all-inclusive.
• Large Commercial and Investment Banks
• International Government Entities
• Major Pharmaceutical Manufacturers
• Health Care Providers
• Large Oil and Gas Companies
Commercial and Int’l Include…
• Air Force
• Army
• Joint Combatant Commands
• Missile Defense Agency
• Navy/Marine Corps
• Infrastructure and Military Health
Defense Clients Include…
• Federal Bureau of
Investigation (FBI)
• Federal Reserve Board
and Banks
• Health and Human
Services (HHS)
• Homeland Security (DHS)
• NASA
• Securities and Exchange
Commission
• Transportation (DOT)
• Treasury
• Veterans Administration
(VA)
Civil Clients Include…
• Military Intelligence
• National Geospatial Agency (NGA)
• National Reconnaissance Office (NRO)
• National Security Agency (NSA)
• Other US Government Classified
Intel Clients Include…
Com/Int'l, 2.1%
Intel, 28.1%
Civil, 23.0%
Defense, 46.8%
FY13 Revenue by Client

Our People Drive Our Success
5 5
An Exceptional Talent Base
of 22,700 (1)
Notes:
(1) As of March 31, 2014.
Booz Allen’s standing as an
employer of choice has been
recognized by a number of
organizations and publications
► 84 partners with an average tenure of 17
years (1)
► Equity incentives broadly distributed to
ensure long-term success and alignment
with shareholders
► Includes: Top Secret/Sensitive
Compartmented Information, Top Secret
(excluding TS/SCI) and Secret.
75% of Staff Hold Clearances
Deep Bench of Aligned Partners
Broad and Deep Client Relationships with
Diversified Contract Base
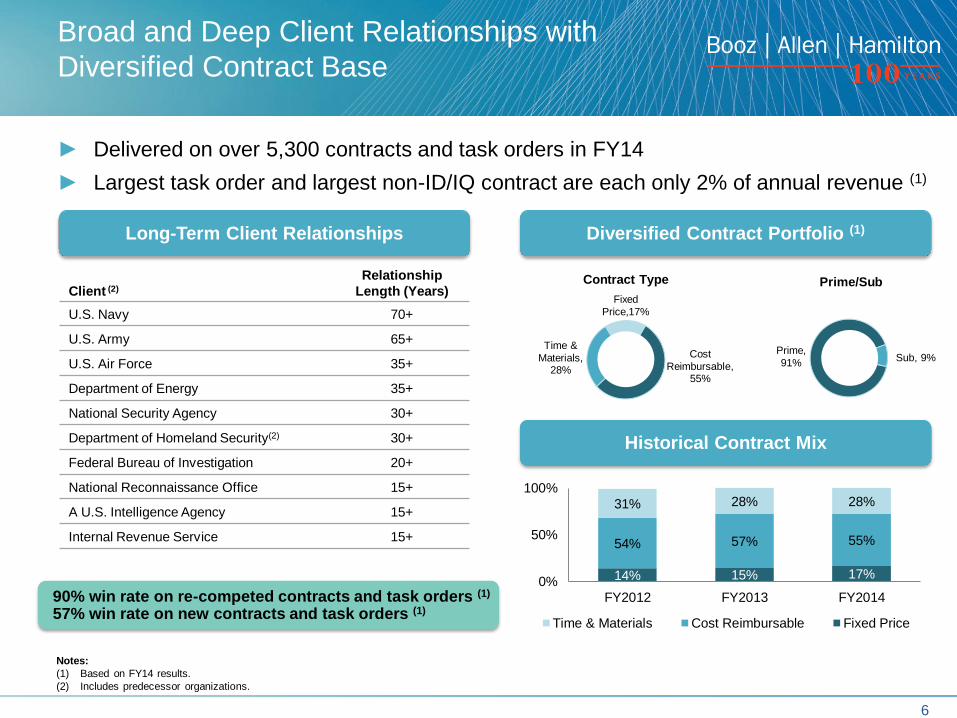
► Delivered on over 5,300 contracts and task orders in FY14
► Largest task order and largest non-ID/IQ contract are each only 2% of annual revenue (1)
6 6
Notes:
(1) Based on FY14 results.
(2) Includes predecessor organizations.
Client (2)
Relationship
Length (Years)
U.S. Navy 70+
U.S. Army 65+
U.S. Air Force 35+
Department of Energy 35+
National Security Agency 30+
Department of Homeland Security(2) 30+
Federal Bureau of Investigation 20+
National Reconnaissance Office 15+
A U.S. Intelligence Agency 15+
Internal Revenue Service 15+
90% win rate on re-competed contracts and task orders (1)
57% win rate on new contracts and task orders (1)
14% 15% 17%
54% 57% 55%
31% 28% 28%
FY2012 FY2013 FY2014
0%
50%
100%
Time & Materials Cost Reimbursable Fixed Price
Diversified Contract Portfolio (1)
Historical Contract Mix
Long-Term Client Relationships
Cost
Reimbursable, 55%
Time &
Materials, 28%
Fixed
Price,17%
Contract Type
Prime,
91% Sub, 9%
Prime/Sub
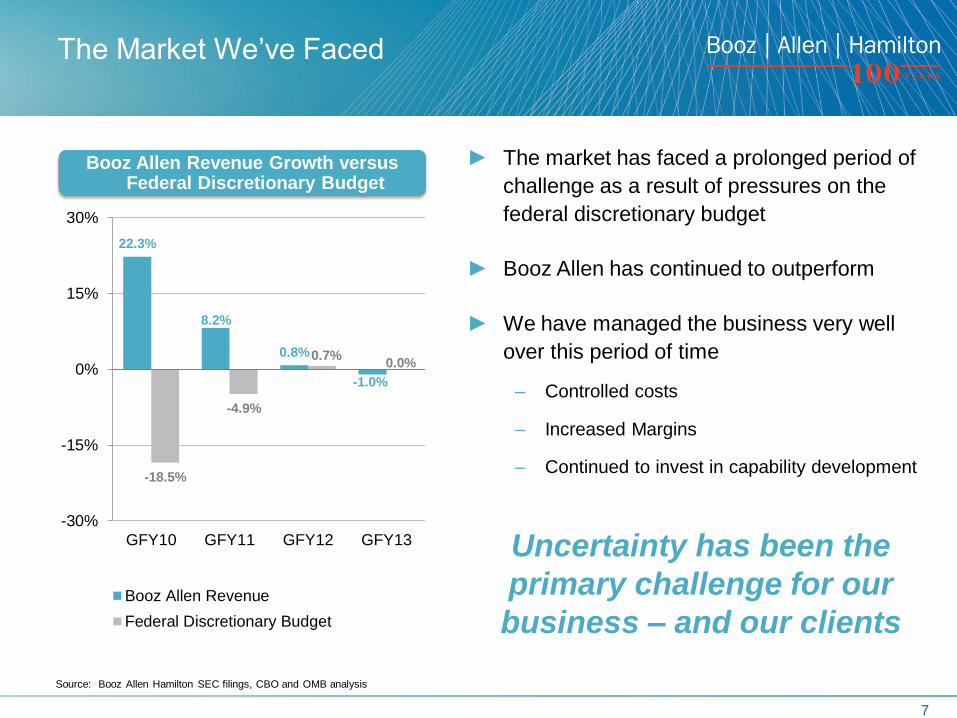
The Market We’ve Faced
► The market has faced a prolonged period of
challenge as a result of pressures on the
federal discretionary budget
► Booz Allen has continued to outperform
► We have managed the business very well
over this period of time
– Controlled costs
– Increased Margins
– Continued to invest in capability development
7 7
Uncertainty has been the
primary challenge for our
business – and our clients
Source: Booz Allen Hamilton SEC filings, CBO and OMB analysis
Booz Allen Revenue Growth versus Federal Discretionary Budget
22.3%
8.2%
0.8%
-1.0%
-18.5%
-4.9%
0.7% 0.0%
-30%
-15%
0%
15%
30%
GFY10 GFY11 GFY12 GFY13
Booz Allen Revenue
Federal Discretionary Budget
Fiscal 2015 First Quarter Business Highlights
► Revenue, earnings, and margin on track with full-year guidance
► Procurement climate improving
– Continued high levels of proposal activity
– Growth in funded backlog
– Seasonally strong book-to-bill
► Attentive management of current business
► Investments in the future
► Leadership successors well-prepared and long-tenured
8 8
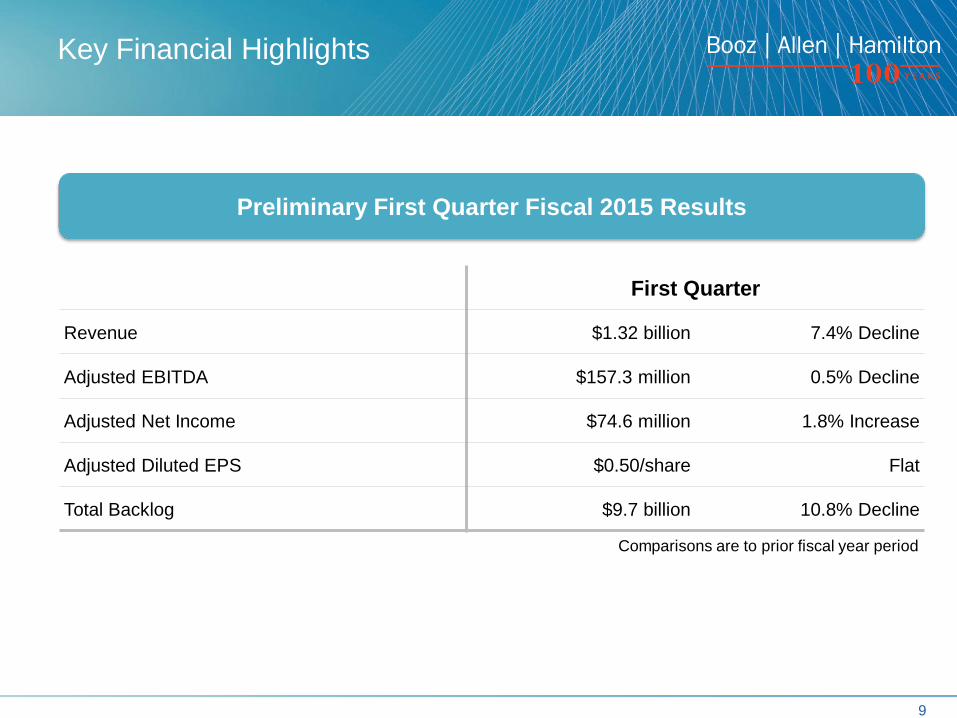
Key Financial Highlights
9
Preliminary First Quarter Fiscal 2015 Results
Comparisons are to prior fiscal year period
First Quarter
Revenue $1.32 billion 7.4% Decline
Adjusted EBITDA $157.3 million 0.5% Decline
Adjusted Net Income $74.6 million 1.8% Increase
Adjusted Diluted EPS $0.50/share Flat
Total Backlog $9.7 billion 10.8% Decline
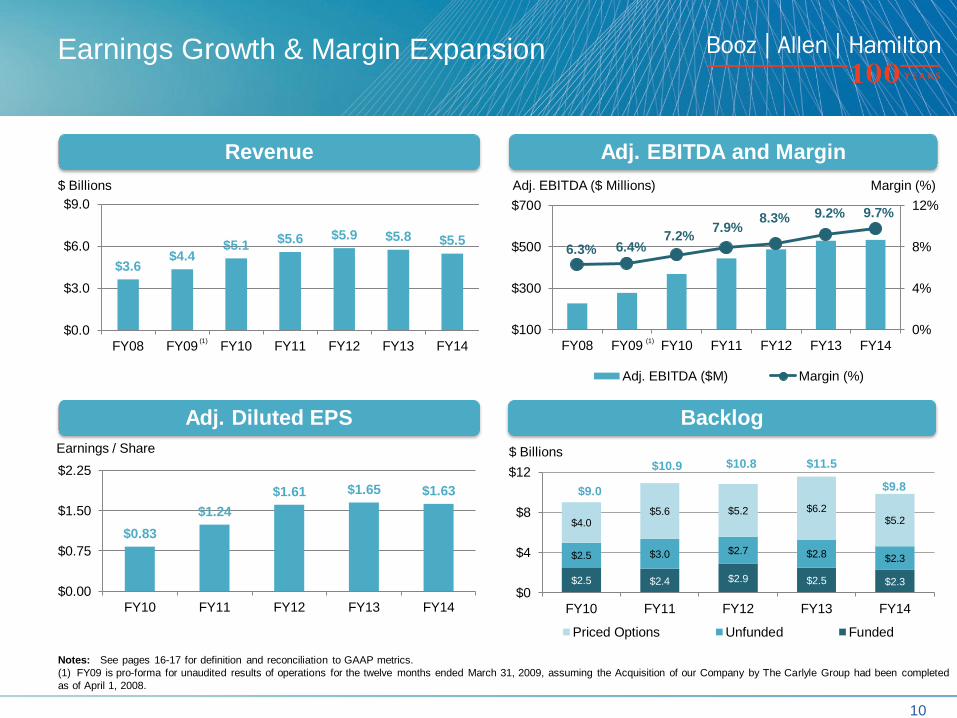
$2.5 $2.4 $2.9 $2.5 $2.3
$2.5 $3.0 $2.7 $2.8 $2.3
$4.0 $5.6 $5.2 $6.2
$5.2
FY10 FY11 FY12 FY13 FY14
$0
$4
$8
$12
Priced Options Unfunded Funded
$10.8 $11.5
$9.8 $9.0
$10.9
Earnings Growth & Margin Expansion
10
6.3% 6.4% 7.2%
7.9% 8.3% 9.2% 9.7%
0%
4%
8%
12%
$100
$300
$500
$700
FY08 FY09 FY10 FY11 FY12 FY13 FY14
Adj. EBITDA ($M) Margin (%)
$0.83
$1.24
$1.61 $1.65 $1.63
$0.00
$0.75
$1.50
$2.25
FY10 FY11 FY12 FY13 FY14
$3.6 $4.4
$5.1 $5.6 $5.9 $5.8 $5.5
$0.0
$3.0
$6.0
$9.0
FY08 FY09 FY10 FY11 FY12 FY13 FY14
Earnings / Share
Adj. EBITDA ($ Millions)
$ Billions
$ Billions
Adj. EBITDA and Margin
Adj. Diluted EPS
Revenue
Margin (%)
Notes: See pages 16-17 for definition and reconciliation to GAAP metrics.
(1) FY09 is pro-forma for unaudited results of operations for the twelve months ended March 31, 2009, assuming the Acquisition of our Company by The Carlyle Group had been completed
as of April 1, 2008.
(1) (1)
Backlog
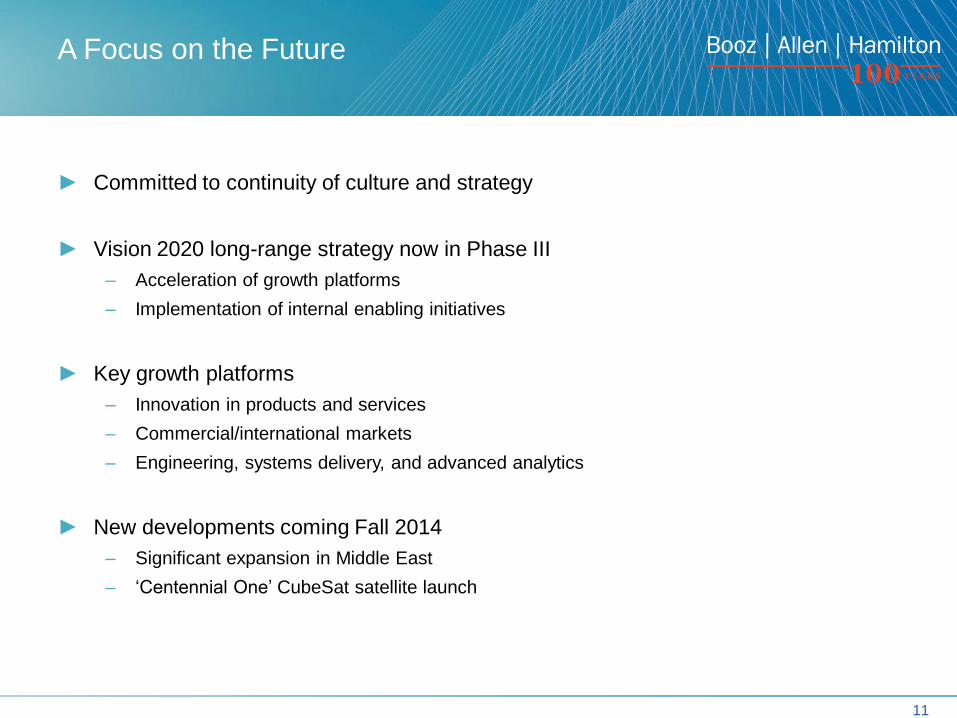
A Focus on the Future
► Committed to continuity of culture and strategy
► Vision 2020 long-range strategy now in Phase III
– Acceleration of growth platforms
– Implementation of internal enabling initiatives
► Key growth platforms
– Innovation in products and services
– Commercial/international markets
– Engineering, systems delivery, and advanced analytics
► New developments coming Fall 2014
– Significant expansion in Middle East
– ‘Centennial One’ CubeSat satellite launch
11 11
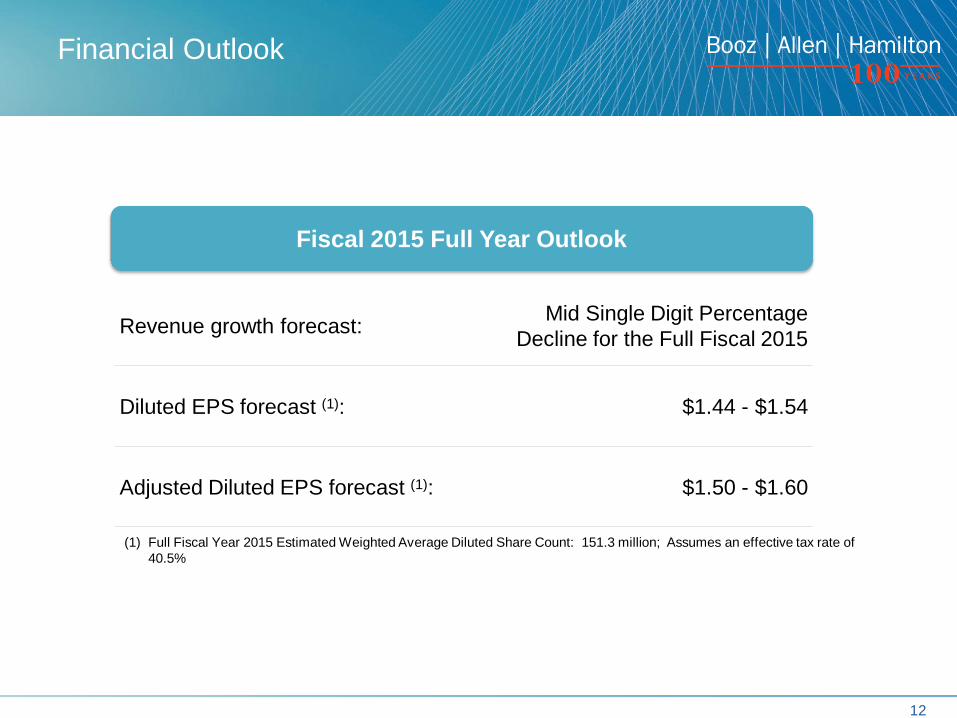
Financial Outlook
12
Revenue growth forecast: Mid Single Digit Percentage
Decline for the Full Fiscal 2015
Diluted EPS forecast (1): $1.44 - $1.54
Adjusted Diluted EPS forecast (1): $1.50 - $1.60
(1) Full Fiscal Year 2015 Estimated Weighted Average Diluted Share Count: 151.3 million; Assumes an effective tax rate of
40.5%
Fiscal 2015 Full Year Outlook

Booz Allen’s Future is Very Bright!
► We are Cautiously Optimistic about the market ahead
► We are Excited about the opportunities we are creating for the future
13 13

Thank You
14