
Bonus Dates If you get your homework in before the actual due date I will give five bonus points for...
106
Bonus Dates • If you get your homework in before the actual due date I will give five bonus points for the homework assignment for each chapter. • Chapters 1 Bonus remains for Tuesday 9/13, Chapter 2 Bonus Friday 9/16. • Otherwise all homework is due the day of the Unit Test set tentatively for the week of September 19-23.
-
Upload
maryann-stevens -
Category
Documents
-
view
214 -
download
0
Transcript of Bonus Dates If you get your homework in before the actual due date I will give five bonus points for...

Bonus Dates• If you get your homework in before the
actual due date I will give five bonus points for the homework assignment for each chapter.
• Chapters 1 Bonus remains for Tuesday 9/13, Chapter 2 Bonus Friday 9/16.
• Otherwise all homework is due the day of the Unit Test set tentatively for the week of September 19-23.

I. What is Economics – The Language
• A. Definition – Social Science concerned with the efficient use of scarce resources to achieve maximum satisfaction of human material wants.
• HUH?!???????

I. What is Economics cont…?
• B. Unlimited Wants satisfied by Limited Resources and using those resources as efficiently as possible.
• Case example USA vs. USSR
• See this stuff is easy!!!

In the beginning…
I. What is Economics cont…?
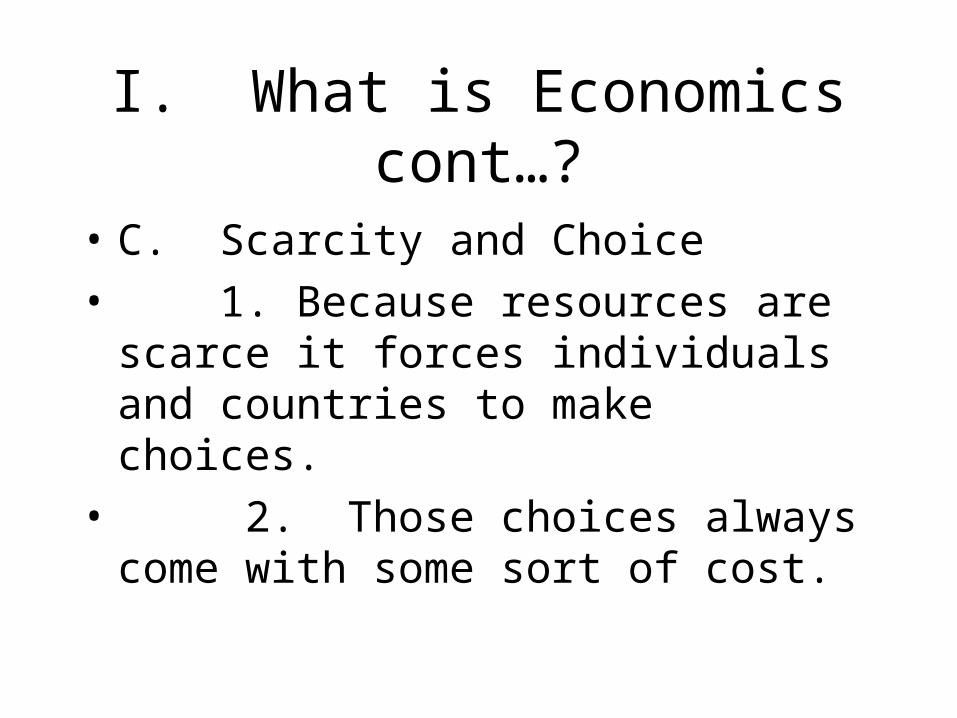
• C. Scarcity and Choice
• 1. Because resources are scarce it forces individuals and countries to make choices.
• 2. Those choices always come with some sort of cost.

What is Economics?
Economics: the study of Unlimited Wants Satisfied by Limited Resources.
Unlimited v. Limited: Forces people, nations, & the world to deal with the
problem of Scarcity.
Scarcity forces Choice!
3. Economics is the study of Choice!!!

No, you can't always get what you wantYou can't always get what you wantYou can't always get what you want

You can't always get what you wantYou can't always get what you wantYou can't always get what you wantBut if you try sometimes you might findYou get what you need


Economics, the study of choice!
I. What is Economics cont…?
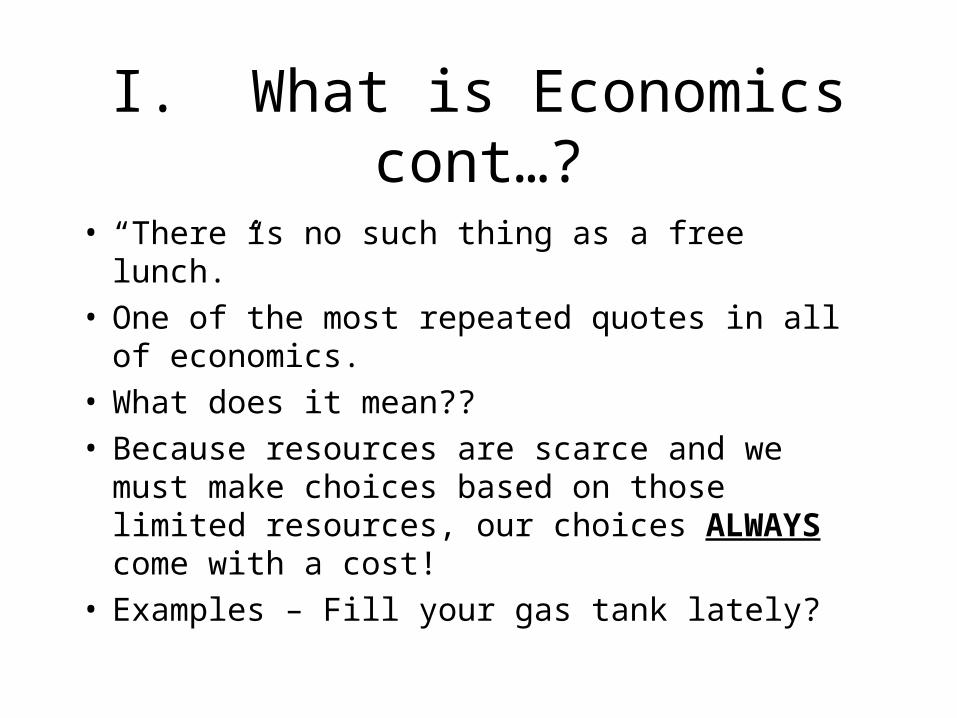
• “There is no such thing as a free lunch.”• One of the most repeated quotes in all of
economics.• What does it mean??• Because resources are scarce and we must make
choices based on those limited resources, our choices ALWAYS come with a cost!
• Examples – Fill your gas tank lately?

Wants????
• Food, Clothing, and Shelter
• Cars, Concerts, and CD’s
• Primary v Secondary Wants
• Different people?• Different nations?• Different wants?
I. What is Economics cont…?
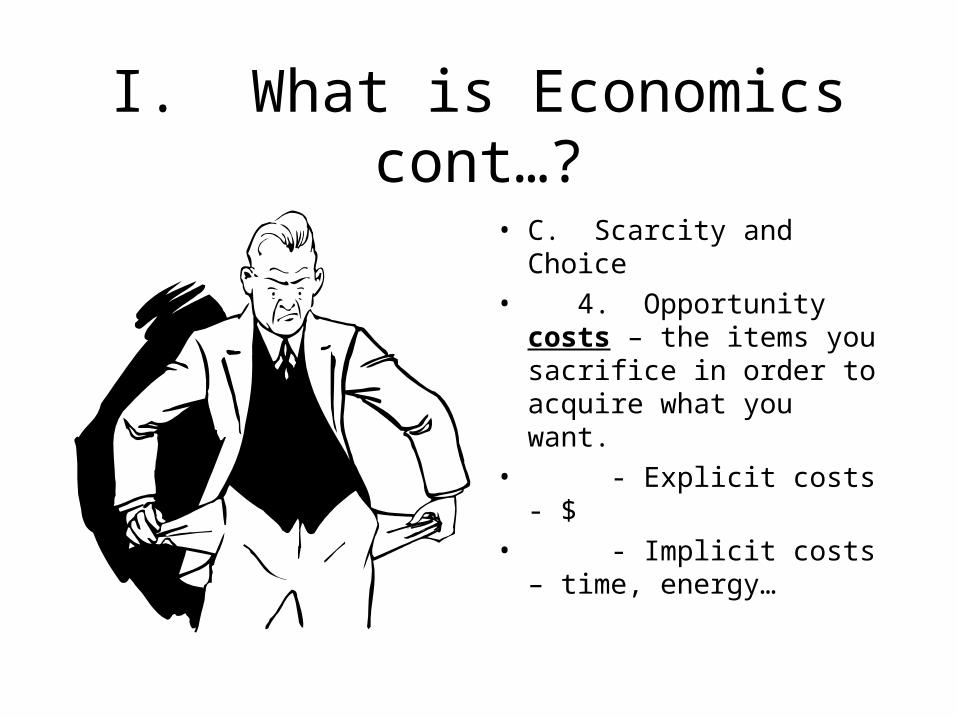
• C. Scarcity and Choice
• 4. Opportunity costs – the items you sacrifice in order to acquire what you want.
• - Explicit costs - $
• - Implicit costs – time, energy…


Economics, the study of choice!

Making a Choice Carries a Cost!
• Opportunity Cost• When one road is taken
an opportunity on another road is missed!
• In taking AP Econ, what did you not take?
• Going out for a sport means…..
• Buying a new outfit means…..
Basic Economic Questions
• $100 gift certificate and a trip to Mayfair Mall!
• Ever not buy something?
• Ever regret a purchase?
• Have a CD you hate?

Overview
• Because we have unlimited wants but limited resources we have to make choices and understand that our choices come with a cost.
• How do we get the greatest satisfaction for the lowest cost??
• “The most bang for the buck!”

I. What is Economics cont…
• D. Marginal
• 1. Economics seeks to compare the marginal benefit to the marginal cost.
• 2. Marginal = Additional or extra.
• (More commonly; is it worth it? Is the added effort worth the benefit you will receive both individually and in society.)
An example -
• Needed – 3 volunteers.
• You get to eat.

Do you think like an Economist – Yet??
• Can the government provide too much financial aid???
• What should you consider?
• Costs=
• Benefits=
• How do you measure it?
• That’s what the class is about.

II. Why Study Economics
• A. Economics has replaced politics as the avenue toward freedom.
• 1. Economics dominates political decisions.
• B. It will help you make better financial decisions.Academic not Vocational –
Accounting = VocationalAcademic = the skills to run a business better

III. Broad Economic Goals
• A. 8 Widely accepted goals of USA • 1. Growth – Higher Standard of Living• 2. Full Employment – Provide jobs for all citizens willing and able to
work.• 3. Efficiency – maximum fulfillment of wants with all available
resources.• 4. Price-level stability – avoid large swings in prices (inflation /deflation)• 5. Freedom – allow for choices.• 6. Equitable distribution of income – poverty v. wealth.• 7. Security – provide for those unable to provide for themselves.
• 8. Balance of Trade – keep a reasonable balance of goods and financial transactions.
• B. Debatable, complementary, and may involve trade-offs.
End of Chapter 1
• Economics Defined• Unlimited wants vs.
limited resources.• Scarcity leads to choice.• Choice is made by
evaluating what is going to give the most satisfaction for the lowest cost.
• Bonus for chapter 1 work Tuesday September 13.

AP Macro Outline – 2005-2006 I. Basic economic concepts 8 – 12 % Chapters 1, 2, 3, 4, 5 & parts of 20 A. Scarcity, choice and opportunity costsB. Production possibilities curveC. Comparative advantage, specialization and exchangeD. Demand, supply, and market equilibriumE. Macroeconomic issues: business cycle, unemployment, inflation, growth II. Measurement of economic performance 12 – 16 % Chapters 4, 5, 7, 8A. National Income Accounts (4-6%)1. Circular flow2. Gross Domestic Product3. Components of GDP4. Real versus Nominal GDPB. Inflation measurement and adjustment (4-5%)1. Price indices2. Nominal versus real values3. Costs of inflationC. Unemployment (4-5%)1. Definition and measurement2. Types of unemployment3. Natural rate of unemployment
Do you think like an economist yet?Let’s See

Chapter 2
• I. The Economizing problem.• A. Society’s material wants are unlimited yet
resources are scarce?• 1. On the one hand we deal with the
desires of consumers. • 2. Consumers seek those items that give
them the greatest utility (pleasure/satisfaction).• 3. Business and Gov’t also have wants
such as satisfying production goals or helping the citizenry.
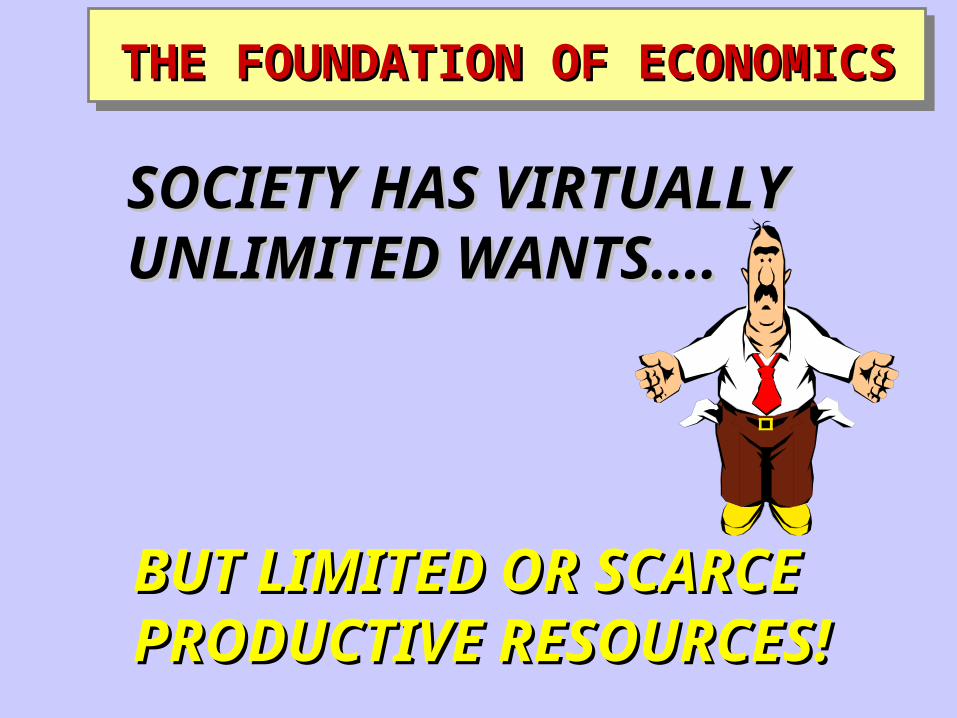
BUT LIMITED OR SCARCEBUT LIMITED OR SCARCEPRODUCTIVE RESOURCES!PRODUCTIVE RESOURCES!
THE FOUNDATION OF ECONOMICSTHE FOUNDATION OF ECONOMICS
SOCIETY HAS VIRTUALLYSOCIETY HAS VIRTUALLYUNLIMITED WANTS....UNLIMITED WANTS....

Wants????
• Food, Clothing, and Shelter
• Cars, Concerts, and CD’s
• Primary v Secondary Wants
• Different people?• Different nations?• Different wants?

I. The economizing problem cont…
• 4. On the other hand we deal with all of the natural, human and manufactured resources.
• B. Resource Categories• 1. Land – All gifts of nature.• 2. Capital – machinery, tools etc…• 3. Labor – physical and mental talents
of individuals.
I. The economizing problem cont…
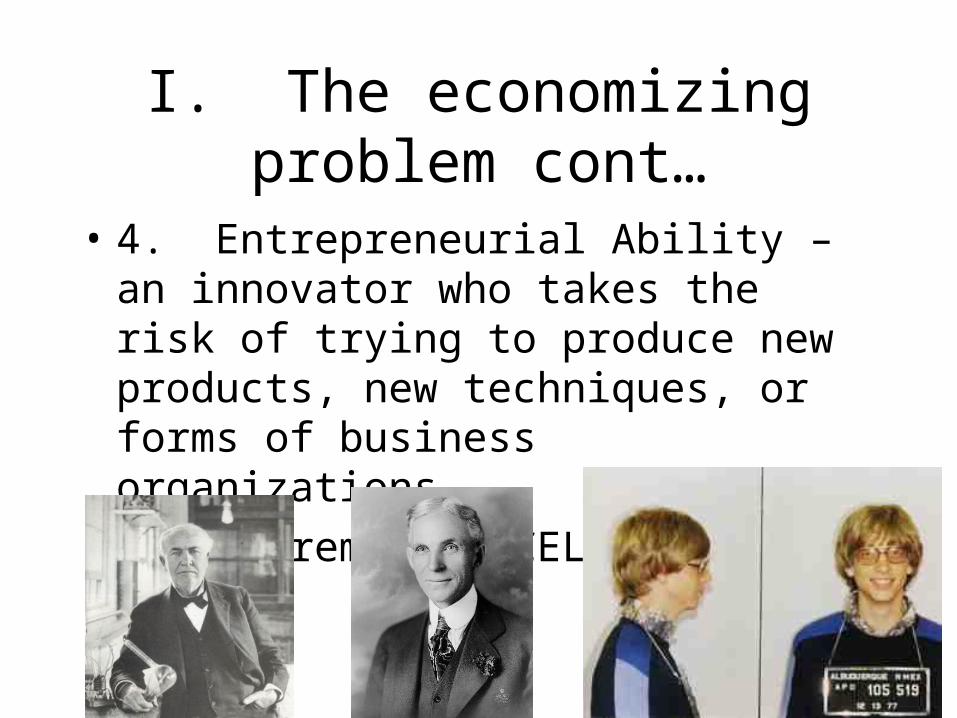
• 4. Entrepreneurial Ability – an innovator who takes the risk of trying to produce new products, new techniques, or forms of business organizations.
• Try to remember CELL

Resource Categories
• Land• Labor• Capital (is not money but
is new machines and factories)
• Entrepreneurial
Skills(CELL – a pneumatic device)

I. The economizing problem cont…
• C. Resource markets• 1. The place where resources or the services
of resource suppliers are bought and sold.• 2. Business demands the 4 categories of
resources to make their goods and services.• 3. In return business must pay for those
resources.• 4. Those resource payments are in the form of
Rent, Interest, Wages and Profits/losses. (weasel puss is red!)

Business/Owners Business/Owners Decisions based on…Decisions based on…$$$$$$
LANDLAND
CAPITALCAPITAL
LABORLABOR
RENTRENT
INTERESTINTEREST
WAGESWAGES
ENTREPRENEURENTREPRENEUR PROFIT &PROFIT &LOSSLOSS
5.

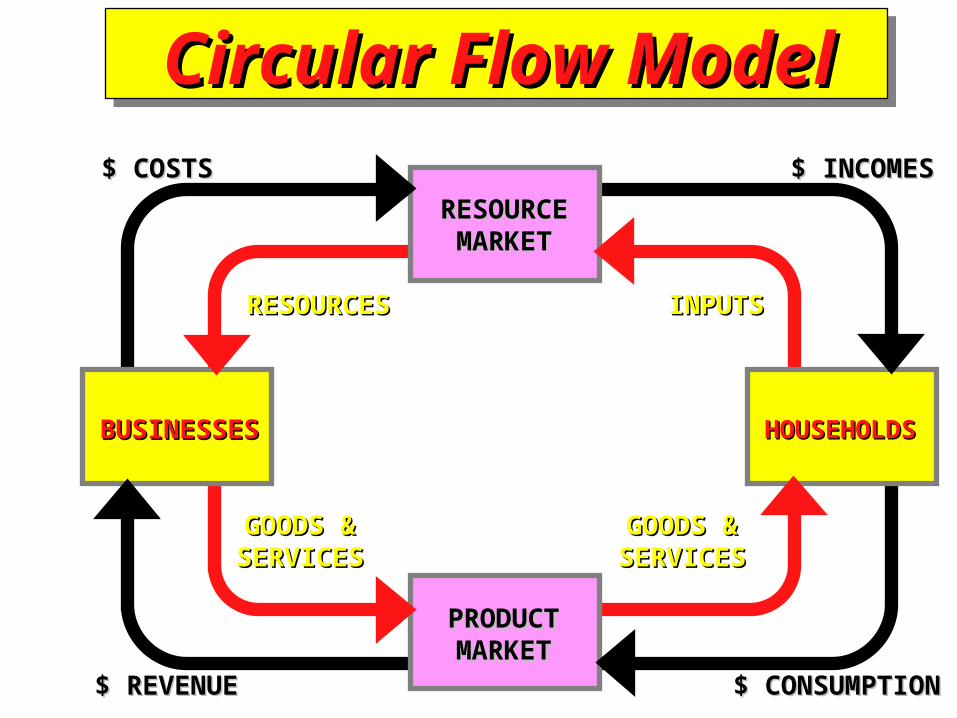
6. Simple Circular Flow
Page 37 in book.

Circular Flow ModelCircular Flow Model
BUSINESSESBUSINESSES

Circular Flow ModelCircular Flow Model
BUSINESSESBUSINESSES HOUSEHOLDSHOUSEHOLDS

Circular Flow ModelCircular Flow Model
RESOURCERESOURCEMARKETMARKET
RESOURCESRESOURCES INPUTSINPUTS
BUSINESSESBUSINESSES HOUSEHOLDSHOUSEHOLDS

Circular Flow ModelCircular Flow Model
RESOURCERESOURCEMARKETMARKET
RESOURCESRESOURCES INPUTSINPUTS
$ COSTS$ COSTS $ INCOMES$ INCOMES
BUSINESSESBUSINESSES HOUSEHOLDSHOUSEHOLDS

LUXURIES vs. NECESSITIESLUXURIES vs. NECESSITIESSecondary vs. Primary WantsSecondary vs. Primary Wants
Consumer Choices are based on...Consumer Choices are based on...Consumer Choices are based on...Consumer Choices are based on...
UTILITY or Opportunity costUTILITY or Opportunity cost

Circular Flow ModelCircular Flow Model
RESOURCERESOURCEMARKETMARKET
RESOURCESRESOURCES INPUTSINPUTS
$ COSTS$ COSTS $ INCOMES$ INCOMES
PRODUCTPRODUCTMARKETMARKET
GOODS &GOODS &SERVICESSERVICES
GOODS &GOODS &SERVICESSERVICES
BUSINESSESBUSINESSES HOUSEHOLDSHOUSEHOLDS
Circular Flow ModelCircular Flow Model
BUSINESSESBUSINESSES HOUSEHOLDSHOUSEHOLDS
RESOURCERESOURCEMARKETMARKET
RESOURCESRESOURCES INPUTSINPUTS
$ COSTS$ COSTS $ INCOMES$ INCOMES
PRODUCTPRODUCTMARKETMARKET
GOODS &GOODS &SERVICESSERVICES
GOODS &GOODS &SERVICESSERVICES
$ CONSUMPTION$ CONSUMPTION$ REVENUE$ REVENUE

How Does an Economy Work?
The Circular Flow Model
1995 Essay:
Draw, Label, & Explain the Circular Flow!

7. Full vs. Allocative Efficiency
• Full – using resources and producing goods in the least costly way.
• Allocative – using the resources and producing goods in the least cost way but also how society deems appropriate.

II. How do nations decide how to best use those resources?
A. 3 Basic Questions for any nation:
1. What?
2. How?
3. For Whom?To answer these questions, economic systems were created.
These economic systems vary greatly in how they use their scarce resources.
In the USA we used our scarce resources to produce $29,000 per person of goods and services.
In Zambia scarce resources were used to produce $900 per person of goods and services.

B. Economic Systems
• 1. Traditional
• 2. Command
• 3. Market
• 4. Mixed
Each system answers: what, how, and for whom differently.

Economic v Political Systems
• All nations fall economically into Traditional, Command, Market, or Mixed systems
• Nations politically can be Capitalist, Socialist, Communist, Dictatorship, or Fascist

C. Traditional Systems
• 1. Barter System• 2. Low Productivity• 3. Third World
Countries• Saukville

D. Command Systems
• 1. Government controls the economy
• 2. Government determines:– What to produce– Who will produce it– How it will be
produced– For whom it will be
produced

E. Market Systems
• 1. Laissez Faire role of government
• 2. Private ownership of the means of production
• 3. Markets determine price and allocate resources

F. Mixed Economic Systems
• 1. Most national economies today
• 2. Market economies dominate with varying degrees of government regulation and manipulation.

Goals of Macroeconomists:
1. Economic Growth
2. Stable Prices
3. Full Employment
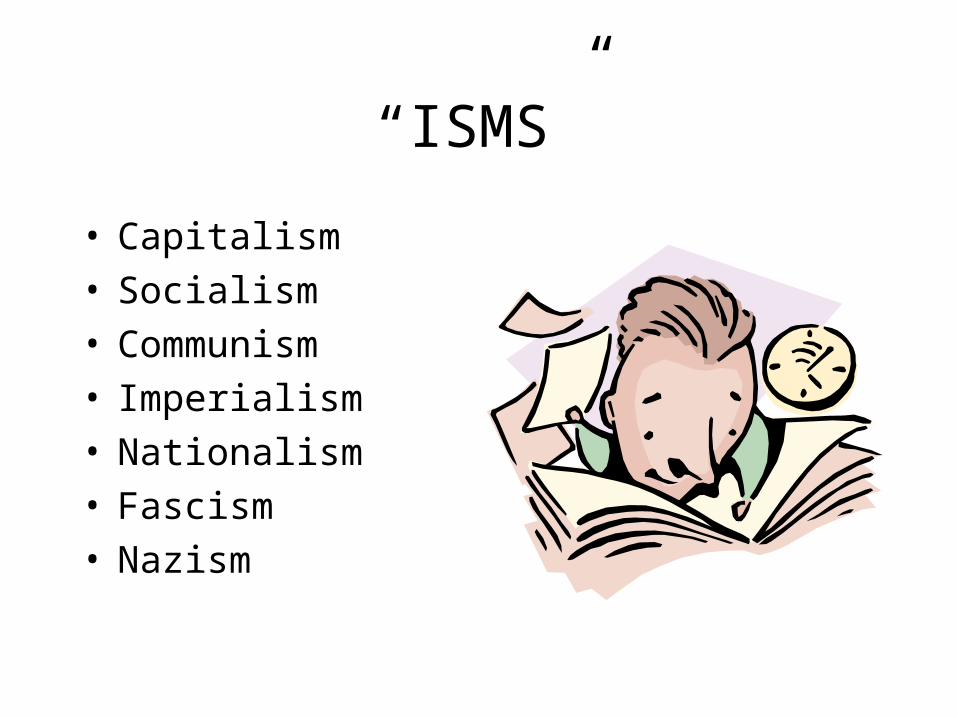
“ISMS”
• Capitalism• Socialism• Communism• Imperialism• Nationalism• Fascism• Nazism

Capitalist Systems - USA
• Limited role of government
• Private ownership of the means of production
• Markets determine price and allocate resources

Socialist Systems• An expanded role of
government• Government & Private
ownership of the means of production
• Government & Markets determine price and allocate resources
In most European countries& in Canada health care isPROVIDED by the Government.Governments own and run airlines and railroads in some countries too!

Communist Systems
• Government controls the economy
• Government determines:– What to produce– Who will produce it– How it will be
produced– For whom it will be
produced

Imperialism v. Nationalism
• Nationalism is waving the flag and being patriotic!
• Imperialism is planting the flag in another country and claiming it for political or economic gain!
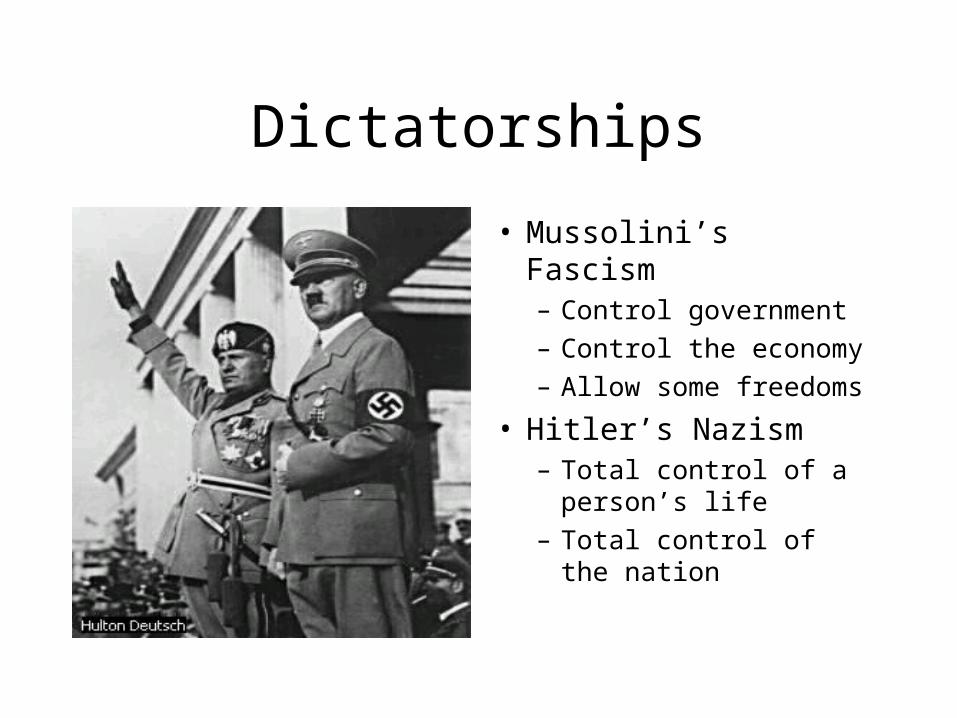
Dictatorships
• Mussolini’s Fascism– Control government
– Control the economy
– Allow some freedoms
• Hitler’s Nazism– Total control of a
person’s life
– Total control of the nation

A Quick Check
• Answer T for traditional, C for Command or M for Market.• 1. This economy has no money in its exchanges.• 2. In this economy consumers decide what will be produced.• 3. In this economy, government decides what will be produced.• 4. In this economy, government has only a minor role.• 5. This economy sees the greatest potential for productivity.• 6. J. Stalin, A. Hitler, F. Castro A. Hilts use this system today.• 7. In this economy the people decide who will receive the goods produced by
using money.• 8. The pilgrims• 9. Airbags and seat belts• 10. McRib, Mcgrafton• Take a look at the first three questions for your chapter two homework. You
should be able to answer them.

Production Possibility Curves
Understanding Efficiency and Choice

III. PPC Curves • A. Simplistic way of illustrating the consequences
of choice in an economy.• B. 4 Assumptions • 1. Full employment and productive efficiency.• 2. Fixed resources.• 3. Fixed Technology• 4. Two goods – consumer goods and capital
goods.• C. A PPC table lists the different combinations of
two products that can be produced with limited resources.
• D. A PPC curve is a 2 dimensional graph of the goods.
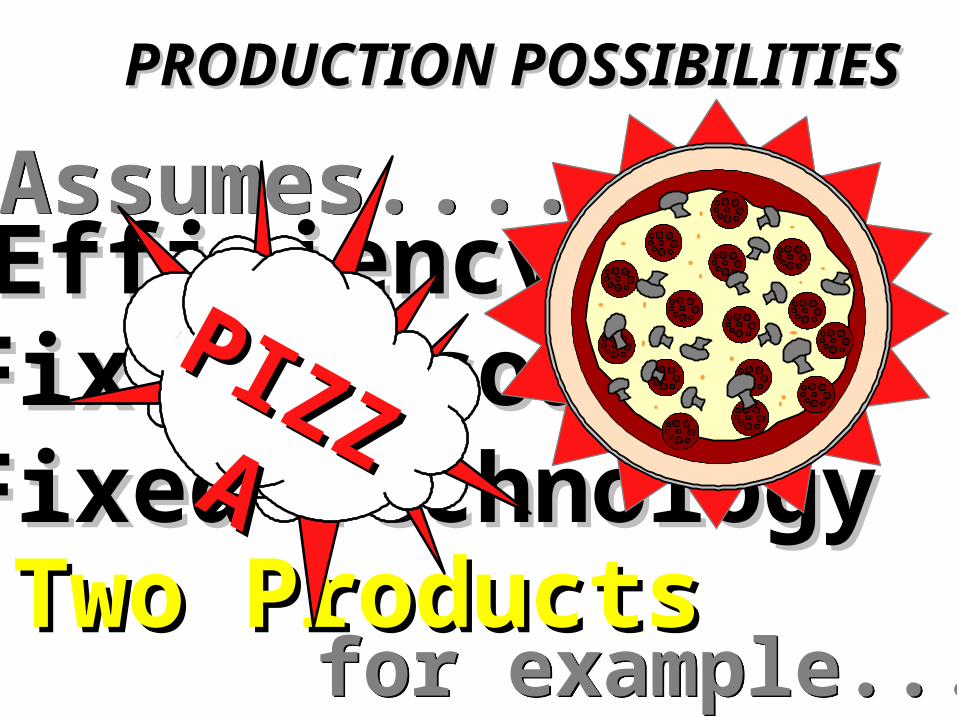
PRODUCTION POSSIBILITIESPRODUCTION POSSIBILITIES
Assumes....Assumes....EfficiencyEfficiency
Fixed ResourcesFixed ResourcesFixed TechnologyFixed TechnologyTwo ProductsTwo Products
PIZZPIZZAA
for example...for example...
for example...for example...
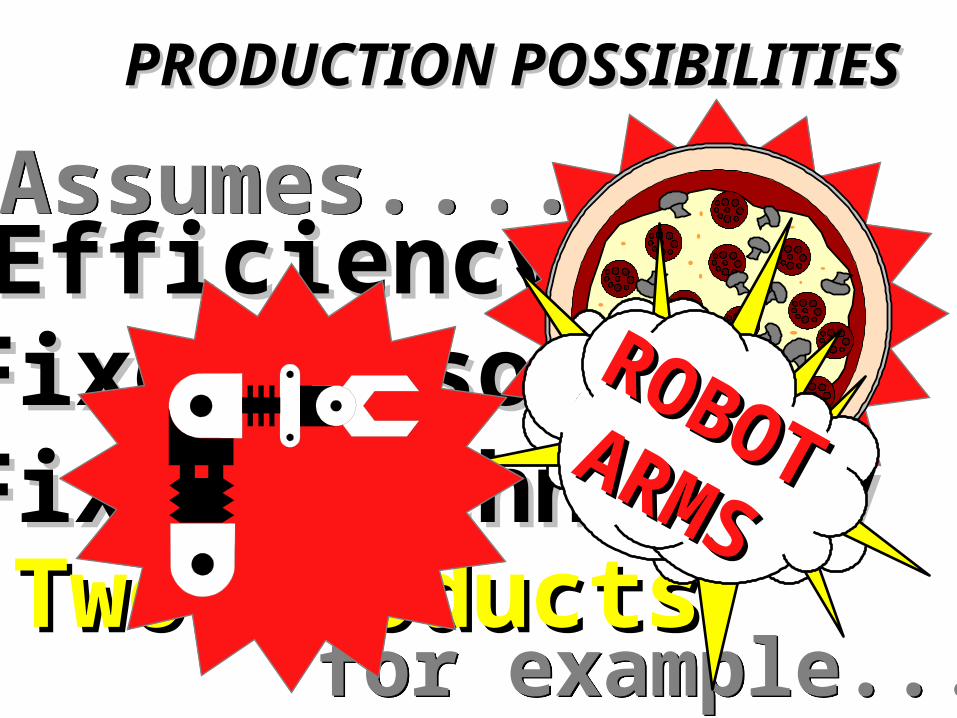
PRODUCTION POSSIBILITIESPRODUCTION POSSIBILITIES
Assumes....Assumes....EfficiencyEfficiency
Fixed ResourcesFixed ResourcesFixed TechnologyFixed TechnologyTwo ProductsTwo Products
ROBOT
ROBOT ARMSARMS
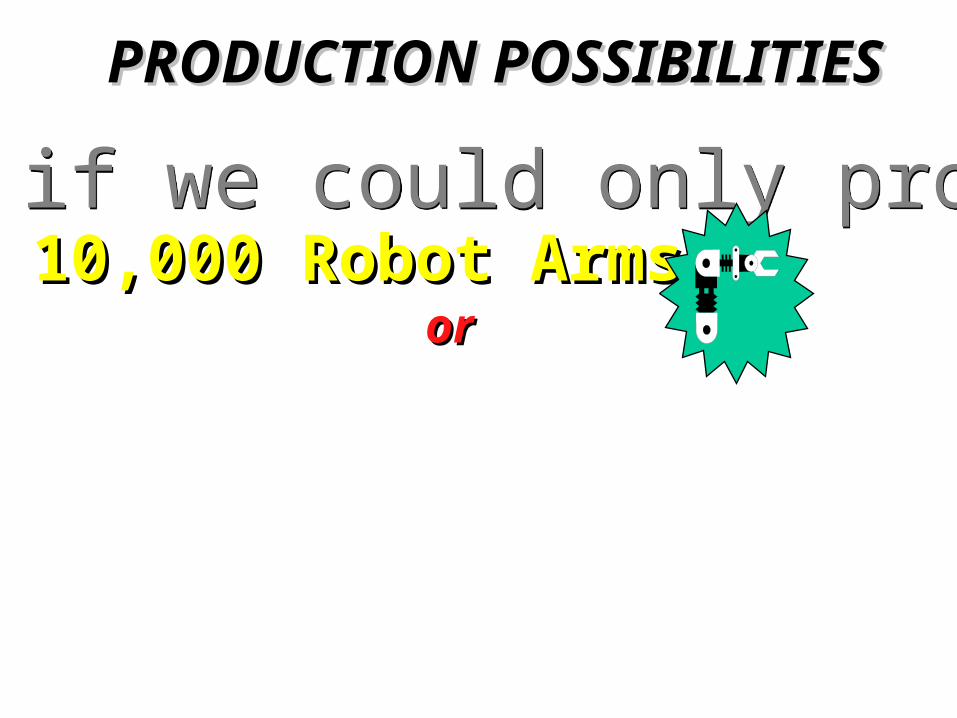
What if we could only produce ...What if we could only produce ...10,000 Robot Arms10,000 Robot Arms
oror
PRODUCTION POSSIBILITIESPRODUCTION POSSIBILITIES

What if we could only produce ...What if we could only produce ...10,000 Robot Arms10,000 Robot Arms
oror
400,000 Pizzas400,000 Pizzas
PRODUCTION POSSIBILITIESPRODUCTION POSSIBILITIES

Using all of our resources, to Using all of our resources, to get some pizza, we must giveget some pizza, we must give
up some robot arms!up some robot arms!
Using all of our resources, to Using all of our resources, to get some pizza, we must giveget some pizza, we must give
up some robot arms!up some robot arms!
for example...for example...for example...for example...
What if we could only produce ...What if we could only produce ...10,000 Robot Arms10,000 Robot Arms
oror
400,000 Pizzas400,000 Pizzas
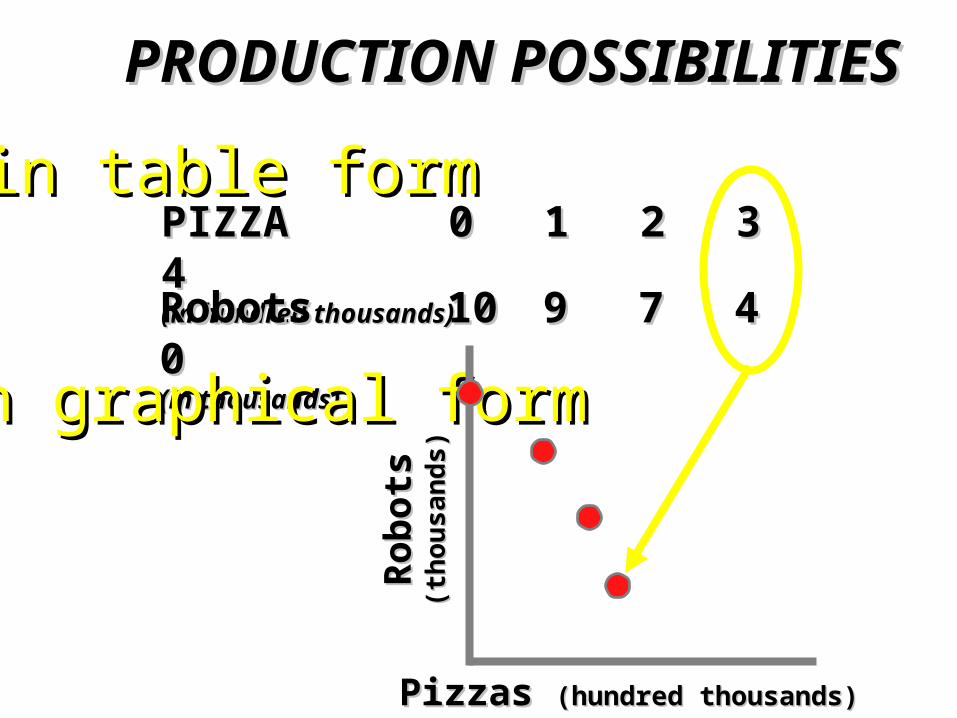
PRODUCTION POSSIBILITIESPRODUCTION POSSIBILITIES

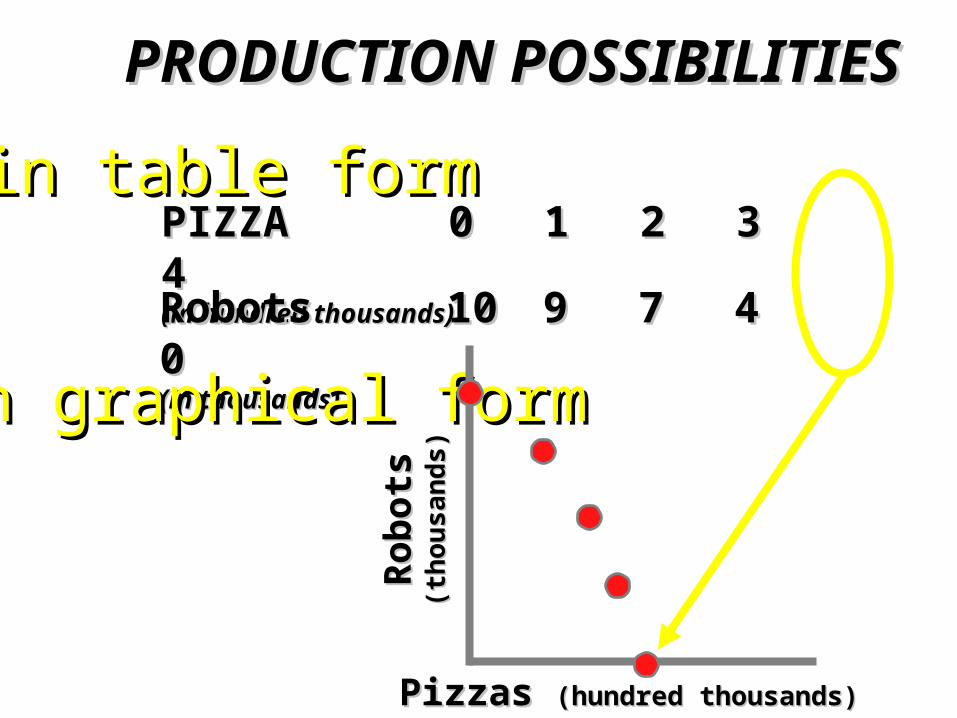
PIZZAPIZZA 00 11 22 33 44(in hundred thousands)(in hundred thousands)
RobotsRobots 1010 99 77 44 00(in thousands)(in thousands)
in table formin table form
PRODUCTION POSSIBILITIESPRODUCTION POSSIBILITIES

PIZZAPIZZA 00 11 22 33 44(in hundred thousands)(in hundred thousands)
RobotsRobots 1010 99 77 44 00(in thousands)(in thousands)
in table formin table form
in graphical formin graphical formR
ob
ots
Ro
bo
ts(t
ho
usa
nd
s)(t
ho
usa
nd
s)
Pizzas Pizzas (hundred thousands)(hundred thousands)
PRODUCTION POSSIBILITIESPRODUCTION POSSIBILITIES

PIZZAPIZZA 00 11 22 33 44(in hundred thousands)(in hundred thousands)
RobotsRobots 1010 99 77 44 00(in thousands)(in thousands)
in table formin table form
in graphical formin graphical formR
ob
ots
Ro
bo
ts(t
ho
usa
nd
s)(t
ho
usa
nd
s)
PRODUCTION POSSIBILITIESPRODUCTION POSSIBILITIES
Pizzas Pizzas (hundred thousands)(hundred thousands)

III. PPC Curves cont…
• E. If an economy is at full employment and full efficiency it must sacrifice some of one good in order to get more of another good.
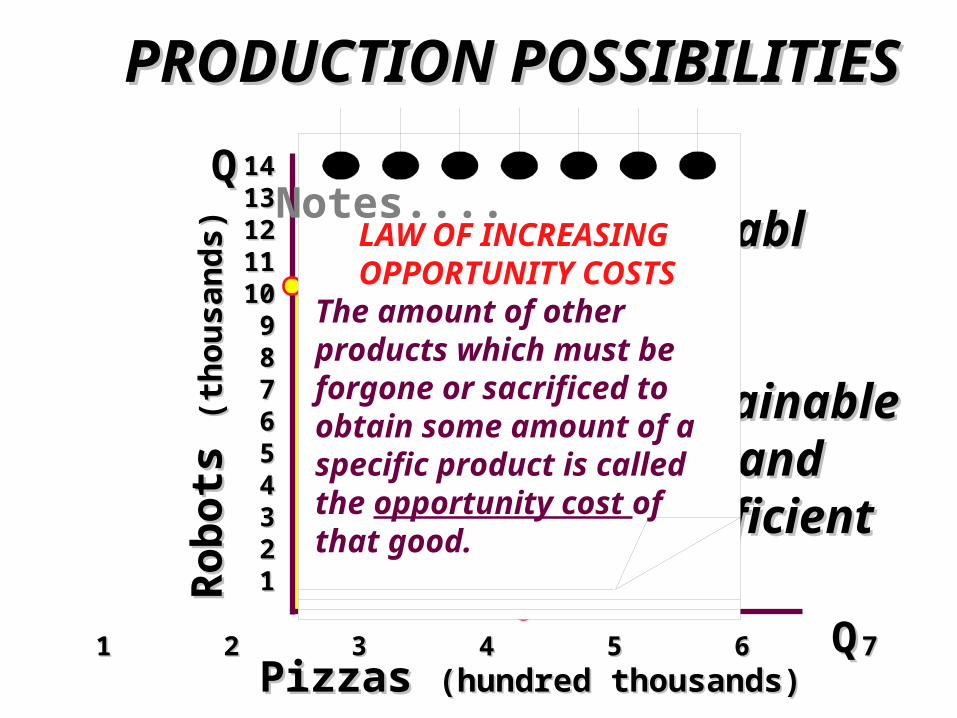
• F. The amount of other products that must be sacrificed to obtain additional units of another good is the – OPPORTUNITY COST!
PIZZAPIZZA 00 11 22 33 44(in hundred thousands)(in hundred thousands)
RobotsRobots 1010 99 77 44 00(in thousands)(in thousands)
in table formin table form
in graphical formin graphical formR
ob
ots
Ro
bo
ts(t
ho
usa
nd
s)(t
ho
usa
nd
s)
PRODUCTION POSSIBILITIESPRODUCTION POSSIBILITIES
Pizzas Pizzas (hundred thousands)(hundred thousands)
III. PPC Curves cont…
• 1. Law of increasing opportunity costs - the opportunity cost of each additional unit is greater than the previous one.
• - When you continue to add to Pizzas it is going to cost you marginally more in robots.
• - why? – it is not an equal trade off. There comes a point when transfer of resources is more costly than an equal trade off.
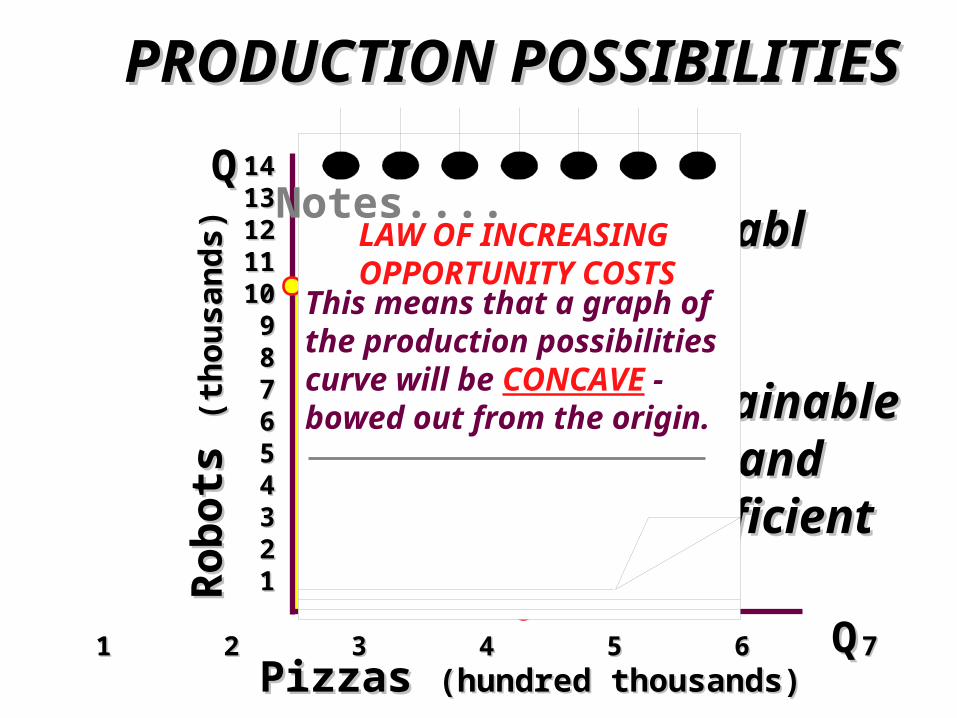
• - That is why PPC curves are concave.• - Converting capital goods or military good to
consumer goods is not an equal trade off.

PIZZAPIZZA 00 11 22 33 44(in hundred thousands)(in hundred thousands)
RobotsRobots 1010 99 77 44 00(in thousands)(in thousands)
in table formin table form
in graphical formin graphical formR
ob
ots
Ro
bo
ts(t
ho
usa
nd
s)(t
ho
usa
nd
s)
PRODUCTION POSSIBILITIESPRODUCTION POSSIBILITIES
Pizzas Pizzas (hundred thousands)(hundred thousands)
Total versus MarginalOpportunity costs.

Limited Resources meansLimited Resources meansa limited output....a limited output....
PRODUCTION POSSIBILITIESPRODUCTION POSSIBILITIES

Limited Resources meansLimited Resources meansa limited output....a limited output....
At any point in time, a full-At any point in time, a full-employment, full-productionemployment, full-productioneconomy must sacrifice someeconomy must sacrifice someof product of product XX to obtain more to obtain moreof product of product YY..
PRODUCTION POSSIBILITIESPRODUCTION POSSIBILITIES

Ro
bo
ts
Ro
bo
ts (t
ho
usa
nd
s)(t
ho
usa
nd
s)
Pizzas Pizzas (hundred thousands)(hundred thousands)
14141313121211111010 99 88 77 66 55 44 33 22 11
1 2 3 4 5 6 7 81 2 3 4 5 6 7 8
PRODUCTION POSSIBILITIESPRODUCTION POSSIBILITIES
A B
C
D
E
W
Attainablebut
Inefficient
UnattainableUnattainable
Attainable andAttainable andefficientefficient
G. Allocative Efficiency 1. Society must decide on some point along the frontier MB = MC
Ro
bo
ts
Ro
bo
ts (t
ho
usa
nd
s)(t
ho
usa
nd
s)
Pizzas Pizzas (hundred thousands)(hundred thousands)
14141313121211111010 99 88 77 66 55 44 33 22 11
1 2 3 4 5 6 7 81 2 3 4 5 6 7 8
PRODUCTION POSSIBILITIESPRODUCTION POSSIBILITIES
A B
C
D
E
W
Attainablebut
Inefficient
UnattainableUnattainable
Attainable andAttainable andefficientefficient
Notes....
The amount of other products which must beforgone or sacrificed to obtain some amount of a specific product is called the opportunity cost of that good.
LAW OF INCREASINGOPPORTUNITY COSTS
Ro
bo
ts
Ro
bo
ts (t
ho
usa
nd
s)(t
ho
usa
nd
s)
Pizzas Pizzas (hundred thousands)(hundred thousands)
14141313121211111010 99 88 77 66 55 44 33 22 11
1 2 3 4 5 6 7 81 2 3 4 5 6 7 8
PRODUCTION POSSIBILITIESPRODUCTION POSSIBILITIES
A B
C
D
E
W
Attainablebut
Inefficient
UnattainableUnattainable
Attainable andAttainable andefficientefficient
Notes....
This means that a graph ofthe production possibilitiescurve will be CONCAVE - bowed out from the origin.
LAW OF INCREASINGOPPORTUNITY COSTS

Ro
bo
ts
Ro
bo
ts (t
ho
usa
nd
s)(t
ho
usa
nd
s)
Pizzas Pizzas (hundred thousands)(hundred thousands)
14141313121211111010 99 88 77 66 55 44 33 22 11
1 2 3 4 5 6 7 81 2 3 4 5 6 7 8
PRODUCTION POSSIBILITIESPRODUCTION POSSIBILITIES
A B
C
D
E
W
Attainablebut
Inefficient
UnattainableUnattainable
Attainable andAttainable andefficientefficient
Notes....
This means that a graph ofthe production possibilitiescurve will be CONCAVE - bowed out from the origin.
Economic resources arenot completely adapt-able to other uses.
LAW OF INCREASINGOPPORTUNITY COSTS
Ro
bo
ts
Ro
bo
ts (t
ho
usa
nd
s)(t
ho
usa
nd
s)
Pizzas Pizzas (hundred thousands)(hundred thousands)
14141313121211111010 99 88 77 66 55 44 33 22 11
1 2 3 4 5 6 7 81 2 3 4 5 6 7 8
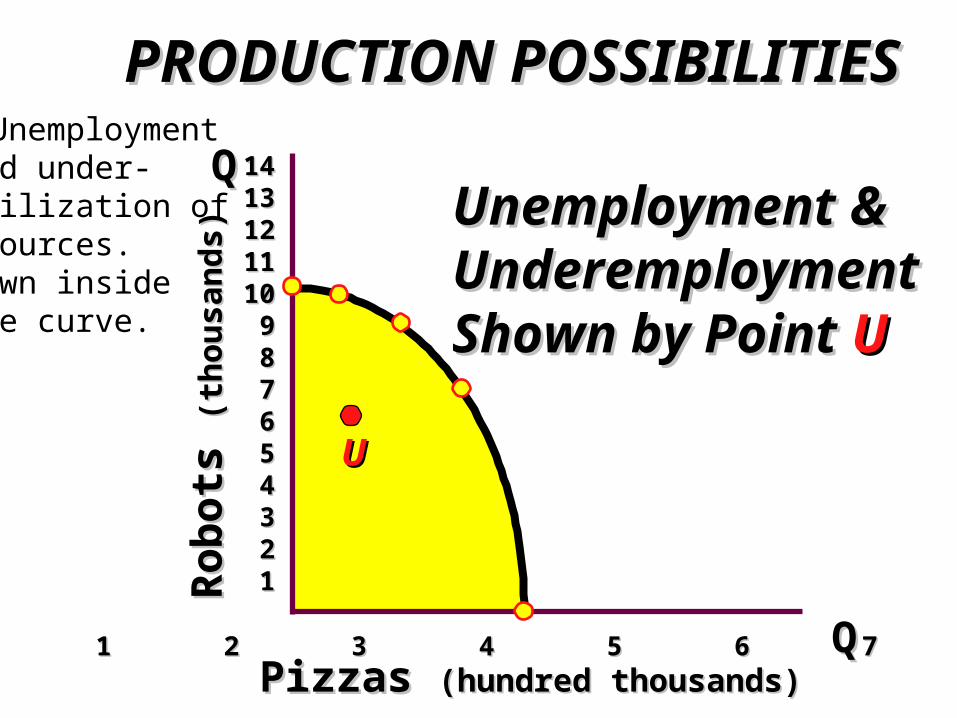
PRODUCTION POSSIBILITIESPRODUCTION POSSIBILITIES
UU
Unemployment &Unemployment &Underemployment Underemployment Shown by Point Shown by Point UU
H. Unemployment and under- utilization ofresources.Shown inside the curve.

PRODUCTION POSSIBILITIESPRODUCTION POSSIBILITIESQ
Q
Cap
ital
Go
od
sC
apit
al G
oo
ds
Consumer GoodsConsumer Goods
A
B
a
Economic LimitsAlong
PPC Frontier

PRODUCTION POSSIBILITIESPRODUCTION POSSIBILITIES
Economic Growth
Q
Q
A
B
C
D
a
b
Cap
ital
Go
od
sC
apit
al G
oo
ds
Consumer GoodsConsumer Goods
I. Growth brought on by an increase in resource supplies or advances in technology. Shifts the Curve to the Right.

12
10
8
6
4
2
02 4 6 8 10 12
PPC – Constant Cost Graph
12
10
8
6
4
2
02 4 6 8 10 12
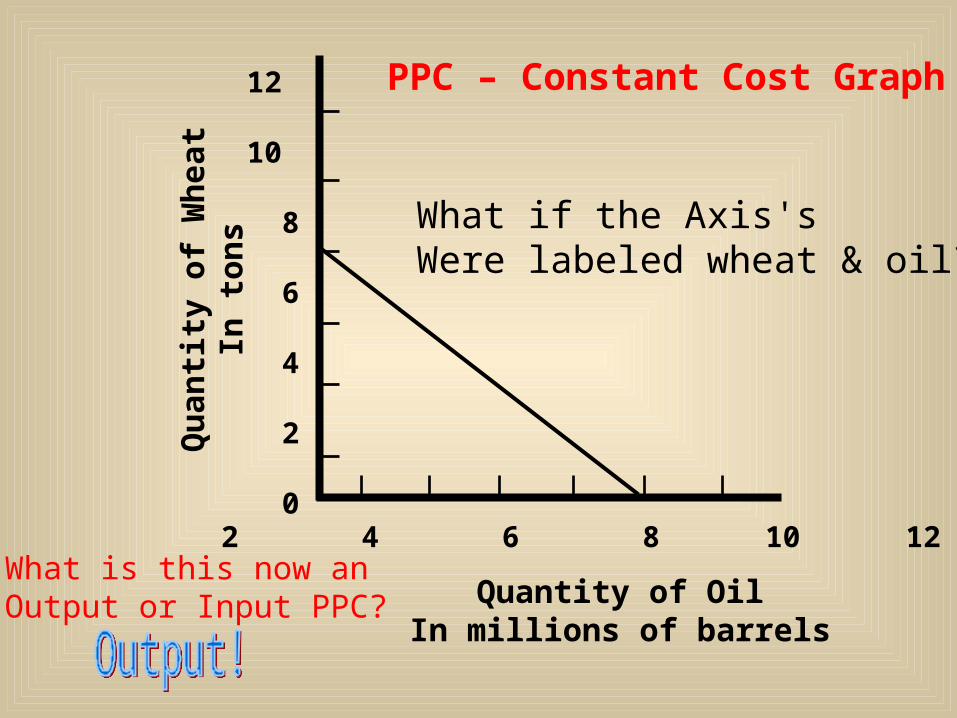
What if the Axis'sWere labeled wheat & oil?
PPC – Constant Cost Graph
Qu
anti
ty o
f W
hea
tIn
to
ns
Quantity of OilIn millions of barrels
What is this now anOutput or Input PPC?

12
10
8
6
4
2
02 4 6 8 10 12
PPC – Constant Cost Graph of
OutputsQ
uan
tity
of
Wh
eat
In t
on
s
Quantity of OilIn millions of barrels

12
10
8
6
4
2
02 4 6 8 10 12
PPC – What happens if output increases?
Qu
anti
ty o
f W
hea
tIn
to
ns
Quantity of OilIn millions of barrels
PRODUCTION POSSIBILITIESPRODUCTION POSSIBILITIES
Assumes....Assumes....EfficiencyEfficiency

PRODUCTION POSSIBILITIESPRODUCTION POSSIBILITIES
Assumes....Assumes....EfficiencyEfficiency
Fixed ResourcesFixed Resources

PRODUCTION POSSIBILITIESPRODUCTION POSSIBILITIES
Assumes....Assumes....EfficiencyEfficiency
Fixed ResourcesFixed ResourcesFixed TechnologyFixed Technology

PRODUCTION POSSIBILITIESPRODUCTION POSSIBILITIES
Assumes....Assumes....EfficiencyEfficiency
Fixed ResourcesFixed ResourcesFixed TechnologyFixed Technology
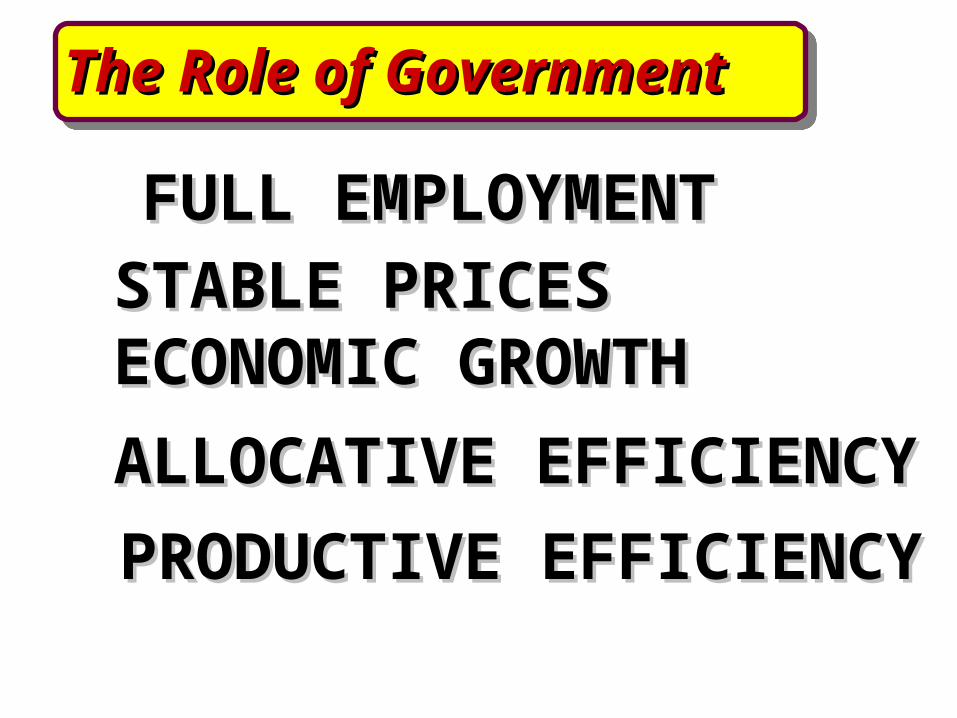
FULL EMPLOYMENTFULL EMPLOYMENT
STABLE PRICESSTABLE PRICESECONOMIC GROWTHECONOMIC GROWTH
ALLOCATIVE EFFICIENCYALLOCATIVE EFFICIENCY
PRODUCTIVE EFFICIENCYPRODUCTIVE EFFICIENCY
The Role of GovernmentThe Role of Government

PRODUCTION POSSIBILITIESPRODUCTION POSSIBILITIES
Assumes....Assumes....EfficiencyEfficiency
Fixed ResourcesFixed ResourcesFixed TechnologyFixed Technology

Ro
bo
ts
Ro
bo
ts (t
ho
usa
nd
s)(t
ho
usa
nd
s)
Pizzas Pizzas (hundred thousands)(hundred thousands)
14141313121211111010 99 88 77 66 55 44 33 22 11
1 2 3 4 5 6 7 81 2 3 4 5 6 7 8
PRODUCTION POSSIBILITIESPRODUCTION POSSIBILITIES
UU
Unemployment &Unemployment &Underemployment Underemployment Shown by Point Shown by Point UU
More of either orMore of either orboth is possibleboth is possible

Ro
bo
ts
Ro
bo
ts (t
ho
usa
nd
s)(t
ho
usa
nd
s)
Pizzas Pizzas (hundred thousands)(hundred thousands)
14141313121211111010 99 88 77 66 55 44 33 22 11
1 2 3 4 5 6 7 81 2 3 4 5 6 7 8
PRODUCTION POSSIBILITIESPRODUCTION POSSIBILITIES
Notes....ECONOMIC GROWTHECONOMIC GROWTH
The ability to producea larger total output -a rightward shift of the production possibilities curve caused by...

Ro
bo
ts
Ro
bo
ts (t
ho
usa
nd
s)(t
ho
usa
nd
s)
Pizzas Pizzas (hundred thousands)(hundred thousands)
14141313121211111010 99 88 77 66 55 44 33 22 11
1 2 3 4 5 6 7 81 2 3 4 5 6 7 8
PRODUCTION POSSIBILITIESPRODUCTION POSSIBILITIES
Notes....
1 - Increases in resources -
2 - Better resource quality -
3 - Technological progress
ECONOMIC GROWTHECONOMIC GROWTH

Economic Economic GrowthGrowth
Ro
bo
ts
Ro
bo
ts (t
ho
usa
nd
s)(t
ho
usa
nd
s)
Pizzas Pizzas (hundred thousands)(hundred thousands)
14141313121211111010 99 88 77 66 55 44 33 22 11
1 2 3 4 5 6 7 81 2 3 4 5 6 7 8
A’A’
B’B’
C’C’
D’D’
E’E’
PRODUCTION POSSIBILITIESPRODUCTION POSSIBILITIES

Two Examples of Two Examples of Economic GrowthEconomic Growth
Go
od
s fo
r th
e F
utu
reG
oo
ds
for
the
Fu
ture
FAVORINGFAVORINGPRESENT GOODSPRESENT GOODS
CURRENTCURRENTCURVECURVE
FUTUREFUTURECURVECURVE
CONSUMPTIONCONSUMPTION
PRODUCTION POSSIBILITIESPRODUCTION POSSIBILITIES
Goods for the PresentGoods for the Present

Two Examples of Two Examples of Economic GrowthEconomic Growth
Goods for the PresentGoods for the Present Goods for the PresentGoods for the Present
Go
od
s fo
r th
e F
utu
reG
oo
ds
for
the
Fu
ture
Go
od
s fo
r th
e F
utu
reG
oo
ds
for
the
Fu
ture
FAVORINGFAVORINGPRESENT GOODSPRESENT GOODS
FAVORINGFAVORINGFUTURE GOODSFUTURE GOODS
CURRENTCURRENTCURVECURVE
FUTUREFUTURECURVECURVE
FUTUREFUTURECURVECURVE
CONSUMPTIONCONSUMPTION
CONSUMPTIONCONSUMPTION
PRODUCTION POSSIBILITIESPRODUCTION POSSIBILITIES
CURRENTCURRENTCURVECURVE

Basic Review – Chapter 2
• 5 point Bonus Chapter 1 for Monday 9/13; 10 Point Bonus Chapter 2 Wednesday 9/15
• Unlimited wants v limited resources
• Primary v Secondary
• Land, Labor, Capital, Entrepreneurial
• Choice
• Scarcity
• Opportunity Cost
• Absolute & Comparative Advantage
• What, How, and For Whom
• Economic Systems: Traditional, Command, Market, and Mixed
• Construction of a Circular Flow & PPC curves
• Efficiency????

Applications....Applications....• Wartime ProductionWartime Production• DiscriminationDiscrimination• Land-Use ControversiesLand-Use Controversies• Destruction from WarDestruction from War• Growth: Japan vs. United StatesGrowth: Japan vs. United States• Famine in AfricaFamine in Africa• Emerging TechnologiesEmerging Technologies
PRODUCTION POSSIBILITIESPRODUCTION POSSIBILITIES

On the back of your quiz:
• Draw a simple circular flow with Households & Businesses, The Factor Market with CELL & WPiR, & the Product Market with Goods & Services and Cash Flow.
• Draw and Label PPC curves on a single graph for Pesto and Pasta Lands labeling: Absolute Advantage(AA) and Comparative Advantage(CA) – Pesto land produces 40 Lasagna and 20 Pizzas
– Pasta land produces 30 Lasagna and 30 Pizzas

The Macro Economy • Consumer Purchases
• Business Investments
• Government Purchases
• Exports
• Imports
• GDP = C + I + G + X – M (demand side)
• GDP = W + i + R + P + Inbt + Dep (income side)


![***SPRING BREAK HOMEWORK ASSIGNMENT DUE ......Document 4 Brigades of Bonus Marchers converged on Washington [in 1932]. Congress had voted the bonus money, but for later. Some of these](https://static.fdocuments.net/doc/165x107/5e94ee77a90b513559349050/spring-break-homework-assignment-due-document-4-brigades-of-bonus-marchers.jpg)