
Bonifazi gazzola building climate change adaptive capacity in spatial planning
36
+ Evaluation and spatial planning – in the name of what? Building climate change adaptive capacity across planning domains in Europe Alessandro Bonifazi - Independent researcher/Politecnico di Bari: [email protected] Paola Gazzola - Global Urban Research Unit, School of Architecture, Planning and Landscape, Newcastle University: [email protected] IX International Workshop on Planning and Evaluation Strategies for the Environment: Evaluating and Planning for Extreme Events Mediterranean Agriculture Institute Bari, Valenzano (BA), Italy March 16-17, 2015
-
Upload
alessandro-bonifazi -
Category
Environment
-
view
64 -
download
1
Transcript of Bonifazi gazzola building climate change adaptive capacity in spatial planning

+
Evaluation and spatial planning – in the name of what? Building climate change adaptive capacity across planning domains in Europe
Alessandro Bonifazi - Independent researcher/Politecnico di Bari: [email protected] Paola Gazzola - Global Urban Research Unit, School of Architecture, Planning and Landscape, Newcastle University: [email protected]
IX International Workshop on Planning and Evaluation
Strategies for the Environment: Evaluating and Planning for
Extreme Events
Mediterranean Agriculture Institute Bari, Valenzano (BA), Italy
March 16-17, 2015

+ Focusses come (Climate change) and go (Sustainable development) in policy agendas (Dryzek, 2005), and frictions arise....
n Opportunity: Climate change mitigation and adaptation policies are expanding the scope of planning and evaluation after decades of declining salience (Albrechts 2004; Davoudi 2012b).
n Threat: The creative compromises between economic development and environmental protection that underpinned most sustainability-oriented planning practices are put under pressure by the prescriptive nature of climate change policies (Dryzek, 2005; While et al., 2010)
2

+ Outline
n Framing climate change adaptive capacity
n Guiding research questions n Is adaptation about making new/different kinds of plans? n Or, does adaptation rather entail carrying out new/different kinds of evaluations? n Nay, it must be about strengthening adaptive capacity in spatially organized
governance processes, mustn’t it?
n Reflecting on the role of evaluation in planning for climate change adaptive capacity-building
n The way forward n Building adaptive capacity to climate change through planning and evaluation: a
conceptual framework n Comparative case study: emerging adaptation practices in planning and evaluation
in Bari (Italy) and Newcastle (UK) metropolitan areas n Discussion: Whatever climate change adaptation be about, in the name of what is it
driving evaluation in planning?
3

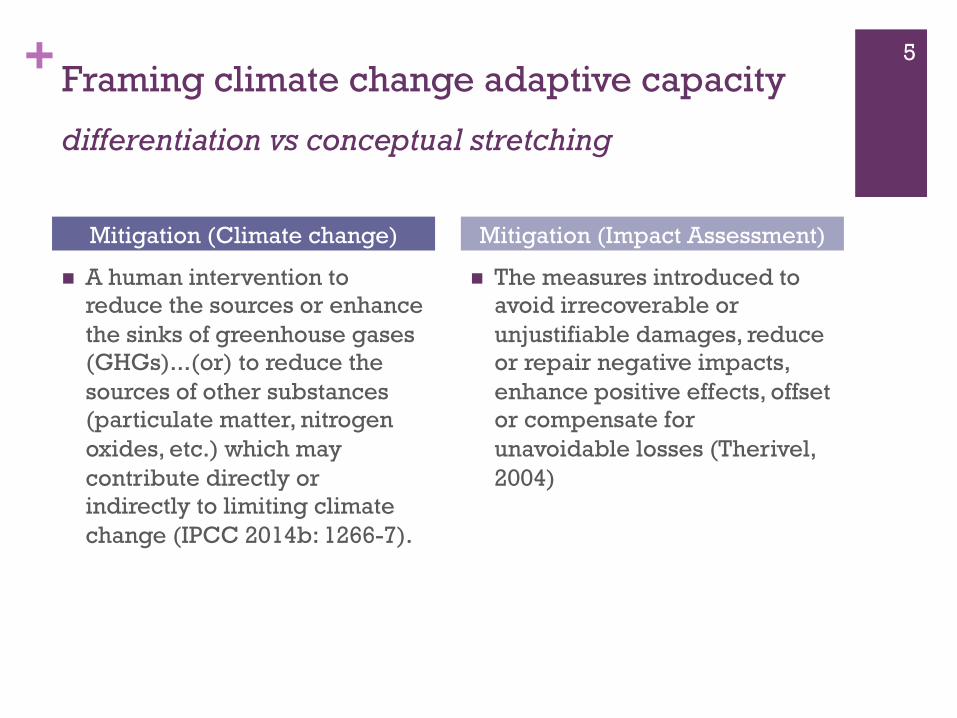
+ Framing climate change adaptive capacity differentiation vs conceptual stretching
n IPCC: “Adaptation is the process of adjustment to actual or expected climate and its effects. In human systems, adaptation seeks to moderate or avoid harm or exploit beneficial opportunities. In some natural systems, human intervention may facilitate adjustment to expected climate and its effects.” (IPCC 2014b: 1251)
n EU (EC+EEA): Adaptation needs a mix of options (grey options rely on technology and civil engineering projects; green options make use of nature; and soft options aim at altering human behaviour and styles of governance) and complex governance networks, in terms of vertical (European, national, regional, local) and horizontal (across socio-economic sectors and between regions) policy integration (EEA, 2013)
4
+
n A human intervention to reduce the sources or enhance the sinks of greenhouse gases (GHGs)...(or) to reduce the sources of other substances (particulate matter, nitrogen oxides, etc.) which may contribute directly or indirectly to limiting climate change (IPCC 2014b: 1266-7).
n The measures introduced to avoid irrecoverable or unjustifiable damages, reduce or repair negative impacts, enhance positive effects, offset or compensate for unavoidable losses (Therivel, 2004)
Mitigation (Climate change) Mitigation (Impact Assessment)
Framing climate change adaptive capacity differentiation vs conceptual stretching
5

+ Framing climate change adaptive capacity ... based on vulnerability
6

+ 7
n Adaptive capacity: “The ability of systems, institutions, humans, and other organisms to adjust to potential damage, to take advantage of opportunities, or to respond to consequences” (IPCC 2014b: 1251).
n Adaptations are manifestations of adaptive capacity, and they represent ways of reducing vulnerability and/or strengthening resilience (adapted after Smit and Walden, 2006: 286)
Framing climate change adaptive capacity

+
n Focus: from biophysical vulnerability to wider social and economic drivers
n Decision-Making Model: incrementalism dominates, irrespective of growing claims that transformative change may be needed
n Measures: engineered and technological options are the most commonly adopted, but ecosystem-based, institutional, and social responses are emerging
n Social actors: growing awareness does not translate into action (...), local government and the private sector critical to progress, safety nets for the most vulnerable
Framing climate change adaptive capacity state-of-the-art in adaptation to climate change
(IPCC, 2014b: 836-7)
8

+
Is adaptation about making new/different kinds of plans?

A STRONGER, MORE RESILIENT
NEW YORK
2007 2013 Hurricane Sandy (2012)
10

+
33PlaNYC PROGRESS REPORT:Sustainability & Resiliency 2014
CATEGORY METRIC 2030 TARGET FIGURE FOR MOST RECENT YEAR
TREND SINCE BASE YEAR
HOUS
ING
AND
NEIG
HBOR
HOOD
S Create homes for almost a million more New Yorkers while making housing and neighborhoods more affordable and sustainable
Increase in new housing units since January, 2007 314,000 125,837 2
% of new units within a 1/2 mile of transit > 70% 82.7% 1 NEUTRAL
Affordable housing units preserved or added (cumulative since 200 165,000 156,3512
PARK
S AN
D
PUBL
IC S
PACE Ensure all New Yorkers live within a 10-minute walk of a park
% of New Yorkers that live within a 1/4 mile of a park 85% 76.5% 1
Cumulative number of trees planted through Million Trees initiative 1,000,000 834,015 1
ENER
GY Reduce energy consumption and make our energy systems cleaner and more reliable
Greenhouse gas emissions per unit of electrical power (lbs CO2e/MWh) DECREASE 674.911 2
AIR
QUAL
ITY Achieve the cleanest air quality of any big U.S. city
City ranking in average PM2.5 (3 yr rolling avg) compared to other large U.S. cities #1 (cleanest air) #4 1 NEUTRAL
Change in average PM2.5 (year-on-year % change in 3 yr rolling avg) DECREASE -0.5% 1
CLIM
ATE
CHAN
GE
Reduce greenhouse gas emissions by over 30%
Increase the resiliency of our communities, natural systems, and infrastructure to climate risks
Greenhouse gas emissions (MTCO2e) DECREASE 30% 3 47,939,030 (19%) 2
SOLI
D
WAS
TE Achieve the cleanest air quality of any big U.S. city
Percentage of waste diverted from landfills (includes fill) 75% 52% 1
1 Results are for FY or CY 20132 Results are for FY or CY 20123 From 2005 levels
Not on Track
On Track
PlaNYC 2007-11 (greener, greater...) 11

+ PlaNYC 2013 (stronger, more resilient...)
89PlaNYC PROGRESS REPORT:Sustainability & Resiliency 2014
Through the Mayor’s Office of Recovery and Resil-
iency (ORR), the City is working to identify and
adopt a set of metrics that will most accurately
assess the progress of resiliency work being
conducted throughout the City.
These metrics, once adopted, will be monitored
and reported in the City’s Mayor’s Management
Report, with the next issue to be published later
in 2014.
Metrics (Preliminary)
CATEGORY METRIC
COASTAL PROTECTION
BUILDINGSNumber of buildings implementing Core Flood Resiliency MeasuresNumber of square feet of residential and non-residential buildings implementing Core Flood resiliency measures
INSURANCEPercent of residences in 100-year floodplain purchasing flood insuranceAverage premium paid for National Flood Insurance Program (NFIP) policies
UTILITIES
Percent of electric generation capacity in the 500-year floodplain able to remain online after a 500-year floodMaximum percent of peak load that could be lost due to failure of any one substationPercent of assets at or above their loading limits during peak demand periodsNumber of miles of cast iron and bare steel gas mains in the 500-year floodplainPercent of steam generation capacity in the 500-year floodplain able to remain online after a 500-year flood
LIQUID FUELSPercent of gas stations with quick-connects for generatorsPercent of regional fuel terminal capacity in the 100-year floodplain hardened against a 100-year floodPercent of regional refining capacity in the 100-year floodplain hardened against a 100-year flood
TELECOMMUNICATIONS Number of critical telecommunications facilities implementing Core Flood Resiliency Measures
TRANSPORTATIONNumber of lane-miles reconstructed or resurfacedPercent of New York City transportation assets adapted for climate change resiliency
WATER AND WASTEWATER
Number of wastewater facilities or assets protected or raised above the 100-year floodplainNumber of right-of-way bioswales constructedNumber of sewer miles built in areas with no or partial sewersNumber of Bluebelt Best Management Practices (BMPs)Percent of water quality samples complying with Surface Water Treatment Rule standard for turbidity
SOLID WASTE Number of DSNY facilities protected or raised above the 100-year floodplain
HEALTHCARE Percent of hospital beds in 500-year floodplain meeting resiliency standardsPercent of beds in nursing homes and adult care facilities in 100-year floodplain meeting resiliency requirements
FOOD SUPPLYNumber of grocery stores with generators or quick connects for generatorsPercent of DCAS food procurement backstopped with more resilient distributors
PARKSPercent of DPR facilities in Sandy inundation zone upgraded for greater resiliencyNumber of trees inspected and pruned
Federal dollars secured for coastal protection projectsNumber of buildings with reduced coastal risk due to coastal protection projectsNumber of cubic yards of beach sand nourishment
12
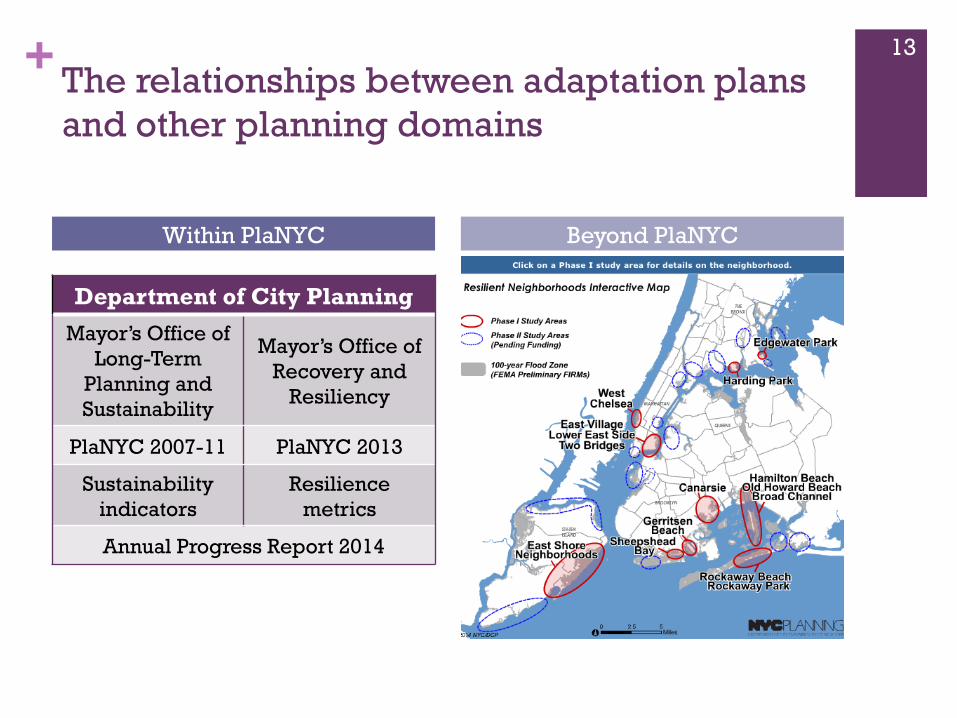
+ The relationships between adaptation plans and other planning domains
Department of City Planning Mayor’s Office of
Long-Term Planning and Sustainability
Mayor’s Office of Recovery and
Resiliency
PlaNYC 2007-11 PlaNYC 2013
Sustainability indicators
Resilience metrics
Annual Progress Report 2014
Within PlaNYC Beyond PlaNYC
13

+ First wave of climate adaptation plans is found to be...
...wanting in many respects:
n lagging behind mitigation policy
n poorly appreciating diversity in local governance contexts
n resembling climate impact assessment, and disregarding implementation
n disintegrated from existing policies
(Preston et al. 2012; Stone et al. 2012)
14

+ First wave of climate adaptation plans is found to be...
...not ready to deliver adaptation
(Preston et al. 2012)
15

+Adaptation Policy Cycle (EEA, 2013)
16
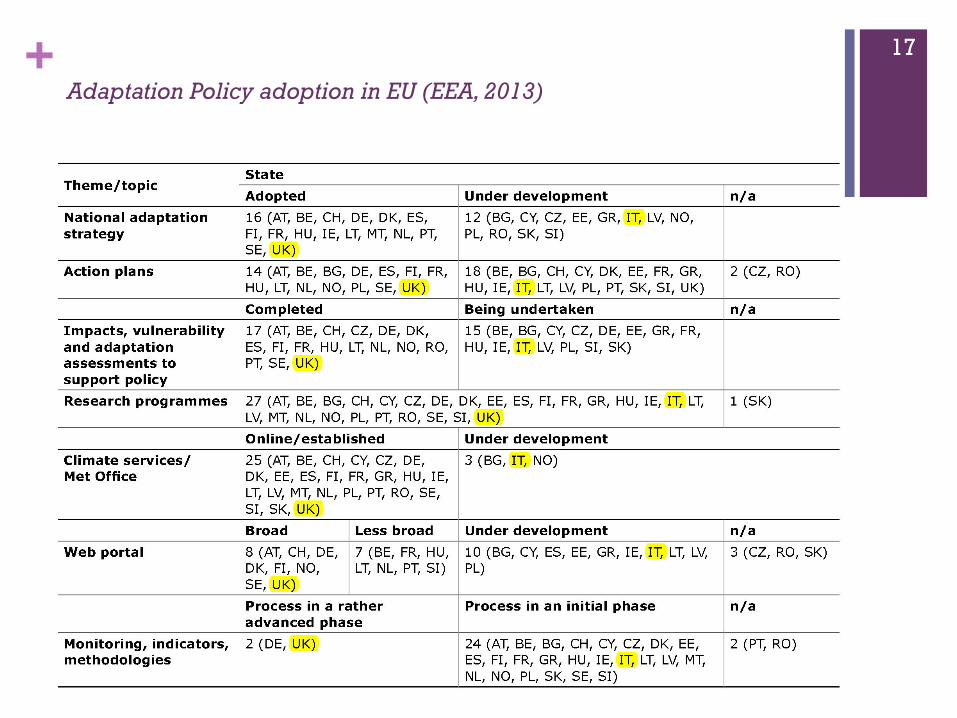
+Adaptation Policy adoption in EU (EEA, 2013)
17

+Adaptation Policy adoption and diffusion in EU (EEA, 2013)
18

+ Is adaptation about making new/different kinds of plans?
n IPCC’s latest recommendations (AR5) address spatial planning mainly for mitigation, and urban areas because highly vulnerable (physical density of people and built environment) and key adaptation drivers (relational, cognitive and social intensity in urban dynamics)
n Adaptation in Nature conservation and environmental risk planning = re-labelling (to further legitimize) or amendments to existing plans (Archie et al., 2012; Runhaar et al., 2012)
n Diffusion of adaptation within municipal planning is meeting with similar problems than earlier innovations, but leadership (also from within the ranks) and accommodating competing priorities are key to advancing the global/local interplay in climate policy (Measham et al., 2011)
Adaptation in different planning domains
19

+ Is adaptation about making new/different kinds of plans?
n Spatial planning potential in climate change adaptation is great: n (alleged) long-term perspective
n coordination role - transport, regional development, land use, biodiversity, industry, tourism, energy, water, risks, etc.
n wide scope, from strategic to operational levels
n Achievements are very limited yet: n poor institutionalization (at legislative, administrative and practice
level)
n perceived barriers are the same as in other policy fields (resources, knowledge, leadership)
n promising opportunities depend on planners’ ownership of adaptation and could build on experts and authorities’ networks
Adaptation in spatial planning
20

+
Or, does adaptation rather entail carrying out new/different kinds of evaluations?

+ Adaptive capacity assessment, based on the ESPON CLIMATE 2013 Programme framework (Juhola and Kruse, 2015)
on almost all of the indicators compared to other regions. The capacities of regions inSouthern and Eastern Europe are lower on most of the indicators compared to those ofregions in the northern and western parts of Europe. On the whole, regions in EasternEurope score lowest on the indicators assessing technology and infrastructure whilstregions in Southern Europe have the lowest capacity on economic and institutionaldeterminants.
The map serves as a starting point for discussion on adaptive capacity in Europe butfurther studies are required to elaborate the regional capacity in Europe. The target audienceof the assessment was mainly the research community, as well as EU level policy makers.The results of the vulnerability assessment were distributed to the ESPON network to allcontact points in the European Union (EU) Member States in order to support policydevelopment in relation to territorial cohesion and regional development.
3.2 Assessment of the adaptive capacity of the tourism sector in the Alpine space
3.2.1 Objectives
The second example focuses on the capacities of the tourism sector of the European Alps. Asabove, adaptive capacity is conceptualised according to the IPCC definition and specified bythe five determinants: knowledge and awareness of tourism stakeholders and policy makers,technology, tourism infrastructure, institutions and economic resources of the tourism sector(cf. Fig. 2). The goals of the assessment are to produce systemic knowledge about thetourism sector’s specific adaptive capacity in the European Alps and to produce transfor-mation knowledge for improving adaptation within the tourism sector (for details cf. Kruseet al. 2011, 2013).
Fig. 2 Determinants and dimensions of adaptive capacity
Mitig Adapt Strateg Glob Change (2015) 20:99–120 107
22

+ 23

Regional Assessment Determinants Dimensions Determinants Alpine Tourism
Educational commitment
Knowledge and awareness AWARENESS Knowledge and
awareness
Problem awareness; attitudes to climate change
Computer skills Access to information
Attitudes towards climate change
Knowledge gaps/missing information
Resources of technology
Technology
ABILITY
Demand for further education/training
Capacity to undertake research
Technology Capacity for research and development
Patents
Transport
Infrastructure Infrastructure
Natural assets/ attractiveness of natural env.
Water exploitation Cultural assets/ attractiveness of heritage
Hospital (beds and doctors)
Government effectiveness
Institutions
ACTION
Institutions
Structure of tourism sector
Democracy Regional cooperation
National adaptation strategies
Income per capita
Economic resources
Economic resources
Diversity of sector
Long term unemployment Capacity for innovation
Age dependency ratio

+ Sustainability Appraisal of London’s Climate Change Adaptation Strategy 2010 - Summary of the findings on flooding policy
February 2010
Draft Climate Change Adaptation Strategy – Sustainability Appraisal Report
134 Collingwood Environmental Planning with the Centre for Research in
Environment and Health
SA Report Part B:
Appraisal
Table 19: Summary of appraisal findings – flooding
Sustainability Appraisal Objectives
1. G
over
nanc
e
2. E
duca
tion
and
Awar
enes
s
3. H
ealth
and
Wel
l-bei
ng
4. E
qual
ity a
nd D
iver
sity
5. S
afet
y an
d Se
curit
y
6. L
ivea
bilit
y an
d Pl
ace
7. A
cces
sibi
lity
and
Avai
labi
lity
8. L
ands
cape
, His
toric
an
d Cu
ltura
l En
viro
nmen
t
9. B
iodi
vers
ity
10. A
ir Q
ualit
y
11. C
limat
e Ch
ange
40
12. W
ater
Qua
lity
and
Wat
er R
esou
rces
41
13 W
aste
Man
agem
ent
14 E
cono
my
Impacts of climate change in London (predicted effects of climate change on sustainability without the draft Strategy but with existing / planned adaptation i.e. Business as usual alternative)
Medium-term (2020s) + +/++ - - -/0 -/0 - -/0 -? 0? - -? - - -/+ -? Long-term (2050+) + ++? --? -/--? --? -/--? --? -/--? --? -? --? --? -? --? -? --? Impacts of the Draft Strategy in isolation (predicted effects on sustainability of the draft Strategy as an initial framework for adaptation)
Medium-term (2020s) +/++ + 0/+ 0/+ + -/+ 0/+ -/+ -/+ 0 -/0 + 0/-/+ 0/+ + 0/+? Long-term (2050+) +? 0/+ 0/+ 0/+ 0/+ -/+ 0/+ -/+ -/+? 0 - + 0/-/+ + + 0/+? Impacts of climate change in London with the draft Strategy (predicted effects of climate change on sustainability with the draft Strategy and existing / planned adaptation)
Medium-term (2020s) +/++ +/++ - - 0/+ -/0 - -/0 -? 0? - -? - - +/0 -? Long-term (2050+) +/++? ++? --? -/--? --? -/--? --? -/--? --? -? --? --? -? --? -/0 --? Key to effects: Major positive: ++ Minor positive: + Neutral: 0 Minor negative: - Major negative: - - Uncertain:? Mixed: -/+
6.35 Policy 1 and associated actions 1 – 9 are predicted to have generally positive effects on the
SA objectives, with only a few minor negative effects, or mixed positive and negative effects predicted. With the exception of governance, the effects predicted are all considered likely to be minor in significance. This reflects the preparatory nature of the flooding actions, as indicated in the categorisation of actions included in Table 18.
6.36 Potential positive effects predicted include:
A number of the actions seek to encourage or facilitate collaborative working, communication and improved information (e.g. mapping), all of which are predicted to improve the ability of organisations with responsibility for flood risk management to work together, thus improving governance of flood risk.
Positive effects are predicted on education and awareness due to the potential influence of a number of the actions relating to increasing knowledge and information of flooding and flood risk in London, as well as specific actions (8 and 9) directly seeking to raise awareness of flood risks and develop community flood risk plans.
Minor positive effects are predicted in relation to a number of SA objectives due to the policy and action’s focus on reducing and managing flood risk. For example, positive effects are predicted on health and wellbeing, due to the potential reduction in the negative health effects of flood events (where risks are reduced) as well as a potential reduction in the occurrence of mental health problems associated with flood events and recovery from flooding.
40 Objective split between (11.1) mitigation and (11.2) adaptation to Climate Change. 41 Objective split between (12.1) water quality and (12.2) water resources.
25

+ Sustainability Appraisal of London’s Climate Change Adaptation Strategy 2010 – What difference does it make?
February 2010
Draft Climate Change Adaptation Strategy – Sustainability Appraisal Report
165 Collingwood Environmental Planning with the Centre for Research in
Environment and Health
SA Report Part B:
Appraisal
Element of draft Strategy Key changes resulting from the Sustainability Appraisal process
communities added. Actions Encouragement to cover all the dimensions of the Prevent, Prepare, Respond, Recover
adaptation framework in the actions which led to several additions. Comments and recommendations led to the amendment and addition of some specific
actions, such as: o Inclusion of an action seeking the development of community flood plans /
emergency plans. o The inclusion of an action relating to water neutrality under policy 2. o Addition of text referring to regular review of the Mayor’s Water Strategy under
Policy 2. Cross-cutting actions included in the draft Strategy were not included in previous drafts.
Some of these address issues raised by the SA, in particular: Action 32 relating to the role of the insurance industry in adaptation. Action 31 encouraging businesses and the private sector to take climate change into
account in risk management and planning. Action 33 relating to the role of TfL and importance of the need for adaptation action
related to infrastructure.
26
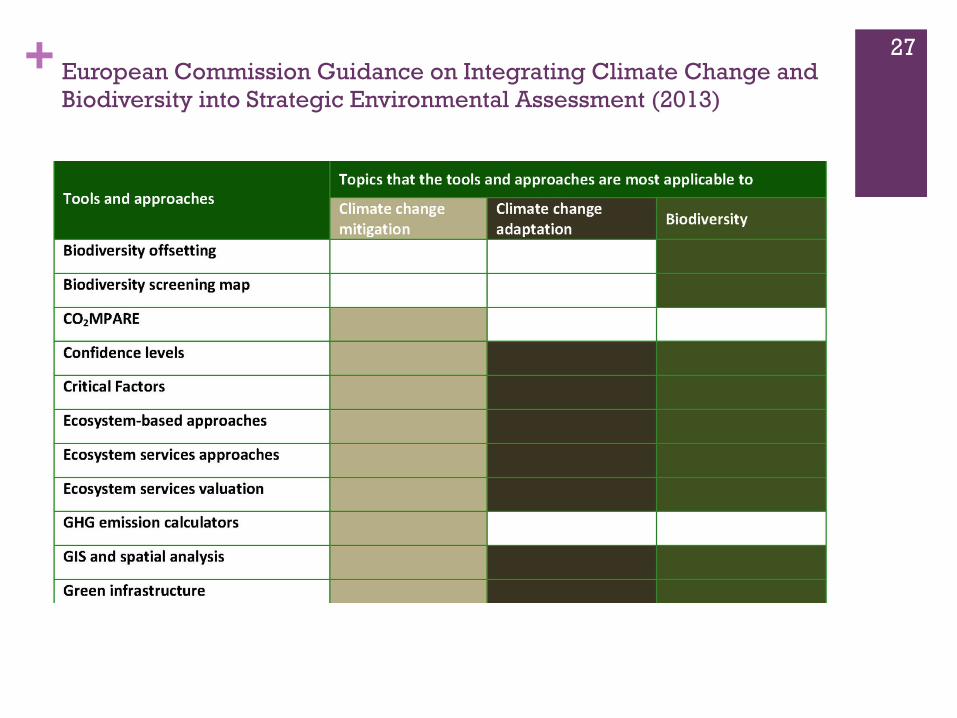
+ European Commission Guidance on Integrating Climate Change and Biodiversity into Strategic Environmental Assessment (2013)
27

+ European Commission Guidance on Integrating Climate Change and Biodiversity into Strategic Environmental Assessment (2013): examples of alternatives and mitigation measures related to adaptation
44 Guidance on integrating climate change and biodiversity into SEA
Table 11: Examples of alternatives and mitigation measures related to climate change mitigation
Main concerns related to: Examples of alternatives and/or mitigation measures at the assessment stage
Energy demand in industry x Reducing demand for energy (electricity or fuel) in industry x Alternative low-carbon sources (onsite or through specific low carbon energy supplier) x Targeted support to businesses engaged in eco-innovations, low-carbon business and low-
carbon technologies x Potential synergies between adaptation and GHG reduction
Energy demand in housing and construction
x Improve the energy performance of buildings x Alternative low carbon sources (onsite or through specific low carbon energy supplier) x Potential synergies between adaptation and GHG reduction
GHG emissions in agriculture
x Reducing the use of nitrogen in fertilising practices x Managing methane (enteric and manure) x Protecting natural carbon sinks, such as peat soils x Potential synergies between adaptation and GHG reduction x Harvesting methane emissions for biogas production
GHG emissions in waste management
x Consider ways in which the PP can increase waste prevention, re-use and recycling, particularly to divert waste from landfill
x Consider ways of producing energy through waste incineration or producing biogas from wastewater and sludge
x Alternative low carbon sources (onsite or through specific low carbon energy supplier) x Potential synergies between adaptation and GHG reduction
Travel patterns and GHG emissions from transport
x Promote PP patterns that reduce the need to travel x Support car-free PP x Encourage walking and cycling x Encourage public transport x Provide transport choices to encourage a modal shift to cleaner modes (e.g. from cars to
trains), such as an effective and integrated public transport system x Transport demand management schemes x Encourage car sharing x Prioritise high density urban PPs (smaller housing at higher density) and reuse of brownfie
land GHG emissions from energy production
x Generic recommendations are intentionally not provided as these are context-specific, depending upon the energy production capacity and energy supply sources of the area in question
x Potential synergies between adaptation and GHG reduction Forests and biodiversity x Investment in wetlands to support carbon sequestration to offset PP's GHG emissions.
Table 12: Examples of alternatives and mitigation measures related to climate change adaptation
Main concerns related to: Examples of alternatives and/or mitigation measures at the assessment stage
Heat waves x Avoid development patterns that fragment habitat corridors or, for linear infrastructures, make sure that habitat continuity is restored in the most sensitive areas
x Improvements in urban structure — expansion of green areas, open water surfaces and wind paths (along rivers and waterfronts) in urban areas to reduce the possible heat island effect
x Encourage greater use of green roofs x Reduce man-made exhausts during heat waves (industries, and car traffic) x Awareness-raising about risks associated with heat waves and action to reduce them x Heat wave early warning systems and response plans x Potential synergies between adaptation and GHG reduction
Droughts x Encourage water efficiency measures x Explore efficient use/re-use of rainwater and grey water x Restrictions on excessive/non-essential use water use during droughts (depending on
their severity) x Minimise low flow withdrawals x Restrictions for effluent discharges into water bodies during droughts x Maintain and improve the resilience of watersheds and aquatic ecosystems by
implementing practices that protect, maintain, and restore watershed processes and services
28

+
Nay, adaptation must be about strengthening adaptive capacity in spatially organized governance processes, mustn’t it?

+Anticipatory Governance
n developing a range of possible scenarios – none of which can serve all planning purposes
n shaping very flexible adaptation strategies
n collapsing monitoring and action in a flow of reflective practices
the need for longer-term perspectives and persistent uncertainties calls for (Fuerth, 2009; Quay, 2010):
30

+Anticipatory Governance
n open strategies (focussed on preserving future options)
n contingency plans, to respond to specific scenarios (including the worst ones)
n no-regrets strategies (near-term actions with minimal losses if discontinued)
Anticipatory governance echoes strategic planning, with its stress on robust actions (Khakee, 1998)
... would entail creating flexible action packages (Fuerth, 2009; Quay, 2010:
31

+ Anticipatory Governance: flexible adaptation pathways for Thames Estuary 2100
32

+ Anticipatory Governance: incremental vs transformative change in action-learning cycles
33

+ Reflecting on the role of evaluation in planning for climate change adaptive capacity-building
n Climate change policy bringing about more planning and further diversified evaluation
n No really “new” concepts yet, but rather a push towards incrementalism (“muddling through”) and strategic approaches
n Three fascinating research perspectives: n longer and twisted planning timelines (flexible pathways)
n growing attention to social, cultural and political contexts in shaping adaptation policy adoption, diffusion and mobility
n harnessing evaluation “bridging potential” in highly fragmented planning landscapes
34

+ Reflecting on the role of evaluation in planning for climate change adaptive capacity-building
n Climate change within a broader shift towards the “risk society” (Beck, 1999)
n The social construction of Nature is shifting (Davoudi, 2014) from an asset and a context for development (sustainability), to a threat to society (climate risk)
n Cf. PlaNYC, 2007 (137): “The sobering images of Hurricane Katrina still haunt us - a testament to our vulnerability in the face of nature’s ferocity”
35

+Thank you! Alessandro Bonifazi - Independent researcher/Politecnico di Bari: [email protected] Paola Gazzola - Global Urban Research Unit, School of Architecture, Planning and Landscape, Newcastle University: [email protected]
35