BOND Implementation and Evaluation Process … 24d...BOND Implementation and Evaluation Process...
101
BOND Implementation and Evaluation Process Study Report Deliverable 24d Submitted To: Social Security Administration Attn: Ms. Joyanne Cobb Office of Research, Demonstrations and Employment Support (ORDES) 500 E Street, SW 9 th Floor, RM #905 Washington, DC 20254 Contract No. SS00-10-60011 Prepared by Michelle Derr Denise Hoffman Jillian Berk Ann Person David Stapleton Sarah Croake Christopher Jones Jonathan McCay February 12, 2015
Transcript of BOND Implementation and Evaluation Process … 24d...BOND Implementation and Evaluation Process...
BOND Implementationand Evaluation
Process Study Report Deliverable 24d
Submitted To: Social Security Administration Attn: Ms. Joyanne Cobb Office of Research, Demonstrations and Employment Support (ORDES) 500 E Street, SW 9th Floor, RM #905 Washington, DC 20254
Contract No. SS00-10-60011
Prepared by Michelle Derr Denise Hoffman Jillian Berk Ann Person David Stapleton Sarah Croake Christopher Jones Jonathan McCay
February 12, 2015
BOND Implementation and Evaluation Contract No. SS00-10-60011
Abt Associates Inc. Process Study Report i
Table of Contents
Acronyms Used in This Report ................................................................................................................. iii
Terminology................................................................................................................................................ iv
Executive Summary .................................................................................................................................... v
1. Introduction ....................................................................................................................................... 1 1.1. The BOND Policy Test ............................................................................................................. 1 1.2. The BOND Evaluation Overview and Process Study Component ............................................ 4 1.3. Findings to Date on the Implementation of BOND ................................................................... 5
1.3.1. Early Implementation Findings for Stage 1 .................................................................. 5 1.3.2. Early Implementation Findings for Stage 2 .................................................................. 7
1.4. The Current Report .................................................................................................................. 10 1.4.1. Detailed Data Sources ................................................................................................ 10 1.4.2. Data Analysis ............................................................................................................. 11 1.4.3. Outline of Remaining Chapters .................................................................................. 11
2. BOND Study Sites and Disability Service Environment ............................................................. 13 2.1. BOND Study Sites ................................................................................................................... 13 2.2. Geographic Characteristics ...................................................................................................... 13 2.3. Economic Indicators ................................................................................................................ 14 2.4. Number and Staffing Configuration of BOND Benefits Counseling Providers ...................... 15 2.5. Number of BOND Subjects ..................................................................................................... 16 2.6. Availability and Use of Employment Services and Other Work-Focused, Disability-
Related Resources ................................................................................................................... 18 2.7. Non-BOND SSDI Benefits Counseling Services .................................................................... 20
2.7.1. Discontinuation and Refunding of WIPA .................................................................. 21 2.7.2. Other Non-BOND Benefits Counseling ..................................................................... 22
2.8. Conclusion ............................................................................................................................... 23
3. BOND Outreach and Enrollment .................................................................................................. 24 3.1. Introduction ............................................................................................................................. 24 3.2. Stage 1 Outreach and Engagement with the Demonstration ................................................... 24
3.2.1. Stage 1 Implementation and Outcomes (2011) .......................................................... 24 3.2.2. Additional T1 Outreach Efforts (2012 and 2013−2014) ............................................ 25
3.3. Stage 2 Outreach and Enrollment ............................................................................................ 30 3.4. Findings Across Stages 1 and 2 ............................................................................................... 31 3.5. Conclusion ............................................................................................................................... 32
4. BOND Benefits Counseling ............................................................................................................ 33 4.1. Design of BOND Counseling .................................................................................................. 33 4.2. Caseloads ................................................................................................................................. 34 4.3. WIC and EWIC Counseling Services...................................................................................... 38 4.4. BOND Post-Entitlement Services ........................................................................................... 43 4.5. Conclusion ............................................................................................................................... 43
BOND Implementation and Evaluation Contract No. SS00-10-60011
Abt Associates Inc. Process Study Report ii
5. Using the Benefit Offset .................................................................................................................. 45 5.1. Introduction ............................................................................................................................. 45 5.2. The Benefit Adjustment Process ............................................................................................. 46
5.2.1. Two Ways to Initiate the Process: Front-Door Versus Back-Door Benefit Adjustment ................................................................................................................. 46
5.2.2. Steps in the Benefit Adjustment Process .................................................................... 47 5.3. Statistics on Offset Use and Benefit Adjustment .................................................................... 49 5.4. Implementation of the Offset Process ..................................................................................... 53
5.4.1. Offset Eligibility (Step 1) ........................................................................................... 54 5.4.2. Work CDR Completion and Processing (Step 2) ....................................................... 55 5.4.3. Completion of an AEE (Step 3) ................................................................................. 59 5.4.4. Initial Benefit Adjustment (Step 4) ............................................................................ 60
5.5. Delayed Benefit Adjustment and Potential Effects ................................................................. 61 5.5.1. Delays with Benefit Adjustment ................................................................................ 61 5.5.2. Improper Payments .................................................................................................... 62 5.5.3. Improper Payments Might Influence Beneficiaries’ Perceptions and Behaviors ....... 64
5.6. Conclusion ............................................................................................................................... 66
6. Conclusion ........................................................................................................................................ 67 6.1. Additional Outreach to T1 Subjects ........................................................................................ 67 6.2. Distinctions Between Services Available to T21, T22, and Control Group Beneficiaries ...... 67 6.3. Offset Use ................................................................................................................................ 68 6.4. Delays with Benefit Adjustment and Improper Payments ...................................................... 69 6.5. Future Process Analyses .......................................................................................................... 70
References .................................................................................................................................................. 71
Appendix A. Key Dates in the Time Line of BOND Implementation ............................................. A-1
Appendix B. Process Study Site Visit Topics and Respondents ...................................................... B-1
Appendix C. Site Summaries .............................................................................................................. C-1
Appendix D. Number of BOND Subjects .......................................................................................... D-1
Appendix E. SSDI and BOND Primer .............................................................................................. E-1 SSDI Under Current Law ................................................................................................................ E-1 The BOND Innovations .................................................................................................................. E-2
BOND Implementation and Evaluation Contract No. SS00-10-60011
Abt Associates Inc. Process Study Report iii
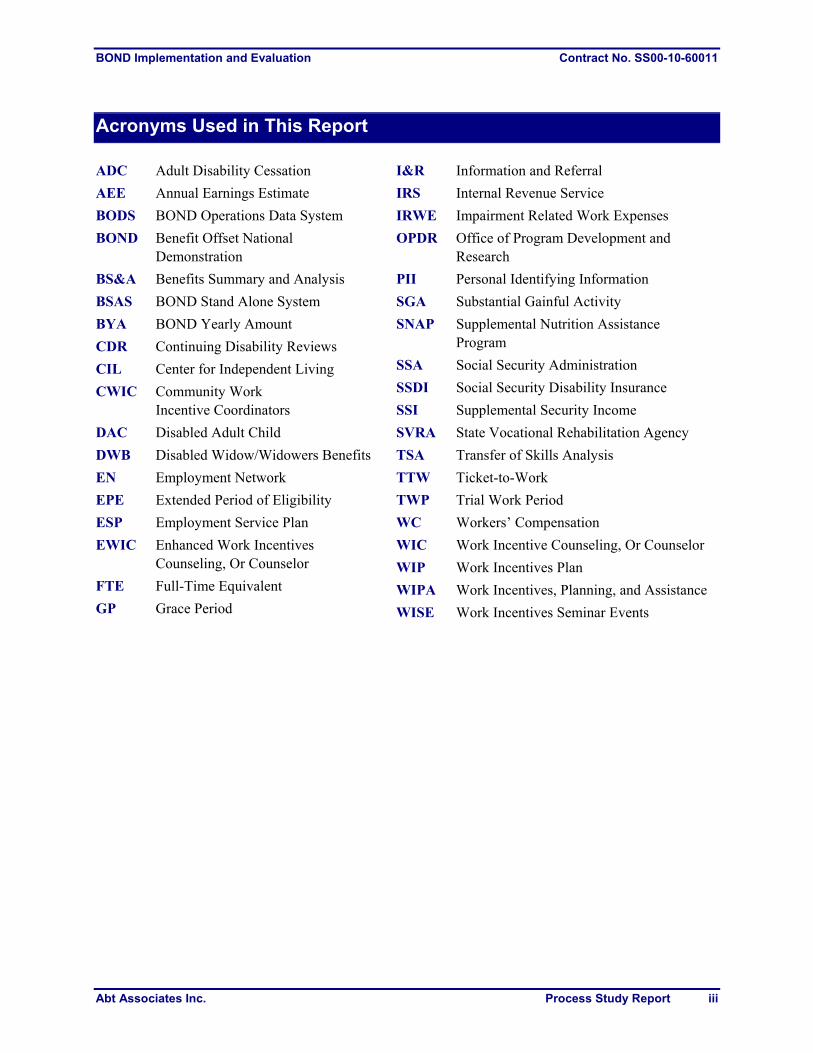
Acronyms Used in This Report
ADC Adult Disability Cessation
AEE Annual Earnings Estimate
BODS BOND Operations Data System
BOND Benefit Offset National Demonstration
BS&A Benefits Summary and Analysis
BSAS BOND Stand Alone System
BYA BOND Yearly Amount
CDR Continuing Disability Reviews
CIL Center for Independent Living
CWIC Community Work Incentive Coordinators
DAC Disabled Adult Child
DWB Disabled Widow/Widowers Benefits
EN Employment Network
EPE Extended Period of Eligibility
ESP Employment Service Plan
EWIC Enhanced Work Incentives Counseling, Or Counselor
FTE Full-Time Equivalent
GP Grace Period
I&R Information and Referral
IRS Internal Revenue Service
IRWE Impairment Related Work Expenses
OPDR Office of Program Development and Research
PII Personal Identifying Information
SGA Substantial Gainful Activity
SNAP Supplemental Nutrition Assistance Program
SSA Social Security Administration
SSDI Social Security Disability Insurance
SSI Supplemental Security Income
SVRA State Vocational Rehabilitation Agency
TSA Transfer of Skills Analysis
TTW Ticket-to-Work
TWP Trial Work Period
WC Workers’ Compensation
WIC Work Incentive Counseling, Or Counselor
WIP Work Incentives Plan
WIPA Work Incentives, Planning, and Assistance
WISE Work Incentives Seminar Events
BOND Implementation and Evaluation Contract No. SS00-10-60011
Abt Associates Inc. Process Study Report iv
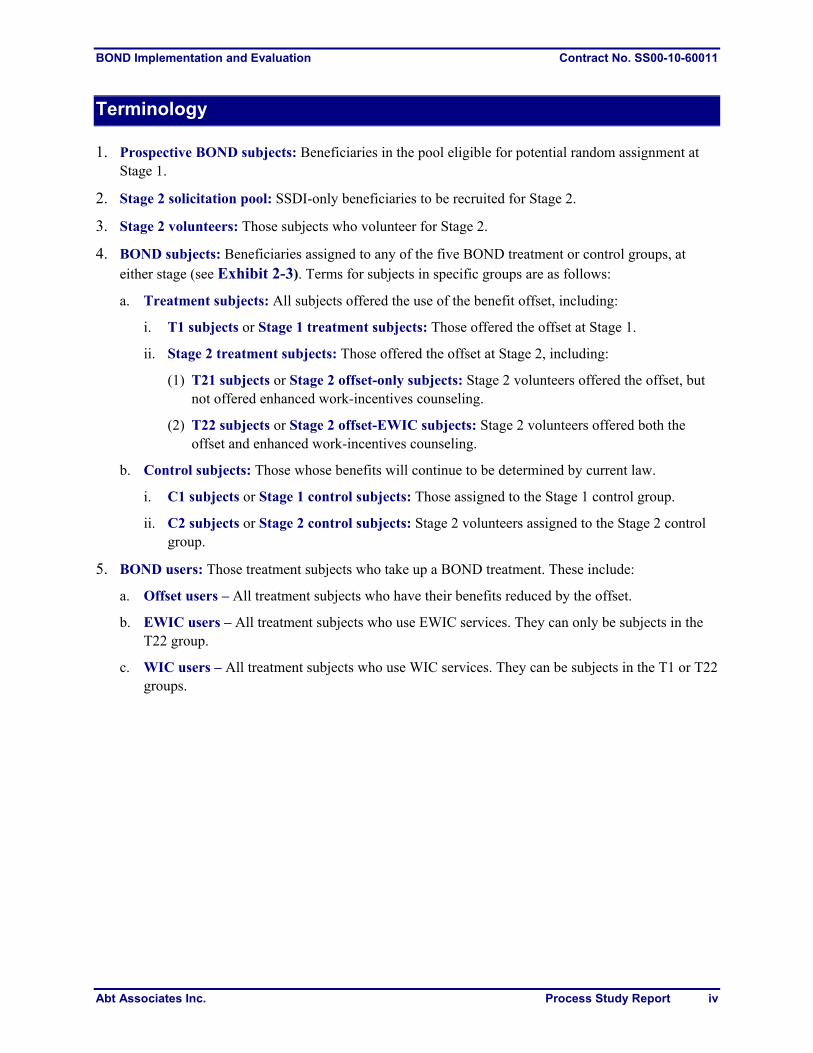
Terminology
1. Prospective BOND subjects: Beneficiaries in the pool eligible for potential random assignment at Stage 1.
2. Stage 2 solicitation pool: SSDI-only beneficiaries to be recruited for Stage 2.
3. Stage 2 volunteers: Those subjects who volunteer for Stage 2.
4. BOND subjects: Beneficiaries assigned to any of the five BOND treatment or control groups, at either stage (see Exhibit 2-3). Terms for subjects in specific groups are as follows:
a. Treatment subjects: All subjects offered the use of the benefit offset, including:
i. T1 subjects or Stage 1 treatment subjects: Those offered the offset at Stage 1.
ii. Stage 2 treatment subjects: Those offered the offset at Stage 2, including:
(1) T21 subjects or Stage 2 offset-only subjects: Stage 2 volunteers offered the offset, but not offered enhanced work-incentives counseling.
(2) T22 subjects or Stage 2 offset-EWIC subjects: Stage 2 volunteers offered both the offset and enhanced work-incentives counseling.
b. Control subjects: Those whose benefits will continue to be determined by current law.
i. C1 subjects or Stage 1 control subjects: Those assigned to the Stage 1 control group.
ii. C2 subjects or Stage 2 control subjects: Stage 2 volunteers assigned to the Stage 2 control group.
5. BOND users: Those treatment subjects who take up a BOND treatment. These include:
a. Offset users – All treatment subjects who have their benefits reduced by the offset.
b. EWIC users – All treatment subjects who use EWIC services. They can only be subjects in the T22 group.
c. WIC users – All treatment subjects who use WIC services. They can be subjects in the T1 or T22 groups.
BOND Implementation and Evaluation Contract No. SS00-10-60011
Abt Associates Inc. Process Study Report v
Executive Summary
As part of the Ticket to Work (TTW) and Work Incentives Improvement Act of 1999, Congress directed the Social Security Administration (SSA) to test alternative Social Security Disability Insurance (SSDI) work rules designed to increase the incentive for SSDI beneficiaries to work and reduce their reliance on benefits. In response, SSA has undertaken the Benefit Offset National Demonstration (BOND), a random assignment test of variants of SSDI program rules governing work and other supports. The BOND project includes two stages. Stage 1 is designed to support an evaluation of how a national benefit offset would affect earnings and program outcomes for the entire SSDI population. Stage 2 is designed to learn more about impacts on those most likely to use the offset (recruited and informed volunteers) and determine the extent to which significant enhancements to counseling services affect impacts. The overarching objectives of the process study are to provide a detailed description of each of the BOND sites and to clearly document the program intervention, creating a foundation for interpreting estimated impacts and assessing the fidelity of the implementation of BOND. This report summarizes the findings of the process analysis to date, focusing primarily on the implementation of BOND in each of the BOND sites during the 2013 calendar year. The findings build upon earlier documents that summarize the initial implementation across the study sites for Stages 1 and 2 (Wittenburg et al. 2012 and Gubits et al. 2013, respectively). The process evaluation employs a mix of qualitative and quantitative data sources to address five broad research questions:
1. How was the intervention implemented for Stage 1 and Stage 2? How did the implementation evolve over time? (All Chapters)
2. Were the recruitment and enrollment processes for Stages 1 and 2 implemented as designed? If significant deviations occurred, why did they occur? (Chapter 3)
3. Were Work Incentives Counseling (WIC) and Enhanced Work Incentives Counseling (EWIC) services implemented as designed? To what extent did EWIC services differ from WIC services? (Chapter 4)
4. Were the processes for reporting earnings, determining Trial Work Period (TWP) completion, and making benefit adjustments for Stages 1 and 2 implemented as designed? How well did they perform? (Chapter 5)
5. What are the likely implications for demonstration outcomes? What are the lessons for national implementation of a benefit offset? (Chapter 6)
Primary data sources included site visits to each of the 10 BOND study sites, focus groups with beneficiaries, and administrative and survey data. The main findings in this report are as follows. First, follow-up Stage 1 treatment (T1) outreach efforts, designed to address initial concerns about limited awareness or understanding of the offset opportunity,

BOND Implementation and Evaluation Contract No. SS00-10-60011
Abt Associates Inc. Process Study Report vi
have contributed to a demonstrable increase in use of the demonstration’s services (Chapter 3). Second, as planned, there are clear distinctions between WIC and EWIC services (Chapter 4). Third, as of the end of 2013 the percentage of treatment subjects who have used the offset had reached 1.5 percent for Stage 1 and 7 percent for Stage 2, and is growing steadily (Chapter 5). Fourth, reflecting large backlogs in SSA processing of earnings information for beneficiaries who were working before the start of BOND, resource constraints, and initial technical issues with the processing of benefit adjustments, delays in the adjustment of benefits under the offset were lengthy in the first two years of BOND, but were substantially shorter by early 2014 (Chapter 5). Fifth, delays in benefit adjustments can lead to improper payments, which have been problematic for some treatment subjects. Presumably, however, they are less problematic for treatment subjects than for control subjects because the offset’s benefit formula is advantageous relative to current law. Chapter 6 provides a detailed summary of each of these evaluation findings and a description of future process study plans. .
BOND Implementation and Evaluation Contract No. SS00-10-60011
Abt Associates Inc. Process Study Report 1
1. Introduction
As part of the Ticket to Work and Work Incentives Improvement Act of 1999, Congress mandated that the Social Security Administration (SSA) test alternative Social Security Disability Insurance (SSDI) work rules designed to increase the incentive for SSDI beneficiaries to work and reduce their reliance on benefits. In response, SSA has undertaken the Benefit Offset National Demonstration (BOND), a random assignment test of variants of SSDI program rules governing work and other supports. SSA, in conjunction with Abt Associates and its partners, developed the infrastructure and supports required to implement BOND. The BOND project includes two stages. Stage 1 is designed to examine how a national benefit offset would affect earnings and program outcomes for the entire SSDI population. Stage 2 is designed to learn more about impacts on those most likely to use the offset (recruited and informed volunteers) and determine the extent to which significant enhancements to counseling services affect impacts. The overarching objectives of the process study are to provide a detailed description of each of the BOND sites and to clearly document the program intervention, creating a foundation for interpreting estimated impacts and assessing the fidelity of the implementation of BOND. This report serves two primary purposes—to document the implementation of BOND since its inception within and across 10 study sites and to assess the fidelity of the implementation compared to the final design. The report focuses on lessons from the experiences of the centralized and site-level staff implementing BOND and the SSDI beneficiaries influenced by it. The report focuses on four topics: (1) a description of BOND, the study sites, and the service environment; (2) demonstration outreach and enrollment; (3) BOND benefits counseling; and (4) the conditions required for benefit offset use and the process for the adjustment of benefits under the offset rules. We begin this chapter by providing an overview of the BOND policy test, followed by a description of the BOND evaluation. We then summarize the primary findings to date on the implementation of BOND as captured in previous reports. Finally, we describe the data collection efforts for this report. 1.1. The BOND Policy Test
Under current program rules, SSDI beneficiaries lose all SSDI benefits after a sustained period of substantial earnings and risk potential loss of other (non-SSDI) benefits.1 Specifically, SSDI benefits are lost if a beneficiary’s countable monthly earnings exceed the monthly Substantial Gainful Activity (SGA) amount after completing a nine-month Trial Work Period (TWP) and a three-month grace period (GP). In 2013, the SGA amount was $1,040 per month for non-blind beneficiaries and $1,740 per month for blind beneficiaries. The complete loss of benefits for sustained earnings in excess of the SGA amount is sometimes called the cash cliff. The cash cliff likely discourages some beneficiaries from working at all
1 Other benefits include Medicare for those on the rolls for at least 24 months. These benefits are extended for a
lengthy period following suspension of SSDI benefits, but not indefinitely. Some SSDI beneficiaries also receive Supplemental Security Income (SSI), Medicaid, or other public or private benefits that can be reduced or eliminated as earnings increase.
BOND Implementation and Evaluation Contract No. SS00-10-60011
Abt Associates Inc. Process Study Report 2
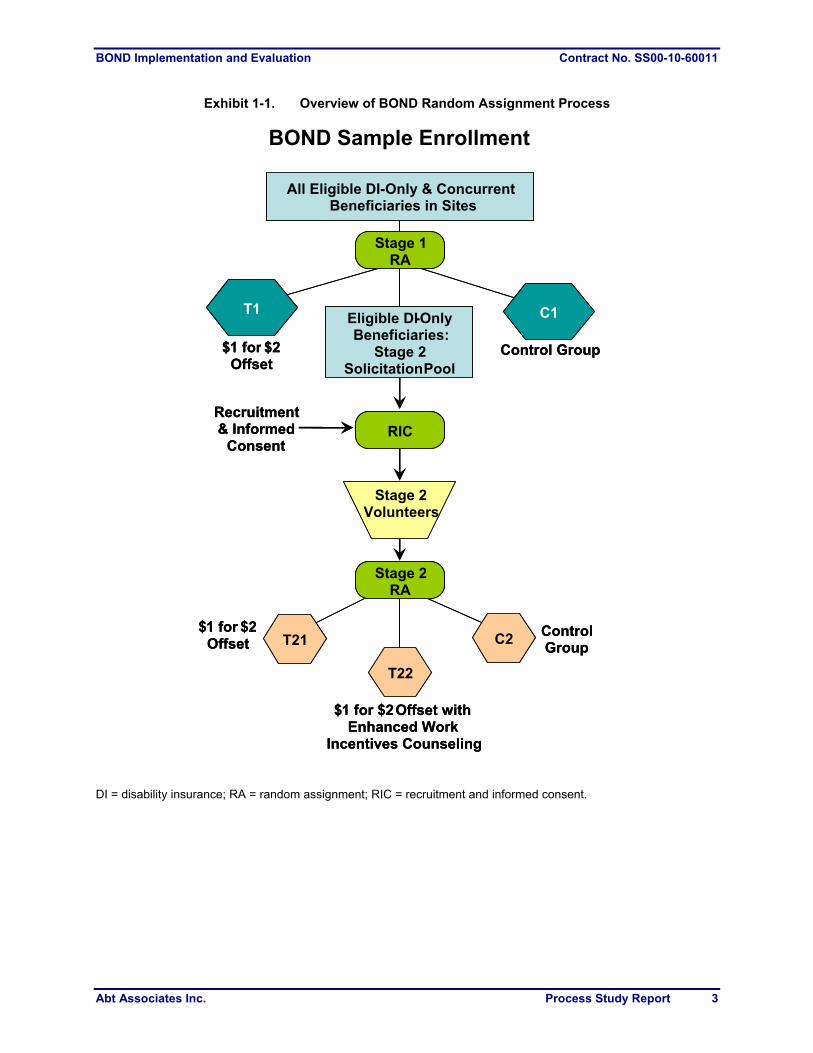
and encourages those who work and could earn above the SGA level to keep their earnings below that level. BOND replaces the cash cliff with a ramp (benefit offset), with the policy objective of encouraging beneficiaries who can work above the SGA level to increase their earnings and reduce their reliance on benefits. More specifically, the benefit offset is expected to increase the earnings of those who otherwise might not work at all, or would earn less than the SGA amount. If such individuals engage in SGA under the benefit offset, their benefits ultimately will be reduced. Offsetting the possible reduction in SSDI benefit outlays are benefits paid under BOND to those who would have had earnings above the SGA amount in the absence of BOND. Thus, the direction of the net impact on mean earnings and benefits of all beneficiaries will depend on the size of the impacts for beneficiaries who would not engage in SGA under current law, relative to the size of the impacts for those who would. Those in the latter group lose their benefits entirely under current law, whereas under the benefit offset, many—perhaps most—will be eligible for a reduced SSDI benefit. BOND also changes the administrative processes to adjust benefits, including replacing the monthly SGA calculation with an annualized measure of SGA, referred to as the BOND Yearly Amount (BYA). BYA is equal to 12 times the monthly SGA amount (in 2013, $12,480 for non-blind and $20,280 for blind Stage 1 treatment [T1] subjects). The benefit offset reduces benefits by $1 for every $2 in countable annual earnings in excess of the BYA following the completion of the GP. It can also be helpful to beneficiaries who have variable monthly earnings. SSA continues to pay benefits monthly under BOND, but the monthly payment amount is based on expected annual earnings. In the following calendar year, SSA reconciles payments to actual countable earnings, based on information provided by the Internal Revenue Service (IRS), documentation provided by the beneficiary, or both. Treatment group beneficiaries eligible for the offset can use it for a 60-month participation period, which begins the month after random assignment for those who completed the TWP before that point or in the month after a given beneficiary’s TWP ends, provided that the TWP is completed by September 30, 2017. Those who fail to complete their TWP by that date will lose their opportunity to use the offset. Benefits cannot be permanently terminated because of work during the participation period, even if benefits fall to zero because of earnings. Current rules will apply at the end of the participation period; the benefits of those engaged in SGA after this point will be terminated when any remaining GP months have been used. As noted earlier, BOND includes two stages—Stages 1 and 2—that test the benefit offset’s impact on the overall SSDI population and on those who have signaled interest in employment (see Exhibit 1-1). Stage 1 was designed to examine how a national benefit offset and changes to ancillary supports would affect earnings and program outcomes for the entire SSDI population. In Stage 1, the demonstration randomly assigned beneficiaries to a treatment group receiving the offset (T1 subjects) or to a control group continuing under standard rules (C1 subjects). By design, T1 and C1 subjects were to have access to essentially comparable levels of counseling: C1 subjects were to have access to counseling under an existing program—Work Incentives Planning and Assistance (WIPA)—whereas treatment subjects were to have access to similar counseling services, customized to the special rules that apply to their benefits—Work Incentives Counseling (WIC). The two groups should be identical except for the BOND intervention, so that any statistically significant differences in outcomes between T1 and C1 subjects can confidently be attributed to the intervention—the basic impact measurement strategy in a randomized experiment.
BOND Implementation and Evaluation Contract No. SS00-10-60011
Abt Associates Inc. Process Study Report 3
Exhibit 1-1. Overview of BOND Random Assignment Process
DI = disability insurance; RA = random assignment; RIC = recruitment and informed consent.
T1 C1
RIC
All Eligible DI-Only & ConcurrentBeneficiaries in Sites
Stage 2Volunteers
$ 1 for $2Offset
Recruitment& Informed
Consent
$1 for $2 Offset withEnhanced Work
Incentives Counseling
Control Group
Control Group
Stage 1 RA
$1 for $2 Offset
Eligible DI-Only Beneficiaries:
Stage 2 SolicitationPool
Stage 2 RA
T22
C2T21
BOND Sample Enrollment
T1 C1
RIC
All Eligible DI-Only & Concurrent Beneficiaries in Sites
Stage 2Volunteers
$ 1 for $2Offset
Recruitment& Informed
Consent
$1 for $2 Offset withEnhanced Work
Incentives Counseling
Control Group
Control Group
Stage 1 RA
$1 for $2 Offset
Eligible DI-Only Beneficiaries:
Stage 2 SolicitationPool
Stage 2 RA
T22
C2T21
BOND Implementation and Evaluation Contract No. SS00-10-60011
Abt Associates Inc. Process Study Report 4
Stage 2 also uses an experimental design to learn about the impacts of the benefit offset on those beneficiaries most likely to use it—informed and recruited volunteers—and to determine the marginal effects of the delivery of more intensive Enhanced Work Incentives Counseling (EWIC) services relative to WIC services. This requires three-way random assignment into an offset-plus-WIC group (T21 subjects), an offset-plus-EWIC group (T22 subjects), and a current-law benefits group (C2 subjects). Concurrent beneficiaries—SSDI beneficiaries who also were receiving Supplemental Security Income (SSI) at the time of random assignment—were included in Stage 1 but excluded from Stage 2, because the interaction between SSI and SSDI diminishes the value of the SSDI benefit offset.2 The final Stage 1 analysis sample contains a total of 968,713 subjects, spread across T1 (77,115) and C1 (891,598).3 The Stage 2 sample consists of 12,954 beneficiaries: 4,936 T21; 3,089 T22; and 4,929 C2. 1.2. The BOND Evaluation Overview and Process Study Component
Abt Associates, in partnership with Mathematica Policy Research, is conducting a comprehensive evaluation of the BOND interventions, including studies of beneficiary participation, demonstration implementation, impacts on participants, and overall social costs and benefits of the initiative. The evaluation also will include cross-cutting analyses that combine findings from these four components which, taken together, deepen our understanding of how the BOND interventions affected beneficiaries. Initial findings from the process and participation analysis have been published in previous reports (Wittenburg et al. 2012 for Stage 1 and Gubits et al. 2013 for Stage 2). Stage 1 estimates for impacts on earnings and benefit outcomes in 2011 and 2012 are reported for Stage 1 in Stapleton et al. (2013, 2014) and for Stage 2 in Gubits et al. (2014). The process study is designed to evaluate the implementation of BOND within and across the study sites over time and to assess the fidelity of the implementation compared to the original design. It includes seven rounds of data collection activities over the course of the demonstration and relies on multiple data sources, including feedback from beneficiaries. As described in the Evaluation Analysis Plan (Bell et al. 2011), the process study employs a mix of qualitative and quantitative data sources to address five broad research questions:4
1. How was the intervention implemented for Stage 1 and Stage 2? How did the implementation evolve over time?
2. Were the recruitment and enrollment processes for Stages 1 and 2 implemented as designed? If significant deviations occurred, why did they occur?
3. Were WIC and EWIC services implemented as designed? To what extent did EWIC services differ from WIC services?
4. Were the processes for reporting earnings, determining TWP completion, and making benefit adjustments for Stages 1 and 2 implemented as designed? How well did they perform?
2 See Bell et al. (2011) for more details on the random assignment process and reasons for excluding concurrent
beneficiaries from Stage 2 but not Stage 1.
3 See Stapleton et al. (2014) for details of the sample and initial impact estimates.
4 The research questions have been slightly modified from the BOND Evaluation Analysis Plan (Bell et al. 2011).

BOND Implementation and Evaluation Contract No. SS00-10-60011
Abt Associates Inc. Process Study Report 5
5. What are the likely implications for demonstration outcomes? What are the lessons for national implementation of a benefit offset?
BOND is being conducted in 10 demonstration sites, each corresponding to the service area of one of 53 SSA area offices. The demonstration sites collectively include nearly one in five SSDI beneficiaries nationally. The 10 sites were selected at random from the 53 candidate areas to ensure that the evaluation’s findings are nationally representative. The BOND sample for random assignment included all SSDI beneficiaries between the ages of 20 and 59 in the BOND sites who were receiving benefit payments and not enrolled in another SSA demonstration. 1.3. Findings to Date on the Implementation of BOND
The evaluation’s early process study findings are summarized in the Stage 1 and Stage 2 Early Assessment Reports released in May 2012 and August 2013, respectively, and summarized here. The Stage 1 Early Assessment Report described the initial implementation of Stage 1 based on data collected from August to November 2011 (Wittenburg et al. 2012), whereas the Stage 2 Early Assessment Report described findings regarding the early implementation of Stage 2 based on data collected from August to November 2012 (Gubits et al. 2013). Both assessments covered the period of demonstration set-up, early operations, and beneficiary enrollment (which occurred in May 2011 for Stage 1 and over a 19-month period from March 2011 to September 2012 for Stage 2). See Appendix A for a time line of the BOND implementation. 1.3.1. Early Implementation Findings for Stage 1
Stage 1 analyses indicate that the quick start-up of this complex and multifaceted demonstration was a considerable challenge for the implementation team (I-team), as indicated in Exhibit 1-2, which summarizes findings for Stage 1 early implementation. The main tasks included building the BOND infrastructure (for example, negotiating subcontracts, securing office space for the site offices, hiring and training BOND site office and WIC/EWIC staff, and obtaining security clearances); defining policies and procedures; designing and testing the BOND Operating Data System (BODS); and organizing and executing outreach efforts. As shown in the exhibit, sample selection and random assignment in spring 2011 produced treatment (T1) and control (C1) groups that were well matched at baseline. However, some aspects of the BOND infrastructure were not yet functioning as well as intended at the end of November 2011. Researchers documented challenges with coordination, competing demands on limited resources, and rapidly changing policies and procedures (Wittenburg et al. 2012).5
5 Examples of challenges during the initial implementation period included delays with obtaining security
clearances, delays with obtaining laptops and other technology, changes to the Beneficiary Tracking System (BTS), and policy and procedural changes such as when a work Continuing Disability Review (CDR) is initiated.

BOND Implementation and Evaluation Contract No. SS00-10-60011
Abt Associates Inc. Process Study Report 6
Exhibit 1-2. Implementation Findings through November 2011 from the Stage 1 Early Assessment Report
Topic Findings Random Assignment The T1 and C1 groups were selected and found to be well matched on baseline
characteristics.
BOND Infrastructure Some aspects of the BOND infrastructure were not yet functioning as intended (sites experienced coordination issues and competing demands on limited resources).
Of the 10 sites, 6 experienced some staffing disruptions, such as temporary medical absences or vacancies in hiring new staff, lasting two to three months, on average.
Outreach and Enrollment
The I-team and SSA mailed outreach letters to T1 subjects, as planned.
The outreach letter did not strongly emphasize contacting the BOND project, and some T1 subjects might not have realized that entering the offset proactively was a possibility or have understood the full extent of the benefits counseling available to them under BOND.6
Some T1 subjects received misinformation about BOND from trusted sources—including SSA field office staff and state vocational rehabilitation counselors.
Of the total of 79,440 T1 subjects sent outreach letters, 6.1 percent (4,840 T1 subjects) contacted the call center.
WIC Services Slightly more than 1 percent of all T1 subjects had made contact with a WIC counselor by the end of October 2011.
Caseloads per full-time equivalent (FTE) WIC counselor varied substantially across sites, suggesting that service delivery across sites might vary by caseload size.
Several factors could have limited WIC services for T1 subjects: inexperienced staff, training limitations, problems related to WIC use of the WIPA management information system rather than the demonstration’s system, staff turnover, and competing time demands.
Some T1 subjects received standard (non-BOND) counseling services from organizations not involved with BOND.
Pathway to the Offset Through October 2011, SSA had adjusted the benefits of 21 T1 subjects.
The number of front-door entrants7 into the offset was limited through October 2011. This might have been due to inadequately functioning demonstration procedures, limited T1 subject understanding, or lack of interest in the offset.
Based on administrative data about earnings and TWP activity, there appeared to be a large gap between the number in offset and the number likely eligible to use the offset.
BOND site offices and WIC provider staff reported a steep learning curve in completing work CDRs, as well as competing priorities.
Source: “BOND Stage 1 Early Assessment Report,” (Wittenburg et al. 2012).
6 Proactive entry refers to the beneficiary contacting the demonstration in response to outreach and providing
information that leads to application of the benefit offset. Treatment subjects with earnings can enter the benefit offset without taking any action, most commonly after the IRS reports their earnings to SSA and SSA proceeds with the adjustment process.
7 Front-door entrants are offset users who took proactive steps to have their benefits adjusted.

BOND Implementation and Evaluation Contract No. SS00-10-60011
Abt Associates Inc. Process Study Report 7
Even though Stage 1 outreach efforts were executed as designed, based on reports from many sources, we know that some beneficiaries were confused about the demonstration. For example, field staff talked about how beneficiaries told them that the outreach letters they received were unclear or that they initially disregarded the letters. They also talked about how the local SSA field offices and some of the disability service providers who were not aware of BOND cautioned some beneficiaries about contacting demonstration staff because they believed it to be a potential scam. We heard reports from multiple sources and sites of confusion about BOND. We are unable, however, to quantify the extent to which beneficiaries received misinformation about BOND or the how well beneficiaries understood the information they received; it might be that we received multiple reports about a small number of incidents, or that the incidents we heard about represent a small fraction of those that occurred. We found that about 1 percent of all T1 subjects used WIC services. Administrative statistics presented in Chapter 5 indicate that SSA eventually adjusted the 2011 benefits of 695 T1 subjects (as of May 1, 2014). Most of these adjustments were made in 2013. During the first six months of the demonstration, 21 T1 subjects had been identified as offset users. This number was a fraction of the total 4,873 T1 subjects who had been in contact with the demonstration (as of October 2011) (see Chapter 5, Section 5.3). Delays in adjustments were due at least partly to an existing national backlog in the completion of work Continuing Disability Reviews (CDRs) that was too large for demonstration staff at SSA to work through quickly. The backlog presumably also caused delays for the control subjects. Data on length of delays for control group members are not available, however, so it was not possible to compare delays for the two groups. As a result, we cannot determine whether the delays for the treatment subjects were typically larger or smaller than delays for control subjects. Technical issues in the implementation of benefit offset adjustments and end-of-year reconciliations also contributed to the delays. Because many beneficiaries started to use the offset without actively seeking benefit adjustments under the offset, we do not know the extent to which they actually understood the offset before the adjustments took place, or changed their behavior in response to the opportunity to use the offset. As anticipated, in many cases SSA made offset adjustments only after investigating reports about substantial earnings from the IRS or other sources, rather than from the beneficiary.8 1.3.2. Early Implementation Findings for Stage 2
The early assessment of Stage 2 implementation through November 2012—two months after participant enrollment was concluded—revealed progress for this portion of the demonstration, but also emphasized the need for continued improvement. Specific findings are summarized in Exhibit 1-3. Core activities during the start-up period included the end of Stage 2 enrollment and closing the BOND site offices, and a shift in work CDR preparation responsibilities from BOND field staff to SSA. In addition, the BOND I-team and SSA made changes to a number of procedures and tools intended to improve the performance of demonstration processes. Another noteworthy event during this time was the termination and subsequent reinstatement of the WIPA program, which provided counseling services to BOND control subjects and all non-BOND beneficiaries. WIPA funding ended June 30, 2012, with no indication that it would be reinstated. It was resumed in August 2013. Changes to the WIPA program created some counseling
8 As reported in the Stage 1 Snapshot Report, SSA adjusted the benefits of a large number of additional T1
subjects in 2013, and a large majority of these cases involved retroactive adjustments for 2011 or 2012. By the end of 2013, SSA had adjusted the benefits of 1,031 T1 subjects (Stapleton et al. 2013).
BOND Implementation and Evaluation Contract No. SS00-10-60011
Abt Associates Inc. Process Study Report 8
service disruptions for control subjects and, in some sites that relied on staff to provide both BOND and WIPA services, created disruptions in BOND staffing. Overall, the BOND evaluation team concluded that the Stage 2 volunteer group was likely to successfully serve its purpose of testing impacts of the offset and of enhanced counseling as an add-on to the offset. One of the major accomplishments was that BOND slightly exceeded its overall enrollment target for Stage 2 (12,954 enrolled versus 12,601 targeted enrollments); more than half of the sites met their individual targets. In addition, the Stage 2 random assignment was successful in creating three well-matched study groups (T21, T22, and C2). Furthermore, as intended, EWIC services differed from WIC services on three primary fronts: EWIC staff (1) contacted beneficiaries proactively, (2) routinely followed up with beneficiaries and referral organizations, and (3) used a more systematic assessment process. According to the Stage 2 Early Assessment Report, by the end of 2012, about 2 percent of Stage 2 treatment subjects had used the offset.9 Despite these accomplishments, important challenges remained as of December 2012. Most notably, site-office staff and WIC and EWIC staff did not fully understand some critical BOND procedures, such as using the BODS, developing work CDRs, and preparing annual earnings estimates (AEEs). Based on feedback from staff interviews, factors contributing to the limited understanding of BOND included the newness of the intervention, the inherent complexity of the demonstration, numerous changes in policies and procedures, and staff turnover.10 In addition, the backlog of work CDRs and adjustments to benefits under the offset remained high at this point. This partly reflected factors that affected treatment and control subjects alike: high work CDR backlogs at the beginning of the demonstration and limited staff available to perform work CDRs. In addition, several factors specific to treatment subjects contributed to delays: technical problems with a process under which demonstration staff were to assist SSA staff in the collection of information needed for work CDRs; the inexperience of demonstration staff responsible for completing AEEs; and technical problems with the BOND Stand-Alone System (BSAS), which SSA uses to adjust benefits under the offset. Under both the offset and current law, delays in the processing of payment adjustments usually result in improper payments. A delay of given length generally results in a smaller improper payment under the benefit offset than under current law, however, because the beneficiary is often eligible for a partial payment during the period of the delay. Under current law, beneficiary notification of an improper payment can trigger a negative employment response when the beneficiary recognizes for the first time that one consequence of increased earnings is
9 The number of identified offset users in the early period continues to increase over time. Indeed, according to
more recent data used in this report, 5.5 percent of Stage 2 treatment subjects were known 2012 offset users.
10 Multiple site visit respondents in each of the sites talked about the “frequent” changes to BOND policies and procedures during the initial implementation. We are not able to quantify their frequency. Examples include SSA’s moving responsibility for the development of information for work CDRs from BOND field staff to the BOND SSA work CDR unit in May 2012; the I-team shifting responsibility for enrollment appointment scheduling from the BOND site offices to the field interviewers; the I-team using available project staff at the BOND Call Center and other site offices to assist overtaxed site offices with outreach to prospective volunteers; the Team’s improvements to the BTS; and SSA’s improvements to BSAS (Gubits et al. 2013).

BOND Implementation and Evaluation Contract No. SS00-10-60011
Abt Associates Inc. Process Study Report 9
benefit suspension. Because the benefit offset substantially softens this consequence, we were surprised to hear anecdotes from field staff and beneficiary focus groups about treatment subjects who reduced their work effort after being notified about an improper payment. It appears that the improper payments undermined these subjects’ willingness to engage in SGA. However, we cannot document the prevalence of this type of response. Exhibit 1-3. Implementation Findings Through November 2012 from the Stage 2 Early
Assessment Report
Topic Findings BOND Infrastructure BOND staff at site offices and WIC and EWIC providers did not fully understand some critical
BOND procedures, including the BODS, development of work CDRs, and preparation of AEEs.
The large amounts of information conveyed during training made it difficult for field staff to fully absorb all of the important points, and opportunities to practice new procedures before actually using them were limited.
Training and technical assistance resources, although helpful, were not wholly successful in improving field staff understanding.
At a number of junctures when issues arose in the operation of the demonstration, the I-team and SSA responded by making changes to BOND procedures and tools.11
Outreach and Enrollment
BOND slightly exceeded its Stage 2 enrollment target and enrolled 12,954 volunteers from February 1, 2011, to September 28, 2012.
About half of study enrollments took place in the field (rather than in site offices), which was higher and more costly than anticipated.
Although many of the features of recruitment were conducted uniformly across sites, there is some evidence that the efforts fell short of the desired level of uniformity.12
Random Assignment Stage 2 random assignment was successful in creating three well-matched study groups (T21, T22, and C2).
WIC and EWIC Services
The differences in WIC and EWIC caseload sizes were more modest than expected, mainly due to lower-than-anticipated take-up of WIC services.
The main differences between EWIC and WIC services, as implemented, were that, compared to WIC staff, EWIC staff (1) contacted beneficiaries proactively, (2) followed up with beneficiaries and referral organizations, and (3) used a more systematic assessment process.
Consistent with the design, a large majority (97 percent) of T22 subjects had some contact with an EWIC counselor, whereas only a minority (28 percent) of T21 subjects had contact with a WIC counselor.
11 Changes included the following: moving responsibility for the development of information for work CDRs from
BOND site staff to the BOND SSA work CDR unit in May 2012, shifting responsibility for enrollment appointment scheduling from the BOND site offices to the field interviewers in some sites, using available project staff at the BOND call center and other site offices to assist overtaxed site offices with outreach to prospective volunteers, improving the BODS, and improving BSAS.
12 Examples of variation in the recruitment process across sites include a different level of outreach between early outreach waves (1–11) and later waves (12–14), insufficient staffing at larger sites, and indications of backlogs in setting up enrollment appointments.
BOND Implementation and Evaluation Contract No. SS00-10-60011
Abt Associates Inc. Process Study Report 10
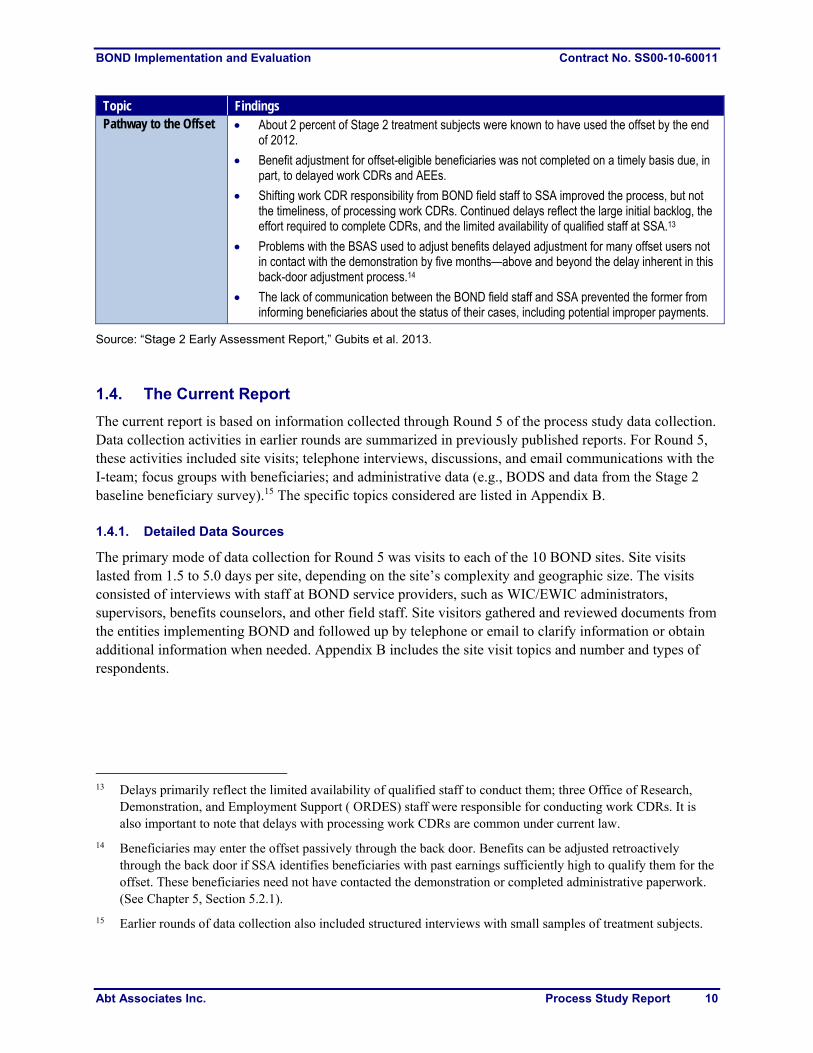
Topic Findings Pathway to the Offset About 2 percent of Stage 2 treatment subjects were known to have used the offset by the end
of 2012.
Benefit adjustment for offset-eligible beneficiaries was not completed on a timely basis due, in part, to delayed work CDRs and AEEs.
Shifting work CDR responsibility from BOND field staff to SSA improved the process, but not the timeliness, of processing work CDRs. Continued delays reflect the large initial backlog, the effort required to complete CDRs, and the limited availability of qualified staff at SSA.13
Problems with the BSAS used to adjust benefits delayed adjustment for many offset users not in contact with the demonstration by five months—above and beyond the delay inherent in this back-door adjustment process.14
The lack of communication between the BOND field staff and SSA prevented the former from informing beneficiaries about the status of their cases, including potential improper payments.
Source: “Stage 2 Early Assessment Report,” Gubits et al. 2013.
1.4. The Current Report
The current report is based on information collected through Round 5 of the process study data collection. Data collection activities in earlier rounds are summarized in previously published reports. For Round 5, these activities included site visits; telephone interviews, discussions, and email communications with the I-team; focus groups with beneficiaries; and administrative data (e.g., BODS and data from the Stage 2 baseline beneficiary survey).15 The specific topics considered are listed in Appendix B. 1.4.1. Detailed Data Sources
The primary mode of data collection for Round 5 was visits to each of the 10 BOND sites. Site visits lasted from 1.5 to 5.0 days per site, depending on the site’s complexity and geographic size. The visits consisted of interviews with staff at BOND service providers, such as WIC/EWIC administrators, supervisors, benefits counselors, and other field staff. Site visitors gathered and reviewed documents from the entities implementing BOND and followed up by telephone or email to clarify information or obtain additional information when needed. Appendix B includes the site visit topics and number and types of respondents.
13 Delays primarily reflect the limited availability of qualified staff to conduct them; three Office of Research,
Demonstration, and Employment Support ( ORDES) staff were responsible for conducting work CDRs. It is also important to note that delays with processing work CDRs are common under current law.
14 Beneficiaries may enter the offset passively through the back door. Benefits can be adjusted retroactively through the back door if SSA identifies beneficiaries with past earnings sufficiently high to qualify them for the offset. These beneficiaries need not have contacted the demonstration or completed administrative paperwork. (See Chapter 5, Section 5.2.1).
15 Earlier rounds of data collection also included structured interviews with small samples of treatment subjects.

BOND Implementation and Evaluation Contract No. SS00-10-60011
Abt Associates Inc. Process Study Report 11
The fall 2013 site visits were the first to include focus groups with beneficiaries. Each site visit included one focus group with WIC users (T1 and T21 subjects) and one group with EWIC users (T22 subjects), for a total of 10 WIC and 10 EWIC groups. As is standard with this mode of data collection, the participants were not intended to be representative of all BOND treatment group subjects who used counseling services; instead, they were selected in a manner that seemed likely to efficiently yield useful information about participants’ demonstration experiences from their perspective. For convenience, the focus groups were held in the area of each site with the highest concentration of beneficiaries. The process study team obtained a list of beneficiaries who had used some BOND services and lived within 20 miles of the focus group location. Beneficiaries were contacted by telephone; those who agreed to participate received a follow-up letter with the location, date, and time of the session. Beneficiaries who attended the group received $25 in cash for their time. Participants answered semistructured questions on a few key topics to encourage interaction and discussion. The process study team also collected data through interviews and discussions with the I-team and updates from that team. Some of this data collection was ongoing, such as biweekly check-in meetings with the I-team director and weekly implementation updates received by email. The study team also interviewed select I-team members and SSA staff by telephone to clarify information about implementation activities for this report. Finally, a small-group discussion was held with the I-team members who operated the BOND data systems. The process study team also used administrative and survey data in this report. Information on the delivery of BOND services and beneficiary status is from BODS. Stage 2 baseline survey data are used to characterize BOND beneficiaries. 1.4.2. Data Analysis
The process study team used ATLAS.ti software to store and organize the qualitative site visit data gathered for this report. Interview notes collected within each of the study sites were coded and analyzed within and across the study sites to identify key themes from these visits. The team recorded and transcribed the focus group discussions with beneficiaries and analyzed focus group notes to identify cross-cutting themes from WIC users (T1 and T22 subjects) and EWIC users (T22 subjects). In addition, the team used descriptive statistics on variables such as contact outcomes of additional T1 outreach, WIC and EWIC service use, and offset use to capture key findings from targeted analyses of BODS and the other quantitative data sources. We also analyzed BODS data to generate information on the effects of T1 set-ups during periods with and without additional outreach (Chapter 3), WIC and EWIC caseload comparisons at a point in time and changes over time (Chapter 4), receipt of benefits counseling for Stage 2 treatment subjects by employment status at enrollment (Chapter 4), and the percentage of Stage 1 and Stage 2 treatment subjects in the offset over time (Chapter 5), among other analyses. 1.4.3. Outline of Remaining Chapters
The rest of this report includes five chapters. Chapter 2 provides background on the BOND study sites and the disability service environment, including changes to the WIPA program. Chapter 3 describes the additional outreach process used for Stage 1 beneficiaries and assesses the success of these outreach efforts. Chapter 4 compares WIC, EWIC, and current-law counseling services. Chapter 5 describes the implementation and use of the offset and benefit adjustment process and presents findings on improper
BOND Implementation and Evaluation Contract No. SS00-10-60011
Abt Associates Inc. Process Study Report 12
payments. Finally, Chapter 6 provides a summary of key findings and highlights issues of importance for future reports. Covered in the appendices of this report are a time line of key dates in BOND implementation (Appendix A), data collection instruments (Appendix B), descriptions of each of the BOND sites (Appendix C), the total number of BOND treatment and control subjects overall and by site (Appendix D), and a primer describing the relationship between SSDI and BOND (Appendix E).
BOND Implementation and Evaluation Contract No. SS00-10-60011
Abt Associates Inc. Process Study Report 13
2. BOND Study Sites and Disability Service Environment
2.1. BOND Study Sites
The BOND sites were selected to be nationally representative; as a result, they are diverse.16 Exhibit 2-1 summarizes how the 10 sites vary on six salient dimensions: (1) geographic characteristics; (2) economic indicators; (3) number and staffing configuration of BOND benefits counseling providers; (4) number of Stage 2 treatment subjects enrolled; (5) availability of employment services and other disability-related resources; and (6) presence of non-BOND benefits counseling services, including WIPA. The following sections discuss each of these dimensions in turn. As the sites are nationally representative, variation across sites is likely indicative of how implementation would vary in the rollout of a national program. In addition to the cross-site observations included here, Appendix C presents individual site summaries. 2.2. Geographic Characteristics
Geographically, the 10 sites differ from one another in ways that might affect the complexity of implementation at multiple points during the demonstration. We have identified three indicators that appear to influence the implementation of BOND.
Number of states in a BOND site. Only one site includes a single, full state (Alabama), whereas four sites cover multiple states or portions thereof, and five sites cover a portion of a state (see Exhibit 2-1). The Northern New England site, which includes New Hampshire, Maine, Vermont, and northern Massachusetts, covers the greatest number of states.
16 The BOND design team used a multistep random selection process to identify 10 sites that together would be
nationally representative of SSDI beneficiaries, both in geographic location and access to health insurance coverage under state Medicaid Buy-In (MBI) programs.
Chapter Findings
BOND sites differ on a variety of dimensions (for example, geography, employment rate, and availability of disability services).
Some WIC providers are using existing, geographically dispersed staffing structures. These structures, created for WIPA, have no BOND-exclusive workers; instead, they have many staff who spend only part of their time on BOND. Given the complexity of BOND policies and procedures, this staffing approach creates challenges in executing BOND-specific tasks.
Although the vocational rehabilitation (VR) agency is the primary employment service provider for BOND beneficiaries in all sites, access to and quality of services varies within and across these sites. For a variety of reasons, other employment services and supports rarely have been used (for example, because they have been difficult to access, not user friendly, or defined eligibility narrowly).
Changes in the WIPA program brought disruptions to benefits counseling services for control subjects, and possibly treatment subjects as well; the magnitude and effects of these disruptions varied by state.

BOND Implementation and Evaluation Contract No. SS00-10-60011
Abt Associates Inc. Process Study Report 14
Population density. The District of Columbia is the most densely populated area, with slightly fewer than 1,000 residents per square mile. Colorado and Wyoming are the least densely populated, with 49 and 6 residents per square mile, respectively. The Northern New England states Maine and Vermont are also mainly rural areas.
Dispersion of SSDI beneficiaries. Four sites—Alabama, Colorado/Wyoming, Northern New England, and Wisconsin—are geographically dispersed, with more than 20 percent of the SSDI population living outside of a metropolitan statistical area (MSA). In the other sites, SSDI beneficiaries live in more centralized urban areas.
This geographic variation has several implications for the demonstration. First, in multistate sites, providers have to understand and navigate multiple sets of state policies and resources, and tailor service delivery to the residents of each state. Similarly, providers in sites that span different geographic regions or metropolitan areas within a state must deal with multiple community resources and service delivery infrastructures. Second, field staff, including site office staff, enrollment staff, and WIC and EWIC staff serving beneficiaries in more consolidated service areas, have smaller geographic areas to cover to meet beneficiaries in person. This factor was more prominent in the early stages of implementation, when field staff travelled to conduct enrollment and intake interviews in person. During site visits, benefits counselors indicated that, as the demonstration progressed, they have been more likely to interact with beneficiaries on the telephone or by email, thus reducing the need to travel. Finally, beneficiaries living in rural areas might have more difficulty than others in accessing employment support services and finding jobs. Respondents indicated that services and job opportunities are relatively sparse in the outlying areas. 2.3. Economic Indicators
The goal of BOND is to encourage SSDI beneficiaries to engage in SGA. This is likely to be easier or harder, depending on the tightness of the local labor market. Evidence suggests that individuals with disabilities have a more difficult time in finding jobs during a period of high unemployment, compared to those without a disability (Livermore et al. 2012). The economic environment varies within and across the BOND sites (Exhibit 2-1), likely in parallel with the availability of jobs and states’ funding of services for people with disabilities. Beneficiaries’ access to jobs and employment services might in turn affect their opportunities to engage in SGA, a necessary step toward using the BOND offset.
Unemployment rate (December 2013). At the end of 2013, in 7 of the 10 BOND sites at least one state or MSA (for sites that include partial states) had an unemployment rate lower than the national average of 6.7 percent.17 Vermont and Wyoming, each part of a multistate site (Northern New England and Colorado/Wyoming, respectively) had the lowest unemployment rates, at 4.2
17 These unemployment figures illustrate the economic environment but are not specific to people with
disabilities. Unemployment rates are based on the U.S. Department of Labor, Bureau of Labor and Statistics. For BOND sites that cover an entire state, we use the state unemployment rate. For sites that include a portion of the state, we rely on the largest MSA within the BOND jurisdiction.
BOND Implementation and Evaluation Contract No. SS00-10-60011
Abt Associates Inc. Process Study Report 15
and 4.4 percent, respectively. In contrast, the unemployment rates in the Riverside, California, and Detroit, Michigan, MSAs were substantially above the national average, at 9.4 and 8.8 percent, respectively. The highest unemployment rate among sites that cover a full state was 7.6 percent in Arizona.
Change in unemployment rate (2011−2013). In 9 of the 10 BOND sites, the unemployment rate decreased from October 2011 (shortly after BOND was first implemented) to December 2013 (see Exhibit 2-1). However, in 7 of the sites, the change in the unemployment rate was smaller than the 2.3 percent reduction in the national rate. The 3 sites with relatively large reductions started the period with particularly high unemployment rates (Riverside, California, MSA; Detroit, Michigan, MSA; Miami and Tampa, Florida, MSAs).
2.4. Number and Staffing Configuration of BOND Benefits Counseling Providers
To deliver BOND WIC and EWIC services, the BOND I-team contracted with local providers already engaged in the existing disability service delivery infrastructure. Because those existing providers were heterogeneous, this strategy led to site-specific differences in the number and types of providers and their WIC/EWIC staffing models.
Number of BOND counseling service providers. Existing providers’ capacity and sites’ geographic characteristics influenced the number of providers by site (see Exhibit 2-1). Three of the study sites—Alabama, Greater Houston, and South Florida—relied on the same single provider for both WIC and EWIC services. One site used two providers—one for WIC and the other for EWIC. The remaining sites relied on three or more providers, including remote providers. Wisconsin, the site with the most providers, had nine.
Types of providers. BOND relied on a range of provider types for WIC and EWIC services. Every site included at least one nonprofit agency. Two sites—Colorado/Wyoming and Northern New England—relied on their state VR agencies. Other types of WIC/EWIC providers included universities/educational institutions, government/human services providers, and an association of disability service providers. Each type of agency brought different strengths. Smaller, nonprofit organizations tend to be more nimble in hiring and downsizing staff, and negotiating subcontracts quickly relative to their larger counterparts. Larger government agencies, particularly VR, tend to bring additional resources, such as employment and training services, as well as work accommodations and supports.
Dispersed staffing structure. Service providers adopted one of two staffing models to provide benefits counseling services under BOND: dispersed (relying on multiple staff with a portion of their time dedicated to BOND) or consolidated (one or two staff fully dedicated to BOND). WIC providers in four of the sites used a dispersed staffing model; that is, they allocated a portion of their time to BOND. They used this approach mostly because it built on the programs’ existing service delivery structures and/or minimized the loss of positions as the BOND staffing FTE allocation was reduced. With the exception of the Wisconsin site, EWIC providers relied on a consolidated model; that is, they hired one or more staff who were dedicated solely to BOND.18
18 Northern New England has multiple providers with one or two EWICs. Collectively, they have multiple EWICs
throughout the site; however, with the provider the staffing is consolidated.

BOND Implementation and Evaluation Contract No. SS00-10-60011
Abt Associates Inc. Process Study Report 16
Some of the staffing configurations had both positive and negative implications for delivery of the demonstration interventions. For example, relying on multiple providers expanded the geographic reach and resources available to beneficiaries. However, contracting arrangements with multiple providers required more coordination and oversight. Similarly, implementing a dispersed staffing model improved the availability and accessibility of services. WIC/EWICs assigned to a geographic region were able to meet in person with beneficiaries and often were knowledgeable about local resources. The dispersed model also lessened the impact of field staff reductions (decreases in FTEs) and turnover because sites did not have to lay off staff. However, a dispersed staffing model made it difficult for staff to stay current and retain their knowledge of BOND policies and procedures, particularly when they did not serve BOND beneficiaries regularly.19 Based on quality assurance reviews conducted by the I-team, it appears that WIC providers that used a dispersed staffing model had the greatest number of errors in BOND post-entitlement work20 because they did it so infrequently. In addition, there was less consistency in how staff provided services within a given BOND site and fewer opportunities for them to consult with colleagues and learn from one another. 2.5. Number of BOND Subjects
The number of BOND subjects served varied across the sites for both Stages 1 and 2 treatment and control groups. Across all sites, the demonstration mailed material to 79,436 T1 subjects (see Appendix D). South Florida and Alabama had the largest number, with 12,232 and 11,254 mailings, respectively. These two sites also had the greatest number of T1 setups, defined as a BOND T1 beneficiary having received an explanation of the offset and WIC services from a member of the I-team. There were 3,148 T1 setups in South Florida and 2,794 in Alabama. The District of Columbia (DC) Metro area had the lowest number of T1 setups, with 1,291 subjects. As planned, the number of enrolled Stage 2 treatment subjects (T21, T22) differed across the study sites based on the size of the pool of BOND-eligible beneficiaries. The highest was 1,064 subjects in South Florida; the lowest were 639 and 641 in the DC Metro and Colorado/Wyoming sites, respectively (see Appendix D for the number of treatment subjects and the pool of potential BOND subjects). This variation had implications for the allocations of WIC and EWIC staff (see Chapter 4).
19 The BOND implementation team offered several resources such as a site liaison (assistance with demonstration
activities and technical assistance resources), Virginia Commonwealth University (benefits counseling), David Vandergoot-Center for Essential Management Services (EWIC), BODS team (BTS), BOND processing center (AEEs and noncountable income). Additional details on TA resources are available in the Stage 2 Early Assessment Report. Still, respondents using a dispersed staffing model said that it was difficult to keep up with all of the changes to the BOND policies and procedures. They also had difficulty retaining information—for example, completing an AEE—when it was not a task they frequently completed.
20 Post-entitlement work is discussed in detail in Chapters 4 and 5. It refers to activities required to facilitate the BOND benefit adjustment process.

BOND Implementation and Evaluation Contract No. SS00-10-60011
Abt Associates Inc. Process Study Report 17
Exhibit 2-1. BOND Site-Level Characteristics
Geographic Characteristics Economic Indicators BOND Benefits Counseling Providers
Sites Number of
States Population
Density1 Geographically
Dispersed2
Unemployment Rate (%)
(December 2013)
Change in Unemployment Rate Since October 2011 Number Types
Dispersed Staffing
Alabama Single 94 (AL) X 6.1 -2.1 1 Nonprofit Arizona/Southeast California
Multiple (1 full, 1 partial)
56 (AZ) 239 (CA)
7.6 (AZ)
9.4 (Riverside MSA) -1.6 -3.6
5* Nonprofit
Colorado/ Wyoming Multiple (2) 49 (CO) 6 (WY)
X 6.2 (CO) 4.4 (WY)
-2.3 -1.6
2 Nonprofit State VR
X (WIC)
DC Metro Multiple
(1 full, 3 partial)
9,856 (DC) 203 (VA) 595 (MD) 77 (WV)
5.1 (Washington, DC
MSA) -0.7 3*
Nonprofit Other3
Greater Detroit Partial 175 (MI) 8.8 (Detroit MSA) -2.4 4 Nonprofit Greater Houston Partial 96 (TX) 5.9 (Houston MSA) -2.0 1 Nonprofit X (WIC)
Northern New England Multiple
(3 full, 1 partial)
147 (NH) 43 (ME)
839 (MA) 68 (VT)
X
5.2 (NH) 6.4 (ME) 7.1 (MA) 4.2 (VT)
-0.3 -1.2
0 -1.2
5
Nonprofit State VR University
Medical center
X (ME,WIC; VT WIC)
South Florida Partial 96 (FL) 6.5 (Miami MSA) 6.2 (Tampa MSA)
-3.5 -4.4
1 Nonprofit
Western New York Partial 411 (NY) 7.0 (Buffalo MSA) -1.1 4* Nonprofit
Advocacy organization X (WIC)
Wisconsin Partial 105 (WI) X 6.3 -1.1 9
Nonprofit educational institution
Government For-profit
X (EWIC, WIC)
U.S. Average N/A 87 N/A 6.7 -2.3 N/A N/A
Sources: Based on respondent interviews from BOND site visits. Bureau of Labor Statistics Labor Market unemployment data (December 2013). U.S. Census Bureau data (2010); http://www.bls.gov/lau/ssamatab1.txt (MSA unemployment rates), http://www.bls.gov/lau/data.htm (state unemployment rates); data extracted in February 2014. * Indicates sites that rely on Virginia Commonwealth University to provide telephonic EWIC services to T22s. 1 Population density indicates number of people per square mile of land, 2010. 2 Geographic dispersion defined as 20 percent of the SSDI population living outside of the MSA. Based on findings from “Social Security Administration $1 for $2 Benefit Offset Demonstration: Site Visit Report” (September 2008). 3 Association of disability service providers. N/A = not applicable.

BOND Implementation and Evaluation Contract No. SS00-10-60011
Abt Associates Inc. Process Study Report 18
2.6. Availability and Use of Employment Services and Other Work-Focused, Disability-Related Resources
Some treatment subjects who seek to use the benefit offset might need assistance from employment service providers to do so. For that reason, referrals to employment service providers are a central feature of BOND. These referrals are intended to supplement WIC and EWIC benefits counseling and support beneficiaries’ use of the BOND offset. Hence, the extent to which such services are available to beneficiaries in a BOND site, and their quality, can potentially affect the timing and size of the impacts of the benefit offset on employment and benefit outcomes.21 Respondents in all sites described the VR agency as the primary employment service provider for BOND subjects; we found very few instances of referrals to Ticket to Work (TTW) employment networks (ENs) other than VR agencies, or to any other providers. We also found that beneficiaries’ access to VR services varied, as did the respondents’ perceptions about the quality of the services provided, both across sites and across states within sites (see Exhibit 2-2). We identified four main findings regarding the availability and quality of VR services. First, in at least a portion of four of the study sites—Arizona, DC Metro, Colorado/Wyoming, and Wisconsin—VR lacked the resources to provide services to all eligible beneficiaries. These providers operated under an order of selection in which they gave top priority to applicants with the most significant disabilities.22 Most SSDI beneficiaries received high priority but sometimes faced substantial wait times.23 Second, VR programs in at least a portion of four BOND sites—Alabama, Colorado/Wyoming, Greater Detroit, and Northern New England (specifically, Massachusetts)—experienced some funding cuts within the past year. These cuts could also have indirectly affected BOND beneficiaries in those states, although we could not observe how these cuts affected them specifically. Third, in at least a portion of eight sites, interview respondents reported delays for beneficiaries attempting to access VR services. In one site, respondents indicated that the wait was as long as 18 months. In half of the sites reporting wait times, the VR agency in at least one state in the site operated under an order of selection. We cannot, however, measure how long the wait times experienced by BOND beneficiaries were, nor is there reason to think that they were longer or shorter for treatment subjects than for control subjects. Finally, for beneficiaries who received VR services, field staff indicated that the quality of services provided varied by office
21 See Honeycutt and Stapleton (2013) for more information on wait times for SSDI beneficiaries at state VR
agencies and evidence that long VR wait times for beneficiaries have a negative impact on their employment and benefit outcomes.
22 The state agency is required to implement an order of selection when it will not have sufficient fiscal and/or personnel resources to fully serve all eligible people. An order of selection consists of priority categories to which eligible people are assigned based on the significance of their disabilities. Those with the most significant disabilities are selected first for the provision of vocational rehabilitation services. If an agency is in an order of selection, an individual plan for employment will be developed and implemented only for those eligible people for whom the agency is able to provide services. Those who do not meet the agency’s order of selection will be put on waiting lists and must be provided with access to the services available through the agency’s information and referral system.
23 This is based on feedback from WIC and EWIC staff and beneficiary feedback during focus groups. Respondents shared anecdotes about extended wait times.

BOND Implementation and Evaluation Contract No. SS00-10-60011
Abt Associates Inc. Process Study Report 19
location and VR worker. During focus groups, beneficiaries in at least five sites gave consistently negative or mixed reviews of VR services, compared to positive reviews in two sites. Other employment initiatives and supports were available in BOND sites. However, WIC and EWIC staff as well as beneficiaries indicated that these other supports were used infrequently. Some of the reasons the respondents reported for limited use of these services were that they were difficult to access, had narrowly defined eligibility, or were not user friendly. A description of the primary services available follows
Ticket to Work. SSA’s TTW program funds ENs to provide career counseling, job placement, and other employment support services. The VR agencies may accept tickets, but they much more frequently use the option of obtaining performance-based, cost-reimbursement payments from SSA under a system that predates TTW. The number of ENs varies across states in the BOND sites; some BOND beneficiaries might not have local EN options (see Exhibit 2-2). There are a few national providers; these mostly provide consumer-directed services. Among all SSDI beneficiaries, EN use varies considerably across states (based on TTW use data). The number of BOND subjects using ENs is currently unknown.
Medicaid Buy-In. The MBI enables individuals with disabilities who are working to purchase Medicaid coverage. MBI programs exist in at least parts of all BOND sites except Alabama and South Florida. Enrollment data show that MBI participation varies across states, likely due to state-specific differences in eligibility criteria, program design, and outreach. It is unknown whether these differences limit MBI access for any BOND beneficiaries, though the proportion of MBI participants in BOND is unknown.
U.S. Department of Labor’s American Job Centers and the Disability Employment Initiative Grants. The U.S. Department of Labor (DOL) funds employment and training services for all eligible people. Funds pass from the state to a local Workforce Investment Board (WIB), which in turn contracts with local employment and training providers to operate American Job Centers (AJCs). AJCs provide job support services to all job seekers, regardless of disability status. Centers provide career counseling, job training, access to resources such as telephones and free Internet access, and help with resume-building and interview skills, among other services. AJCs tend to be useful for job seekers who require minimal support to navigate job search resources. WIC and EWIC staff said that those who are hard to employ often have more difficulty in accessing services at the AJCs. To improve access to and quality of employment services to people with disabilities through AJCs, DOL awarded four rounds of Disability Employment Initiative (DEI) grants, beginning in 2010. Eight states in seven BOND sites have been awarded at least one round of DEI funding (see Exhibit 2-2).
If, in fact, some beneficiaries require good-quality employment services in order to take advantage of the opportunity provided by the benefit offset, these findings suggest that significant limits on the availability of such services in some sites, or parts of sites, is dampening the impact of the benefit offset on employment and benefit outcomes for at least some treatment subjects.
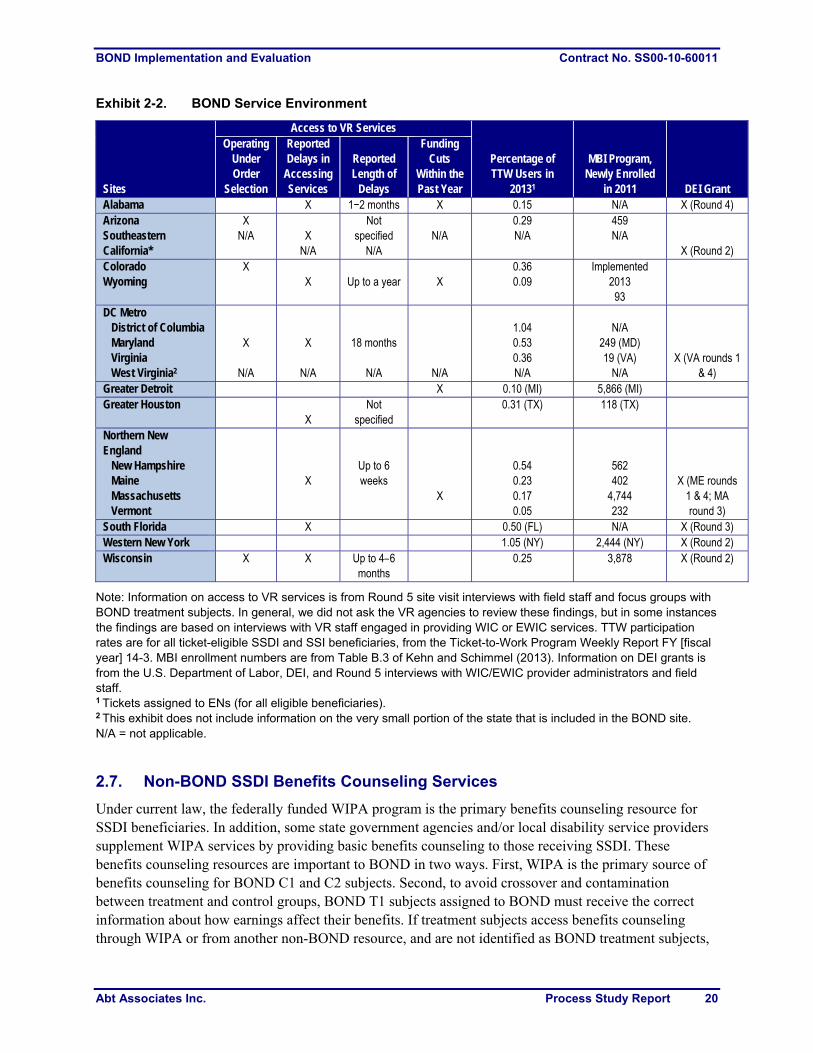
BOND Implementation and Evaluation Contract No. SS00-10-60011
Abt Associates Inc. Process Study Report 20
Exhibit 2-2. BOND Service Environment
Sites
Access to VR Services
Percentage of TTW Users in
20131
MBI Program, Newly Enrolled
in 2011 DEI Grant
Operating Under Order
Selection
Reported Delays in
Accessing Services
Reported Length of
Delays
Funding Cuts
Within the Past Year
Alabama X 1−2 months X 0.15 N/A X (Round 4) Arizona Southeastern California*
X N/A X
N/A
Not specified
N/A N/A
0.29 N/A
459 N/A
X (Round 2) Colorado Wyoming
X X
Up to a year
X
0.36 0.09
Implemented 2013
93 DC Metro District of Columbia Maryland Virginia West Virginia2
X
N/A
X
N/A
18 months
N/A
N/A
1.04 0.53 0.36 N/A
N/A
249 (MD) 19 (VA)
N/A
X (VA rounds 1 & 4)
Greater Detroit X 0.10 (MI) 5,866 (MI) Greater Houston
X Not
specified 0.31 (TX) 118 (TX)
Northern New England New Hampshire Maine Massachusetts Vermont
X
Up to 6 weeks
X
0.54 0.23 0.17 0.05
562 402
4,744 232
X (ME rounds 1 & 4; MA round 3)
South Florida X 0.50 (FL) N/A X (Round 3) Western New York 1.05 (NY) 2,444 (NY) X (Round 2) Wisconsin X X Up to 4–6
months 0.25 3,878 X (Round 2)
Note: Information on access to VR services is from Round 5 site visit interviews with field staff and focus groups with BOND treatment subjects. In general, we did not ask the VR agencies to review these findings, but in some instances the findings are based on interviews with VR staff engaged in providing WIC or EWIC services. TTW participation rates are for all ticket-eligible SSDI and SSI beneficiaries, from the Ticket-to-Work Program Weekly Report FY [fiscal year] 14-3. MBI enrollment numbers are from Table B.3 of Kehn and Schimmel (2013). Information on DEI grants is from the U.S. Department of Labor, DEI, and Round 5 interviews with WIC/EWIC provider administrators and field staff. 1 Tickets assigned to ENs (for all eligible beneficiaries). 2 This exhibit does not include information on the very small portion of the state that is included in the BOND site. N/A = not applicable.
2.7. Non-BOND SSDI Benefits Counseling Services
Under current law, the federally funded WIPA program is the primary benefits counseling resource for SSDI beneficiaries. In addition, some state government agencies and/or local disability service providers supplement WIPA services by providing basic benefits counseling to those receiving SSDI. These benefits counseling resources are important to BOND in two ways. First, WIPA is the primary source of benefits counseling for BOND C1 and C2 subjects. Second, to avoid crossover and contamination between treatment and control groups, BOND T1 subjects assigned to BOND must receive the correct information about how earnings affect their benefits. If treatment subjects access benefits counseling through WIPA or from another non-BOND resource, and are not identified as BOND treatment subjects,
BOND Implementation and Evaluation Contract No. SS00-10-60011
Abt Associates Inc. Process Study Report 21
they might receive incorrect information that could influence their decisions about whether and how much to work. To avoid that problem, if a BOND treatment subject sought services from a WIPA counselor, a flag in the WIPA management information system, Efforts to Outcomes (ETO), alerted the counselor to the subject’s status. However, perhaps because of a temporary discontinuation in the WIPA program and the availability of guidance from non-WIPA counselors, we heard anecdotal reports of BOND subjects receiving incorrect information, but do not have data on the frequency with which this occurred. Below, we discuss how changes to the WIPA program might have influenced the availability of counseling for BOND control subjects and the risk of beneficiaries receiving misinformation about BOND. 2.7.1. Discontinuation and Refunding of WIPA
Funding for the WIPA program ended June 30, 2012, with an uncertain future. More than a year later, in August 2013, Congress reallocated funds to support these services. This funding disruption might have affected benefits counseling for BOND control subjects in both stages, because WIPA services are a main source of benefits counseling for them. States responded differently to the end of WIPA, which had implications for BOND beneficiaries assigned to the control group. Some WIPA providers were granted no-cost extensions of their WIPA grants to continue services through September 2012. New funding for non-WIPA benefits counseling was patched together at the state or local levels for many sites, which continued services for some control group beneficiaries. All of the sites maintained some level of services during the gap in federal WIPA funding (see Exhibit 2-3). However, in at least a portion of all study sites, there was a decrease in services available to the control group, either through targeting counseling to a select group (for example, by continuing benefits counseling to VR clients only) or by reducing the types or intensity of services (information and referral [I&R] only, or not accepting new clients).24 Although only the control group experienced the direct effect of the funding interruption, the WIC and EWIC services delivered to treatment subjects experienced indirect effects due to staffing changes. Sites that implemented a dispersed staffing model and/or where a portion of the WIC/EWIC supervisor’s time was funded by WIPA experienced temporary disruptions in staffing. In one site, a supervisor of a WIC/EWIC provider was mainly funded by WIPA, but allocated a small portion of her time to BOND. When WIPA ended, there were no longer enough funds to support her position. As a result, she took early retirement and her BOND responsibilities shifted to another person within the agency who was supported with non-WIPA funds. Seven sites reported that the ending of WIPA required layoffs of benefits counselors; in six of the study sites, it required at least one provider to shift staff responsibilities.
24 We could not estimate the number of control group beneficiaries who might have been influenced by the end of
WIPA funding.
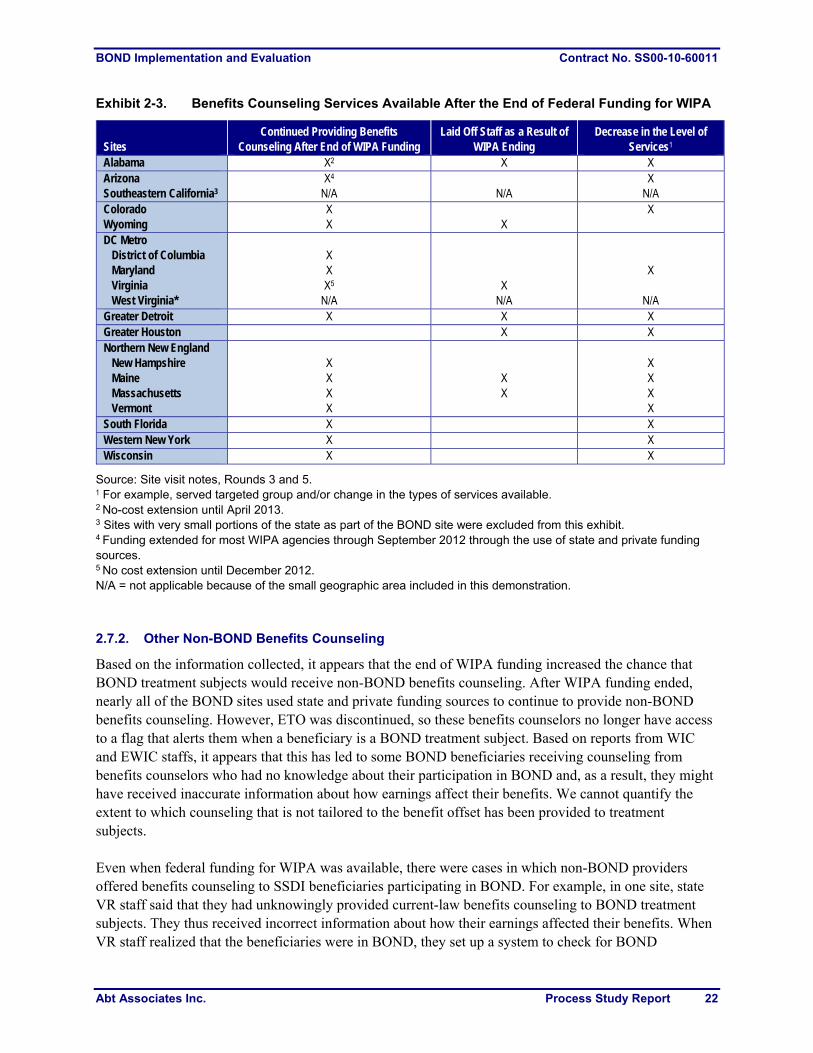
BOND Implementation and Evaluation Contract No. SS00-10-60011
Abt Associates Inc. Process Study Report 22
Exhibit 2-3. Benefits Counseling Services Available After the End of Federal Funding for WIPA
Sites Continued Providing Benefits
Counseling After End of WIPA Funding Laid Off Staff as a Result of
WIPA Ending Decrease in the Level of
Services1 Alabama X2 X X Arizona Southeastern California3
X4
N/A
N/A X
N/A Colorado Wyoming
X X X
X
DC Metro District of Columbia Maryland Virginia West Virginia*
X X X5
N/A
X N/A
X
N/A Greater Detroit X X X
Greater Houston X X Northern New England New Hampshire Maine Massachusetts Vermont
X X X X
X X
X X X X
South Florida X X Western New York X X Wisconsin X X
Source: Site visit notes, Rounds 3 and 5. 1 For example, served targeted group and/or change in the types of services available. 2 No-cost extension until April 2013. 3 Sites with very small portions of the state as part of the BOND site were excluded from this exhibit. 4 Funding extended for most WIPA agencies through September 2012 through the use of state and private funding sources. 5 No cost extension until December 2012. N/A = not applicable because of the small geographic area included in this demonstration.
2.7.2. Other Non-BOND Benefits Counseling
Based on the information collected, it appears that the end of WIPA funding increased the chance that BOND treatment subjects would receive non-BOND benefits counseling. After WIPA funding ended, nearly all of the BOND sites used state and private funding sources to continue to provide non-BOND benefits counseling. However, ETO was discontinued, so these benefits counselors no longer have access to a flag that alerts them when a beneficiary is a BOND treatment subject. Based on reports from WIC and EWIC staffs, it appears that this has led to some BOND beneficiaries receiving counseling from benefits counselors who had no knowledge about their participation in BOND and, as a result, they might have received inaccurate information about how earnings affect their benefits. We cannot quantify the extent to which counseling that is not tailored to the benefit offset has been provided to treatment subjects. Even when federal funding for WIPA was available, there were cases in which non-BOND providers offered benefits counseling to SSDI beneficiaries participating in BOND. For example, in one site, state VR staff said that they had unknowingly provided current-law benefits counseling to BOND treatment subjects. They thus received incorrect information about how their earnings affected their benefits. When VR staff realized that the beneficiaries were in BOND, they set up a system to check for BOND
BOND Implementation and Evaluation Contract No. SS00-10-60011
Abt Associates Inc. Process Study Report 23
participation to avoid this mistake in the future. What is unclear is whether these scenarios always were identified and remedied across the sites. 2.8. Conclusion
Overall, the demonstration was implemented as planned. However, the implementation had to address many challenges; the nature of these challenges and how they were addressed will likely have at least some influence on estimated impacts. Many of these challenges stemmed from an important feature of the demonstration’s design: the 10 large geographic regions that comprise the demonstration’s sites. In many instances, serving beneficiaries across the entire site required the demonstration to contract with multiple counseling providers, to deal with the VR agencies of multiple states, and to train staff in the relevant program rules for the same states, such as those for Medicaid. The disruption in the WIPA program and its implications for counseling providers added to these challenges. The experience of implementing BOND has some relevance to implementation of a national program, but also reflects factors unique to a large demonstration. In a national program, SSA field offices, rather than special BOND site offices, presumably would serve as the local administrative hub for implementation. SSA manages field offices at a level comparable to that used for sites (areas served by SSA area offices), and staff in the field offices serve beneficiaries in their offices’ jurisdiction—in some instances crossing state boundaries. All SSDI beneficiaries would be eligible for the benefit offset, not just those randomly assigned via the demonstration’s selection process; all agencies, providers, advocacy organizations, and other stakeholders would learn about the new benefit design. Even so, with a national program, it would be necessary to serve beneficiaries in wide-ranging, diverse areas; address interactions between the SSDI benefit offset and state programs; and support and manage a benefits counseling program. Cross-site variation is of interest because of the information it provides about the potential opportunities and challenges of implementing a national program, and how these could vary from one SSA area office to another.

BOND Implementation and Evaluation Contract No. SS00-10-60011
Abt Associates Inc. Process Study Report 24
3. BOND Outreach and Enrollment
3.1. Introduction
As noted in Chapter 1, BOND was implemented in two stages. Stage 1 was designed to examine how a national benefit offset would affect the SSDI population as a whole, whereas Stage 2 was designed to assess the impact of the benefit offset on those most likely to use it and the effect of significant enhancements to the demonstration’s basic counseling services. By design, the demonstration involved different outreach and enrollment procedures for the two stages. Further, the I-team modified the approaches to outreach as it learned from early experiences and the demonstration evolved. This chapter describes outreach efforts in both stages. As earlier reports have assessed the initial Stage 1 outreach efforts and the entirety of Stage 2 outreach efforts, here we focus on the implementation and outcomes of the additional efforts to T1subjects conducted in two phases from 2012 to 2014. More detailed information on the implementation and results of initial Stage 1 and Stage 2 outreach is provided in Wittenburg et al. (2012) and Gubits et al. (2013), respectively. 3.2. Stage 1 Outreach and Engagement with the Demonstration
3.2.1. Stage 1 Implementation and Outcomes (2011)
Stage 1 outreach was initially limited, but later expanded based on recommendations in Wittenburg et al. (2012). After the completion of Stage 1 random assignment, those assigned to the T1 treatment group were notified of their involvement via a one-page letter sent by BOND central operations between May and August 2011.25 This was followed by a letter from SSA, typically sent about two weeks later, which reinforced the information in the original BOND letter and explained the specific rule changes that would affect benefits. The purpose of these efforts was to inform T1 beneficiaries of their status in the demonstration and make them aware of the offset and services available under BOND, including how to 25 BOND sent a final mailing in October 2011 as a follow-up to all letters initially returned as undeliverable.
Chapter Findings
Two early findings suggested that outreach to T1 subjects should be augmented—(1) low WIC take-up and offset use by T1 subjects in the first seven months of the demonstration (May to early December 2011) and (2) reports by BOND site office field staff of confusion among beneficiaries regarding the original outreach letter.
BOND call center staff conducted additional T1 outreach in two phases. The first phase (July−November 2012) was part of the original demonstration outreach plan and was directed at a group composed primarily of those having evidence of earnings. The second phase (April 2013−April 2014) was motivated by recommendations in Wittenburg et al. (2011) and targeted the remainder of T1 subjects not yet engaged with the demonstration.
Through the additional outreach, call center staff reached a minority of the targeted T1 subjects by telephone (29 percent in the first effort and 21 percent in the second); these efforts appear to have resulted in increases in beneficiary telephone contacts and intake record setups, WIC assignments and caseloads, and submissions of AEEs.

BOND Implementation and Evaluation Contract No. SS00-10-60011
Abt Associates Inc. Process Study Report 25
contact the demonstration. For more details on the outreach materials and initial contact process for T1 subjects, refer to Section 2.3.2 of Wittenburg et al. (2012). BOND site offices also provided information to selected provider and disability organizations, but the fact that a large majority of beneficiaries in touch with these stakeholders were not in the treatment group, coupled with staff turnover, may have diluted the effectiveness of this outreach. Initial Stage 1 outreach was implemented as planned. By the end of October 2011, 6.1 percent of T1 beneficiaries had been in contact with the demonstration and had completed record setup in the BODS (Wittenburg et al. 2012, Exhibit 4-1).26 At the same point, 1.3 percent of T1 subjects had contacted a WIC counselor,27 compared to 30 percent anticipated by the I-team (O’Day and Vandergoot 2010, Exhibit 4-1). In addition, 21 T1 subjects had used the offset, compared to 800 beneficiaries predicted to be eligible to use it in 2011.28 To provide context for the observed initial response, the original BOND outreach letter did not emphasize or direct recipients to contact BOND. This might have resulted in the correct assumption by beneficiaries that they did not have to reach out to the demonstration to use the offset. Even beneficiaries interested in the opportunities afforded by the offset would not necessarily have felt compelled to respond to the outreach letter or engage with WIC services right away. 3.2.2. Additional T1 Outreach Efforts (2012 and 2013−2014)
The findings described above led the I-team to conclude that expanded outreach was needed to ensure that T1 subjects were aware of the opportunity to use the offset, trusted the opportunity, and understood how to use it (Wittenburg et al. 2012). In response to the findings, the team strengthened the plan for additional T1 outreach. In this section, we describe the additional outreach efforts. Description of Additional Outreach The 2012 outreach to a subset of T1 subjects with evidence of earnings (and thus more likely to use the offset) was part of the demonstration’s original outreach plan. The purpose of this effort, as originally conceived, was to remind subjects with earnings about the demonstration and their assignment to the offset. At the BOND evaluation team’s suggestion, however, the approach was revised to support a test of the impact of the additional outreach. The ultimate sample for this 2012 effort comprised 10,388 T1
26 The concept of setup was not part of the initial evaluation design, but rather was developed by the I-team in
2011. It serves to identify and track beneficiaries who have received a basic explanation of the demonstration and helps to distinguish them from those who had contact with the demonstration but did not stay on the telephone long enough to receive the critical information. A beneficiary’s record is considered set up when a BOND staff member affirms that both WIC services and BOND reporting requirements were discussed with BOND call center staff during the outreach call. This definition was established in October 2013. Before that time, a beneficiary was considered set up when any answer (yes or no) was recorded in BTS to the question asking whether WIC services and BOND reporting requirements had been discussed.
27 This figure represents those T1 subjects who had a contact for WIC services recorded in ETO. See Wittenburg et al. 2012, Exhibit 4-3.
28 Wittenburg et al. (2012) used data from a prior year to predict that at least 800 T1 beneficiaries had sufficient 2011 earnings to have their benefits adjusted under the offset. Since that document’s publication, retroactive adjustments have continued to increase the number of T1 subjects with benefit adjustments for 2011.
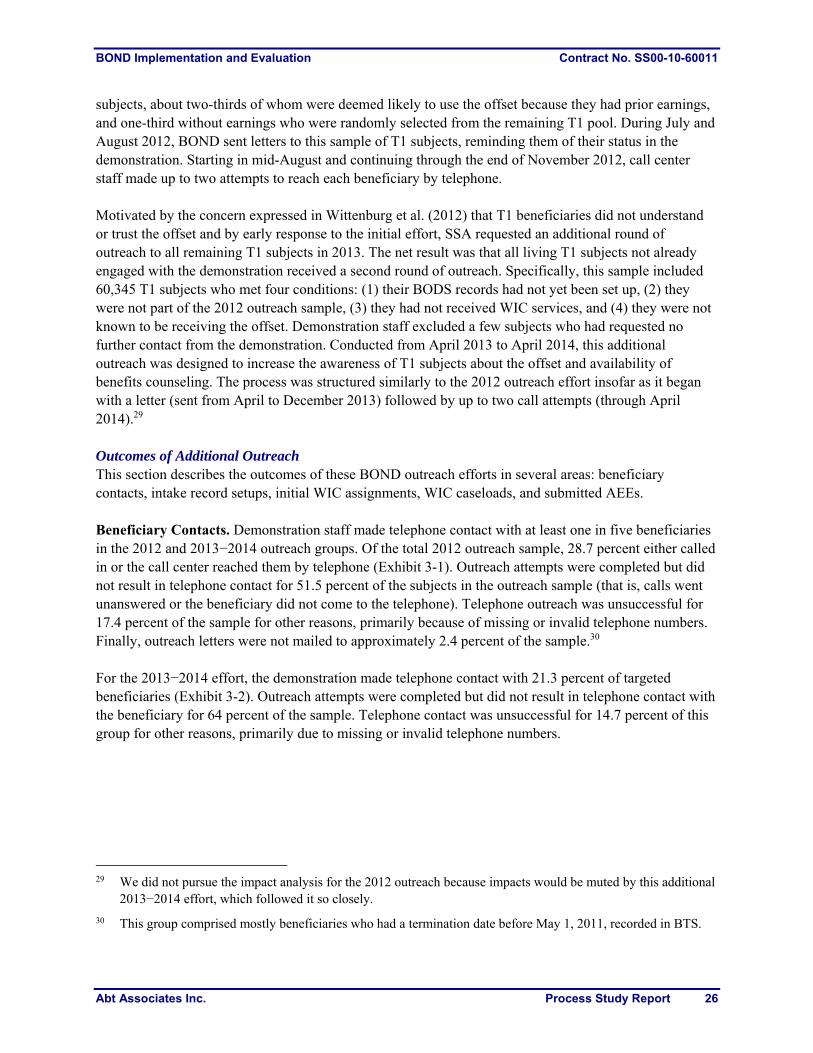
BOND Implementation and Evaluation Contract No. SS00-10-60011
Abt Associates Inc. Process Study Report 26
subjects, about two-thirds of whom were deemed likely to use the offset because they had prior earnings, and one-third without earnings who were randomly selected from the remaining T1 pool. During July and August 2012, BOND sent letters to this sample of T1 subjects, reminding them of their status in the demonstration. Starting in mid-August and continuing through the end of November 2012, call center staff made up to two attempts to reach each beneficiary by telephone. Motivated by the concern expressed in Wittenburg et al. (2012) that T1 beneficiaries did not understand or trust the offset and by early response to the initial effort, SSA requested an additional round of outreach to all remaining T1 subjects in 2013. The net result was that all living T1 subjects not already engaged with the demonstration received a second round of outreach. Specifically, this sample included 60,345 T1 subjects who met four conditions: (1) their BODS records had not yet been set up, (2) they were not part of the 2012 outreach sample, (3) they had not received WIC services, and (4) they were not known to be receiving the offset. Demonstration staff excluded a few subjects who had requested no further contact from the demonstration. Conducted from April 2013 to April 2014, this additional outreach was designed to increase the awareness of T1 subjects about the offset and availability of benefits counseling. The process was structured similarly to the 2012 outreach effort insofar as it began with a letter (sent from April to December 2013) followed by up to two call attempts (through April 2014).29 Outcomes of Additional Outreach This section describes the outcomes of these BOND outreach efforts in several areas: beneficiary contacts, intake record setups, initial WIC assignments, WIC caseloads, and submitted AEEs. Beneficiary Contacts. Demonstration staff made telephone contact with at least one in five beneficiaries in the 2012 and 2013−2014 outreach groups. Of the total 2012 outreach sample, 28.7 percent either called in or the call center reached them by telephone (Exhibit 3-1). Outreach attempts were completed but did not result in telephone contact for 51.5 percent of the subjects in the outreach sample (that is, calls went unanswered or the beneficiary did not come to the telephone). Telephone outreach was unsuccessful for 17.4 percent of the sample for other reasons, primarily because of missing or invalid telephone numbers. Finally, outreach letters were not mailed to approximately 2.4 percent of the sample.30 For the 2013−2014 effort, the demonstration made telephone contact with 21.3 percent of targeted beneficiaries (Exhibit 3-2). Outreach attempts were completed but did not result in telephone contact with the beneficiary for 64 percent of the sample. Telephone contact was unsuccessful for 14.7 percent of this group for other reasons, primarily due to missing or invalid telephone numbers.
29 We did not pursue the impact analysis for the 2012 outreach because impacts would be muted by this additional
2013−2014 effort, which followed it so closely.
30 This group comprised mostly beneficiaries who had a termination date before May 1, 2011, recorded in BTS.
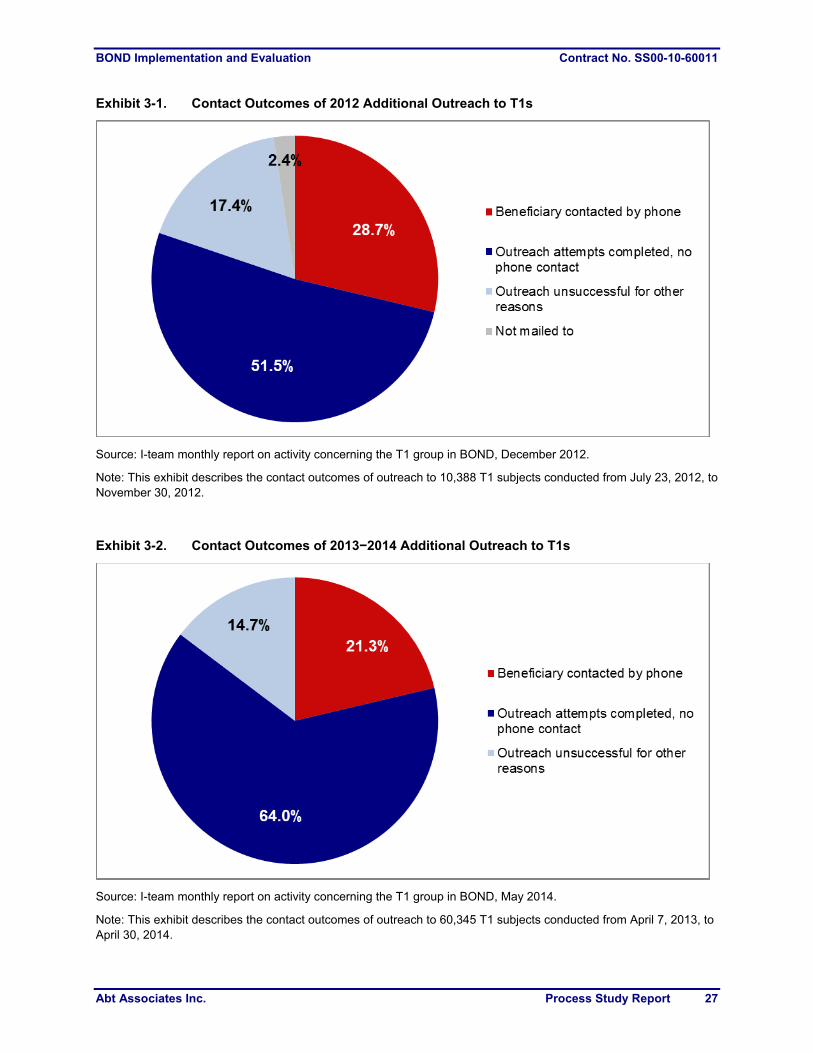
BOND Implementation and Evaluation Contract No. SS00-10-60011
Abt Associates Inc. Process Study Report 27
Exhibit 3-1. Contact Outcomes of 2012 Additional Outreach to T1s
Source: I-team monthly report on activity concerning the T1 group in BOND, December 2012.
Note: This exhibit describes the contact outcomes of outreach to 10,388 T1 subjects conducted from July 23, 2012, to November 30, 2012.
Exhibit 3-2. Contact Outcomes of 2013−2014 Additional Outreach to T1s
Source: I-team monthly report on activity concerning the T1 group in BOND, May 2014.
Note: This exhibit describes the contact outcomes of outreach to 60,345 T1 subjects conducted from April 7, 2013, to April 30, 2014.

BOND Implementation and Evaluation Contract No. SS00-10-60011
Abt Associates Inc. Process Study Report 28
Beneficiary Record Setups. The number and rate of T1 setup completions rose substantially during both outreach periods. Completed setups among the 2012 T1 outreach sample increased from 11.6 percent of the sample at the start of 2012 outreach31 to 31.2 percent one month after the end of the effort (December 31, 2012), a 19.6 percentage point increase. Similarly, between the start of the 2013−2014 outreach effort and April 30, 2014, there was an 18.3 percentage point increase in setups for the sample. Although we cannot say precisely how many setups were a direct result of the additional outreach efforts,32 both rounds of outreach have coincided with a jump in the rate of completed setups among all T1 subjects, with a total increase from 7.0 percent to 9.7 percent from the beginning to the end of the 2012 outreach, and from 9.8 percent to 27.6 percent from the beginning to the end of the 2013−2014 outreach (Exhibit 3-3). Exhibit 3-3. Change in T1 Setups During Periods with and Without Additional Outreach
Source: I-team weekly email updates on BOND T1 activity.
Note: On October 15, 2013, the definition of complete setup changed. Originally, complete setups were defined as records in which two questions were answered, but not necessarily affirmatively, as to whether BOND reporting requirements and WIC services were discussed with the beneficiary. Starting in mid-October 2013, complete setups required those two questions to be answered affirmatively.
WIC Assignments and Caseloads. The number and rate of first WIC assignments33 also increased during the additional outreach periods. In the 2012 outreach sample, 2.5 percent of beneficiaries had an initial WIC assignment between the start and one month after the end of outreach. The corresponding
31 The 2012 T1 outreach sample included some beneficiaries who already were set up but either were not
receiving WIC services or completed setup between the sample draw and the time of outreach.
32 Some setups would have undoubtedly occurred during this period even if there had not been additional outreach.
33 The term WIC assignments is an indicator in BODS that the beneficiary has contacted the WIC and the WIC has logged the contact in BODS.
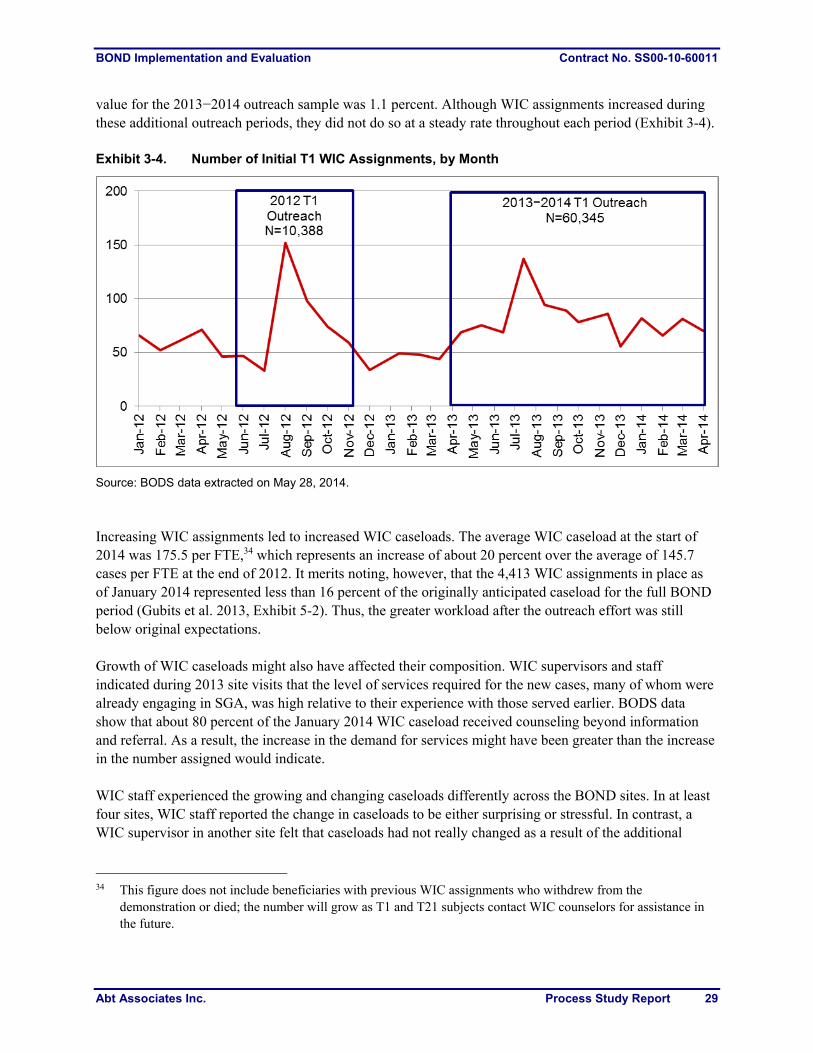
BOND Implementation and Evaluation Contract No. SS00-10-60011
Abt Associates Inc. Process Study Report 29
value for the 2013−2014 outreach sample was 1.1 percent. Although WIC assignments increased during these additional outreach periods, they did not do so at a steady rate throughout each period (Exhibit 3-4). Exhibit 3-4. Number of Initial T1 WIC Assignments, by Month
Source: BODS data extracted on May 28, 2014.
Increasing WIC assignments led to increased WIC caseloads. The average WIC caseload at the start of 2014 was 175.5 per FTE,34 which represents an increase of about 20 percent over the average of 145.7 cases per FTE at the end of 2012. It merits noting, however, that the 4,413 WIC assignments in place as of January 2014 represented less than 16 percent of the originally anticipated caseload for the full BOND period (Gubits et al. 2013, Exhibit 5-2). Thus, the greater workload after the outreach effort was still below original expectations. Growth of WIC caseloads might also have affected their composition. WIC supervisors and staff indicated during 2013 site visits that the level of services required for the new cases, many of whom were already engaging in SGA, was high relative to their experience with those served earlier. BODS data show that about 80 percent of the January 2014 WIC caseload received counseling beyond information and referral. As a result, the increase in the demand for services might have been greater than the increase in the number assigned would indicate. WIC staff experienced the growing and changing caseloads differently across the BOND sites. In at least four sites, WIC staff reported the change in caseloads to be either surprising or stressful. In contrast, a WIC supervisor in another site felt that caseloads had not really changed as a result of the additional
34 This figure does not include beneficiaries with previous WIC assignments who withdrew from the
demonstration or died; the number will grow as T1 and T21 subjects contact WIC counselors for assistance in the future.
BOND Implementation and Evaluation Contract No. SS00-10-60011
Abt Associates Inc. Process Study Report 30
outreach. In yet another site, WIC staff reported that their site liaison kept them abreast of outreach efforts, so they were not surprised by changes in caseloads. Submission of AEEs. One final outcome area to consider with respect to BOND outreach is the submission of AEEs. AEE submission is the last step taken by beneficiaries in the process for contemporaneously adjusting benefits according to the offset rules (see Chapter 5 for more details). Among the 2012 T1 outreach sample, 0.4 percent had submitted an AEE before the outreach period started; an additional 1.0 percent submitted an AEE between the start and one month after the end of outreach. The increase in AEEs submitted suggests that information communicated to beneficiaries by the call center or WIC staff encouraged beneficiaries to work with the demonstration to have their benefits adjusted under the offset. The number of beneficiaries submitting AEEs continued to rise thereafter, but the association between later outreach and AEE submissions is unclear and might reflect SSA’s reconciliation efforts in early 2013. Although the observed increases in T1 beneficiary setups, WIC assignments and caseloads, and AEE submissions coincided with the two periods of additional BOND outreach, they cannot be fully attributed to the outreach efforts. Some of the increases might have resulted from other factors, including but not limited to SSA having accelerated the processing of work CDRs in summer 2013 and completion of the automated reconciliation with IRS data for 2011 in January 2013. The latter resulted in improper payment notices to a substantial number of T1 subjects, potentially prompting them to seek WIC services. Data from site visit interviews reflect a general perception among WIC supervisors and staff that caseloads increased with additional T1 outreach, but this was not reported uniformly across all sites. In summary, the findings from our analysis of the follow-up outreach indicate that it increased treatment beneficiaries’ use of demonstration services, including in some cases the completion of initial steps that could lead to the adjustment of benefits under the offset. Hence, as intended, it appears that the outreach has reduced the size of any gap between how treatment subjects will behave in the demonstration and how they would behave under a national program in which information about the offset rules would be more widely available, understood, and trusted. We are not able to determine the size of any behavioral gap that remains. Although the demonstration was able to contact only a minority of those targeted for outreach and had setup the records of fewer than a third of T1 subjects as of the end April 2014, it might be that the vast majority of T1 subjects able and willing to engage in SGA are among those who have a good understanding of the opportunity to use the offset, for two reasons. First, compared to those unable or unwilling to engage in SGA, they seem more likely to pay attention to an offer that increases the incentive to engage in SGA. Second, if they have already had substantial earnings, SSA is likely to have contacted them because of IRS earnings reports. Hence, the remaining gap might be quite small. 3.3. Stage 2 Outreach and Enrollment
As noted, Stage 2 was designed to test the effect of the benefit offset on those most likely to use demonstration services and to assess the impact of enhancements to the demonstration’s basic work incentives counseling. Hence, the Stage 2 outreach encouraged members of the solicitation pool to volunteer for the demonstration. From the solicitation pool, BOND central operations sent a letter inviting SSDI-only beneficiaries with a mailing address within a BOND site to enroll in the demonstration. Working in waves, central operations first sent potential subjects letters from January 2011 to August 2012. The demonstration then sent up to two follow-up letters and the call center made up to three outreach calls, for a total of five contact attempts. Those beneficiaries who volunteered for the
BOND Implementation and Evaluation Contract No. SS00-10-60011
Abt Associates Inc. Process Study Report 31
demonstration were screened and scheduled for an enrollment interview, at which they were randomized into one of three groups if they completed the informed consent process: (1) the T21 treatment group, for which the benefit offset, counseling (WIC), and all demonstration processes other than recruitment were the same as for the T1 group from Stage 1; (2) the T22 treatment group, for which treatment was the same as for T21 except that subjects received EWIC; or (3) the C2 control group. Stage 2 outreach concluded in September 2012. For more details, see Section 3.1 of Gubits et al. (2013). Stage 2 outreach resulted in higher-than-expected enrollment rates. Although enrollment was projected at 4.0 percent for the full outreach sample, 6.2 percent of beneficiaries contacted during the first 6 waves of outreach enrolled in the demonstration and 5.4 percent enrolled across all 14 waves. The lower response for the later waves reflects the fact that the target sample size was achieved before the later waves received all outreach attempts. In the end, fewer and smaller outreach waves were needed than had originally been planned. This approach did not invalidate randomization. Indeed, random assignment of Stage 2 volunteers resulted in three well-matched groups. Finally, because all volunteers were provided with extensive information about the offset and demonstration processes during the informed consent process, there was no need for further outreach to these beneficiaries after they enrolled. For more details, see Section 3.2 of Gubits et al. (2013). 3.4. Findings Across Stages 1 and 2
Up to this point in the chapter, we have discussed Stages 1 and 2 separately, focusing on the presentation and discussion of findings from the process study data. It is worthwhile, however, to note a few findings from qualitative data that cut across Stages 1 and 2.35 In particular, data from interviews with BOND staff and focus groups with treatment subjects indicate that beneficiaries in both stages of the demonstration have at some point misunderstood and/or mistrusted the demonstration. Gubits et al. (2013) present detailed findings from BOND staff interviews indicating that Stage 2 sample members did not always understand or believe the BOND outreach letters. These sentiments were echoed in more recent (2013) focus groups with Stages 1 and 2 beneficiaries. For example, focus group participants in four sites indicated that initially they held the mistaken belief that BOND would help them get a job. Similarly, beneficiaries participating in EWIC focus groups expressed initial skepticism about the demonstration, with one participant describing the outreach letter as “fake” and “too good to be true.” Despite such misunderstandings or misgivings about BOND, the demonstration was not without appeal to beneficiaries. Beneficiaries participating in WIC and EWIC focus groups expressed enthusiasm about the demonstration when responding to questions about their initial reactions to BOND. There was broad interest in the offset, with participants in focus groups at seven sites indicating that the opportunity to keep more earnings was an appealing feature of BOND. Participants in four sites said they were attracted by the opportunity to work, and those in one EWIC focus group reported interest in benefits counseling.
35 The 2012 site visits occurred shortly after the conclusion of Stage 2 outreach, and the 2013 site visits occurred
in the midst of the second round of additional Stage 1 outreach efforts. Focus groups included beneficiaries from the T1, T21, and T22 treatment groups.

BOND Implementation and Evaluation Contract No. SS00-10-60011
Abt Associates Inc. Process Study Report 32
3.5. Conclusion
BOND outreach and enrollment efforts have had some success reaching beneficiaries; however, the extent to which more intensive efforts would have changed the observed outcomes is unclear. Based on reports from field staff and beneficiaries, original Stage 1 efforts appeared to have left some beneficiaries poorly informed about the demonstration (see Wittenburg et al. 2012). The 36-month survey will provide additional evidence concerning treatment subjects’ understanding of the opportunity provided by the offset. In contrast, given higher-than-expected response rates, Stage 2 outreach was curtailed before the final sample releases were fully worked. The distinction between the Stage 1 and Stage 2 samples is important for considering the different outcomes of the respective outreach efforts. Still, according to field staff and beneficiaries, treatment subjects in samples from both stages in some cases appeared to have misunderstood or mistrusted the demonstration based on the outreach information they received. Among those who take up benefits counseling, the demonstration has an opportunity to improve upon the information delivered through outreach and enrollment, and advance beneficiary participation in the offset. We address BOND counseling efforts in the next chapter.
BOND Implementation and Evaluation Contract No. SS00-10-60011
Abt Associates Inc. Process Study Report 33
4. BOND Benefits Counseling
Benefits counseling is a key component of BOND. The counseling developed for BOND was intended to enable beneficiaries to understand and take advantage of the offset. BOND included two types of counseling: (1) basic counseling (WIC), which was designed to be comparable to the counseling available in the current system; and (2) enhanced counseling (EWIC). WIC staff serve beneficiaries assigned to treatment in Stage 1 (T1 subjects) and Stage 2 volunteers assigned to the T21 treatment group (see Appendix C). EWIC staff serve only Stage 2 volunteers assigned to the T22 treatment group. 4.1. Design of BOND Counseling
As designed, both WIC and EWIC staff are expected to explain how BOND rules operate and help beneficiaries understand how BOND would affect total income and other benefits under earnings scenarios relevant to their circumstances. WIC was designed to provide a range and intensity of services similar to those delivered by Community Work Incentives Coordinators (CWICs) under WIPA. EWIC services are intended to be more intensive than WIC services. The more intensive components of EWIC services include the development of a detailed employment support plan based on assessments of vocational skills and interests, and assistance in helping beneficiaries obtain the resources and support they need to find employment, as well as the ongoing support they need to keep it. Compared to WIC staff members, EWIC staff were expected to have substantially more contact with beneficiaries. EWIC staff were instructed to contact all T22 beneficiaries within two weeks of random assignment and contact them thereafter at least once per month over the course of BOND.36 In contrast,
36 The requirements for EWIC contact were modified in early 2014 after all T22 subject had received at least 18
months of monthly contact. Now, all engaged T22 subjects must receive at least quarterly contact from EWIC
Chapter Findings
Consistent with the program design, there is a clear difference in the quantity and nature of counseling received by beneficiaries assigned to WIC as compared to EWIC counseling services, both collectively and across sites.
Compared to staff who provide current-law benefits counseling to control group subjects, both WIC and EWIC benefits counseling staff have greater responsibility for assisting beneficiaries with post-entitlement work that directly affects benefits. Post-entitlement work consists of reporting and documenting earnings to SSA, as well as earnings disregards, such as for impairment-related work expenses; these are deducted from earnings to calculate benefit payments under the offset.
Counselors report that post-entitlement work takes a great deal of time and effort to complete. Some also are dissatisfied because they think this work puts them in the position of acting as an agent for SSA, rather than their clients.
In many sites, post-entitlement work is now being performed by contractor staff at a central office, rather than the counselors. This staffing change addresses issues brought about by relying on WIC and EWIC staff.
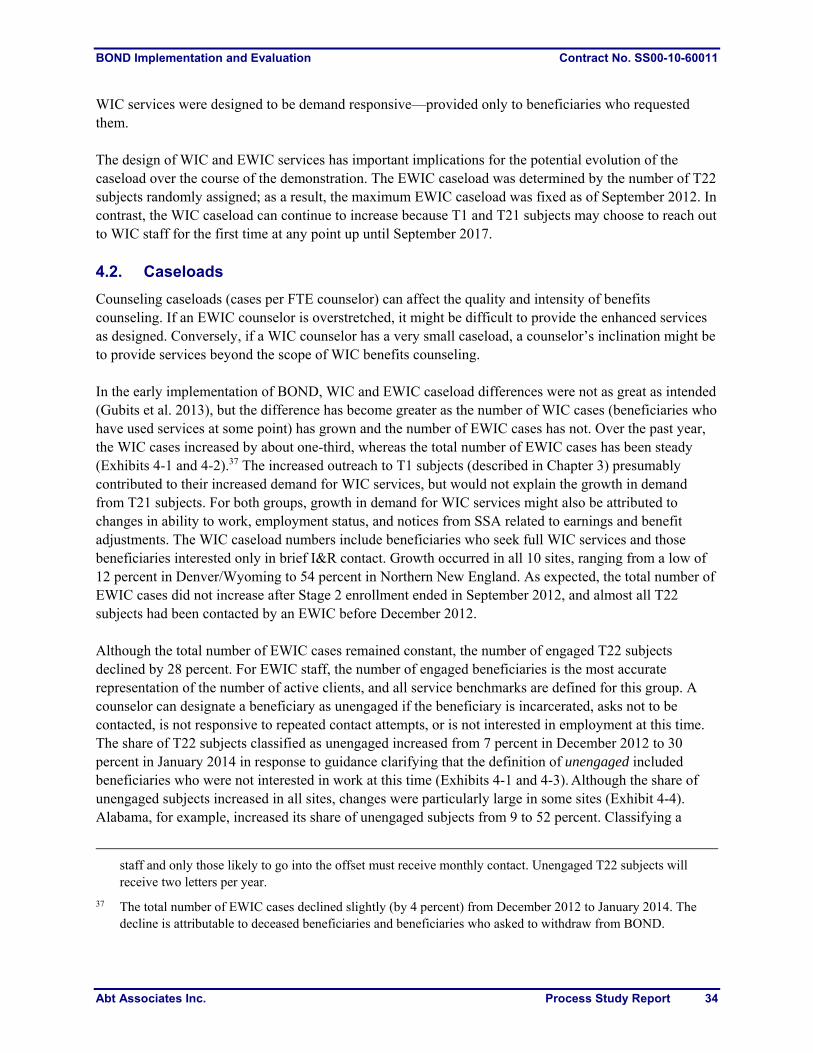
BOND Implementation and Evaluation Contract No. SS00-10-60011
Abt Associates Inc. Process Study Report 34
WIC services were designed to be demand responsive—provided only to beneficiaries who requested them. The design of WIC and EWIC services has important implications for the potential evolution of the caseload over the course of the demonstration. The EWIC caseload was determined by the number of T22 subjects randomly assigned; as a result, the maximum EWIC caseload was fixed as of September 2012. In contrast, the WIC caseload can continue to increase because T1 and T21 subjects may choose to reach out to WIC staff for the first time at any point up until September 2017. 4.2. Caseloads
Counseling caseloads (cases per FTE counselor) can affect the quality and intensity of benefits counseling. If an EWIC counselor is overstretched, it might be difficult to provide the enhanced services as designed. Conversely, if a WIC counselor has a very small caseload, a counselor’s inclination might be to provide services beyond the scope of WIC benefits counseling. In the early implementation of BOND, WIC and EWIC caseload differences were not as great as intended (Gubits et al. 2013), but the difference has become greater as the number of WIC cases (beneficiaries who have used services at some point) has grown and the number of EWIC cases has not. Over the past year, the WIC cases increased by about one-third, whereas the total number of EWIC cases has been steady (Exhibits 4-1 and 4-2).37 The increased outreach to T1 subjects (described in Chapter 3) presumably contributed to their increased demand for WIC services, but would not explain the growth in demand from T21 subjects. For both groups, growth in demand for WIC services might also be attributed to changes in ability to work, employment status, and notices from SSA related to earnings and benefit adjustments. The WIC caseload numbers include beneficiaries who seek full WIC services and those beneficiaries interested only in brief I&R contact. Growth occurred in all 10 sites, ranging from a low of 12 percent in Denver/Wyoming to 54 percent in Northern New England. As expected, the total number of EWIC cases did not increase after Stage 2 enrollment ended in September 2012, and almost all T22 subjects had been contacted by an EWIC before December 2012. Although the total number of EWIC cases remained constant, the number of engaged T22 subjects declined by 28 percent. For EWIC staff, the number of engaged beneficiaries is the most accurate representation of the number of active clients, and all service benchmarks are defined for this group. A counselor can designate a beneficiary as unengaged if the beneficiary is incarcerated, asks not to be contacted, is not responsive to repeated contact attempts, or is not interested in employment at this time. The share of T22 subjects classified as unengaged increased from 7 percent in December 2012 to 30 percent in January 2014 in response to guidance clarifying that the definition of unengaged included beneficiaries who were not interested in work at this time (Exhibits 4-1 and 4-3). Although the share of unengaged subjects increased in all sites, changes were particularly large in some sites (Exhibit 4-4). Alabama, for example, increased its share of unengaged subjects from 9 to 52 percent. Classifying a
staff and only those likely to go into the offset must receive monthly contact. Unengaged T22 subjects will receive two letters per year.
37 The total number of EWIC cases declined slightly (by 4 percent) from December 2012 to January 2014. The decline is attributable to deceased beneficiaries and beneficiaries who asked to withdraw from BOND.
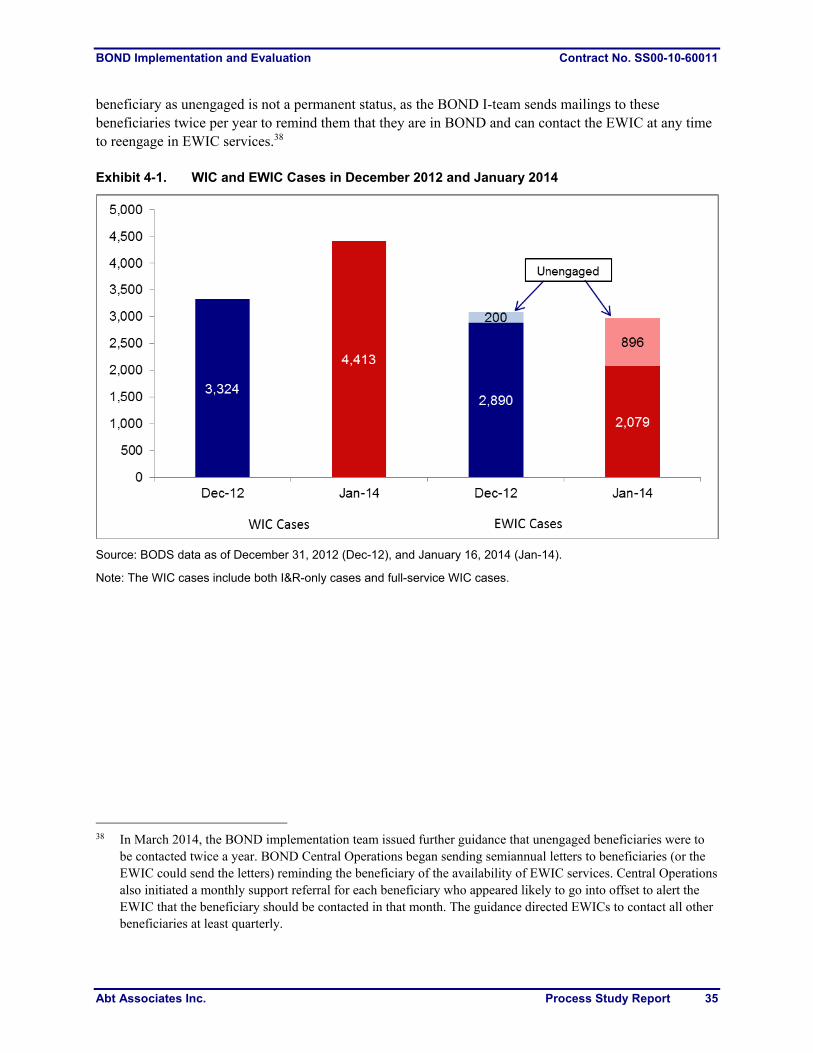
BOND Implementation and Evaluation Contract No. SS00-10-60011
Abt Associates Inc. Process Study Report 35
beneficiary as unengaged is not a permanent status, as the BOND I-team sends mailings to these beneficiaries twice per year to remind them that they are in BOND and can contact the EWIC at any time to reengage in EWIC services.38 Exhibit 4-1. WIC and EWIC Cases in December 2012 and January 2014
Source: BODS data as of December 31, 2012 (Dec-12), and January 16, 2014 (Jan-14).
Note: The WIC cases include both I&R-only cases and full-service WIC cases.
38 In March 2014, the BOND implementation team issued further guidance that unengaged beneficiaries were to
be contacted twice a year. BOND Central Operations began sending semiannual letters to beneficiaries (or the EWIC could send the letters) reminding the beneficiary of the availability of EWIC services. Central Operations also initiated a monthly support referral for each beneficiary who appeared likely to go into offset to alert the EWIC that the beneficiary should be contacted in that month. The guidance directed EWICs to contact all other beneficiaries at least quarterly.
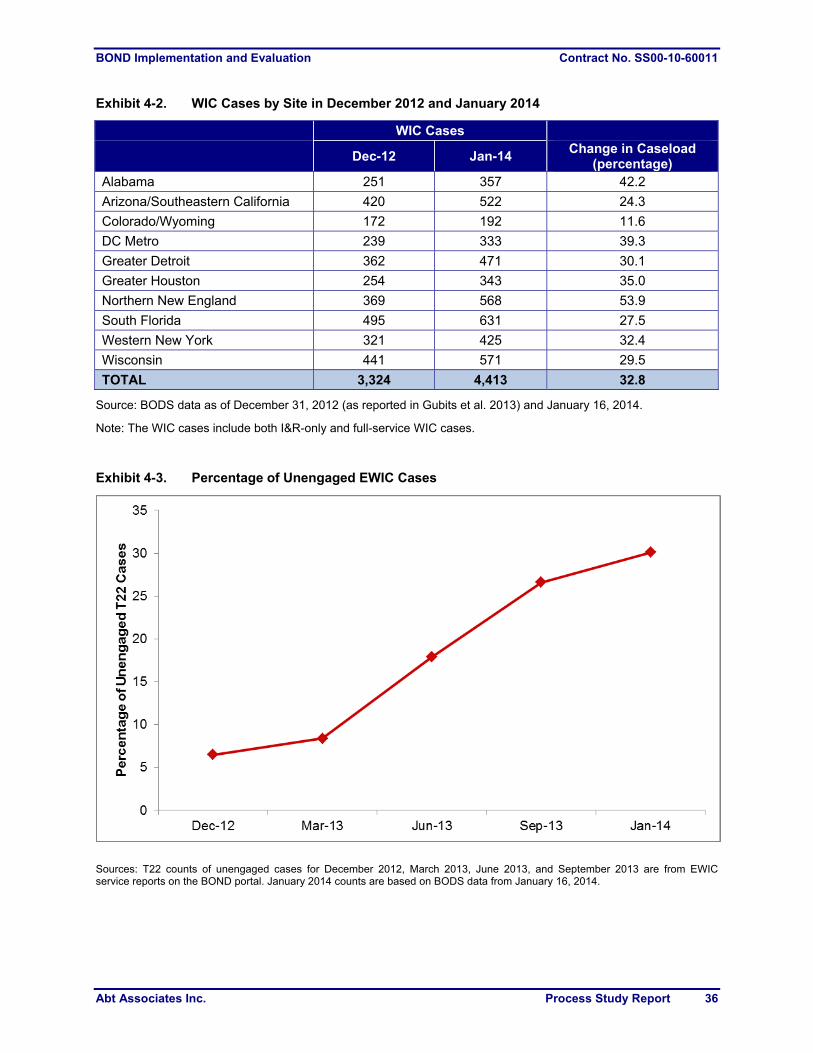
BOND Implementation and Evaluation Contract No. SS00-10-60011
Abt Associates Inc. Process Study Report 36
Exhibit 4-2. WIC Cases by Site in December 2012 and January 2014
WIC Cases
Dec-12 Jan-14 Change in Caseload
(percentage) Alabama 251 357 42.2
Arizona/Southeastern California 420 522 24.3
Colorado/Wyoming 172 192 11.6
DC Metro 239 333 39.3
Greater Detroit 362 471 30.1
Greater Houston 254 343 35.0
Northern New England 369 568 53.9
South Florida 495 631 27.5
Western New York 321 425 32.4
Wisconsin 441 571 29.5
TOTAL 3,324 4,413 32.8
Source: BODS data as of December 31, 2012 (as reported in Gubits et al. 2013) and January 16, 2014.
Note: The WIC cases include both I&R-only and full-service WIC cases.
Exhibit 4-3. Percentage of Unengaged EWIC Cases
Sources: T22 counts of unengaged cases for December 2012, March 2013, June 2013, and September 2013 are from EWIC service reports on the BOND portal. January 2014 counts are based on BODS data from January 16, 2014.
BOND Implementation and Evaluation Contract No. SS00-10-60011
Abt Associates Inc. Process Study Report 37
Exhibit 4-4. Engaged EWIC Cases in December 2012 and January 2014
Engaged EWIC Cases
Dec-12 Jan-14 Change in Caseload
(percentage) Alabama 285 139 -51.2
Arizona/Southeastern California 360 195 -45.8
Colorado/Wyoming 245 210 -14.3
DC Metro 229 197 -14.0
Greater Detroit 265 220 -17.0
Greater Houston 248 155 -37.5
Northern New England 279 221 -20.8
South Florida 375 286 -23.7
Western New York 278 231 -16.9
Wisconsin 326 225 -31.0
TOTAL 2,890 2,079 -28.1
Sources: EWIC December 2012: EWIC data on number of engaged T22 clients from state EWIC reports for December 2012. EWIC January 2014: EWIC data on number of engaged T22 clients from BODS data as of January 16, 2014.
In January 2014, EWIC caseloads were lower than WIC caseloads, as planned. WIC staff served an average of 176 beneficiaries per FTE, compared to 95 engaged beneficiaries per FTE for EWIC staff. WIC caseloads were larger than EWIC caseloads for engaged clients in every site (Exhibit 4-5). In contrast, in December 2012, EWIC caseloads were higher than WIC caseloads in the Northern New England site (Gubits et al. 2013). In addition, the average ratio of EWIC to WIC cases across all sites was higher in December 2012 than in January 2014. This reflects changes in the total number of cases as well as some adjustments to counselor staffing. As reported in Gubits et al. (2013), significant variations remain in caseload size across sites. As of January 2014, WIC caseloads per FTE ranged from 119 to 222 subjects, whereas the number of engaged EWIC cases per FTE ranged from 76 to 116 subjects. On average, the engaged EWIC caseload was 54 percent as large as the WIC caseload. The ratio of EWIC to WIC caseloads varied significantly across sites, from Wisconsin, where the EWIC caseload was 38 percent as large as the WIC caseload, to Colorado/Wyoming, where the EWIC caseload was 88 percent as large as the WIC caseload. Site visits also revealed significant variation in caseload size within a site for each type of counselor, primarily due to differences in counselors’ tenure and geographic location.
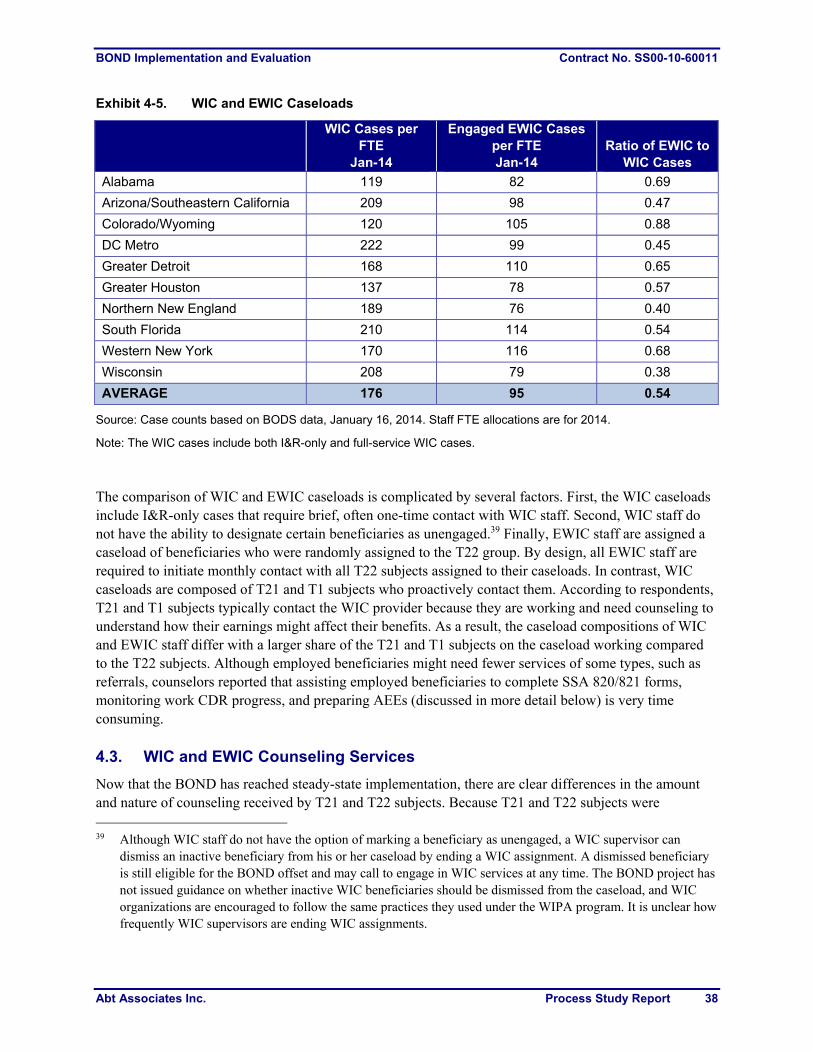
BOND Implementation and Evaluation Contract No. SS00-10-60011
Abt Associates Inc. Process Study Report 38
Exhibit 4-5. WIC and EWIC Caseloads
WIC Cases per FTE
Jan-14
Engaged EWIC Cases per FTE Jan-14
Ratio of EWIC to WIC Cases
Alabama 119 82 0.69
Arizona/Southeastern California 209 98 0.47
Colorado/Wyoming 120 105 0.88
DC Metro 222 99 0.45
Greater Detroit 168 110 0.65
Greater Houston 137 78 0.57
Northern New England 189 76 0.40
South Florida 210 114 0.54
Western New York 170 116 0.68
Wisconsin 208 79 0.38
AVERAGE 176 95 0.54
Source: Case counts based on BODS data, January 16, 2014. Staff FTE allocations are for 2014.
Note: The WIC cases include both I&R-only and full-service WIC cases.
The comparison of WIC and EWIC caseloads is complicated by several factors. First, the WIC caseloads include I&R-only cases that require brief, often one-time contact with WIC staff. Second, WIC staff do not have the ability to designate certain beneficiaries as unengaged.39 Finally, EWIC staff are assigned a caseload of beneficiaries who were randomly assigned to the T22 group. By design, all EWIC staff are required to initiate monthly contact with all T22 subjects assigned to their caseloads. In contrast, WIC caseloads are composed of T21 and T1 subjects who proactively contact them. According to respondents, T21 and T1 subjects typically contact the WIC provider because they are working and need counseling to understand how their earnings might affect their benefits. As a result, the caseload compositions of WIC and EWIC staff differ with a larger share of the T21 and T1 subjects on the caseload working compared to the T22 subjects. Although employed beneficiaries might need fewer services of some types, such as referrals, counselors reported that assisting employed beneficiaries to complete SSA 820/821 forms, monitoring work CDR progress, and preparing AEEs (discussed in more detail below) is very time consuming. 4.3. WIC and EWIC Counseling Services
Now that the BOND has reached steady-state implementation, there are clear differences in the amount and nature of counseling received by T21 and T22 subjects. Because T21 and T22 subjects were 39 Although WIC staff do not have the option of marking a beneficiary as unengaged, a WIC supervisor can
dismiss an inactive beneficiary from his or her caseload by ending a WIC assignment. A dismissed beneficiary is still eligible for the BOND offset and may call to engage in WIC services at any time. The BOND project has not issued guidance on whether inactive WIC beneficiaries should be dismissed from the caseload, and WIC organizations are encouraged to follow the same practices they used under the WIPA program. It is unclear how frequently WIC supervisors are ending WIC assignments.
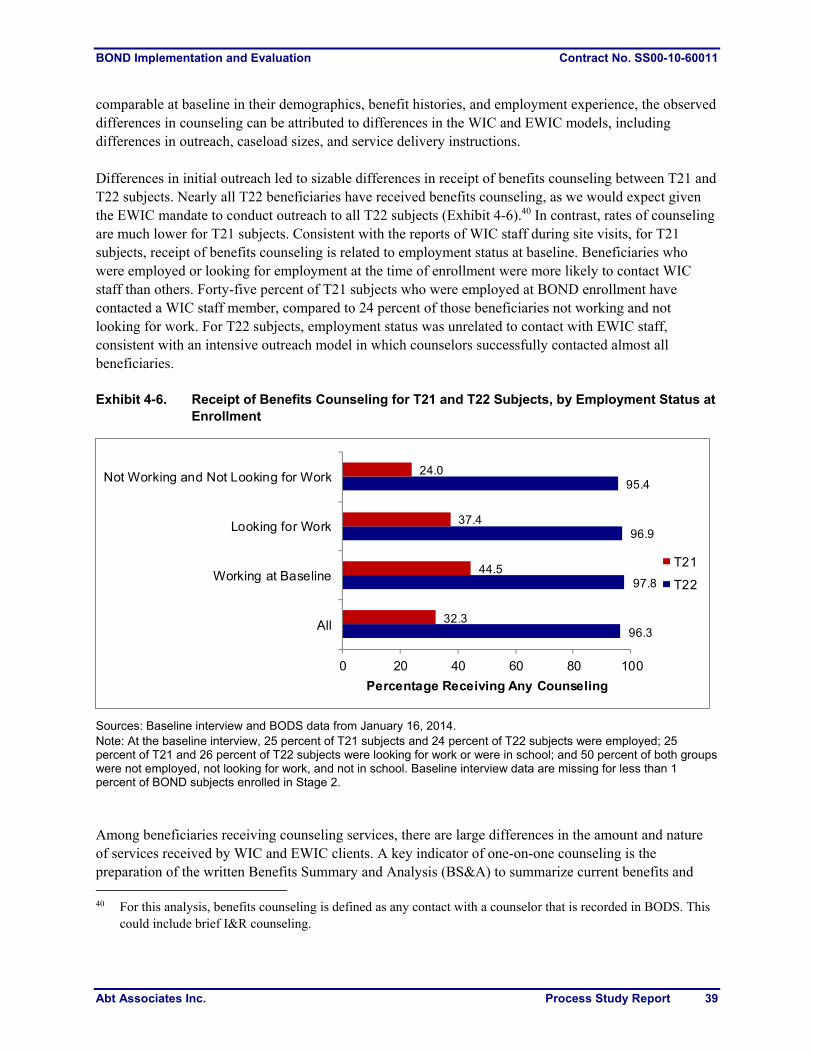
BOND Implementation and Evaluation Contract No. SS00-10-60011
Abt Associates Inc. Process Study Report 39
comparable at baseline in their demographics, benefit histories, and employment experience, the observed differences in counseling can be attributed to differences in the WIC and EWIC models, including differences in outreach, caseload sizes, and service delivery instructions. Differences in initial outreach led to sizable differences in receipt of benefits counseling between T21 and T22 subjects. Nearly all T22 beneficiaries have received benefits counseling, as we would expect given the EWIC mandate to conduct outreach to all T22 subjects (Exhibit 4-6).40 In contrast, rates of counseling are much lower for T21 subjects. Consistent with the reports of WIC staff during site visits, for T21 subjects, receipt of benefits counseling is related to employment status at baseline. Beneficiaries who were employed or looking for employment at the time of enrollment were more likely to contact WIC staff than others. Forty-five percent of T21 subjects who were employed at BOND enrollment have contacted a WIC staff member, compared to 24 percent of those beneficiaries not working and not looking for work. For T22 subjects, employment status was unrelated to contact with EWIC staff, consistent with an intensive outreach model in which counselors successfully contacted almost all beneficiaries. Exhibit 4-6. Receipt of Benefits Counseling for T21 and T22 Subjects, by Employment Status at
Enrollment
96.3
97.8
96.9
95.4
32.3
44.5
37.4
24.0
0 20 40 60 80 100
All
Working at Baseline
Looking for Work
Not Working and Not Looking for Work
Percentage Receiving Any Counseling
T21
T22
Sources: Baseline interview and BODS data from January 16, 2014. Note: At the baseline interview, 25 percent of T21 subjects and 24 percent of T22 subjects were employed; 25 percent of T21 and 26 percent of T22 subjects were looking for work or were in school; and 50 percent of both groups were not employed, not looking for work, and not in school. Baseline interview data are missing for less than 1 percent of BOND subjects enrolled in Stage 2. Among beneficiaries receiving counseling services, there are large differences in the amount and nature of services received by WIC and EWIC clients. A key indicator of one-on-one counseling is the preparation of the written Benefits Summary and Analysis (BS&A) to summarize current benefits and 40 For this analysis, benefits counseling is defined as any contact with a counselor that is recorded in BODS. This
could include brief I&R counseling.
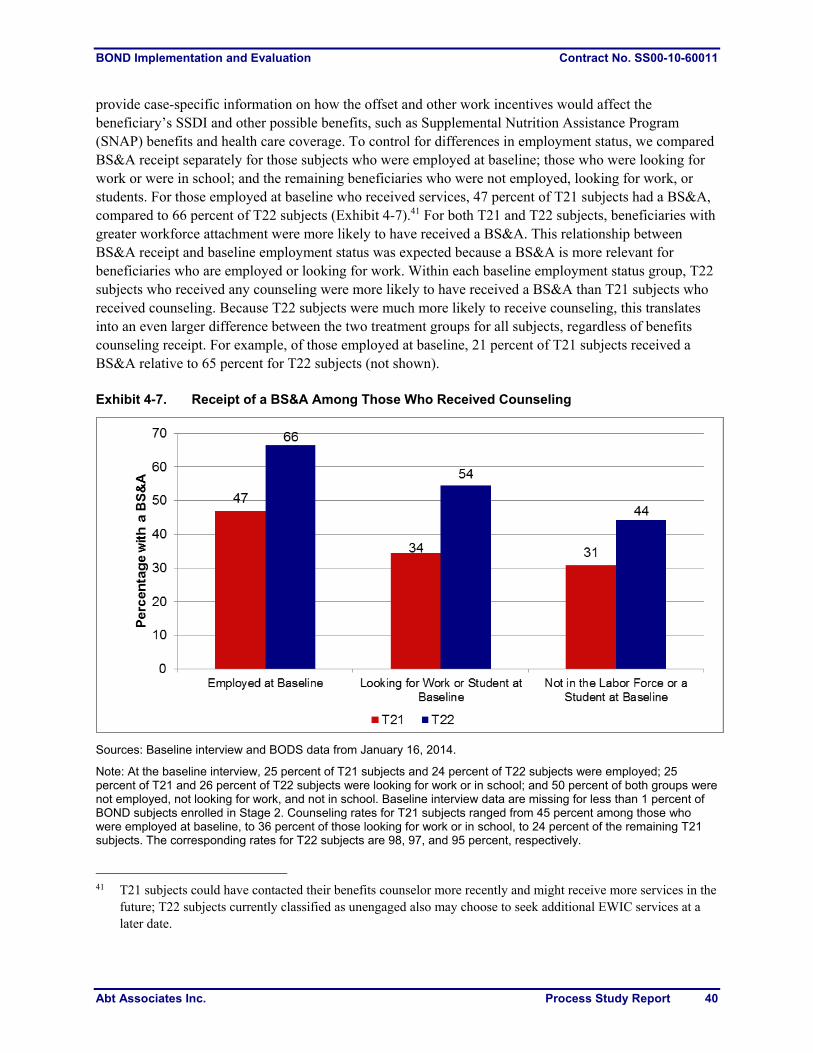
BOND Implementation and Evaluation Contract No. SS00-10-60011
Abt Associates Inc. Process Study Report 40
provide case-specific information on how the offset and other work incentives would affect the beneficiary’s SSDI and other possible benefits, such as Supplemental Nutrition Assistance Program (SNAP) benefits and health care coverage. To control for differences in employment status, we compared BS&A receipt separately for those subjects who were employed at baseline; those who were looking for work or were in school; and the remaining beneficiaries who were not employed, looking for work, or students. For those employed at baseline who received services, 47 percent of T21 subjects had a BS&A, compared to 66 percent of T22 subjects (Exhibit 4-7).41 For both T21 and T22 subjects, beneficiaries with greater workforce attachment were more likely to have received a BS&A. This relationship between BS&A receipt and baseline employment status was expected because a BS&A is more relevant for beneficiaries who are employed or looking for work. Within each baseline employment status group, T22 subjects who received any counseling were more likely to have received a BS&A than T21 subjects who received counseling. Because T22 subjects were much more likely to receive counseling, this translates into an even larger difference between the two treatment groups for all subjects, regardless of benefits counseling receipt. For example, of those employed at baseline, 21 percent of T21 subjects received a BS&A relative to 65 percent for T22 subjects (not shown). Exhibit 4-7. Receipt of a BS&A Among Those Who Received Counseling
Sources: Baseline interview and BODS data from January 16, 2014.
Note: At the baseline interview, 25 percent of T21 subjects and 24 percent of T22 subjects were employed; 25 percent of T21 and 26 percent of T22 subjects were looking for work or in school; and 50 percent of both groups were not employed, not looking for work, and not in school. Baseline interview data are missing for less than 1 percent of BOND subjects enrolled in Stage 2. Counseling rates for T21 subjects ranged from 45 percent among those who were employed at baseline, to 36 percent of those looking for work or in school, to 24 percent of the remaining T21 subjects. The corresponding rates for T22 subjects are 98, 97, and 95 percent, respectively.
41 T21 subjects could have contacted their benefits counselor more recently and might receive more services in the
future; T22 subjects currently classified as unengaged also may choose to seek additional EWIC services at a later date.
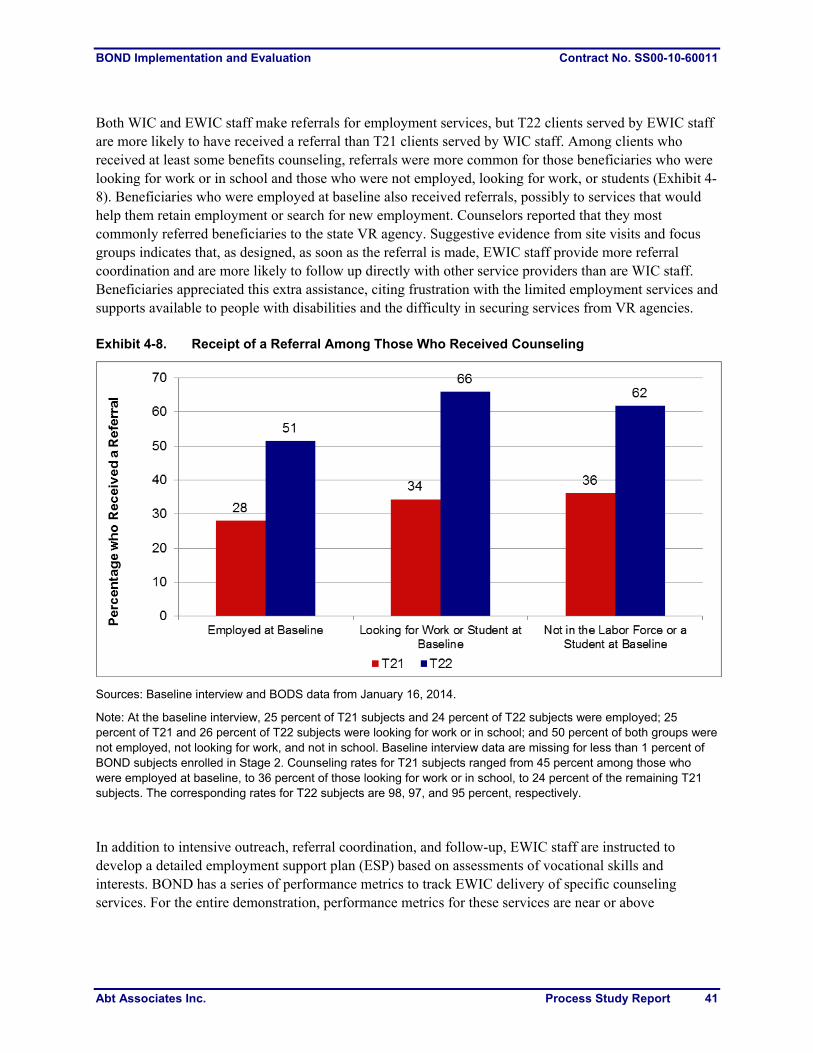
BOND Implementation and Evaluation Contract No. SS00-10-60011
Abt Associates Inc. Process Study Report 41
Both WIC and EWIC staff make referrals for employment services, but T22 clients served by EWIC staff are more likely to have received a referral than T21 clients served by WIC staff. Among clients who received at least some benefits counseling, referrals were more common for those beneficiaries who were looking for work or in school and those who were not employed, looking for work, or students (Exhibit 4-8). Beneficiaries who were employed at baseline also received referrals, possibly to services that would help them retain employment or search for new employment. Counselors reported that they most commonly referred beneficiaries to the state VR agency. Suggestive evidence from site visits and focus groups indicates that, as designed, as soon as the referral is made, EWIC staff provide more referral coordination and are more likely to follow up directly with other service providers than are WIC staff. Beneficiaries appreciated this extra assistance, citing frustration with the limited employment services and supports available to people with disabilities and the difficulty in securing services from VR agencies. Exhibit 4-8. Receipt of a Referral Among Those Who Received Counseling
Sources: Baseline interview and BODS data from January 16, 2014.
Note: At the baseline interview, 25 percent of T21 subjects and 24 percent of T22 subjects were employed; 25 percent of T21 and 26 percent of T22 subjects were looking for work or in school; and 50 percent of both groups were not employed, not looking for work, and not in school. Baseline interview data are missing for less than 1 percent of BOND subjects enrolled in Stage 2. Counseling rates for T21 subjects ranged from 45 percent among those who were employed at baseline, to 36 percent of those looking for work or in school, to 24 percent of the remaining T21 subjects. The corresponding rates for T22 subjects are 98, 97, and 95 percent, respectively.
In addition to intensive outreach, referral coordination, and follow-up, EWIC staff are instructed to develop a detailed employment support plan (ESP) based on assessments of vocational skills and interests. BOND has a series of performance metrics to track EWIC delivery of specific counseling services. For the entire demonstration, performance metrics for these services are near or above
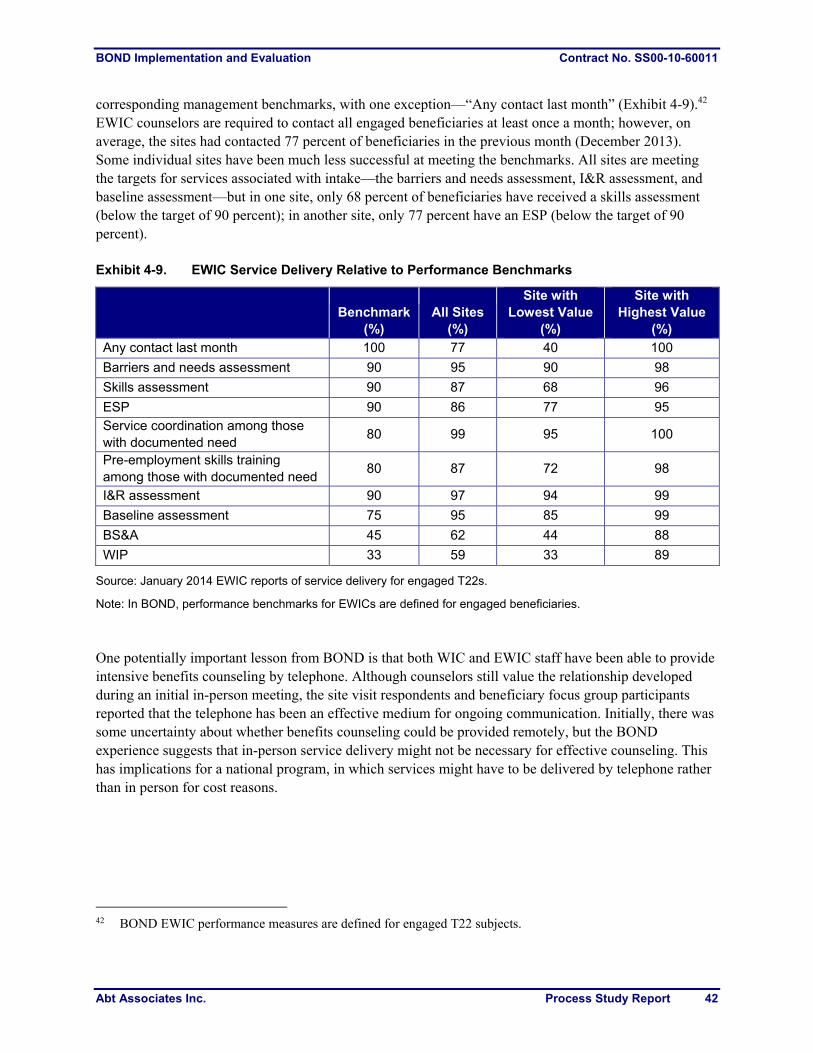
BOND Implementation and Evaluation Contract No. SS00-10-60011
Abt Associates Inc. Process Study Report 42
corresponding management benchmarks, with one exception—“Any contact last month” (Exhibit 4-9).42 EWIC counselors are required to contact all engaged beneficiaries at least once a month; however, on average, the sites had contacted 77 percent of beneficiaries in the previous month (December 2013). Some individual sites have been much less successful at meeting the benchmarks. All sites are meeting the targets for services associated with intake—the barriers and needs assessment, I&R assessment, and baseline assessment—but in one site, only 68 percent of beneficiaries have received a skills assessment (below the target of 90 percent); in another site, only 77 percent have an ESP (below the target of 90 percent). Exhibit 4-9. EWIC Service Delivery Relative to Performance Benchmarks
Benchmark
(%) All Sites
(%)
Site with Lowest Value
(%)
Site with Highest Value
(%)
Any contact last month 100 77 40 100
Barriers and needs assessment 90 95 90 98
Skills assessment 90 87 68 96
ESP 90 86 77 95
Service coordination among those with documented need
80 99 95 100
Pre-employment skills training among those with documented need
80 87 72 98
I&R assessment 90 97 94 99
Baseline assessment 75 95 85 99
BS&A 45 62 44 88
WIP 33 59 33 89
Source: January 2014 EWIC reports of service delivery for engaged T22s.
Note: In BOND, performance benchmarks for EWICs are defined for engaged beneficiaries.
One potentially important lesson from BOND is that both WIC and EWIC staff have been able to provide intensive benefits counseling by telephone. Although counselors still value the relationship developed during an initial in-person meeting, the site visit respondents and beneficiary focus group participants reported that the telephone has been an effective medium for ongoing communication. Initially, there was some uncertainty about whether benefits counseling could be provided remotely, but the BOND experience suggests that in-person service delivery might not be necessary for effective counseling. This has implications for a national program, in which services might have to be delivered by telephone rather than in person for cost reasons.
42 BOND EWIC performance measures are defined for engaged T22 subjects.

BOND Implementation and Evaluation Contract No. SS00-10-60011
Abt Associates Inc. Process Study Report 43
4.4. BOND Post-Entitlement Services
Compared to CWIC staff in WIPA, both WIC and EWIC staff have greater responsibility for assisting beneficiaries with post-entitlement work. This includes submitting earnings estimates and documentation of earnings to SSA for those eligible for the offset and submitting evidence of earnings disregards to be deducted from earnings before calculating benefits under the offset. Post-entitlement work limits the time counselors have available for traditional benefits planning, such as helping beneficiaries consider how employment or an increase in earnings might affect their SSDI and other benefits and, for EWIC staff, enhanced counseling services. During site visits, both WIC and EWIC counselors described post-entitlement work as an unanticipated and time-consuming distraction from benefits counseling. The initial application for WIC and EWIC organizations did not include post-entitlement work in the list of counselor responsibilities (Abt Associates 2010), but this responsibility has grown over time as the demonstration has evolved and as additional cases with earnings were identified through beneficiaries reporting work, SSA initiation of work CDRs, and by the automated reconciliation process.43 Counselors reported dissatisfaction with their involvement in the delivery of post-entitlement services. Some counselors reported feeling as if they were acting “as an agent of SSA,” whereas their usual role is to act as an agent of the beneficiary. They also expressed frustration about performing this role while having limited information about the status of a beneficiary’s case. After the last round of site visits, post-entitlement work was consolidated for most sites, with centralized staff on the BOND I-team taking responsibility for these functions.44 In future visits, we plan to explore the effect of this centralization on BOND counseling in each site. Although post-entitlement work has been a significant component of benefits counseling in BOND, it is an artifact of the demonstration and would not necessarily be an issue if BOND was national policy. If the offset were adopted as national policy, SSA field offices might be involved in earnings verification, in which case the benefit counselor’s involvement would be significantly reduced. 4.5. Conclusion
Early in the BOND implementation period, WIC and EWIC counseling were, in practice, more similar than intended. One factor was that the differences in caseload were not as large as planned. Because the take-up of WIC services by T1 and T21 subjects was lower than expected, WIC counselors were serving fewer clients than anticipated, giving them the time to deliver more intensive services than intended. This
43 Although the application packet did not include post-entitlement work in the list of counselors’ responsibilities,
the I-team always planned to have WIC and EWIC staff involved with the post-entitlement work and included these activities in the initial training. WIC and EWIC staff were assigned this responsibility with the expectation that counselors would have ongoing contact with the beneficiaries and were therefore well situated to assist beneficiaries with this work.
44 As of December 2013, only the Alabama WIC and EWIC, the Detroit WIC, the Western New York WIC and EWIC, and the Wisconsin EWIC will continue to provide post-entitlement services. In the other sites, the centralized staff from the BOND I-team assumed this responsibility. Centralization was taken into account when determining EWIC and WIC staffing levels for 2014.
BOND Implementation and Evaluation Contract No. SS00-10-60011
Abt Associates Inc. Process Study Report 44
does not necessarily mean that the counseling available to T1 and T21 subjects was more extensive than counseling available to C1 and C2 subjects, because we also heard reports of WIPA counselors delivering more intensive services than required. Of more importance to interpretation of the impact analysis, delivery of WIC services to T21 subjects that are more intensive than intended diminishes the differences between WIC and EWIC services. Those differences might have been further diminished by the fact that total EWIC caseloads were higher than expected because Stage 2 enrollment proceeded ahead of schedule and had a high level of take-up by T22 subjects (counselors successfully engaged 97 percent of T22 subjects). Additionally, EWIC counselors reported that, as they strove to keep up with outreach and enrollment of T22 subjects, it was difficult to find time to counsel previously enrolled subjects. As BOND has evolved, differences between WIC and EWIC services have crystallized. Stage 2 beneficiaries assigned to EWIC services were substantially more likely to interact with benefits counselors and, when the connection was made, these beneficiaries received more intensive counseling, additional support in seeking employment services, and more coordination and follow-up. One key challenge for both WIC and EWIC staff has been balancing their role as benefits counselors with their responsibility for post-entitlement work. As post-entitlement work is centralized for some sites, it will be important to monitor how this change affects variation in the availability and intensity of counseling across sites.

BOND Implementation and Evaluation Contract No. SS00-10-60011
Abt Associates Inc. Process Study Report 45
5. Using the Benefit Offset
5.1. Introduction
Use of the benefit offset and timely benefit adjustment under the offset rules rely on the implementation of a number of complex processes. If processes designed to support offset entry and benefit adjustment do not function as intended, the desired effects of the offset—sustained engagement in SGA—might not be realized. Specifically, the financial incentive provided by the benefit offset is unlikely to be effective if beneficiaries are unaware of it, do not trust it, or do not have at least a moderate understanding of how it works. In this chapter, we describe the structure, implementation, and use of the benefit offset. The chapter first describes the pathway to the offset and necessary steps for adjusting benefits under the offset rules. It then describes the frequency of and trends in offset use and subsequent benefit adjustment between the start of BOND and the end of 2013. Next, the chapter discusses key implementation findings, including challenges in administering the offset, solutions, and progress to date. Finally, it concludes with a discussion about the consequences of delays in benefit adjustment.
Chapter Findings
For the period ending December 2013, SSA had identified 1.5 percent of Stage 1 treatment subjects as offset users. The corresponding value for Stage 2 treatment subjects who, by design, enrolled in the demonstration through a different process and have different characteristics than Stage 1 subjects, was 7.3 percent. The cumulative number of identified offset users grew over this period and will continue to increase as SSA completes retroactive adjustments.
Early delays in the identification of offset users and subsequent adjustment of benefits under the offset rules were lengthy, reflecting a large backlog of work CDRs that existed for both treatment and control subjects before the demonstration started, limited resources available to process work CDRs, and initial technical difficulties with other aspects of the adjustment process. This process has become more timely as the demonstration has evolved, although some delays remain.
Delays with benefit adjustment, which are inevitable when beneficiaries do not proactively seek benefit adjustments, lead to improper payments. For a delay of any given length, treatment subjects generally incur smaller improper payments than control subjects, because SSA reduces their benefits under the offset, rather than suspends them. Nonetheless, we heard numerous reports of treatment subjects who were surprised by the presence or size of their improper payments. Although some were comforted by the fact that the payments would have been larger had they not been in BOND, others were not. In some cases, improper payments caused financial hardship and created negative attitudes toward employment and the demonstration. In addition, improper payments were often time-consuming for beneficiaries, counseling staff, and SSA to manage.
Some beneficiaries expressed an incomplete understanding of the benefit offset rules and requirements. Because such beneficiaries might fail to adjust their work activities in a manner that takes full advantage of the offset or fail to comply with earnings reporting requirements, information campaigns, such as the 2012 and 2013–2014 supplemental T1 outreach efforts, might increase offset use and the timeliness of benefit adjustment.

BOND Implementation and Evaluation Contract No. SS00-10-60011
Abt Associates Inc. Process Study Report 46
5.2. The Benefit Adjustment Process
This section describes the two pathways by which treatment subjects can have their benefits adjusted under the benefit offset rules and the major milestones associated with each pathway. The distinction between the two pathways is important for understanding the barriers to and delays in benefit adjustment discussed in Section 5.4, which differ across the modes of adjustment. Before describing the benefit adjustment process, it is important to understand how beneficiaries qualify for adjustment by entering the offset. When a BOND treatment subject completes the TWP, engages in SGA (identified by a disability cessation date), and completes an additional two months of the GP, the beneficiary becomes eligible for the offset and remains eligible for the duration of his or her BOND participation period.45 From that point forward, a beneficiary is considered an offset user if earnings exceed the BYA or partial-year (prorated) amount if offset eligibility does not begin at the beginning of the calendar year. SSA might not formally recognize that the beneficiary is an offset user in the same month the beneficiary engages in SGA after the GP occurs. Instead, formal recognition occurs when benefits are first adjusted. Likewise, some beneficiaries could be unaware of their status as an offset user until their benefits are adjusted. A beneficiary’s action or inaction in the months leading up to the start of the BOND participation period has an important effect on the manner and speed at which benefits are adjusted, as discussed below. 5.2.1. Two Ways to Initiate the Process: Front-Door Versus Back-Door Benefit Adjustment
BOND treatment subjects can have benefits adjusted under the offset rules in one of two ways:
1. Proactively, through the front door. For this to occur, a beneficiary must report earnings to the demonstration and, when requested, complete administrative paperwork (e.g., a work CDR and AEE).
2. Passively, through the back door. Benefits can be adjusted retroactively through the back door if SSA identifies beneficiaries with past earnings sufficiently high to qualify them for the offset. This group includes beneficiaries whose benefits were (or should have been) suspended due to work before BOND random assignment, but not yet terminated. These beneficiaries need not have contacted the demonstration or completed administrative paperwork.
All beneficiaries eligible for the offset eventually will have their benefits adjusted, but adjustment is timelier when it occurs via the front door rather than the back door. Delays in benefit adjustment due to back-door entry are a part of the demonstration design and are inevitable when beneficiaries do not report their earnings. Unfortunately, such delays routinely cause improper benefit payments, which can be detrimental to beneficiaries, affect their trust in the demonstration, and affect their willingness to engage in SGA.
45 Refer to Appendix E for a description of the current SSDI rules regarding work and the BOND innovations.
BOND Implementation and Evaluation Contract No. SS00-10-60011
Abt Associates Inc. Process Study Report 47
One reason beneficiaries have their benefits adjusted through the front rather than the back door can be related to awareness of the offset. For the front-door adjustment to occur, beneficiaries must be in contact with the demonstration. Awareness of the offset and some trust in its legitimacy are likely precursors to this contact. Beneficiaries might not understand how the offset works when they first contact the demonstration, but demonstration services are designed to help them gain that understanding and take maximal advantage of the opportunity. In contrast, offset users whose benefits are adjusted through the back door might have no prior awareness or understanding of the offset. It is possible for beneficiaries to have a complete understanding of the offset, choose to ignore the mandatory SSA work reporting requirements (just as some do under current law), and therefore not engage in the process for timely benefit adjustment. It is important to note that offset users who were not previously aware of or did not understand the incentive before using it might behave differently when their benefits are adjusted under the offset rules relative to beneficiaries subject to the current law. Existing research on current-law benefits shows that the earnings of many beneficiaries decline after they complete the TWP and GP (Schimmel et al. 2011; Weathers and Bailey 2014). One possible explanation for this decline is that these beneficiaries seek to have their benefits reinstated and avoid benefit termination for SGA following the end of the extended period of eligibility (EPE). When benefits are adjusted under the offset rules and offset users who previously had limited or no understanding have a more complete understanding of the offset, those users might not see a need to scale back earnings because of the advantageous benefit formula offered by the offset. 5.2.2. Steps in the Benefit Adjustment Process
The benefit adjustment process varies based on the pathway of adjustment. There are four major milestones for front-door benefit adjustment: (1) completion of the TWP, subsequent engagement in SGA, and completion of the GP; (2) completion and processing of a work CDR;46 (3) completion of an AEE; and (4) initial benefit adjustment.47 The process for back-door adjustment is similar, but has two key differences. First, front-door entrants must have proactively engaged either the demonstration or an SSA field office to report their earnings while completing the first milestone; back-door entrants presumably have not done so. Instead, back-door adjustment begins when SSA identifies beneficiaries with substantial earnings from a review of IRS or other earnings data reported to SSA. Second, back-door adjustment does not require an AEE, although all offset users are encouraged to submit an AEE for subsequent years to facilitate timely and accurate benefit adjustment.48 Exhibit 5-1 provides an illustration of the differences in the two types of adjustment for a fictional beneficiary who first used the offset in November 2012.
46 For beneficiaries who have completed their TWP and subsequently engaged in SGA, the result of a work CDR
will be the assignment of a disability cessation date.
47 Benefits can be readjusted in response to revised AEEs. Any difference between benefits paid and benefits owed are identified and corrected after the end of each calendar year, either through beneficiary-initiated or automated end-of-year reconciliation.
48 SSA suspends the future cash benefits of identified offset users until they submit an AEE; retroactive adjustment of benefits paid in prior calendar years will occur without an AEE.
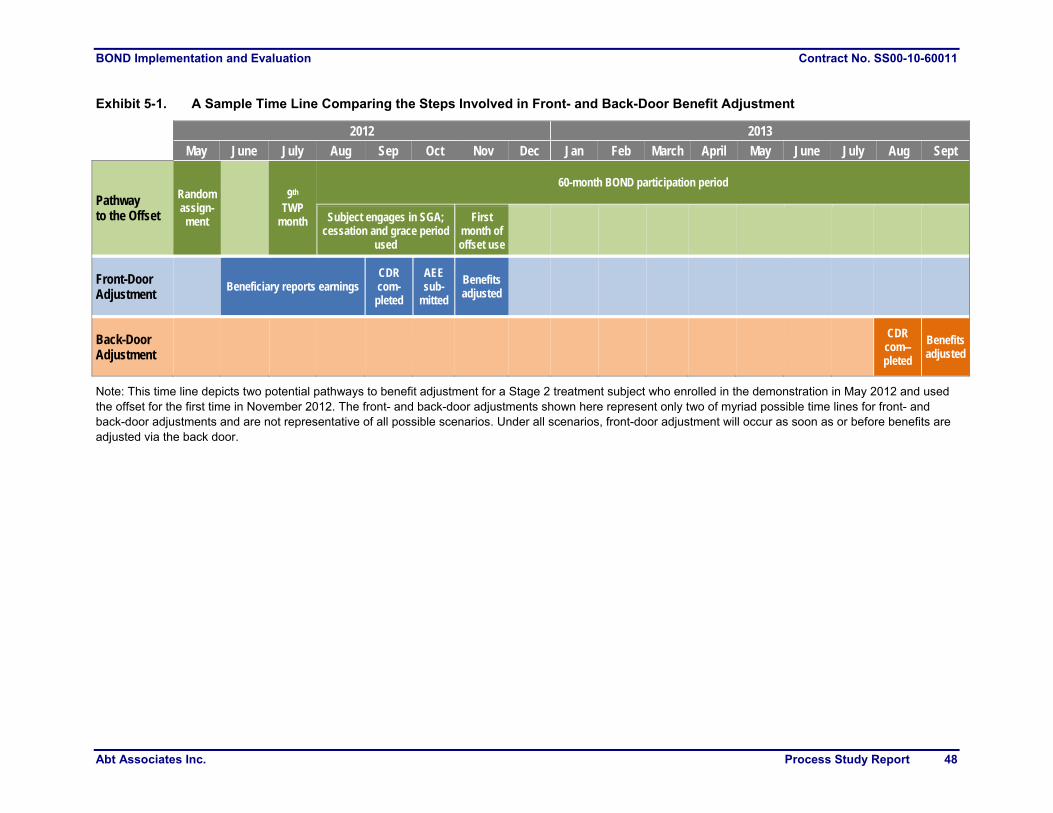
BOND Implementation and Evaluation Contract No. SS00-10-60011
Abt Associates Inc. Process Study Report 48
Exhibit 5-1. A Sample Time Line Comparing the Steps Involved in Front- and Back-Door Benefit Adjustment
2012 2013
May June July Aug Sep Oct Nov Dec Jan Feb March April May June July Aug Sept
Pathway to the Offset
Random assign-ment
9th TWP
month
60-month BOND participation period
Subject engages in SGA; cessation and grace period
used
First month of offset use
Front-Door Adjustment
Beneficiary reports earnings CDR com-pleted
AEE sub-
mitted
Benefits adjusted
Back-Door Adjustment
CDR com--pleted
Benefits adjusted
Note: This time line depicts two potential pathways to benefit adjustment for a Stage 2 treatment subject who enrolled in the demonstration in May 2012 and used the offset for the first time in November 2012. The front- and back-door adjustments shown here represent only two of myriad possible time lines for front- and back-door adjustments and are not representative of all possible scenarios. Under all scenarios, front-door adjustment will occur as soon as or before benefits are adjusted via the back door.

BOND Implementation and Evaluation Contract No. SS00-10-60011
Abt Associates Inc. Process Study Report 49
The manner in which benefits are adjusted varies depending on when a treatment subject is identified as an offset user. Benefit adjustment can occur contemporaneously with the first month of offset use, based on an AEE for beneficiaries identified as offset users, in time for that month of offset use (presumably most, if not all, beneficiaries with contemporaneous adjustments enter through the front door). Beneficiaries identified as offset users after their first month of offset use (front-door entrants who encounter delays and back-door entrants) will have their benefits adjusted retroactively based on a comparison of benefits paid to actual earnings, and contemporaneously pending the completion of an AEE. After the end of each calendar year, benefits paid based on an AEE in accordance with the offset rules are reconciled with actual earnings. The process for retroactive benefit adjustment, known as reconciliation, varies depending on who initiates the process and when. During reconciliation, SSA uses the BSAS to compare benefits paid to beneficiaries with an established disability cessation date to benefits due as determined by actual earnings according to the IRS data, net of any noncountable income reported by the beneficiary and approved by SSA. There are two types of reconciliation. Automated reconciliation is scheduled for August after the end of each calendar year.49 Manual reconciliation also is conducted after the end of a calendar year and may occur either before or after the automated reconciliation. Beneficiaries may request that a manual reconciliation to take place before the scheduled automated reconciliation. A beneficiary-initiated (manual) reconciliation often is processed for beneficiaries who believe they were underpaid SSDI benefits in the previous year and want to receive money due from SSA as soon as possible. Manual reconciliations also are conducted for calendar years in which automated reconciliation already has been completed. For example, if a beneficiary had a work CDR in December 2013 that established a cessation date in 2012, SSA would run a manual reconciliation because the 2012 automated reconciliation already had been processed. 5.3. Statistics on Offset Use and Benefit Adjustment
This section presents statistics on identified benefit offset use and actual benefit adjustments from the start of Stage 1 random assignment in April 2011 through December 2013. Specifically, we present two sets of statistics in Exhibits 5-2 (for Stage 1 treatment subjects) and 5-3 (for Stage 2 treatment subjects), based on SSA administrative data and BODS records:50
The upper line in each exhibit, cumulative identified offset users, shows the cumulative percentage of treatment subjects who have been identified as offset users, based on benefit adjustments recorded by May 1, 2014. For instance, the value of 1.1 percent in January 2012 for T1 subjects (Exhibit 5-2) means that, as of May 1, 2014, SSA had adjusted the benefits of 1.1
49 This time line represents a delay relative to the current-law process. Under the current law, IRS data are
available for SSA review shortly after beneficiary submission to the IRS, which often occurs in the first quarter of the following calendar year, perhaps four months before the scheduled BOND automated reconciliation in August.
50 The data on cumulative identified offset users are based on a monthly extract from SSA’s Master Beneficiary Record (MBR) as well as calculation and verification of first offset month by SSA staff. The data on cumulative first offset adjustments in 2011 and 2012 are from manual updates made by SSA staff to BODS and were recently verified by SSA staff. The data on cumulative first offset adjustments in 2013 are from a combination of BODS, BSAS, and MBR data.
BOND Implementation and Evaluation Contract No. SS00-10-60011
Abt Associates Inc. Process Study Report 50
percent of T1 subjects under the offset in at least one month from April 2011 to January 2012. The cumulative percentage of offset users at any point in time presented in this series will continue to increase, especially toward the end of the period, until SSA completes retroactive adjustments for this period.
The lower line in each exhibit, cumulative first offset adjustments, provides information on the months in which initial benefit adjustments under the offset were made—usually later than the first month of offset use. It represents the percentage of beneficiaries whose benefits actually have been adjusted under the offset as of the month indicated.
An example is helpful in distinguishing between the two cumulative series. If a beneficiary had a cessation date and sufficient earnings to warrant benefit offset use in May 2012 but was not identified as such and did not have his or her benefits (retroactively) adjusted until September 2013, the beneficiary would be included in the upper line starting in May 2012 and in the lower line starting in September 2013. In contrast, if the same beneficiary had entered through the front door, and SSA had first adjusted his or her benefits under the offset contemporaneously with the first month of offset use (May 2012), the beneficiary would be included in both lines starting in that month. One oddity of the T1 series for cumulative percentage of first adjustments is that the series declined somewhat in mid-2013, despite the fact that it is cumulative. The reason is that some offset adjustments were reversed, typically because a beneficiary who entered through the back door later provided evidence of earnings disregards that resulted in annual countable earnings below the BYA. Such cases are not included in the cumulative identified user series because the later action determined that they were non-users. Based on data through May 2014, the number of offset users grew throughout the demonstration period. As depicted in the upper line in Exhibit 5-2, 0.7 percent of T1 subjects (561 beneficiaries) used the offset in the month after random assignment—May 2011.51 Most of these beneficiaries were likely in their extended period of eligibility and engaged in SGA before BOND random assignment, and their benefits were (or should have been) in suspense. Since May 2011, the cumulative percentage of T1 users has grown gradually.52 By the end of 2011, 0.9 percent of T1 subjects (695 beneficiaries) were identified as offset users, which is about 100 less than the 800 predicted to be eligible for the offset in 2011 based on current-law incentives using historical earnings data (Wittenburg et al. 2012). By December 2013, the cumulative percentage of identified offset users had reached 1.5 percent of T1 subjects (1,159 beneficiaries), based on the data through May 2014. This increase reflects the fact that working beneficiaries are continually entering the BOND participation period and becoming eligible to use the offset.
51 Stage 1 random assignment occurred in April 2011 and, for beneficiaries with a disability cessation, the BOND
participation period may begin in the first month after random assignment.
52 Each January, there was a jump in identified offset use (upper line) for all subjects. This likely reflects the interaction between SSA work incentive rules and use of calendar year earnings (when SSA does not have detailed monthly information from beneficiaries) in reconciliation. Specifically, if a beneficiary has earnings above BYA, SSA can count the first nine months of the calendar year as the TWP and the remaining months as the GP, and then adjust benefits starting the following January.
BOND Implementation and Evaluation Contract No. SS00-10-60011
Abt Associates Inc. Process Study Report 51
As expected, offset use was higher for Stage 2 treatment subjects and grew more rapidly relative to growth for Stage 1 subjects. As of May 2014, 4.9 percent of Stage 2 treatment subjects (395 beneficiaries) were identified as offset users through September 2012 (Exhibit 5-3)—the last month of the enrollment period. The gradual increase before that month reflects the fact that Stage 2 enrollment spanned a period of more than a year, and treatment subjects could not use the offset until they were enrolled. The percentage of identified offset users increased to 7.3 percent (585 beneficiaries) of Stage 2 treatment subjects by December 2013. Relative to Stage 1 subjects, the higher level of offset use reflects the fact that Stage 2 subjects were all volunteers and not SSI recipients (the effects of earnings and SSDI benefits on SSI benefits diminish the financial incentive of the offset relative to current law), whereas Stage 1 subjects are a random sample of all eligible SSDI beneficiaries, including those concurrently receiving SSI.53 Both the Stage 1 and Stage 2 series are based on benefit adjustments made through May 2014 and pending retroactive adjustments (particularly 2013 automated reconciliation) likely will shift the series upward in the future, especially in the more recent months. For both groups of treatment subjects, many initial benefit adjustments were delayed, in part because of back-door entry. A comparison of the lower line in Exhibit 5-2 to the corresponding upper line shows that the first adjustments for many Stage 1 offset users were delayed and occurred in March 2013, immediately following SSA’s completion of 2011 automated reconciliation. In fact, almost three-quarters (73 percent) of T1 offset users in 2011 had their benefits adjusted through the 2011 automated reconciliations that occurred from January to February 2013. The percentage of subjects who had benefits adjusted via automated reconciliation is a lower-bound estimate of the percentage entering via the back door.54 A high proportion of Stage 2 treatment subjects had their benefits adjusted retroactively, although this proportion appears lower than the corresponding proportion of Stage 1 treatment subjects. Approximately 45 percent of identified Stage 2 2011 offset users had benefits adjusted through automated reconciliation, compared to 73 percent of T1 offset users. Because front-door offset entry is associated with beneficiary awareness of the offset, this difference implies greater understanding of the offset provision for Stage 2 treatment group subjects than Stage 1 treatment group subjects. This difference might reflect what Stage 2 subjects learned in the enrollment process or their higher rates of contact with benefits counselors.
53 The percentage of Stage 1 and Stage 2 offset users are not directly comparable. To illustrate this point, the
number of Stage 2 offset users represents just 0.4 percent of the approximately 146,500 beneficiaries solicited for Stage 2 who would have been eligible for the offset (i.e., assigned to one of the treatment groups) had they volunteered (based on the 238,070 who were solicited and the percentage of volunteers assigned to either T21 or T22; Stage 2 Early Assessment Report, Exhibits 3-2 and 4-1). The fact that this percentage is lower than the 1.5 percent of T1 subjects who were users as of December 2013 is at least in part due to the fact that Stage 2 enrollment ended early in the solicitation process for the approximately 80,000 beneficiaries in the last four solicitation waves (Stage 2 Early Assessment Report, Exhibit 3-2). Other factors that make the comparison problematic are the later enrollment dates for all but a few Stage 2 subjects and the exclusion of concurrent beneficiaries from Stage 2.
54 Back-door benefit adjustments include two types of adjustments: automated and manual reconciliations. Beneficiaries with both types of adjustments are included in Exhibits 5-2 and 5-3, along with beneficiaries with front-door adjustments. However, statistics to identify the exact number of adjustments by treatment group in each calendar year are available for automated reconciliations and not for manual reconciliations. Accordingly, the exact number of back-door adjustments is unknown.
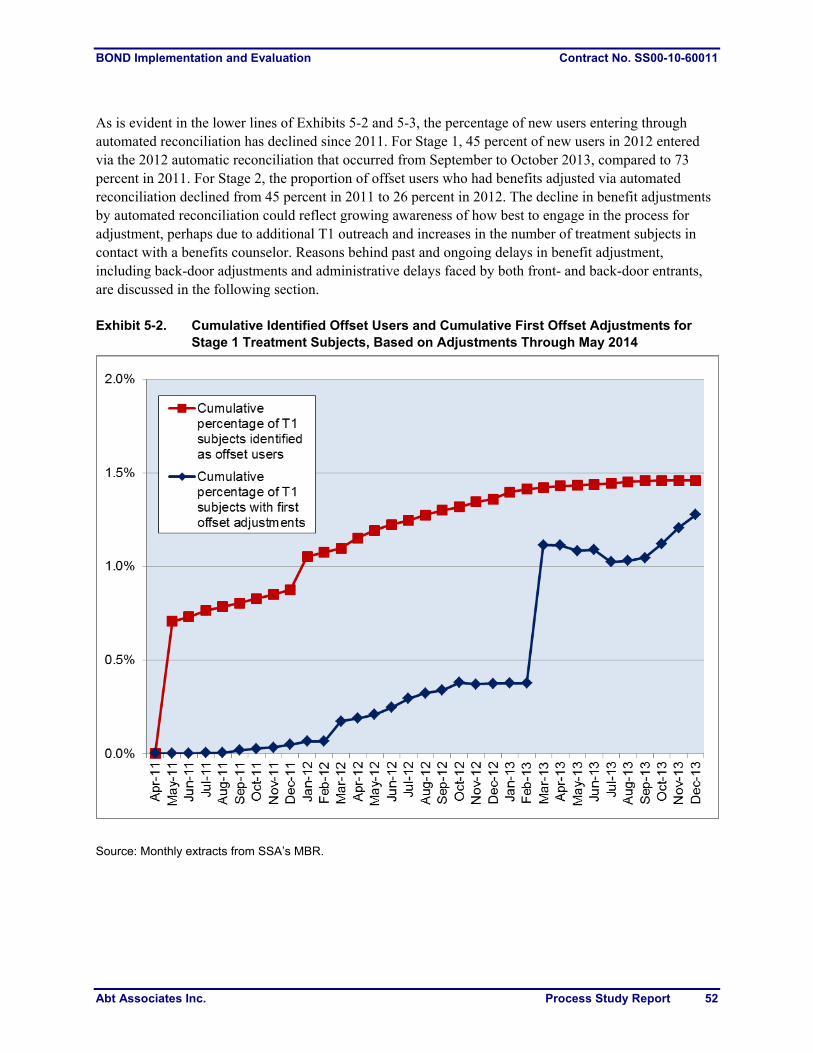
BOND Implementation and Evaluation Contract No. SS00-10-60011
Abt Associates Inc. Process Study Report 52
As is evident in the lower lines of Exhibits 5-2 and 5-3, the percentage of new users entering through automated reconciliation has declined since 2011. For Stage 1, 45 percent of new users in 2012 entered via the 2012 automatic reconciliation that occurred from September to October 2013, compared to 73 percent in 2011. For Stage 2, the proportion of offset users who had benefits adjusted via automated reconciliation declined from 45 percent in 2011 to 26 percent in 2012. The decline in benefit adjustments by automated reconciliation could reflect growing awareness of how best to engage in the process for adjustment, perhaps due to additional T1 outreach and increases in the number of treatment subjects in contact with a benefits counselor. Reasons behind past and ongoing delays in benefit adjustment, including back-door adjustments and administrative delays faced by both front- and back-door entrants, are discussed in the following section. Exhibit 5-2. Cumulative Identified Offset Users and Cumulative First Offset Adjustments for
Stage 1 Treatment Subjects, Based on Adjustments Through May 2014
Source: Monthly extracts from SSA’s MBR.

BOND Implementation and Evaluation Contract No. SS00-10-60011
Abt Associates Inc. Process Study Report 53
Exhibit 5-3. Cumulative Identified Offset Users and Cumulative First Offset Adjustments for Stage 2 Treatment Subjects, Based on Adjustments Through May 2014
Source: Monthly extracts from SSA’s MBR. 5.4. Implementation of the Offset Process
The initial benefit adjustment process includes four primary milestones: (1) meeting offset eligibility, (2) completion and processing of a work CDR (if an SGA cessation is not already established), (3) completion of an AEE (not necessarily applicable to back-door entrants), and (4) initial benefit adjustment. The complexity of these milestones and the overall process has created implementation challenges. However, process changes and increasing field staff experience have improved the timeliness and accuracy of the benefit adjustment process. In this section, we describe each of the major milestones and the primary implementation challenges and improvements.

BOND Implementation and Evaluation Contract No. SS00-10-60011
Abt Associates Inc. Process Study Report 54
5.4.1. Offset Eligibility (Step 1)
To enter the offset, a BOND treatment subject must first work and earn more than a certain threshold for an extended period (i.e., complete the TWP). The BOND participation period begins after completion of the nine-month TWP or, for those who completed the TWP before random assignment, at random assignment.55 After the participation period starts, the offset is applied as soon as beneficiaries use their three GP months. However, efforts to become offset-eligible can be dampened by beneficiaries’ lack of understanding of SSA and the BOND rules, limited employment services and work supports, and other factors that interfere with steady employment. According to beneficiaries who participated in focus group discussions, the offset might not have the desired effect on all treatment subjects due to beneficiaries’ lack of awareness or understanding of the offset. Areas in which some beneficiaries were unclear included the following: whether SSDI beneficiaries are allowed to work, the meaning and measurement of SGA, how the offset affects benefits, the process for accessing the benefit offset, the duration of the BOND participation period, and how use of the offset would affect future SSDI benefits after the end of the demonstration. In addition, a small number of WIC focus group participants said they were initially unaware of their inclusion in BOND.56 Beneficiaries who are not aware and, to a lesser extent, those who do not understand how the offset works are unlikely to intentionally modify their employment behaviors to take advantage of the offset. According to focus group reports, additional outreach to a targeted group of T1 subjects conducted in 2012 and more expansive supplemental outreach efforts in 2013 (both discussed in Chapter 3) helped improve some T1 subjects’ understanding of the demonstration. This could translate into higher future uptake of the offset; however, there is no formal measure of the effect of the outreach on beneficiaries’ understanding of offset use.
55 BOND treatment subjects are able to use the offset during a 60-month BOND participation period, which starts
at the later of (1) the month of random assignment (for those who completed TWP before random assignment); or (2) the month after completion of TWP, provided that TWP completion occurs before September 30, 2017.
56 Focus groups of WIC-assigned beneficiaries included both T1 and T21 subjects, who likely had different experiences with the demonstration. Specifically, T21 subjects were recruited for BOND, expressed interest, agreed to enroll, and went through an in-person enrollment process and baseline interview, whereas T1s initially received only written notifications that they had been assigned to BOND. The beneficiaries who were initially unaware of their inclusion in BOND were likely Stage 1 treatment subjects.
Implementation Challenges
Some beneficiaries might not engage in SGA because they have an incomplete understanding of SSA and BOND rules.
In many communities within the BOND sites, employment services and supports are insufficient to help beneficiaries get and retain jobs.
Improvements Made
Additional outreach to T1 subjects starting in summer 2012 and late 2013 might improve awareness and comprehension of the SSA and BOND rules.
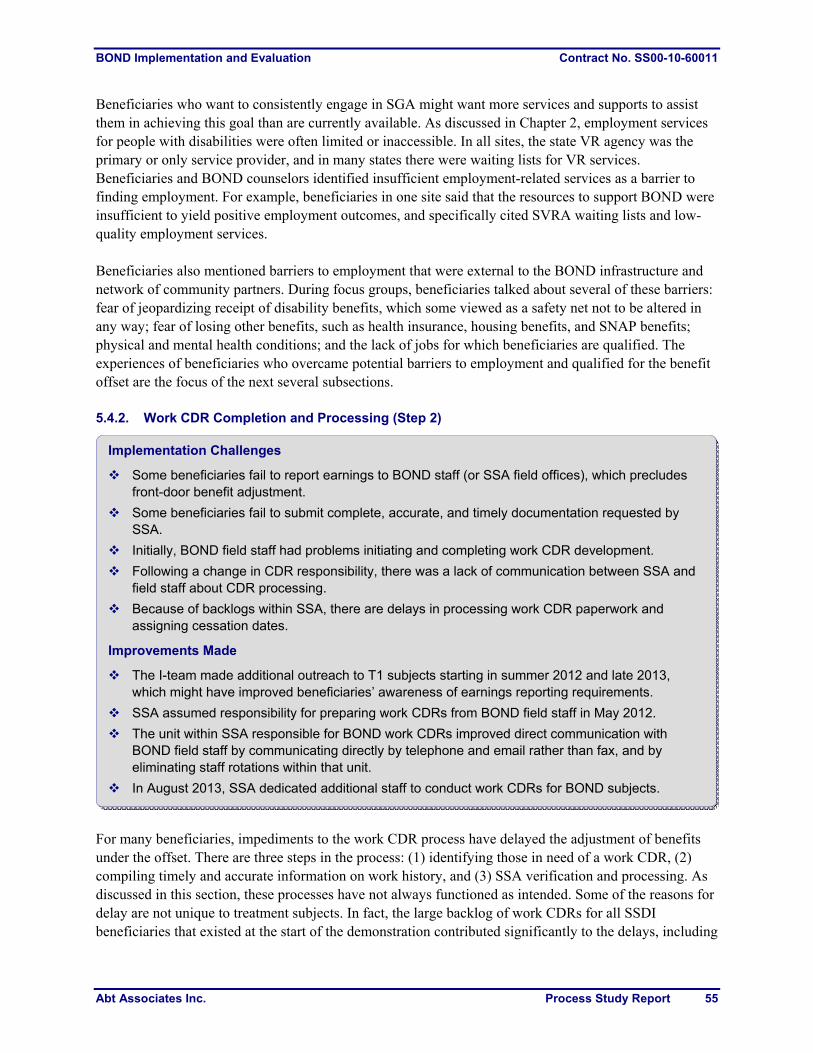
BOND Implementation and Evaluation Contract No. SS00-10-60011
Abt Associates Inc. Process Study Report 55
Beneficiaries who want to consistently engage in SGA might want more services and supports to assist them in achieving this goal than are currently available. As discussed in Chapter 2, employment services for people with disabilities were often limited or inaccessible. In all sites, the state VR agency was the primary or only service provider, and in many states there were waiting lists for VR services. Beneficiaries and BOND counselors identified insufficient employment-related services as a barrier to finding employment. For example, beneficiaries in one site said that the resources to support BOND were insufficient to yield positive employment outcomes, and specifically cited SVRA waiting lists and low-quality employment services. Beneficiaries also mentioned barriers to employment that were external to the BOND infrastructure and network of community partners. During focus groups, beneficiaries talked about several of these barriers: fear of jeopardizing receipt of disability benefits, which some viewed as a safety net not to be altered in any way; fear of losing other benefits, such as health insurance, housing benefits, and SNAP benefits; physical and mental health conditions; and the lack of jobs for which beneficiaries are qualified. The experiences of beneficiaries who overcame potential barriers to employment and qualified for the benefit offset are the focus of the next several subsections. 5.4.2. Work CDR Completion and Processing (Step 2)
For many beneficiaries, impediments to the work CDR process have delayed the adjustment of benefits under the offset. There are three steps in the process: (1) identifying those in need of a work CDR, (2) compiling timely and accurate information on work history, and (3) SSA verification and processing. As discussed in this section, these processes have not always functioned as intended. Some of the reasons for delay are not unique to treatment subjects. In fact, the large backlog of work CDRs for all SSDI beneficiaries that existed at the start of the demonstration contributed significantly to the delays, including
Implementation Challenges
Some beneficiaries fail to report earnings to BOND staff (or SSA field offices), which precludes front-door benefit adjustment.
Some beneficiaries fail to submit complete, accurate, and timely documentation requested by SSA.
Initially, BOND field staff had problems initiating and completing work CDR development.
Following a change in CDR responsibility, there was a lack of communication between SSA and field staff about CDR processing.
Because of backlogs within SSA, there are delays in processing work CDR paperwork and assigning cessation dates.
Improvements Made
The I-team made additional outreach to T1 subjects starting in summer 2012 and late 2013, which might have improved beneficiaries’ awareness of earnings reporting requirements.
SSA assumed responsibility for preparing work CDRs from BOND field staff in May 2012.
The unit within SSA responsible for BOND work CDRs improved direct communication with BOND field staff by communicating directly by telephone and email rather than fax, and by eliminating staff rotations within that unit.
In August 2013, SSA dedicated additional staff to conduct work CDRs for BOND subjects.
BOND Implementation and Evaluation Contract No. SS00-10-60011
Abt Associates Inc. Process Study Report 56
for many BOND treatment subjects that SSA had not yet realized needed a work CDR. Changes over the course of the demonstration have considerably improved the process for treatment subjects, although some challenges remain. Identifying Beneficiaries in Need of a Work CDR (Work CDR Step 1) Timely benefit adjustment begins with beneficiaries reporting their earnings to BOND staff or an SSA field office. BOND and SSA staff rely on this information to monitor beneficiaries’ progress through the TWP and initiate a work CDR at the appropriate time. However, WIC and EWIC staff in seven sites have observed that some of their clients do not submit earnings documentation or notify them when they have a change in earnings; others provide incorrect information. Furthermore, many beneficiaries (including the overwhelming majority of T1 subjects) are not in contact with the demonstration at all. Beneficiaries who do not engage in timely and accurate reporting could have undetected earnings for an extended period of time, which delays the initiation of the work CDR process and the adjustment of benefits; in most cases, SSA will eventually identify such beneficiaries using IRS data or other information reported to SSA.57 Additional outreach to T1 subjects in 2012 and 2013 could have improved beneficiary awareness of their reporting obligations. However, as of late 2013, beneficiaries who do not report earnings were still an issue for the timely adjustment of benefits. The failure of the beneficiary to report earnings is the primary reason that so many subjects enter the offset through the backdoor. The process also requires a BOND or SSA staff member to recognize that a beneficiary is nearing the end of the TWP and initiate a work CDR. As reported in Gubits et al. (2013), during the first year of the demonstration, this responsibility fell to BOND field staff. This process did not work as intended and, in May 2012, SSA staff assumed most of this responsibility. Under the current process, SSA staff use administrative data to identify beneficiaries in need of a work CDR. In addition, BOND staff can also request that SSA initiate a work CDR.58 Developing Work History (Work CDR Step 2) When SSA or BOND staff recognize the need for a work CDR, SSA staff advance the process by sending the beneficiary administrative forms and a request to document past work activity. WIC and EWIC staff reported that beneficiaries can be unresponsive or slow to complete the forms. In many cases, beneficiaries are unable to supply evidence of earnings, such as pay stubs and tax forms, needed to complete the forms. Because beneficiaries are often unable to prepare work CDR packages on their own, ultimate responsibility for this step fell to BOND field staff at the start of the demonstration, but the process did not function as intended. As documented in Gubits et al. (2013), BOND staff struggled to submit accurate and complete work CDR packages. In May 2012, along with the changes in the process for work CDR
57 SSA can identify current-law beneficiaries with unreported earnings earlier than BOND treatment subjects with
unreported earnings. Under the current-law system, IRS data are available for SSA review shortly after a beneficiary files a tax return, which is often in the first quarter of the following calendar year. In contrast, BOND subjects’ earnings records are not reviewed until August of the following calendar year.
58 From January 2013 to May 2014, BOND staff requested more than 2,600 work CDRs. By the end of May 2014, SSA had initiated more than 2,100 work CDRs and determined that work CDRs were not needed for some additional beneficiaries. SSA expects to initiate the remaining work CDRs within the next few months.
BOND Implementation and Evaluation Contract No. SS00-10-60011
Abt Associates Inc. Process Study Report 57
initiation, the responsibility for completing work CDR packages shifted to SSA. When requested, BOND staff still assist beneficiaries in completing the work CDR paperwork, but SSA has primary responsibility for developing the work history. For example, if a beneficiary is unable to supply appropriate earnings documentation, SSA will contact employers for information. According to BOND field staff and SSA staff charged with conducting and overseeing BOND work CDRs, the new process (which includes SSA responsibility for identifying beneficiaries in need of a CDR) generally works well. Following the transfer in responsibility for work CDRs, communication between SSA and WIC and EWIC benefits counselors about work CDRs was limited. This problem was ultimately resolved by a change in the guidance related to contacting SSA staff. When WIC and EWIC staff had primary responsibility for CDR development, they were aware of the status of their clients’ work CDRs. However, under the new arrangement, WIC and EWIC staff initially had very little direct knowledge and could communicate only with the SSA staff processing work CDRs via fax. As reported in Gubits et al. (2013), staff felt uninformed about the process. In December 2012, staffing at the SSA unit responsible for BOND work CDR development changed from staff on four-month rotations to permanent staff. Soon after, in January 2013, WIC and EWIC staff were given telephone numbers and email addresses for these staff. Together, the changes have helped to create an ongoing working relationship between the two sets of staff. BOND TA providers also have been helpful in fostering this relationship by coaching WIC and EWIC staff on how to ask appropriate and targeted questions. During site visits in fall 2013, WIC and EWIC staff said they were more informed following the new rules related to communication, which has improved their client relationships and enabled them to help beneficiaries plan for the likely outcome of a work CDR (e.g., create an AEE or anticipate an improper payment). SSA Processing of Work CDRs (Work CDR Step 3) Delays in processing work CDRs have existed since the start of the demonstration, at which time delays reflected their existence under the current law. Regardless of their origin, WIC and EWIC staff have cited delays in work CDR processing as key barriers to timely benefit adjustment. Such delays exist because demand exceeds the processing capacity of staff in SSA’s BOND work unit within the Office of Research, Demonstration, and Employment Support (ORDES), the SSA unit responsible for BOND work CDRs.59 At the start of the demonstration, staff within the BOND work unit estimated that they would process about 8,000 work CDRs through September 2017. However, the number of BOND treatment subjects in need of a work CDR already had surpassed that estimate by early 2014. According to BODS data (which were available for only 478 beneficiaries for whom work CDRs were requested by BOND staff in 2012 and, according to a proxy variable used to estimate the completion date for work CDR,60 an
59 The BOND work unit was a part of SSA’s Office of Program Development and Research (OPDR) until that
department merged with the Office of Employment Support Programs into one consolidated department, ORDES, in early 2014.
60 The earliest earnings record created post-work CDR is used as a proxy for the date on which the cessation date assignment was made. This date was used to estimate the time required to complete work CDRs. Earnings records can include a variety of reports, including AEEs, records submitted in advance of reconciliation to show evidence of noncountable earnings, and records submitted to appeal the outcome of reconciliation. These records are not completed until after a beneficiary is known to have been assigned a cessation date. AEEs, which, according to staff interviews, are the earliest earnings record for a large majority of beneficiaries in this subsample, are typically created as soon as a beneficiary is known to have an assigned disability cessation date.

BOND Implementation and Evaluation Contract No. SS00-10-60011
Abt Associates Inc. Process Study Report 58
average of 227 days (7.5 months) elapsed between the CDR initiation and the cessation date assignment. This time frame includes completion and mailing of the CDR paperwork by beneficiaries—factors beyond SSA’s direct control. In addition, in the first five months of that year, BOND staff had responsibility for preparing work CDR packages, which might have been less timely than that of SSA preparation. Regardless, this time frame did not support timely benefit adjustment. In response to the backlog of work CDRs and associated processing delays, SSA increased the resources dedicated to treatment subject work CDR processing in late 2012. First, the transition to permanent staff in the ORDES BOND work unit in December 2012 increased the amount of time available for CDR processing (because of less time spent training new staff) and enabled the staff to become proficient with work CDRs and the BOND rules. Then, in August 2013, two SSA processing centers began assisting with work CDRs for approximately 1,300 BOND beneficiaries believed to have earnings above BYA and potentially eligible for offset use (based on SSA’s check of IRS data). Finally, in January 2014, SSA field offices began processing work CDRs for about 4,700 treatment subjects who were overdue for a work CDR but were not anticipated to have a disability cessation.61 New cases not anticipated to have a disability cessation will continue to be assigned to field offices for processing. As a result of the additional resources, the backlog of and processing times for work CDRs for BOND treatment subjects have declined. According to status updates provided to the BOND I-team in March and April 2014, the expectation was that SSA processing centers and field offices would complete processing of the work CDR cases for treatment group subjects in their backlogs by May 2014.62 WIC and EWIC benefits counseling staff, members of the BOND processing center, and staff at the BOND work unit all reported that processing times have declined over the past year. WIC and EWIC staff reported that average processing times for work CDRs requested in 2013 had fallen to about four months, and an estimate of average processing times based on BODS data suggests that processing took less than an average of 148 days (4.9 months).63 A comparison of 2012 and 2013 BODS data suggests that work CDR processing times among beneficiaries for whom work CDRs were requested by BOND staff were shorter in 2013. However, the available statistics are for completed cases, and there might have been more pending cases (including those that take a long time to process) in the sample initiated in 2013. Still, collectively, the evidence suggests that work CDR processing times declined and, in the absence of unanticipated problems, it seems likely that they will decline further. BOND work unit staff estimate that when the backlog of cases processed by the SSA processing centers and field office is complete, new
61 Cases discovered to have a disability cessation are transferred back to the BOND work unit for further
processing. Based on estimates provided by SSA, approximately 5 to 10 percent of these cases are found to have a disability cessation.
62 As of March 2014, ORDES estimated that the field offices would complete their processing of the backlog of 4,700 work CDR cases by May 2014. All of the approximately 1,300 work CDRs sent to SSA processing centers for processing were complete as of April 2014.
63 BODS data on a subset of 504 beneficiaries for whom a work CDR was requested by BOND staff (as opposed to by SSA) in 2013 and who, according to a proxy variable, were assigned a cessation date as of April 2014, suggest that an average of 148 days elapsed between the work CDR initiation and the cessation date assignment. This time frame includes completion and mailing of the work CDR paperwork and processing.
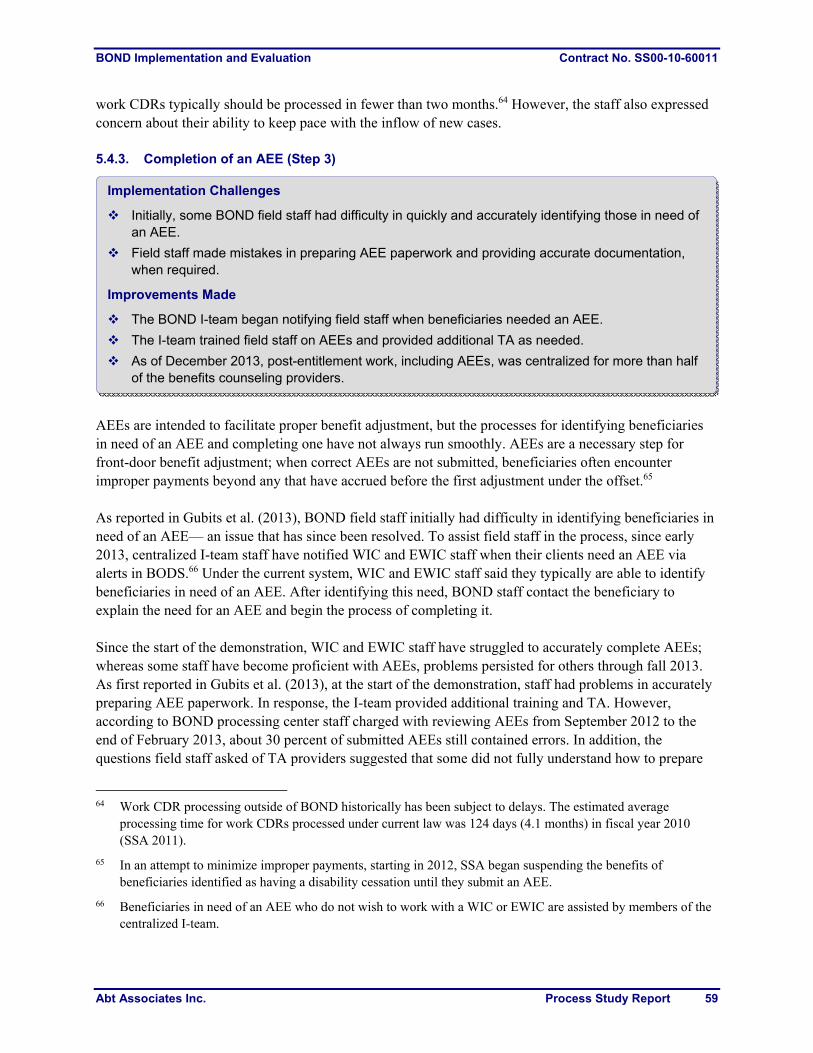
BOND Implementation and Evaluation Contract No. SS00-10-60011
Abt Associates Inc. Process Study Report 59
work CDRs typically should be processed in fewer than two months.64 However, the staff also expressed concern about their ability to keep pace with the inflow of new cases. 5.4.3. Completion of an AEE (Step 3)
AEEs are intended to facilitate proper benefit adjustment, but the processes for identifying beneficiaries in need of an AEE and completing one have not always run smoothly. AEEs are a necessary step for front-door benefit adjustment; when correct AEEs are not submitted, beneficiaries often encounter improper payments beyond any that have accrued before the first adjustment under the offset.65 As reported in Gubits et al. (2013), BOND field staff initially had difficulty in identifying beneficiaries in need of an AEE— an issue that has since been resolved. To assist field staff in the process, since early 2013, centralized I-team staff have notified WIC and EWIC staff when their clients need an AEE via alerts in BODS.66 Under the current system, WIC and EWIC staff said they typically are able to identify beneficiaries in need of an AEE. After identifying this need, BOND staff contact the beneficiary to explain the need for an AEE and begin the process of completing it. Since the start of the demonstration, WIC and EWIC staff have struggled to accurately complete AEEs; whereas some staff have become proficient with AEEs, problems persisted for others through fall 2013. As first reported in Gubits et al. (2013), at the start of the demonstration, staff had problems in accurately preparing AEE paperwork. In response, the I-team provided additional training and TA. However, according to BOND processing center staff charged with reviewing AEEs from September 2012 to the end of February 2013, about 30 percent of submitted AEEs still contained errors. In addition, the questions field staff asked of TA providers suggested that some did not fully understand how to prepare
64 Work CDR processing outside of BOND historically has been subject to delays. The estimated average
processing time for work CDRs processed under current law was 124 days (4.1 months) in fiscal year 2010 (SSA 2011).
65 In an attempt to minimize improper payments, starting in 2012, SSA began suspending the benefits of beneficiaries identified as having a disability cessation until they submit an AEE.
66 Beneficiaries in need of an AEE who do not wish to work with a WIC or EWIC are assisted by members of the centralized I-team.
Implementation Challenges
Initially, some BOND field staff had difficulty in quickly and accurately identifying those in need of an AEE.
Field staff made mistakes in preparing AEE paperwork and providing accurate documentation, when required.
Improvements Made
The BOND I-team began notifying field staff when beneficiaries needed an AEE.
The I-team trained field staff on AEEs and provided additional TA as needed.
As of December 2013, post-entitlement work, including AEEs, was centralized for more than half of the benefits counseling providers.
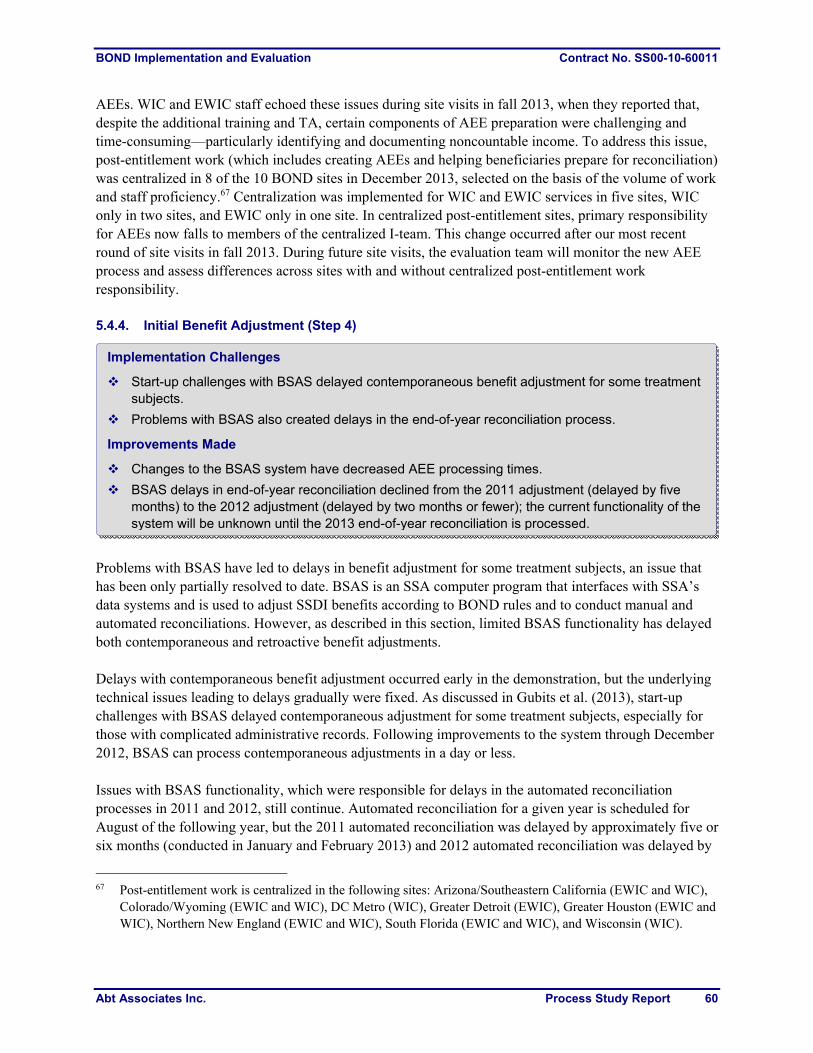
BOND Implementation and Evaluation Contract No. SS00-10-60011
Abt Associates Inc. Process Study Report 60
AEEs. WIC and EWIC staff echoed these issues during site visits in fall 2013, when they reported that, despite the additional training and TA, certain components of AEE preparation were challenging and time-consuming—particularly identifying and documenting noncountable income. To address this issue, post-entitlement work (which includes creating AEEs and helping beneficiaries prepare for reconciliation) was centralized in 8 of the 10 BOND sites in December 2013, selected on the basis of the volume of work and staff proficiency.67 Centralization was implemented for WIC and EWIC services in five sites, WIC only in two sites, and EWIC only in one site. In centralized post-entitlement sites, primary responsibility for AEEs now falls to members of the centralized I-team. This change occurred after our most recent round of site visits in fall 2013. During future site visits, the evaluation team will monitor the new AEE process and assess differences across sites with and without centralized post-entitlement work responsibility. 5.4.4. Initial Benefit Adjustment (Step 4)
Problems with BSAS have led to delays in benefit adjustment for some treatment subjects, an issue that has been only partially resolved to date. BSAS is an SSA computer program that interfaces with SSA’s data systems and is used to adjust SSDI benefits according to BOND rules and to conduct manual and automated reconciliations. However, as described in this section, limited BSAS functionality has delayed both contemporaneous and retroactive benefit adjustments. Delays with contemporaneous benefit adjustment occurred early in the demonstration, but the underlying technical issues leading to delays gradually were fixed. As discussed in Gubits et al. (2013), start-up challenges with BSAS delayed contemporaneous adjustment for some treatment subjects, especially for those with complicated administrative records. Following improvements to the system through December 2012, BSAS can process contemporaneous adjustments in a day or less. Issues with BSAS functionality, which were responsible for delays in the automated reconciliation processes in 2011 and 2012, still continue. Automated reconciliation for a given year is scheduled for August of the following year, but the 2011 automated reconciliation was delayed by approximately five or six months (conducted in January and February 2013) and 2012 automated reconciliation was delayed by
67 Post-entitlement work is centralized in the following sites: Arizona/Southeastern California (EWIC and WIC),
Colorado/Wyoming (EWIC and WIC), DC Metro (WIC), Greater Detroit (EWIC), Greater Houston (EWIC and WIC), Northern New England (EWIC and WIC), South Florida (EWIC and WIC), and Wisconsin (WIC).
Implementation Challenges
Start-up challenges with BSAS delayed contemporaneous benefit adjustment for some treatment subjects.
Problems with BSAS also created delays in the end-of-year reconciliation process.
Improvements Made
Changes to the BSAS system have decreased AEE processing times.
BSAS delays in end-of-year reconciliation declined from the 2011 adjustment (delayed by five months) to the 2012 adjustment (delayed by two months or fewer); the current functionality of the system will be unknown until the 2013 end-of-year reconciliation is processed.

BOND Implementation and Evaluation Contract No. SS00-10-60011
Abt Associates Inc. Process Study Report 61
up to two months (conducted in four batches in September and October 2013). According to a respondent in the BOND work unit within SSA, the contractor responsible for developing BSAS is working to fix the outstanding problems with the system. It is uncertain whether the updates will be implemented by the scheduled date for the 2013 automated reconciliation (August 2014). The contractor expects that automated reconciliation will be delayed by no more than one month. The direct result of such delays is an extended wait for benefit adjustment. 5.5. Delayed Benefit Adjustment and Potential Effects
The initial implementation of BOND was characterized by a number of challenges that hindered timely benefit adjustment. Though many of these challenges have been addressed and the process appears to have become shorter, delays remain. These delays often lead to improper payments, when beneficiaries are paid more or less than they were entitled to—a difference that is later reconciled by SSA. Earlier sections of this report described in detail the multiple sources of delays encountered since the start of the demonstration. In this section, we summarize the remaining delay as of late 2013 and consider the potential consequences of improper benefit payments that result from delays for beneficiaries’ perceptions and behaviors. 5.5.1. Delays with Benefit Adjustment
As of late 2013, significant delays in benefit adjustment occurred at several points. Exhibit 5-4 presents the steps in the benefit adjustment process and identifies points at which delays were reported to be common in fall 2013.This exhibit reveals two important findings. First, for beneficiaries attempting to enter through the front door, work CDRs were the most common point for delays. According to estimates from BODS and reports from WIC and EWIC staff, in 2013 it took on average about four or five months to prepare and process a work CDR. These delays occurred in part because of SSA processing delays, but some delays were beyond SSA’s control—most notably when beneficiaries did not quickly respond to SSA requests for information. Second, delays in completing AEEs sometimes occurred because of limited staff proficiency, which varied by site. BODS data suggest that 2013 AEEs were completed in an average of 12 days.68 In total, assuming no delays in initiating work CDRs or adjusting benefits, in 2013 it took approximately five months to complete the steps for front-door benefit adjustment. For work CDRs initiated in the seventh or eighth TWP month (as was the guidance at the writing of this report), beneficiaries might have had benefits adjusted on time for the first month of offset entry. Longer processing times could have resulted in delays in benefit adjustment. Consistent with the program design, back-door adjustment was less timely than front-door adjustment and was subject to additional, unanticipated delays. By design, the process began with a delay because beneficiaries did not report their earnings to the demonstration. SSA subsequently identified many beneficiaries with earnings in need of a work CDR, but only after SSA received earnings information from another, less timely, source. For instance, if a beneficiary entered the offset in January, SSA would not see evidence of earnings in the IRS data until it first reviewed the data in August of the following year—17 months later. This timeline is somewhat accelerated compared to the typical timeline for SSA case reviews for current-law subjects. Although it is possible for SSA to review the earnings of current-
68 Statistics from the BOND Weekly AEE Monitoring Report disseminated on December 3, 2013, and produced
by the BOND I-team, based on 1,918 beneficiaries with a 2013 AEE.
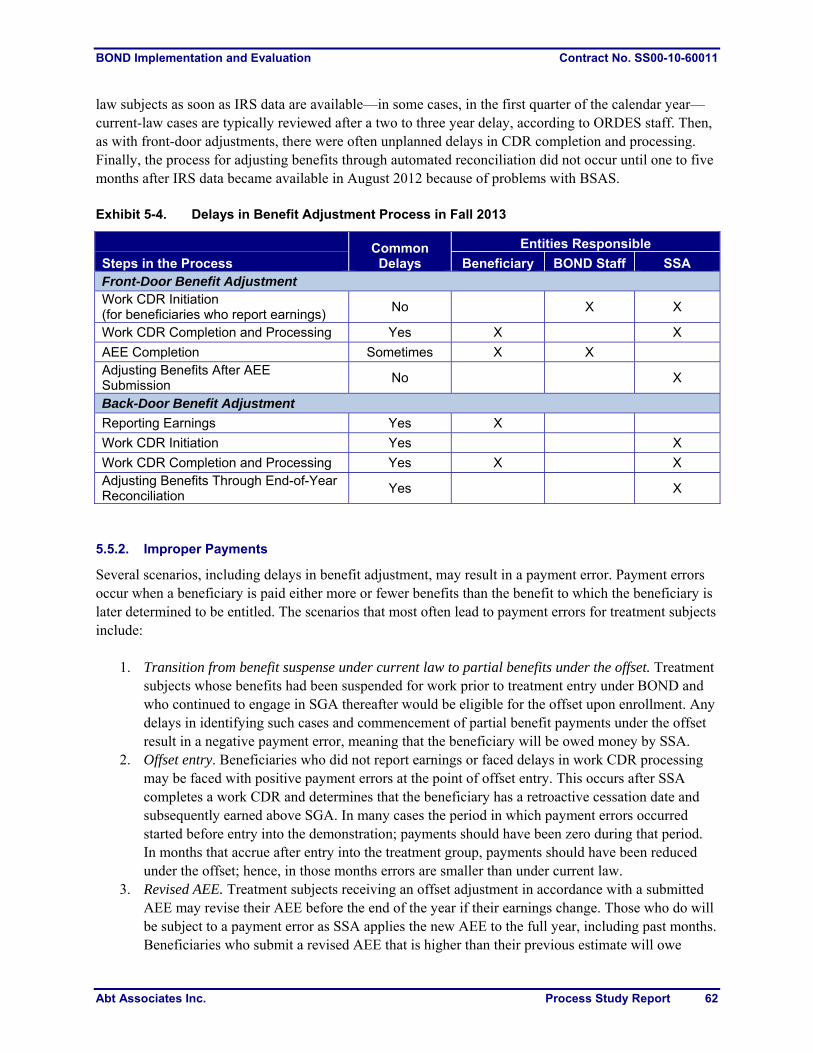
BOND Implementation and Evaluation Contract No. SS00-10-60011
Abt Associates Inc. Process Study Report 62
law subjects as soon as IRS data are available—in some cases, in the first quarter of the calendar year—current-law cases are typically reviewed after a two to three year delay, according to ORDES staff. Then, as with front-door adjustments, there were often unplanned delays in CDR completion and processing. Finally, the process for adjusting benefits through automated reconciliation did not occur until one to five months after IRS data became available in August 2012 because of problems with BSAS. Exhibit 5-4. Delays in Benefit Adjustment Process in Fall 2013
Common Delays
Entities Responsible
Steps in the Process Beneficiary BOND Staff SSA Front-Door Benefit Adjustment Work CDR Initiation (for beneficiaries who report earnings)
No
X X
Work CDR Completion and Processing Yes X X
AEE Completion Sometimes X X Adjusting Benefits After AEE Submission
No
X
Back-Door Benefit Adjustment
Reporting Earnings Yes X
Work CDR Initiation Yes X
Work CDR Completion and Processing Yes X X Adjusting Benefits Through End-of-Year Reconciliation
Yes
X
5.5.2. Improper Payments
Several scenarios, including delays in benefit adjustment, may result in a payment error. Payment errors occur when a beneficiary is paid either more or fewer benefits than the benefit to which the beneficiary is later determined to be entitled. The scenarios that most often lead to payment errors for treatment subjects include:
1. Transition from benefit suspense under current law to partial benefits under the offset. Treatment subjects whose benefits had been suspended for work prior to treatment entry under BOND and who continued to engage in SGA thereafter would be eligible for the offset upon enrollment. Any delays in identifying such cases and commencement of partial benefit payments under the offset result in a negative payment error, meaning that the beneficiary will be owed money by SSA.
2. Offset entry. Beneficiaries who did not report earnings or faced delays in work CDR processing may be faced with positive payment errors at the point of offset entry. This occurs after SSA completes a work CDR and determines that the beneficiary has a retroactive cessation date and subsequently earned above SGA. In many cases the period in which payment errors occurred started before entry into the demonstration; payments should have been zero during that period. In months that accrue after entry into the treatment group, payments should have been reduced under the offset; hence, in those months errors are smaller than under current law.
3. Revised AEE. Treatment subjects receiving an offset adjustment in accordance with a submitted AEE may revise their AEE before the end of the year if their earnings change. Those who do will be subject to a payment error as SSA applies the new AEE to the full year, including past months. Beneficiaries who submit a revised AEE that is higher than their previous estimate will owe
BOND Implementation and Evaluation Contract No. SS00-10-60011
Abt Associates Inc. Process Study Report 63
money to SSA and beneficiaries who submit a revised AEE that is lower than their previous estimate will be owed money from SSA.
4. Incorrect AEE. During reconciliation after the end of the calendar year, if SSA discovers that actual earnings differed from predicted earnings reported via an AEE, the difference needs to be resolved. If actual earnings were higher than the AEE, the beneficiary was paid too much and owes SSA money. If, instead, actual earnings were lower than the AEE, the beneficiary was not paid enough and is owed money.
SSA calls the resulting payment errors improper payments, an umbrella term that encompasses three types of payment errors:
Underpayments occur when beneficiaries receive fewer benefits than those to which they were entitled. When SSA recognizes the underpayment, the agency issues beneficiaries a lump-sum check. This could occur in the first scenario above, as the result of a revised AEE, or in the case where actual annual earnings fall substantially short of the AEE.
Overpayments occur when beneficiaries receive more benefits than those to which they were entitled in the previous calendar year and SSA does not recognize the discrepancy until after the end of the year. When SSA identifies the overpayment, it requires beneficiaries to repay the amount owed (either by check or withheld future benefits). Beneficiaries have the right to appeal an overpayment and SSA may agree to set up a repayment plan to mitigate financial hardship. Overpayments can occur at the point of offset entry or as a result of an incorrect AEE.
Incorrect overpayments occur when beneficiaries receive more benefits than those to which they were entitled in the current calendar year and SSA recognizes the discrepancy before the end of the year. This can occur at offset entry or following the submission of a revised AEE. In these cases, benefit checks are withheld through the end of the calendar year to recoup the payment.
Thus, there are two primary differences between incorrect overpayments and those overpayments discovered after the end of the calendar year; unlike the latter, with incorrect overpayments, (1) beneficiaries do not have the right to appeal and (2) SSA withholds the full amount of the benefit check until the payment is recouped.69 Note also that improper payment types do not correspond uniquely to the four improper payment scenarios described above, and some scenarios can generate both types of improper payments—most notably the second scenario, when treatment subjects first enter the offset. The size of improper payments is related to the scenario under which the error arose. Underpayments and overpayments can be especially large at offset entry because the errors may span multiple years (some of which may predate BOND). SSA is also likely to identify large overpayments for control subjects simultaneously with an initial discovery of unreported earnings during the EPE, but unlikely to find underpayments. For treatment subjects, improper payments in subsequent years are expected to be small,
69 At the end of each calendar year, incorrect overpayments are eligible to be reclassified as overpayments.
However, according to a staff person at the BOND processing center, incorrect overpayments for BOND treatment subjects have rarely been converted to overpayments at the start of the next year. Conversion does not occur unless the beneficiary initiates a reconciliation request or, more typically, automated end-of-year reconciliation. If incorrect payments are not converted, benefit checks remain suspended until the incorrect overpayment amount is repaid.
BOND Implementation and Evaluation Contract No. SS00-10-60011
Abt Associates Inc. Process Study Report 64
especially if the beneficiary submits an accurate AEE at offset entry and at the beginning of each subsequent year. This is because AEEs are intended to facilitate proper benefit adjustment and thus reduce payment errors and because potential errors will span a period of no more than a year. According to staff in the BOND work unit at SSA, these small payment errors were anticipated to occur in BOND as part of the change from monthly to annual accounting. Overpayments and underpayments are also common for control subjects following the initial suspension of benefits for work if their earnings rise or fall above the SGA threshold, especially if they do not immediately report the changes in their earnings. In contrast, incorrect overpayments are expected to be rare for control subjects because SSA uses a monthly, rather than annual, accounting period under current law.70 According to WIC and EWIC staff, improper payments were common among offset users, as they are for control subjects under current law, and varied in size.71,72 WIC and EWIC staff in seven sites observed that all or nearly all of their clients in the offset had received a payment error resulting in payment owed to SSA. There was no consensus as to whether such errors were more prevalent among BOND treatment subjects than among working SSDI beneficiaries subject to the current law. The size of improper payments can vary; WIC and EWIC staff observed that incorrect payments typically were smaller than overpayments. This is not surprising, because incorrect payments occur within a calendar year and by definition cannot be larger than the annual benefit amount. In contrast, overpayments can span multiple calendar years. Holding earnings and the time of their identification constant, overpayments for those assigned to the BOND treatment group are likely smaller than for those assigned to the control group. This is because treatment subjects who earn above BYA are entitled to receive more benefits under the offset relative to control subjects—again holding earnings and time of identification constant. 5.5.3. Improper Payments Might Influence Beneficiaries’ Perceptions and Behaviors
WIC and EWIC staff reported that improper payments can cause financial hardship for some beneficiaries, while others manage to avoid financial distress. According to these staff as well as beneficiaries themselves, many beneficiaries live near or below the poverty line and have struggled to deal with even seemingly minor payment disruptions. In many cases respondents did not differentiate improper payments by the scenarios that caused the payment error, or distinguish between incorrect overpayments and those overpayments discovered after the end of the calendar year. However, WIC and EWIC staff did observe that overpayments, especially overpayments for months that predate offset entry, are often large and, although disruptive, can be mediated and gradually repaid over the course of months or years. In contrast, they explained, unanticipated incorrect overpayments can be more problematic, even 70 Working early retirees are the only other Social Security beneficiaries experiencing incorrect payments more
than rarely; like BOND treatment subjects, their earnings are adjusted under an offset on the basis of annual earnings estimates. Processing of incorrect payments under BOND follows processes established for early retirees.
71 We are currently exploring the use of BODS and SSA administrative data to quantify the prevalence and size of work-related overpayments, underpayments, and incorrect payments.
72 Incorrect underpayments were not mentioned by staff during site visits or by beneficiaries during focus groups. However, ORDES staff reported that incorrect underpayments have occurred for BOND treatment subjects. It is likely that incorrect underpayments, which SSA reconciles by immediate payment of benefits due to the beneficiary, were easy to manage and did not cause financial distress, so were not as memorable as payment errors resulting in beneficiaries owing money to SSA.

BOND Implementation and Evaluation Contract No. SS00-10-60011
Abt Associates Inc. Process Study Report 65
if smaller, because SSA retains the entire benefit check until the incorrect payment is recovered or the remaining amount is converted to an overpayment. In general, WICs and EWICs reported that beneficiaries who anticipate and are able to plan for improper payments of any sort typically are better positioned and may encounter only minor or no financial difficulties. However, WIC and EWIC staff explained that some beneficiaries had trouble reserving the money to repay an eventual improper payment after being warned about potential improper payments. According to interviews with beneficiaries and WIC and EWIC staff, beneficiaries have a range of reactions to incorrect overpayments and overpayments discovered after the end of the calendar year, often related to whether they were anticipated. Nearly all interviewed WIC and EWIC staff said that they alert their clients when there is potential for an improper overpayment and advise them to set aside money for repayment. These staff reported that beneficiaries who set aside money to prepare for such a situation appreciated the advance warning and were less likely to form negative associations between the improper payment and BOND. They said that other beneficiaries, particularly those who were not reporting their earnings to the demonstration, did not receive this warning and often had negative reactions to the situation. Incorrect overpayments and overpayments come as a surprise to many beneficiaries, according to reports from WIC and EWIC staff and beneficiary focus groups. Upon the discovery of such improper payments, these beneficiaries were, reportedly, often angry and blamed SSA, BOND, or their WIC or EWIC benefits counselor for the payment error. When possible, demonstration staff explain that beneficiaries are in a better situation because of the benefit offset than they would have been otherwise. Some field staff and focus group participants reported beneficiaries reducing their hours or quitting their jobs in response to the news of an improper payment. This is a surprising response, because under the offset rules their total income (benefits plus earnings) will be reduced. We have no information on the prevalence of this type of response. It is possible that the length of delays in benefit adjustments and the size of improper payments will have a bearing on the size of benefit offset impacts on employment and benefit outcomes, but it is difficult to know the direction, let alone the magnitude of such effects. One reason is that the direction and size of any effect depends on how delays in benefit cessations for work and the size of overpayments affect employment and benefits under current law. Currently, there are no estimates of how processing delays and improper payments affect employment and benefits under current law, and there are conflicting hypotheses about the direction of the effects. One theory is that delays and improper payments under current law reduce engagement in SGA and increase benefit payments because beneficiaries fear accrual of large improper payments. A competing hypothesis is that delays and improper payments under current law increase engagement in SGA and reduce benefit payments, when improper payments are recovered, because beneficiaries are often unaware that they have entered suspension for work status and some continue in that status until SSA notifies them of the improper payment. There is a second reason we cannot predict how processing delays and improper payments for treatment subjects will affect benefit offset impacts. The direction and size of any effect also depends on whether delays are typically shorter or longer under the benefit offset than under current law, and whether improper payments are smaller or larger. Although processing delays have been long and improper payments have been substantial for many BOND treatment subjects, they are not necessarily longer or
BOND Implementation and Evaluation Contract No. SS00-10-60011
Abt Associates Inc. Process Study Report 66
larger than under current law. Further, even if delays are typically longer, the improper payments might typically be smaller. 5.6. Conclusion
The benefit offset—the signature component of BOND—is intended to encourage sustained engagement in SGA, but several factors can hinder its ability to achieve the desired effect. First, despite several rounds of outreach to Stage 1 treatment subjects and informed consent provided by Stage 2 treatment subjects in their enrollment process, some treatment subjects might be unaware of or might not fully understand the details of the offset. Beneficiaries can refrain from SGA because of a limited understanding of the benefit offset, combined with fear of benefit loss. Others might be unsure of the process for initiating timely benefit adjustment. Second, beneficiaries who wish to take advantage of the offset might be unable to find or maintain employment long enough to do so, in part because of an insufficient network of employment-related supports in many of the BOND sites. Finally, some beneficiaries who have used the offset have encountered delays in benefit adjustment and improper payments and, because of the experience, no longer wish to continue engaging in SGA. Despite the challenges to offset use, the number of offset users has grown and the process of benefit adjustment has improved over the course of the demonstration. By the end of 2013, at least 1,159 (1.5 percent) Stage 1 treatment subjects and 585 (7.3 percent) Stage 2 treatment subjects had one or more months of offset use, figures that likely will increase as the work CDR backlog is cleared and more beneficiaries are identified as offset users through the reconciliation process for 2013. Although many of the known offset users had their benefits adjusted through the back door, the proportion with such retroactive adjustments appears to have declined each year through 2013. Furthermore, the advantageous benefit formula offered by the offset could encourage back-door offset users who were not previously aware of the offset to continue to engage in SGA at higher rates than they would under current law. Finally, the front-door benefit adjustment process has become more efficient and timely. In 2013 it took approximately five months for front- door benefit adjustment, a time line that allows for the first benefit adjustment to occur contemporaneously with the first month of offset use if the beneficiary reports earnings in a timely fashion.
BOND Implementation and Evaluation Contract No. SS00-10-60011
Abt Associates Inc. Process Study Report 67
6. Conclusion
This chapter summarizes the findings, focusing primarily on the implementation of BOND over the past year. Findings build upon earlier documents that summarize the initial implementation for Stages 1 and 2 (Wittenburg et al. 2012 and Gubits et al. 2013, respectively). Overall, we found that BOND implementation has gradually improved so that, as of fall 2013, the demonstration is, in large part, functioning as designed. The balance of this chapter review the four most important new findings: (1) additional outreach increased T1 subjects’ awareness of the demonstration’s services and requirements; (2) as planned, there were clear distinctions between WIC and EWIC services; (3) the percentage of treatment subjects using the offset is small but growing steadily; and (4) delays in the adjustment of benefits under the offset have been lengthy and, in many cases, led to improper payments for beneficiaries, but delays are becoming substantially shorter. 6.1. Additional Outreach to T1 Subjects
In an attempt to increase awareness about the offset and counseling services, the I-team made additional outreach attempts by letter and telephone to Stage 1 beneficiaries (see Chapter 3). In 2012, the team targeted 10,388 T1 subjects, most of whom had earnings in 2011. Then, in 2013 and early 2014, they targeted the remaining 60,345 T1 subjects who had not already been in contact with the demonstration. The investment in additional outreach appears to have increased awareness of the demonstration and proactive use of its services and incentives. The intensity of outreach appears to have direct implications for program awareness and use. Additional T1 outreach efforts immediately preceded increased setups, WIC assignments, and AEE submissions—signs of interest in using the offset. The positive outcomes following the additional Stage 1 outreach suggest that multiple contact attempts and modes of contact generate better outcomes than a single letter. Still, it remains unclear if mail and telephone are adequate outreach approaches. Indeed, beneficiaries and staff reported misunderstanding or mistrust of the demonstration based on feedback about the initial outreach letter. It is also apparent that, despite repeated contact attempts, most beneficiaries did not respond to any of the Stage 1 outreach efforts or were not reached because of outdated or inaccurate contact information. We do not know the extent to which this reflects lack of interest in the benefit offset, rather than failure of the outreach efforts to adequately inform those who might find the offset of substantial interest. In a national program, the media, disability organizations, service providers, SSA claims representatives, and others could be used to help inform beneficiaries of the new rules. These approaches are not practical for BOND, however, because only a small percentage of beneficiaries in demonstration areas are eligible to use the offset. 6.2. Distinctions Between Services Available to T21, T22, and Control Group
Beneficiaries
A central feature of the demonstration is testing whether counseling services more intensive than those available under the current law increase the size of the impacts of the benefit offset on earnings, benefits, and other outcomes. Essential to this experiment is a clear distinction between WIC services—those designed to be comparable to services available to all beneficiaries provided by CWICs (benefits counselors) under WIPA—and EWIC services. We found that WIC and EWIC services differed substantially in both the quantity and nature of services provided. We found substantial differences in all
BOND Implementation and Evaluation Contract No. SS00-10-60011
Abt Associates Inc. Process Study Report 68
sites, but differences in some sites were much larger than in others. The take-up rate of benefits counseling was lower than expected for WIC services (T1 and T21 subjects) and met expectations for EWIC services (T22 subjects). True to the design of BOND, nearly all subjects in the EWIC group received some benefits counseling, compared to about one-third of the WIC group. As intended, T22 subjects who receive counseling services receive more intensive services than T21 subjects. Statistics from BODS clearly show this pattern. However, these statistics might be somewhat biased because EWIC staff have more incentive than WIC staff to record use of each service provided. Qualitative evidence from beneficiary focus groups and interviews of counselors are consistent with the quantitative findings. The impact analysis will formally test whether the delivery of EWIC services, along with the benefit offset, resulted in impacts on earnings, benefits, and other outcomes that differ from the benefit offset accompanied by WIC services only (i.e., T21 vs. T22). Although WIC services were designed to be comparable to the CWIC services available to beneficiaries under current law, two substantial differences have emerged and have the potential to influence impact estimates. The first difference is an interruption in the WIPA program, which provides support for CWIC services. As a result, during the period when WIPA was not funded (June 30, 2012, to August 1, 2013), CWIC services might have been less available, or not available at all to control group beneficiaries. In all sites, some counseling services continued to be available to at least some control subjects during this period, but not necessarily to all, and the timeliness and quality of services might have declined for those who did receive services (Chapter 2). The second difference is that, until very recently, most WIC staff had responsibility for providing post-entitlement services, whereas CWIC staff do not have this responsibility. Under current law, some post-entitlement responsibilities do not exist (such as AEEs) and SSA field offices are responsible for the rest of this work. WIC staff said that they prioritized post-entitlement work over general benefits counseling because post-entitlement work has a direct impact on benefit payments. As a result, some WIC staff reported that they often provided intensive services to beneficiaries who had completed or were close to completing their TWPs, but were unable to provide their desired level of service to those beneficiaries in the initial stages of employment. WIC staff who had worked as CWIC benefits counselors under WIPA said that they had a different relationship with beneficiaries than they did under WIPA because of the post-entitlement work. They preferred to solely help the beneficiary maximize the beneficiary’s financial and personal well-being by using the work incentives, and not take responsibility for administrative functions that could lead to identification of improper payments. WIC staff said that they felt greater pressure and responsibility under BOND than they did as a CWIC under WIPA. Toward the end of the period under study, much of the post-entitlement work was shifted to centralized I-team staff. The most important implication of WIC performance of post-entitlement work for the demonstration is that it might have a dampening effect on the size of impacts. However, we have no reason to think that any such effect would be substantial. 6.3. Offset Use
The percentage of treatment subjects who have used the offset is steadily growing. Based on benefit adjustments made through May 2014, 0.9 percent of T1 subjects and 1.2 percent of Stage 2 treatment subjects had used the offset by the end of 2011. By the end of 2013, SSA had identified 1.5 percent of T1 subjects and 7.3 percent of Stage 2 treatment subjects. Offset use will continue to rise as SSA retroactively adjusts the benefits of offset users through 2013 and more treatment subjects engage in SGA and qualify for the offset.
BOND Implementation and Evaluation Contract No. SS00-10-60011
Abt Associates Inc. Process Study Report 69
Patterns in offset use and benefit adjustment suggest that most early offset users did not proactively engage with the demonstration through the front door to allow for timely adjustment. Although at least 0.9 percent (695 beneficiaries) of T1 subjects were offset users in 2011, SSA had adjusted the benefits of only 0.05 percent (39 beneficiaries) by the end of that year. Many of the T1 offset users in 2011 entered the offset in the month after random assignment; presumably, they were already in the EPE and engaged in SGA. Over the next two years, the proportion of back-door adjustments appears to have decreased. For example, the number of initial adjustments for T1 subjects made by automated reconciliation dropped from 64 percent of 2011 offset users to 29 percent of 2012 offset users. Many Stage 2 subjects also had their benefits adjusted retroactively. However, the proportion of retroactive adjustments is lower than for Stage 1 subjects. At least 1.2 percent (94 beneficiaries) of T21 and T22 treatment subjects were offset users in 2011 but SSA adjusted the benefits for only 0.3 percent (23 beneficiaries) of those subjects by the end of that year. The proportion of Stage 2 offset users who had their benefits adjusted through automated reconciliations declined from 45 percent in 2011 to 26 percent in 2012. The pathway of benefit adjustment could be related to awareness and understanding of the offset. Specifically, front-door adjustment requires contact with the demonstration and seems to be highly correlated with awareness of the offset, whereas offset users whose benefits are adjusted through the back door need not have been previously aware of the offset. The Stage 2 recruitment and enrollment process likely ensured that the Stage 2 volunteers, as a group, initially had greater knowledge than those assigned to the Stage 1 treatment group. EWIC outreach to T22 treatment subjects also likely contributed to higher awareness and understanding for that Stage 2 group. Indeed, higher levels of contact with the demonstration likely help explain why a lower proportion of Stage 2 treatment offset users had benefits adjusted through the back door relative to Stage 1 treatment subjects. 6.4. Delays with Benefit Adjustment and Improper Payments
Since the initial implementation of BOND, delays with benefit adjustments under the offset have been common. Because delays are common under current law, BOND control subjects also have presumably experienced substantial delays. Most of the causes of delays are the same under the offset and current law. Under both sets of rules, delays can occur because (1) beneficiaries do not report earnings in a timely manner (to SSA field offices or, in the case of the offset, to the demonstration); (2) backlogs occur in tasks such as processing work CDRs; or (3) beneficiaries are slow to respond to requests for information when the adjustment process is started. Because of the need to inform treatment subjects about the offset, start-up problems in the post-entitlement processes, and delayed review of IRS data on earnings, the demonstration likely contributed to the delays for treatment subjects. We documented improvements in the timeliness for benefit adjustment under BOND, the most notable of which is the decline in work CDR processing times. Some delays remain, but expansion in resources available to perform work CDRs and the centralization of post-entitlement work will likely reduce delays further. It is possible that benefit adjustment for treatment subjects will become, or already is, more timely than adjustment for control subjects. Past delays with benefit adjustment under the benefit offset have contributed to improper payments, which can cause significant financial hardship and often trigger negative responses from beneficiaries. In many cases that arose in focus group discussions or in reports from demonstration staff, beneficiaries
BOND Implementation and Evaluation Contract No. SS00-10-60011
Abt Associates Inc. Process Study Report 70
attributed the improper payment to the benefit offset itself, particularly those who had not been in contact with the demonstration. In some cases, beneficiaries even reduced their earnings or stopped working to avoid future improper payments; such beneficiaries likely failed to understand that continuing to work is in their best interest financially. WIC and EWIC staff explained that educating beneficiaries about the benefit offset rules, updating them about their progress toward the offset and benefit adjustment, and explaining the alternative situation the beneficiary would face under current law (which is almost always a less desirable situation) reduced anxiety and frustration about the improper payment, but any substantial improper payments are nonetheless a negative experience. Inadequate understanding of the effect of earnings on benefits coupled with delays in the adjustment of benefits might have delayed the impact of the benefit offset on earnings for some treatment subjects. After benefits were adjusted under the offset, more treatment group subjects presumably understood that engagement in SGA caused only a partial reduction in benefits, rather than suspension as under the current law. This could spawn greater work effort and larger earnings impacts than have been seen to this point. 6.5. Future Process Analyses
Moving forward, there are two additional rounds of process study data collection: September−October 2014 and September−October 2015. Six future reports will include findings from these and previous visits: (1) Stage 2 Interim Participation, Process, and Impact Report (June 2015); (2) Stage 1 Interim Participation, Process, and Impact Report (March 2016); (3) Stage 1 Interim Participation, Process, and Impact Report (March 2017); (4) Stage 2 Interim Participation, Process, and Impact Report (June 2017); (5) Connecting the Impact and Process Analyses (June 2017); and (6) the Final Evaluation Report (October 2017). We plan to focus future data collection in five primary areas. First, we will continue to document the differences between WIC and EWIC services as well as the control group services available through WIPA. Second, we will examine how shifting post-entitlement responsibilities from WIC and EWIC staff to centralized staff might influence the quality and intensity of benefits counseling services. Third, we will continue to track the extent to which back-door benefit adjustments continue to occur; diminishing back-door adjustments are expected if beneficiaries’ understanding of the offset improves because of recent outreach efforts. Fourth, we will monitor the timeliness of benefit adjustment and document new or ongoing delays in the process. Finally, we will continue to study improper payments, documenting their number and amount and the influence they can have on beneficiaries’ behavior and well-being.

BOND Implementation and Evaluation Contract No. SS00-10-60011
Abt Associates Inc. Process Study Report 71
References
Abt Associates. “Application to Provide Work Incentives Counseling (WIC) and/or Enhanced Work Incentives Counseling (EWIC) Under the Benefit Offset National Demonstration.” Submitted to the Social Security Administration (Contract SS00-10-60011), Office of Program Development & Research. Cambridge, MA: Abt Associates, June 2010.
Bell, Stephen H., Daniel Gubits, David Stapleton, David Wittenburg, Michelle Derr, Arkadipta Ghosh,
and Sara Ansell. “BOND Implementation and Evaluation. Evaluation Analysis Plan.” Final Report Submitted to Social Security Administration. Cambridge, MA: Abt Associates, March 2011.
Gubits, Daniel, Rachel Cook, Steven Bell, Michelle K. Derr, Denise Hoffman, Jill Berk, Ann Person, and
David Wittenburg. “BOND Implementation and Evaluation: BOND Stage 2 Early Assessment Report.” Submitted to the Social Security Administration (contract deliverable 24a.2 under Contract SS00-10-60011), Office of Program Development & Research. Cambridge, MA: Abt Associates, March 2013.
Gubits, Daniel, Winston Lin, and Stephen Bell. “BOND Implementation and Evaluation: First- and
Second-Year Snapshot of Earnings and Benefit Impacts for Stage 2.” Submitted to the Social Security Administration. Cambridge, MA: Abt Associates, and Washington, DC: Mathematica Policy Research, 2014.
Honeycutt, Todd, and David Stapleton. “Striking While the Iron Is Hot: The Effect of Vocational
Rehabilitation Service Wait Times on Employment Outcomes for Applicants Receiving Social Security Disability Benefits.” Journal of Vocational Rehabilitation, vol. 39, no. 2, 2013.
Kehn, Matthew, and Jody Schimmel. “"Enrollment, Employment, and Earnings in the Medicaid Buy-In
Program, 2010.” Submitted to the Centers for Medicare & Medicaid Services Disabled and Elderly Health Programs Group. Washington, DC: Mathematica Policy Research, May 2013.
Livermore, Gina A., Denise Hoffman, and Maura Bardos. “Ticket to Work Participant Characteristics and
Outcomes Under the Revised Regulations.” Submitted to the Social Security Administration, Office of Retirement and Disability Policy. Washington, DC: Mathematica Policy Research, 2012.
O’Day, Bonnie, and David Vandergoot. “Benefit Counseling Specifications and Costs.” Report submitted
to Social Security Administration (contract deliverable 10.1). Cambridge, MA: Abt Associates, July 2010.
Schimmel, Jody, David Stapleton, and Jea Song. “How Common Is ‘Parking’ Among Social Security
Disability Insurance Beneficiaries? Evidence from the 1999 Change in the Earnings Level of Substantial Gainful Activity.” Social Security Bulletin, vol. 71, no. 4, 2011.
BOND Implementation and Evaluation Contract No. SS00-10-60011
Abt Associates Inc. Process Study Report 72
Social Security Administration. “The Social Security Administration’s Report on Continuing Disability Reviews Resulting from Work Activity.” Report to House Appropriations Committee. Washington, DC: SSA, January 26, 2011.
Stapleton, David C., Stephen H. Bell, David C. Wittenburg, Brian Sokol, and Debi McInnis. “BOND
Implementation and Evaluation: BOND Final Design Report.” Submitted to the Social Security Administration (contract deliverable 2.2 under Contract SS00-10-60011), Office of Program Development & Research. Cambridge, MA: Abt Associates, December 2010.
Stapleton, David, David Wittenburg, Daniel Gubits, David Judkins, David Mann, and Andrew McGuirk.
“BOND Implementation and Evaluation: First-Year Snapshot of Earnings and Benefit Impacts for Stage 1.” Cambridge, MA: Abt Associates, and Washington, DC: Mathematica Policy Research, 2013.
Stapleton, David, David Wittenburg, David R. Mann, Denise Hoffman, and Andrew McGuirk. “BOND
Implementation and Evaluation: Second-Year Snapshot of Earnings and Benefit Impacts for Stage 1.” Submitted to the Social Security Administration (contract deliverable 24c.2 under Contract SS00-10-60011), Office of Program Development & Research. Washington, DC: Mathematica Policy Research, 2014.
Weathers, Robert, and Michelle Stegman Bailey. “The Impact of Rehabilitation and Counseling Services
on the Labor Market Activity of Social Security Disability Insurance (SSDI) Beneficiaries.” Journal of Policy Analysis and Management, vol. 33, no. 3, 2014, pp. 623–648.
Wittenburg, David, David Stapleton, Michelle Derr, Denise W. Hoffman, and David R. Mann. “BOND
Implementation and Evaluation: BOND Stage 1 Early Assessment Report.” Submitted to the Social Security Administration (contract deliverable 24.1 under Contract SS00-10-60011), Office of Program Development & Research. Cambridge, MA: Abt Associates, May 2012.
Wright, Deborah, Gina Livermore, Denise Hoffman, Eric Grau, and Maura Bardos. “2010 National
Beneficiary Survey: Methodology and Descriptive Statistics.” Washington, DC: Mathematica Policy Research, 2012.

BOND Implementation and Evaluation Contract No. SS00-10-60011
Abt Associates Inc. Process Study Report A-1
Appendix A. Key Dates in the Time Line of BOND Implementation
Exhibit A-1. Key BOND Implementation Dates
Date Activity
December 2009 Start of BOND contract
October 2010 (site directors); November/December 2010 (BOND site directors and specialists)
Initial training of BOND site office directors and specialists (additional training on BODS and refresher trainings)
October 2010 BOND site offices opened with site directors
February 2011 First full wave of Stage 2 outreach letters mailed to Solicitation Poola
Ongoing Initial training of WIC/EWIC staff began in December 2010/January 2011; additional trainings held in 2011, 2012, and 2013
March 2011 First Stage 2 subject enrolled in BOND
May 2011 Stage 1 random assignment performed
Spring/Summer 2011 Initial roll-out of BODS to field staff
May–July August 2011 Initial outreach letters mailed to all Stage 1 T1 subjects
May 2012 Work CDR preparation responsibility moved to SSA staff
June 2012 WIPA funding ended
September 2012 Stage 2 enrollment ended
September 2012 BOND site offices closed
January–February 2013 Automated reconciliation of 2011 earnings performed for BOND treatment subjects
August 2013 WIPA funding resumed
September–October 2013 Automated reconciliation of 2012 earnings performed for BOND treatment subjects
a The first 200 Stage 2 (wave 1) letters were mailed in January 2011. The balance of wave 1 (6,000 letters) was mailed in February 2011. Wave 2 outreach letters for Stage 2 were mailed in April 2011.
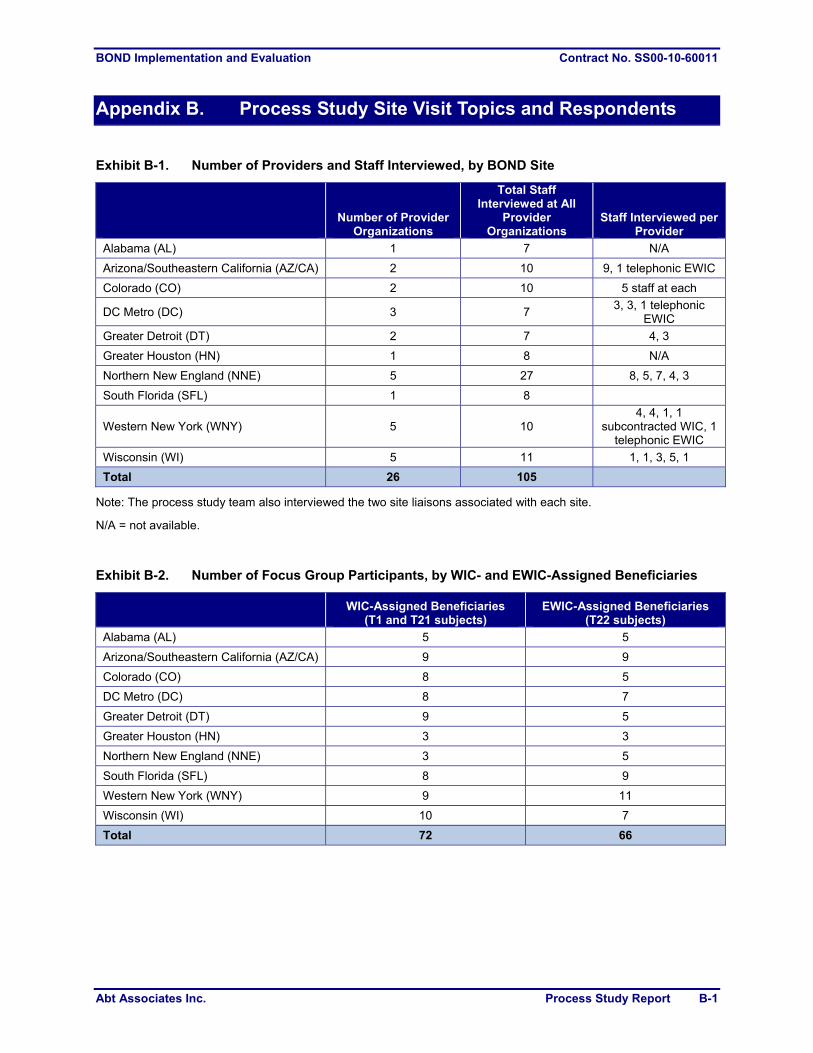
BOND Implementation and Evaluation Contract No. SS00-10-60011
Abt Associates Inc. Process Study Report B-1
Appendix B. Process Study Site Visit Topics and Respondents
Exhibit B-1. Number of Providers and Staff Interviewed, by BOND Site
Number of Provider
Organizations
Total Staff Interviewed at All
Provider Organizations
Staff Interviewed per Provider
Alabama (AL) 1 7 N/A
Arizona/Southeastern California (AZ/CA) 2 10 9, 1 telephonic EWIC
Colorado (CO) 2 10 5 staff at each
DC Metro (DC) 3 7 3, 3, 1 telephonic
EWIC
Greater Detroit (DT) 2 7 4, 3
Greater Houston (HN) 1 8 N/A
Northern New England (NNE) 5 27 8, 5, 7, 4, 3
South Florida (SFL) 1 8
Western New York (WNY) 5 10 4, 4, 1, 1
subcontracted WIC, 1 telephonic EWIC
Wisconsin (WI) 5 11 1, 1, 3, 5, 1
Total 26 105
Note: The process study team also interviewed the two site liaisons associated with each site.
N/A = not available.
Exhibit B-2. Number of Focus Group Participants, by WIC- and EWIC-Assigned Beneficiaries
WIC-Assigned Beneficiaries (T1 and T21 subjects)
EWIC-Assigned Beneficiaries (T22 subjects)
Alabama (AL) 5 5
Arizona/Southeastern California (AZ/CA) 9 9
Colorado (CO) 8 5
DC Metro (DC) 8 7
Greater Detroit (DT) 9 5
Greater Houston (HN) 3 3
Northern New England (NNE) 3 5
South Florida (SFL) 8 9
Western New York (WNY) 9 11
Wisconsin (WI) 10 7
Total 72 66
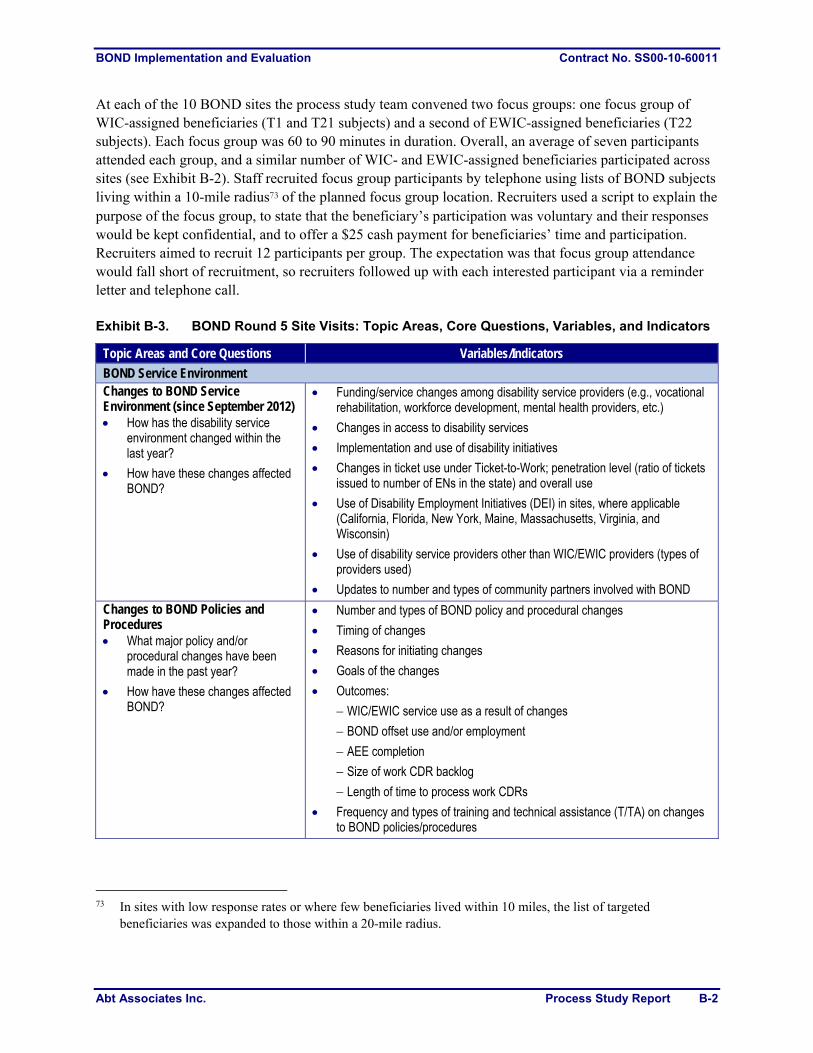
BOND Implementation and Evaluation Contract No. SS00-10-60011
Abt Associates Inc. Process Study Report B-2
At each of the 10 BOND sites the process study team convened two focus groups: one focus group of WIC-assigned beneficiaries (T1 and T21 subjects) and a second of EWIC-assigned beneficiaries (T22 subjects). Each focus group was 60 to 90 minutes in duration. Overall, an average of seven participants attended each group, and a similar number of WIC- and EWIC-assigned beneficiaries participated across sites (see Exhibit B-2). Staff recruited focus group participants by telephone using lists of BOND subjects living within a 10-mile radius73 of the planned focus group location. Recruiters used a script to explain the purpose of the focus group, to state that the beneficiary’s participation was voluntary and their responses would be kept confidential, and to offer a $25 cash payment for beneficiaries’ time and participation. Recruiters aimed to recruit 12 participants per group. The expectation was that focus group attendance would fall short of recruitment, so recruiters followed up with each interested participant via a reminder letter and telephone call. Exhibit B-3. BOND Round 5 Site Visits: Topic Areas, Core Questions, Variables, and Indicators
Topic Areas and Core Questions Variables/Indicators
BOND Service Environment Changes to BOND Service Environment (since September 2012) How has the disability service
environment changed within the last year?
How have these changes affected BOND?
Funding/service changes among disability service providers (e.g., vocational rehabilitation, workforce development, mental health providers, etc.)
Changes in access to disability services
Implementation and use of disability initiatives
Changes in ticket use under Ticket-to-Work; penetration level (ratio of tickets issued to number of ENs in the state) and overall use
Use of Disability Employment Initiatives (DEI) in sites, where applicable (California, Florida, New York, Maine, Massachusetts, Virginia, and Wisconsin)
Use of disability service providers other than WIC/EWIC providers (types of providers used)
Updates to number and types of community partners involved with BOND
Changes to BOND Policies and Procedures What major policy and/or
procedural changes have been made in the past year?
How have these changes affected BOND?
Number and types of BOND policy and procedural changes
Timing of changes
Reasons for initiating changes
Goals of the changes
Outcomes:
WIC/EWIC service use as a result of changes
BOND offset use and/or employment
AEE completion
Size of work CDR backlog
Length of time to process work CDRs
Frequency and types of training and technical assistance (T/TA) on changes to BOND policies/procedures
73 In sites with low response rates or where few beneficiaries lived within 10 miles, the list of targeted
beneficiaries was expanded to those within a 20-mile radius.
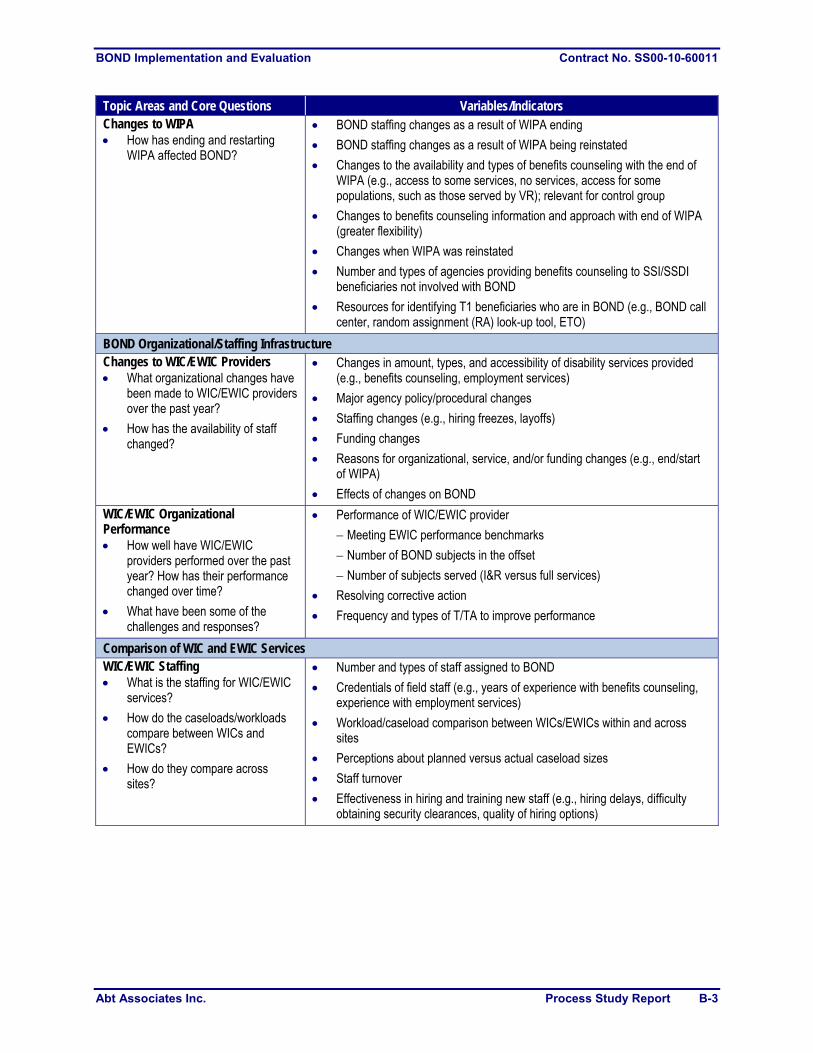
BOND Implementation and Evaluation Contract No. SS00-10-60011
Abt Associates Inc. Process Study Report B-3
Topic Areas and Core Questions Variables/Indicators Changes to WIPA How has ending and restarting
WIPA affected BOND?
BOND staffing changes as a result of WIPA ending
BOND staffing changes as a result of WIPA being reinstated
Changes to the availability and types of benefits counseling with the end of WIPA (e.g., access to some services, no services, access for some populations, such as those served by VR); relevant for control group
Changes to benefits counseling information and approach with end of WIPA (greater flexibility)
Changes when WIPA was reinstated
Number and types of agencies providing benefits counseling to SSI/SSDI beneficiaries not involved with BOND
Resources for identifying T1 beneficiaries who are in BOND (e.g., BOND call center, random assignment (RA) look-up tool, ETO)
BOND Organizational/Staffing Infrastructure Changes to WIC/EWIC Providers What organizational changes have
been made to WIC/EWIC providers over the past year?
How has the availability of staff changed?
Changes in amount, types, and accessibility of disability services provided (e.g., benefits counseling, employment services)
Major agency policy/procedural changes
Staffing changes (e.g., hiring freezes, layoffs)
Funding changes
Reasons for organizational, service, and/or funding changes (e.g., end/start of WIPA)
Effects of changes on BOND
WIC/EWIC Organizational Performance How well have WIC/EWIC
providers performed over the past year? How has their performance changed over time?
What have been some of the challenges and responses?
Performance of WIC/EWIC provider
Meeting EWIC performance benchmarks
Number of BOND subjects in the offset
Number of subjects served (I&R versus full services)
Resolving corrective action
Frequency and types of T/TA to improve performance
Comparison of WIC and EWIC Services WIC/EWIC Staffing What is the staffing for WIC/EWIC
services?
How do the caseloads/workloads compare between WICs and EWICs?
How do they compare across sites?
Number and types of staff assigned to BOND
Credentials of field staff (e.g., years of experience with benefits counseling, experience with employment services)
Workload/caseload comparison between WICs/EWICs within and across sites
Perceptions about planned versus actual caseload sizes
Staff turnover
Effectiveness in hiring and training new staff (e.g., hiring delays, difficulty obtaining security clearances, quality of hiring options)
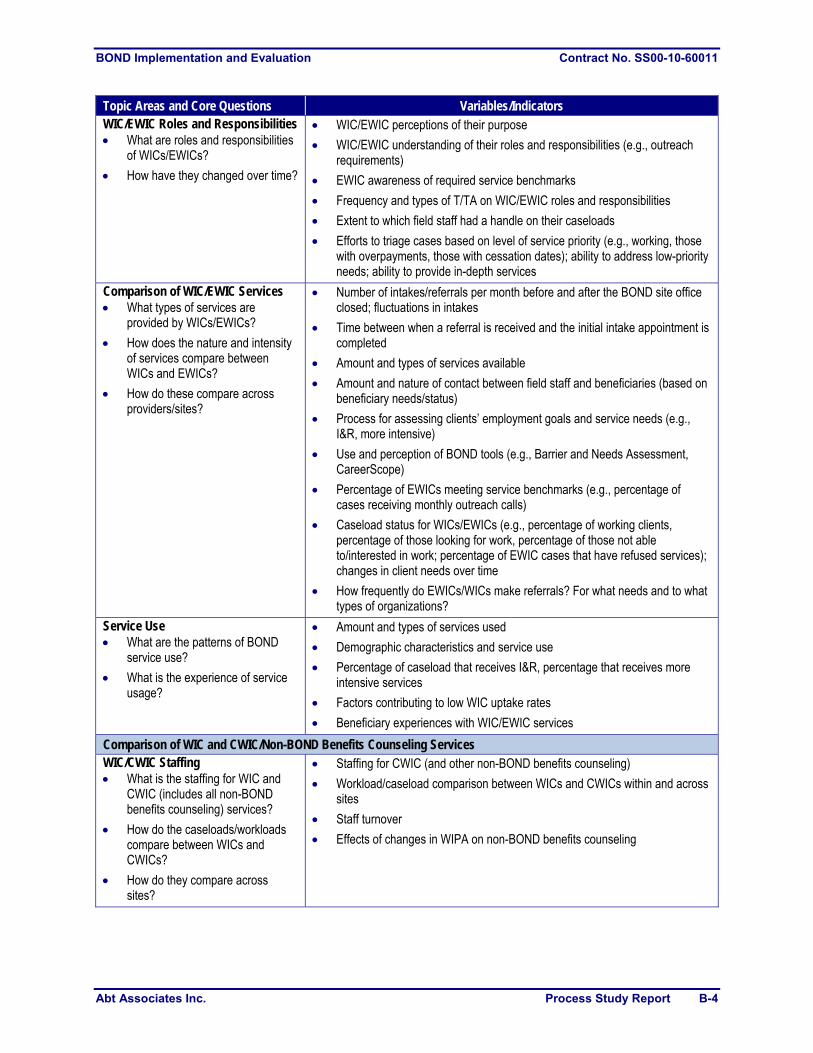
BOND Implementation and Evaluation Contract No. SS00-10-60011
Abt Associates Inc. Process Study Report B-4
Topic Areas and Core Questions Variables/Indicators WIC/EWIC Roles and Responsibilities What are roles and responsibilities
of WICs/EWICs?
How have they changed over time?
WIC/EWIC perceptions of their purpose
WIC/EWIC understanding of their roles and responsibilities (e.g., outreach requirements)
EWIC awareness of required service benchmarks
Frequency and types of T/TA on WIC/EWIC roles and responsibilities
Extent to which field staff had a handle on their caseloads
Efforts to triage cases based on level of service priority (e.g., working, those with overpayments, those with cessation dates); ability to address low-priority needs; ability to provide in-depth services
Comparison of WIC/EWIC Services What types of services are
provided by WICs/EWICs?
How does the nature and intensity of services compare between WICs and EWICs?
How do these compare across providers/sites?
Number of intakes/referrals per month before and after the BOND site office closed; fluctuations in intakes
Time between when a referral is received and the initial intake appointment is completed
Amount and types of services available
Amount and nature of contact between field staff and beneficiaries (based on beneficiary needs/status)
Process for assessing clients’ employment goals and service needs (e.g., I&R, more intensive)
Use and perception of BOND tools (e.g., Barrier and Needs Assessment, CareerScope)
Percentage of EWICs meeting service benchmarks (e.g., percentage of cases receiving monthly outreach calls)
Caseload status for WICs/EWICs (e.g., percentage of working clients, percentage of those looking for work, percentage of those not able to/interested in work; percentage of EWIC cases that have refused services); changes in client needs over time
How frequently do EWICs/WICs make referrals? For what needs and to what types of organizations?
Service Use What are the patterns of BOND
service use?
What is the experience of service usage?
Amount and types of services used
Demographic characteristics and service use
Percentage of caseload that receives I&R, percentage that receives more intensive services
Factors contributing to low WIC uptake rates
Beneficiary experiences with WIC/EWIC services
Comparison of WIC and CWIC/Non-BOND Benefits Counseling Services WIC/CWIC Staffing What is the staffing for WIC and
CWIC (includes all non-BOND benefits counseling) services?
How do the caseloads/workloads compare between WICs and CWICs?
How do they compare across sites?
Staffing for CWIC (and other non-BOND benefits counseling)
Workload/caseload comparison between WICs and CWICs within and across sites
Staff turnover
Effects of changes in WIPA on non-BOND benefits counseling
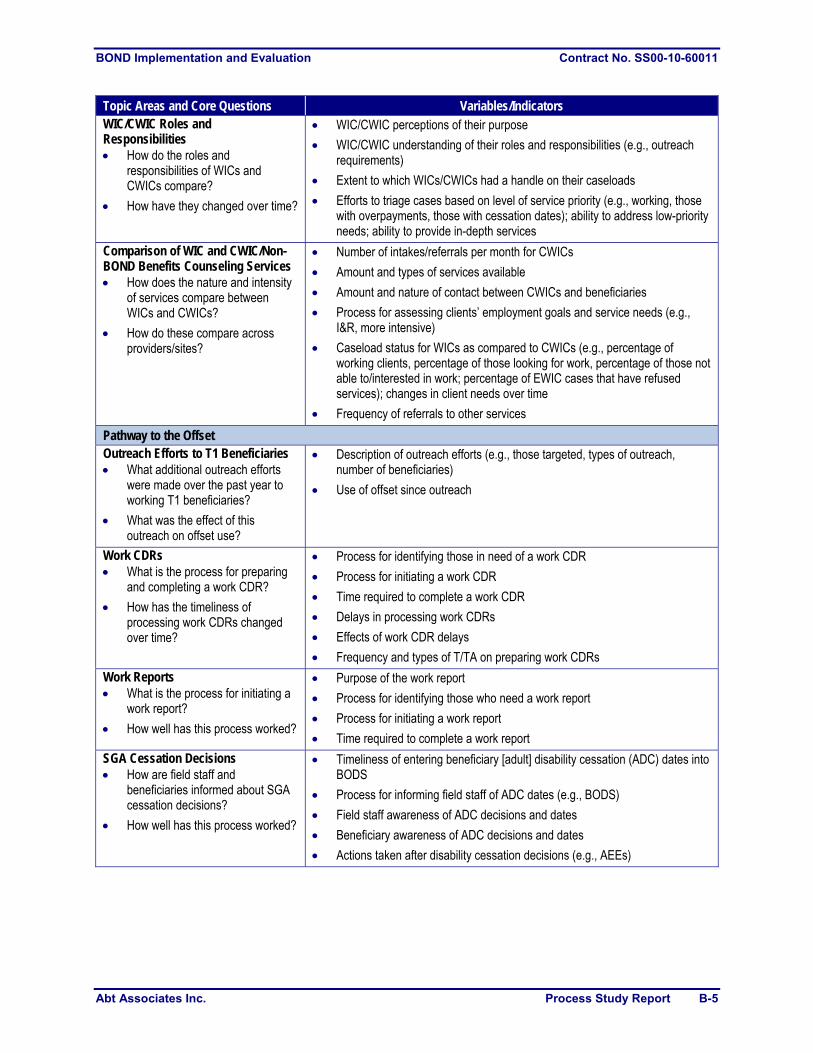
BOND Implementation and Evaluation Contract No. SS00-10-60011
Abt Associates Inc. Process Study Report B-5
Topic Areas and Core Questions Variables/Indicators WIC/CWIC Roles and Responsibilities How do the roles and
responsibilities of WICs and CWICs compare?
How have they changed over time?
WIC/CWIC perceptions of their purpose
WIC/CWIC understanding of their roles and responsibilities (e.g., outreach requirements)
Extent to which WICs/CWICs had a handle on their caseloads
Efforts to triage cases based on level of service priority (e.g., working, those with overpayments, those with cessation dates); ability to address low-priority needs; ability to provide in-depth services
Comparison of WIC and CWIC/Non-BOND Benefits Counseling Services How does the nature and intensity
of services compare between WICs and CWICs?
How do these compare across providers/sites?
Number of intakes/referrals per month for CWICs
Amount and types of services available
Amount and nature of contact between CWICs and beneficiaries
Process for assessing clients’ employment goals and service needs (e.g., I&R, more intensive)
Caseload status for WICs as compared to CWICs (e.g., percentage of working clients, percentage of those looking for work, percentage of those not able to/interested in work; percentage of EWIC cases that have refused services); changes in client needs over time
Frequency of referrals to other services
Pathway to the Offset Outreach Efforts to T1 Beneficiaries What additional outreach efforts
were made over the past year to working T1 beneficiaries?
What was the effect of this outreach on offset use?
Description of outreach efforts (e.g., those targeted, types of outreach, number of beneficiaries)
Use of offset since outreach
Work CDRs What is the process for preparing
and completing a work CDR?
How has the timeliness of processing work CDRs changed over time?
Process for identifying those in need of a work CDR
Process for initiating a work CDR
Time required to complete a work CDR
Delays in processing work CDRs
Effects of work CDR delays
Frequency and types of T/TA on preparing work CDRs
Work Reports What is the process for initiating a
work report?
How well has this process worked?
Purpose of the work report
Process for identifying those who need a work report
Process for initiating a work report
Time required to complete a work report
SGA Cessation Decisions How are field staff and
beneficiaries informed about SGA cessation decisions?
How well has this process worked?
Timeliness of entering beneficiary [adult] disability cessation (ADC) dates into BODS
Process for informing field staff of ADC dates (e.g., BODS)
Field staff awareness of ADC decisions and dates
Beneficiary awareness of ADC decisions and dates
Actions taken after disability cessation decisions (e.g., AEEs)
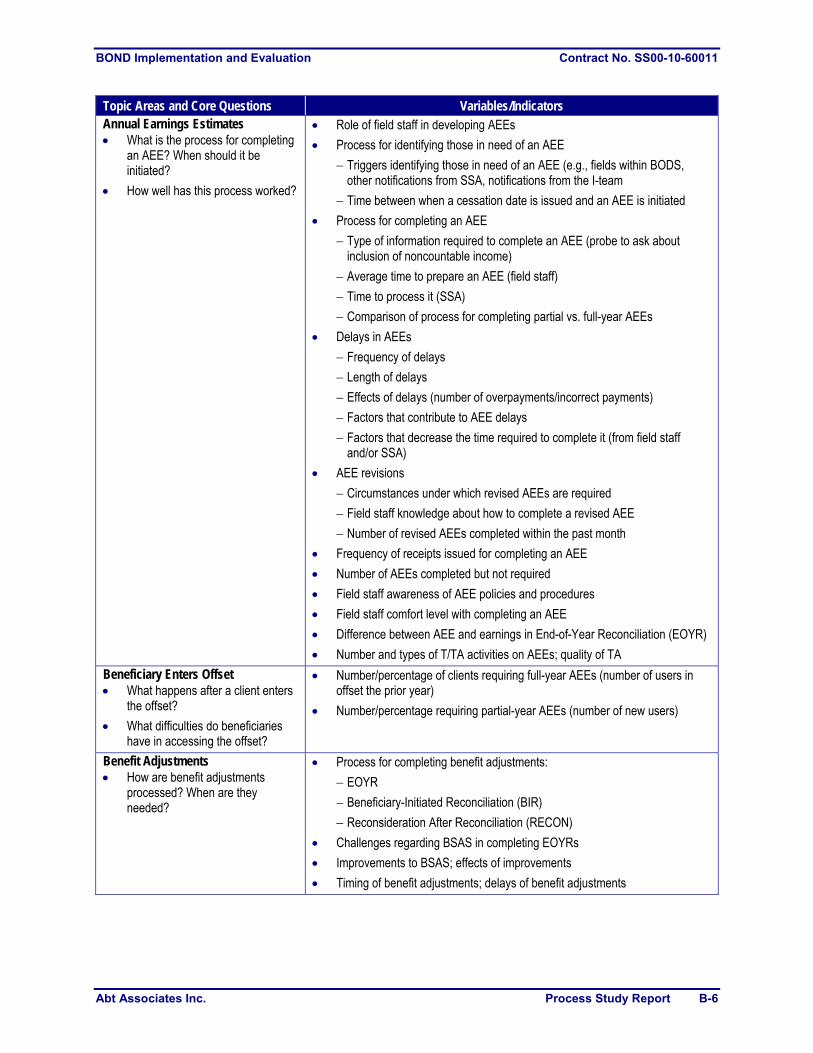
BOND Implementation and Evaluation Contract No. SS00-10-60011
Abt Associates Inc. Process Study Report B-6
Topic Areas and Core Questions Variables/Indicators Annual Earnings Estimates What is the process for completing
an AEE? When should it be initiated?
How well has this process worked?
Role of field staff in developing AEEs
Process for identifying those in need of an AEE
Triggers identifying those in need of an AEE (e.g., fields within BODS, other notifications from SSA, notifications from the I-team
Time between when a cessation date is issued and an AEE is initiated
Process for completing an AEE
Type of information required to complete an AEE (probe to ask about inclusion of noncountable income)
Average time to prepare an AEE (field staff)
Time to process it (SSA)
Comparison of process for completing partial vs. full-year AEEs
Delays in AEEs
Frequency of delays
Length of delays
Effects of delays (number of overpayments/incorrect payments)
Factors that contribute to AEE delays
Factors that decrease the time required to complete it (from field staff and/or SSA)
AEE revisions
Circumstances under which revised AEEs are required
Field staff knowledge about how to complete a revised AEE
Number of revised AEEs completed within the past month
Frequency of receipts issued for completing an AEE
Number of AEEs completed but not required
Field staff awareness of AEE policies and procedures
Field staff comfort level with completing an AEE
Difference between AEE and earnings in End-of-Year Reconciliation (EOYR)
Number and types of T/TA activities on AEEs; quality of TA
Beneficiary Enters Offset What happens after a client enters
the offset?
What difficulties do beneficiaries have in accessing the offset?
Number/percentage of clients requiring full-year AEEs (number of users in offset the prior year)
Number/percentage requiring partial-year AEEs (number of new users)
Benefit Adjustments How are benefit adjustments
processed? When are they needed?
Process for completing benefit adjustments:
EOYR
Beneficiary-Initiated Reconciliation (BIR)
Reconsideration After Reconciliation (RECON)
Challenges regarding BSAS in completing EOYRs
Improvements to BSAS; effects of improvements
Timing of benefit adjustments; delays of benefit adjustments

BOND Implementation and Evaluation Contract No. SS00-10-60011
Abt Associates Inc. Process Study Report B-7
Topic Areas and Core Questions Variables/Indicators Improper Payments/Overpayments How frequent are improper
payments?
What are the consequences for beneficiaries?
What steps have been taken to reduce overpayments? How successful have they been?
Frequency of, amounts, and reasons for improper payments (e.g., overpayments, underpayments, incorrect payments)
Consequences of overpayments for beneficiaries
Strategies for reducing overpayments
Success in reducing overpayments
Variation in Implementation and Offset Use Across Sites How does the implementation of
BOND vary across sites?
What are the implications of this variation on service and offset use?
Amount and types of implementation variation across sites
Quality of services
Number of subjects in offset
Percentage of completed AEEs
Amount and types of service use
Delays in benefit adjustments; overpayment amounts
Demographic characteristics of service users
Caseload/workload sizes
WIC/EWIC provider staff quality
Staff knowledge of BOND process
Comparison of T/TA requests and needs across sites
Monitoring, Reporting, and Use of BODS and Other Data Systems Process for Monitoring and Tracking Beneficiary Earnings and Benefits How do field staff monitor and track
earnings, benefit changes, and other case actions?
Process for entering services into BODS
Frequency of entering data (e.g., immediately or as soon as possible after the beneficiary interaction, weekly data entry, monthly data entry)
Quality and consistency of data entry
Understanding of where field staff record earnings and evidence of earnings (work reports, not case notes)
Knowledge of when to issue receipts for entering earnings
Frequency and timeliness of issuing receipts
Use of BODS How and when do field staff use
BODS?
How is information stored in BODS?
Field staff use of BODS
Comfort level with BODS
Use of BTS and ETO for WICs who also serve as CWICs
Perceptions about the accuracy of BODS data
Use of BODS email
Frequency and types of T/TA on use of BODS
Monitoring Field Staff Performance How are field staff informed about
their performance in meeting BOND requirements (e.g., outreach, timely completion of AEEs)?
Process for informing field staff about performance on BOND benchmarks
How this information is used
Actions taken when performance is low

BOND Implementation and Evaluation Contract No. SS00-10-60011
Abt Associates Inc. Process Study Report B-8
Topic Areas and Core Questions Variables/Indicators
Communication and Coordination Communication Between the I-team and Field Staff How, when, and for what purposes
does the I-team communicate with field staff?
Communication between I-team and field staff (e.g., frequency, mode, and time between request and response)
Purposes of communication (e.g., clarify policy, inform field staff of performance, respond to T/TA requests)
With whom do field staff communicate most often (e.g., liaisons, contracted TA providers [Virginia Commonwealth University, Center for Essential Management Services], BOND technical support [e.g., Gina Freeman])
Field staff knowledge of whom to contact for what information
Average number of emails field staff receive each day; purpose of emails
Frequency of checking BODS email for status updates
Communication Between the Field Staff and SSA How, when, and for what purposes
do field staff and SSA communicate?
Communication between field staff and SSA (e.g., frequency, mode, and length of time between request and response)
Communication between SSA and WICs/EWICs regarding work CDRs
Other reasons for communication
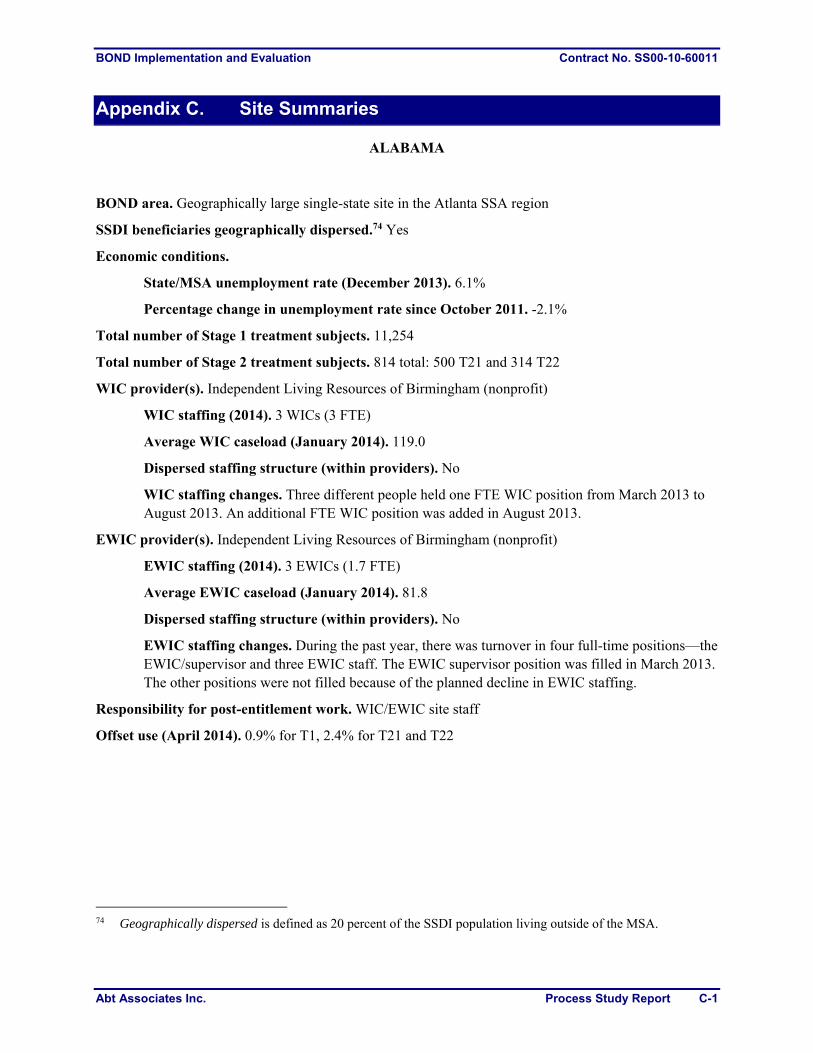
BOND Implementation and Evaluation Contract No. SS00-10-60011
Abt Associates Inc. Process Study Report C-1
Appendix C. Site Summaries
ALABAMA BOND area. Geographically large single-state site in the Atlanta SSA region
SSDI beneficiaries geographically dispersed.74 Yes
Economic conditions.
State/MSA unemployment rate (December 2013). 6.1%
Percentage change in unemployment rate since October 2011. -2.1%
Total number of Stage 1 treatment subjects. 11,254
Total number of Stage 2 treatment subjects. 814 total: 500 T21 and 314 T22
WIC provider(s). Independent Living Resources of Birmingham (nonprofit)
WIC staffing (2014). 3 WICs (3 FTE)
Average WIC caseload (January 2014). 119.0
Dispersed staffing structure (within providers). No
WIC staffing changes. Three different people held one FTE WIC position from March 2013 to August 2013. An additional FTE WIC position was added in August 2013.
EWIC provider(s). Independent Living Resources of Birmingham (nonprofit)
EWIC staffing (2014). 3 EWICs (1.7 FTE)
Average EWIC caseload (January 2014). 81.8
Dispersed staffing structure (within providers). No
EWIC staffing changes. During the past year, there was turnover in four full-time positions—the EWIC/supervisor and three EWIC staff. The EWIC supervisor position was filled in March 2013. The other positions were not filled because of the planned decline in EWIC staffing.
Responsibility for post-entitlement work. WIC/EWIC site staff
Offset use (April 2014). 0.9% for T1, 2.4% for T21 and T22
74 Geographically dispersed is defined as 20 percent of the SSDI population living outside of the MSA.

BOND Implementation and Evaluation Contract No. SS00-10-60011
Abt Associates Inc. Process Study Report C-2
ARIZONA / Southeastern CALIFORNIA BOND area. Geographically large multistate site in the San Francisco SSA region, comprising the state of Arizona as well as Riverside and Imperial counties in southeastern California
SSDI beneficiaries geographically dispersed.75 No
Economic conditions.
State/MSA unemployment rate (December 2013). 7.6% (Arizona); 9.4% (Southeastern California)
Percentage change in unemployment rate since October 2011. -1.6% (Arizona); -3.6% (Southeastern California)
Total number of Stage 1 treatment subjects. 7,787
Total number of Stage 2 treatment subjects. 1,011 total: 625 T21 and 386 T22
WIC provider(s). Arizona Bridge to Independent Living (nonprofit)
WIC staffing (2014). 3 WICs (2.5 FTEs)
Average WIC caseload (January 2014). 208.8
Dispersed staffing structure (within providers). No
WIC staffing changes. Three WIC positions staffed at 0.10, 0.25, and 1.0 FTE were eliminated from late 2012 to early 2013.
EWIC provider(s). Arizona Bridge to Independent Living (nonprofit)
EWIC staffing (2014). 2 EWICs (2 FTEs)
Average EWIC caseload (January 2014). 97.5
Dispersed staffing structure (within providers). No
EWIC staffing changes. There has been frequent turnover in the EWIC positions at the supervisory and EWIC positions. Eliminated positions included two EWIC staff and a part-time (0.5 FTE) telephonic EWIC. The EWIC supervisor position was vacant beginning in September 2013. The supervisor responsibilities were handled by the EWIC agency administrator.
Responsibility for post-entitlement work. Centralized
Offset use (April 2014). 1.6% for T1, 5.1% for T21 and T22
75 Geographically dispersed is defined as 20 percent of the SSDI population living outside of the MSA.
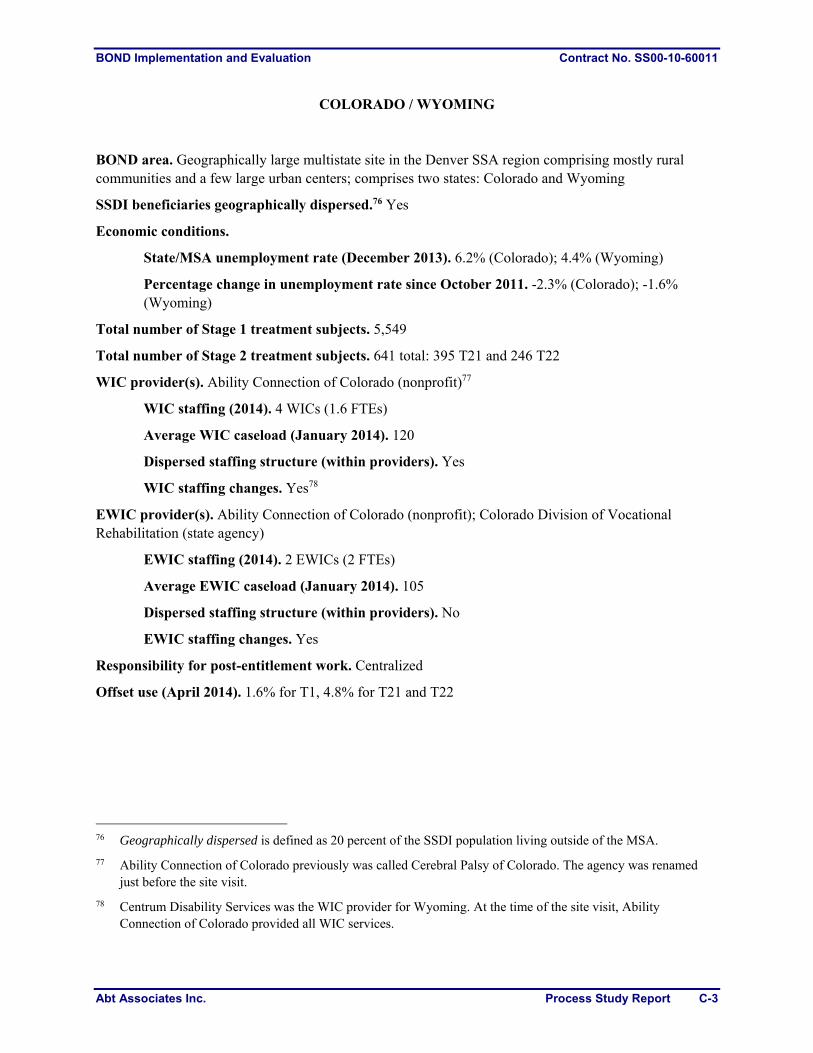
BOND Implementation and Evaluation Contract No. SS00-10-60011
Abt Associates Inc. Process Study Report C-3
COLORADO / WYOMING BOND area. Geographically large multistate site in the Denver SSA region comprising mostly rural communities and a few large urban centers; comprises two states: Colorado and Wyoming
SSDI beneficiaries geographically dispersed.76 Yes
Economic conditions.
State/MSA unemployment rate (December 2013). 6.2% (Colorado); 4.4% (Wyoming)
Percentage change in unemployment rate since October 2011. -2.3% (Colorado); -1.6% (Wyoming)
Total number of Stage 1 treatment subjects. 5,549
Total number of Stage 2 treatment subjects. 641 total: 395 T21 and 246 T22
WIC provider(s). Ability Connection of Colorado (nonprofit)77
WIC staffing (2014). 4 WICs (1.6 FTEs)
Average WIC caseload (January 2014). 120
Dispersed staffing structure (within providers). Yes
WIC staffing changes. Yes78
EWIC provider(s). Ability Connection of Colorado (nonprofit); Colorado Division of Vocational Rehabilitation (state agency)
EWIC staffing (2014). 2 EWICs (2 FTEs)
Average EWIC caseload (January 2014). 105
Dispersed staffing structure (within providers). No
EWIC staffing changes. Yes
Responsibility for post-entitlement work. Centralized
Offset use (April 2014). 1.6% for T1, 4.8% for T21 and T22
76 Geographically dispersed is defined as 20 percent of the SSDI population living outside of the MSA.
77 Ability Connection of Colorado previously was called Cerebral Palsy of Colorado. The agency was renamed just before the site visit.
78 Centrum Disability Services was the WIC provider for Wyoming. At the time of the site visit, Ability Connection of Colorado provided all WIC services.
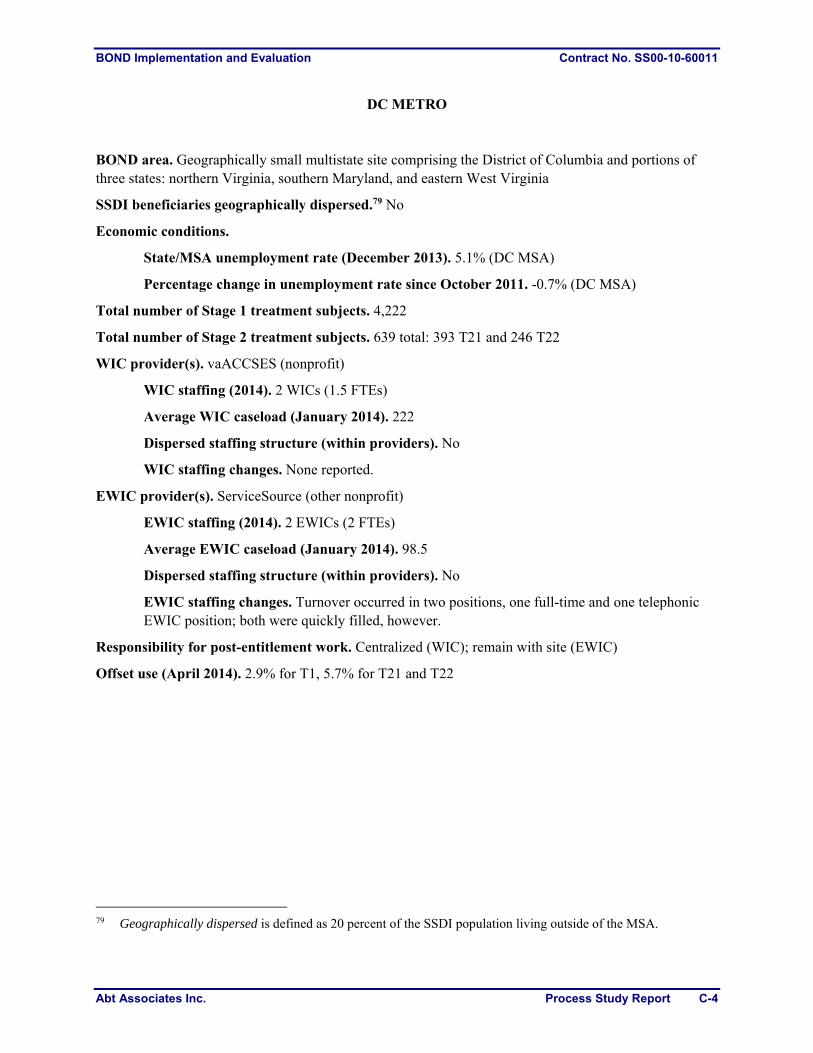
BOND Implementation and Evaluation Contract No. SS00-10-60011
Abt Associates Inc. Process Study Report C-4
DC METRO BOND area. Geographically small multistate site comprising the District of Columbia and portions of three states: northern Virginia, southern Maryland, and eastern West Virginia
SSDI beneficiaries geographically dispersed.79 No
Economic conditions.
State/MSA unemployment rate (December 2013). 5.1% (DC MSA)
Percentage change in unemployment rate since October 2011. -0.7% (DC MSA)
Total number of Stage 1 treatment subjects. 4,222
Total number of Stage 2 treatment subjects. 639 total: 393 T21 and 246 T22
WIC provider(s). vaACCSES (nonprofit)
WIC staffing (2014). 2 WICs (1.5 FTEs)
Average WIC caseload (January 2014). 222
Dispersed staffing structure (within providers). No
WIC staffing changes. None reported.
EWIC provider(s). ServiceSource (other nonprofit)
EWIC staffing (2014). 2 EWICs (2 FTEs)
Average EWIC caseload (January 2014). 98.5
Dispersed staffing structure (within providers). No
EWIC staffing changes. Turnover occurred in two positions, one full-time and one telephonic EWIC position; both were quickly filled, however.
Responsibility for post-entitlement work. Centralized (WIC); remain with site (EWIC)
Offset use (April 2014). 2.9% for T1, 5.7% for T21 and T22
79 Geographically dispersed is defined as 20 percent of the SSDI population living outside of the MSA.
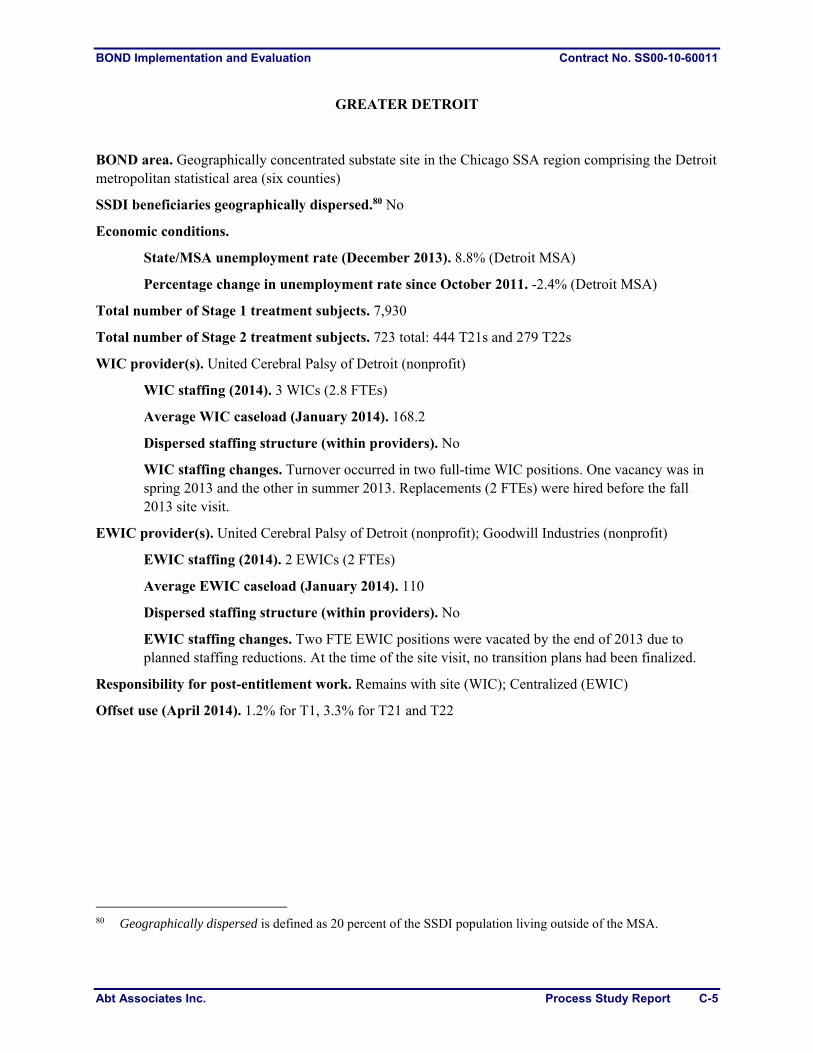
BOND Implementation and Evaluation Contract No. SS00-10-60011
Abt Associates Inc. Process Study Report C-5
GREATER DETROIT BOND area. Geographically concentrated substate site in the Chicago SSA region comprising the Detroit metropolitan statistical area (six counties)
SSDI beneficiaries geographically dispersed.80 No
Economic conditions.
State/MSA unemployment rate (December 2013). 8.8% (Detroit MSA)
Percentage change in unemployment rate since October 2011. -2.4% (Detroit MSA)
Total number of Stage 1 treatment subjects. 7,930
Total number of Stage 2 treatment subjects. 723 total: 444 T21s and 279 T22s
WIC provider(s). United Cerebral Palsy of Detroit (nonprofit)
WIC staffing (2014). 3 WICs (2.8 FTEs)
Average WIC caseload (January 2014). 168.2
Dispersed staffing structure (within providers). No
WIC staffing changes. Turnover occurred in two full-time WIC positions. One vacancy was in spring 2013 and the other in summer 2013. Replacements (2 FTEs) were hired before the fall 2013 site visit.
EWIC provider(s). United Cerebral Palsy of Detroit (nonprofit); Goodwill Industries (nonprofit)
EWIC staffing (2014). 2 EWICs (2 FTEs)
Average EWIC caseload (January 2014). 110
Dispersed staffing structure (within providers). No
EWIC staffing changes. Two FTE EWIC positions were vacated by the end of 2013 due to planned staffing reductions. At the time of the site visit, no transition plans had been finalized.
Responsibility for post-entitlement work. Remains with site (WIC); Centralized (EWIC)
Offset use (April 2014). 1.2% for T1, 3.3% for T21 and T22
80 Geographically dispersed is defined as 20 percent of the SSDI population living outside of the MSA.
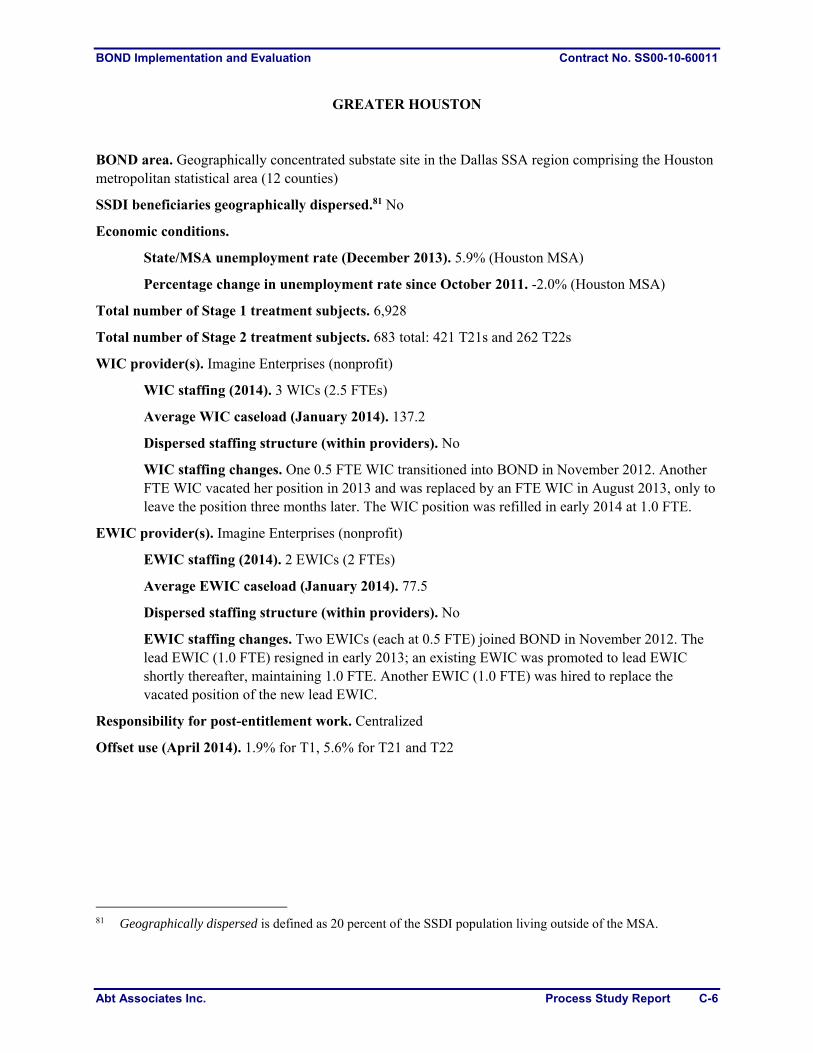
BOND Implementation and Evaluation Contract No. SS00-10-60011
Abt Associates Inc. Process Study Report C-6
GREATER HOUSTON BOND area. Geographically concentrated substate site in the Dallas SSA region comprising the Houston metropolitan statistical area (12 counties)
SSDI beneficiaries geographically dispersed.81 No
Economic conditions.
State/MSA unemployment rate (December 2013). 5.9% (Houston MSA)
Percentage change in unemployment rate since October 2011. -2.0% (Houston MSA)
Total number of Stage 1 treatment subjects. 6,928
Total number of Stage 2 treatment subjects. 683 total: 421 T21s and 262 T22s
WIC provider(s). Imagine Enterprises (nonprofit)
WIC staffing (2014). 3 WICs (2.5 FTEs)
Average WIC caseload (January 2014). 137.2
Dispersed staffing structure (within providers). No
WIC staffing changes. One 0.5 FTE WIC transitioned into BOND in November 2012. Another FTE WIC vacated her position in 2013 and was replaced by an FTE WIC in August 2013, only to leave the position three months later. The WIC position was refilled in early 2014 at 1.0 FTE.
EWIC provider(s). Imagine Enterprises (nonprofit)
EWIC staffing (2014). 2 EWICs (2 FTEs)
Average EWIC caseload (January 2014). 77.5
Dispersed staffing structure (within providers). No
EWIC staffing changes. Two EWICs (each at 0.5 FTE) joined BOND in November 2012. The lead EWIC (1.0 FTE) resigned in early 2013; an existing EWIC was promoted to lead EWIC shortly thereafter, maintaining 1.0 FTE. Another EWIC (1.0 FTE) was hired to replace the vacated position of the new lead EWIC.
Responsibility for post-entitlement work. Centralized
Offset use (April 2014). 1.9% for T1, 5.6% for T21 and T22
81 Geographically dispersed is defined as 20 percent of the SSDI population living outside of the MSA.
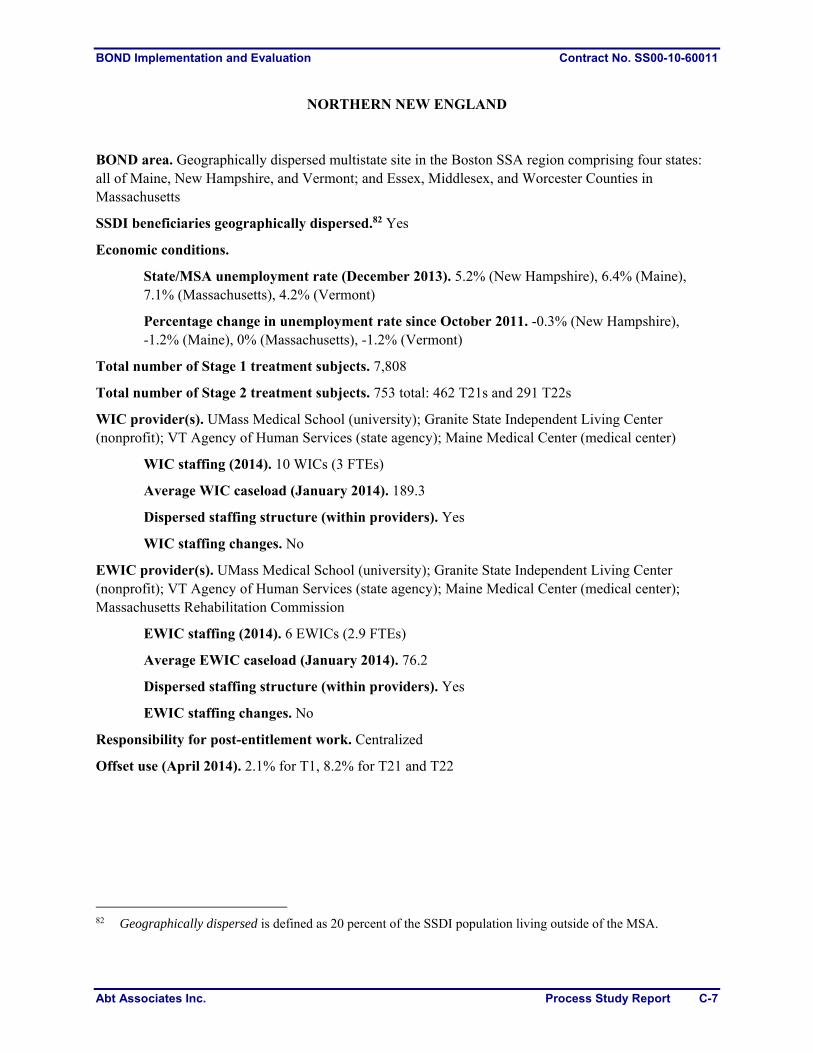
BOND Implementation and Evaluation Contract No. SS00-10-60011
Abt Associates Inc. Process Study Report C-7
NORTHERN NEW ENGLAND BOND area. Geographically dispersed multistate site in the Boston SSA region comprising four states: all of Maine, New Hampshire, and Vermont; and Essex, Middlesex, and Worcester Counties in Massachusetts
SSDI beneficiaries geographically dispersed.82 Yes
Economic conditions.
State/MSA unemployment rate (December 2013). 5.2% (New Hampshire), 6.4% (Maine), 7.1% (Massachusetts), 4.2% (Vermont)
Percentage change in unemployment rate since October 2011. -0.3% (New Hampshire), -1.2% (Maine), 0% (Massachusetts), -1.2% (Vermont)
Total number of Stage 1 treatment subjects. 7,808
Total number of Stage 2 treatment subjects. 753 total: 462 T21s and 291 T22s
WIC provider(s). UMass Medical School (university); Granite State Independent Living Center (nonprofit); VT Agency of Human Services (state agency); Maine Medical Center (medical center)
WIC staffing (2014). 10 WICs (3 FTEs)
Average WIC caseload (January 2014). 189.3
Dispersed staffing structure (within providers). Yes
WIC staffing changes. No
EWIC provider(s). UMass Medical School (university); Granite State Independent Living Center (nonprofit); VT Agency of Human Services (state agency); Maine Medical Center (medical center); Massachusetts Rehabilitation Commission
EWIC staffing (2014). 6 EWICs (2.9 FTEs)
Average EWIC caseload (January 2014). 76.2
Dispersed staffing structure (within providers). Yes
EWIC staffing changes. No
Responsibility for post-entitlement work. Centralized
Offset use (April 2014). 2.1% for T1, 8.2% for T21 and T22
82 Geographically dispersed is defined as 20 percent of the SSDI population living outside of the MSA.
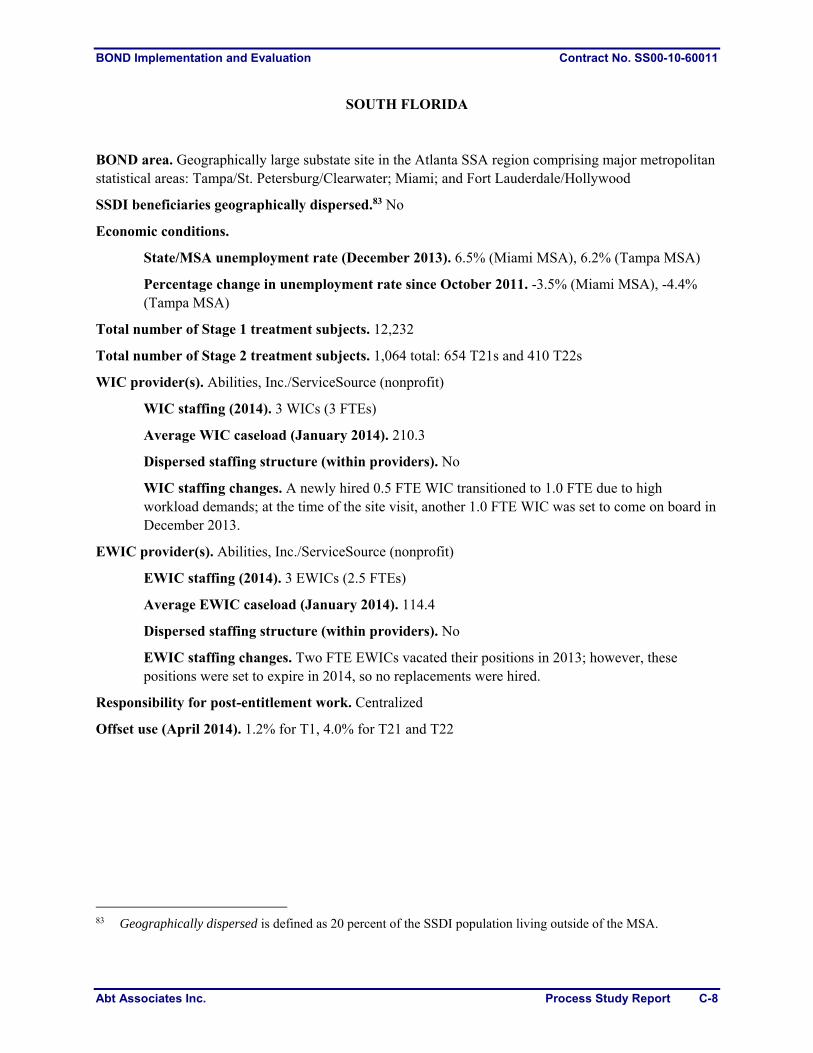
BOND Implementation and Evaluation Contract No. SS00-10-60011
Abt Associates Inc. Process Study Report C-8
SOUTH FLORIDA BOND area. Geographically large substate site in the Atlanta SSA region comprising major metropolitan statistical areas: Tampa/St. Petersburg/Clearwater; Miami; and Fort Lauderdale/Hollywood
SSDI beneficiaries geographically dispersed.83 No
Economic conditions.
State/MSA unemployment rate (December 2013). 6.5% (Miami MSA), 6.2% (Tampa MSA)
Percentage change in unemployment rate since October 2011. -3.5% (Miami MSA), -4.4% (Tampa MSA)
Total number of Stage 1 treatment subjects. 12,232
Total number of Stage 2 treatment subjects. 1,064 total: 654 T21s and 410 T22s
WIC provider(s). Abilities, Inc./ServiceSource (nonprofit)
WIC staffing (2014). 3 WICs (3 FTEs)
Average WIC caseload (January 2014). 210.3
Dispersed staffing structure (within providers). No
WIC staffing changes. A newly hired 0.5 FTE WIC transitioned to 1.0 FTE due to high workload demands; at the time of the site visit, another 1.0 FTE WIC was set to come on board in December 2013.
EWIC provider(s). Abilities, Inc./ServiceSource (nonprofit)
EWIC staffing (2014). 3 EWICs (2.5 FTEs)
Average EWIC caseload (January 2014). 114.4
Dispersed staffing structure (within providers). No
EWIC staffing changes. Two FTE EWICs vacated their positions in 2013; however, these positions were set to expire in 2014, so no replacements were hired.
Responsibility for post-entitlement work. Centralized
Offset use (April 2014). 1.2% for T1, 4.0% for T21 and T22
83 Geographically dispersed is defined as 20 percent of the SSDI population living outside of the MSA.
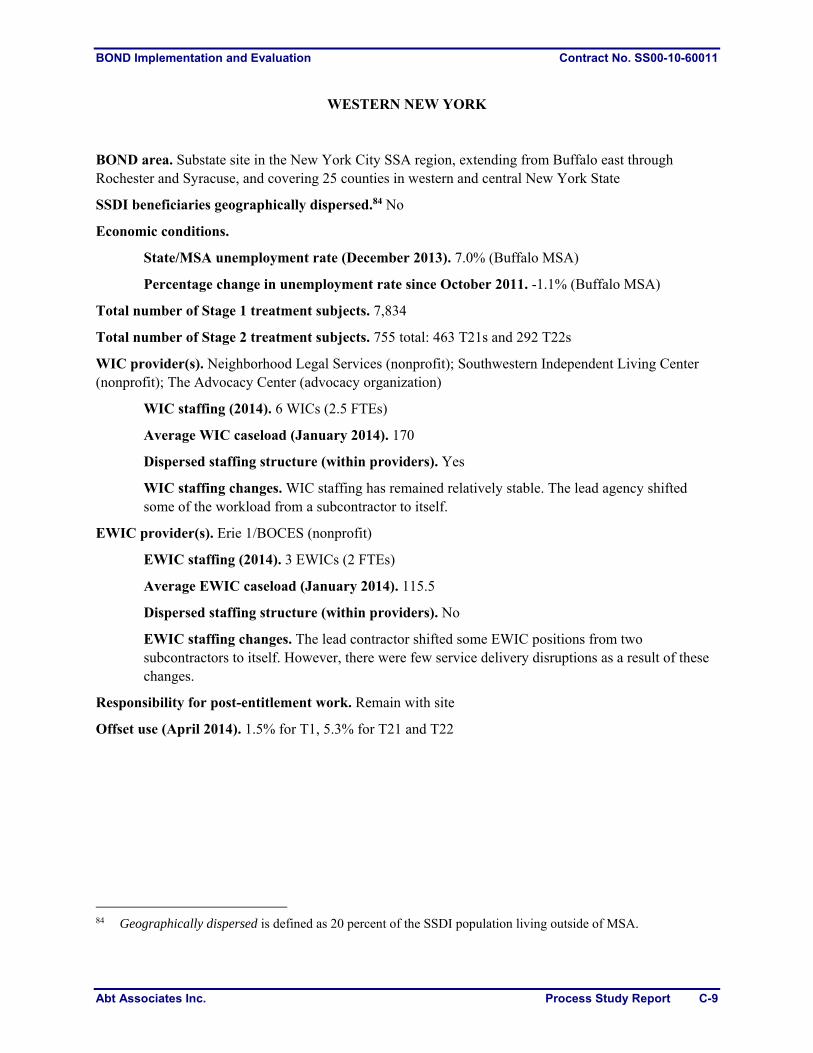
BOND Implementation and Evaluation Contract No. SS00-10-60011
Abt Associates Inc. Process Study Report C-9
WESTERN NEW YORK BOND area. Substate site in the New York City SSA region, extending from Buffalo east through Rochester and Syracuse, and covering 25 counties in western and central New York State
SSDI beneficiaries geographically dispersed.84 No
Economic conditions.
State/MSA unemployment rate (December 2013). 7.0% (Buffalo MSA)
Percentage change in unemployment rate since October 2011. -1.1% (Buffalo MSA)
Total number of Stage 1 treatment subjects. 7,834
Total number of Stage 2 treatment subjects. 755 total: 463 T21s and 292 T22s
WIC provider(s). Neighborhood Legal Services (nonprofit); Southwestern Independent Living Center (nonprofit); The Advocacy Center (advocacy organization)
WIC staffing (2014). 6 WICs (2.5 FTEs)
Average WIC caseload (January 2014). 170
Dispersed staffing structure (within providers). Yes
WIC staffing changes. WIC staffing has remained relatively stable. The lead agency shifted some of the workload from a subcontractor to itself.
EWIC provider(s). Erie 1/BOCES (nonprofit)
EWIC staffing (2014). 3 EWICs (2 FTEs)
Average EWIC caseload (January 2014). 115.5
Dispersed staffing structure (within providers). No
EWIC staffing changes. The lead contractor shifted some EWIC positions from two subcontractors to itself. However, there were few service delivery disruptions as a result of these changes.
Responsibility for post-entitlement work. Remain with site
Offset use (April 2014). 1.5% for T1, 5.3% for T21 and T22
84 Geographically dispersed is defined as 20 percent of the SSDI population living outside of MSA.
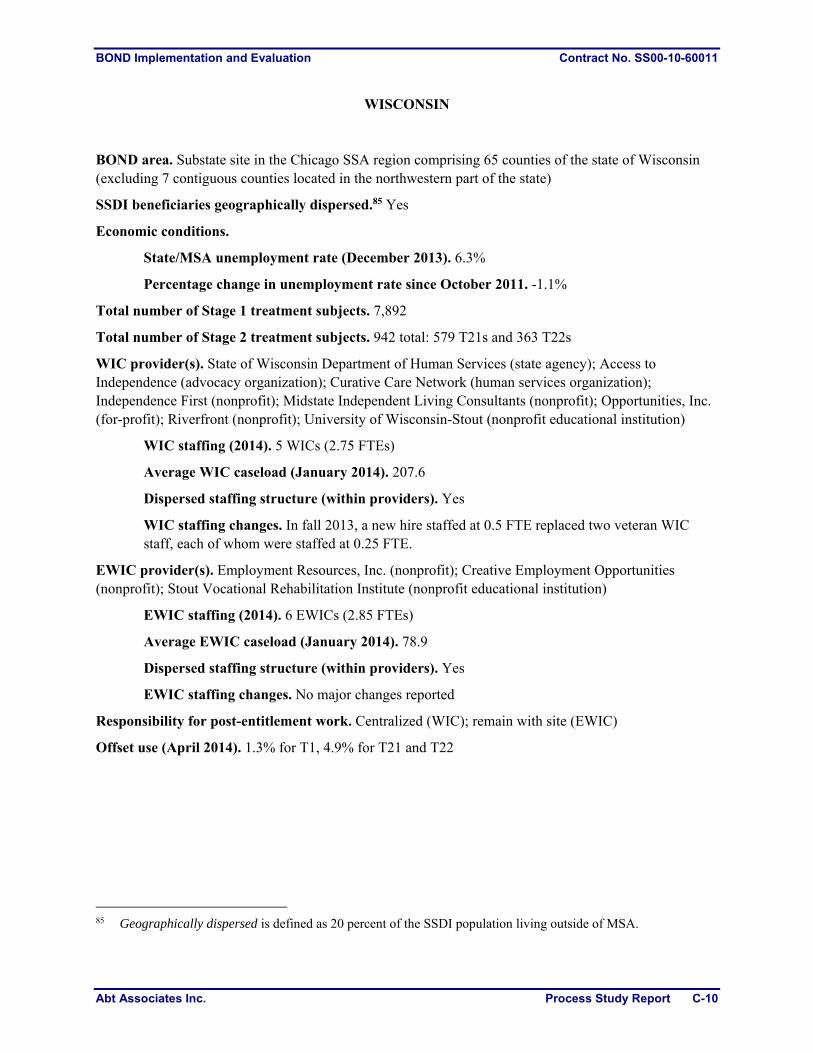
BOND Implementation and Evaluation Contract No. SS00-10-60011
Abt Associates Inc. Process Study Report C-10
WISCONSIN BOND area. Substate site in the Chicago SSA region comprising 65 counties of the state of Wisconsin (excluding 7 contiguous counties located in the northwestern part of the state)
SSDI beneficiaries geographically dispersed.85 Yes
Economic conditions.
State/MSA unemployment rate (December 2013). 6.3%
Percentage change in unemployment rate since October 2011. -1.1%
Total number of Stage 1 treatment subjects. 7,892
Total number of Stage 2 treatment subjects. 942 total: 579 T21s and 363 T22s
WIC provider(s). State of Wisconsin Department of Human Services (state agency); Access to Independence (advocacy organization); Curative Care Network (human services organization); Independence First (nonprofit); Midstate Independent Living Consultants (nonprofit); Opportunities, Inc. (for-profit); Riverfront (nonprofit); University of Wisconsin-Stout (nonprofit educational institution)
WIC staffing (2014). 5 WICs (2.75 FTEs)
Average WIC caseload (January 2014). 207.6
Dispersed staffing structure (within providers). Yes
WIC staffing changes. In fall 2013, a new hire staffed at 0.5 FTE replaced two veteran WIC staff, each of whom were staffed at 0.25 FTE.
EWIC provider(s). Employment Resources, Inc. (nonprofit); Creative Employment Opportunities (nonprofit); Stout Vocational Rehabilitation Institute (nonprofit educational institution)
EWIC staffing (2014). 6 EWICs (2.85 FTEs)
Average EWIC caseload (January 2014). 78.9
Dispersed staffing structure (within providers). Yes
EWIC staffing changes. No major changes reported
Responsibility for post-entitlement work. Centralized (WIC); remain with site (EWIC)
Offset use (April 2014). 1.3% for T1, 4.9% for T21 and T22
85 Geographically dispersed is defined as 20 percent of the SSDI population living outside of MSA.
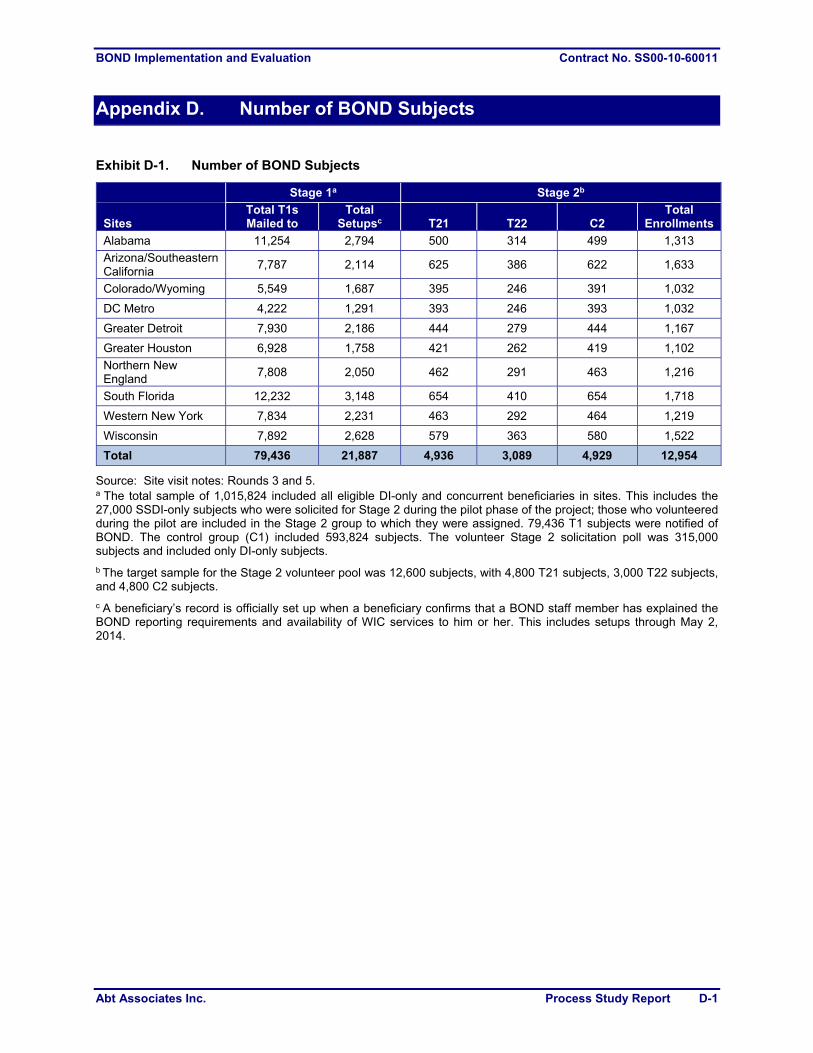
BOND Implementation and Evaluation Contract No. SS00-10-60011
Abt Associates Inc. Process Study Report D-1
Appendix D. Number of BOND Subjects
Exhibit D-1. Number of BOND Subjects
Stage 1a Stage 2b
Sites Total T1s Mailed to
Total Setupsc T21 T22 C2
Total Enrollments
Alabama 11,254 2,794 500 314 499 1,313
Arizona/Southeastern California
7,787 2,114 625 386 622 1,633
Colorado/Wyoming 5,549 1,687 395 246 391 1,032
DC Metro 4,222 1,291 393 246 393 1,032
Greater Detroit 7,930 2,186 444 279 444 1,167
Greater Houston 6,928 1,758 421 262 419 1,102
Northern New England
7,808 2,050 462 291 463 1,216
South Florida 12,232 3,148 654 410 654 1,718
Western New York 7,834 2,231 463 292 464 1,219
Wisconsin 7,892 2,628 579 363 580 1,522
Total 79,436 21,887 4,936 3,089 4,929 12,954
Source: Site visit notes: Rounds 3 and 5. a The total sample of 1,015,824 included all eligible DI-only and concurrent beneficiaries in sites. This includes the 27,000 SSDI-only subjects who were solicited for Stage 2 during the pilot phase of the project; those who volunteered during the pilot are included in the Stage 2 group to which they were assigned. 79,436 T1 subjects were notified of BOND. The control group (C1) included 593,824 subjects. The volunteer Stage 2 solicitation poll was 315,000 subjects and included only DI-only subjects.
b The target sample for the Stage 2 volunteer pool was 12,600 subjects, with 4,800 T21 subjects, 3,000 T22 subjects, and 4,800 C2 subjects.
c A beneficiary’s record is officially set up when a beneficiary confirms that a BOND staff member has explained the BOND reporting requirements and availability of WIC services to him or her. This includes setups through May 2, 2014.
BOND Implementation and Evaluation Contract No. SS00-10-60011
Abt Associates Inc. Process Study Report E-1
Appendix E. SSDI and BOND Primer
SSDI Under Current Law
The Social Security Disability Insurance (SSDI) program is the disability insurance component of Old Age Survivors and Disability Insurance (OASDI), the social insurance program commonly known as Social Security. SSDI provides benefits to disabled workers and their dependents. OASDI also provides benefits to the disabled adult children (DAC) and disabled widows(ers) (DWBs) of all OASDI worker beneficiaries.86 Workers are entitled to disability benefits only if they are disability insured (i.e., have worked recently in covered jobs for a sufficient length of time; the exact length of time varies with age at application) and have a medically determinable condition that prevents them from engaging in substantial gainful activity (SGA) and is expected to last for at least one year or result in death. SGA was defined (in 2013) as an activity comparable to unsubsidized paid work for monthly wages, after allowable deductions, of at least $1,040 for non-blind individuals or $1,740 for blind individuals. The SGA level is adjusted annually by the percentage change in the Average Wage Index (AWI) compiled by the Social Security Administration (SSA). DAC benefits and DWB meet the same medical eligibility criteria, but nonmedical eligibility is based on the work history and benefit status of a parent or deceased spouse. Although SSA uses inability to engage in SGA to define disability for program eligibility purposes, the current program does not immediately terminate benefits if a beneficiary begins engaging in SGA after program entry. Instead, SSDI has several work incentives designed to provide the beneficiary time to achieve and sustain SGA before benefits are terminated. SSDI work incentives define three periods of benefit receipt that occur consecutively as employment unfolds:
1. The Trial Work Period (TWP) tests an SSDI beneficiary’s ability to work without affecting benefits. In 2013, a TWP month was any month in which an SSDI beneficiary had monthly earnings of at least $750 or worked at least 80 self-employed hours. The TWP earnings threshold is indexed to growth in average wages. The TWP consists of 9 such months in a rolling 60-month window.
2. The Extended Period of Eligibility (EPE) begins immediately after completion of the TWP and lasts until benefits are terminated (as described in the next numbered entry). During the first 36 months of the EPE, if the beneficiary engages in SGA, benefits are suspended—i.e., not paid—for that month, except that the beneficiary has 3 grace period (GP) months, not necessarily consecutive, in which full benefits are paid even if the beneficiary engages in SGA. SSA completes a work Continuing Disability Review (CDR) to determine the first GP month, which is classified as the month of cessation. If the beneficiary ceases to engage in SGA within the EPE, benefits are resumed, provided that the beneficiary has not experienced medical recovery (i.e., continues to meet SSA’s medical eligibility criteria).
86 OASDI worker beneficiaries include disabled, retired, and deceased workers. Benefits for the DAC and DWB
of retired and deceased workers fall under the Old Age and Survivors Insurance (OASI) component of OASDI, not SSDI, but the SSDI earnings rules apply to their benefits under current law and they are included in the BOND samples. Following common practice, references to SSDI beneficiaries in this and other BOND documents include all DAC and DWB receiving OASI benefits, unless otherwise indicated.
BOND Implementation and Evaluation Contract No. SS00-10-60011
Abt Associates Inc. Process Study Report E-2
3. Finally, benefits are terminated with the first month of SGA-level work after the EPE ends or as soon thereafter as the GP is completed. After termination, benefits do not resume simply because SGA ends. The beneficiary may apply for expedited reinstatement of benefits and might be eligible for provisional benefits while SSA reviews his or her application. But, unlike suspension during the EPE, the beneficiary must go through a reapplication and requalification process for benefits to resume.
The BOND Innovations
The primary innovation tested in BOND is a change in the way that countable earnings at or above SGA affect benefits after the TWP and GP are completed. BOND replaces the cash cliff—suspension of all cash benefits when countable earnings reach the SGA threshold—with the benefit offset—a $1 reduction in benefits for every $2 in additional earnings over the SGA amount. Also, whereas under current law the benefit in any month is based on earnings in that month, under the BOND benefit offset SSA uses an annual accounting period for determining the benefit amount under the offset. Benefits continue to be paid monthly, however, so in effect, each month’s benefits are based on average monthly earnings over the entire year. The period during which the beneficiary can use the offset is the 60-month BOND participation period, starting with the first month after the TWP is completed and continuing for 59 consecutive months. Because the offset does not apply until after the 3 GP months (the first of which is the cessation month), the maximum number of months during which the offset can be applied is 57 months, unless the beneficiary completed the TWP and some GP months before random assignment, in which case the number of months in which the offset can apply is 57 plus the number of previously completed GP months. Subjects who complete the TWP after random assignment and by September 2017 will be able to use the offset for the full 57 months, even if those months extend beyond the end of the demonstration period. The BOND participation period is an extension of the 36 months in which current-law beneficiaries may engage in SGA without cash benefit termination. For more details on current-law rules and BOND innovations, refer to Chapter 2 of Stapleton et al. (2010).