Bond bond funds bond etfs May11 Webinar updated …€¦ · Agg – Barclays Capital Global...
38
1 1 Bonds, Bond Funds, and Bond ETFs FIXED INCOME WEBINAR Beau Coash Fixed Income Portfolio Manager Lee Sterne ETF Strategist Roger Young SVP, Fidelity Capital Markets Host: Richard Carter VP, Fixed Income Products May 11, 2016 724077.4.1
Transcript of Bond bond funds bond etfs May11 Webinar updated …€¦ · Agg – Barclays Capital Global...

11
Bonds, Bond Funds, and Bond ETFs
FIXED INCOME WEBINAR
Beau Coash Fixed Income Portfolio Manager
Lee Sterne ETF Strategist
Roger Young SVP, Fidelity Capital Markets
Host:
Richard Carter VP, Fixed Income Products
May 11, 2016
724077.4.1

2
Agenda• Bond Market Context• Individual Bonds• Bond Mutual Funds• Bond ETFs• Summary & Next Steps
3
Bond Market ContextBeau Coash

4
Markets are Pricing in a Slower Pace of Hikes Than The Fed Articulated
Sources: Federal Reserve, Bloomberg and FMR Research as of 3/31/2016.
0.00
0.50
1.00
1.50
2.00
2.50
3.00
3.50Mar‐12
Jul‐1
2
Nov
‐12
Mar‐13
Jul‐1
3
Nov
‐13
Mar‐14
Jul‐1
4
Nov
‐14
Mar‐15
Jul‐1
5
Nov
‐15
Mar‐16
Jul‐1
6
Nov
‐16
Mar‐17
Jul‐1
7
Nov
‐17
Mar‐18
Jul‐1
8
Nov
‐18
Mar‐19
%
Fed Funds Target Rate
Fed Fund Futures 3/31/14
Fed Fund Futures 3/31/15
Fed Fund Futures 3/31/16
3/16/2016 FOMC Dot Median
3/18/2015 FOMC Dot Median
3/18/2014 FOMC Dot Median

5
1. Global Agg. Yield 1.55% 1.34%
2. Aging demographics
3. Regulatory policy / banks need for AAA
Developed Countries
May 201510 Year Yield (%)*
April 201610 Year Yield (%)**
Difference
1 Switzerland 0.019 ‐0.412 ‐0.4312 Japan 0.352 ‐0.100 ‐0.4523 Germany 0.451 0.097 ‐0.3544 Denmark 0.507 0.299 ‐0.2085 Austria 0.556 0.303 ‐0.2536 Netherlands 0.590 0.315 ‐0.2757 Finland 0.483 0.370 ‐0.1138 France 0.721 0.440 ‐0.2819 Sweden 0.531 0.465 ‐0.06610 Belgium 0.709 0.480 ‐0.22911 Ireland 0.987 0.773 ‐0.21412 Hong Kong 1.516 1.163 ‐0.35313 Norway 1.545 1.170 ‐0.37514 Canada 1.698 1.206 ‐0.49215 Italy 1.527 1.327 ‐0.20016 United Kingdom 1.841 1.351 ‐0.49017 Spain 1.494 1.533 0.03918 Israel 1.510 1.709 0.19919 United States 2.131 1.717 ‐0.414
Source: *Bloomberg as of May 4, 2015 at 1:41pm. **Bloomberg as of April 8, 2016 10:00 AM. Global Agg Yield as of May 4, 2015 and April 7, 2016; Source, Barclays Live
U.S. rates are not low relative to other high-quality liquid markets
Other Developed Markets have Lower Yields than USA Shared Set of Demand Drivers
10YRYields less than 1%
5

6
Bond Returns vs. Interest Rates(1940 – 2015)
Source: Barclays and Bloomberg as of 12/31/2015.Note: From 1940–1975, bond returns are based on Fidelity Investments “Synthetic Aggregate”=67% Intermediate Government Bonds, 33% Long-term Corporate Bonds. From 1975–2015, bond returns are based on Barclays U.S. Aggregate Bond Index.Past performance is no guarantee of future results. It is not possible to invest directly in an index. Index performance is not meant to represent that of any Fidelity mutual fund.See the Glossary at the end of this presentation for more information on any terms.
Average Annual Return: 5.6% Average Annual 10YR Yield: 5.3%
Represents recessionary period
-0.2% -0.6%-0.3%-2.6%
-1.6% -0.6% -1.0%-3.2% -2.9%
-0.8% -2.0%-5%
0%
5%
10%
15%
20%
25%
30%
35%
1940
1943
1946
1949
1952
1955
1958
1961
1964
1967
1970
1973
1976
1979
1982
1985
1988
1991
1994
1997
2000
2003
2006
2009
2012
2015
Annual Return 10-yr Treasury Yield

7
When Stocks Fall, Bonds Tend to Stabilize Portfolio ReturnsBond Returns in Years when Stocks Were Down, 1926–2015
-50
-40
-30
-20
-10
0
10
20S&P 500 Investment-Grade Bonds
Percent
Source: Morningstar EnCorr, Fidelity Investments (AART).Past performance is no guarantee of future results. Diversification does not ensure a profit or guarantee against loss. Bond returns represented by the performance of the Barclays Aggregate Bond Index from January 1976 and by a composite of the IA SBBI U.S. Intermediate-Term Government Bond Index (67%) and the IA SBBI U.S. Long-Term Corporate Bond Index (33%) from January 1926 through December 1975. Stock returns represented by the performance of the S&P 500 Index.See the Glossary at the end of this presentation for more information on any terms.
CALENDAR YEAR TOTAL RETURN (%)
8
Bonds S&P 500
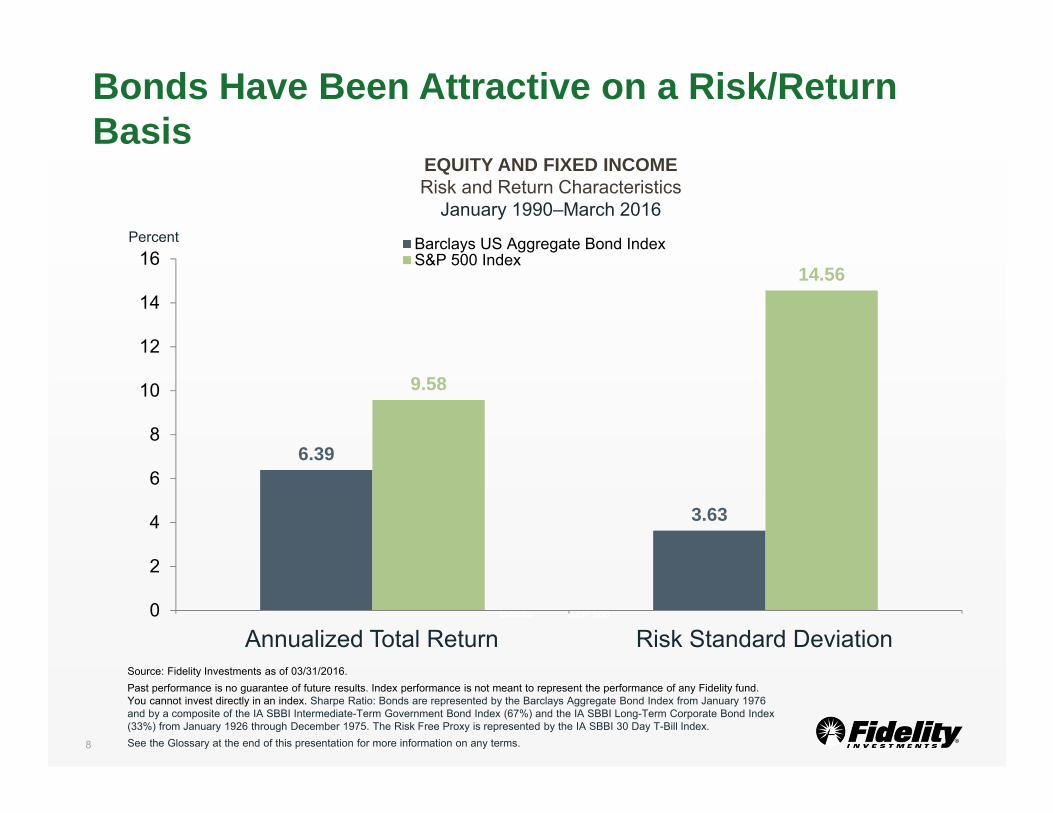
Source: Fidelity Investments as of 03/31/2016. Past performance is no guarantee of future results. Index performance is not meant to represent the performance of any Fidelity fund. You cannot invest directly in an index. Sharpe Ratio: Bonds are represented by the Barclays Aggregate Bond Index from January 1976 and by a composite of the IA SBBI Intermediate-Term Government Bond Index (67%) and the IA SBBI Long-Term Corporate Bond Index (33%) from January 1926 through December 1975. The Risk Free Proxy is represented by the IA SBBI 30 Day T-Bill Index. See the Glossary at the end of this presentation for more information on any terms.
Bonds Have Been Attractive on a Risk/Return Basis
6.39
3.63
9.58
14.56
0
2
4
6
8
10
12
14
16Barclays US Aggregate Bond IndexS&P 500 Index
Percent
EQUITY AND FIXED INCOMERisk and Return Characteristics
January 1990–March 2016
Annualized Total Return Risk Standard Deviation

9
Individual BondsRoger Young

1010
Bond Ownership Varies Across Bond Types
Source: SIFMA; Federal Reserve
12/2006 3/2016
US Treasuries $4.3T $15T
Municipals $3.1T $3.7T
Corporates $4.8T $8.2T
Growth in Recent Years
$1.21
$1.28
$0.54$0.30
$2.46
$6.18
$0.68
$2.21
$0.21
US Treasuries Ownership ($15T)
IndividualsMutual FundsBanksInsurersMonetary AuthForeign/IntlState & LocalPensionsOther
$1.51
$1.08
$0.52
$0.48
$0.13
US Muni Bond Ownership ($3.7T)
Individuals
MutualFundsBanks
Insurers
Other
11
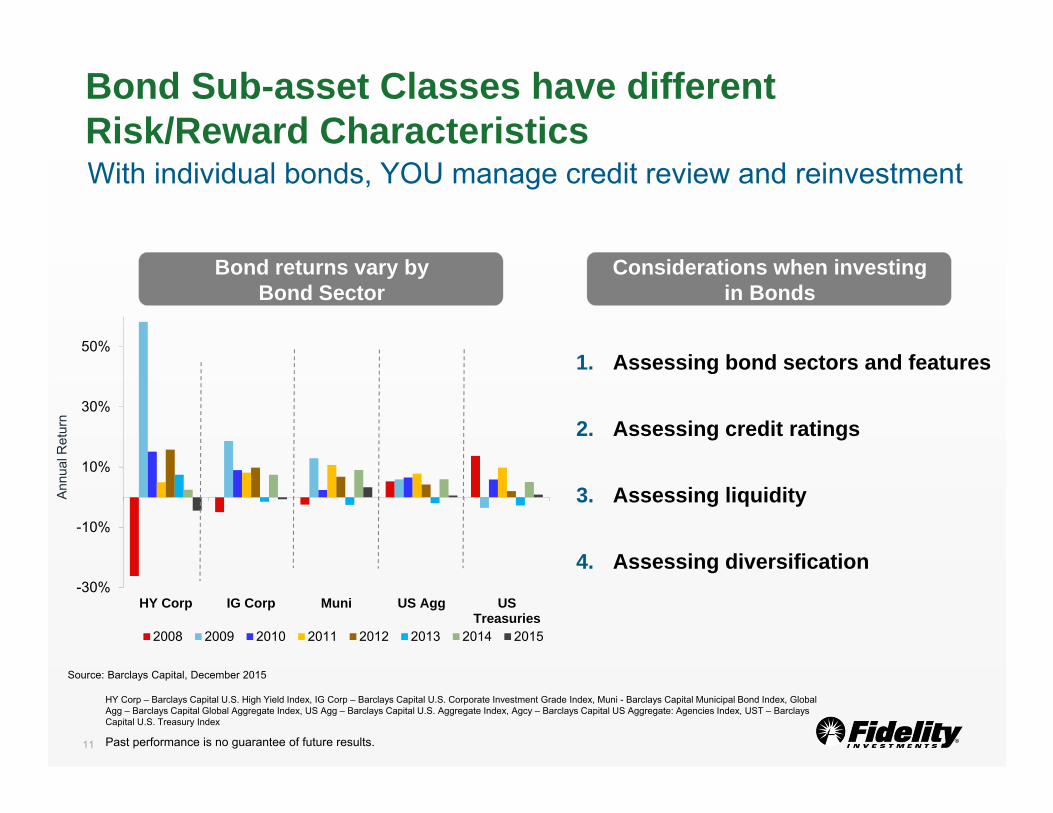
Bond Sub-asset Classes have different Risk/Reward Characteristics
Source: Barclays Capital, December 2015
HY Corp – Barclays Capital U.S. High Yield Index, IG Corp – Barclays Capital U.S. Corporate Investment Grade Index, Muni - Barclays Capital Municipal Bond Index, Global Agg – Barclays Capital Global Aggregate Index, US Agg – Barclays Capital U.S. Aggregate Index, Agcy – Barclays Capital US Aggregate: Agencies Index, UST – Barclays Capital U.S. Treasury Index
Past performance is no guarantee of future results.
With individual bonds, YOU manage credit review and reinvestment
Considerations when investing in Bonds
-30%
-10%
10%
30%
50%
HY Corp IG Corp Muni US Agg USTreasuries
2008 2009 2010 2011 2012 2013 2014 2015
1. Assessing bond sectors and features
2. Assessing credit ratings
3. Assessing liquidity
4. Assessing diversification
Bond returns vary by Bond Sector
Annu
al R
etur
n

1212
Using the Bond Yield Table on Fidelity.com
1
2
3
Where can I learn more?
Research > Fixed Income Bonds & CDs
For illustrative purposes only

1313
Using the Bond Details Pages
Source: Fidelity.com, April 2016
For illustrative purposes only
Researching the bond’s features and attributes

14
Issuer-Specific Credit Reports
Source: Fidelity.com, April, 2016 For illustrative purposes only
Understand why a bond has its rating and potential risks

1515
Using Pricing Information to “See the Market”
3
Source: Fidelity.com, April 2016
For illustrative purposes only
Aggregated, live “Depth of Book” and historical trading prices
1
2

1616
Understanding the Impact of Transaction Costs
3
Source: Fidelity.com, April 2016 For illustrative purposes only
Compare Fidelity’s $1 per bond with mark-up competitors
1
Where can I learn more?
www.Fidelity.com/go/bond

17
Bond Market News and Reports
Source: Fidelity.com, April 2016
1
News, commentary, and research reports are from third-party sources unaffiliated with Fidelity. Fidelity does not endorse or adopt their content. Fidelity makes no guarantees that the information supplied is accurate, complete, or timely, and does not provide any warranties regarding results obtained from its use
1
2
For illustrative purposes only
News and analysis from Fidelity and 3rd-parties

1818
Key Advantages of Individual BondsUsing Fidelity’s Proprietary Tools to Plan & Monitor
1. Bonds mature – plan for future expenses, real estate tax payment, college education, reinvestment
2. Cash flow planning - bond valuations may fluctuate but cash flow is consistent, barring an issuer default
3. Research before you invest - bond structure and pricing
4. Strive to lower costs – use Depth of Book. Compare Fidelity to firms with significant markups. New issue products no charge at Fidelity1
5. Monitor your holdings - Fixed Income Analysis; Alerts on maturities, ratings changes
Fixed Income Analysis –with interest rate sensitivity
1) Fidelity makes certain new issue products available without a separate transaction fee. Fidelity Brokerage Services LLC and National Financial Services LLC receive compensation for participating in the offering as a selling group member or underwriter.
For illustrative purposes only
Where can I learn more?
Research > Fixed Income Bonds & CDs > Bond Tools tab

19
How do ETFs compare to mutual funds?Lee Sterne

2020
1.2 1.21.4
1.51.4
2.0
2.3
2.5
3.12.9
3.1 3.1 3.1
‐100
‐50
0
50
100
150
200
250
300
350
400
0.0
0.5
1.0
1.5
2.0
2.5
3.0
3.5
2004 2005 2006 2007 2008 2009 2010 2011 2012 2013 2014 2015 Ytd‐2/16
Flows ($B)
Assets ($
T)
Fixed Income Mutual Fund GrowthAssetsFlows
Source: Simfund as of 2/29/16
Bond Fund Market Landscape Ending Assets$3.1 T

2121
Bond ETF Market Landscape
4 5 8 15 2135
57
106
138
187
250 245
302
354
‐10
0
10
20
30
40
50
60
70
0
50
100
150
200
250
300
350
400
2002 2003 2004 2005 2006 2007 2008 2009 2010 2011 2012 2013 2014 2015
Asset G
rowth $B
Total A
ssets $B
Fixed Income ETF Asset Growth
Assets YOY Asset Growth
Source: Morningstar Direct 3/30/16
Ending Assets$354B

2222
Where can I learn more on Fidelity.com?
Research > Learning Center > ETFs and Mutual Funds: What to consider
What is an Exchange-Traded Fund (ETF)?• An ETF is an evolution of the mutual fund which:
– Offers exposure to a certain segment(s) of the market – Can be either passively, enhanced or actively managed – Investors access through brokerage account– Investors buy or sell shares on Exchange at the market price– Market Price may differ from NAV– Shares are not individually redeemable with the ETF– Potentially more tax efficient
What is a Mutual Fund?• Investment Strategy Registered under the 1940 Act:
– Professionally Managed portfolio of securities– Can be either passively, enhanced or actively managed– Investors access directly from mutual fund provider

23
Things to know about TRADING ATTRIBUTES
ETFs Mutual Funds
• Intra-day trading on exchange at market price which may be higher or lower than NAV
• Allows Limit, Stop and Conditional Orders
• Allows Shorting and Margin
• Most transact once a day at closing NAV
• No Limit, Stop or Conditional Orders
• No Shorting (Margin 30 days)
Where can I learn more on Fidelity.com?
Research > Learning Center > Understanding how mutual funds, ETFs, and stocks trade
Images are for illustrative purposes only.

24
Things to know about COSTS
ETFs Mutual Funds
• Expense ratios
• Commissions (certain ETFs may be traded commission free)
• Bid-Ask spreads
• Premium/Discounts
• Tracking error
• Expense ratios
• Transaction Fee (Load and no-load)
• May have redemption fees
Where can I learn more on Fidelity.com?
Research > ETFs > ETF / ETP Screener
Images are for illustrative purposes only.

25
Things to know about ACCESS, TRANSPARENCY & TAXES
ETFs Mutual Funds
• Asset class specific, maturity focused and broad market
• Generally, daily transparency of all holdings
• Capital gains tend to be lower due to creation & redemption feature
• Asset class specific, maturity focused and broad market
• Holdings data usually at least 1 month old
• Less tax efficient structure, all shareholders bear tax burden
Where can I learn more on Fidelity.com?
Research > Learning Center > What’s in your ETF ? Understanding ETF portfolio composition
Images are for illustrative purposes only.

2626
Images are for illustrative purposes only.
Mutual Fund Research Use the information available to learn more about an individual Mutual Fund or to compare to others.Commonly used pages include:
Summary – one-page summary with details on Category, expense ratios, ratings and objectives
Portfolio Composition – view the Top 10 Holdings
Compare – perform a side-by-side comparison of up to 5 different securities
2727
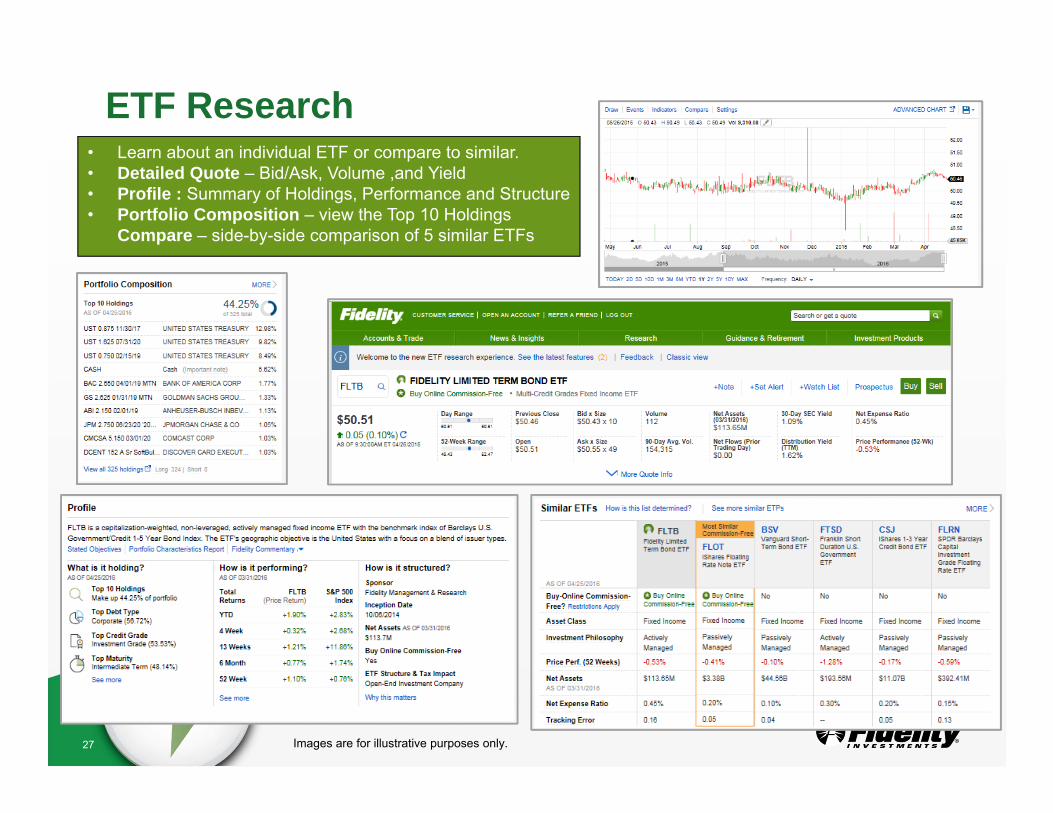
ETF Research
Images are for illustrative purposes only.
• Learn about an individual ETF or compare to similar.• Detailed Quote – Bid/Ask, Volume ,and Yield• Profile : Summary of Holdings, Performance and Structure• Portfolio Composition – view the Top 10 Holdings
Compare – side-by-side comparison of 5 similar ETFs

28
Mutual Fund Screener: Easy Search ToolBuild your own screen by identifying criteria that is important to you
Look for the Fidelity Fund Picks or No Transaction Fee Icons
There when you need it - embedded educationin the screener to help along the way.
Where can I learn more?Research > Learning Center > What are Bond Funds?

29
ETF/ETP Screener: 2 Ways to Get Started
Images are for illustrative purposes only.
Just a click away from results! Where can I learn more?Research > Learning Center > Finding an ETF that’s right for you with Fidelity’s ETF/ETP Screener
There when you need it - embedded education in the screener to help along the way.
Build your own screen by identifying criteria that is important to you
Or select a theme that best describes the type of ETF you are looking for.

30
ETF/ETP Screener: Results
Print, Download or Save your results
Read more about the theme to understand what is included as well as excluded.
Commission-free icon
Images are for illustrative purposes only.

31
Free commission offer applies to online purchases of Fidelity ETFs and select iShares ETFs in a Fidelity brokerage account. Fidelity accounts may require minimum balances. The sale of ETFs is subject to an activity assessment fee (of between $0.01 to $0.03 per $1,000 of principal). iShares ETFs and Fidelity ETFs are subject to a short-term trading fee by Fidelity if held less than 30 days. For iShares ETFs, Fidelity receives compensation from the ETF sponsor and/or its affiliates in connection with an exclusive, long-term marketing program that includes promotion of iShares ETFs and inclusion of iShares funds in certain FBS platforms and investment programs. Additional information about the sources, amounts, and terms of compensation is described in the ETF’s prospectus and related documents. Fidelity may add or waive commissions on ETFs without prior notice. BlackRock and iShares are registered trademarks of BlackRock, Inc. and its affiliates. $7.95 commission applies to online U.S. equity trades in a Fidelity account with a minimum opening balance of $2,500 for Fidelity Brokerage Services LLC retail clients. Sell orders are subject to an activity assessment fee of between ($0.01 to $0.03 per $1,000 of principal). Other conditions may apply. See Fidelity.com/commissions for details.ETFs are subject to market fluctuation and the risks of their underlying investments. ETFs are subject to management fees and other expenses. Unlike mutual funds, ETF shares are bought and sold at market price, which may be higher or lower than their NAV, and are not individually redeemed from the fund. Stock markets are volatile and can fluctuate significantly in response to company, industry, political, regulatory, market, or economic developments. Investing in stock involves risks, including the loss of principal.
Bond Mutual Funds and ETFs on Fidelity.com
26 iShares ETFS
Bond Mutual Funds Bond ETFs
Over 230Subject to Commission
Fees
Nearly30
Over 2,300Subject to Transaction
Fees
Over950
COMMISSION FREENO TRANSACTION FEE
280 Fidelity Funds FBND FLTB FCOR

32
Summary and Next Steps

3333
Images are for illustrative purposes only.
Why Buy Bonds at Fidelity?

34
FUND AWARDS 2015 Fund
3 Year Fidelity Intermediate Government IncomeSpartan Long-Term Treasury Bond IndexSpartan Short-Term Treasury Bond Index
5 Year Fidelity Intermediate Government IncomeSpartan Short-Term Treasury Bond Index
10 Year Fidelity Intermediate Government Income
Awards & Recognition: Fixed Income
† As of 3/31/16.*You could lose money by investing in a money market fund. Because the share price of the fund will fluctuate when you sell your shares they may be worth more or less than what you originally paid for them. The Fund may impose a fee upon the sale of your shares or may temporarily suspend your ability to sell shares if the Fund’s liquidity falls below required minimums because of market conditions or other factors. An investment in the fund is not insured or guaranteed by the Federal Deposit Insurance Corporation or any other government agency. Fidelity Investments and its affiliates, the fund’s sponsor, have no legal obligation to provide financial support to the fund, and you should not expect that the sponsor will provide financial support to the fund at any time. The municipal market can be affected by adverse tax, legislative or political changes and the financial condition of the issuers of municipal securities. A portion of the dividends you receive may be subject to federal and state income taxes. Capital gains realized by the fund generally will be subject to taxation at each level. The fund may invest in municipal securities whose interest is subject to the federal alternative minimum tax.
FIXED-INCOME MANAGER OF THE YEAR AWARDS
Franco Castagliuolo and Bill IrvingNominee: 2011 and 2014Fidelity Municipal Bond Team Winner: 2003 │Nominee: 2002, 2008, and 2011
FIXED-INCOME MANAGER OF THE DECADE AWARDS
Fidelity Municipal Bond Team 2009 Nominee
25 FAVORITE NO-LOAD MUTUAL FUNDSAs of April 2016
5 ETFS FOR 2015
BEST FIDELITY FUNDS FOR INCOME INVESTORSJuly 2015
Fidelity Intermediate Muni Income
2014 RATED MONEYFUND REPORT AWARDS
34
ANALYST RATINGS:† 15 GOLD / 7 SILVER / 3 BRONZE
California Municipal Income • GNMA • Government Income • IntermediateMunicipal Income • Limited Term Municipal Income • Municipal Income •New York Municipal Income • Tax-Free Bond • Total Bond • FA CaliforniaMunicipal Income • FA Government Income • FA Intermediate MunicipalIncome • FA Limited Term Municipal Income • FA New York MunicipalIncome • FA Total Bond
Conservative Income Bond • Spartan U.S. Bond Index • Spartan U.S. BondIndex Advantage
Fidelity Total Bond ETF
“The Goldilocks of Bond Funds”Morningstar, June 2014
“Intermediate-Term Bond Alternatives to PIMCO Total Return” Morningstar, October 2014
MORNINGSTAR 4 & 5 STARS† 34 Funds
MONEY 50-BEST MUTUAL FUNDS
Fidelity Total Bond2014
“8 Great Core Bond Funds”Morningstar, March 2015
Total Bond, GNMA, Government Income
Morningstar Lipper
Kiplinger
iMoney Net
MoneyIntermediate Bond • Investment Grade Bond • Short Term Bond •Strategic Income • FA Investment Grade Bond • FA Municipal Income •FA Strategic Income
Fidelity Intermediate Muni IncomeFidelity Total Bond
FANTASTIC 50, August 2015 Fidelity Total Bond Fund
Fidelity Institutional Money Market Tax-Exempt CL I*Fidelity Institutional Money Market Tax-Exempt CL III*Highest Net Total ReturnsAAA-rated National Tax-Free Funds Category

35
Your Next Steps Locating the Products on Fidelity.com More education and support services How to buy
Bond Mutual Funds Bond ETFsIndividual Bonds
Fidelity.com > Research > Fixed Income
https://fixedincome.fidelity.com/ftgw/fi/FILanding
Fidelity.com > Research > Mutual Funds
https://www.fidelity.com/fund-screener/research.shtml
Fidelity.com > Research > ETFs ETF/ETP Screener
https://research2.fidelity.com/pi/etf-screener
For illustrative purposes only

36
Thank you!• In general, the bond market is volatile, and fixed income securities carry interest rate risk. (As interest rates rise, bond prices
usually fall, and vice versa. This effect is usually more pronounced for longer-term securities). Fixed income securities also carry inflation risk, liquidity risk, call risk and credit and default risks for both issuers and counterparties. Any fixed-income security sold or redeemed prior to maturity may be subject to loss.
• Interest income earned from tax-exempt municipal securities generally is exempt from federal income tax, and may also be exempt from state and local income taxes if the investor is a resident in the state of issuance. A portion of the income received may be subject to federal and state income taxes, including the federal alternative minimum tax. In addition, investors may be subject to tax on amounts recognized in connection with the sale of municipal bonds, including capital gains and “market discount” taxed at ordinary income rates. “Market discount” arises when a bond is purchased on the secondary market for a price that is less than its stated redemption price by more than a statutory amount. Before making any investment, investors should review the official statement for the relevant offering for additional tax and other considerations.
• The tax information contained herein is general in nature, is provided for informational purposes only, and should not be construed as legal or tax advice. Fidelity does not provide legal or tax advice. Fidelity cannot guarantee that such informationis accurate, complete, or timely. Laws of a particular state or laws that may be applicable to a particular situation may have an impact on the applicability, accuracy, or completeness of such information. Always consult an attorney or tax professionalregarding your specific legal or tax situation.
• For secondary market fixed-income trades to which concessions apply, minimum charges for rep-assisted trades are $19.95. The maximum charge applied to a fixed-income trade is $250. The maximum charge will be reduced to $50 for securities with a maturity date of one year or less.
• Please note that concessions may impact the total cost of the transaction and the total, or "effective," yield of your investment. The offering broker may separately mark up or mark down the price of the security and may realize a trading profit or loss on the transaction.
• Past performance is no guarantee of future results.• Before investing in any mutual fund or exchange-traded fund, you should consider its investment objectives, risks,
charges, and expenses. Contact Fidelity for a prospectus, an offering circular, or, if available, a summary prospectus containing this information. Read it carefully.

37
Important InformationNot FDIC Insured. May Lose Value. No Bank Guarantee.
Not NCUA or NCUSIF insured. May lose value. No credit union guarantee.
© 2015 Morningstar, Inc. All rights reserved. The information contained herein: (1) is proprietary to Morningstar and/or its affiliates; (2) may not be copied or distributed; (3) is not warranted to be accurate, complete, or timely. Neither Morningstar nor its content providers are responsible for any damages or losses arising from any use of this information. Morningstar is a registered trademark of Morningstar, Inc., and is not affiliated with Fidelity Investments.
Fidelity does not review the Morningstar data. For mutual fund performance information, you should check the fund’s current prospectus for the most up-to-date information concerning applicable loads, fees, and expenses.
Third-party trademarks and service marks are the property of their respective owners. All other trademarks and service marks arethe property of FMR LLC or an affiliated company.
Established in 1988, the Morningstar Fund Manager of the Year award recognizes portfolio managers who demonstrate excellent investment skill and the courage to differ from the consensus to benefit investors. To qualify for the award, managers’ funds must have not only posted impressive returns for the year, but the managers also must have a record of delivering outstanding long-term performance and of aligning their interests with shareholders’. The Fund Manager of the Year award winners are chosen based on Morningstar’s proprietary research and in-depth evaluation by its fund analysts.
For the 2003 Fixed-Income Manager of the Year award, Morningstar evaluated 1,851 bond fund managers on long- and short-term returns, shareholder-friendly management style, and strength of conviction in investing decisions. From Fidelity’s muni fund lineup, Mark Sommer, Jamie Pagliocco, and Kevin Ramundo’s team was nominated for 2011 Morningstar Fixed-Income Manager of the Year. From Fidelity’s muni fund lineup, Christine Thompson, Mark Sommer, and Jamie Pagliocco’s team was nominated for 2008 Morningstar Fixed-Income Manager of the Year. To be nominated, managers’ funds must have not only posted impressive returns for the year, but the managers also must have a record of delivering outstanding long-term performance and aligning their interests with shareholders’. Effective 06/30/2010, Christine Thompson was appointed Bond Group Chief Investment Officer for FMRCo.
Kiplinger considers funds that do not levy a sales load and generally avoid funds with high ongoing fees. They favor funds with modest minimum initial investments. Kiplinger closely examines the track records of portfolio managers. Outstanding long-term performance is a given. They also pay attention to how those results were achieved. Consistency is important for Kiplinger, as is the link between returns and risk. Funds that have produced modest returns are perfectly acceptable for Kiplinger if they have takenbelow-average risks. One subpar year doesn’t disqualify a fund from consideration. Kiplinger asks portfolio managers directly todescribe their strategies, styles and thought processes for buying and selling stocks or bonds.

38
Index Definitions Barclays Capital U.S. High Yield Index is a market value-weighted index that covers the
universe of dollar-denominated, fixed-rate, non-investment grade debt. Barclays Capital U.S. Corporate Investment Grade Index is a market value-weighted index of
investment-grade corporate fixed-rate debt issues with maturities of one year or more. Barclays Capital Municipal Bond Index is an unmanaged index that includes investment-
grade, tax-exempt, and fixed-rate bonds with maturities greater than two years selected from issues larger than $75 million.
Barclays Capital U.S. Aggregate Index is an unmanaged index that tracks domestic investment-grade bonds, including corporate, government, and mortgage-backed securities.
Barclays Capital U.S. Treasury Index is a market value-weighted index of public obligations of the U.S. Treasury with maturities of one year or more.
724077.4.0