
Bombardier Commercial Aircraft Market Forecast 2009 - …Welcome to the Bombardier Aerospace...
47
future Bombardier Commercial Aircraft Market Forecast 2009 - 2028
Transcript of Bombardier Commercial Aircraft Market Forecast 2009 - …Welcome to the Bombardier Aerospace...
03 Executive Summary
06 Economic Trends and Key Factors
14 Airline Industry Trends
23 The Forecast
31 Conclusion
33 Geographic Detail
46 Resources
This presentation includes forward-looking statements. Forward-looking statements generally can be identified by the use of forward-looking terminology such as “may”, “will”, “expect”, “intend”, “estimate”, “anticipate”, “plan”, “foresee”, “believe” or “continue” or the negatives of these terms or variations of them or similar terminology. By their nature, forward-looking statements require Bombardier Inc. (the “Corporation”) to make assumptions and are subject to important known and unknown risks and uncertainties, which may cause the Corporation’s actual results in future periods to differ materially from forecasted results. While the Corporation considers its assumptions to be reasonable and appropriate based on current information available, there is a risk that they may not be accurate. For additional information with respect to the assumptions underlying the forward-looking statements made in this presentation, please refer to the respective sections of the Corporation’s aerospace segment (“Aerospace”) and the Corporation’s
transportation segment (“Transportation”) in the F09 MD&A. Certain factors that could cause actual results to differ materially from those anticipated in the forward-looking statements, include risks associated with general economic conditions, risks associated with the Corporation’s business environment (such as the financial condition of the airline industry, government policies and priorities and competition from other businesses), operational risks (such as regulatory risks and dependence on key personnel, risks associated with doing business with partners, risks involved with developing new products and services, warranty and casualty claim losses, legal risks from legal proceedings, risks relating to the Corporation’s dependence on certain key customers and key suppliers, risks resulting from fixed-term commitments, human resource risk, and environmental risk), financing risks (such as risks resulting from reliance on government support, risks relating to financing support provided on behalf of certain customers, risks relating
to liquidity and access to capital markets, risks relating to the terms of certain restrictive debt covenants and market risks (including currency, interest rate and commodity pricing risk). See the Risks and Uncertainties section in the F09 MD&A. Readers are cautioned that the foregoing list of factors that may affect future growth, results and performance is not exhaustive and undue reliance should not be placed on forward-looking statements. The forward-looking statements set forth herein reflect the Corporation’s expectations as at the date of the F09 MD&A and are subject to change after such date. Unless otherwise required by applicable securities laws, the Corporation expressly disclaims any intention, and assumes no obligation to update or revise any forward-looking statements, whether as a result of new information, future events or otherwise.
All monetary amounts are expressed in 2009 US dollars unless otherwise stated.
Forward Looking Statement
table of contents
Bombardier Commercial Aircraft Market Forecast 2009 - 2028 02

executive summary
Bombardier Commercial Aircraft Market Forecast 2009 - 2028 03

Our view of commercial aviation is one of an adaptable and evolutionary industry. In spite of the current challenges faced by economies worldwide, the fundamentals driving the aviation industry remain secure over the long-term. Over the next 20 years, Bombardier expects that the following long-term trends continue:
• Airtraveldemandwillbedirectly related to economic growth
• Aviationdemandfromdeveloping markets will increase
• Aviationmarketswillcontinue their trend towards liberalization
• Airlineswillcontinuetofocus on reducing costs and improving profitability
• Thefocusonenvironmentalsustainability will increase throughout the aviation industry
In 2008, the economic outlook for aviation dramatically slowed as the worldwide economy declined by $5 trillion. The near-term impact of this recession has left few markets unaffected. However, the fundamental drivers of the aviation industry remain positive.
Over the next 20 years, Bombardier forecasts demand for 12,400 aircraft in the 20 to 149-seat market. This segment of the overall industry is expected to generate $588.6 billion in total revenue. The 20 to 99-seat market will account for 38% of these revenues ($226.6 billion), while the 100 to 149-seat market will generate 62% or $362 billion.
Economic Growth: Over the next 20 years, the global economy is expected to grow at a rate of 2.98%. This marks a slightly lower growth rate than the 3.14% predicted last year.
Optimization: A projected increase in fuel prices, downward yield pressures, and environmental concerns will shift aircraft demand to larger capacity, more fuel efficient types. Manufacturers will work with airlines to develop new aircraft that optimize economics and performance for the capacity segments they serve.
executive summary
Welcome to the Bombardier Aerospace Commercial Aircraft Market Forecast, our 20-year view of the market for 20 to 149-seat aircraft.
Bombardier Commercial Aircraft Market Forecast 2009 - 2028 04
Seat Category 2009 - 2028
20 to 59-Seats 300
60 to 99-Seats 5,800
100 to 149-Seats 6,300
Aircraft Total 12,400
Delivery Forecast (Units)

Geographic Shift: Over the next 20 years, significant demand growth will develop in markets outside of North America and Europe. These markets will grow at a higher than average rate. Though stable growth will continue in North America and Europe, these regions represent the largest quantity of aircraft fleet and deliveries.
Environmental Focus: Environmental concerns are a challenge to the prosperity, health and the future of the aviation industry. From an environmental regulatory perspective, the aviation industry is the most advanced and sophisticated commercial transportation mode.
Evolving Segments: The 20 to 59-seat segment remains the foundation of the regional airline industry and the base of the fleet for the near-term. Demand for new aircraft in this segment is small and has dwindled to very low levels. This segment is exhibiting some new vitality with a myriad of applications, including
package freighter and corporate conversions, in the secondary market.
Regional airlines’ desire to increase capacity and reduce per-seat costs has created strong demand for 60 to 99-seat aircraft. In the near-term these large regional aircraft are in high demand causing the average aircraft size to shift upward.
The long-term growth of the 20 to 149-seat market will be in the 100 to 149-seat segment. New aircraft designed specifically for this segment will encompass ‘game changing’ technology, both in terms of operating economics and passenger comfort. These new generation aircraft will enter into service within the next five years.
executive summary
Bombardier Commercial Aircraft Market Forecast 2009 - 2028 05
0
20-Year Worldwide Fleet Forecast
60 to 99-seats
11,500Units
17,000Units
4,000
8,000
12,000
16,000
20,000
2008 2028
5,60
0
8,60
0
2,100
6,90
01,
500
Source: OAG Aviation Solutions, Bombardier Analysis
Total FleetUnits
100 to 149-seats
20 to 59-seats
3,80
0

economic trendsand key factors
Bombardier Commercial Aircraft Market Forecast 2009 - 2028 06

Economic Growth Drives Passenger Demand
Airline passenger demand is directly related to the state of economic growth. Worldwide gross domestic product (GDP) is projected to grow at a compound
annual growth rate (CAGR) of 2.98% over the next 20 years, down from last year’s forecast of 3.14%.
The near-term forecast for the US and Europe remains volatile, with the long-term outlook predicting
CAGR of 2.4% and 1.7% respectively, both of which are below the projected worldwide average. By 2028, developing markets are expected to account for nearly 50% of the global GDP, up 10 points from their current position.
economic trends and key factors
Bombardier Commercial Aircraft Market Forecast 2009 - 2028 07
GDP Growth Rates (2008-2028)
Source : IHS Global Insight
1%
0%
2%
3%
4%
8%
5%
6%
7%
Wo
rld
2.98%
Afr
ica
4.7%
1.7%
Ind
ia
6.3%
Ch
ina
7.5%
2.4%
Mid
dle
Eas
t
3.8%
Latin
Am
eric
a
No
rth
Am
eric
a
2.3%
Asi
a/P
acifi
c(e
x. C
hina
)
Eur
op
e
3.6%
Source: IHS Global Insight
0
GDP Distribution by Country(2008, 2028)
Asia/Pacific (ex. China)
China
Europe
Rest of World
North America
Tota
l GD
P (
$ Tr
illio
n)
$43 Trillion
$19 Trillion
10
20
30
50
40
60
70
80
90
100
2008 2028

economic trends and key factors
Bombardier Commercial Aircraft Market Forecast 2009 - 2028 08
GDP per capita
KenyaIndia
China RussiaBrazil
SouthAfrica
Israel
MalaysiaPortugal Australia
Kuwait
NetherlandsGermany Japan France
United States
Canada
Propensity to Travel
0.001
0.01
0.1
1
10
Trip
s p
er C
apita
0 $10,000 $20,000 $30,000 $40,000 $50,000 $60,000
Source: IHS Global Insight, Sabre Global Demand data, Bombardier Analysis
China and India are the growth leaders among developing markets. Since 2003, China and India’s GDP growth rates have
exceeded the world average. For five of those years, China’s growth rate registered double digits, while India’s was five points above the
world average. This consistent economic strength underlies the forecast shift in aircraft demand in developing markets.

economic trends and key factors
Bombardier Commercial Aircraft Market Forecast 2009 - 2028 09
Airline Capacity Growth
Total fleet-seats, defined as the total number of passenger seats on all in-service commercial aircraft,
are anticipated to increase by 56% over the forecast period in the 20 to 149-seat market. Fleet growth and the shift to larger capacity aircraft will drive this increase.
The current economic recession has resulted in airline capacity reductions in line with decreased passenger demand.
Source: OAG Aviation Solutions, Bombardier Analysis
0.4
0.6
0.0
0.2
0.8
1.0
1.2
1.4
1.6
1.8
1998
Fle
et S
eats
(mill
ions
)
2003 2008 2013 2018 2023 2028
Worldwide Commercial Aircraft CapacityFleet seats, 20 to 149-seat aircraft, Calendar year 1998-2028
20 to 59-seats
Actual Forecast
60 to 99-seats 100 to 149-seats

economic trends and key factors
Bombardier Commercial Aircraft Market Forecast 2009 - 2028 10
Since March 2009, capacity is indicating a slowing decline, leading to a cautiously optimistic view that the worst of this economic recession is behind us. In any case, previous capacity reduction events has led to an accelerated
retirement of old aircraft types and growth in the 20 to 99-seat fleet. It is anticipated that a similar trend will take place in the 100 to 149-seat segment, where the fleet has a high average age.
Overall the future is expected to be positive for an aviation industry focused on long-term economic growth.
Source: IATA-April 2009
Passenger Load Factor by Region
Africa Asia Europe LatinAmerica
MiddleEast
NorthAmerica
Worldwide
47%
63%
79%
95%
70.3%67.4%
74.4% 75.2% 76.0%71.7% 71.4%73.0% 74.2% 72.6%
78.3%74.0% 75.4%
73.3%
April-08 April-09
Source: IATA-April 2009
Passenger Load Factor by Region
Africa Asia Europe LatinAmerica
MiddleEast
NorthAmerica
Worldwide
47%
63%
79%
95%
70.3%67.4%
74.4% 75.2% 76.0%71.7% 71.4%73.0% 74.2% 72.6%
78.3%74.0% 75.4%
73.3%
April-08 April-09
Source: IATA-April 2009
Passenger Load Factor by Region
Africa Asia Europe LatinAmerica
MiddleEast
NorthAmerica
Worldwide
47%
63%
79%
95%
70.3%67.4%
74.4% 75.2% 76.0%71.7% 71.4%73.0% 74.2% 72.6%
78.3%74.0% 75.4%
73.3%
April-08 April-09

economic trends and key factors
Bombardier Commercial Aircraft Market Forecast 2009 - 2028 11
Step Change in the Price of Fuel
Within the past 3 years, fuel surpassed labour as the largest single airline cost factor. Current forecasts by the US Energy Information Administration (EIA)
predict that the price of oil will average $109 per barrel over the next 20 years. During 2008, oil prices exhibited extreme volatility, ranging from nearly $150 per barrel in the middle of the year, down to the $45 level at the end.
Price volatility has a direct impact on the global economy, perhaps even more significant than the actual price itself.
Fuel Price Forecast
Source: Energy Information Administration (EIA), 2009
$0
$20
$40
$60
$80
$100
$120
$140
1980
$US
D P
er B
arre
l
68% Increase
Average Forecast Price $109 per barrel
1982
1984
1986
1988
1990
1992
1994
1996
1998
2000
2002
2004
2006
2008
2010
2012
2014
2016
2018
2020
2022
2024
2026
2028
EIA 2009 ForecastEIA 2008 ForecastEIA 2007 ForecastHistory

economic trends and key factors
Bombardier Commercial Aircraft Market Forecast 2009 - 2028 12
Evidence of the impact of oil prices on global GDP was clearly seen in 2008, where spikes and drops in oil prices played at least some part in the current
recession. The unpredictability of this component of airline costs requires continued action, including fuel hedging, cost-efficient operational improvements,
right-sizing of aircraft and a renewal of fleet in favour of more fuel efficient aircraft.
Fuel CostsLabour Costs
Source: Air Transport Association, 2009
Labour and Fuel Unit Cost History
1Q20
00
3Q20
00
1Q20
01
3Q20
01
1Q20
02
3Q20
02
1Q20
03
3Q20
03
1Q20
04
3Q20
04
1Q20
05
3Q20
05
1Q20
06
3Q20
06
1Q20
07
3Q20
07
1Q20
08
0.0
1.0
2.0
4.0
5.0
6.0
7.0
3.0
Uni
t O
per
atin
g C
ost
(C
ents
per
Ava
ilab
le S
eat
Kilo
met
er)
Fuel CostsLabour Costs
Source: Air Transport Association, 2009
Labour and Fuel Unit Cost History
1Q20
00
3Q20
00
1Q20
01
3Q20
01
1Q20
02
3Q20
02
1Q20
03
3Q20
03
1Q20
04
3Q20
04
1Q20
05
3Q20
05
1Q20
06
3Q20
06
1Q20
07
3Q20
07
1Q20
080.0
1.0
2.0
4.0
5.0
6.0
7.0
3.0
Uni
t O
per
atin
g C
ost
(C
ents
per
Ava
ilab
le S
eat
Kilo
met
er)
Fuel CostsLabour Costs
Source: Air Transport Association, 2009
Labour and Fuel Unit Cost History
1Q20
00
3Q20
00
1Q20
01
3Q20
01
1Q20
02
3Q20
02
1Q20
03
3Q20
03
1Q20
04
3Q20
04
1Q20
05
3Q20
05
1Q20
06
3Q20
06
1Q20
07
3Q20
07
1Q20
08
0.0
1.0
2.0
4.0
5.0
6.0
7.0
3.0
Uni
t O
per
atin
g C
ost
(C
ents
per
Ava
ilab
le S
eat
Kilo
met
er)

economic trends and key factors
Bombardier Commercial Aircraft Market Forecast 2009 - 2028 13
Aircraft Retirements
Fuel price volatility influences airline decisions surrounding the pace and extent of fleet renewals.
During the next 20 years, Bombardier expects retirements of older aircraft to accelerate compared to last year’s forecast. Key in this upward trend is the assumption that fuel prices
will average $109 per barrel and that there will be further implementation of environmental regulations and charges throughout the industry. History has shown that retirements of older aircraft are accelerated during capacity reduction events.
Bombardier anticipates 60% of the current 20 to 149-seat fleet to retire over the 20-year period.
This retirement activity is not evenly distributed across seat categories. However, in response to the introduction of new aircraft optimized for the 100 to 149-seat segment, nearly half of all forecast retirements will occur in this segment.
In Service Fleet at Year End
Source: OAG Aviation Solutions, Bombardier Analysis
0
2,000
4,000
6,000
8,000
10,000
12,000
14,000
16,000
18,000
2008
Airc
raft
Uni
ts
Retained Fleet
11,500
Replacement (56%)6,900 Aircraft
New Growth (44%)5,500 Aircraft
2009
2010
2011
2012
2013
2014
2015
2016
2017
2018
2019
2020
2021
2022
2023
2024
2025
2026
2027
2028
12,400Deliveries

airline industry trends
Bombardier Commercial Aircraft Market Forecast 2009 - 2028 14

airline industry trends
Bombardier Commercial Aircraft Market Forecast 2009 - 2028 15
Airline Economics
Global airline profitability is predicted to deteriorate in 2009 as a result of the recession. The International Air Transportation Association (IATA) predicts airline revenues will continue to decline, with net losses for the industry of $9.0 billion. This will represent losses almost twice as big as IATA was forecasting just three months ago.
The global recession mixed with fuel price volatility and other factors has precluded any regional profitability forecast for this year. North American carriers have successfully reduced capacity in response to declining demand. Yet, where IATA previously predicted break-even profitability for US airlines by the end of 2009, they are now forecasting a loss of $1 billion. Asia/Pacific and European carriers are expected
to experience the highest losses, with Latin America, Middle East and Africa also projected to be unprofitable. On a positive note lower fuel prices in the near-term are expected to save the industry $59 billion.
Region 2006 2007 2008E 2009F
World -0.1 12.9 -10.4 -9.0
North America -2.6 5.3 -5.1 -1.0
Europe 1.8 5.4 0.4 -1.8
Asia/Pacific 0.9 2.1 -3.9 -3.3
Middle East -0.1 -0.1 -1.0 -1.5
Latin America 0.1 0.1 -0.7 -0.9
Africa -0.2 0.1 -0.2 -0.5
Airline Industry Net Profits (Billions)
Source: IATA, June 2009

airline industry trends
Bombardier Commercial Aircraft Market Forecast 2009 - 2028 16
Airline Segmentation
There exists within the airline industry, three common passenger business models with distinctive characteristics: mainline carriers, low fare carriers (LFCs) and regional carriers.
Mainline carriers commonly operate fleets of aircraft with 100 or more seats, often in a hub-and-spoke network, serving numerous cities and countries. The evolution of mainline carriers has involved the retirement of old and/or inefficient aircraft types, increased specialization within their networks, mergers, alliances, acquisitions and improved usage of distribution and information technology. Network optimization through specialization has led to strong partnerships between mainline and regional carriers. Known for their lower cost
business models, regional carriers enable their mainline partners to “right-size” aircraft for passenger demand throughout their network. Regional carriers commonly operate aircraft of 100 seats or less, and serve short to medium-haul markets.
Regional carriers are commonly compensated by their mainline partners through either a capacity
purchase agreement (CPA) or pro-rate revenue sharing. Under a CPA, the mainline carrier purchases the regional’s capacity based on fixed fees for completed departures and/or block hours. Recent developments suggest that at least some US Majors will increase the percentage of pro-rate regional flying in the near-term, to provide a better balance with current CPA flying.
airline industry trends
Bombardier Commercial Aircraft Market Forecast 2009 - 2028 17
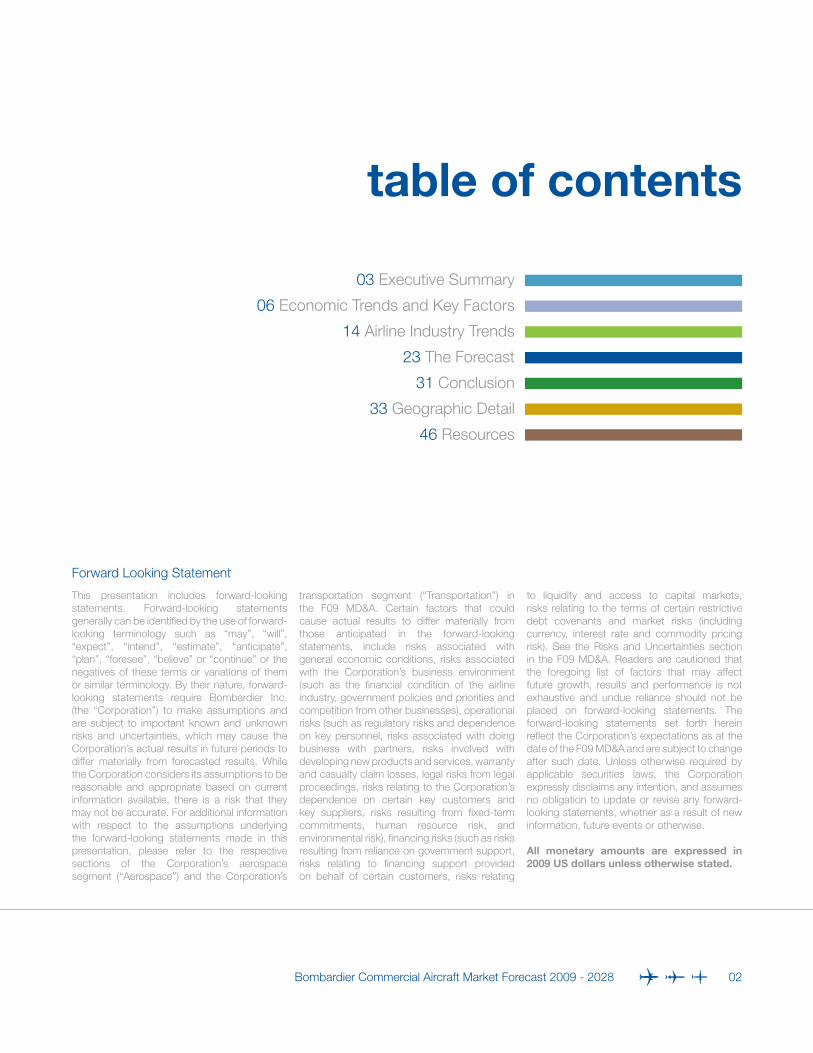
Historical Distribution of US Domestic Seat Share
2000
2001
2002
2003
2004
2005
2006
2007
2008
17 %
20%
20%
22%
22%
24%
26%
27% 21
%
68%
63%
62%
58%
57%
53%
51%
49%
15%
17%
18%
20%
21%
23%
23%
24%
29%
46%
25%
Source: OAG Schedules
Historical Distribution of EU Domestic Seat Share
Majors
LFCs
Regionals
2000
2001
2002
2003
2004
2005
2006
2007
2008
7%
8%
9%
14%
16%
19%
21%
25%
21%
76%
72%
70%
66%
64%
63%
61%
58%
20%
21%
20%
20%
18%
18%
17%
26%
58%
16%
17%
With considerable variation in their business models, most LFCs offer non-hub, point-to-point service in single-class aircraft
cabin configurations. LFCs are well established in North America and Europe, two of the most liberalized aviation regions. Today
LFCs exist in nearly every region of the world.

Labour Trends
As fuel prices have increased, labour costs for airlines have been driven downward. An important source of labour cost-savings has come from third party outsourcing of aircraft operations. These operations, performed by regional carriers, offer cost efficiencies that allow mainline carriers and LFCs to serve smaller markets than would otherwise be economically viable.
An important component of mainline carrier crew labour agreements are ‘scope clauses’. These negotiated clauses define restrictions on the type, number and size of aircraft that may be flown by regional airline partners. Scope clauses are found in both the US and Europe, but are most restrictive in the US. Historically, scope clauses have been a barrier to outsourcing. However, scope clauses are considerably
less restrictive than they were historically, and are permitting regional carriers to fly more and larger regional aircraft. It is predicted that over the next 20 years, scopes clauses will evolve, permitting 100-seat aircraft to be
flown by regional carriers, and play a central role in reshaping the makeup of the industry.
airline industry trends
Bombardier Commercial Aircraft Market Forecast 2009 - 2028 18
Tonne-Kilometers Per Employee
+5.8% CAGR
Airline Labour Productivity
0.5
0.0
1.0
1.5
2.0
2.5
3.0
1997
Ind
ex =
100
in 1
997
1998
1999
2000
2001
2002
2003
2004
2005
2006
2007
2008
E
Source: IATA, 2008
airline industry trends
Bombardier Commercial Aircraft Market Forecast 2009 - 2028 19
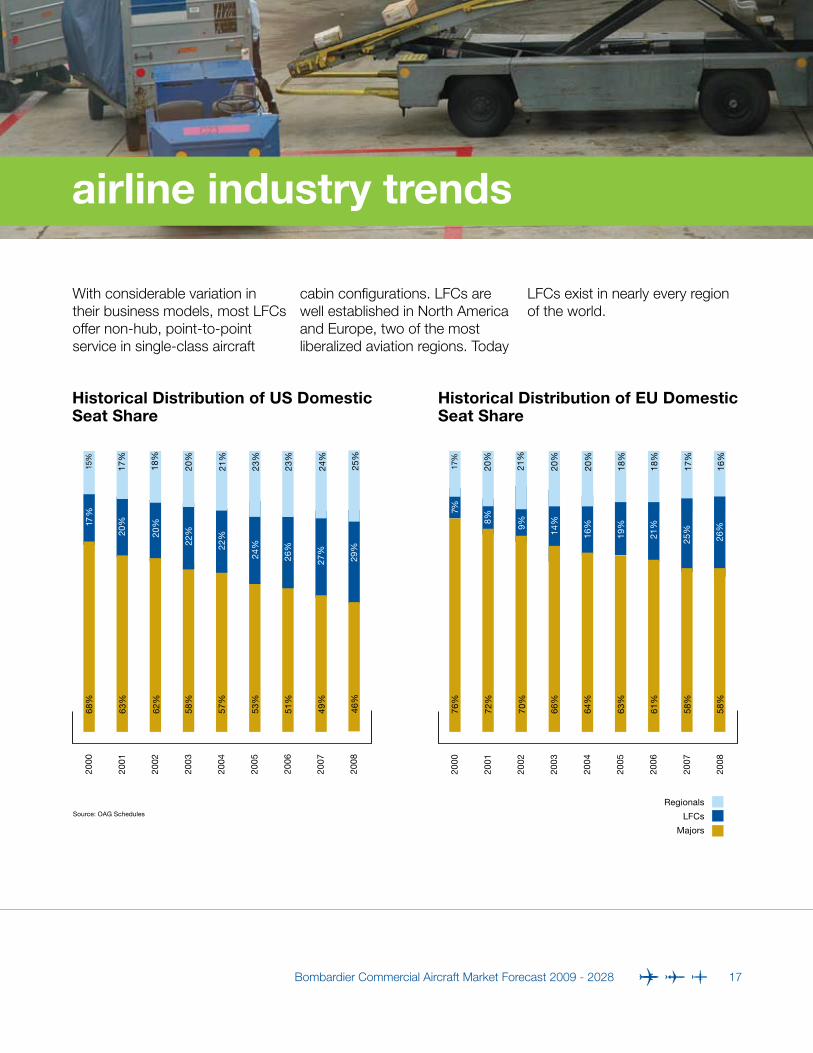
Turboprops and Jets: Optimization in Practice
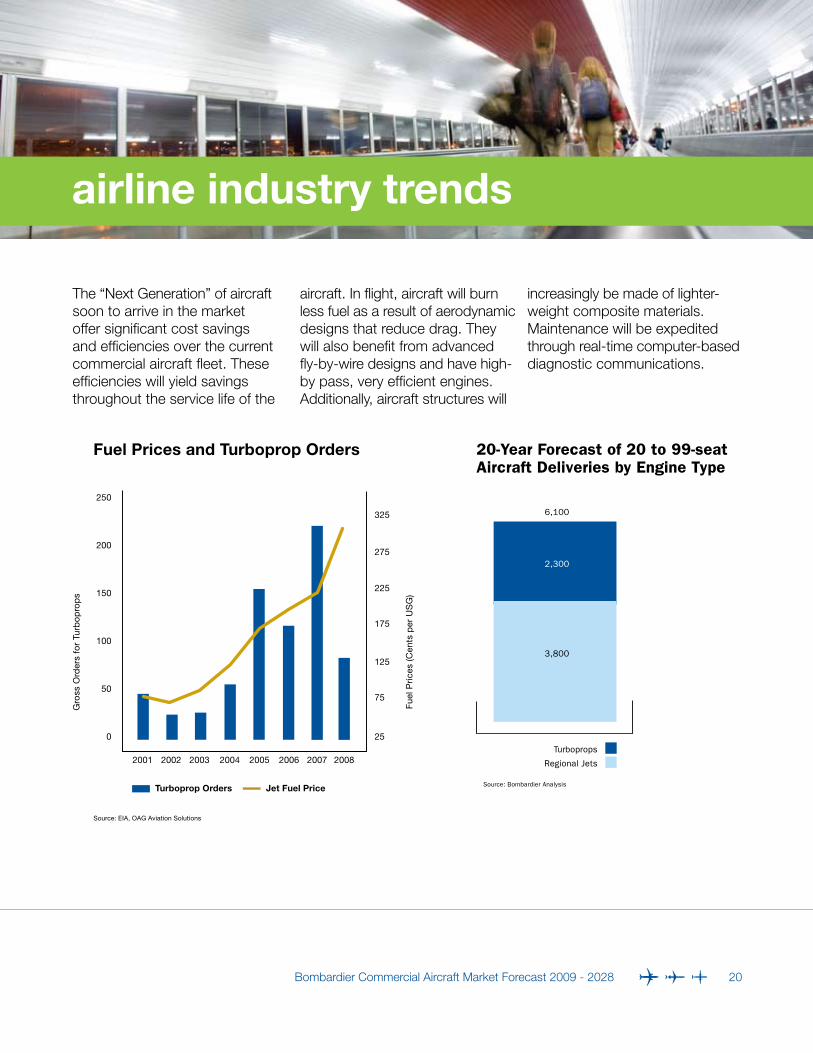
Aircraft design plays a crucial role in airline fleet and network optimization. The return of high fuel prices heightens the importance of efficiency within airline fleets. Beyond fuel efficiency, other considerations drive the need for an optimized fleet plan for any given airline. Noise, emissions, range and capacity are just some examples. True fleet optimization requires aircraft of differing capacity and engine types. The most optimal solution for short-haul services is the turboprop. With seating capacity up to 80 seats, turboprops have proven their value to airlines for more than three decades. For that reason, we anticipate demand for 2,300 turboprop deliveries over the next 20 years. Turboprops will represent 38% of all deliveries in the 20 to 99-seat segment.
To achieve the greatest efficiencies, jet aircraft are best used for longer routes. With jet capacities ranging from less than 50 seats to greater than 500 seats, right-sizing is critical for maintaining low costs. Regional jets in the 60 to 99-seat market
offer optimized capacity solutions for routes with lower traffic volumes. New technology, single-aisle jets in the 100 to 149-seat segment will be optimized for markets up to 3,000 miles with medium-sized traffic volumes.
airline industry trends
Bombardier Commercial Aircraft Market Forecast 2009 - 2028 20
Fuel Prices and Turboprop Orders
Source: EIA, OAG Aviation Solutions
0
50
Gro
ss O
rder
s fo
r Tu
rbo
pro
ps
Fue
l Pric
es (C
ents
per
US
G)
100
200
150
25
75
125
175
225
275
325
250
2004 20062005 20072001
Turboprop Orders Jet Fuel Price
20032002 2008
3,800
20-Year Forecast of 20 to 99-seat Aircraft Deliveries by Engine Type
Regional Jets
Turboprops
Source: Bombardier Analysis
6,100
2,300
The “Next Generation” of aircraft soon to arrive in the market offer significant cost savings and efficiencies over the current commercial aircraft fleet. These efficiencies will yield savings throughout the service life of the
aircraft. In flight, aircraft will burn less fuel as a result of aerodynamic designs that reduce drag. They will also benefit from advanced fly-by-wire designs and have high-by pass, very efficient engines. Additionally, aircraft structures will
increasingly be made of lighter-weight composite materials. Maintenance will be expedited through real-time computer-based diagnostic communications.
airline industry trends
Bombardier Commercial Aircraft Market Forecast 2009 - 2028 21
Airlines and the Environment
Environmental concerns are increasingly shaping the future of the aviation industry. Climate change currently drives a global agenda with focus on carbon dioxide (CO2) emissions, a major source of greenhouse gas (GHG). Aviation represents 2 - 3 % of all CO2 emissions worldwide.
IATA estimates that aviation travel will grow at 5% per year while increasing its carbon footprint by only 3% per year. The different rates of growth are due to the initiatives the industry is taking including fleet modernization, infrastructure and operational improvements.
For aviation, concern for the environment includes not only our global GHG footprint, but
also the local air quality and noise impacts surrounding airports. In all of these areas the industry has made great strides:• Today’s aircraft operations
have increased fuel efficiency and decreased CO2 emissions by 20% over the past 10 years.
• Today’saircraftflythreetimesfurther on the same amount of fuel as 40 years ago. This translates into a 75% fuel efficiency gain per passenger-kilometer.
• By2020noiseisexpectedtobe reduced by a further 50% and nitrous oxides, which affect local air quality, will be reduced by 80%.
IATA has adopted a four pillar strategic approach to reducing aviation’s impact on the environment: • maximizingtheuseof
technology, • improvingairtraffic
operations, • improvingaviation
infrastructure, • maintainingtheeconomic
health of the industry while moving forward.
Advances in aircraft technology, with particular respect to propulsion and construction materials, are contributing to an aviation industry built on sustainability. Aircraft cockpit technology designed to optimize fuel burn during flight and airway routings is being applied to both current and next generation aircraft designs. Further advances in air traffic management systems are necessary to ensure improvements made by airlines and aircraft manufacturers are fully realized. Some airlines are creatively “shrinking” their way to fuel efficiency by lightening cargo containers, removing magazines and adding winglets. Airlines estimate that every extra pound burns between 2% - 4% of its weight each hour in fuel.

There also exist current technology solutions that have yet to be fully utilized. Turboprop aircraft offer low fuel burn, low emissions and low NOx when used on short-haul routes. Currently, turboprop aircraft fly only 27% (278,000) of more than one million monthly flights on routes of less than 500 statute miles. Increasing this ratio presents a significant optimization opportunity. In addition, new point-to-point services using “right-sized” turboprop and jet aircraft could reduce per-passenger fuel burn and emissions through more direct routings, and by removing
stops associated with hub-and-spoke networks.
The aviation industry endeavours to make further improvements, with guidance from bodies such as ICAO and ATAG. Blue-prints for a “carbon-neutral” and “carbon-free future” are under development. The focus on environmental sustainability is increasing rapidly. With this increase comes greater understanding that protecting our environment is good for business. In 2008, Bombardier furthered its commitment to environmental
sustainability with the release of its first corporate responsibility report. Among our commitments are:• Designingthemostfuel-
efficient aircraft with the lowest noise and emissions in their categories.
• Minimizingtheenvironmentalfootprint of our operations through increased efficiency and innovation.
• Improvingsystemstoensure high health, safety, environment and labour commitments across our supply chains.
airline industry trends
Bombardier Commercial Aircraft Market Forecast 2009 - 2028 22
Fuel Efficiency History(US Carriers)
10
0
20
30
40
50
60
70
80
90
1971R
even
ue P
asse
nger
Kilo
met
res
Per
Gal
lon
1978
1980
1990
2000
2005
2008
Source: Air Transport Association, 2009
3.5% Fuel economy improvement per year
Short-Haul Monthly Departures: Turboprops and Jets
Source: OAG Aviation Solutions, Bombardier Analysis
1-100 101-200 201-300 301-400
0
50,000
150,000
100,000Mo
nthl
y D
epar
ture
s
Distance (SM)
250,000
200,000
350,000
300,000
401-500 501-600 601-700 701-800
Currently Turboprop Currently Jet

the forecast
Bombardier Commercial Aircraft Market Forecast 2009 - 2028 23
the forecast
Bombardier Commercial Aircraft Market Forecast 2009 - 2028 24
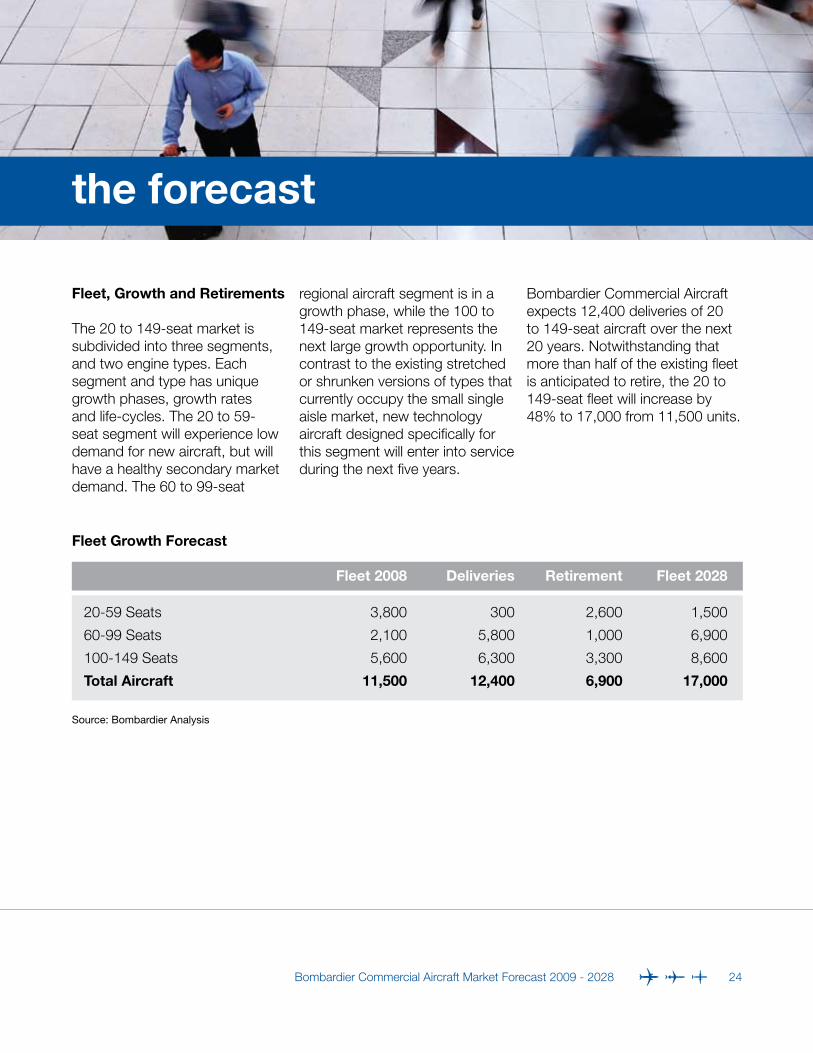
Fleet, Growth and Retirements
The 20 to 149-seat market is subdivided into three segments, and two engine types. Each segment and type has unique growth phases, growth rates and life-cycles. The 20 to 59-seat segment will experience low demand for new aircraft, but will have a healthy secondary market demand. The 60 to 99-seat
regional aircraft segment is in a growth phase, while the 100 to 149-seat market represents the next large growth opportunity. In contrast to the existing stretched or shrunken versions of types that currently occupy the small single aisle market, new technology aircraft designed specifically for this segment will enter into service during the next five years.
Bombardier Commercial Aircraft expects 12,400 deliveries of 20 to 149-seat aircraft over the next 20 years. Notwithstanding that more than half of the existing fleet is anticipated to retire, the 20 to 149-seat fleet will increase by 48% to 17,000 from 11,500 units.
Fleet 2008 Deliveries Retirement Fleet 2028
20-59 Seats 3,800 300 2,600 1,500
60-99 Seats 2,100 5,800 1,000 6,900
100-149 Seats 5,600 6,300 3,300 8,600
Total Aircraft 11,500 12,400 6,900 17,000
Fleet Growth Forecast
Source: Bombardier Analysis

the forecast
Bombardier Commercial Aircraft Market Forecast 2009 - 2028 25
Summary
Of the 12,400 aircraft deliveries predicted from 2009-2028, 2,300 will be turboprops. The remaining 10,100 will be jets, with 3,800 in the 20 to 99-seat segment and
6,300 in the 100 to 149-seat segment. While the absolute number of aircraft deliveries will be weighted towards North America and Europe, there is expected to be a shift from these markets in terms of the percentage of total
deliveries. This is indicative of the increasing importance of China and other Asia/Pacific countries, where economic growth is projected to outpace the rest of the world.
Source: Bombardier Analysis
North America
% of total(12,400 units)
4,780
Europe 2,230
China
Asia/Pacific
Africa &Middle East
Latin America
38%
18%
17%
13%
7%
7%
Worldwide Distribution of Aircraft Deliveries, 2009-2028
2,100
1,550
870
870
Source: Bombardier Analysis
North America
% of total(17,000 units)
6,750
Europe 3,500
China
Asia/Pacific
Africa &Middle East
Latin America
40%
20%
14%
12%
7%
7%
Worldwide Distribution of Aircraft Fleet by 2028
2,400
2,000
1,140
1,210
the forecast
Bombardier Commercial Aircraft Market Forecast 2009 - 2028 26
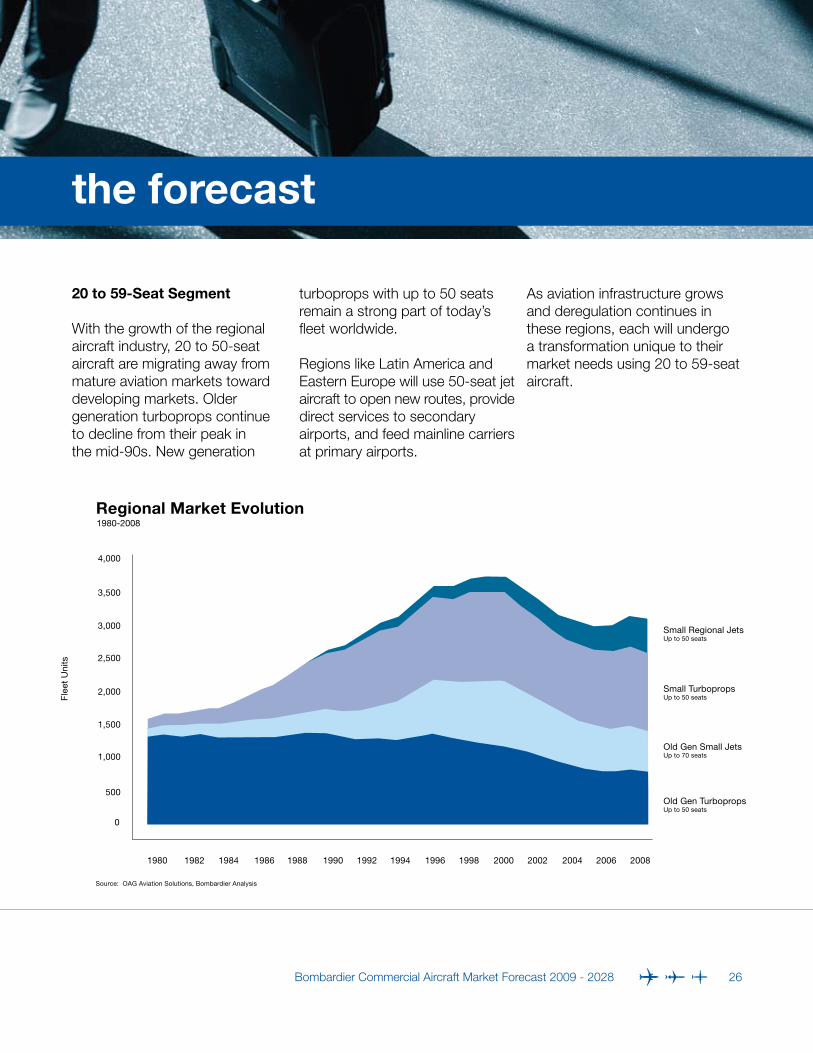
20 to 59-Seat Segment
With the growth of the regional aircraft industry, 20 to 50-seat aircraft are migrating away from mature aviation markets toward developing markets. Older generation turboprops continue to decline from their peak in the mid-90s. New generation
turboprops with up to 50 seats remain a strong part of today’s fleet worldwide.
Regions like Latin America and Eastern Europe will use 50-seat jet aircraft to open new routes, provide direct services to secondary airports, and feed mainline carriers at primary airports.
As aviation infrastructure grows and deregulation continues in these regions, each will undergo a transformation unique to their market needs using 20 to 59-seat aircraft.
1980-2008
0
500
1,000
1,500
1980 1982 1984 1986 1988 1990 1992 1994 1996 1998 2000 2002 2004 2006 2008
2,000
2,500
3,000
3,500
4,000
Old Gen TurbopropsUp to 50 seats
Old Gen Small JetsUp to 70 seats
Small TurbopropsUp to 50 seats
Small Regional JetsUp to 50 seats
Regional Market Evolution
Source: OAG Aviation Solutions, Bombardier Analysis
Fle
et U
nits

the forecast
Bombardier Commercial Aircraft Market Forecast 2009 - 2028 27
Looking forward, 300 new aircraft deliveries are predicted in this segment. New aircraft demand will be derived from replacement opportunities of older 20 to 59-seat aircraft towards the end of the forecast period.
Nearly all of the existing small cargo fleet is comprised of aging turboprops with considerably less range than a regional jet. The average age of these freighters within the smallest payload category exceeds 30 years. There exists cargo conversion and other specialized opportunities for 50-seat jets.
Africa Asia/Pacific China India
Latin America Middle East Russia CIS
Developing Markets Serviced by 50-Seat Jets
Source: OAG Schedules
Year
lt A
SK
s (B
illio
ns)
2000 2001 2002 2003 2004 2005 2006 2007 2008
0.0
2.0
4.0
6.0
8.0
10.0
12.0
14.0
Cargo/Freighter Fleet by Maximum Payload Capacity
2,200 to 4,500 4,500 to 6,800
0
100
50
200
150
Tota
l Airc
raft
300
250
350
6,800 to 9,100
Maximum Payload (kgs)
Avg. Age: 27 Years
Avg. Age: 30 Years
Avg. Age: 21 Years
Source: OAG Aviation Solutions; Jet & Narrowbody Aircraft

the forecast
Bombardier Commercial Aircraft Market Forecast 2009 - 2028 28
60 to 99-Seat Segment
The 60 to 99-seat segment will grow strongly during the forecast period. In mature markets, this growth will be accelerated by traffic demand necessitating larger turboprops and regional jets. In markets such as Asia/
Pacific, the absence of scope clauses combined with the range of the larger regional aircraft will also increase demand.
Turboprops will play a key role in the 60 to 99-seat segment. The worldwide turboprop fleet has continued to grow and is
experiencing a resurgence in North America. Of the 2,300 turboprop deliveries predicted in the forecast, 2,150 will be in the 60 to 99-seat segment. With a high correlation between turboprop demand and fuel prices, the turboprop market is predicted to remain strong.
1980-2008
0
1,000
2,000
3,000
1980 1982 1984 1986 1988 1990 1992 1994 1996 1998 2000 2002 2004 2006 2008
4,000
5,000
6,000
7,000
Old Gen TurbopropsUp to 50 seats
Old Gen Small JetsUp to 70 seats
Small TurbopropsUp to 50 seats
Fle
et U
nits Small Regional Jets
Up to 50 seats
Large TurbopropsUp to 76 seats
Large Regional JetsUp to 99 seats
Regional Market Evolution
Source: OAG Aviation Solutions, Bombardier Analysis
the forecast
Bombardier Commercial Aircraft Market Forecast 2009 - 2028 29
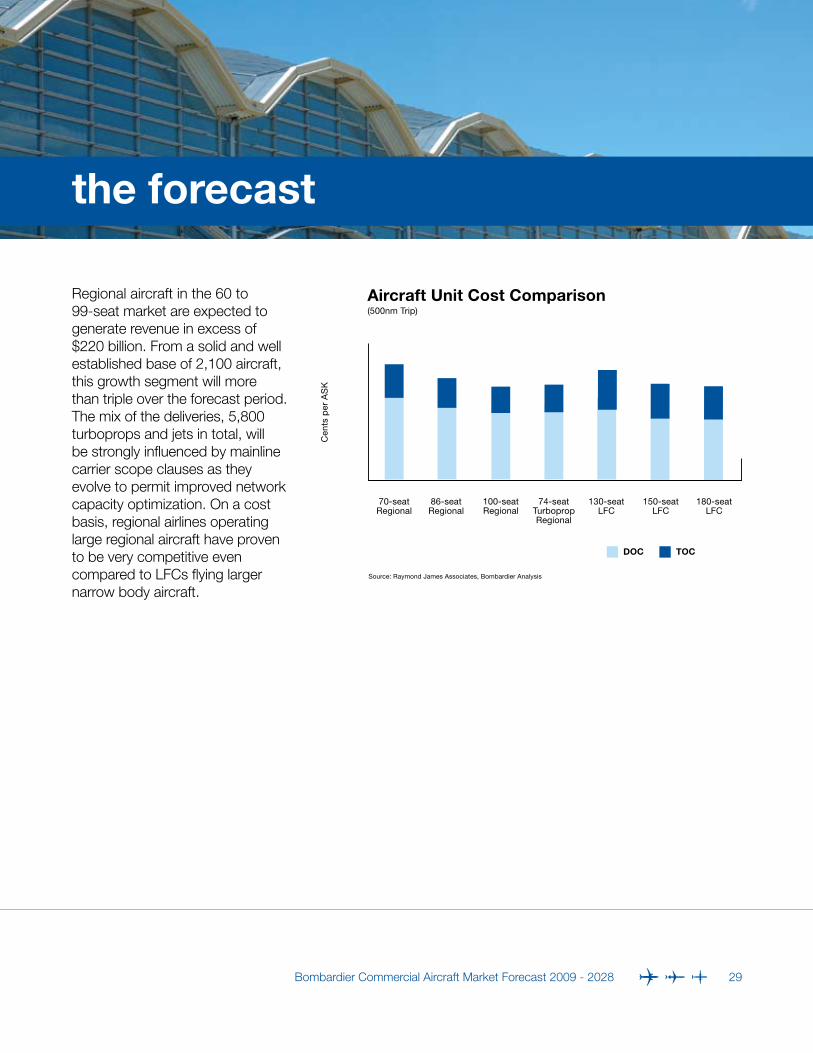
Regional aircraft in the 60 to 99-seat market are expected to generate revenue in excess of $220 billion. From a solid and well established base of 2,100 aircraft, this growth segment will more than triple over the forecast period. The mix of the deliveries, 5,800 turboprops and jets in total, will be strongly influenced by mainline carrier scope clauses as they evolve to permit improved network capacity optimization. On a cost basis, regional airlines operating large regional aircraft have proven to be very competitive even compared to LFCs flying larger narrow body aircraft.
Aircraft Unit Cost Comparison(500nm Trip)
Source: Raymond James Associates, Bombardier Analysis
70-seatRegional
86-seatRegional
100-seatRegional
74-seatTurbopropRegional
Cen
ts p
er A
SK
130-seatLFC
150-seatLFC
180-seatLFC
DOC TOC
the forecast
Bombardier Commercial Aircraft Market Forecast 2009 - 2028 30
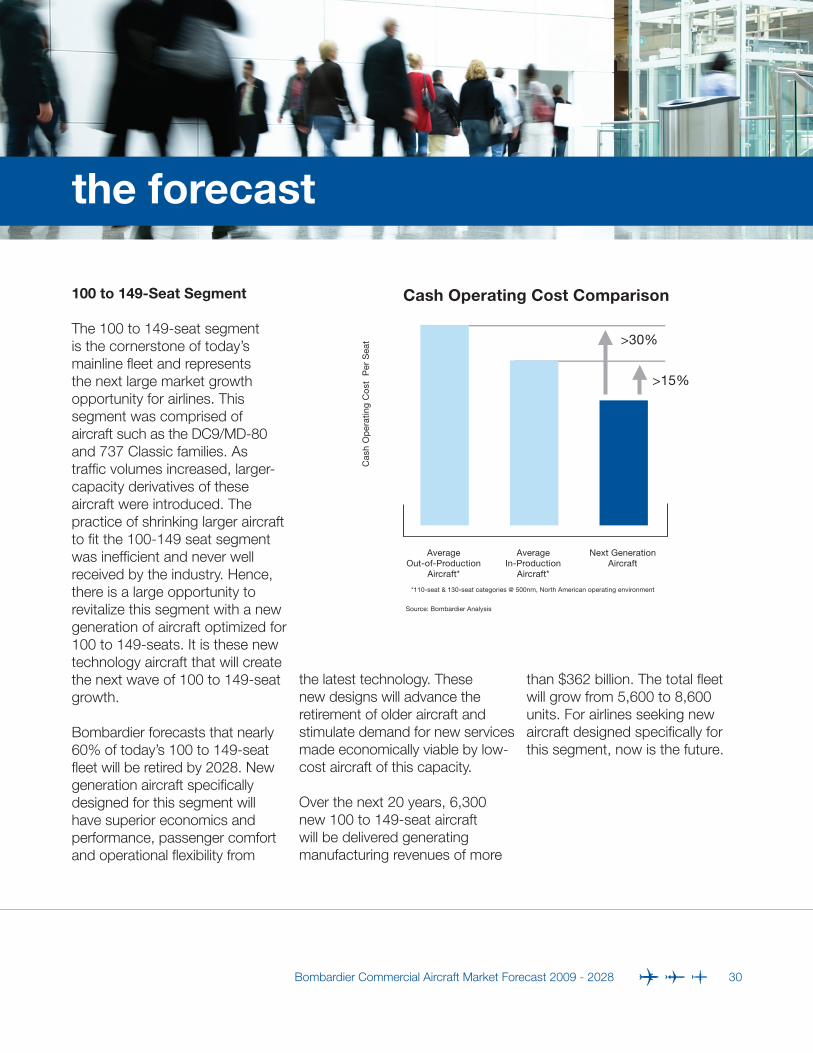
100 to 149-Seat Segment
The 100 to 149-seat segment is the cornerstone of today’s mainline fleet and represents the next large market growth opportunity for airlines. This segment was comprised of aircraft such as the DC9/MD-80 and 737 Classic families. As traffic volumes increased, larger-capacity derivatives of these aircraft were introduced. The practice of shrinking larger aircraft to fit the 100-149 seat segment was inefficient and never well received by the industry. Hence, there is a large opportunity to revitalize this segment with a new generation of aircraft optimized for 100 to 149-seats. It is these new technology aircraft that will create the next wave of 100 to 149-seat growth.
Bombardier forecasts that nearly 60% of today’s 100 to 149-seat fleet will be retired by 2028. New generation aircraft specifically designed for this segment will have superior economics and performance, passenger comfort and operational flexibility from
the latest technology. These new designs will advance the retirement of older aircraft and stimulate demand for new services made economically viable by low-cost aircraft of this capacity.
Over the next 20 years, 6,300 new 100 to 149-seat aircraft will be delivered generating manufacturing revenues of more
than $362 billion. The total fleet will grow from 5,600 to 8,600 units. For airlines seeking new aircraft designed specifically for this segment, now is the future.
Cash Operating Cost Comparison
AverageOut-of-Production
Aircraft*
AverageIn-Production
Aircraft*
Next GenerationAircraft
>30%
>15%C
ash
Op
erat
ing
Co
st P
er S
eat
Source: Bombardier Analysis
*110-seat & 130-seat categories @ 500nm, North American operating environment

conclusion
Bombardier Commercial Aircraft Market Forecast 2009 - 2028 31
conclusion
Bombardier Commercial Aircraft Market Forecast 2009 - 2028 32
Despite the current economic challenges, Bombardier’s view of the worldwide aviation industry remains optimistic. The industry has successfully reinvented itself in past economic downturns and it will do so again with a focus on optimization and efficiency. This is best observed in airframe and engine design, where the combination of highly efficient aircraft and cost-effective operators will continue to create new growth opportunities.
The 20 to 149-seat market will continue its strong growth with deliveries of 12,400 aircraft, representing revenue values of $588.6 billion over the next 20 years. Regional airlines are building a firm new baseline at 60 to 99-seats on top of a solidly established 3,800 strong 20 to 59-seat segment. New
aircraft technology and low-cost operators will revitalize the 100 to 149-seat segment, leading to substantial growth opportunities for manufactures with new aircraft designed specifically for this segment. Finally, the future
of the 20 to 149-seat market will be focused on optimization, efficiency and new technologies that will be at the forefront of an economically and environmentally sustainable aviation industry.

geographic detail
Bombardier Commercial Aircraft Market Forecast 2009 - 2028 33

geographic detail
Bombardier Commercial Aircraft Market Forecast 2009 - 2028 34
North America (ex-Mexico)
North America is currently the largest aviation market and is predicted to receive 38% of the total deliveries in the 20 to 149-seat market. In the near-term, the US market is experiencing its weakest economic growth since the Great Depression, with negative GDP growth expected for much of 2009 and recovery not expected before 2010. Coupled with oil price volatility, the economic slowdown will accelerate the drive for even greater efficiencies within this market. Capacity reduction plans by mainline carriers began during the second half of 2008 to offset decreases in passenger demand. Most of these capacity reductions took place before the current economic crisis, which has put
many US carriers in a relatively good position to weather the recession. While the rate of capacity reductions is expected to slow, US mainline carriers will continue to remove older aircraft from their fleets. Scope clauses will be challenged as mainline carriers continue to look for more optimization opportunities through regional carrier outsourcing.

geographic detail
Bombardier Commercial Aircraft Market Forecast 2009 - 2028 35
Demand for new single-aisle aircraft in North America will be strong. This demand will be realized as the global economy stabilizes and grows. The removal of older mainline fleet types will create demand for new generation single-aisle aircraft and larger regional aircraft alike. With fuel price volatility as a key factor, network optimization and
implementation of highly fuel-efficient aircraft will be the focus of mainline operators. Fiscal stimulus announced by the US government will likely include aviation infrastructure funding. The industry has asked the US Congress for $4-billion to support the NextGen Air Transportation System and general airport improvements.
Progressively over the 20-year forecast period, North America will represent a smaller percent of worldwide GDP than at present, moving to 26% from the current 29%. Though growth will be slower than other economies, delivery demand of 4,780 aircraft preserves North America as the largest aviation market.
Demand Distribution by Seat SegmentNorth America, 2009-2028Total: 4,780 Units
3%
54%
43%
20 to 59-seats
60 to 99-seats
100 to 149-seatsSource: Bombardier Analysis
Yearly Scheduled Intra-North AmericanAirline Seats
20 to 59-Seats
60 to 99-Seats
100 to 149-Seats
Source: OAG Aviation Solutions
2000 2001 2002 2003 2004 2005 2006 2007 2008
0
200
100
400
300Mill
ions
600
500
800
700
geographic detail
Bombardier Commercial Aircraft Market Forecast 2009 - 2028 36
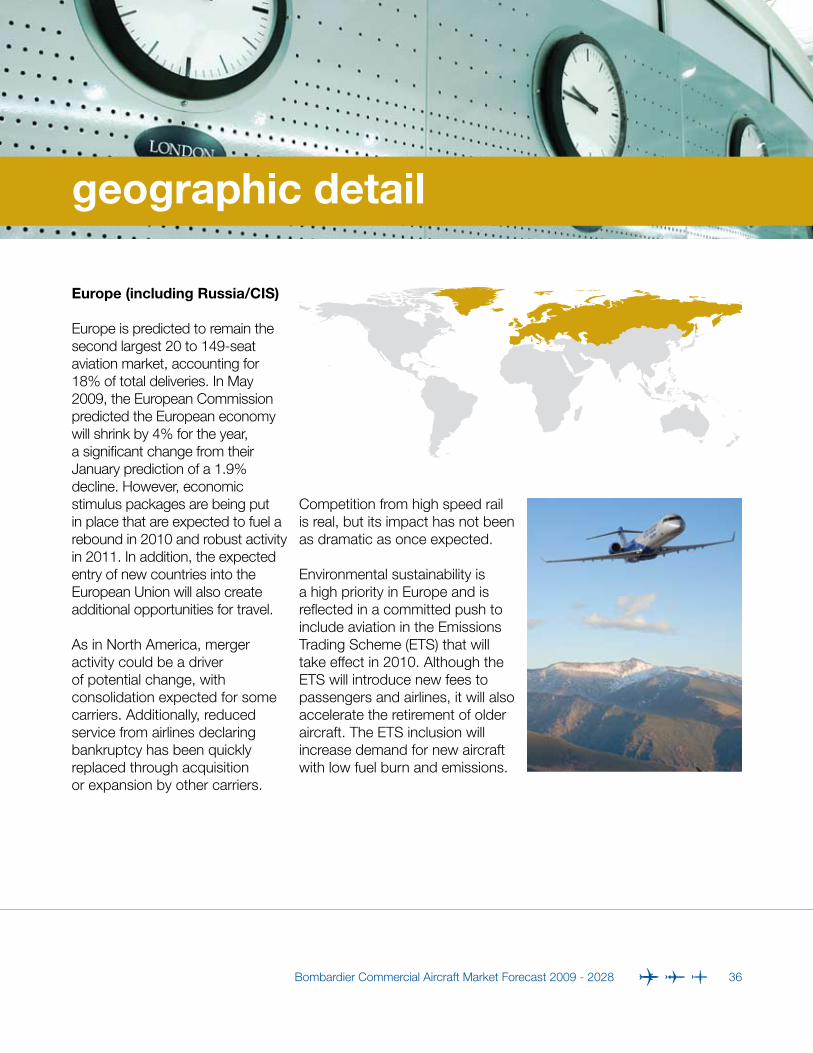
Europe (including Russia/CIS)
Europe is predicted to remain the second largest 20 to 149-seat aviation market, accounting for 18% of total deliveries. In May 2009, the European Commission predicted the European economy will shrink by 4% for the year, a significant change from their January prediction of a 1.9% decline. However, economic stimulus packages are being put in place that are expected to fuel a rebound in 2010 and robust activity in 2011. In addition, the expected entry of new countries into the European Union will also create additional opportunities for travel.
As in North America, merger activity could be a driver of potential change, with consolidation expected for some carriers. Additionally, reduced service from airlines declaring bankruptcy has been quickly replaced through acquisition or expansion by other carriers.
Competition from high speed rail is real, but its impact has not been as dramatic as once expected.
Environmental sustainability is a high priority in Europe and is reflected in a committed push to include aviation in the Emissions Trading Scheme (ETS) that will take effect in 2010. Although the ETS will introduce new fees to passengers and airlines, it will also accelerate the retirement of older aircraft. The ETS inclusion will increase demand for new aircraft with low fuel burn and emissions.
geographic detail
Bombardier Commercial Aircraft Market Forecast 2009 - 2028 37
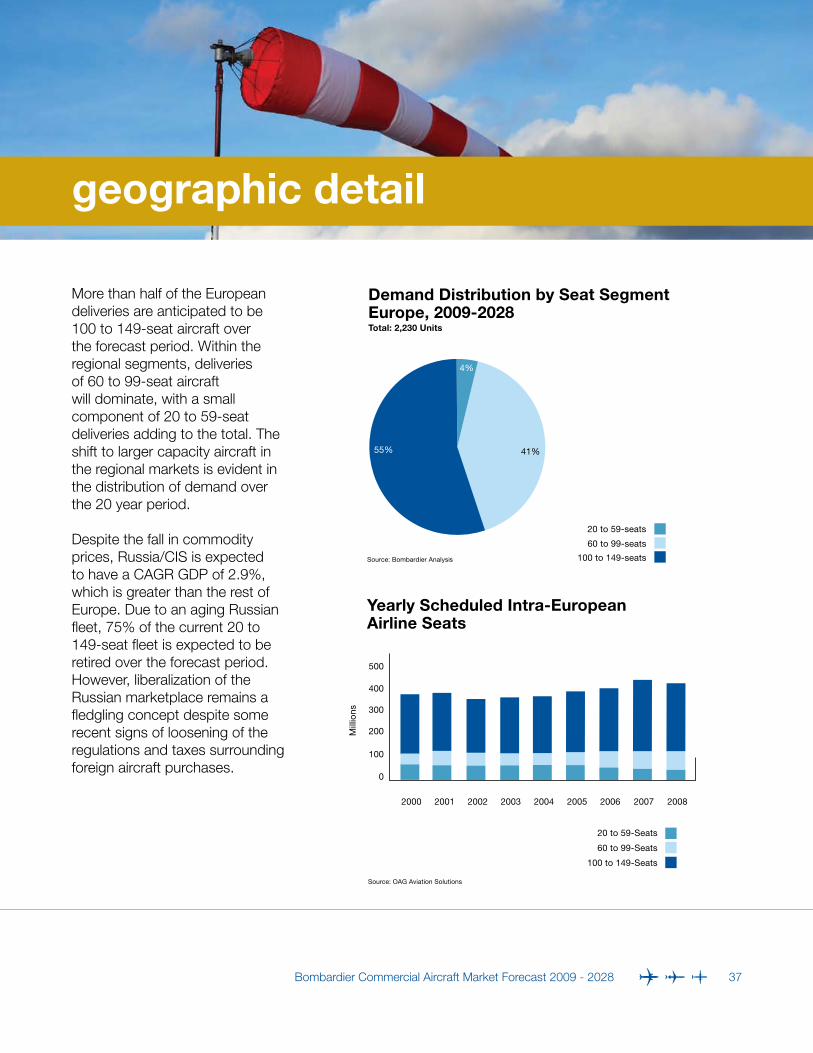
More than half of the European deliveries are anticipated to be 100 to 149-seat aircraft over the forecast period. Within the regional segments, deliveries of 60 to 99-seat aircraft will dominate, with a small component of 20 to 59-seat deliveries adding to the total. The shift to larger capacity aircraft in the regional markets is evident in the distribution of demand over the 20 year period.
Despite the fall in commodity prices, Russia/CIS is expected to have a CAGR GDP of 2.9%, which is greater than the rest of Europe. Due to an aging Russian fleet, 75% of the current 20 to 149-seat fleet is expected to be retired over the forecast period. However, liberalization of the Russian marketplace remains a fledgling concept despite some recent signs of loosening of the regulations and taxes surrounding foreign aircraft purchases.
Demand Distribution by Seat SegmentEurope, 2009-2028Total: 2,230 Units
4%
41%
20 to 59-seats
60 to 99-seats
100 to 149-seatsSource: Bombardier Analysis
55%
Yearly Scheduled Intra-EuropeanAirline Seats
20 to 59-Seats
60 to 99-Seats
100 to 149-Seats
Source: OAG Aviation Solutions
2000 2001 2002 2003 2004 2005 2006 2007
0
100
300
200Mill
ions
400
500
2008
geographic detail
Bombardier Commercial Aircraft Market Forecast 2009 - 2028 38
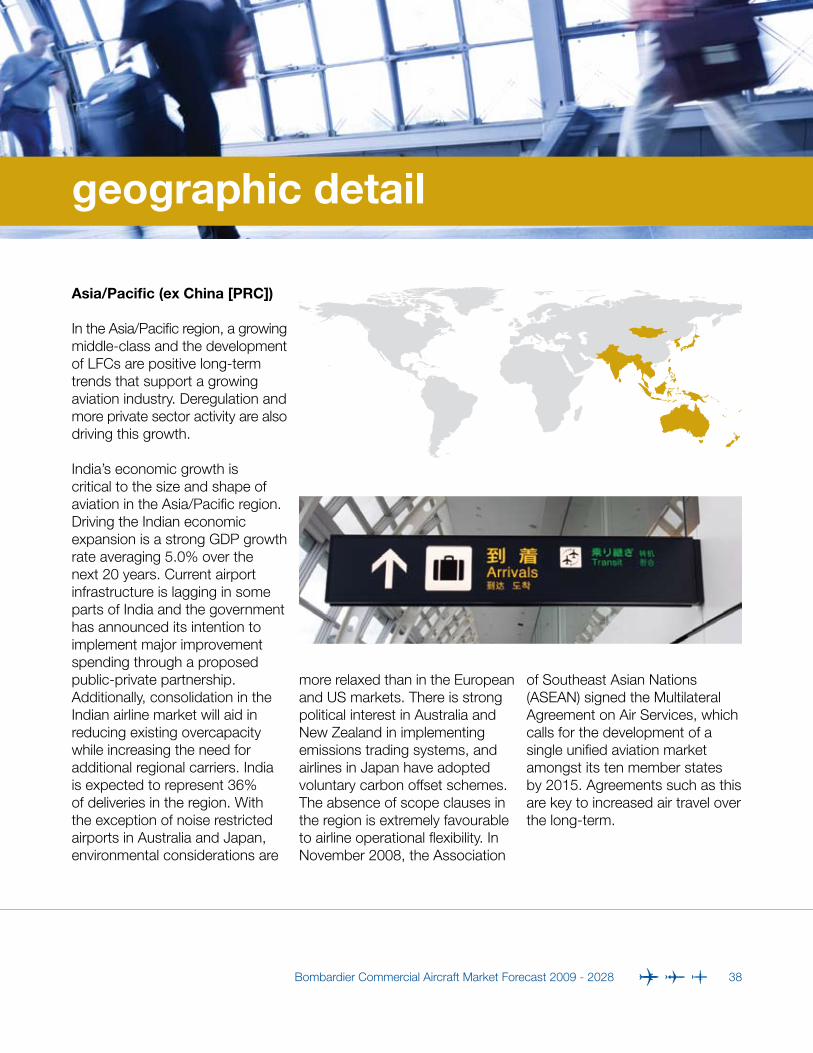
Asia/Pacific (ex China [PRC])
In the Asia/Pacific region, a growing middle-class and the development of LFCs are positive long-term trends that support a growing aviation industry. Deregulation and more private sector activity are also driving this growth.
India’s economic growth is critical to the size and shape of aviation in the Asia/Pacific region. Driving the Indian economic expansion is a strong GDP growth rate averaging 5.0% over the next 20 years. Current airport infrastructure is lagging in some parts of India and the government has announced its intention to implement major improvement spending through a proposed public-private partnership.Additionally, consolidation in the Indian airline market will aid in reducing existing overcapacity while increasing the need for additional regional carriers. India is expected to represent 36% of deliveries in the region. With the exception of noise restricted airports in Australia and Japan, environmental considerations are
more relaxed than in the European and US markets. There is strong political interest in Australia and New Zealand in implementing emissions trading systems, and airlines in Japan have adopted voluntary carbon offset schemes. The absence of scope clauses in the region is extremely favourable to airline operational flexibility. In November 2008, the Association
of Southeast Asian Nations (ASEAN) signed the Multilateral Agreement on Air Services, which calls for the development of a single unified aviation market amongst its ten member states by 2015. Agreements such as this are key to increased air travel over the long-term.

geographic detail
Bombardier Commercial Aircraft Market Forecast 2009 - 2028 39
Demand for the region will be weighted towards the 100 to 149-seat segment, with 55% of the expected deliveries. Additionally, 700 regional aircraft are expected to be delivered, with 670 in the 60 to 99-seat segment. The Asia/Pacific region is expected to take delivery of 1,550 aircraft in the 20 to 149-seat market, representing 13% of the total demand.
Demand Distribution by Seat SegmentAsia/Pacific (ex-China), 2009-2028Total: 1,550 Units
2 %
43%55%
20 to 59-seats
60 to 99-seats
100 to 149-seats
Source: Bombardier Analysis
Yearly Scheduled Intra-Asia/Pacific Airline Seats
20 to 59-Seats
60 to 99-Seats
100 to 149-Seats
Source: OAG Aviation Solutions
2000 2001 2002 2003 2004 2005 2006 2007 2008
0
50
150
100Mill
ions
200

geographic detail
Bombardier Commercial Aircraft Market Forecast 2009 - 2028 40
China
Due to the current financial crisis, the GDP growth rate of China is expected to slow to 6% in 2009, and the growth of commercial aviation is forecast to be below 10%. However, over the next 20 years it is projected that China will more than double its proportion of worldwide GDP to 15%. Year-over-year GDP growth above 7% will allow these projections to materialize. Chinese cities are experiencing unprecedented growth marking a major shift in China’s demographics.
China’s strengthening economic power can be observed throughout its aviation industry. Aviation sector manufacturing, repair and supply organizations are well entrenched. At present, the airline industry is still highly regulated, but steps towards liberalization are expected. The Civil Aviation Administration of China (CAAC) has been working with the military to open more airspace to commercial traffic.

geographic detail
Bombardier Commercial Aircraft Market Forecast 2009 - 2028 41
There are no scope clause issues in China, although a shortage of pilots is still a problem for startups. A planned 97 new airports will be built by 2020 and many airport expansion projects are underway. In April 2009, China and Taiwan further liberalised cross-strait air operations by allowing the introduction of scheduled passenger services and more cargo flights, building upon an initial 2008 agreement that allowed limited charter flights.
China is expected to receive 2,100 aircraft in the 20 to 149-seat market during the next 20 years, representing 17% of the worldwide total.
Demand Distribution by Seat SegmentChina, 2009-2028Total: 2,100 Units
<1%
46%
54%
20 to 59-seats
60 to 99-seats
100 to 149-seats
Source: Bombardier Analysis
Yearly Scheduled Intra-China Airline Seats
20 to 59-Seats
60 to 99-Seats
100 to 149-Seats
Source: OAG Aviation Solutions
2000 2001 2002 2003 2004 2005 2006 2007 2008
0
20
60
40Mill
ions
80
100
120

geographic detail
Bombardier Commercial Aircraft Market Forecast 2009 - 2028 42
Latin America (including Mexico and the Caribbean)
With 9.2% of the global population, Latin America currently accounts for 6% of the world’s GDP and is expected to achieve growth rates higher than the worldwide average over the next 20 years. Despite the current economic challenges, the foundations of growth remain secure due to the relative political stability of the region.
Historically, the route network in Latin America was developed by flag carriers serving major city pairs with limited competition. Market changes through deregulation and the emergence of LFCs is altering this pattern and creating new opportunities for competitive non-stop services. A market transformation can be seen in Latin America with the introduction and expansion of the LFC business model, which has been particularly successful in Brazil, Colombia and Mexico. The trend is expected to permeate
the region. A strong secondary market for 50-seat regional jets has been established in a number of Latin American countries and is also expected to grow.
Regional governments are recognizing that investment in airport infrastructure is required to expedite airline growth. A need for low-cost regional point-to-point flying between secondary cities also exists. To date, most new start-ups have focused on large cities, with inadequate service in regional markets as a result of a mismatch between aircraft size and passenger demand.
A unique domestic transportation system exists in Mexico. According to the Dirección General de Aeronáutica Civil, the domestic Mexican travel market is currently split disproportionately 5% by air and 95% by ground, with the latter dominated by bus travel. Travel times by bus are very long, between 4 to 20 hours. Hence, there is a huge opportunity for new low cost regional and single-aisle aircraft. Regional airlines will play an increasingly important role for both hub feed and non-stop services.
geographic detail
Bombardier Commercial Aircraft Market Forecast 2009 - 2028 43
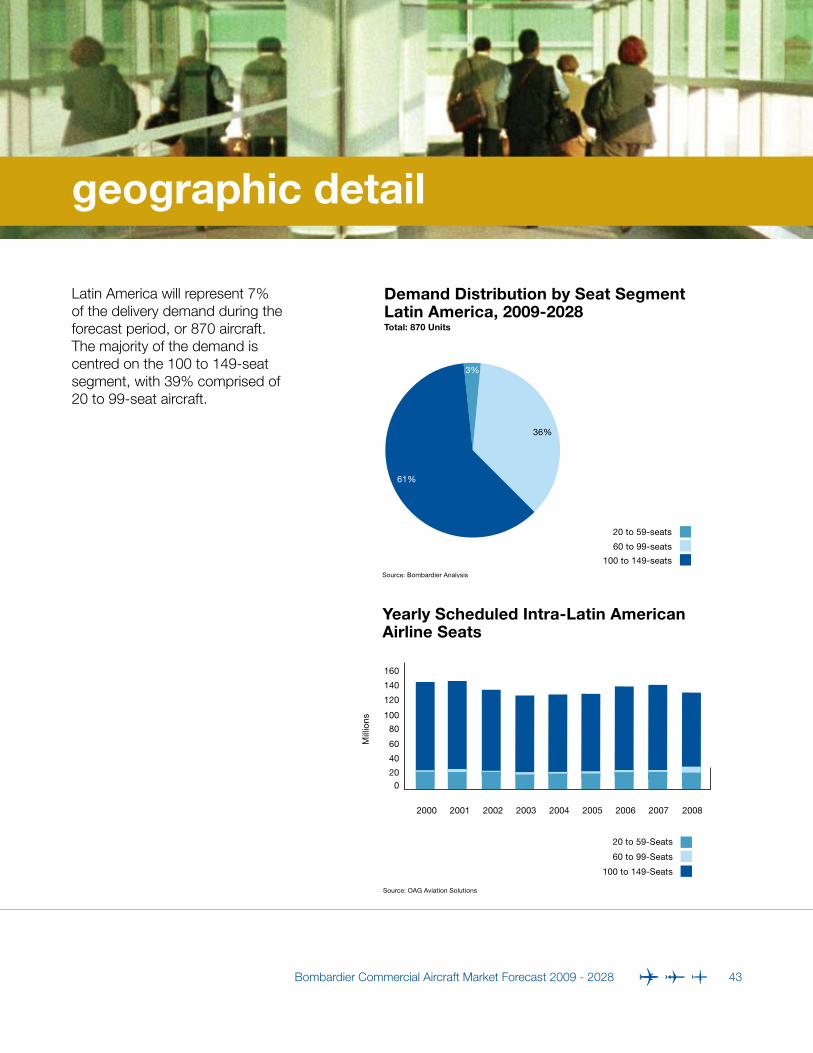
Latin America will represent 7% of the delivery demand during the forecast period, or 870 aircraft. The majority of the demand is centred on the 100 to 149-seat segment, with 39% comprised of 20 to 99-seat aircraft.
20 to 59-seats
60 to 99-seats
100 to 149-seats
Source: Bombardier Analysis
Demand Distribution by Seat SegmentLatin America, 2009-2028Total: 870 Units
3%
36%
61%
Yearly Scheduled Intra-Latin American Airline Seats
20 to 59-Seats
60 to 99-Seats
100 to 149-Seats
Source: OAG Aviation Solutions
2000 2001 2002 2003 2004 2005 2006 2007 2008
0
40
20
80
60Mill
ions
120
100
160
140

geographic detail
Bombardier Commercial Aircraft Market Forecast 2009 - 2028 44
Africa and the Middle East
In 2008, Africa experienced year-over-year GDP growth of 5.3%, while the Middle East grew at 4.7%, both exceeding the worldwide average. However, economic development and growth must be balanced against social and political issues within both regions. Global Insight reports that the short-term outlook for Africa and the Middle East has improved due to a higher oil revenue outlook and a more moderate political climate. Oil is a major export for these regions and is a source of significant revenue generation. Sub-Saharan Africa is not experiencing the same healthy growth in the short-term but is expected to continue to trend positively over time, driven by increased commodity prices and a growing tourism trade. While many of the airlines in this region are state-owned, market liberalization, regulatory reforms and privatization are underway. In the Middle East, LFCs emerged to compete with the majors in the market. Over
half a dozen major Middle Eastern LFCs have appeared in the last five years. These LFCs are stimulating
the market by making air travel more affordable and accessible.

geographic detail
Bombardier Commercial Aircraft Market Forecast 2009 - 2028 45
40%
Demand Distribution by Seat SegmentAfrica and the Middle East, 2009-2028Total: 1,140 Units
20 to 59-Seats
60 to 99-Seats
100 to 149-SeatsSource: Bombardier Analysis
58%
2%
Yearly Scheduled Intra-Africa and Intra-Middle East Airline Seats20 to 149-seat Aircraft
Source: OAG Aviation Solutions
20
30
0
10
40
50
60
70
2000
Mill
ions
2001 2002 2003 2004 2005
Africa
Middle East
2006 2007 2008
In Africa, intra-continental routes are a largely untapped market that promises great potential. The intra-African market currently accounts for less than 20% of the overall continental market (versus more than 50% for North America). Air travel is an excellent alternative to ground transportation over vast
distances and difficult terrain, where road and rail infrastructure is limited. Fifty-seat regional jets are an attractive solution for low-risk entries into new markets. As these markets mature, they will find themselves ideally suited for new technology single-aisle mainline aircraft.
Africa and the Middle East together will account for 7% or 870 units of the 20 to 149-seat aircraft delivery demand.

resources
Bombardier Commercial Aircraft Market Forecast 2009 - 2028 46

resources
Bombardier Commercial Aircraft Market Forecast 2009 - 2028 47
Resources used in the Bombardier Aerospace, Commercial Aircraft Market Forecast
AAPA – Association of Asia/Pacific AirlinesACAS – AirCraft Analytic System databaseAirline MonitorAssociation of SouthEast Asian Nations (ASEAN) ATA – Air Transport AssociationAviation DailyBTS – US Bureau of Transportation StatisticsCivil Aviation Administration of China (CAAC) Direccion General de Aeronautica Civil (DGAC) DOT – US Department of TransportationEIA – US Energy Information AdministrationERAA – European Regional Airline AssociationEuropean Union – ec.europa.euIATA – International Air Transport Association, World Air Transportation StatisticsICAO – International Civil Aviation OrganisationIHS Global InsightOAG – BACK AviationRAA – Regional Airline AssociationRaymond James Associates World Bank – www.worldbank.org
For electronic copies of the Bombardier Aerospace Commercial Aircraft Market Forecast, 2009-2028, please visit our website at: www.bombardier.com