Boiler Emission Compliance Survey Norton AFB CA · Ae:OEHL REPORT 89-098EQ0144HEF Boiler Emission...
177
Ae:OEHL REPORT 89-098EQ0144HEF Boiler Emission Compliance Survey Norton AFB CA CHARLES iN. ATTEBERY, 1 Lt, USAF, BSC RONALD W. VAUGHN, Capt, USAF, BSC AUGUST 1989 D I ELECTE Final Report S JAN111990 IJ Distribution is unlimited; approved for public release AF Occupational and Environmental Health Laboratory (AFSC) Human Systems Division Brooks Air Force Base, Texas 78235-5501 9 0 01 11 0 31.
Transcript of Boiler Emission Compliance Survey Norton AFB CA · Ae:OEHL REPORT 89-098EQ0144HEF Boiler Emission...

Ae:OEHL REPORT 89-098EQ0144HEF
Boiler Emission Compliance SurveyNorton AFB CA
CHARLES iN. ATTEBERY, 1 Lt, USAF, BSCRONALD W. VAUGHN, Capt, USAF, BSC
AUGUST 1989 D IELECTE
Final Report S JAN111990 IJDistribution is unlimited; approved for public release
AF Occupational and Environmental Health Laboratory (AFSC)Human Systems Division
Brooks Air Force Base, Texas 78235-5501
9 0 01 11 0 31.

NOTICES
When Government drawings, specifications, or other data are used for any purposeother than a definitely related Government procurement operation, the Governmentincurs no responsibility or any obligation whatsoever. The fact that theGovernment may have formulated, or in any way supplied the drawing, specifica-tions, or other data, is not to be regarded by implication, or otherwise, as inany manner licensing the holder or any other person or corporation; or conveyingany rights or permission to manufacture, use, or sell any patented inventionthat may in any way be related thereto.
The mention of trade names or commercial products in this publication is forillustration purposes and does not constitute endorsement or recommendation foruse by the United States Air Force.
The Public Affairs Office has reviewed this report, and it is releasable to theNational Technical Information Service, where it will be available to thegeneral public, including foreign nations.
This report has been reviewed and is approved for publication.
Air Force installations may direct requests for copies of this report to: AirForce Occupational and Environmental Health Laboratory (AFOEHL) Library, BrooksAFB TX 78235-5501.
Other Government agencies and their contractors registered with the DTIC shoulddirect requests for copies of this report to: Defense Technical InformationCenter (DTIC), Cameron Station, Alexandria VA 22304-6145.
Non-Government agencies may purchase copies of this report from: National
Technical Information Service (NTIS), 5285 Port Royal Road, Springfield VA 22161
CHARLES W. ATTEBERY, It, USAF, BSC \ ROBERT D. BINOVI, Lt Col, USAF, BSCAir Quality Engineer Chief, Environmental Quality Division

UNCLASSIFIEDSEN"'ITY CLASSIFCA-TION -OF TI,IS PA-?f
REPORT DOCUMENTATION PAGE 01%1 O 70 1d
1s a~tA! f CLASSIFICATION lb R WRICTIVE MARK INGS
20. IURITY CLASSIFICATION AUTHORITY 3. DI Rr se;2b. DECLASSIFICATION / DOWNGRADING SCHEDULE distribution is unlimited.NA
4. PERFORMING ORGANIZATION REPORT NUMBER(S) 5 MONITORING ORGANIZATION REPORT NUMBER(S)
AFOEHL Report 89-o98EQO144HEF________6. NAME OF PERFORMING ORGANIZATION I6b OFFICE SYMBOL 7. NAME OF MONITORING ORGANIZATION
AF Occupational and Environ- j (it applicable)mental Health Laboratory EQE _______________________
6c. ADDRESS (City, Stote, "n ZIP Code) 7b ADDRESS (City, Stee and4 ZIP Code)
BrooksAFBTX 78235-5501 ________________________________
8a. NAME OF FUNDING/ SPONSORING fBb. OFFICE SYMBOL 9 PROCUREMENT INSTRUIVILNT IDENTIFICATION NUMBERORGANIZATION j(if applicable)
Same as 6aI9(- ADDRESS (City, State, and ZJP Cod#) 10 SOURCE OF FUNDING WNMERS
PROGRAM PROJECT ITArSK WORK uNITELEMENT NO NO NO ACCESSON NO
Same as 6c I111. TITLE (Include Security Classification)
Boiler Emission Compliance Survey, Norton AFB CA
12. PERSONAL AUTHOR(S)Charles W. Attebery, iLt, USAF, BSC and Ronald W. Yaughn, Capt, USAF, BSC
13a. TYPE OF REPORT 13b TIME COVERED 114, DATE OF REPORT (Year, Month, Day) 15 PAGE COuNTFinal IFROM TO I August 19891
16. SUPPLEMENTARY NOTATION
17. COSATI CODES 18 SUBJECT TERMS (Continue on reverse if i Eceisdry and identify by block number)FIELD GROUP Su- '--Compliance Testing, Norton, Air Pollution,- Attebery
c- Source EmissionTest -ing, 'Stack -Sampl ing, VaughParticulatesf -Earbon MonoxideF.--xides of Nitrogen )
19. ABSTRACT (Continue on revel t if necessary and identify by block numb*,)
)At the request of USAF CGlinic/SGPB, Norton AFB and HQ MAC/SGPB, compliance testing (carbonmonoxide and oxides of nitrfgen) of emissions from three Norton AFB boilers was conductedon 17-29 April 1989. Testing was performed to determine compliance with regards to thenewly adopted Rule #1146 of the South Cois't-Air Quality Management District. inanticipation of further regulation, particulate emissionhs were also determined. Resultsshow that none of the boiler emissions meet the 40 ppm limit for oxides of-,itrogen butall meet the 400 ppm limit for carbon monoxide emissions. L
20 AgTRI8IjTIONI 4AVAILA8IL;TY OF ABSTRACT 21 A TR~TS~I~C S~,AODONCLASSFED,';rti ITk.' C3i SAME AS RPT DTI UrctERS ~ nc a suieu
22& NAME OF RESPON')8iL N~i'I VAL BS 2,1 -E4HP4 Il Ar MB.CS"IkC. Attebery, ILt, USA, BSC5 0EL(u~aOFFoHL/tQE
00 Forml1473, JUN 86 Preious editions ,s'e obsolete Sk, RTY C ASSIFICATiON )T- 7
UNCLASSIFIED

ii

CONTENTS
Page
DD Form 1473 iIllustrations ii
I. INTRODUCTION 1
II. DISCUSSION I
A. Background IB. Site Descriptions IC. Applicable Limits 2D. Sampling Methods and Procedures 5
III. CONCLUSIONS 7
IV. RECOMMENDATIONS 12
References 12
Appendix
A Personnel Information 13B South Coast Air Quality Management District Rule #1146 17C Building 672 Boiler 1 Field Data 29D Building 249 Boiler 1 Field Data 53E Building 716 Boiler 4 (Natural Gas) Field Data 77F Building 716 Boiler 4 (Fuel Oil) Field Data 101G Acetone Blank Results 123H Emissions Calculations 127I Calibration Data 155
Distribution List / 171
Aogession For
INTIS GRA&IDTIC TAB 0j
Uran.ounoed 0Jusc ifloaftioa_
By_Distraut ton/
Avail.blltty CodesAvail and/or
Dist Speolal
.... ' I IIII I I I I I II I

Illustrations
Table Title Page
I Boiler Information 12 SCAQMD Rule #1146 Standards 53 Stack Emissions Particulate Test Results 104 Stack Emissions Carbon Moxoxide Test Results 115 Stack Emission NOx Test Results 11
Figure
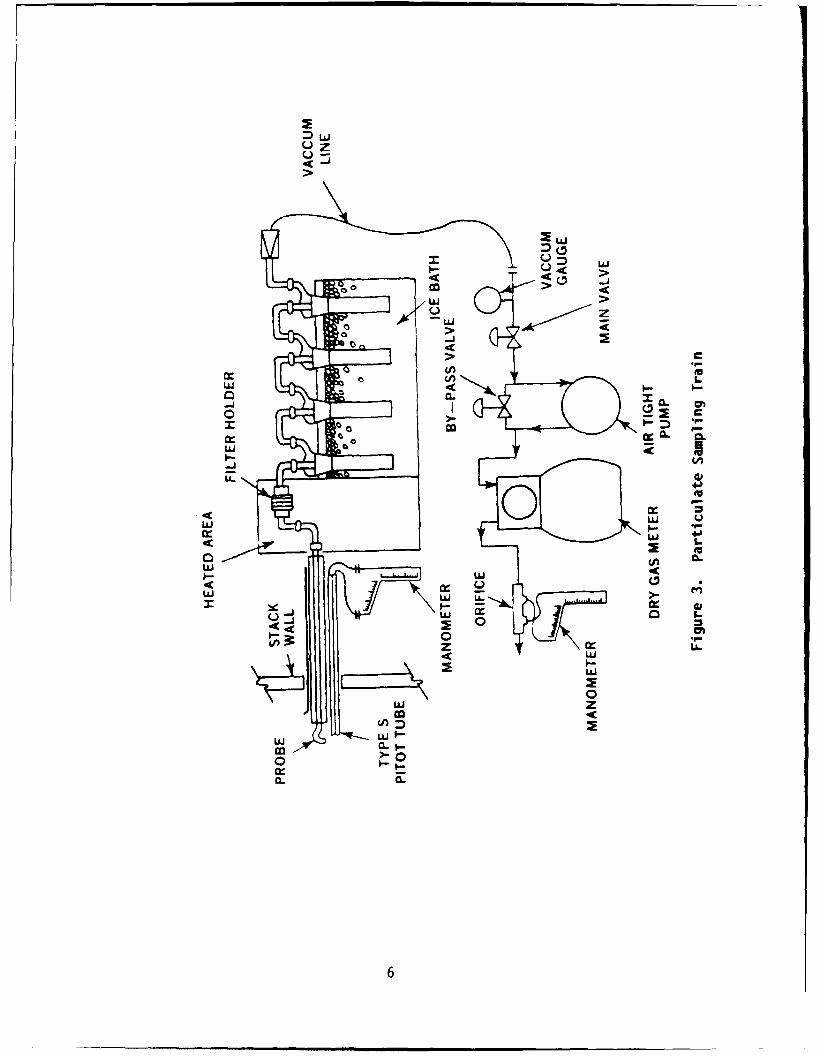
1 Boiler Stack During Testing, Building 672 32 Boiler Stack, Building 249 43 Particulate Sampling Train 64 ORSAT Grab Sampling Apparatus 85 ORSAT Apparatus 86 Sampling Train for Oxides of Nitrogen 97 Carbon Monoxide Sampling Train 9
iv

I. INTRODUCTION
On 17-29 April 1989, compliance emission testing for carbon monoxide (CO),oxides of nitrogen (NOx) and particulate emissions was conducted at Norton AFBon three boilers by personnel of the Air Quality Function of the Air ForceOccupational and Environmental Health Laboratory (AFOEHL). This survey wasrequested by USAF Clinic Norton/SGPB through HQ MAC/SGPB to determinecompliance status with regards to newly adopted Rule #1146 of the South CoastAir Quality Management District (SCAQMD). Personnel involved with on-sitetesting are listed in Appendix A. SCAQMD Rule #1146 is presented in AppendixB.
II. DISCUSSION
A. Background
On 25 Oct 1988 Norton AFB requested that the AFOEHL determine thecarbon monoxide and oxides of nitrogen emission compliance status of threeboilers with respect to the newly adopted Rule #1146. In order to maximizethe benefit of our visit, we were also tasked to determine the particulateemissions in anticipation of further regulation. The boilers in buildings249 and 672 were each tested once. Boiler number 4 in building 716 was testedtwice utilizing natural gas and then diesel #2 as fuels.
To demonstrate and maintain compliance with SCAQMD Rule #1146, NortonAFB requested AFOEHL assistance to: (1) determine carbon monoxide emissionsfrom each boiler as specified in 40 CFR 60, Appendix A, Reference Method 10,and (2) determine the oxides of nitrogen emissions from each boiler asspecified in 40 CFR 60, Appendix A, Reference Method 7, and for additionalinformation (3) determine perticulate emissions from each boiler as specifiedin 40 CFR 60, Appendix A, Reference Methods 1-5.
B. Site Description
A total of three boilers were tested for compliance status withregards to SCAQMD Rule #1146 (Table 1):
Table 1. Boiler Information
Boiler No./Manufacturer Fuel Size
Bldg 672 #1 NaturalAjax Boiler Co. Gas 5-10 million BTU/hr
Bldg 249 #1/ NaturalKewanee Scotch Generator Gas 5-10 million BTU/hr
Bldg 716 #4/ NaturalErie City Iron Works Gas > 10 million BTU/hr
or Oil
1

The water jacket type boilers are used intermittently, depending ondemand, to produce steam and water. Steam/hot water had to be vented/discharged from the boilers during the tests to maintain constant operation.Sampling ports were installed prior to the arrival of the survey team.
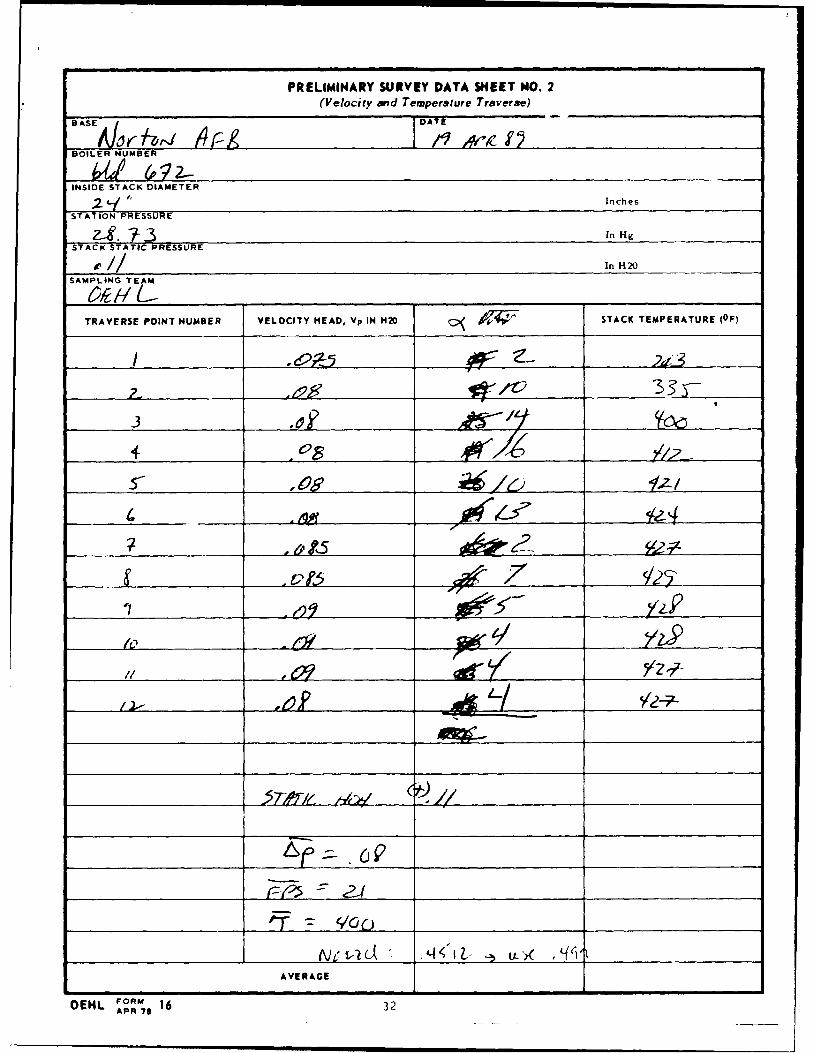
Boiler No. 1, located in building 672 (Figure 1), produces hot waterfor an adjacent aircraft washrack. Since the boiler works on an intermittentdemand schedule, hot water had to be continuously discharged through thewashrack to maintain uninterrupted high-fire operation while testing was inprogress. Sampling ports were located approximately 0.5 stack diametersupstream of the stack outlet and 4 stack diameters downstream of the boiler.
Boiler No. 1, located in building 249 (Figure 2), produces steam forthe Photo Processing Lab complex. Since this boiler also works on anintermittent demand schedule, steam had to be continuously vented throughsafety valves to maintain uninterrupted high-fire operation while testing wasin progress. Sampling ports were located approximately 6 stack diametersupstream of the stack outlet and 2 stack diameters downstream of the nearestairflow obstruction.
Boiler No. 4, located in building 716, produces hot water for much ofthe main base. Since this boiler also works on an intermittent demandschedule, steam had to be continuously vented through safety valves tomaintain uninterrupted high-fire operation while testing was in progress.Sampling ports were located approximately 2 stack diameters upstream of thestack outlet and 3 stack diameters downstream of the nearest airflowobstruction. This boiler was tested twice utilizing different fuels: naturalgas and fuel oil. Natural gas is the normal fuel, however, fuel oil isavailable as a backup.
Gaseous discharge from building 716 boiler No. 4 stack was found tohave cyclonical flow with an average rotation angle of 21.6 degrees. Sinceapplicable test methods require that the rotation angle be 20 degrees or less,this condition had to be corrected by installing temporary straightenersbefore testing could be conducted. Straighteners made from sheet metal werefashioned and installed by Mr Frank Sage and his crew. After modification theaverage rotation angle was found to be in compliance with the test methodcriteria.
C. Applicable Limits
The limits identified in SCAQMD Rule #1146 along with the applicablecompliance dates are presented in Table 2.
2

Figure 1. Boiler Stack During Testing, Bldg 672
3

FietS
Figure 2. Boiler Stack, Bldg 249

Table 2. SCAQND Rule #1146 Standards
Boiler Appliable Standard Compliance Date
Bldg 672 #1 NOX - 40 ppm 1 Mar 92CO - 400 ppm
Bldg 249 #1 NOx - 40 ppm 1 Mar 92CO - 400 ppm
Bldg 716 #4 NOx - 40 ppm 1 Sep 91CO - 400 ppm
D. Sampling Methods and Procedures
The SCAQMD Rule #1146 requires that all emissions tests be conductedin accordance with the procedures and analytical methods specified in 40 CFR60, Appendix A, Methods 1-5, 7 and 10. Therefore, test methods, equipment,sample train preparation, sampling and recovery, calibration requirements, andquality assurance were done in accordance with the methods and proceduresoutlined in 40 CFR 60, Appendix A.
The boiler exhaust stack, in each of the three cases, was a straightduct. Sampling ports were already in place and met the minimum standards formethod 1. Based on the port location, stack diameter and type of sample(particulate), a maximum of 24 traverse points were used for each emissionevaluation.
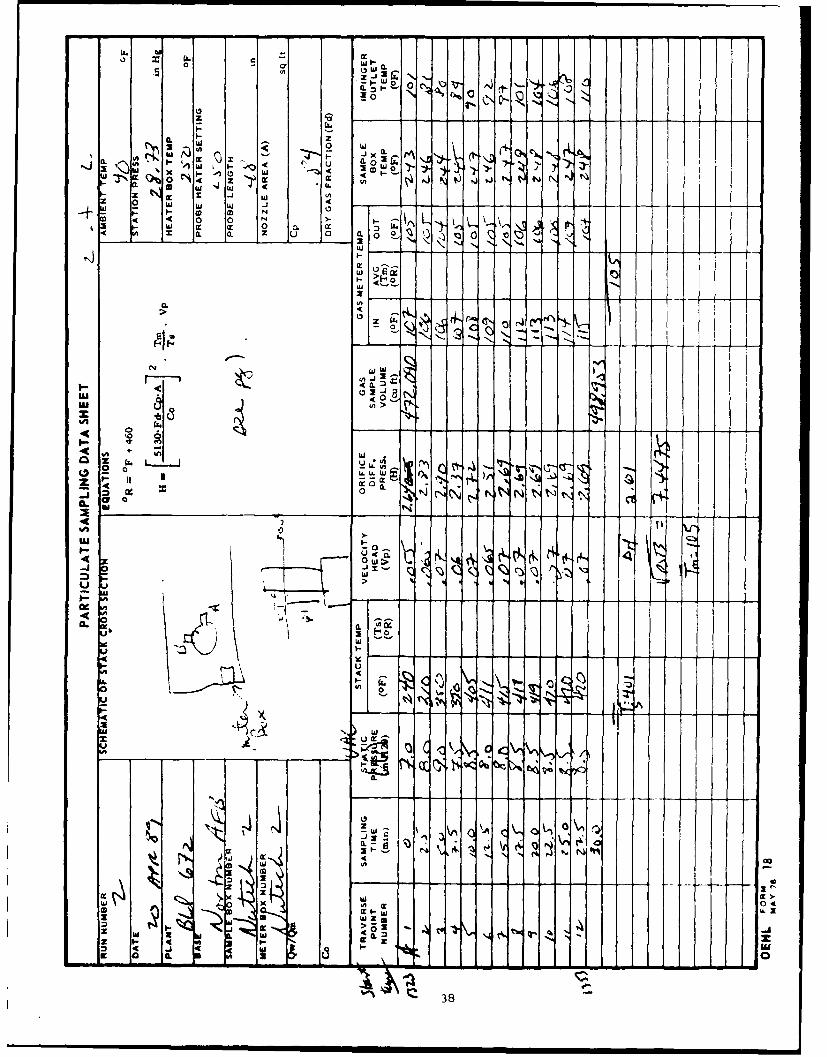
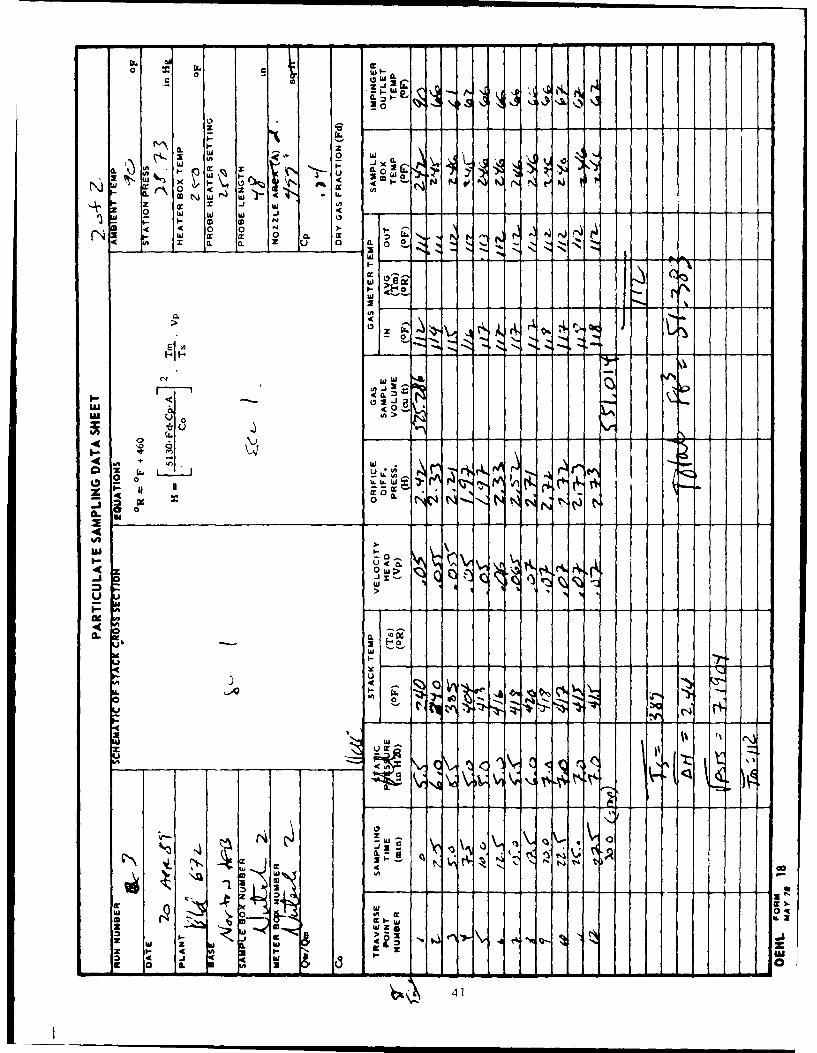
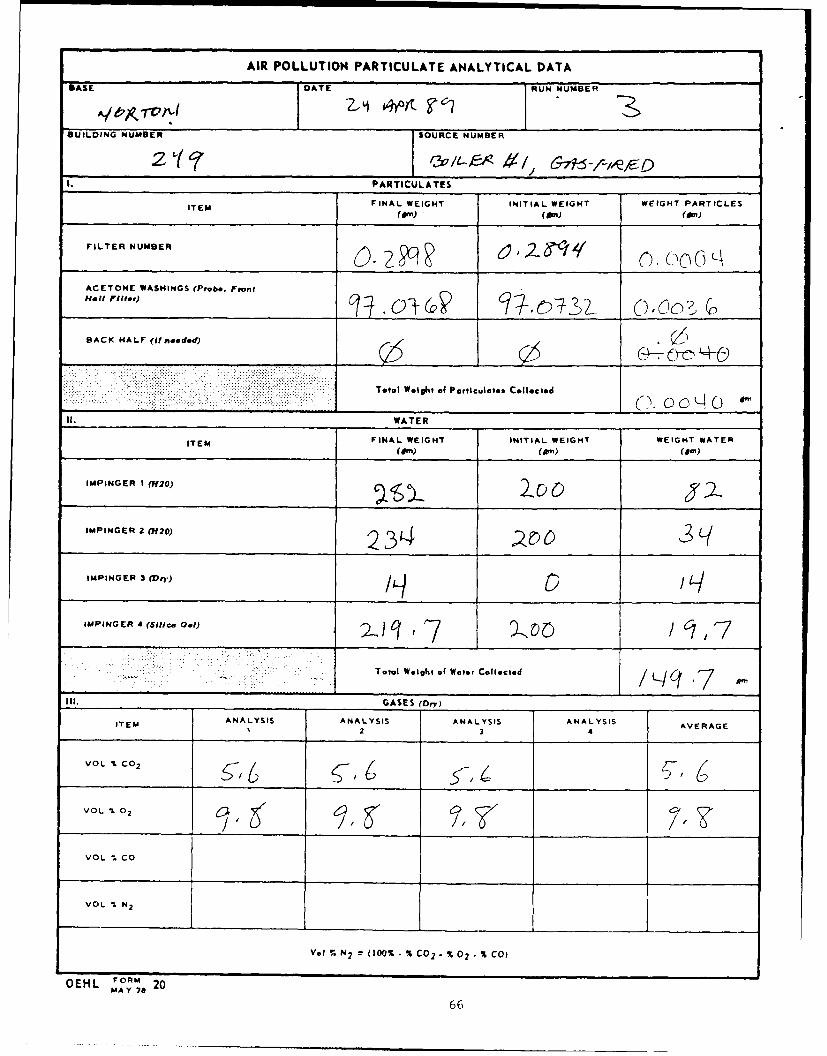
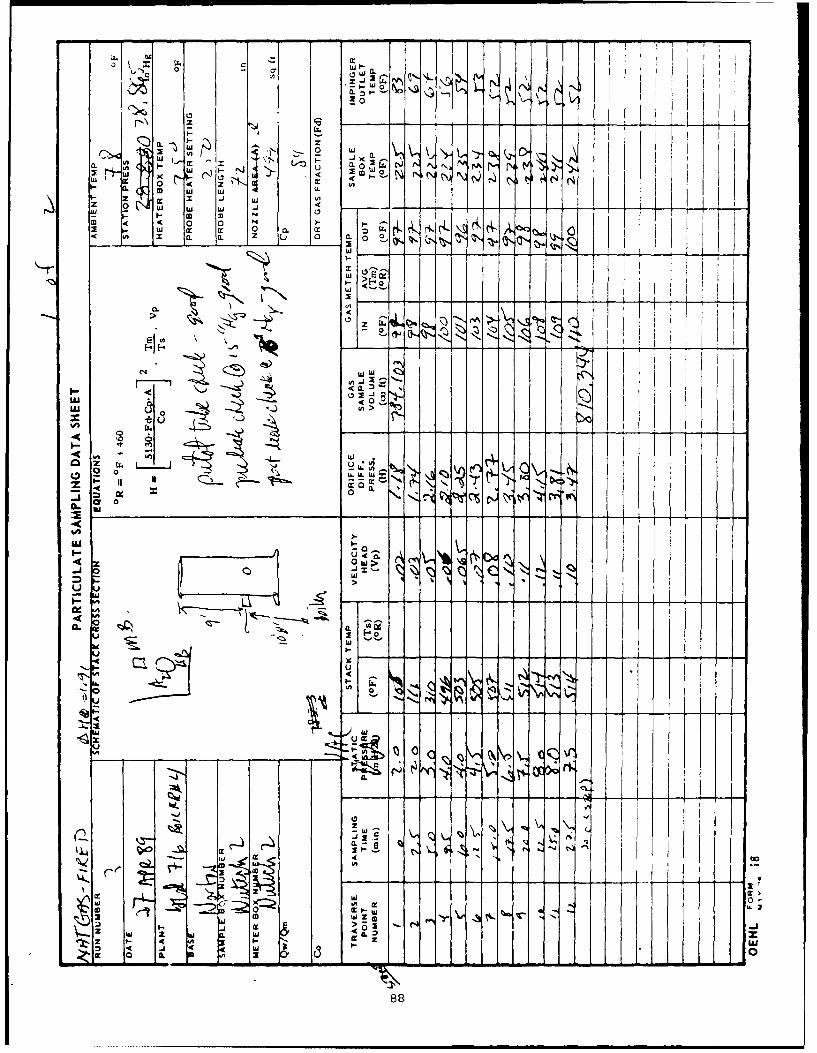
Particulate samples were collected using the sampling train shown inFigure 3. The train consisted of a buttonhook probe nozzle, heated inconelprobe, heated glass filter, impingers, and pumping and metering device. Thenozzel was sized prior to each test so that the gas stream could be sampledisokinetically; in other words, the velocity of the gas at the nozzel tip wasthe same as the stack gas velocity at each point sampled. Flue gas velocitypressure was measured at the nozzle tip, using a Type-S pitot tube connectedto a 10-inch inclined-vertical manometer.
Type K thermocouples were used to measure flue gas and sampling traintemperatures. The probe and filter were heated to minimize moisturecondensation. The heated filter was used to collect particulate material.The impinger train (first, third, and fourth impingers were modifiedGreenburg-Smith type; the second impinger was a standard Greenburg-Smithdesign) acted as a condenser to collect stack gas moisture. The pumping andmetering system was used to control and monitor the flue gas flow rate as wellas the sampling rate.
Each sampling run lasted 60 minutes; therefore, the sampling time foreach of the 24 traverse points was 2.5 minutes. These sample times wereapplicable for all runs. All runs were within the required isokinetic rate.
5
-Jj
>- <
(n faCL CL
tuj
U..
0 'u0
cr 46

Prior to each sample run on a stack, a preliminary velocity pressuretraverse was accomplished and cyclonic flow was determined. For acceptableflow conditions to exist in a stack, the average of the absolute value of theflow angle (cyclonicity) taken at each traverse point must be less than orequal to 20 degrees. The flow angle for the boilers located in buildings 672,249 and 716 were 7.6, 5.4, and 6.5 (after modification), respectively.
During each sample run, a flue gas grab sample for ORSAT analysis(measures oxygen and carbon dioxide for stack gas molecular weightdetermination and emissions correction) was taken. ORSAT sampling andanalysis equipment are shown in Figures 4 and 5. Flue gas moisture content,also needed for determination of gas molecular weight, was obtained duringparticulate sampling.
Emission calculations were done using "Source Test Calculation andCheck Programs for Hewlett-Packard 41 Calculators" (EPA-340/1-85-018)developed by the EPA Office of Air Quality Planning and Standards, ResearchTriangle Park NC. This is our standard method for calculating emissionsdata. Calibration data are presented in Appendix I.
Oxides of nitrogen samples were collected using the sampling trainshown in Figure 6. The train consisted of a glass probe packed with glasswool and wrapped with a heating system, T-bore stopcocks, 2-Liter flask,vacuum gauge, squeeze bulb, and evacuation pump. The sample is removed by agrab sampling technique. It is captured in a 2-Liter flask which has beenevacuated and contains an absorbing solution of hydrogen peroxide and sulfuricacid. The absorbing solution converts the NOX (except nitrous oxide (N20)) inthe captured gas to nitric acid (HNO3 ) in solution. NOX sampling wasconducted concurrently with particulate sampling. Type K thermocouples wereused to measure the sample temperature. Calibration Data are presented inAppendix I.
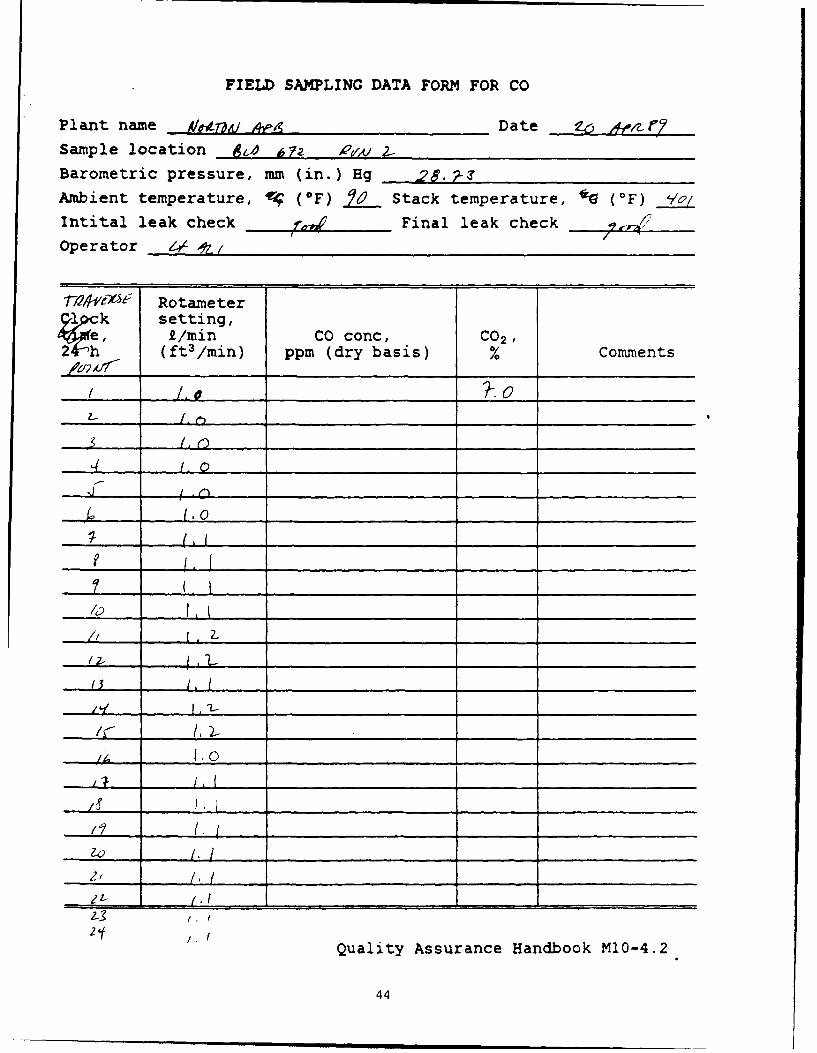
Carbon monoxide samples were collected using the sampling train shownin Figure 7. The i.Lain consisted of a stainless steel sample probe packedwith glass wool, a condenser, a rotometer, a sample bag, an evacuationcontainer and evacuation pump. An integrated sample was collected byevacuating the evacuation container, which caused a negative pressure,pulling a sample into the sample bag. The rate of flow into the sample bagwas monitored and adjusted (using the evacuation pump) to remain proportionalto the stack flowrate. Prior to connecting the sample bag to the probe, theprobe was purged with stack gases. Calibration data are presented inAppendix I.
III. CONCLUSIONS
1. Particulate Emission Rate (EPA Method 5)
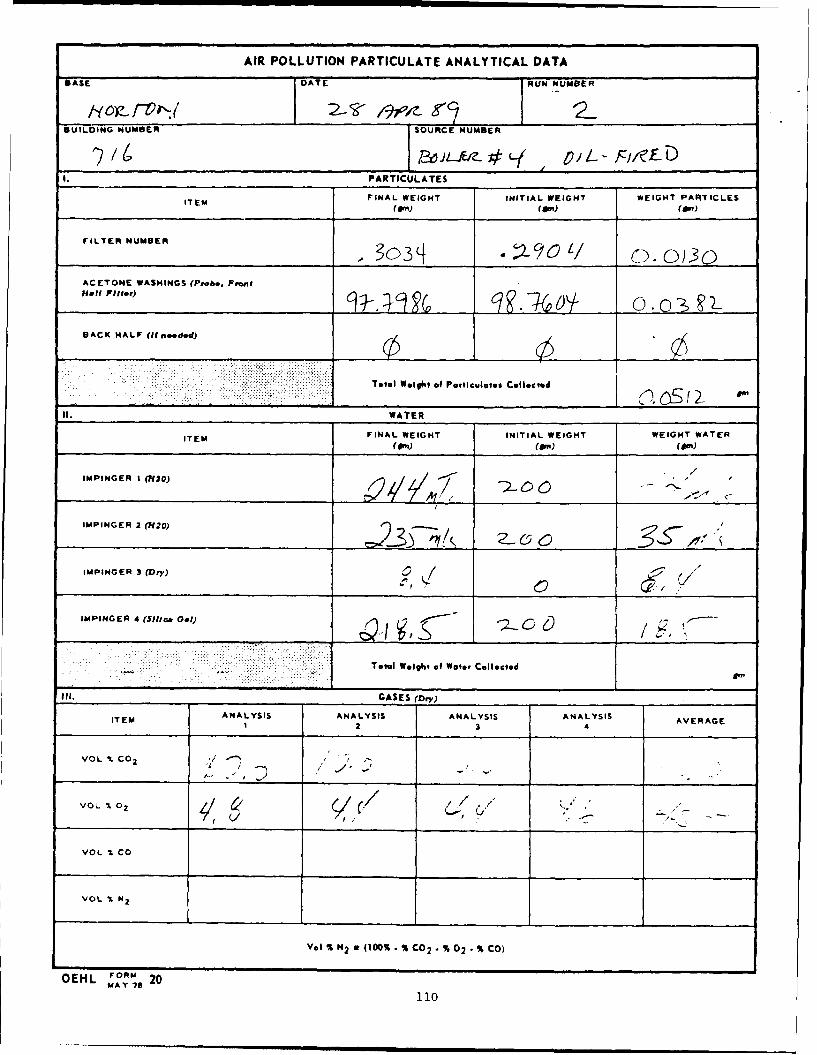
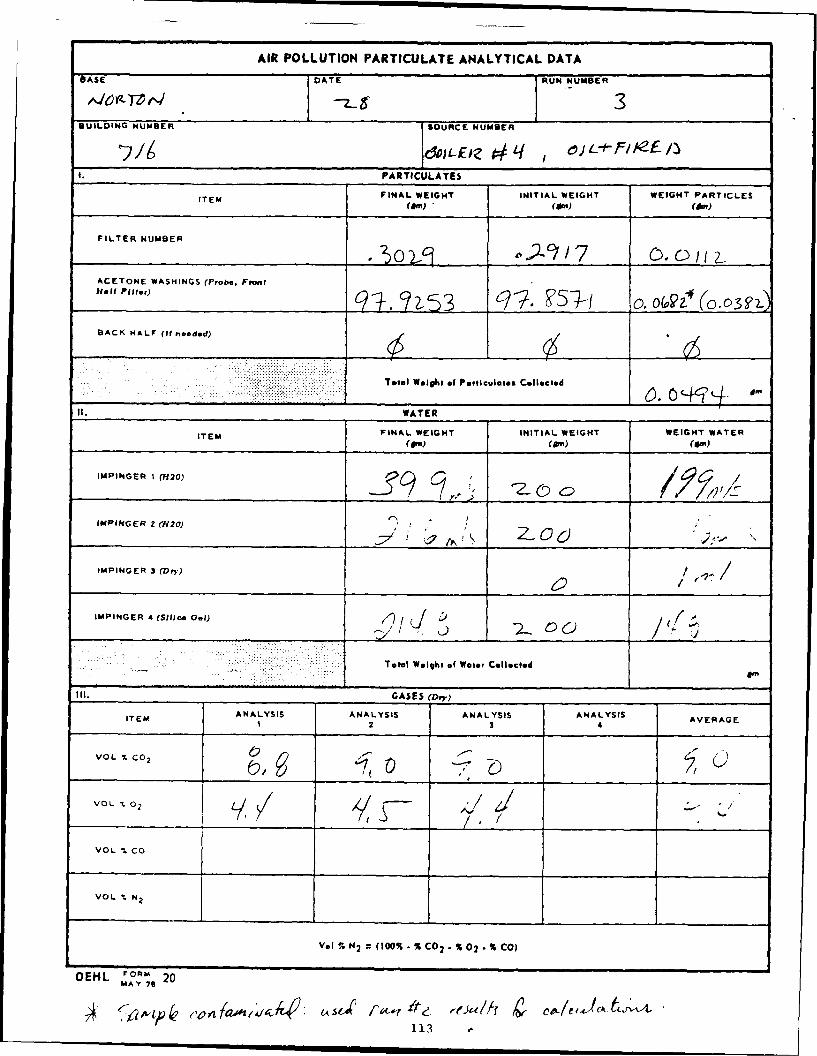
Table 3 provides the particulate emission rates determined from thesetests. Results indicate the three runs conducted on boiler 716/4 utilizingfuel oil emitted approximately five times the particulates generated by thethree runs which used natural gas. However, the emission levels for all thetests were low and should rot cause the base any problems. Calculations forparticulate emissions are presented in Appendix H.
7
PROBE FLEXIBLE TUBING
"- TO ANALYZER
FILTER (GLASS WOOL)
SQUEEZE BULB
Figure 4. ORSAT Grab Sampling Train
ORSAT
SAMPLEINLET =
CO 0, co, LEVELINGBOTTLE
SIDE VIEWOF TYPICAL
PIPETTE ABSORBER
Figure 5. ORSAT Apparatus
8

EVACUATE EVACUATE 9PURGE VENT
THEROMET (?PUMP VALVE
SQUEEZE BULB
2 LITR FLSK- MANOMETER
FOAM ENCASEMENT
Figure 6. Sampling Train for Oxides of Nitrogen
RATE14ETER
VALVE
F I-LTERQUICK DISCONNECT
(GLAS WOOLPUMP
AIRTIGHT _________
CONTAINER
Figure 7. Carbon Monoxide Sampling Train
9

Table 3. Stack Emission Particulate Test Results
Boiler Run Particulate EmissionsDate No. No. (gr/dscf) (mg/m ) (lb/hr) (kg/hr)
19 APR 89 672/1 1 3.2998E-6 0.0076 0.0001 2.5454E-520 APR 89 672/1 2 2.1580E-6 0.0049 3.4479E-5 1.5640E-520 APR 89 672/1 3 2.2852E-6 0.0052 3.5101E-5 1.5922E-5Average of Runs 1,2,3 7.TUF3 T= 562E T.9005 E
24 APR 89 249/1 1 2.3241E-6 0.0053 3.3506E-5 1.5198E-524 APR 89 249/1 2 1.6322E-6 0.0037 2.2426E-5 1.0172E-524 APR 89 249/1 3 1.5729E-6 0.0036 2.1450E-5 9.7296E-6Average of Runs 1,2,3 T.8T34E 1-7TT-4170ET
27 APR 89 716/41 1 4.5218E-6 0.0103 0.0002 0.000127 APR 89 716/41 2 2.7274E-6 0.0062 0.0001 0.000127 APR 89 716/41 3 2.8044E-6 0.0064 0.0001 0.0001Average of Runs 1,2,3 391E- 6= 0.0001" T=
28 APR 89 716/42 1 1.6523E-5 0.0378 0.0007 0.000328 APR 89 716/42 2 1.7848E-5 0.0408 0.0008 0.000428 APR 89 716/42 3 1.6095E-5 0.0368 0.0007 0.0003Average of Runs 1,2,3 18E- UM 0TT-=
Note: gr/djcf = grains per dry standard cubic footmg/m = milligrams per cubic meterlb/hr = pounds per hourkg/hr = kilograms per hour
1 = natural gas burned as fuel2 = diesel fuel #2 burned as fuel
2. Carbon Monoxide (EPA Method 10)
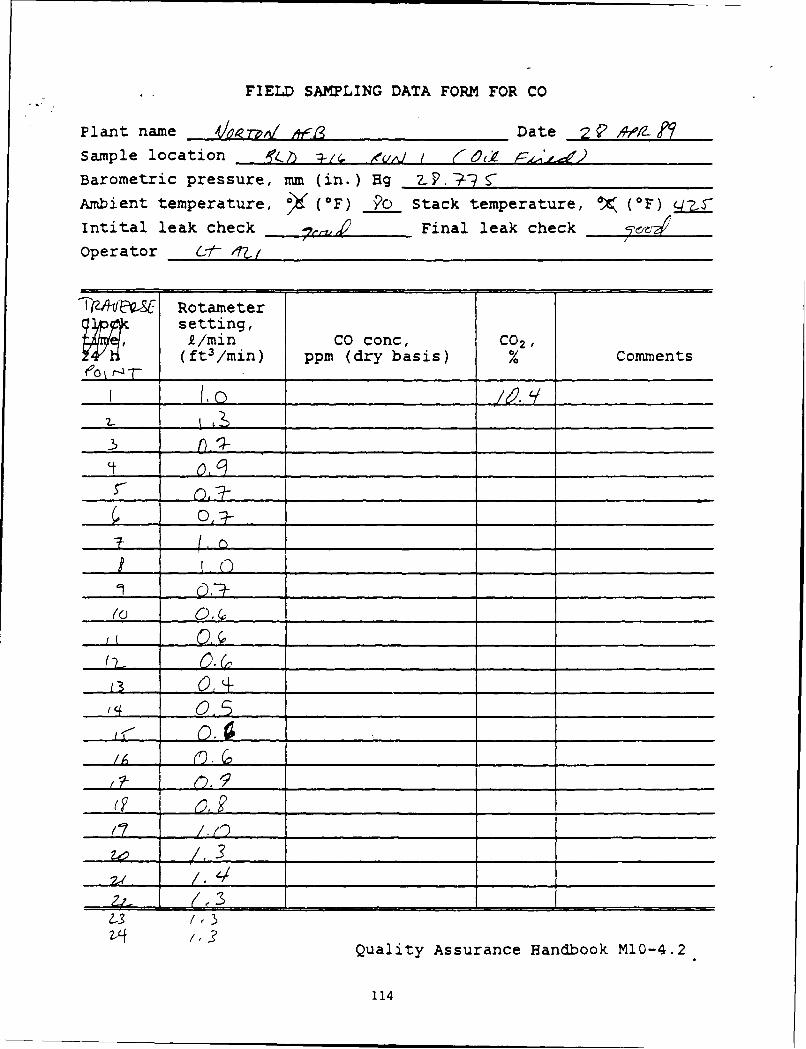
Table 4 provides the carbon monoxide emission concentrationsdetermined from these tests. Results indicate that carbon monoxide emissionsfrom the third run conducted on boiler 716/4 (utilizing natural gas as a fuel)did not meet the limit of 400 ppm. However, this is of little consequencesince the average of three runs constitutes one test. The average of thethree runs, 197.72 ppm, was well below the standard. All other boileremissions were found to be well below the SCAQMD Rule #1146 limit of 400 ppm.Calculations for carbon monoxide emissions are presented in Appendix H.
10

Table 4. Stack Emission Carbon Monoxide Test Results
Boiler Run Concentration Conc. Conc. CorrectedDate No. No. CO2 (percent) CO (ppm) CO (ppm) Average
19 Apr 672/1 1 4.3 10 9.5720 Apr 672/1 2 7.0 10 9.3020 Apr 672/1 3 7.0 10 9.30 9.39
24 Apr 249/1 1 6.0 <10 <9.4024 Apr 249/1 2 5.2 <10 <9.4824 Apr 249/1 3 5.6 <10 <9.44 9.44
27 Apr 716/41 1 9.0 65 59.1527 Apr 716/41 2 7.0 10 9.3127 Apr 716/41 3 9.0 570 518.70 195.72
28 Apr 716/42 1 10.4 <10 <8.9628 Apr 716/42 2 10.0 <10 <9.0028 Apr 716/42 3 9.0 <10 <9.10 9.02
note: 1 = natural gas burned as fuel
2 = diesel fuel #2 burned as fuel
3. Oxides of Nitrogen (EPA Method 7)
Table 5 provides the oxides of nitrogen emission concentrationsdetermined from these tests. Results show that emissions from all boilerstested do not meet the SCAQMD Rule #1146 limit of 40 ppm. Further, theburning of diesel fuel #2 in boiler 716 produced 83 percent more NO than theburning of natural gas. Conditions which favor NOx formation are high flametemperature, long residence time and excess oxygen. Calculations for oxidesof nitrogen emissions are presented in Appendix H.
Two methods of reducing NOx emissions are to change fuels and/or modifythe combustion system. As can be seen in Table 5, gas combustion produces theleast NOx emissions. An obvious combustion modification for NOx control is toreduce excess air. This will reduce NO, formation from nitrogen found in theair. Reducing combustion temperature will lower NO formation from nitrogenfound in the fuel itself. Reduction of combustion temperature can beaccomplished by: (1) eliminating "hot spots" in the combustion gases whererapid mixing of fuels and air occur; (2) reducing rate of combustion byreducing fuel rate or load; and, (3) recirculating flue gas (acts as heat sinkto reduce temperature). Although this may cause effluent CO concentrationlevels to rise, the initial CO concentrations (10-200 ppm) are low compared tothe standard (400 ppm).
11

Table 5. Stack Emission NOx Test Results
Boiler Run Concentration AverageDate No. No. NOx (ppm) Concentration
19 Apr 672/1 1 4520 Apr 672/1 2 4220 Apr 672/1 3 41 43
24 Apr 249/1 1 3824 Apr 249/1 2 4124 Apr 249/1 3 45 41
27 Apr 716/41 1 7527 Apr 716/41 2 5627 Apr 716/41 3 53 62
28 Apr 716/42 1 11328 Apr 716/42 2 10728 Apr 716/42 3 110 110
note: 1 = natural gas used as fuel2 = diesel fuel #2 burned as fuel
IV. RECOMMENDATIONS
We recommend that each boiler be retested with the operational parameterssuch as flame temperature and excess oxygen decreased to retard NOx formation.
References
1. "Standards of Performance for New Stationary Sources," Title 40, Part 60,Code of Federal Regulations, July 1, 1987.
2. Quality Assurance Handbook for Air Pollution Measurement Systems - VolumeIII, Stationary Source Specific Methods, U.S. Environmental ProtectionAgency, EPA-600/4-77-027-b, Research Triangle Park, North Carolina,December 1984.
3. Source Test Calculation and Check Programs for Hewlett-Packard 41Calculators. U.S. Environmental Protection Agency, EPA-340/1-85-018,Research Triangle Park, North Carolina, May 1987.
4. Brenchly, D.L., et al, "Industrial Source Sampling," Ann Arbor SciencePublishers Co., Ann Arbor, Michigan, 1973.
12

APPENDIX A
PERSONNEL INFORMATION
13

(This page left blank)
14
List of TOY Personnel
1. AFOEHL Sampling Team:
Maj James A. Garrison, Chief, Air Quality FunctionCapt Ronald W. Vaughn, Consultant, Environmental QualityiLt Charles W. Attebery, Consultant Environmental Quality1Lt Ali Y. Ali, Consultant, Industrial HygieneSgt Robert P. Davis, Technician, Environmental QualitySgt Harrold D. Casey, Technician, Environmental Quality
2. Norton AFB On-Site Representatives:
Capt Richard Matta, USAF Clinic/SGPB2Lt Krista Wenzel, USAF Clinic/SGPBMr Frank Sage, 63 CES/DEMUH
i5

(This page left blank)
16

APPENDIX B
South Coast Air Quality Management
District Rule No. 1146
17

(This page left blank)
18

I'
(Adopted September 9, 1988)
RULE 1146. EMISSIONS OF OXIDES OF NITROGEN FROM INDUSTRIAL,INSTITUTIONAL AND COMMERCIAL BOILERS, STEAMGENERATORS, AND PROCESS HEATERS
(a) Definitions
(1) Annual Heat Input means the actual amount of heat released by fuels
burned in a unit during a calendar year.
(2) Boiler or Steam Generator means any combustion equipment fired with
liquid and/or gaseous fuel and used to produce steam or to heat water
and that is not used exclusively to produce electricity for sale. Boiler orSteam Generator does not include any waste heat recovery boiler that is
used to recover sensible heat from the exhaust of a combustion turbine or
any unfired waste heat recovery boiler that is used to recover sensible
heat from the exhaust of any combustion equipment.
(3) BTU means British thermal unit.
(4) Heat Input means the chemical heat released due to fuel combustion in a
unit, using the higher heating value of the fuel. This does not include the
sensible heat of incoming combustion air.
(5) NOx Emissions means the sum of nitric oxides and nitrogen dioxide in the
flue gas, collectively expressed as nitrogen dioxide and averaged over a
period of 15 minutes.
(6) Process Heater means any combustion equipment fired with liquid
and/or gaseous fuel and which transfers heat from combustion gases towater or process streams. Process Heater does not include any kiln or
oven used for drying, baking, cooking, calcining, or vitrifying; or any
unfired waste heat recovery heater that is used to recover sensible heatfrom the exhaust of any combustion equipment.
(7) Rated Heat Input Capacity means the heat input capacity specified on the
nameplate of the *combustion unit. If the combustion unit has been
altered or modified such that its maximum heat input is different than the
heat input capacity specified on the nameplate, the new maximum heatinput shall be considered as the rated heat input capacity.
(8) Therm means 100,000 Btu's.
19

'. AT
Rule 1146 (Cont.) (Adopted September 9, 1988)
(9) Unit means any boiler, steam generator, or process heater as defined insubparagraph (2) or (6) of this paragraph.
(b) ApplicabilityWith the exception of boilers used by electric utilities to generate electricity, and
boilers and process heaters with a rated heat input greater than 40 million Btuperhour that are used in petroleum refineries, this rule applies to boilers, steam
generators, and process heaters used in all industrial, institutional, andcommercial operations.
(c) Requirements(1) The owner or operator of any unit(s) shall not discharge into the
atmosphere oxides of nitrogen, expressed as nitrogen dioxide (NO 2 ), inexcess of the concentrations shown in the following table.
GaseousRated Heat or LiquidInput Capacity Annual Heat Input Fuels
Equal to or Greater than 9 40 ppmgreater than And x 10' Btu's per yr (0.05 lb per5 million Btu's (90,000 106 Btu'sper hour Therms) of heat
input)
Carbon monoxide (CO) emissions from unit(s) subject to thissubparagraph shall not exceed 400 ppm.
(2) Any unit(s) with a rated heat input capacity greater than or equal to 5
million Btu per hour and an annual heat input less than or equal to 9.0 x10⁹ Btu per year shall:(A) be operated in a manner that maintains stack gas oxygen
concentrations at' less than or equal to 3 percent on a dry basis for
any 15-consecutive-minute averaging period; or(B) be operated with a stack gas oxygen trim system; or
(C) be tuned at least twice per year, once during the Spring and onceduring the Autumn, by a technician who is qualified, to the
20

Rule 1146 (Cozit.) (Adopted September 9, 1988)(
satisfaction of the Executive Officer, to perform a tune-up inaccordance with the procedure described in Attachment 1. The
owner or operator of any unit(s) who specifies the semi-annualtune-up option shall submit an annual report verifying that the
tune-up has been performed. The report shall contain any otherinformation or documentation that the Executive Officerdetermines to be necessary; or
(D) be operated in compliance with the applicable emission levels
specified in subparagraph (c)(1).
(3) The owner or operator of any unit(s) subject to subparagraph (c)(2) shall
submit for the approval of the Executive Officer a plan that demonstrates
compliance with subparagraph (c)(2). Such plan shall contain:
(A) A list of all units with the rated heat input capacity and anticipated
annual heat input.
(B) For each unit listed, a selection of one of the four options specified
in subparagraph (c)(2) to achieve compliance with this rule.
(4) Any unit(s) with a rated heat input capacity greater than or equal to 40
million Btu per hour and an annual heat input greater than 200 x 109 Btu
per year, or any units that are part of an Alternative Emission Control
Plan, shall have a continuous in-stack nitrogen oxides monitor or
equivalent verification system as approved by the Executive Officer.
Records shall be maintained and made accessible for a period of two
years in a form and manner as specified by the Executive Officer.
(d) Alternative Emission Control Plan
(1) An owner or operator may achieve compliance with paragraph (c) by
achieving equivalent nitrogen oxides emissions reductions obtained by
alternative control methods provided the applicant submits an
Alternative Emission Control Plan that is enforceable by the District and
receives approval of the Plan in writing from the Executive Officer prior
to implementation. The Alternative Emission Control Plan shall:
(A) Contain, as a minimum, all data, records, and other information
necessary to determine eligibility for alternative emission control,
including but not limited to:
21

Rule 1146 (Cont.) (Adopted September 9, 1988)
(i) A list of equipment subject to alternative emission
control;(ii) Daily hours of utilization for applicable equipment;(iii) Estimated emission of nitrogen oxides for each
operation;(iv) Rated capacity; and
(v) Historical and projected fuel use.(B) Present the methodology for estimation of equivalency of emission
reductions under the proposed Alternative Emission Control Planas compared to either the emission reductions otherwise requiredby the rule or to actual emissions, whichever is less.
(C) Demonstrate that the permit units subject to the specified ruleemission limitations are in compliance with or on an approvedschedule for compliance with all applicable District rules.
(2) Revision of Control Plan
A revised control plan may be submitted by the owner or operator, alongwith any required permit applications. Such a plan shall adhere to theemissions limits and the final compliance dates of this rule. New units,including functionally identical replacement units, shall not beincorporated into the plan.
(e) Exemptions(1) To qualify for an exemption from the provisions of subparagraph (c)(1),
based on annual heat input, the owner or operator of any unit(s) shall:(A) install by February 1, 1989 or at the time the unit is constructed, a
totalizing meter for each fuel that demonstrates that the unit(s)operated at or below the applicable heat input levels; and
(B) have available for inspection by the Executive Officer by March 1,1989, and March 1, of each year thereafter, annual fuel use datafor the preceding calendar year. Records shall be maintained andmade accessible to the Executive Officer for a period of two years.
(2) An exemption granted for any unit will become null and void if that unit
operates for one calendar year at an annual heat input greater than theannual applicable heat input levels.
22

Rule 1146 (Cont.)' (Adopted September 9, 1988)
(3) Sulfur plant reaction boilers are exempt from the provisions of this rule.
(f') Compliance Determination
(1) An owner or operator of any unit(s) shall have the option of complyingwith either the pound per million Btu or parts per million emission limits
specified in subparagraph (c)(1).(2) All emission determinations shall be made in the as-found operating
condition, except no compliance determination shall be establishedduring start-up, shutdown, or under breakdown conditions.
(3) All parts per million emission limits specified in paragraph (c) arereferenced at 3 percent volume stack gas oxygen on a dry basis averaged
over a minimum of 15 consecutive minutes.(4) Compliance th the NOx emission requirements and the stack gas
oxygen concenti,.. -,.arement of paragraph (c) shall be determined
in a manner approved by the Executive Officer.
(g) Compliance Schedule
The owner or operator of units subject to this rule shall meet the following
increments of progress:
(1) For owners or operators of units subject to subparagraph (c)(2), submit,by September 1, 1989, a plan pursuant to subparagraph (c)(3) and byMarch 1, 1990, demonstrate final compliance with subparagraph (c)(2).
(2) For owners or operators utilizing the Alternative Emission Control Plan,
pursuant to paragraph (d), by September 1, 1989, submit a control plan.
(3) For owners or operators of units with a rated heat input capacity equal to
or greater than 10 million Btu per hour that are subject to subparagraph(c)(1), including those with an approved Alternative Emission Control
Plan;(A) By March 1, 1990, submit required applications for permits to
construct and operate.
(B) By September 1, 1991 demonstrate compliance with subparagraph(c)(1) and, if applicable, subparagraph (c)(4).
23

Rule 1146 (Cont.) (Adopted September 9, 1988)
(4) For owners or operators of units with a rated heat input capacity equal toor greater than 5 million Btu per hour, but less than 10 million Btu perhour, that are subject to subparagraph (c)(1):(A) By March 1, 1991, submit required applications for permits to
construct and operate.(B) By March 1, 1992, demonstrate compliance with subparagraph
(c)( 1).
24

. o
Rule 1146 (Cont.) (Adopted September 9, 1988)
ATTACHMENT 1
Equipment Tuning Procedure1
Nothing in this Equipment Tuning Procedure shall be construed to require any act oromission that would result in unsafe conditions or would be in violation of anyregulation or requirement established by Factory Mutual, Industrial Risk Insurors,
National Fire Prevention Association, the California Department of IndustrialRelations (Occupational Safety and Health Division), the Federal Occupational Safety
and Health Administration, or other relevant regulations and requirements.1. Operate the unit at the firing rate most typical of normal operation. If the unit
experiences significant load variations during normal operation, operate it at itsaverage firing rate.
2. At this firing rate, record stack gas temperature, oxygen concentration, and COconcentration (for gaseous fuels) or smoke-spot number2 (for liquid fuels), andobserve flame conditions after unit operation stabilizes at the firing rateselected. If the excess oxygen in the stack gas is at the lower end of the range of
typical minimum values 3, and if CO emissions are low and there is not smoke,the unit is probably operating at near optimum efficiency - at this particular
firing rate.
1. This tuning procedure is based on a tune-up procedure developed by KVB,
Inc. for the EPA. This procedure is included in Appendix D.
2. The smoke-spot number can be determined with ASTM Test Method D-2156
or with the Bacharach meth6d. ASTM Test Method D-2156 is included in a tuneup kitthat can be purchased from the Bacharach Company.
3. Typical minimum oxygen levels for boilers at high firing rates are:1. For natural gas: 0.5% - 3%
2. For liquid fuels: 2% - 4%
25

., .
Rule 1146 (Cont.) (Adopted September 9, 1988)
However, complete the remaining portion of this procedure to determine
whether still lower oxygen levels are practical.3. Increase combustion air flow to the furnace until stack gas oxygen levels increase
by one to two percent over the level measured in Step 2. As in Step 2, record thestack gas temperature, CO concentration (for gaseous fuels) or smoke-spotnumber (for liquid fuels), and observe flame conditions for these higher oxygenlevels after boiler operation stabilizes.
4. Decrease combustion air flow until the stack gas oxygen concentration is at thelevel measured in Step 2. From this level gradually reduce the combustion airflow, in small increrii..nts. After each increment, record the stack gastemperature, oxygen concentration, CO concentration (for gaseous fuels) andsmoke-spot number (for liquid fuels). Also observe the flame and record anychanges in its condition.
5. Continue to reduce combustion air flow stepwise, until one of these limits is
reached:
a. Uriacceptable flame conditions - such as flame impingement on furnacewalls or burner parts, excessive flame carryover, or flame instability.
b. Stack gas CO concentrations greater than 400 ppm.
c. Smoking at the stack.
d. Equipment-related limitations - such as low windbox/furnace pressure
differential, built in air-flow limits, etc.6. Develop an 0 2 /CO curve (for gaseous fuels) or 0 2 /smoke curve (for liquid
fuels) similar to those shown in Figures 1 and 2 using the excess oxygen and COor smoke-spot number data obtained at each combustion air flow setting.
7. From the curves prepared in Step 6, find the stack gas oxygen levels where theCO emissions or smoke-spot number equal the following values:Fuel Measurement Valu
Gaseous CO Emissions 400 ppm#1 and #2 oils smoke-spot number number 1
#4 oil srioke-spot number number 2#5 oil smoke-spot number number 3Other oils smoke-spot number number 4
26

Rule 1146 (Cont.) (Adopted September 9, 1988)
The above conditions are referred to as the CO or smoke thresholds, or as the
minimum excess oxygen level.
Compare this minimum value of excess oxygen to the expected value provided by
the combustion unit manufacturer. If the minimum level found is substantially
higher than the value provided by the combustion unit manufacturer, burner
adjustments can probably be made to improve fuel and air mixing, thereby
allowing operation with less air.
8. Add 0.5 to 2.0 percent of the minimum excess oxygen level found in Step 7 and
reset burner controls to operate automatically at this higher stack gas oxygen
level. This margin above the minimum oxygen level accounts for fuel variations,
variations in atmospheric conditions, load changes, and nonrepeatability or play
in automatic controls.
9. If the load of the combustion unit varies significantly during normal operation,
repeat Steps 1-8 for firing rates that represent the upper and lower limits of the
range of the load. Because control adjustments at one firing rate may affect
conditions at other firing rates, it may not be possible to establish the optimum
excess oxygen level at all firing rates. If this is the case, choose the burner
control settings that give best performance over the range of firing rates. If one
firing rate predominates, settings should optimize conditions at that rate.
10. Verify that the new settings can accommodate the sudden load changes that may
occur in daily operation without adverse effects. Do this by increasing and
decreasing load rapidly while observing the flame and stack. If any of the
conditions in Step 5 result, reset the combustion controls to provide a lightly
higher level of excess oxygen at the affected firing rates. Next, verify these new
settings in a similar fashion. Then make sure that the final control settings are
recorded at steady-state operating conditions for future reference.
27

(This page left blank)
28

APPENDIX C
BUILDING 672 BOILER 1 FIELD DATA
29

(This page left blank)
30

DETERMINATION OF MINIMUM NUMBER OF TRAVERSE POINTS
Stack ID: .U *4? Stack diameter at ports: 2_ (ft)
Distance A (ft) . £ (duct diameters) 0. I
Recommended number of traverse points as determined by
distance A: .24
Distance B (ft) 8 (duct diameters) 1-
Recommended number of traverse points as determined by
distance B:
Number of traverse points used: _-
A .5A
301
31
PRELIMINARY SURVEY DATA SHEET NO. 2(Velocity and Temperature Traverse)
BASE4 OATE
BOILER NUMBER
-INSIDE SACK DIAMETER
.2y "I Inches
STATION PRESSURE
ZI 7-3 In HgSTACK STATIC PRESSURE
I/ In H20
SAMPLING TEAM
TRAVERSE POINT NUMBER VELOCITY HEAD, Vp IN M20 STACK TEMPERATURE (OF)
2I .61? __ __ __ __ __
3 .or ,, rca
_ _ _ _ _ _ _ _ _ _ _ _ _ - _ _ " _ _ _" _ _._ _ _ _ #,2.g
OEHLT /6. 16 3
APR "78

PRELIMINARY SURVEY DATA SHEET NO. 1
(Stack Geometry)
BASE PLANT
A/0 A 13L D: 672 ," o7,A sozcDATE SAMPLING TEA-
/9 ,Wr- Py 4/SOURCE TYPE AND MAKE
11OURCE NUMBER IRS1DE STACK DIAMETER
/&9&AA 47 z 1 -- InchesRELATEo C APACITY TYPE FUEL
DISTANCE FROM OUTSIDE OF NIPPLE TO INSIDE DIAMETER
(/'z InchesNUMBER OF TRAVERSES NUMBER OF POINTS,TR AVERSE
I IN M PI
_______________LOCATION OF SAMPLING POINTS ALONG TRAVERSE
PERCENT OF DISTANCE FROM TOTAL DISTANCE FROM OUTSIDE
POINT DIAMETER INSIDE WALL OF NIPPLE TO SAMPLING POINT
(Inches) (inches)
t c,5" _____, _______
___,_ _ /9,3
_q, 3 /o,?
7 /5, ,
__ __ _/ 9.0 6Y'
/9 7 21,2
____ ____ 21.2 2777__ _ 23.S- 3o0
OEHL FORM" 15.3APR ?a33

0 c W
00
w -'-4IM- qa , -,-
Ix 0 VCc
I- M CD
< 0 1w cr 0~2
w w Ia
I-
N N_
I LPl
II - -
'A w
2
a.-
"II
I-
z W2 IQz
.J CA
\~4L

0 - UC I T
00
2CI0- cr xa
uJ w 0
0- 1. wN
In .9 0 0~ 2L U 00w~ cc x 0 a
w IQ
0.LU
CL~- C -IF
-CuC
<0
UA u 0
U. LL W~'
LIu04
-J IN ~ WNJi
_J X
43-
4C -)IX .2 i-
z .' go
0. N
w x z
x0
- - - - -\ -, I. -" - -T L9- It 4A( (-i 2 hx- 4i .9- ........
-~3
5
0i9

AIR POLLUTION PARTICULATE ANALYTICAL DATA
-ASE DATE RUN NUMBER
BUILDING NUMBER SOURCE NUMBER
PARTICULATES
ITMFINAL WEIGHT INITIAL WEIGHT WEIGHT PARTICLES
FILTER NUMBER 2 CC(e
ACETONE WASHINGS (Probe FrontHall Filter) Y9
BACK HALF IIneeded)/
Total Weigh~t of Particulates Collected
II. WATER
ITMFINAL WEIGHT INITIAL WEIGHT WEIGHT WATER
IM IGE (H20)
'"" SlGest 0.7) 2 c2 /,001)
Total Weighat of Water Collected a
III. ~~~~GASES (Dry) __________
ITMAAYI NLSSANALYSIS ANALYSIS AVERAGE12 3
VOL_ -%~ 02__ /__
Val %N 2 a(tO0t. CO 2 . S 02 % CO)
AMD FE8 651 REPLACES OEtIL 20, MAY 78, WHICH IS OBSOLETE.

0 ~ CLc 'I
CL I
*z1
.IJ S
0.
ii I.. 0
X 0 Ic zJ iicar,
2 w 4 _
w cr 0 CL mzA a u 0r a. NC
4 u~I ~.a 2~ o a
vthI-
>J.
<u
Cu
.4-.-_j&
>. k -
-< 0usI '
4L4 o
w. A.n 04PNIm I
s-sM
luJ
I-J
0
C3C
a
-,r, v
co4
zI
xMIU 0 r %L
0 OL 0I
£3
Lt - w a - - --- wa
0 -. IL
"12 g%. c"o N
z-
a. z
- xN --w -I- w ~ U ~ '~
'. -Q -F 4z tQ 0 uJ w)0 w w w -
wi r F 0 ( r
C. In. Q>-K
< ----- I---.6 u
I-.
a~
eul _t: -
- ~ J X
wwI- -o
'n 'r4;-J ~ 0
I-. ~ I1w------------------------------
u c
I - - -, -v------
2
cr IF-- 9.w ~ 'A
I>. Z w cc>
> 04
z 1 1-
- 0- - -
38 1 A I -I

AIR POLLUTION PARTICULATE ANALYTICAL DATABASE DATE RUN NUMBER
BUILDING NUMBER SOURCE NUMBER
7 ZY5 -f/ k fI'
PARTICULATES
ITEM FINAL WEIGHT INITIAL WEIGHT WEIGHT PARTICLEs(em) (s') (l
FILTER NUMBER
ACETONE WASHINGS (Probe, FronrHll Filter) 5 5332 o_ o____
BACK HALF (it needed)
Total Weight of Portlculote& Collected
If. WATER
ITEM FINAL WEIGHT INITIAL WEIGHT WEIGHT WATER(() (g)
IMPINGER 2 (H 20)
IMPINGER 3 (Dry) g)
IMPINGER 4 (Sice Ge.) 7 30,7
Total WeIit of Water Collecteda Im
Ill. IIGASES (Dry)
ITEM ANALYSIS ANALYSIS ANALYSIS ANALYSIS AVERAGE1 2 3 4
VOL %, 02O 7 ' 7,.
VOL % 02 6r,6 _ _ _ _ ~
VOL % CO
VOL % N2
Vol N2 * (100% CO2 . ' 0 2 . CO)
AMD FE 651 REPLACES OEHL 20, MAY 78, WHICH IS OBSOLETE
39

0 W C
z S
zzX IL
0
0 0 3A~
4 -0 0 0 S CC ICL w w Ca r
z~A NJ x_-
0.0
w
0.
104
ZZ
0B w
w
of4
- 6 I iZ*
DM r 2 i ,i
ID I- I- w L~~~~~~~~~~~ Z . a '.... ----- .- - - 1
CZC.
W 0 A'CC
z w~' x w
0 * w w --- - -
w r 0 Ix (I10~ 1' 1 a
I
I-..
ww
JO- 0
+ I-
I- r
D C
J
12-I
44
I-
u4- 0A
_ ~2-g -~. (L i
w go
>2~aw z hi£
J Ic 4
41

AIR POLLUTION PARTICULATE ANALYTICAL DATA
BASE tDATE RUN NUMBER
IBUILOING NUMBER SOURCE NUMBER
1. PARTICULATES
ITEM FINAL WEIGHT INITIAL WEIGHT WEIGHT PARTICLES(9) (am) (9m)
FILTER NUMBERc.2 7N {/
ACETONE WASHINGS (Probe, FrontHall Filter)
BACK HALF (If needed)
Total Weight of Paticulates Collected 9
II. WATER
ITEM FINAL WEIGHT INITIAL WEIGHT WEIGHT WATER
(am) (9'm) (a)
IMPINGER I (H20)7 Lq
IMPINGER 2 (20) 3 )
IMPINGER 3 (Dry) 2-
IMPINGER 4 (Silica 0el)- 34
Total WeIght of Water Collected ) 3 C 1
Ill. GASES (Dry)
ITEM ANALYSIS ANALYSIS ANALYSIS ANALYSIS AVERAGE1 2 3 4
VOL %.CO2 7 O 7- 70 7,0
VOL %0 20
VOL % CO
VOL % N2
Val % N2 a (100%. CO2 . 02 .CO)
AMD E4 651 REPLACES OEHL 20, MAY 76. WHICH IS OBSOLETE
42

FIELD SAMPLING DATA FORM FOR CO
Plant name iOd -4 , Date / 4~ 4f
Sample location 'lu) C - -- I AA / -
Barometric pressure, mm (in.) Hg 2f.73
Ambient temperature, * (OF) o Stack temperature, ," (OF) Y572Intital leak check Final leak check
Operator (i' 4 &
J 1 7Se1 RotameterCsetting, 2/min CO conc, C02 1
(ft3/min) ppm (dry basis) Comments
' 43
__ __ / ( ,
-3 __ _ __ _ _ _ _ __ __,_ __ _ _
r/_ _ __,._
,_ _ . _ _ _ _ __._ _
"I._11__! _.
_x /.0 __._
QulIyisuaceZaI.O ILUo~,
i ¢ /.43
FIELD SAMPLING DATA FORM FOR CO
Plant name / / Date Z l CZ
Sample location &4 6312 2-
Barometric pressure, mm (in.) Hg 28. 9_T
Ambient temperature, (OF) Stack temperature, *G (OF) Vc'/
Intital leak check Final leak check
Operator I$ fL,
14W%54,X RotameterPk setting,
£e, /min CO conc, C02,(ft3/min) ppm (dry basis) % Comments
/ _ _ _ _ _ _ _ _ _ _ _ _ _ _ _ _ _
2(I
! I.' ___
'Qu1 Assurance Hanboo M10_ 4.2
4/.2'f 'Quality Assurance Handbook Ml0-4.2
44

FIELD SAMPLING DATA FiRM FOR CO
Plant name ,(ergr te Date 20 4 1f P.Sample location Oe t ouJ 3
Barometric pressure, mm (in.) Hg 2.13
Ambient temperature, Ot (OF) lo Stack temperature, " (*F) 5
Intital leak check z Final leak check
Operator 17f 4 j
li'? Rotameterik setting,
k/min CO conc, CO2 ,(ft3/min) ppm (dry basis) % Comments
Ic~o -- _--____
f ., n.
ILc)
7--
(,, _ _ _ _ _ _ _
LZ. __ _ __I,_ _ _ _ _ _
,I ___
Quality Assurance Handbook M10-4.2
45

5-01-79 5 Section 3.6.12
Z
r6
Q C4 N
-q) 0. -
a 1
-- ae.
046

5-01-79 7 Section 3.6.12
'b N
LO N
C LO
C oa
4.
0..ECA.
4 a t7
.- '.~.I47

5-01-79 5 Section 3.6.12
Itc- r--- .~
zz
.,4
7-'
'-r 48 r' '
m A4
:j 7L7
1'4
Z1~ 11,ch*8j
C4z ~

5-01-79 7 Section 3.6.12
(0Z
Sac
Q~ 2b
NN
GI 4
(b 4
lbb4,L
It' _4 (4-t, GO
44.

5-01-79 5 Section 3.6.12
00
f-3
q0
Cn-
cc)i3X 0m
0-
0 '~r-6
InI
(4 )

5-01-79 7 Section 3.6.12
CIL,
-I (
- -K
'.c,
v a
Q.L(3 - _____

(This page left blank)
r 2

APPENDIX D
BUILDING 249 BOILER 1 FIELD DATA
53

(This page left blank)
54
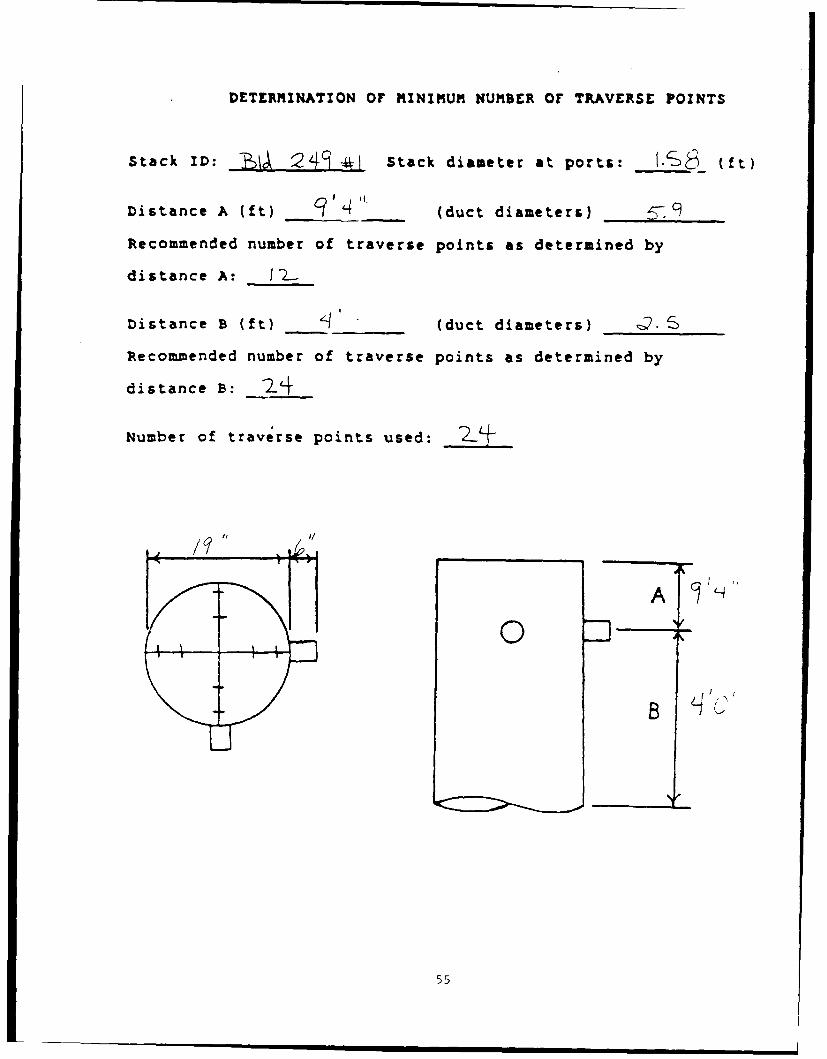
DETERMINATION OF MINIMUM NUMBER Of TRAVERSE POINTS
Stack ID: BA249 Stack diameter at ports: t.6 (f t)
Distance A (ft) q"4 (duct diameters) 5-j9
Recommended number of traverse points as determined by
distance A: 12
Distance B (ft) I (duct diameters) 2.
Recommended number of traverse points as determined by
distance B: 24
Number of traverse points used:
I I
A~L
55

PRELIMINARY SURVEY DATA SHEET NO. 1(Stack Geometry)
ASE/ PLANT
ATE SAMPLING TEAM
DURCE TYPE AND MAKE
.)URCE NUMBER INSIDE STACK'DIAMETER
I jq itInches
ELATED CAPACITY TYPE FUEL
#STANCE FROM OUTSIDE OF NIPPLE TO INSIDE DIAMETER
(0 Inches
UMBER OF TRAVERSES NUMBER OF PO1NTSFTRAVERSE
LOCATION OF SAMPLING POINTS ALONG TRAVERSE
PERCENT OF DISTANCE FROM TOTAL DISTANCE FROM OUTSIDEPOINT DIAMETER INSIDE WALL OF NIPPLE TO SAMPLING POINT
(Inches) (inches)
2 .__ _ _ __ _ _ _7.?
7-4_____ _ ___ ___ 2-
___ __ __ 159
6 56/2.
// _ _ _ _ _._ .,__ _ _-
)EHL r(. 1556

I 'PRELIMINARY SURVEY DATA SHEET NO. 2
(Velocity and Temperature Traverse)BAIJSE /"DATE
U ER
INSIDE STACK DIAMETER
/9 (Inches
STATION PRESSURE
220t' In HgSTACK STATIC PRESSURE
In H20SAMPLING TEAM
TRAVERSE POINT NUMBER VELOCITY HEAD, VP IN H21)0- STACK TEMPERATURE (OF)
f~1 .3 3 -3'3" ._____ ._____"3
_______9 3J__ __ __ _ __ __ __ 3 ] -
__ __I _ _ I0
_ _ _ _ _ _ _--t__ _ _,,__ _ co,/ .f/) 5- ,9'
%q 0 7,
ff
AVERAGE
OEHL '"" 16,r- ,,.57

X j W0
zCL w w r ~ I
LL 0w 14) _
0 0C- (L z C
14jW
LCu
0.~ lip
11~~ -a- - -) --
CL 0
I i-H
0J 0___m __ p_ w
U u58

z J w
k-iC 0 C
N,
0 ~ 0 N )
- - I
0. U,4
L- t-6I-W.
00a
i.4
J4 1)4 ,,4r0w It !
z
U > 0
m mw -
zA w L w &. :cr C:.
3 -.w-- (L MK
.59

AIR POLLUTION PARTICULATE ANALYTICAL DATASASE DATE RUN NUMBER,,1J 0,-k 7-Z, A.J", .'BUILOING NUMBER SOURCE NUMBER
h. PARTICULATES
ITEM FINAL WEIGHT INITIAL WEIGHT WEIGHT PARTICLES(fn) ' (am) (p')
FILTER NUMBER 2
ACETONE WASHINGS (Probe, Front
BACK H A LF (it needed)
Total W.1ighI of Particulates Collected a
II, WATER
ITEM FINAL WEIGHT INITIAL WEIGHT WEIGHT WATER(l ,) (ia) (11mn)
IMPINGER 1 20) 3 5' 2- o & 3-
INP'ING'"R 2 (10) I C) 1/CI
IMPINGER 3 ) /6)
IMPINGER 4 (Stile. o.,) OO/
Total W*Ight of Waer Collected
III. GASES (Dr)
ITEM ANALYSIS ANALYSIS ANALYSIS ANALYSIS AVERAGE1 2 3 4
VOL C02 iK ago
VOL% 02/.,-
VOL % CO
VOL % N 2
Vol % N2 (100% % CO2 . O . CO)
OEHL FORM 20MA0Y 78
60

IL 40 -i rw x, 0 IL 0
2 <
0 -C zN w w - - - - - --uJ x. -j
0 w w- 0 w
< < 0 0. t.
a 0 ~
x a..
IS I~ toor( I
> ~ z
ui 'n >
x .6 CL L..
0-M0
I.-N
a.
ir
0 w-
I- x
Ile 1 - wL

- l mIM-
00
U~ ujW- V4 0 0<
9L z
<. o0 (t
Idj I-
0w.
w
.6
CL~
U5K'
w.w
w ~ 0>
-~ ~ Ia
1 w z a1 34
lC z 0. =
62

AIR POLLUTION PARTICULATE ANALYTICAL DATA
BASE DATE RUN NUMBER
BUILDING NUMBER SOURCE NUMBER
PARTICULATES
ITEM FINAL WEIGHT INITIAL WEIGHT WEIGHT PARTICLES(a) m)(Ia (4m)
FILTER NUMBER 0, ,coC
ACETONE WASHINGS (Probe, FrontHall itr) j . 0 2 . 6 o0 7 (o
BACK HALF (it needed)
Total Weight of Particulate* Collected
II. WATER
ITEM FINAL WEIGHT INITIAL WEIGHT WEIGHT WATER
(Em) (am) (1m)
IMPINGER ( 00) 2 -- 0 0 o-22 0
IMPINGER 2 (,20) Z-L/ -- I3
IMPINGER 3 (Dry)Jo)
IMPINGER 4(Shii. 0.,, 23
Total Weight of Water Collected
aa
Ill. GASES (Dry)
ITEM ANALYSIS ANALYSIS ANALYSIS ANALYSIS AVERAGE1 2 3 4
VOL... %C02
VOL ~.CO
VOL % N 2
Vol % N2 (100% . % CO2 - % 02 . % CO)
OEHL ro 20MA6Y 7
6 1

z III
0 w x~- T. m w N4
x 0 x . m
ww __ - - ---w- .' +~
t- w
U I
40 PgCLAO -~
El
w
-j1 : -O z~C LJD
IIc J-a- -0
Ga>L-4
uj u-
10-
tN-U -: w .1 .
W.
CL- 0~
UJ~~ X ,
M 3u-
-4

C~ 0
zI 0
- zLw0 U
Cr w -CW
ID ~ 4 0 0 Nt~LU t- m) 0 al. CCIOq~r~
z UI a 0. o. %4 00
-
UAJ0 __6
0.
0 w U .>
IL
0 W
Ir-
LL
:X w
Vi Cc40
a- n- W
3
w a 0
0.651
AIR POLLUTION PARTICULATE ANALYTICAL DATA
BASE DATE RUN NUMBER
BUILDING NUMBER SOURCE NUMBER
1. PARTICULATES
ITEM FINAL WEIGHT INITIAL WEIGHT WEIGHT PARTICLES(0-) (A-) (a)
FILTER NUMBER 2 2- 0 0 9
ACETONE WASHINGS (Probe, Frontme It Filter)
-0 -2
BACK HALF (itnerded)
Total Weightl of Particulates Collected
II.__WATER
ITEM FINAL WEIGHT INITIAL WEIGHT WEIGHT WATER(Em) (Em) ra$,)
IMPINGER I (120) 2c
IMPINGER 2 (H120) 234IMPINGER 3 (Dry) 0q, . . , . oe 4 .( 1 21> 4 G e t J7
" " 'Total Weight of Water Collected
II. GASES (Dry)
ITEM ANALYSIS ANALYSIS ANALYSIS ANALYSIS AVERAGE1 2 3 4
VOLCO %7 C4
VOL~O 02 __ _
VOL CO
VOL N 2
Vol % N 2 t( 00. % CO 2 . %02. % CO)
OE:HL FORM 20MAY 78
66

FIELD SAMPLING DATA FORM FOR CO
Plant name &/cpoAj A*., Date 4 f rt
Sample location 249 go fj I
Barometric pressure, mm (in.) Hg 2-P. ?oSAmbient temperature, %Z, (OF) - Stack temperature, 4 (OF) (9_
Intital leak check f Final leak check
Operator Lt 47 .
re4 l6wSC Rotameter~k setting,
I/min CO conc, C02 ,(ft3/min) ppm (dry basis) % Comments
11 .q
L- - _ _ _ _ _ _ __ _ _ _ _
24) . ...
~0,1
no I __ _ _ _ _
_ _ _ _ (, /_ _ _ _ _ _ _ _ _ _ _ _
- ; - __3.
,_ _ 0._:7 __.__
Q a i A..n ____
_- __ I3 ,_7
_ _ _ ___,_ { __
Quality Assurance Handbook M10-4.2
67

FIELD SAMPLING DATA FORM FOR CO
Plant name 10&k rD, A+-9 Date 2I 4"2 .PS
Sample location guj 2i kv, "z.
Barometric pressure, mm (in.) Hg 2jP.7S
Ambient temperature, ' (OF) 7 Stack temperature, 1 ('F) 3;-
Intital leak check Final leak check
Operator c- 'f (/
Tp. Mst Rotametersetting,1/min CO conc, C02 ,(ft3/min) ppm (dry basis) % Comments
_ f toc
f _.
I Z- ___ i
?- .
Quality Assurance Handbook M10-4.2
6P

FIELD SAMPLING DATA FORM FOR CO
Plant name Aio9d f- A-3 Date 2q 9e
Sample location ,(j 2 gL 3Barometric pressure, mm (in.) Hg z.o5Ambient temperature, C (*F) Stack temperature, O (OF)
Intital leak check Final leak check
Operator 61-1- 14t/
-eVM3ie Rotametersetting,£/min CO conc, C02,(ft3/min) ppm (dry basis) % Comments
~~ __
(0 o.
/-at- 6 1
Z69
Quality Assurance Handbook M10-4.2

5-01-79 5 Section 3.6-12
,I-
z- r'flm
a-
CC
a -~ cC -
ft
Lf- CIO
Z:z r
04. r
U--
qj 0
C14)
*' fa Q6 t
07

5-01-79 7 Section 3.6.12
-30
lb
-I-
m. 0
QL CIL -
E
VI
0 f0f-i
i-a- a 0 ~ Z -
- 0 Q
C ICL
711

5-01-79 5 Section 3.B.12
, -I - 3
0 Iv)F-
\\40
) - 1
cLk
it .-
"72- 4
III I I
qI 0 Il I

6-01-79 7 Sction 3.S.12
C4N
C
caa
(b (z,
bqq)
q)
CiC
0 Z
a A Ln
QV) Q
q~ -.~74

5-01 -79 5 Section 3.6.12
n- nVNg
~ u)rx
C-J
00
- r- ' Q. 7)
A-
'rJ- r
U)I
l?t 0 CQ
744

5-01-79 7 Section 3.6.12
q, CN
~~ZI
43~* 43
'Q- Q;
-C~ cc C
"b 0C~
.22
473
03 -0
43 -~ 4jQ1-3. 0
lbb
Pel ,..r =~
43 - 475

(This page left blank)
. . .. .. . .-- -= = m ,, m n m nmn n mlu nunn unnnmnllnl~ll~ Cnm n

APPENDIX E
BUILDING 716 BOILER 4
(NATUARL GAS) FIELD DATA
77

(This page left blank)
78

DETERMINATION OF MINIMUM NUMBER OF TRAVERSE POINTS
Stack ID: "A Th I * Stack diameter at ports: 3.3 (ft)
Distance A (ft) _' (duct diameters) 2.7
Recommended number of traverse points as determined by
distance A: (2-
Distance B (ft) j0 jj (duct diameters) 3.1s
Recommended number of traverse points as determined by
distance B:
Number of traverse points used:
A q'q00
79

PRELIMINARY SURVEY DATA SHEET NO. 1(Stack Geometry)
DOATE J- APIGTA
ISOURCE TYPE AND MAKESOURCE NUMBER INSIDE STACK DIAMETER
04/ICxI Inches
RELATED CAPACITY TVr UTL
,1,7-7 G4 -S (Z7 iL- (Z H2DISTANCE FROM OUTSIDE OF NIPPLE TO INSIDE DIAMETER
InchesNUMBER OF TRAVERSES NUMBER OF POINTS/TRAVERSE
2 12-LOCATION OF SAMPLING POINTS ALONG TRAVERSE
PERCENT OF DISTANCE FROM TOTAL DISTANCE FROM OUTSIDEPOINT DIAMETER INSIDE WALL OF NIPPLE TO SAMPLING POINT
(Inches) (Inches)
220-
I. 3 .t-
33(
I
.5 I.
IO (I.3
II q3 ,3
i 2-Si
OEHL FORM 15A P "7p, 80

PRELIMINARY SURVEY DATA SKEE4T NO. 2(Velocity and Tevnpmtwr. T,.vain)
BASE N e 0 /A 'w
BOILER NUMBER
(3LD 6- 7? , pseo 'kINSIDE STACK DIAMETER
STATION PRESSURE L4(7/2ei o In Hg
STAK STATIC PRESSURE
0,04T/' In H20SAMPLING TEAM
TRAVERSE POINT NUMBER VELOCITY HEAD, Vp IMN~ H20 STACK TMPERATURE (OF)
3 3
26 -i--
7 lku
0C Z .4A R I (, 11 4. 50 2- /
____~~~I!~~ffli'L __ _ __ _ __ __ __ ___ __ __
-- ~ .0 .t _ __.3_ _ _ _ _ _ _ _
AVERAGE
OEHL FOR' 16 8

0I LaMO
CL mz ', u a
m a))
L~p.
0,4 a. a. z u C
I 5 =
u I' Ww
U ox IV
Luu
w
4 r
CL ( 0 0 a.
0ww
I -- 0
82

0
I-. -L
m w 0 1W1
z x -j
I- m (Dm < 0 0
2 0. 0. 2 . 0.00
I
Co j
CLL
I-i<I o~.2M 5~A
OzCL..
w n
901
2 IILIx
w
4 z-
z P.-
cr. IQ M
83

AIR POLLUTION PARTICULATE ANALYTICAL DATA
SASE DAERUN NUMBER
BUILOING NUMER SOURCE NUMBER
7/ZPARTICULATES
ITEM FINAL WEIGHT INITIAL WEIGHT WEIGHT PARTICLES(am) (am) (am)
FILTER NUMBER
ACIETONE WASHINGS (Probe, FrontHall Filter)7.qv- _ _ _ (9.(oi-_
BACK HALF (iI needed)
Total Weight of Partleulates Collected a
II. WATER
ITEM FINAL WEIGHT INITIAL WEIGHT WEIGHT WATER
(am) (am) (a-)
IMPINGER 1(_S 6'000) 2I6,
IMPINGER 2 (H20) i6
IMPINGER 3 (Dry.j) ~(
IMPINGER 4 (Silica Gel)
Total Weight of We. Collected am
Ili. GASES (Dry)_
ITEM ANALYSIS ANALYSIS ANALYSIS ANALYSIS AVERAGE1 2 3AR
VOL,.C02 .7o ?,-o _ ,_
VOL % CO
VOL % N2
Vol %N 2 (100%. % CO 2 . O . % CO)
fES 84 651 REPLACES OEHL 20. MAY 78, WHICH IS OBSOLETE
H4

('Ir
C W-
W I-- ., P I-Cw* Jm Xu 1 0 2
wa No.~
n. 0 . 0
m w w
42 cjr x jU4 - A
00
U>t
W.W
<44
LU
00~ zuJ cl
MM U)
0 00CI
z z 1 3
\ LI
- - t~~~~~~~~~~III~~ a a a a a a
w -

0 a.
Sm C
m0 0
2 w
W U) Z a. a a. 0
- I-
W W
10
Cl 0 0
I-
-JJ
"
-
a-
UAU4
x U Ix.C'
zz
T--Ili.
z A- I. . .c
z .j 4 A.11wr L 1 10
ct: -
-V-3 - - -

AIR POLLUTION PARTICULATE ANALYTICAL DATA
BASE DATE RUN NUMBER
BUILDING NUMBER SOURCE NUMBER
PARTICULATES
ITE,; FINAL WEIGHT INITIAL WEIGHT WEIGHT PARTICLES(am) • (am) (am)
FILTER NUMBER , 2 -0 . S9 7 O.oL3
ACETONE WASHINGS (Probe, FrontH ll Pill.,) qFil er - 0To o -
BACK HALF (it needed)
Total Weight of Particulates Collected
II. WATER
ITEM FINAL WEIGHT INITIAL WEIGHT WEIGHT WATER($m) (g-) (em)
IMPINGER I (H20) Ac0?2c' _______
,OPINGER, /(H20
IMP"NGER 3 (Vt°') .S 6
IMPINGER 4 (Silice Get)
, ." .. ,Total Weight of Water Collecte
Itil. GASES (Dry)
ITEM ANALYSIS ANALYSIS ANALYSIS ANALYSIS AVERAGE1 2 4
VOL %C02~v 7~
VOL . 2 -. . .
VOL CO
VOL % N 2
Vol SN 2 (100r- % CO 2 - % 02 .a CO)
OEHL Fo0," 20MA Y 77
87
- Z i--- - - .-x- -
~L. W I
0-
CL 1w Wl
w. 0 - U
9- i- I- mN w
0 w w w .
: m0, 0 . Z (~ 0 00 _ _ _
W W
10 a- - - - - -
w I-
>
~1-0~ 1. -
CI I
h~t1
_-Q CL- - - - - - -
7: - t:AcUA P
-~~~~ z 14_*Ef - -I-'--
z w z K I 88

01
0. w
0C 0.
w~. x !M2
en di .4U
2 N w
400
I-I
.C.
El.. 0
UA-
0 Wi R10 6 - - - - L .
w~I- ,
U9

AIR POLLUTION PARTICULATE ANALYTICAL DATA
BASE DATE RUN NUMBER
BUILOING NUMBER SOURCE NUMBER
7. PARTICULATES
ITEM FINAL WEIGHT INITIAL WEIGHT WEIGHT PARTICLES(Qm) nl) (ar )
FILTER NUMBER 2 9 -2 0c o o z -
ACETONE WASHINGS (Probe, FronlMell Filter) 9,)5-
BACK HALF (of needed)
Total Weight of Particulate& Collected(5 c?6II. WATER
ITEM FINAL WEIGHT INITIAL WEIGHT WEIGHT WATER
IMPINGER I (7120)
IMPINGERt 2 (1120) 2 i
IMPINGER 3 (Dry) ~'N-
IMPINGO R 4 (Siica Gel)
Total Weight of Woter Collected
Ill, GASES (Dry)
ITEM ANALYSIS ANALYSIS ANALYSIS ANALYSIS AVERAGE2 3 4
VOL , CO 2 .4 ,'j,- J ) ,3- -?, -'
VOL 2 -
VOL '.CO
VOL % N 2
Vol % N2 (100% S CO 2 . % 02 % CO'
OEHL ORoN= 20MA Y 79
9n

FIELD SAMPLING DATA FORM FOR CO
Plant name &L447-MI i Date 2-7 PIZ f
Sample location 640 z/j 'j ( -'7))
Barometric pressure, mm (in.) Hg 2F'. 76 -
Ambient temperature,)'6 (OF) * Stack temperature, O (OF)
Intital leak check Final leak check -zrw
Operator 6r- A/
72A "7q' Rotameterk setting,
£/min CO conc, CO2 1(ft3/min) ppm (dry basis) % Comments
2- __ __ __ _
[/4_ _ _ 1.5 _ _ _ _ _ _5f.-5
-77
.._ _- _ I"
22
Quality Assurance Handbook M10-4.2
i /'91

FIELD SAMPLING DATA FORM FOR CO
Plant name _____ _ ____J A_ _ _ _ Date 27- /75Z l
Sample location i-e &0 2- ( C4< -J
Barometric pressure, mm (in.) Hg 2{ YG¢
Ambient temperature, 3 (0F) Stack temperature, o (OF) qO1
Intital leak check . Final leak check ___
Operator (.7- /.(
-5200t-SE Rotameterk setting,
I/min CO conc, CO2 ,(ftS/min) ppm (dry basis) % Comments
?-
IL 09
., __-_
-l -~ . ..-
- , - J-__
_ __._
(ic, ___--__ __
(,.. ,
20 1,_ _ __-
' , I/. ,
/ uaiyAsuaceIndokMl-.
Ir92

FIELD SAMPLING DATA FORM FOR CO
Plant name 6Y),N/fr 9 Date ? . f e Pl,Sample location 014 ?[ RZZAI'/ ( e- ,2Barometric pressure, mm (in.) Hg 2( SAmbient temperature, t(*F) Stack temperature, c (*F) 4V
Intital leak check Z Final leak check
Operator -et (
7Au'-Ai4e5 Z Rotameter, setting,
1/min CO conc, CO21(ft3/min) ppm (dry basis) % Comments
/2- 3-__
-- ,. __%
z-4 Quality Assurance Handbook M10-4-2
93

5-01-79 5 Section 3.6.12
0
0C,
CL-
-~to
It i' -
~4x09

5-01-79 7 Section 3.6.12
4) -~ .-
-~ bK A4)(.1
1.~
b
4)
4)1~~~$~ 4)
~- c-sc-, '0
cj,~ I4) ~
4) __U -
4)e4) - ~.-
4) 4) ~- 4) -
4)- 0
4) 4)U)
4) 4) 4)U) -
U .,.. - -' 4)4) '4 4) -:
b -~-~ ~ . '.. - NrI U
4) 4)C. ~ -' -~, vx I.-F'. UU . 0
''4) '* -4)
3 l~
''-''~ * \r Z3J Ne) ~*-.) o bz r-)~ =
- ~ r- '-~ T- - 4) 4)-~ - 04) -
4) - U)I-
U) 0) V 4)o 4) U 0.4) -J 4)0~
43 ~.. Q. ~ 4)- - - ______ b ~ U)
~' 4) 4)'- ~- 4. U) 4)
I' - -.
o .~ 4) U)U - 0) - 4)I-. 4)
-~ 4) 0 - 4)4. q
4 -. U) ~
00~ ~4) ~ -0
~ - ___________ Ii ~ ~ 4)4) -- e&. ~ 4) )~ 4) *~Q. Cd, ~. 4)'.- a -~
-4) ,-.< N'~

5-01-79 5 Section 3.6.12
,.A II zi3
Q 11
.1c
U-A
-04S..6
Q l r-S9iiS ~

5-01-79 7 Section 3.6.12
~(
'44
NIN
S q)
4-
q))
4! j
4?,
4) 4)
Q Co IK C (-
5- -4- 7
rls (-0
0~ .97

5-01-79 5 Section 3.6.12
At
'b
Q)
cc0 N
O Th' c
q) 0
-LL Ca- .--- U. m ~ ~.+
CV 98

5-01-79 7 Section 3.6.12
0'4q) -IC q,
Z: 04
QL C4
cc N)
f-44
z Cc)14 t
V) Q-6
4) C0 mQ.~ ~ 4 -6.%',
4))-S 4) 4
41 O.z U
CLi
C~ 0 ,99

(This page left blank)
100

APPENDIX F
BUILDING 716 BOILER 4
(FUEL OIL) FIELD DATA
101

(This page left blank)
102

DETERMINATION OF MINIMUM NUMBER OF TRAVERSE POINTS
Stack ID: 41 il*-I Stack diameter at ports: 3,3 (ft)
Distance A (ft) 9 (duct diameters) __ _:
Recommended number of traverse points as determined by
distance A: /2.
Distance 9 (ft) 10 ' (duct diameters) _ ,___
Recommended number of traverse points as determined by
distance B: 2
Number of traverse points used:
0A'li
B~
I . .. . . I ( I

10 PRELIMINARY SURVEY DATA SHEET NO. 2(Velocity md Te..pwwr.o Travers)
VAAI
BOILER NUMBER
INSIDE STACK DIAMETER
q6 InchesITAITION PRESSURE
-7 S Ln mgSTACK STATIC PRESSURE
In H20SAMPLING TEAM
TRAVERSE POINT NUMBER VELOCITY HEAD, Vp IN M30 N STACK TEMPERATURE (OF)
z .o ... ,,IS-o
_._ _"- 5-- ,-(, -
AVERAGE
OEHL -- 16______ ~~104 _____ __________

'a z~j2~ IC ~
00
a. 0 a
0 0 0w 04 1.1 S. j
w UJ 4 w . I
0 <. z
CL w w
m co o
w
MA
.4
CL1 Cy 0
NJ
U
I Eow
Z-0
01
-w LO
-A W. IA
C> I,1 w L,
1-0

-J 2
.
tzr 4 - ~0
uw 1j 0 -J1 ,N
~ N>.I- -04 -
i( 0 N) a. a C40a 0a.w ___z x F-
L a . U ) L z A u 10I .
< C
.64
0 0
I-.. - I9 c'
7-.
u -'
2 - !
U
w~I-. - -
Y.S. F 5 ~
1 hIS KFto
h~l 6
cm. 6- - - - --C
106

AIR POLLUTION PARTICULATE ANALYTICAL DATA
BASE DATE RUN NUMBER
BUILDING NUMBER SOURCE NUMBER
PARTICULATES
ITEM FINAL WEIGHT INITIAL WEIGHT WEIGHT PARTICLES(0m) (am) (01)
FILTER NUMBER cc~qACETONE WASHINGS (Probe. Front
Hall Piller) (j(4.}g(? __ (/OcL 0 (o~~L
BACK HALF (it needed)
. . ....... ....... i ?Total Weight of Ponlculates Collected
II, WATER
ITEM FINAL WEIGHT INITIAL WEIGHT WEIGHT WATER(o)(Do) (¢ei)
IMPINGER I (H20)
INPINGER 2 (H20) .
IMPINGER 3 (Dry)
IMPINGER A (Silics Get C
Total Weight of Water Collected
III. GASES (Dry) .... ..
ITEM ANALYSIS ANALYSIS ANALYSIS ANALYSIS AVERAGE1 2 3 4
VOL,.., / o, ___ _/_,
VOL % 02
VOL CO
VOL . N 2
V1%N 2 (100%V.C0 2 .% 02. % C 0 )
OEHL FORm 20MA Y 70
107

- J
;: -j
0. 0-
w 2 l.- 4 I'
I. w m 0.
a.z 1w. I 4
>w00
<00.LAJ 0ul-
C-6 4
4A4
AU _
w
CL aa~
108KI.

n - - - -- - ------ q
0 - C
~- 2 X rw c
-c N
(L 0 . U.
2 w . aw w
Ix zlP W-w
-C
0LU 0~ n
100
Ui G
JU I-
ii' (Z
M I
>~ 0
z I
109
AIR POLLUTION PARTICULATE ANALYTICAL DATABASE DATE RUN NUMBER
BUILDING NUMBER SOURCE NUMBER
PARTICULATES
ITEM FINAL WEIGHT INITIAL WEIGHT WEIGHT PARTICLES(Sm) (0m) (410)
FILTER NUMBER 3O34 1.1 / C). )30
ACETONE WASHINGS (Probe, FrontHatt1 Filler) C)0 '
B3ACK HALF (it ene~ded)
Total Weightt of Particulates Collected
II. WATER
ITEM FINAL WEIGHT INITIAL WEIGHT WEIGHT WATER
IMPINGER 1 (120)
IMPINGER 2 (7120) Z 5 -/IMPINGER 3 (Dsy),o/
__.___ __________.-
IMPINGER 4 (Silica 0.t
Totl Weight of Water Collected
III. GASES (Dry)
ITEM ANALYSIS ANALYSIS ANALYSIS ANALYSIS AVERAGEI1 2 3 4
VOL % CO 2 /
VOL % 02/
VOL % CO
VOL % N2
Vol % N2 = (100% % CO 2 . % 02 % CO)
OEHL FORM 20MAY 71
110

M- I4 z 4
I 2 f%
* i-4-
Nn E
Lll
K m
V >
0-
r' m
mm
1 410- C)
00 z 1

LL. z: -0 - (
zz
w In JIX C
r'w w co W4j 0 0 cc
< 0~ 0 0 >- I.-
la-
W W
(L M
LLS~
'. ' W
0
LU (Ji >Z0
UI uJ
Inn
ILi
I-.I
> 40
- -4 I - - - - -
4 t\ !;
112
AIR POLLUTION PARTICULATE ANALYTICAL DATABASE DATE RUN NUMBER
BUILDING NUMBER SOURCE NUMBER
PARTICULATES
ITEM FINAL WEIGHT INITIAL WEIGHT WEIGHT PARTICLES(eli) •(em) (ei)
FILTER NUMBER , 01) - (81 411
ACETONE WASHINGS (Probe, Front
BACK HALF (if needed)
T.ol Weight of Particulate$ Collected e
II. WATER ______._____-,_W-,ER
ITEM FINAL WEIGHT INITIAL WEIGHT WEIGHT WATER
(0m) (ge) Cje)
IMPINGER 1 (H20)
iMPINGER 2 (712)
IMPINGER 3 (Dry) .
IMPINGER 4 (Silica Gel) t 1(
Total Weigt of Water Collected
Ill. GASES (Dry)
ITEM ANALYSIS ANALYSIS ANALYSIS ANALYSIS AVERAGEI 2 3 4
VOLC 2
VOL/,
VOL % CO
VOL % N 2
Vol % N 2 = (100' % CO 2 . % 0 2 .CO)
OEHL FORM 20MA Y 71
113 0
FIELD SAMPLING DATA FORM FOR CO
Plant name 1I/Orz,/ ,-,cj3 Date 2 i p .AOSample location . _ _ /,1 (-J , e(% j
Barometric pressure, mm (in.) Hg 7-. -3Ambient temperature, OX (OF) 9O Stack temperature, I (OF) C
Intital leak check Final leak check
operator -' /Z,
& Rotameter
setting,£/min CO conc, C02,(ft3/min) ppm (dry basis) % Comments
0,0
(0 _ ,__-
Quality Assurance Handbook M10-4.2
114

FIELD SAMPLING DATA FORM FOR CO
Plant name .. ,A AL Date ..2f TU c
Sample location 44 (qy lxac )
Barometric pressure, mm (in.) Hg 2- Y. ;7-7
Ambient temperature, C (OF) ?O Stack temperature, O*§(OF) qjJ
Intital leak check ,ioW Final leak check
Operator 7#/z(
-1 Rotametersetting,2/min CO conc, CO21(ft3/min) ppm (dry basis) % Comments
/~ qr
Qualit Ass ao bookM0-.
1-.-I, __ _ _ _ _ _ _
(0_ __ _ _ ___7___ _ _ _ _ __ _ _
,,..,_ _ _ _ _ _ _ _ _ _ _ _ _ _ _
(-L(,
L (2--_ _ __ _ ___ _ _ _
Qult/Asrne adok l-.
,:7- 1,5

FIELD SAMPLING DATA FORM FOR CO
Plant name _ __6 / Date .2 F /V(£
Sample location 2 ,u ( ~ 42)Barometric pressure, mm (in.) Hg z.775Ambient temperature, < (OF) O Stack temperature, O6 \-(OF)
Intital leak check Final leak check __
Operator /1 6 /
A-Vt12 Rotameterl!c setting,m I/min CO conc, C02 ,
4 h (ft3/min) ppm (dry basis) % Comments
2- !,
, o ,...
w7- !__
LL 0,? .. .. _ __ __ _
,'? 0 , 2
/ /,
- t
Quality Assurance Handbook M10-4.2
116

5-01-79 5 Section 3.6.12
-J _
00
.- ,
c ."
a
4. 13 71I
41
-rn
q9V
Q6
117" "
ii I ! I I I I I I I I I I

5-01-79 7 Section 3.8.12
(ti4
Q Cl. qq)A
IZ7, 'ZI
bC
4? N
% LCO~
+ Ll
- S. 43 -
Q It cc (- 0 0. -
43I43 5,to

5-01-79 5 Sectioitt 3.6.12
IL
- 0
C ~ - L'f- 0v
q,
-NI
Q(dU
0 -l
tn 0

5-01-79 7 Section 3.6.12
4)4
Z))
4)ON~ 'AA4
TO()
o 1 4
'4-~0 %j4
-A -
c,' 4 .-. '.zb
03120

AN5-01-79 5 Section 3.6.12
tbbCoC
CL
-40
to
C C7
-Its
crt
."12 r)

5-01-79 7 Section 3.6.12
ONN
t(h
ao Ca ccc 0aVka
CLC
41
a.r
(A CA4 ~05
4122
APPENDIX G
ACETONE BLANK RESULTS
123

(This page left blank)
124

AIR POLLUTION PARTICULATE ANALYTICAL DATABASE OATE RUN NUMBER
- /&4L /&j I~ lk-&6e 24,.BUILDING NUMBER SOURCE UMBER
PARTICULATES
ITEM FINAL WEIGHT INITIAL WEIGHT WEIGHT PARTICLES(AM) (am) (111m)
FILTER NUMBER
ACETONE WASHINGS (Probe. FrontH all Fltr) /3. 7 ,, 6 (-) . 9 0 / o
BACK HALF (if needed)
Total Weight of Particulates Collected co
II. WATER
ITEM FINAL WEIGHT INITIAL WEIGHT WEIGHT WATER
IMPINGER I (n20)
IMPINGER 2 (1120)
IMPINGER 3 (Dry)
IMPINGER 4 (Silica Gel)
Total Weight of Water Collectedien
Ill. ~~~~~GASES (Dry) _____________
ITEM ANALYSIS ANALYSIS ANALYSIS ANALYSIS AVERAGEI 2 3 4
VOL CO,
VOL 0 2
VOL % CO
VOL % N2
VolS 2 z (100% C02 . %02 .% CO)
AMD FORMFEBA 4 651 REPLACES OEHL 20, MAY 76, WHICH IS OBSOLETE.
125

(This page left blank)
126

APPENDIX H
EMISSIONS CALCULATIONS
127

(This page left blank)
128

XROM "METH 5" XROM METH 5"XRO METH 5"RUN NUMBER RUN NUMBER RUN NUMBER
BOILER, BLDG 672, RUN 7 BOILER, BLDG 672, RUN URUN RU: - BOILER, BLDIG 672, RUN 3RUN RUN
METER BOX Y? METER BOX Y? RUXMT8828 RUB 1.8828 RUN METER BOX Y?1.028 ON .06820 RUN
DELTA H? DELTA H? 2ELTA H?3.8588 RUN 2.6188 RUN ELTA HE?
BAR PRESS ? BAR PRESS 282.8 RURUNB
28.730 RUN3 28.73RB RUN
METER VOL ? METER VOL ? METER VOL ?
56.5548 RUN 52.9338 RUN 51,3830 RUMTREMTR TEMP F? MTR TEMP F?
188.8888 RUN 185.8888 RUN F?
% OTHER GAS % OTHER GAS % OTHER GAS
REMOVED BEFORE REMOVED BEFORE REMOVED BEFORE
DRY GAS METER ? DRY GAS METER DRY GAS METERE
RUH RUN RUNSTAITIC HON IN ? I STATIC HOH IN ? RUN STATIC NON IN ?
I " I I l.11 RU
STACK TEMP. STACK TEMP. STACK TEMP.
392.0000 RUN 481.888 389.888 RUN
ML. WATEP ML. WATER ? ML. ATER?
!14.988" PU" 128.1888 PRU" ML..MATER .
IMP. 9. IMP. % NON 18.6 IMP. 4, HOH 2,2,5IMF'.M:.: HO : '2.5
% HOH:IO.6 % HOH:12.5HOH=9.6
C "." Coll? %C02?
": C02? 7.0888 RUN 788 U
4.3000 RUN 7.080 RUN .@@ CRUNO.YGENUN OXYGEN? OXYGEN?.8XRYGEO? 8.6880 RUN 9.eXY RU
A 1.7000 Uq -cc ? % CO ?RU N. RUN RUS
MOL UT OTHEP? MOL WT OTHER? O TTMOL WT OTHER RUN RUN
RUN
NWd =29- 24 MWd =29.46 MWd =29.48
MW WET='. I MW WET=28.25 MM WET=2884
SgRT V.ST SQRT PSTS ? SQRT PSTS :I T ? 7.4475 RU N 7.1984 RUN
TINE N 7.7461 RU TIME MIN " TIME MIN ?TE I 68.8888 RUN 68.8888 RUN
68.8808 PN NOZZLE DIP ? NOZZLE DIP ?
NOZZLE IP .4998 RUN .499e RUN
.49908 PU! STK DIP INCH 2 STK DIA INCH ?
:,T iI P INCH 2 24.8888 PUN 24.8888 PUN
24.8888 RUN* VOL MTR STI = 47.912 * VOL MTR STIt z 45.92e
VOL MT i 58.976 STK PRES ABS = 28.74 STK PRES ABS 28.7
STI PRES ABls = 28.74 VOL HOH GAS = 5.65 VOL HON GAS = 6.5"
VOL HOh GAS = 5.41 ; MOISTURE = 18.55 MOISTURE =12.52
MOISTURE = .59 MOL DRY GAS 8.894 MOL DRY GAS 8.875
MOL 'GEN = 8.984 . NITROGEN = 84.48 % NITROGEN = 84.8
NITROGE = 82.88 MOL WT DRY = 29.46 MOL WT DRY = 29.48
MOL T DRY '>9 ,24 MOL UT WET = 28,25 MOL T WET = 2S 84
MOL WT NE= 28 1t VELOCITY FPS = 18.77 VELOCITY FF': 18 'q
VELO TY l 5, STPCK AREP = 3 .iA STACK PEO = -
STACJ'
TPI
'TCri I!?]C~ C '~.~SA~t -129iFTTJ:'
' -
129

XROM "MRSSFLO" XROM "MASSFLO" XROM -MRSSFLO'
RUN NUMBER RUN NUMBER RUN NUMBERBOILER, BLDG 672, RUN I BOILER BLDG 672. RUN 2 BOILER, BLDG 672, RUN
RUN RUN PUN
VOL MTR STD? VOL MTR STD ? VOL MTR STD47.9120 RUN 45.9288 PUH
50.9760 RUN STACK DSCFM ? STACK DSCFM ?STACK DSCFM 2 1,864.8880 RUN 1,792.8888 PUN
1,984.080 RUN FRONT 14 12 2 FRONT 1/2 MG FRONT 1/2 MG ? .6867 RUN .8869 PUN
.8189 RUN BACK 1/2 MG ? BACK 1/2 MGBACr !'2 MG 8.088 RUN 8.8088 RUN
v.8008 RUN
F GR/DSCF = 2.1580E-6 F GR'DSCF = 2.2852E-6F GFDSCF = 3.2998E-6 F MG/MMM 8.8849 F MG/MMM = 8.,8852F MGMMM 8.0876 F LB/HR 3.4479E-5 F LB/HR =.51OIE-5F LB/HP 8.881 F KG/HP 1.564PE-5 F KG'NR =5922E-F KGNP = 2.5454E-5
130

XROM, "METN " XROM "METH "XROM "METH "
RUN NUMBER RUN NUMBER RUN NUMBER
BOILER 1 e8Ln 249, RUN: BOILER 1, BLD 249, RUN 2 BOILER 1, BLD 249, RUN 3RUN RUN RUN
METER BOX Y? METER BOX Y? METER BOX Y?1.8828 RUN 1.8828 RUN 1.6828 RUN
DELTA H? DELTA H? DELTA H?
1.6588 RUN 1.688 RUN 1.688 RUNBAR PRESS ! BAR PRESS ? BAR PRESS ?
28. 7858 RUN 28.7858 RUN 28.7058 RUNMETER VOL METER VOL ? METER VOL ?
41.3518 RUN 48.5928 RUN 42.0448 RUNMTR TEMP F? MTR TEMP F? MTR TEMP F?
78.8888 RUN 87.8888 RUN 86.8888 RUN. OTHER GAS 4 OTHER GAS % OTHER GASREMOVED BEFORE REMOVED BEFORE REMOVED BEFOREDRY GAS METER ? DRY GAS METER ? DRY GAS METER ?
RUN RUN PUNSTATIC HOH IN ? STATIC HOH IN ? STATIC HON IN ?
.0588 PUN .8508 RUN .8588 R U NSTACK TEMP. STACK TEMP. STACK TEMP.
S369.88 @[email protected] P.R- 77.0000 PlUh 377.Oe88 RUK,'
ML. WPTER ML. WATER ML. WATER ?18.6888 PUni 128.6888 P1.1: 149.7880 PuLN
IMF. = .. '. IMP. % HOH = 13.8 IMP. HOH = 15,2
HOH 1X, , HOHH13.8 % HOH=15.2
" C02? % C02? % C02?E.8888 NRUN 5.2888 RUN 5.6888 PUl;
% OXYGEN? %, OXYGEN? % OXYGEN?9. 8888 RU 18.688 RUN 9.8888 RUN
C, " RCO " % CO ?
RUN RUN RUN
MOL WT OTHEP" MOL WT OTHER? MOL WT OTHER?
PUN RUN RUN
MW. -9 * 3 MWd =29.2t MWd =29.29
MW "T .. MW WET=27. . MW WET=27.57
SQP "- SQRT PST"' SQRT PSTS_,368 PT.IF 18.2158 :N 18,2886. PU1!
TIME MIN - TIME MIN ' TIME MIN
A. 88@8 RU ,J 68.8888 PUN 68.@888 RUHNOH7 DI NOZZLE DIP NOZZLE DIP ?
.'75 P'l~. . 3758 RUN .3758 PUk
STI; t INC-' STK DIP INCH STK DIA INCH ?! C. f. FIJI; 19.8888 PI 19.8888 RUN
* • v C ,7 ... - * VOL MTP STD = 77,2 * VOL MTR STD = 39-24z
STK PPE.S AF": 2S.71 STK PRES ABS 2 71 STK PRES ABS = 20. 7'
VOL HOH GA :', 4.74 VOL HOH GAS = 6.85 VOL NON GAS = :
% MOISTURE = '0.'* % MOISTURE = 13.80 % MOISTURE = 15.-MOL DPY G' P MOL DRY GAS = 0.862 MOL DRY GAS = 8.84S. HITROGEN = ' 2 % NITROGEN = 84.2. NITROGEN = 84.68
MOL VT DPY = ' 7c MOL WT DRY = 29. MOL WT DRY = 29.20MOL WT WET = ,c "7 MOL WT WET P MOL WT WET: =',S.VELOCITT " VELOCITY FPS 2 6. 0 VELOCITY FPS 2 6 624STc"Y OPEC STACr QPE= STACK AREA : 9-
,T' ' ~:. , : I ' =,-,TACi DC. r : '6:
131

XROM 'MASSFLO" XROM "MASSFLO" XRON "MRSSFLO'
RUN NUMBER RUN NUMBER RUN NUMBERBOILER 1, BLD 249, PUN I BOILER Z, BLD 249, RUN 2 BOILER I, BLU 249, RUN 7
RUN RUN RUN
VOL MTR STD ? VOL MTR STD 7 VOL MTR STD39.1778 RUN 37.8280 PUN 39.2458 RUNSTACK DSCFM ? STACK DSCFM ? STACK DSCFM
1,682.8888 RUN 1,6os.o8e RUN J,59J.898 RUNFRONT 1/2 MG? FRONT 1/2 MG ? FRONT 1/2 MG.8859 PUN .084e RUN .8840 RUNBACK G2 MG? BACK 1/2 MG ? BACK 1/2 MG 2
8.0888 PUN 8.8888 PUNf .8ee RUN
F GR/DSCF = 2.3241E-6 F GR/DSCF = 1.6322E-6 F GR/DSCFF MG/MMM 8.8057 F MG/MM 8.8837 F MG/MMM 8.883EF LBHP 3.3586E-5 F LB/HR = 2.2426E-5 F LB/HP = 2.1450;-9F KG/HP 1.5198E- F KG/HP = 1.0172E-5 F KG/HR 9.7296E-
132

ET,5 XRO" *EETH f'
RUN NUMBER RUN NUMBER RUN NUMBER
BOIL. 4 BLD 716, RUN I BOIL. 4, BLD 716, RUN 2 BOIL. 4, BLD 716, RUN 31 RUN
METER BOM R 1METER BOX Y? METER BOX Y?1.8MT8 RUN Y1.8828 RUN i.es2e RUN
DELTA H? DELTA H? DELTA N?
2,4509 0 2,6488 RUN 2.68 RUNBAR PRESS ? BAR PRESS ? BAR PRESS ?
BA8R PRiSS 28.8658 RUN 28.8650 RUN
MET., BO2 ,-METER VOL ? METER VOL ?METER VOL ? 53.7810 RUN 51.7669 RUN
R P MTR TEMP F? MTR TEMP F?MTR TEMP F? 95.8688 RUN 182.98 RUN
8 OTHER GIS % OTHER GAS %. OTHER GSREOVE BEFORE REMOVED BEFORE REMOVED BEFOREDRY GAS METER ? DRY GAS METER D DRY GAS METER ?
RUN RUN RUNSTRTIC UON IN ? STATIC HON IN ?
SAI OINSTATIC HON IN ? RN.0450 RUN.8458 RUN .8458 RUN.45 Rtf
.T0C9 TEMP. STACK TEMP. STACK TEMP.44STAC TM PN 484.888@ RUN 436.8888 P9P
ML. WTER " L .L WWATER ?M L. .9TER 22 Ui 88 29. 400 0 U
IMP. NOH 16.8 IMP. % HOH = 17.2
IMP,. HON 17.3% HOH=16.0 % HOH=17.2
i HOH=17.3
% C02? " C02?
% C,? 7.8889 RUN 9.8888 RUN
'9.888 RUN % OXYGEN? % OXYGEN?
OYYGEN? I 5.8888 RUN 3.8888 RUN4I80 IU " CO? .O ?
"RUN RCORUN RUN
PUN MOL WT OTHER? MOL WT OTHER?
MOL T OTHER? RUN RUN
RUNM =d -29.35 MNd =29.56
M Nd =2 .68 MR WET=27.5" MW WET:27,57
SORT PSTS ? SORT PSTS ?
S@PT 7.6686 RUP 7.8698 RU
7.o8..,, PUN TIME M14 7 TIME MIN ?
TIME MIN N 68.888 RUN 68.8888 RUN
6.,e8 RUN NOZZLE DIP ? NOZZLE DIP ?
Nr~ D . IP. .5088 RUN .5888 RUN
.5880 U6 STK DIP INCH ? STK PI INCH
ST DIP INOHF 48.8888 RUN 48.8.88 RUN
4@,8888 PUNVOL MTR ST, ' 49,792 VOL MTR STD = 47.324
VOL mITF STI 47,7 STK PRES ABS 28.67 STK PRES ACS - 28.&7
S.. PRES AS 28.8 VOL NON GAS = 9.51 VOL NON GAS = 9.86
VOL HON GAS 9.83 , MOISTURE = 16.8 .MOISTURE = 17.24
MOOITURE ML DRY GAS = 8.848 MOL DRY GAS = 8.82.'
MOL DPY GPS 8,827 .NITROGEN = 87.28 >, NITROGEN z 88.8.
% NITROGEN = 87. ML WT DRY = 2q.35 MOL WT DRY : 29.56
NOL WT OPRY = 29.6P MOL WT NET 27,.53 MOL NT MET = 27,57
MOL WT WET = 27.0 VELOCITY FPS = 19.5 VELOCITY FPS x 28.83
VELOCITY FPS - 28.@E STACK AREA 8.73 STACN REA = 5.7:.,,2I .1 "2... :TACK ACFM = '4- ,4'
,
'C' ,2" 133

XROM "MASSFLO" XROM MASSFLO" XROM "MPSSFLO"
RUN NUMBER RUN NUMBER RUN NUMBERBOIL. 4, BLD 716, RUH 1 BOIL. 4, BLD 716, RUN 2 BOIL. 4, BLD 716, RUN
RUN PUN RU
YOL MTR STD ? YOL MTR STD ? VOLMTRSTD ?
47.8978 RUN 49.7920 RUN 47.3248 RUN
STACK DSCFM ? STACK DSCFM ? STACK DSCFM ?4,871.008B RUH 5,864.8e RUN 4,936.0888 RUN
FRONT I/2 MG ? FRONT 1/2 NG ? FRONT 1/2 MG.0138 RUN .088 RUN .0886 RUN
BACK 1/2 MC ? BACK 1/2 MG ? BACK 1/2 MG 2.. 88 RUH 8.8000 RUN @.Be@@ RUN
F GRpDSCF = 4.5218E-6 F GR/DSCF = 2.7274E-6 F GR/DSCF = 2.8844E-E
F MG/MMM 8.810" F MG/tMMM 8.8862 F MG/MMM = 8.88'4F LB/HF 8.8082 F LB/HR 8.0@ F LB/HF = 8.8881F KG/HP' 8.8001 F KG/HR : 8.801 F KG/HR = 8.8881
134

F{.U6L i L.- UV tJ XROM "MET,1
XRO 'METH 5" XROM 'METH 5 RUN NUMBER
RUN NUMBEF RUN NUMBER BOIL 4, 5, R
BOIL. 4, OIL RUN I BOIL. 4, OIL RUN 2 RUN BOIL. 4 OIL RUN 3 RUNRUH METER BOX Y? METER BOX Y?
METERBOX Y) 1.0620 RUN1.ME2T RUN DELTA H .1.0620 RUN1.882ELT DETAH
DELTA H! 2.328 RUN DELTA HR2•88 RNBAR PRESS ? 2. 53" RUN
BAR PRESS 2.3088 RUN 28.775 RUN BAR PRESS ?
28.7750 RUN METER VOL ? 28.7758 RUNMETER VOL ? 498410 RUN
48.7840 RUN MTR TEMP F? 52.3498 RUNFTR TEMP F? ?8/.0080 RUN MTR TEMP F?
96.8@@8 RUN % OTHER GAS 106.8088 RUN.OTHER GAS REMOVED BEFORE V% OTHER GASREMOVED BEFORE DRY GAS METER REMOVED BEFOREDRY GAS METER ? RUN DRY GAS METER ?RUN STATIC HOH IN ? RUN
STATIC HOH IN ? liB@ RUN STATIC HOH IN ?
.1188 RUN STACK TEMP. .118 PUN
STACK TEMP. 419.888P RU, 427.8888 RUN
425.808 RUN ML. WATER ? ML. MATER ?
ML. WATER " 185.9880 RUN 1L..8EPPUP. HO =I V.1 IMP. % HOH 13.8
IMP. *O HO= 8.4% HOH=1.1 V.HOH=13.B
% HOH=8.4
% C02? % v.C2V. C02? 18,888 RUN 9.8888 RUN
18.4888 RUN % OXYGEN? % OXYGEN?
% OXYGE4? 4.5589 RUN .4.488 RUN4.4888 RUN V. CO ? 446 U
V. CO ? RUN VCRUN% oIRUN ROL MT OTHER? U U
RUNMOL WT OTHER? MOL WT OTHER?MOL MT OTHER? RUNRU
M~d =29.78 Md=96
MWd =29.84 MM WET=28.59 Md WET=28.18MW WET=28.84
SORT PSTS ?
.qRT PSTS ? 7.5915 RUN SORT PSTS ? RUN',. 7 TIME IN ? 1TIME MIN ? 68.8888 PUN TIME MIN RUN
68.888 RUN NOZZLE DIP ? NOZZLE RUN
NOZZLE DIP ? .5888 RUN .5NZL RUN.5880 RUN STK DIP INCH ? .58 DUN
SW DP I~:~l~ 488888 RU~STK DlI INCH ?STK [DlA INCH '- 4 e.@BB e RUN 4 0.009e RUN
40.8888 RU4R* VOL MTP STP = 44.269
VOL MT STD = 44.-82 STK PRES ABS = 28.7E VOL P S = 364ST PRES 'ABS = 28.78 VOL HON GAS = 4.98 SO PR ASVOL HON GAS = 4.13 % MOISTURE = 10.12 1% MOISTURE = C.43 MOL DRY GAS =8.899 % MOISTURE 13.83
MOL DRY GAS : 8.916 % NITROGEN = 85.45OL DRY GAS = .87
% NITROGEN : 85.20 MOL WT DRY : 29.78 % NITROGEN 86-6
MOL RT DRY = 29.84 MOL WT WET = 28.59 MOL MT DRY 29.62
ML WT WET = 28.84 VELOCITY FPS 19.8MT MET = 2810VELOCITY FPS:2.1
VELOCITY FPS : 19.12 STACK AREP : V.7ELT Y FR S : .21CTp'PE .?TAK CF STACK AREA = 7r '~~~~STC AFCF? x SAK F.2' .... r .; : = iP.PI * STACK DSCFM : 5 FM :
IE STACr DSCFM : '2'.:23• 7 -: % 13O NSK cN.' 3
i135

XROM "MASSFLO" XROM "MASSFLO xO"r
RUN NUMBER RUN NUMBER RUN NUMBERBOIL. 4, OIL 716 RUN 3 BOIL. 4, OIL 716 RUN 2 BOIL. 4, OIL 716 RUN I
RUN RUN RUN
VOL MTR STD ? VOL MTR STD V VOL MTR STD 747.3648 RUN 44.2698 RUN 44.8328 RUi
STACK DSCFM ? STACK DSCFM ?5,269.888 RUN 5,168.088 RUN 5,263.0@0 RUN
FRONT 1/2 MG ? FRONT 1/2 MG ? FRONT 1/2 MG ?.8494 RUN .8512 RUN .8488 PUNBACkI/2 MG BRCKI'2MG, BACK I/2 MG?
8.888 RUN 8.8888 RUN 8.8@8 RUN
F GR/DSCF = 1.6895E-5 F GR'DSCF = 1.7848E-5 F GR/DSCF = 1.6523E-5F MG/MMM 8.8368 F MGCMMM 8.8488 F MG/MMM 8.8378F LB/HR 8.8887 F LB/HR = 6,08.0 F LBHP 8.887F KG/HR 8.8883 F KG/HP = 8.0884 F KG/HF .
136

LABORATORY ANALYSIS REPORT AND RECORD (General) D
USAPOEHL/SABROOKS AFB TX 78235-5501
£ AMPLt ITITY
SAMPLE FROM "AONTWOuR
TEST FOR
METHODOLOGY: Infrared Spectrograph, ED X-ray: Gas Chromatograph; Other;cFosed cur Flash Pt. Tester: rH measurement; Atomic Absorption
OEHL BASE RESULTS epJ01LNO NO -_ -.
-Z.4 7 cew < /0
• ,,_
ft~Ousr~Nc AGENY (Mi~j,~Add?..) ~D. HILSBERRY, G~2 7Chief, Industrial Pro;\ tts andCompressed Gas Ana yse@ Section
.-SC Form 3511. DEC e5 A'J.u SoP62 s2 wM(,1SOBS0L(o T
137

CARBON MONOXIDE CALCULATION FORM
Plant AJO.krb IJ APB Date 20 , 2#f ,9
Sample location L) 6.2 -.
Test number f z- , 3 .
Bag number a.A/,9 j Goi I (A)89 oI9
Operator .T A-ij
CO Concentration
C~ ~~/ CO 10) to dr0ai)
NDIR --- ppm (dry basis).
4 , S -4 . --?-. 0 = .1 q 0 q 3 .0
CO2 %- -1 = _._
CCO CCONDIR (1 FC02 ).
1 , ,o , 1 o .o k o -+ f/ 5 9 q - 3
___ (1 - 0. _ ) = . . ppm (dry basis).
,'jj-,1" Co 9-1' 9 f, (Wz.-7 6 dErrors:
Quality Assurance Handbook M10-6.1
138

CARBON MONOXIDE CALCULATION FORM
Plant A/lbOrI A Date , 6U f
Sample location (1D z 9
Test number -2. 3
Bag number .AfqQc,,2p G. 6J7ooJ ,, kcfo&z. -
Operator 7 /"Z/
CO Concentration
CCONDIR -- - ppm (dry basis).
FCO = . %+ 100 = 0.
CCOstack = CCONDIR (1 - CO2 ).
/ t /o J.(/ 5 '05
(1 - 0.- )= . ppm (dry basis).
Errors:
Quality Assurance Handbook M10-6.1
139

CARBON MONOXIDE CALCULATION FORM
Plant A/d7m^l 4 Date 2 3 iA-- 9
Sample location (v e-u- b $ )
Test number 1: ,
Bag number G t7 6-- .3 02-4 , J oo-L
Operator LT pL I
CO Concentration
CONDIR - ppm (dry basis).
0 , . O,.o o9Fc CO 2- % 100 = 0. _
CcOstack = CONDIR (1 - CO 2 ).
- __- (1 - 0. 0) =. .. ppm (dry basis).
CC C e~J?1zA~r-.AJ~-& / .
Errors:
Quality Assurance Handbook M10-6.1
140

CARBON MONOXIDE CALCULATION FORM
Plant ,____________Date 2- f P
Sample location eg ;X& ~,d
Test number /, 0- 7
Bag number GtJ MOz C0 f 0 0 -21t 6 a o Q z
operator (. ,47-
CO Concentration
CC0 -ICONDIR = ppm (dry basis).
/eo,</, /0.0, 9.c' ,/oo, .100) .~
FO =o - + 100 = 0._
CCOstack = CONDIR (1 - FCO 2 ).
/0 /a ( to ./1( 00 .7)9. ~/S(1 - 0. _ ) =. .. ppm (dry basis).
Errors:
Quality Assurance Handbook M10-6.1
141

• LABORATORY ANALYSIS REPORT AND RECORD (General) IDATE "SI J 9 JUN 9e I
TO: [PROM:I I.ISAMPLE IDENTITY IDATE RECEIVEDI Air/Impinger Solution I // ,4 Y 9fISAMPLE FROM ILAB CONTROL NR
BLDG. 47Z .27125 - /7/ITEST FOR
Nitrogen Oxides
REFERENCED METHOD: Method #7, 42 CFR, #160, Part IIANALYSIS DATE: June 8, 1989
LAB W OEHL # BASE # ANALYTICAL RESULTS
(ug NO?)
Quantitation Limit 100
89-05-294-01 27125 GX890029 13089-05-294-02 27126 GX890030 14089-05-294-03 27127 GX890031 14089-05-294-04 27128 GX890032 17089-05-294-05 27129 GX890033 15089-05-294-06 27130 GX890034 14089-05-294-07 27131 GX890035 11089-05-294-08 27132 GX890036 14089-05-294-09 27133 GX890037 11089-05-294-10 27134 GX890038 15089-05-294-11 27135 GX890039 13089-05-294-12 27136 GX890040 12089-05-294-13 27137 GX890041 12089-05-294-14 27138 GX890042 13089-05-294-15 27139 GX890043 12089-05-294-16 27140 GX890044 15089-05-294-17 27141 GX890045 14089-05-294-18 27142 GX890046 14089-05-294-19 27143 GX890047 13089-05-294-20 27145 GX890049 15089-05-294-21 27146 GX890050 15089-05-294-22 27148 GX890Q52 15089-05-294-23 27149 GX890053 27089-05-294-24 27150 GX890054 29089-05-294-25 27151 GX890055 24089-05-294-26 27152 GX890056 22089-05-294-27 27153 GX890057 150
REQUESTING AGENCY (Mailing Address) T
I .F C rF V Bosheic
Analyzed by Biospherics Incorporated
1342CHEM 1 142

I LABORATORY ANALYSIS REPORT AND RECORD (General) IDATEI IITO: IFROM:
ISAMPLE IDENTITY IDATE RECEIVEDj Air/Impinger Solution IISAMPLE FROM ILAB CONTROL NRI IITEST FORI Nitroqen Oxides
REFERENCED METHOD: Method #7, 42 CFR, #160, Part IIANALYSIS DATE: June 8, 1989
LAB # OEHL # BASE # ANALYTICAL RESULTS
(vg NO 2 )
Quantitation Limit 100
89-05-294-28 27154 GX890058 20089-05-294-29 27155 GX890059 21089-05-294-30 27156 GX890060 19089-05-294-31 27157 GX890061 20089-05-294-32 27158 GX890062 19089-05-294-33 27159 GX890063 17089-05-294-34 27160 GX890064 15089-05-294-35 27161 GX890065 32089-05-294-36 27162 GX890066 41089-05-294-37 27163 GX890067 45089-05-294-38 27164 GX890068 33089-05-294-39 27165 GX890069 38089-05-294-40 27166 GX890070 34089-05-294-41 27167 GX890071 31089-05-294-42 27168 GX890072 37089-05-296-01 27169 GX890073 34089-05-296-02 27170 GX890074 35089-05-296-03 27171 GX890075 34089-05-296-04 27172 GX890076 40089-05-296-05 27173 BK890077 *89-05-296-06 2717.4 BK890078 *
*Sample broken during analysis. _
ANDREW RICARDSON, III, GS.12Chief, IH Analysis Section
REQUESTING AGENCY (Mailing Address)
I Analyzed by Biospherics Incorporated
!342CHEY, 2 143

1. Nitrogen Concentration Calculations
A. Calculation for sample volume, dry basis, corrected to standardconditions:
Pf PiVsc - K1 (Vf - 25 ml) (----- )
Tf Ti
where:K1 - 0.3858 K / mm Hg
B. Sample concentration, dry basis, corrected to standard conditions:
mC = K2 ---
Vsc
where:mg/m'
K2 10'-----ug/ml
units:m - mass of N02 as N02 in gas sample, ug.Pf - final absolute pressure of flask, mm Hg.Pi - initial absolute pressure of flask, mm Hg.
Pstd - standard absolute pressure, 760 mm Hg.Tf - final absolute temperature of flask, K.Ti - initial absolute temperature of flask, K.
Tstd - standard absolute temperature, 293 K.Vsc - sample volume at standard conditions (dry basis), ml.Vf - volume of flask and valve, ml.
144

Bldg. 672
Run - Sample Vf Pf Pi Tf Ti Vsc
1 - 1 2085 682 62 295 314 1,680
1 - 2 2085 718 72 295 314 1,752
1 - 3 2054 711 70 295 320 1,715
1 - 4 2075 682 60 295 319 1,679
2 - 1 2090 677 62 294 320 1,680
2 - 2 2072 685 65 295 320 1,673
2 - 3 2066 682 64 295 319 1,662
2 - 4 2070 689 61 295 317 1,690
3 - 1 2089 678 59 295 316 1,681
3 - 2 2080 680 72 296 317 1,641
3 - 3 2084 680 71 296 320 1,648
3 - 4 2072 674 72 296 321 1,621
145

Bldg. 672
Run - Sample Vsc m C
1 - 1 1,680 130 41
1 - 2 1,752 140 42
1 - 3 1,715 140 43
1 - 4 1,679 170 53
ave 45
2 - 1 1,680 150 47
2 - 2 1,673 140 44
2 - 3 1,662 110 35
2 - 4 1,690 140 44
ave 42
3 - 1 1,681 110 34
3 - 2 1,641 150 48
3 - 3 1,648 130 41
3 - 4 1,621 120 39
ave 41
Average of 3 runs 43
146

Bldg. 249
Run - Sample Vf Pf Pi Tf Ti Vsc
1 - 1 2059 707 55 290 295 1,766
1 - 2 2080 708 56 291 296 1,778
1 - 3 2082 712 54 291 296 1,796
1 - 4 2043 715 53 291 297 1,773
2 - 1 2066 699 58 291 299 1,738
2 - 2 2074 694 61 292 299 1,717
2 - 3 2061 716 54 292 301 1,785
2 - 4 2102 711 61 293 297 1,779
3 - 1 2080 696 56 292 305 1,744
3 - 2 2062 695 58 292 301 1,719
3 - 3 2086 704 57 292 302 1,766
3 - 4 2066 716 53 292 295 1,789
147

Bldg. 249
Run - Sample Vsc m C
1 - 1 1,766 120 36
1 - 2 1,778 130 38
1 - 3 1,796 120 35
1 - 4 1,773 150 44
ave 38
2 - 1 1,738 140 42
2 - 2 1,717 140 43
2 - 3 1,785 130 38
2 - 4 1,779 135 40
ave 41
3 - 1 1,744 150 45
3 - 2 1,719 150 46
3 - 3 1,766 150 45
3 - 4 1,789 150 44
ave 45
average of 3 runs 41
148

Bldg. 716 Gas
Run- Sample Vf Pf Pi Tf Ti Vsc
1 - 1 2085 725 56 294 297 1,809
1 - 2 2054 728 52 296 296 1,787
1 - 3 2075 723 55 297 301 1,780
1 - 4 2070 712 56 296 303 1,751
2 - 1 2090 710 55 296 302 1,765
2 - 2 2072 712 56 296 300 1,752
2 - 3 2066 713 56 296 297 1,748
2 - 4 2070 712 55 296 304 1,755
3 - 1 2089 715 59 296 300 1,766
3 - 2 2080 716 54 296 304 1,776
3 - 3 2084 704 61 296 305 1,730
3 - 4 2072 702 55 296 304 1,730
149

Bldg. 716 gas
Run - Sanple Vsc m C
1 - 1 1,809 270 79
1 - 2 1,787 290 86
1 - 3 1,780 240 71
1 - 4 1,751 220 66
ave 75
2 - 1 1,765 150 45
2 - 2 1,752 200 60
2 - 3 1,748 210 63
2 - 4 1,755 190 57
ave 56
3 - 1 1,766 200 60
3 - 2 1,776 190 56
3 - 3 1,730 170 52
3 - 4 1,730 150 46
ave 53
average of 3 runs 62
150

Bldg. 716 oil
Run - Sample Vf Pf Pi Tf Ti Vsc
1 - 1 2059 712 54 293 302 1,766
1 - 2 2080 711 56 293 301 1,776
1 - 3 2082 711 57 293 300 1,774
1 - 4 2043 712 55 293 300 1,749
2 - 1 2066 708 60 293 302 1,746
2 - 2 2074 705 57 293 304 1,753
2 - 3 2061 696 59 293 304 1,713
2 - 4 2102 692 64 293 306 1,724
3 - 1 2080 700 60 293 307 1,739
3 - 2 2062 696 63 293 307 1,705
3 - 3 2059 698 64 293 306 1,705
3 - 4 2059 701 63 295 303 1.701
151

Bldg 716 oil
Run-Sample Vsc 3C
1 -1 1,766 320 96
1 2 1,776 410 122
1 -3 1,774 450 134
1 -4 1,749 330 100
ave 113
2 -1 1,746 380 115
2 -2 1,753 340 103
2 -3 1,713 310 96
2 4 1,724 370 114
ave 107
3 -1 1,739 340 103
3 -2 1,705 350 109
3 -3 1,705 340 105
3 -4 1,701 400 124
ave 110
average of 3 runs 110
152

SERIAL #1 1008903ENERAC MODEL 2000
COMBUSTION TEST RECORD
FOR: WESTINGHOUSE CA.
TIME: 12:52,16DATE: 84/28/89
FUEL 2 OIL: 19368 BTU/LB
COMBUSTION EF ICIENCV: 93.7 XAMBIENT TEMPERATURE: 92 °FSTACK TEMPERATURE: 112 °FOXYGEN: 086.8 %CARBON MONOXIDE: 38 PPMCARBON DIOXIDE: 11.3 %COMBUSTIBLE GASES: 8.8 0STACK DRAFT (INCHES H20): + 88.8
<CESS AIR: 36 "OXIDES of NITROGEN: 128 PPMSULFUR DIOXIDE: 32 PPMCARBON MONOXIDE ALARM: 688 PPM
153

(This page left blank)
154

APPENDIX I
CALIBRATION DATA
155

(This page left blank)
156

STACK TEMPERATURE SENSOR CALIBRATION DATA FORM
Date S 9 1 Thermocouple number IAf 4Ar/ VwyLJCT-
Ambient temperature __ _C Barometric pressure in. Hg
Calibrator 94Ajt w Reference: mercury-in-glass ASY-)7 13Fother
Reference ThermocoupleReference thermometer potentiometer Temperaturebpoint Sourcea temperature, temperature, difference,number (specify) cC cc
q. s- c
aType of calibration system used.b(re f temp, C + 273) - (test thermom temp, 0 C + 273)-1
ref temp, 0 C + 273 100<1.5%.
Quality Assurance Handbook M5-2.5
157

Pitot tube assembly level? ,_ __ yes -- _ no
Pitot tube openings damaged? yes (explain below) ' no
_______ 0 (<100), 02 = c4 ° (<100), 1l = . (<50),
P2 = 1 o .(<50o)
= - e40, E A _____W
Z = A sin y = ,W (in.); <0.32 cm (<I/8 in.),
w = A sin e = _ _ (in.); <.08 cm (<1/32 in.)
P A P,' 7- in.
D t = 37'5
Comments: ( -,PNT1,rZ9- b i. ' L/() Z > f. 5 , -ri-0779-2'4-22- 1 -a/ E> i ,Iso lehfI, T ,-j C C,
F1- 2 2 ts6,vic -I'ry - =- 0, C+W7
Calibration required? yes 1 no
Quality Assurance Handbook F2-1.7
158

Pitot tube assembly level? 9 yes ,_no
Pitot tube openings damaged? yes (explain below) _ _ no
= 0 (<I0°), a2 C 0° (<100), Al = 0 (<50),
I02 =0/2o5<-o
Y0 = 0 0 °, A= / 1_. (in.)
z = A sin y = 0, C) - (in.); <0.32 cm (< 1/8 in.),
w A sin e = 0,0 cm (in.); <.08 cm (</32 in.)
M (in. 0. 3 /m (in,,A i7/3z o~3 "~ (a. b /73 L.=j i.
Dt = L.,75 - (in.)
Comments: C c.,ov 5 -;e L ) c-c) . F-7 & ijC,, " e , /7 MJ.;c F# L
FIC-2... 9s,, / ,E l2) . C,E/,/c,,yv 0. '4
Calibration required? yes L..-" n o
Quaa Jty Assurance Handbook M2-2.7
159

STACK TE PERATURE SENSOR CALIBRATION DATA FORM
Date w_7 Thermocouple number D3z f.- V 4.Ambient temperature *& C Barometric pressure r ./7-F in. Hg
Calibrator AT L4/ Reference: mercury-in-glass N!55
_______ other
Reference ThermocoupleReference b thermometer potentiometer Temperaturepoint Source temperature, temperature, difference,number a (specify) cc 0C , Cz
C C
&-, Mk
aEvery 30'C (50'F) for each reference point.
bvpe of calibration system used.
c[raf temp, OC -+273) - (test thermom temp, 'C 4 273)1ref temp, 6C + 273J 200<1.5%.
91Q ,7'T" E#. WTl/I /'C oFR £,f
Quality Assurance Handbook M2-2.10
160

STACK TEMPERATURE SENSOR CALIBRATION DATA FORM
Date / r_____- ____ Thermocouple number
Ambient temperature -J C Barometric pressure -9./7S- in. Hg
Calibrator 6:4 Reference: mercury-in-glass N8S5 Ct 77 - other
Re ference ThermocoupleReference b thermometer potentiometer Temperaturepointa Source temperature, temperature, difference,
number (specify) cC cC X cc
o m .0 2 -. 0 t.
aEvery 300C (500F) for each reference point.
bType of calibration system used.c[(Yef temp, °C + 273) - (test thermom temp, OC + 273)1[ tref temp, °C + 273J 100<1.5%.
mcs r& BEv i7WIAf /Oe- tk_
Quality Assurance Handbook M2-2.10
161

STACK TEMPERATURE SENSOR CALIBRATION DATA FORM
Date ______________Thermocouple number ()
Ambient temperature Y-6 -C Barometric pressure 9.17.5- in. Hg
Calibrator 67 St// Reference: mercury-in-glass /
S______ other
Reference ThermocoupleReference b thermometer potentiometer Temperaturec
point Source temperature, temperature, difference,number a (specify) 0C cC Dc
o IC-F o C
TIE Mp
aEvery 300C (500F) for each reference point.bType of calibration system used.c[ref temp, -C * 273) - test thermo' temp, 'C + 273)1
ref temp, 'C + 273 100< l.5-
% msrMA,- W/.Tejo, / ( eC
Quality Assurance Handbook M2-2.20
162

STACK SENSOR.CALIBRATION: 19-20 Oct 88
REFERENCE TESTSENSOR TEMPERATURE TEMPERATURE
(deg K) (deg K)X axis Y axis
P1 273.30 273.60 Regression Output:371.90 373.60 Constant -4.30447.00 450.20 Std Err of Y Est 0.20
R Squared 1.00No. of Observations 3.00Degrees of Freedom 1.00
X Coefficient(s) 1.02Std Err of Coef. 0.00
% Deviation @ 2000 F(1093.3 K) = 1-29%
P2 273.30 273.60 Regression Output:371.80 373.60 Constant -4.27447.60 450.80 Std Err of Y Est 0.11
R Squared 1.00No. of Observations 3.00Degrees of Freedom 1.00
X Coefficient(s) 1.02Std Err of Coef. 0.00
% Deviation @ 2000 F(1093.3 K) = 1.25%
P3 273.30 274.10 Regression Output:371.90 374.10 Constant -2.96447.60 450.80 Std Err of Y Est 0.03
R Squared 1.00No. of Observations 3.00Degrees of Freedom 1.00
X Coefficient(s) 1.01Std Err of Coef. 0.00
% Deviation @ 2000 F(1093.3 K) = 1.11%
P4 273.30 273.60 Regression Output:371.80 373.60 Constant -4.27447.60 450.80 Std Err of Y Est 0.11
R Squared 1.00No. of Observations 3.00Degrees of Freedom 1.00
X Coefficient(s) 1.02
Std Err of Coef. 0.00
Deviation @ 2000 F(1093.3 K) = 1.271
163

+
'.o 0
0 +
0
S-4i
3 0 .0
0. > (U ', ' 0
Ll s. 1"4-
cu.- .0 01 ca
ri >4 r.- $4 i 4 4 41S- o - A. 1 A (U J4
< x +j 411(a *- v 1 L $ a
L41 41*U co to-141 '- to W L1 0i
.0 2i m - wa4H j 00 cc U 0 C4V Q
E-4 41 Go -H a1:0% 4) ' U *a 4).w 41 41 0)
~l. a . 041 Q0 41 1% .0 -4 v .
4)~~6 cowoA) 4 44 4
3:..4 W 441bo4 0 0 - 0 41
CAiA 4j a2- cis 4 W us4 >
75- 41 W*1r 0 'u t 0 0L 0 -610 0006 41 43 L
41 Q 1 =r =r -M.A Q? 41 uC(U :4-') 0 0 00 04 4 cc W
o) 0 40 0 - .
43 40 43 a a. w 0- C
460W 41 4 - 1 41 Ai 43 VU 40 s L".1 -0 4.W1Aw m )
064 > % Oa>14- 1C: m. m 04 - 0 0 Q44 :3 0 610 0
E4~~~~' 1:6 ur-.4 L i L C
v3 (a CA43 w4 w4 w4 do z3 0 1 4 i 0 g0 4) *.
(A0 6 43 - ) 4.3 -A ol a, w4 FA H $i0 Li 41 1 a'W a a eU ' 4j~ 4u " a w s
4J Li 44 -4 r-4 44.VQ1 w 4 > 0 .
to 41 *'a
164

<o'-0%
> t /
04 w
~-(A u 414
J.43
>4 -a 4j-r44
04, 4 4
4 cn4
E--0 41 9
Ld* 4Q4 *1 > r
'0-4 a441. v~ a
Vt p- o a 4, .0a41 a a -.4 4 .40 . 4 u w
4j 4 Or 1 a '4
'.4 A 614 .1 4
U -A '.,4
r44 54 C'1A ( a to 41
-i4 44 644 41 J
\A 0 0 W 4 a 0) U+ U :-ow w 14 ___4 4130
0 A U4 to 93 z 44-9 41 6A1U ol 0 4 51
G4. a00 41 4; -.4
~0 41~>44 U 10. A 1-
041 As .4 Uw 26 *4-4. U-4 .-4- 4A a '4 a'4
A.A 0a 4 0 uE-4le - \ 0 414.0 42 0004
-n a$ .0 4 U -04 4s 4Fa1 a 9.. A0 404 u 41
4141 00000 4 Uz 00 U 3 u4 u41'd ~41 U 44 41 u 6
54 45 4 w a a 41 4 40 40 00 a 0- 5
411 00, 0.%4U
4104 &A 4) f- W54 C
A2 - g .044 U *4 0-4 a
'U 4,4 4, 416 45154 u~ 61__ V4 >455 5 8 4
~ 2 '4 -~ 4165

.* . .. ., 0
U) . - ........
0( . . . . ..
.. . . . . ..... . . ............... 0
.. . . . .. . . . .. .. .. ...~~...................................~L
............. . . . . . . . .. .. .. .
00. . . . . . . . . . . . . . ...
.... ...
. . . . ... . . . . . . . .0
w. . ... ... .. ..... . . . . .. . . . .. . . . .
. ................
.i t .i -o .......0'': ro .~ . ~ ...f .N .: .... .... .
JO~flS ~flflDV
166 .. ..

VACUUM GAUGE MANOMETER DELTA
mm. Hg mm. Hg
Leg A Leg B P
3 828 90 1 2
25 818 1.00 21 4
s0 805 114 48 2
75 793 126 72 3
100 780 139 98 2
Barometric Pressure 739 mm Hg
167

VOLUMES OF NOX FLASKS WITH VALVES(ml)
1) 2085 17) 2066
2) 2054 18) 2074
3) 2075 19) 2061
4) 2070 20) 2102
5) 2090 21) 2080
6) 2072 22) 2062
7) 2066 23) 2086
8) 2070 24) 2066
9) 2089 25) 2070
10) 2080 26) 2059
11) 2084 27) 2059
12) 2072 28) 2083
13) 2059 29) 2065
14) 2080 30) 2063
15) 2082 31) 2074
16) 2043 32) 2086
168

Calibration of Rotometer
M 4.0 +EA 3.5 +SU L 3.0 + +R /IE m 2.5 + +D i
n 2.0 + +F IL 1.5 + +
~0W 1.0 + +
0.5 + +
+ + + + + 40.5 1.0 1.5 2.0 2.5 3.0
ACTUAL FLOW RATE' (L/min)
note: Buck Bubble Tube Calibrator used to establish actual flow rate.
169

NOZZLE CALIBRATION DATA FORM
Date /q k ? I Calibrated by c:A-yiW c: kzizraj
Nozzle Nozzle Diametera b cidentification D1, D , D AD, D b
number mm (In.) mm tin.) MM Tin.) )mm (in.) avg
ii, 75 • 37g' . 77 ~o
where:
a = three different nozzles diameters, mm (in.); eachdiameter must be within (0.025 mm) 0.001 in.
AD= maximum difference between any two diameters, mm (in.),
AD <(0.10 mm) 0.004 in.
C Davg average of D, D2, and D3
Quality Assurance Handbook M5-2.6
170

Distribution ListCopies
HQ USAF/SGPA 2Boiling AFB DC 20332-6188
HQ AFSC/DEEV 2Andrews AFB DC 20334-5000
HQ AFSC/SGPB 2Andrews AFB DC 20334-5000
HQ MAC/DEEV 2Scott AFB IL 62225-5001
USAF Regional Medical Center Weisbaden/SGB 1APO New York 09220-5300
OL AD, AFOEHL 1APO San Francisco 96274-5000
USAFSAM/TSK/EDH 1Brooks AFB TX 78235-5301
HQ HSD/XAE IBrooks AFB TX 78235-5000
Defense Technical Information Center (DTIC) 2Cameron StationAlexandria VA 22304-6145
HQ USAF/LEEV 2Boiling AFB DC 20330-5000
HQ AFESC/RDV 2Tyndall AFB FL 32403-6001
USAF Clinic Norton/SGPB 4Norton AFB CA 92409-5300
63 CES/DENorton AFB CA 92409-5000 1
171
U.S. GOVERNMENT PRNTING OFFICE: 19 -n | .?-0 O2 =