BOETrends in Lending July09
12
Trends in Lending July 2009
Transcript of BOETrends in Lending July09

8/14/2019 BOETrends in Lending July09
http://slidepdf.com/reader/full/boetrends-in-lending-july09 1/12
Trends in Lending
July 2009
8/14/2019 BOETrends in Lending July09
http://slidepdf.com/reader/full/boetrends-in-lending-july09 2/12
BANK OF ENGLAND
Trends in Lending July 2009
This publication presents the Bank of England’s assessment of the latest trends in lending to the
UK economy. It draws mainly on long-established official data sources, such as the existing
monetary and financial statistics collected by the Bank. These data are supplemented by the
results of a new data set, established by the Bank in late 2008, to provide more timely data
covering aspects of lending to the UK corporate and household sectors.(1) The Bank collects
these data on behalf of the Lending Panel,(2) which was established by the Chancellor in
November 2008 to monitor lending to the UK economy and to promote best practice across theindustry in dealing with borrowers facing financial difficulties.
The new data set — referred to as ‘Lending Panel data’ — covers the major UK lenders:(3) Banco
Santander, Barclays, HSBC, Lloyds Banking Group, Nationwide and Royal Bank of Scotland.
Together they accounted for around 65% of the stock of lending to businesses, 50% of the stock
of consumer credit, and 70% of the stock of mortgage lending at the end of 2008. These data
have provided a useful input to discussions between the major lenders and Bank staff, giving
staff a better understanding of the business developments driving the figures and this
intelligence is reflected in the report. The report also draws on intelligence gathered by the
Bank’s regional Agents and from market contacts, as well as the results of other surveys. The
focus of the report is on lending, but broader credit market developments, such as those relating
to trade credit or capital market issuance, may be discussed where relevant.
The report covers official data up to May 2009, supplemented by Lending Panel data and
intelligence gathered up to end June 2009. Unless stated otherwise, the data reported cover
lending in both sterling and foreign currency, are expressed in sterling terms, and are not
seasonally adjusted. Lending Panel data are provided to the Bank on a ‘best endeavours’ basis.
This, together with their relative timeliness, means that they may not be as accurate as
established data sets. As a result, care is needed in interpreting the Lending Panel data
presented in this report.
(1) For a fuller background please refer to the first edition of Trends in Lending available at:www.bankofengland.co.uk/publications/other/monetary/TrendsApril09.pdf.
(2) The Lending Panel comprises Government, lenders, consumer, debt advice and trade bodies, regulators and the Bank of England. Seewww.hm-treasury.gov.uk/press_126_08.htm.
(3) Membership of the group of major UK lenders is based on the provision of credit to UK-resident companies and individuals, regardlessof the country of ownership.

8/14/2019 BOETrends in Lending July09
http://slidepdf.com/reader/full/boetrends-in-lending-july09 3/12
Executive summary 3
1 Lending to UK businesses 4
2 Mortgage lending 7
3 Consumer credit 10
Glossary and other information 11
Contents
8/14/2019 BOETrends in Lending July09
http://slidepdf.com/reader/full/boetrends-in-lending-july09 4/12
Executive summary 3
The flow of net lending to UK businesses remained negative in May. Some UK businesses repaid bank debt using funds raised on
the capital markets. But, taken together, funds raised by businesses from banks and capital markets remained weak. Spreads and
fees are reported to have risen in recent months, which the major UK lenders have attributed to higher longer-term funding costs
and credit risk, though some of them thought that spreads may now be close to reaching a plateau. And, for some major UK
lenders, a stabilisation in the economic outlook, as well as slightly more plentiful and cheaper funding, was expected to help them
make credit more available over the next three months. Lenders reported little actual or expected increase in demand for credit,
except for balance sheet restructuring.
Official data for May showed the lowest flow of total net mortgage lending since the monthly series began in April 1993, but the
major UK lenders reported that in June their flow of net mortgage lending rose a little. The major UK lenders reported a furtherrise in approvals for house purchase in June, suggesting that mortgage lending for house purchase may continue to strengthen in
coming months. Fixed mortgage rates rose in June, in part reflecting increases in swap rates. Some major UK lenders have
reported that signs of stabilisation in housing market activity and prices, and the margins prevailing on higher LTV products, have
slightly increased their appetite to lend at higher LTVs.
Net flows of consumer credit remained weak in May. Within the total, net consumer credit excluding credit cards remained
subdued, but was positive for the first time since December 2008. Spreads on credit card lending have continued to rise, reflecting
higher actual and expected default rates. None of the major UK lenders reported any plans to expand the availability of consumer
credit, and they had yet to detect any significant signs of an increase in demand.
Executive summary
8/14/2019 BOETrends in Lending July09
http://slidepdf.com/reader/full/boetrends-in-lending-july09 5/12
4 Trends in Lending July 2009
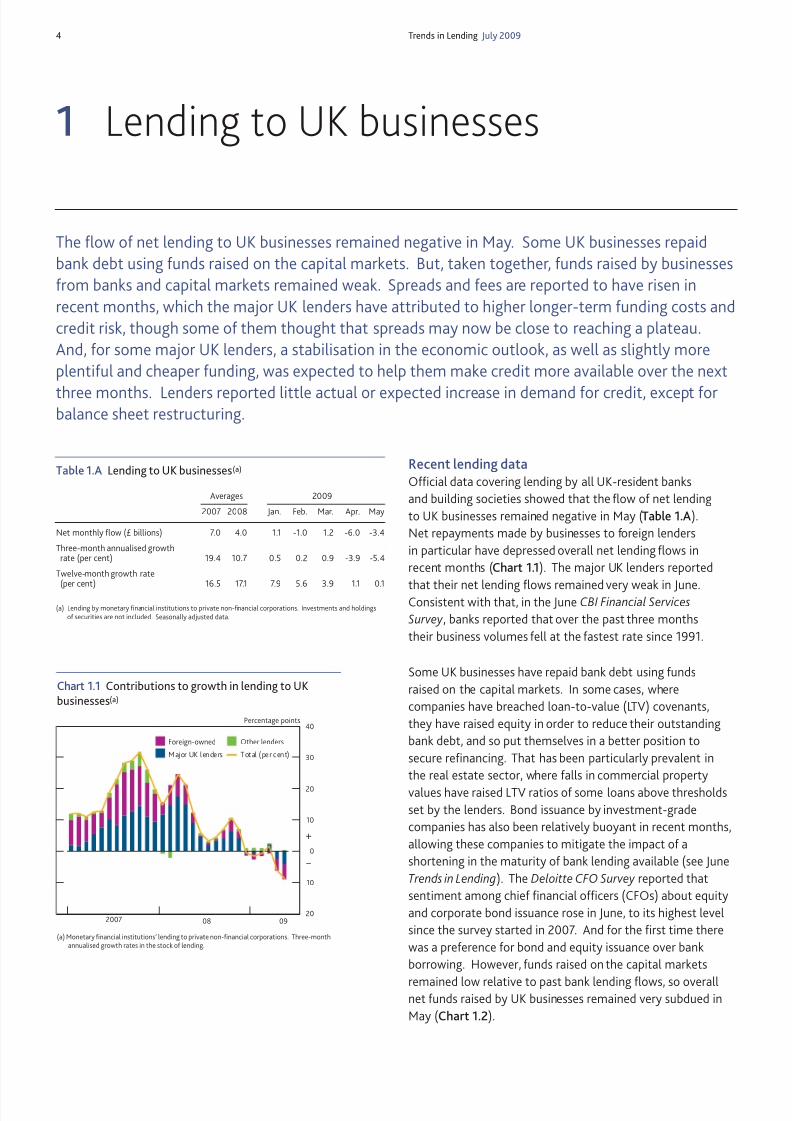
Recent lending dataOfficial data covering lending by all UK-resident banks
and building societies showed that the flow of net lending
to UK businesses remained negative in May (Table 1.A).
Net repayments made by businesses to foreign lenders
in particular have depressed overall net lending flows in
recent months (Chart 1.1). The major UK lenders reported
that their net lending flows remained very weak in June.Consistent with that, in the June CBI Financial Services
Survey , banks reported that over the past three months
their business volumes fell at the fastest rate since 1991.
Some UK businesses have repaid bank debt using funds
raised on the capital markets. In some cases, where
companies have breached loan-to-value (LTV) covenants,
they have raised equity in order to reduce their outstanding
bank debt, and so put themselves in a better position to
secure refinancing. That has been particularly prevalent in
the real estate sector, where falls in commercial property
values have raised LTV ratios of some loans above thresholds
set by the lenders. Bond issuance by investment-grade
companies has also been relatively buoyant in recent months,
allowing these companies to mitigate the impact of a
shortening in the maturity of bank lending available (see June
Trends in Lending). The Deloitte CFO Survey reported that
sentiment among chief financial officers (CFOs) about equity
and corporate bond issuance rose in June, to its highest level
since the survey started in 2007. And for the first time there
was a preference for bond and equity issuance over bank
borrowing. However, funds raised on the capital markets
remained low relative to past bank lending flows, so overallnet funds raised by UK businesses remained very subdued in
May (Chart 1.2).
1 Lending to UK businesses
The flow of net lending to UK businesses remained negative in May. Some UK businesses repaidbank debt using funds raised on the capital markets. But, taken together, funds raised by businessesfrom banks and capital markets remained weak. Spreads and fees are reported to have risen inrecent months, which the major UK lenders have attributed to higher longer-term funding costs andcredit risk, though some of them thought that spreads may now be close to reaching a plateau.And, for some major UK lenders, a stabilisation in the economic outlook, as well as slightly moreplentiful and cheaper funding, was expected to help them make credit more available over the next
three months. Lenders reported little actual or expected increase in demand for credit, except forbalance sheet restructuring.
20
10
0
10
20
30
40
2007 08 09
Percentage points
Other lendersForeign-owned
Major UK lenders Total (per cent)
+
–
(a) Monetary financial institutions’ lending to private non-financial corporations. Three-monthannualised growth rates in the stock of lending.
Chart 1.1 Contributions to growth in lending to UKbusinesses(a)
Table 1.A Lending to UK businesses(a)
Averages 2009
2007 2008 Jan. Feb. Mar. Apr. May
Net monthly flow (£ billions) 7.0 4.0 1.1 -1.0 1.2 -6.0 -3.4
Three-month annualised growthrate (per cent) 19.4 10.7 0.5 0.2 0.9 -3.9 -5.4
Twelve-month growth rate(per cent) 16.5 17.1 7.9 5.6 3.9 1.1 0.1
(a) Lending by monetary financial institutions to private non-financial corporations. Investments and holdingsof securities are not included. Seasonally adjusted data.

8/14/2019 BOETrends in Lending July09
http://slidepdf.com/reader/full/boetrends-in-lending-july09 6/12
Section 1 Lending to UK businesses 5
10
5
0
5
10
15
20
2007 08 09
£ billions
Loans Bonds
Equity Total
+
–
(a) Private non-financial corporations. Loans are seasonally adjusted, but bond and equityissuance is not, as it has been found not to be significantly seasonal. Commercial paper isincluded within bonds.
Chart 1.2 Net funds raised by UK businesses(a) Corporate loan pricingThe total cost of bank finance to a company can be
decomposed into the fees charged by the bank to provide
facilities, the spread over a given reference rate (Libor or Bank
Rate) at which loans are offered, and the prevailing level of
that reference rate in the financial markets. In the Bank ofEngland’s 2009 Q2 Credit Conditions Survey a net balance of
lenders reported that spreads and fees had risen over the three
months to mid-June, though the net balance was much
smaller than in previous quarters (Chart 1.3). Contacts of the
Bank’s regional Agents have also continued to report paying
higher spreads and fees on renewed or extended facilities.
One factor that lenders have cited for the upward pressure on
spreads over Libor or Bank Rate has been the difficulty and
expense of raising longer-term funding. Funding conditions for
lenders have eased slightly over the past three months,moderating somewhat that influence on spreads. On the
other hand, in the Credit Conditions Survey lenders continued
to report that defaults and losses on loans to companies had
increased and were expected to rise further. This deterioration
in the credit quality of borrowers has caused lenders to widen
spreads to cover the higher expected cost of default. Looking
forward, in recent discussions with the Bank some major UK
lenders thought that spreads may be close to reaching a
plateau. Indeed, several reported recent instances where
renewed competition to grant loans had led to some
compression of spreads. Some lenders reported that a further
easing in longer-term funding conditions might also allow
them to reduce spreads over Libor or Bank Rate.
Supply and demandThe amount of lending and its price depend on the interaction
of demand and supply factors. Disentangling the separate
influences of changes in the supply of and demand for credit is
extremely difficult, though surveys can help. In the Credit
Conditions Survey a net balance of lenders reported that they
had increased the availability of credit over the past three
months, albeit by less than they had expected (Chart 1.4).
Some contacts of the Bank’s regional Agents felt that banks’appetite for lending had increased in June, but others
continued to report difficulties in accessing finance, notably in
the property and construction sectors and some retail sectors.
The flow of gross new facilities granted by the major UK
lenders has not changed significantly since the beginning of
the year (Chart 1.5). Those new facilities are reported to
continue to reflect mainly the refinancing of existing
customers’ facilities, and so have not flowed through into
additional (or net) lending.
A net balance of lenders in the Credit Conditions Survey
expected to increase further the availability of credit in
2009 Q3, particularly those lenders who have made lending
commitments under the Government’s Asset Protection
Scheme (APS). A stabilisation in the economic outlook, as well
80
70
60
50
40
30
20
10
0
10
20
Q2 Q4 Q2 Q4 Q2 Q2 Q4 Q2 Q4 Q2
2007 08 09 2007 08 09
Spread on loans Fees/commissions on loans
Net percentage balances
Increase in spreads and fees
+
–
(a) Net percentages are calculated by weighting together the responses of those lenders whoanswered the questions. The blue bars show the responses over the previous three months.The red diamonds show the expectations over the next three months. Expectations balanceshave been moved forward a quarter so that they can be compared with the actual outturns inthe following quarter.
(b) A negative balance indicates an increase in spreads and fees. Covers lending to medium-sizedcompanies only.
Chart 1.3 Credit Conditions Survey : spreads and fees onloans(a)(b)
60
50
40
30
20
10
0
10
20
30
40
50
Q2 Q4 Q2 Q4 Q2 Q2 Q4 Q2 Q4 Q2 Q2 Q4 Q2 Q4 Q2
2007 08 09 2007 08 09 2007 08 09
Availability of credit Demand frommedium PNFCs(c)
Demand fromlarge PNFCs(c)
Net percentage balances
+
–
(a) See footnote to Chart 1.3.(b) A positive balance indicates that more credit is available or there is greater demand.(c) Private non-financial corporations.
Chart 1.4 Credit Conditions Survey : corporate creditavailability and demand for credit(a)(b)

8/14/2019 BOETrends in Lending July09
http://slidepdf.com/reader/full/boetrends-in-lending-july09 7/12
6 Trends in Lending July 2009
6
5
4
3
2
1
0
1
2
3
4
1988 91 94 97 2000 03 06 09
Per cent of nominal GDP
+–
Sources: ONS and Bank calculations.
(a) Private non-financial corporations. Four-quarter moving average is shown. Financial surplusis measured as the difference between total income and outgoings.
Chart 1.6 Financial surplus of UK businesses(a)
as slightly more plentiful and cheaper funding, was expected
to help increase credit availability.
In the Credit Conditions Survey , and in discussions with the
Bank, lenders have continued to report subdued demand for
new loans, in particular for capital investment. Contacts of theBank’s regional Agents have reported very weak investment
intentions and a preference for preserving cash — as their
normal tendency to hoard cash at a time of uncertain demand
is being exacerbated by concerns over the availability of
working capital. Since the beginning of 2008, the Deloitte CFO
Survey has reported that a net balance of companies think that
UK corporate balance sheets are overleveraged. Lower
spending on capital equipment and inventories by businesses
has allowed them to maintain a historically high financial
surplus (defined as total income net of outgoings) in the face
of lower profits (Chart 1.6). This financial surplus has beenused in part to repay bank debt and so reduce leverage.
Looking forward, in the Credit Conditions Survey lenders
expected some increase in loan demand from small and
medium-sized companies in 2009 Q3. Demand from large
companies was expected to be unchanged (Chart 1.4). The
divergence perhaps reflects the greater ability of large
companies to access the capital markets. Demand for lending
was still mainly expected to be for balance sheet restructuring
— the refinancing of existing loans, sometimes also requiring
the borrower to inject more equity. Weaker spending on
capital equipment and inventories was expected to continue toreduce demand for credit. In the June Deloitte CFO Survey
there was a big increase in the percentage of companies
expecting mergers and acquisitions (M&A) activity to increase
over the next year. But in the Credit Conditions Survey , and in
discussions with the Bank, lenders reported only very tentative
expectations of greater loan demand for that purpose.
0
2
4
6
8
10
12
Dec. Jan. Feb. Mar. Apr. May June
£ billionsOther
Construction
Renting andother business activities
Hotels and restaurants
Wholesale and retail trade
Manufacturing
Real estate
2008 09
(a) Lending Panel data, available from December 2008 only. Lending Panel data are generally oflower quality than existing data sources and have a short history. As a result, less weightshould be attached to this chart than to those using existing data sources.
Chart 1.5 Gross new loan facilities granted by the majorUK lenders(a)
8/14/2019 BOETrends in Lending July09
http://slidepdf.com/reader/full/boetrends-in-lending-july09 8/12
Section 2 Mortgage lending 7
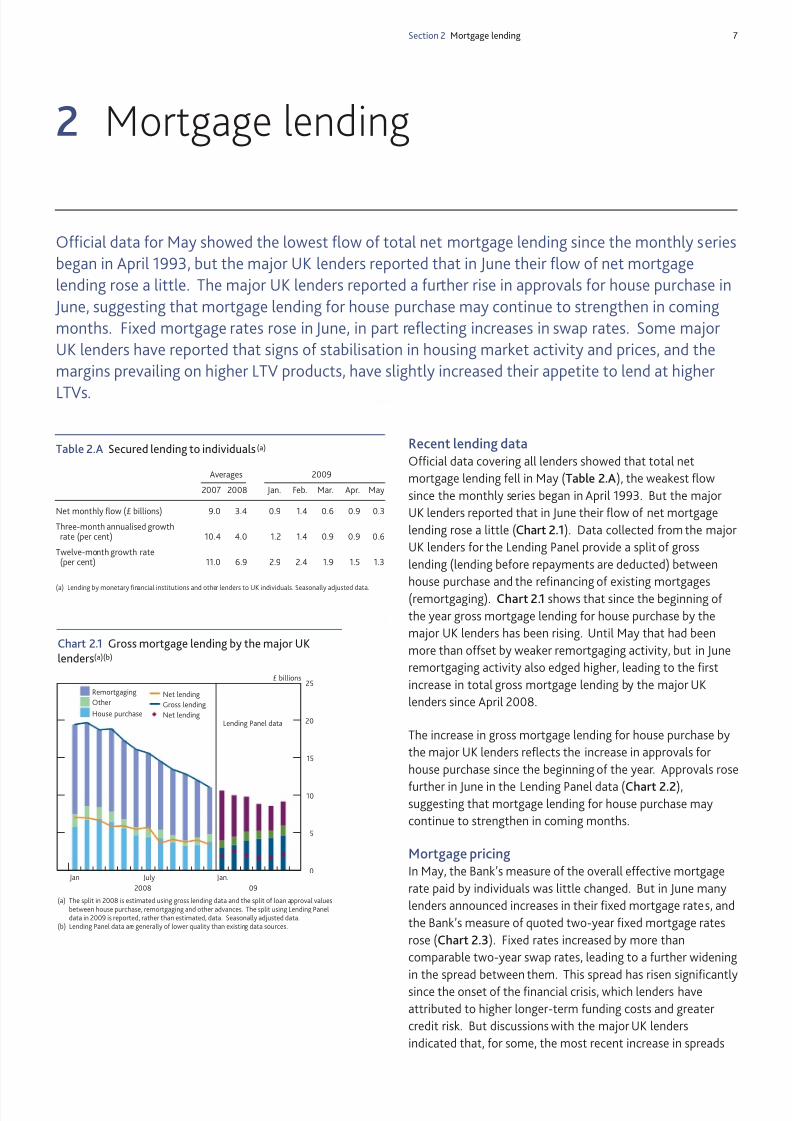
Recent lending dataOfficial data covering all lenders showed that total net
mortgage lending fell in May (Table 2.A), the weakest flow
since the monthly series began in April 1993. But the major
UK lenders reported that in June their flow of net mortgage
lending rose a little (Chart 2.1). Data collected from the major
UK lenders for the Lending Panel provide a split of gross
lending (lending before repayments are deducted) between
house purchase and the refinancing of existing mortgages
(remortgaging). Chart 2.1 shows that since the beginning of
the year gross mortgage lending for house purchase by the
major UK lenders has been rising. Until May that had been
more than offset by weaker remortgaging activity, but in June
remortgaging activity also edged higher, leading to the first
increase in total gross mortgage lending by the major UK
lenders since April 2008.
The increase in gross mortgage lending for house purchase by
the major UK lenders reflects the increase in approvals for
house purchase since the beginning of the year. Approvals rose
further in June in the Lending Panel data (Chart 2.2),suggesting that mortgage lending for house purchase may
continue to strengthen in coming months.
Mortgage pricingIn May, the Bank’s measure of the overall effective mortgage
rate paid by individuals was little changed. But in June many
lenders announced increases in their fixed mortgage rates, and
the Bank’s measure of quoted two-year fixed mortgage rates
rose (Chart 2.3). Fixed rates increased by more than
comparable two-year swap rates, leading to a further widening
in the spread between them. This spread has risen significantly
since the onset of the financial crisis, which lenders have
attributed to higher longer-term funding costs and greater
credit risk. But discussions with the major UK lenders
indicated that, for some, the most recent increase in spreads
2 Mortgage lending
Official data for May showed the lowest flow of total net mortgage lending since the monthly seriesbegan in April 1993, but the major UK lenders reported that in June their flow of net mortgagelending rose a little. The major UK lenders reported a further rise in approvals for house purchase in June, suggesting that mortgage lending for house purchase may continue to strengthen in comingmonths. Fixed mortgage rates rose in June, in part reflecting increases in swap rates. Some majorUK lenders have reported that signs of stabilisation in housing market activity and prices, and themargins prevailing on higher LTV products, have slightly increased their appetite to lend at higher
LTVs.
0
5
10
15
20
25
Jan July Jan.
House purchase
Other
Remortgaging
Gross lending
Net lending
Net lending
£ billions
Lending Panel data
2008 09
(a) The split in 2008 is estimated using gross lending data and the split of loan approval valuesbetween house purchase, remortgaging and other advances. The split using Lending Paneldata in 2009 is reported, rather than estimated, data. Seasonally adjusted data.
(b) Lending Panel data are generally of lower quality than existing data sources.
Chart 2.1 Gross mortgage lending by the major UKlenders(a)(b)
Table 2.A Secured lending to individuals(a)
Averages 2009
2007 2008 Jan. Feb. Mar. Apr. May
Net monthly flow (£ billions) 9.0 3.4 0.9 1.4 0.6 0.9 0.3
Three-month annualised growthrate (per cent) 10.4 4.0 1.2 1.4 0.9 0.9 0.6
Twelve-month growth rate(per cent) 11.0 6.9 2.9 2.4 1.9 1.5 1.3
(a) Lending by monetary financial institutions and other lenders to UK individuals. Seasonally adjusted data.

8/14/2019 BOETrends in Lending July09
http://slidepdf.com/reader/full/boetrends-in-lending-july09 9/12
8 Trends in Lending July 2009
may also have reflected the strength of demand for fixed-rate
mortgages relative to their capacity to fund them. Since the
beginning of the year, borrowers have increasingly chosen to
take out fixed-rate mortgages, which accounted for around
70% of new mortgages in May.
Supply and demandAs with corporate lending, it is difficult to identify precisely the
separate influences on overall mortgage lending of changes in
the supply of and demand for mortgages. On the supply side,
in the Credit Conditions Survey a net balance of lenders
reported that there had been an increase in the availability of
secured credit to households over the three months to
mid-June, the first significantly positive balance since the
survey began in 2007 Q2 (Chart 2.4). As with lending to
businesses, that partly reflects the impact of the lending
commitments made under the Government’s APS. The majorUK lenders have reported that approval rates for mortgages
have edged higher in recent months.
Over the past few months contacts of the Banks’ regional
Agents have reported an increase in the range of mortgage
products available. And according to Moneyfacts Group, the
number of 90%-plus LTV mortgages available increased
slightly in both May and June, though remains only around one
tenth of the number on offer a year ago. Moreover, the extra
cost of borrowing at 90% LTV relative to 75% LTV is much
higher than prior to the onset of the financial crisis (Chart 2.3).
Some major UK lenders have reported that signs of
stabilisation in housing market activity and prices, and the
margins prevailing on higher LTV products, have made them a
little more inclined to lend at higher LTV ratios. Consistent
with that, a net balance of lenders in the Credit Conditions
Survey expected to increase the availability of mortgages to
higher (>75%) LTV borrowers in 2009 Q3, alongside a slight
easing in credit scoring criteria (Chart 2.4). The slight increase
in risk appetite may have been supported by lower than
expected increases in default rates on secured lending over the
past three months. In discussions with the Bank, most lenderssaid they had become less pessimistic about defaults since the
beginning of the year. And in June the Council of Mortgage
Lenders revised down its projections for arrears and
repossessions in 2009, citing the beneficial effects of low
interest rates and increased forbearance by the lenders.
In the Credit Conditions Survey , demand for mortgages for
house purchase was reported to have increased in the three
months to mid-June. The Royal Institution of Chartered
Surveyors’ (RICS) new buyer enquiries balance has continued
to rise in recent months, indicating that demand for mortgages
for house purchase may rise further. And the major UK lenders
have reported rising applications for house purchase
mortgages. But lenders and the Bank’s regional Agents have
said that difficulties in valuing properties in present market
0
2
4
6
8
2007 08 09
Per cent
95% loan-to-value(b) 90% loan-to-value(c)
75% loan-to-value
Two-year swap rate(d)
(a) The Bank’s quoted interest rates series comprise data from up to 31 monetary financialinstitutions.
(b) Series finishes in April 2008, as thereafter only two or fewer products are offered.(c) Series is only available on a consistent basis back to May 2008, as earlier periods require a
greater degree of estimation, and is not published for March-May 2009 as only two or fewerproducts were offered in that period. The Ju ne observation is marked with the diamond.
(d) End-month rate.
Chart 2.3 Quoted interest rates on two-year fixed-ratemortgages(a)
80
60
40
20
0
20
40
60
Q2 Q4 Q2 Q4 Q2 Q2 Q4 Q2 Q4 Q2 Q2 Q4 Q2 Q4 Q2
2007 08 09
Overall creditavailability
Availability toborrowers withmore than 75%loan to value
Changes in creditscore criteria
Net percentage balances
n.a.
Tighter criteria
2007 08 09 2007 08 09
+
–
(a) See footnote to Chart 1.3.(b) A positive balance indicates that more credit is available or credit score criteria are less strict.
The balance for overall credit availability in 2007 Q3 was 0.1 but is not visible on the chart.
Chart 2.4 Credit Conditions Survey : mortgage credit
availability(a)(b)
0
20
40
60
80
100
120
140
2007 08 09
Major UK lenders(b)
Major UK lenders (Lending Panel data)(b)
Total(c)
Thousands
(a) Seasonally adjusted.(b) Gross approvals data.(c) Monetary financial institutions and other lenders. These data are net of cancellations and
hence the total can fall below the gross approvals data shown for the major UK lenders.
Chart 2.2 Approvals for mortgages for house purchase(a)
8/14/2019 BOETrends in Lending July09
http://slidepdf.com/reader/full/boetrends-in-lending-july09 10/12
Section 2 Mortgage lending 9
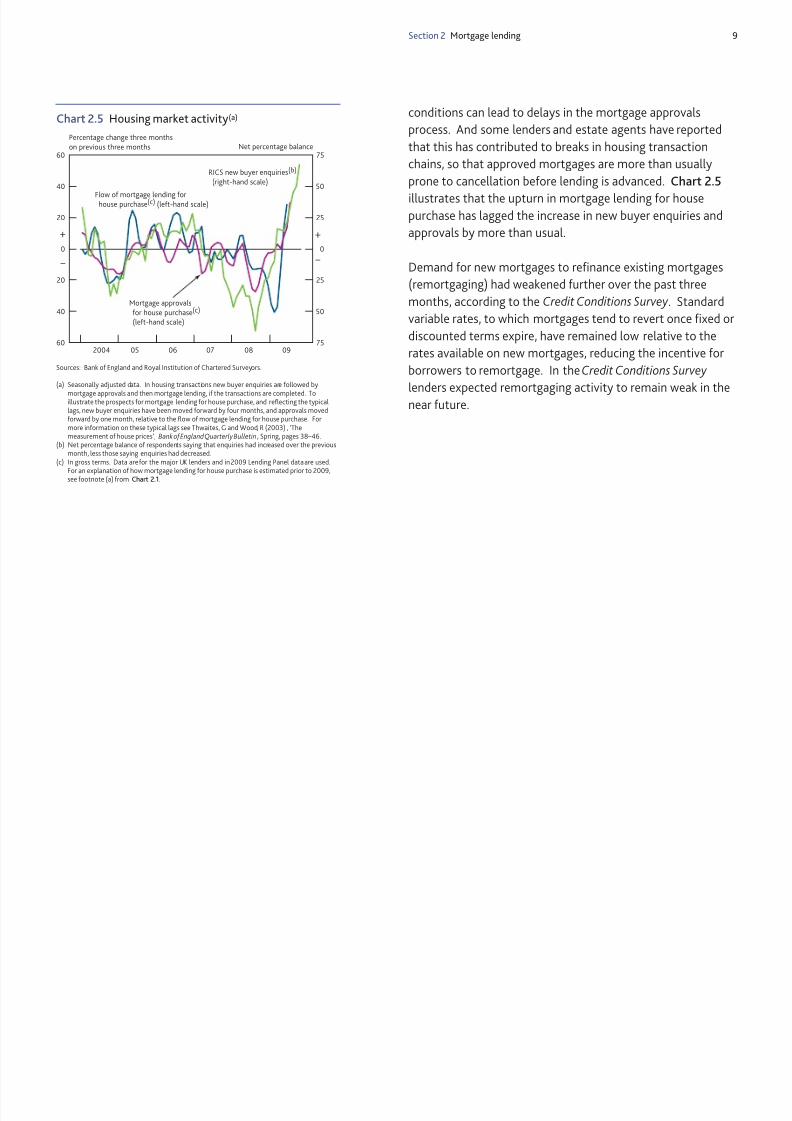
conditions can lead to delays in the mortgage approvals
process. And some lenders and estate agents have reported
that this has contributed to breaks in housing transaction
chains, so that approved mortgages are more than usually
prone to cancellation before lending is advanced. Chart 2.5
illustrates that the upturn in mortgage lending for housepurchase has lagged the increase in new buyer enquiries and
approvals by more than usual.
Demand for new mortgages to refinance existing mortgages
(remortgaging) had weakened further over the past three
months, according to the Credit Conditions Survey . Standard
variable rates, to which mortgages tend to revert once fixed or
discounted terms expire, have remained low relative to the
rates available on new mortgages, reducing the incentive for
borrowers to remortgage. In the Credit Conditions Survey
lenders expected remortgaging activity to remain weak in thenear future.
60
40
20
0
20
40
60
2004 05 06 07 08 0975
50
25
0
25
50
75Net percentage balance
Percentage change three monthson previous three months
RICS new buyer enquiries(b)
(right-hand scale)
Flow of mortgage lending forhouse purchase(c) (left-hand scale)
Mortgage approvalsfor house purchase(c)
(left-hand scale)
+
–
+
–
Chart 2.5 Housing market activity(a)
Sources: Bank of England and Royal Institution of Chartered Surveyors.
(a) Seasonally adjusted data. In housing transactions new buyer enquiries are followed by
mortgage approvals and then mortgage lending, if the transactions are completed. Toillustrate the prospects for mortgage lending for house purchase, and reflecting the typicallags, new buyer enquiries have been moved forward by four months, and approvals movedforward by one month, relative to the flow of mortgage lending for house purchase. Formore information on these typical lags see Thwaites, G and Wood, R (2003) , ‘Themeasurement of house prices’, Bank of England Quarterly Bulletin, Spring, pages 38–46.
(b) Net percentage balance of respondents saying that enquiries had increased over the previousmonth, less those saying enquiries had decreased.
(c) In gross terms. Data are for the major UK lenders and in 2009 Lending Panel data are used.For an explanation of how mortgage lending for house purchase is estimated prior to 2009,see footnote (a) from Chart 2.1.

8/14/2019 BOETrends in Lending July09
http://slidepdf.com/reader/full/boetrends-in-lending-july09 11/12
10 Trends in Lending July 2009
Recent lending data
Total net consumer credit flows remained weak in May(Table 3.A), so the twelve-month growth rate in the stock of
consumer credit continued to drift down. Within the total, net
consumer credit excluding credit cards remained subdued, but
was positive for the first time since December 2008 (Chart 3.1).
The major UK lenders in aggregate also reported a very slight
improvement in net lending via personal loans in June.
Consumer credit pricingEffective interest rates on overdrafts and personal loans have
fallen in recent months, though by much less than Bank Rate
and Libor. By contrast, rates on credit cards have remained
broadly unchanged. This widening in spreads is reported toreflect in part lenders’ perceptions of heightened credit risk on
consumer credit. In the 2009 Q2 Credit Conditions Survey
default rates and losses on consumer credit were reported to
have risen over the past three months, and further increases
were anticipated. Chart 3.2 shows how, for credit cards, this
has coincided with the sharp increase in spreads.
Supply and demandA net balance of lenders in the Credit Conditions Survey
reported that they had reduced the availability of consumer
credit over the past three months, and by more than they hadanticipated. Over the next three months, lenders expected
credit limits to be reduced and credit scoring criteria to be
tightened further. In discussions with the Bank, none of the
major UK lenders indicated any plans to expand the availability
of consumer credit.
The tentative recovery in net consumer credit excluding credit
cards might be consistent with the recent pick-up in private car
sales, some of which is likely to have been financed by personal
loans. According to the Society of Motor Manufacturers and
Traders, new private car registrations in June were 4% higher
than a year ago, the first positive annual growth rate since
November 2007. But in discussions with the Bank, the major
UK lenders had yet to detect any significant signs of an
increase in demand for personal loans.
3 Consumer credit
Net flows of consumer credit remained weak in May. Within the total, net consumer creditexcluding credit cards remained subdued, but was positive for the first time since December 2008.Spreads on credit card lending have continued to rise, reflecting higher actual and expected defaultrates. None of the major UK lenders reported any plans to expand the availability of consumercredit, and they had yet to detect any significant signs of an increase in demand.
0.5
0.0
0.5
1.0
1.5
2.0
2.5
2007 08 09
£ billions
Other consumer credit
Credit cardTotal
+
–
(a) Flow of net unsecured lending by monetary financial institutions and other lenders to UKindividuals. Seasonally adjusted data. Sterling lending only.
Chart 3.1 Consumer credit(a)
30
20
10
0
10
20
30
40
50
60
70
2007 08 09
7
8
9
10
11
12
13
14
15
16
17
Spread of quoted credit card ratesover three-month Libor(c)
(right-hand scale)
Percentage pointsNet percentage balances
+
–
June Dec. June Dec. June
(a) See footnote to Chart 1.3.(b) A positive balance indicates an increase in default rates.(c) The Bank’s quoted interest rates series comprise data from up to 31 monetary financial institutions.
Chart 3.2 Credit Conditions Survey : change in default rateson credit cards(a)(b)
Table 3.A Consumer credit(a)
Averages 2009
2007 2008 Jan. Feb. Mar. Apr. May
Net monthly flow (£ billions) 1.1 1.0 0.1 0.1 0.0 0.2 0.3
Three-month annualised growthrate (per cent) 6.4 5.3 2.1 0.9 0.4 0.6 0.9
Twelve-month growth rate(per cent) 6.1 6.3 4.7 3.6 3.1 2.8 2.3
(a) Unsecured lending by monetary financial institutions and other lenders to UK individuals. Seasonallyadjusted data. Sterling lending only.
8/14/2019 BOETrends in Lending July09
http://slidepdf.com/reader/full/boetrends-in-lending-july09 12/12
Glossary and other information 11
AbbreviationsAPS – Asset Protection Scheme (see below).
CBI – Confederation of British Industry.
CFO – chief financial officer.
Libor – London interbank offered rate (see below).
LTV – loan to value ratio (see below).M&A – mergers and acquisitions.
ONS – Office for National Statistics.
PNFCs – private non-financial corporations (see below).
RICS – Royal Institution of Chartered Surveyors.
GlossaryAsset Protection A Government scheme that provides
Scheme lenders with partial protection, in return
for a fee, against credit losses on
portfolios of assets.Bank Rate The official rate paid on commercial bank
reserves by the Bank of England.
Businesses Private non-financial corporations (see
below).
Consumer credit Borrowing by UK individuals to finance
expenditure on goods and/or services.
Consumer credit is split into two
components: credit card lending
and ‘other’ lending (mainly overdrafts
and other loans/advances).
Effective interest The weighted average of calculated
rates interest rates on various types of deposit
and loan accounts. The calculated
annual rate is derived from the deposit or
loan interest flow during the period,
divided by the average stock of deposit or
loan during the period.
Facility An agreement in which a lender sets out
the conditions on which it is prepared to
commit to advance a specified amount
to a borrower within a defined period.
Gross lending The total value of loans advanced by an
institution in a given period.Loan approvals Lenders’ firm offers to advance credit.
Loan to value ratio Ratio of outstanding loan amount to the
(LTV) market value of the asset against which
the loan is secured (normally residential
or commercial property).
London interbank The rate of interest at which banks
offered rate (Libor) borrow funds from each other, in
marketable size, in the London interbank
market.
Major UK lenders Banco Santander, Barclays, HSBC,
Lloyds Banking Group, Nationwide and
Royal Bank of Scotland.
Monetary financial A statistical grouping comprising banks
institutions and building societies.
Mortgage lending Lending to households, secured against
the value of their dwellings.
Net lending The difference between gross lending and
gross repayments of debt in a givenperiod.
Private All corporations whose primary activity is
non-financial non-financial, and that are not controlled
corporations by central or local government.
Quoted interest The weighted average of a sample of
rates advertised deposit and loan rates:
weights calculated from Bank of England
statistical collections.
Reference rate The rate on which loans to businesses are
set, with an agreed margin over the
reference rate (typically these will beBank Rate or Libor).
Remortgaging A process whereby borrowers repay
their current mortgage in favour of a new
one secured on the same property.
Swap rate The fixed rate of interest in a swap
contract in which floating-rate interest
payments are exchanged for fixed-rate
interest payments. Swap rates are a key
factor in the setting of fixed mortgage
rates.
Symbols and conventionsExcept where otherwise stated, data are not seasonally
adjusted and the source of data in charts and tables is the
Bank of England.
On the horizontal axes of graphs, larger ticks denote the first
observation within the relevant period, eg data for the first
quarter of the year.
© Bank of England 2009
ISSN: 2040-4042 (online)