Board Structure: Data Spotlight, Quick Guide Series
18
David F. Larcker and Brian Tayan Corporate Governance Research Initiative Stanford Graduate School of Business BOARD STRUCTURE DATA SPOTLIGHT
-
Upload
stanford-gsb-corporate-governance-research-initiative -
Category
Business
-
view
1.331 -
download
0
Transcript of Board Structure: Data Spotlight, Quick Guide Series
David F. Larcker and Brian TayanCorporate Governance Research Initiative
Stanford Graduate School of Business
BOARD STRUCTUREDATA SPOTLIGHT

NUMBER OF DIRECTORS
There are approximately 40,000 directors of publicly traded companies in the U.S.
2009 2010 2011 2012
Number of firms 4,650 4,972 4,624 4,249
Number of directors 42,642 45,242 42,557 39,547
Data from Equilar; calculations by the authors

NEW DIRECTOR BACKGROUNDS
Directors have a diverse set of executive, financial, and other experience.
Spencer Stuart Board Index (2015)

WISH LIST FOR DIRECTOR BACKGROUNDS
Boards are looking to add directors with financial, industry, and leadership expertise. Diversity is also important.
Spencer Stuart Board Index (2015)
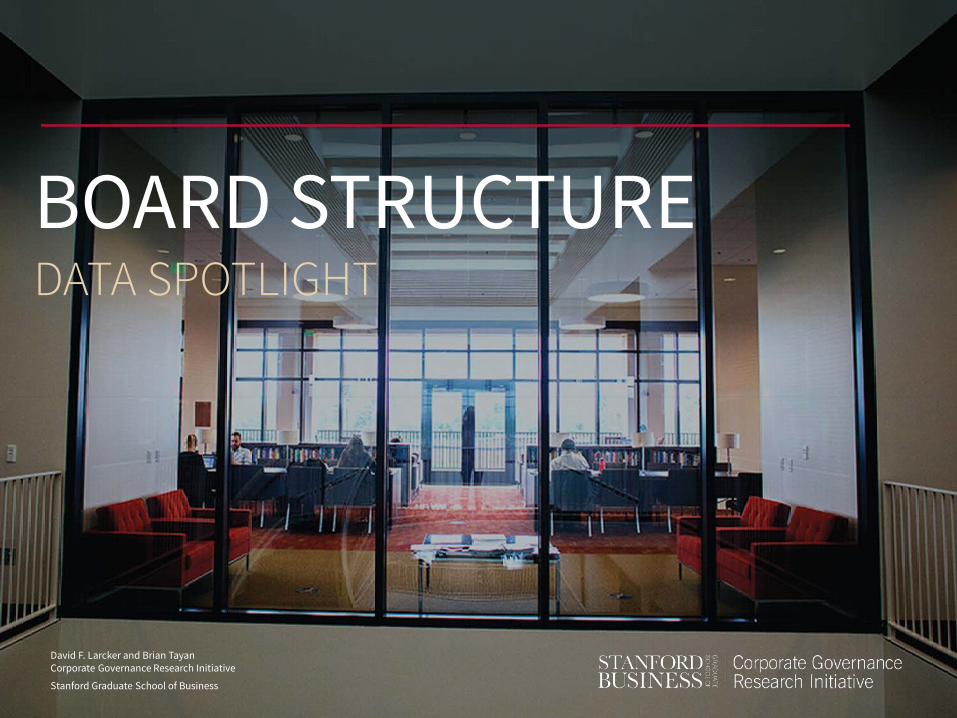
DIRECTORS WITH CEO EXPERIENCE
Directors who are active CEOs are being replaced by retired CEOs and directors with other corporate executive experience.
Spencer Stuart Board Index
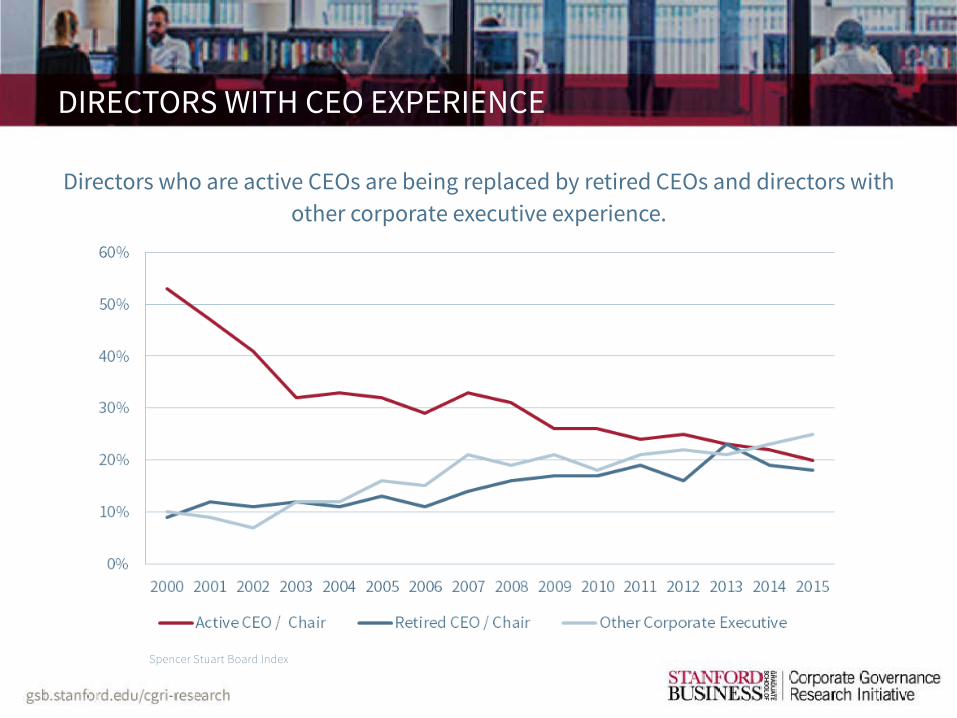
FEMALE DIRECTORS
Spencer Stuart Board Index
The average percentage of female directors on boards is low, but growing.
FEMALE DIRECTORS
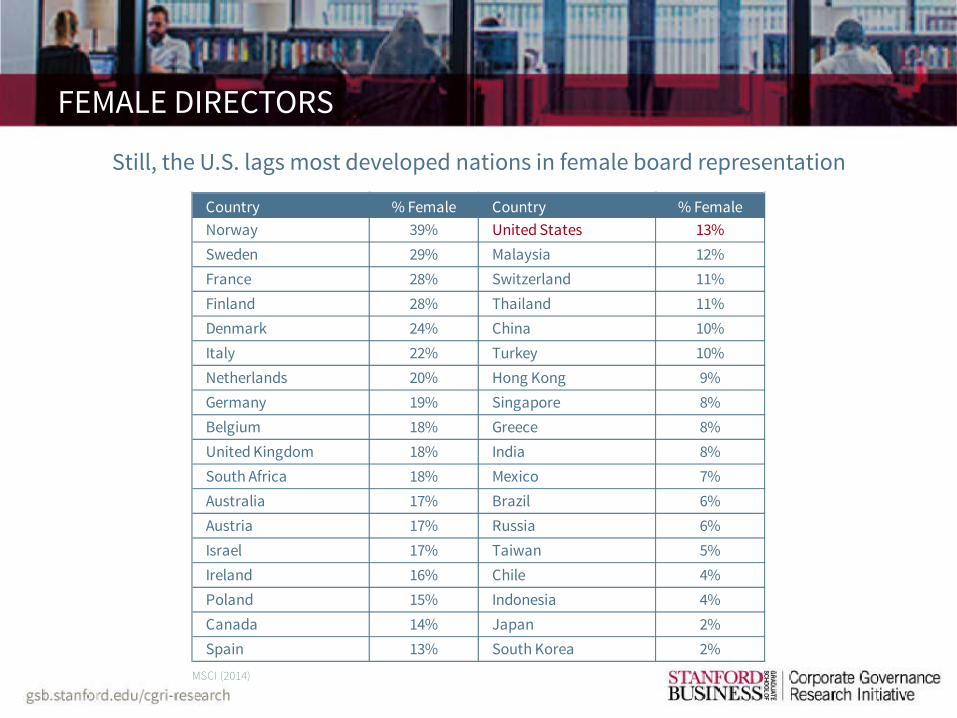
MSCI (2014)
Country % Female Country % FemaleNorway 39% United States 13%Sweden 29% Malaysia 12%France 28% Switzerland 11%Finland 28% Thailand 11%Denmark 24% China 10%Italy 22% Turkey 10%Netherlands 20% Hong Kong 9%Germany 19% Singapore 8%Belgium 18% Greece 8%United Kingdom 18% India 8%South Africa 18% Mexico 7%Australia 17% Brazil 6%Austria 17% Russia 6%Israel 17% Taiwan 5%Ireland 16% Chile 4%Poland 15% Indonesia 4%Canada 14% Japan 2%Spain 13% South Korea 2%
Still, the U.S. lags most developed nations in female board representation
DIRECTOR COMPENSATION
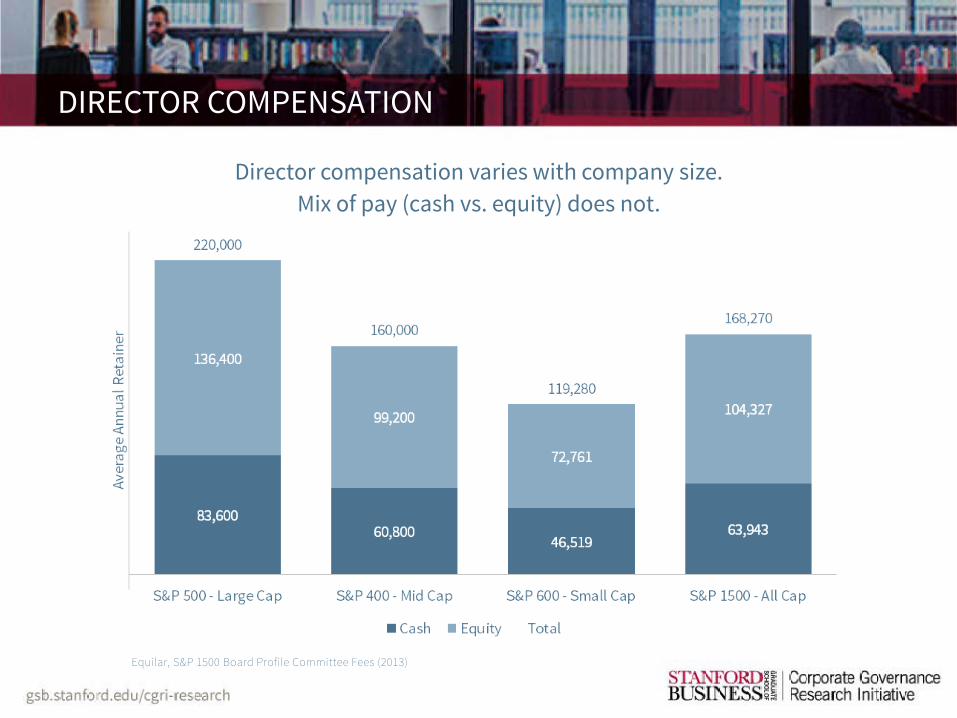
Equilar, S&P 1500 Board Profile Committee Fees (2013)
Director compensation varies with company size. Mix of pay (cash vs. equity) does not.
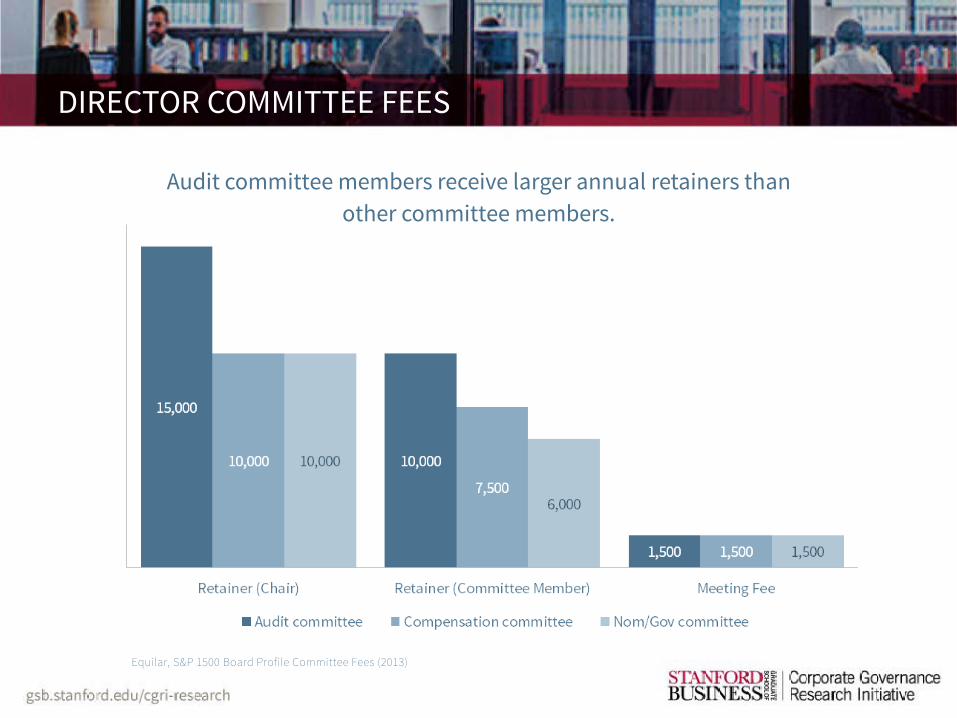
DIRECTOR COMMITTEE FEES
Audit committee members receive larger annual retainers than other committee members.
Equilar, S&P 1500 Board Profile Committee Fees (2013)
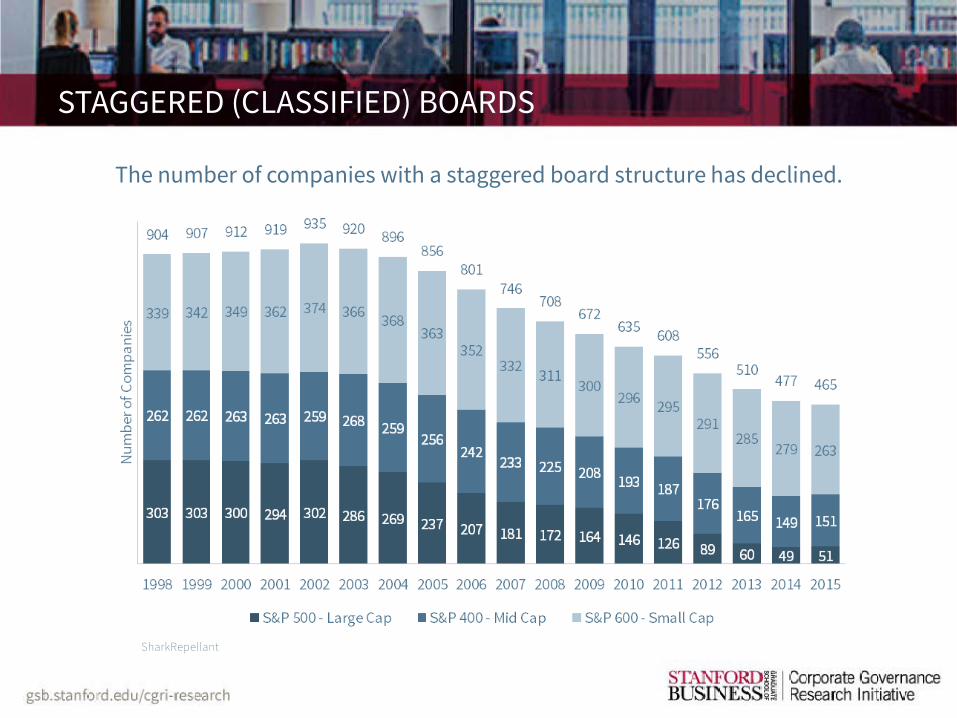
STAGGERED (CLASSIFIED) BOARDS
The number of companies with a staggered board structure has declined.
SharkRepellant
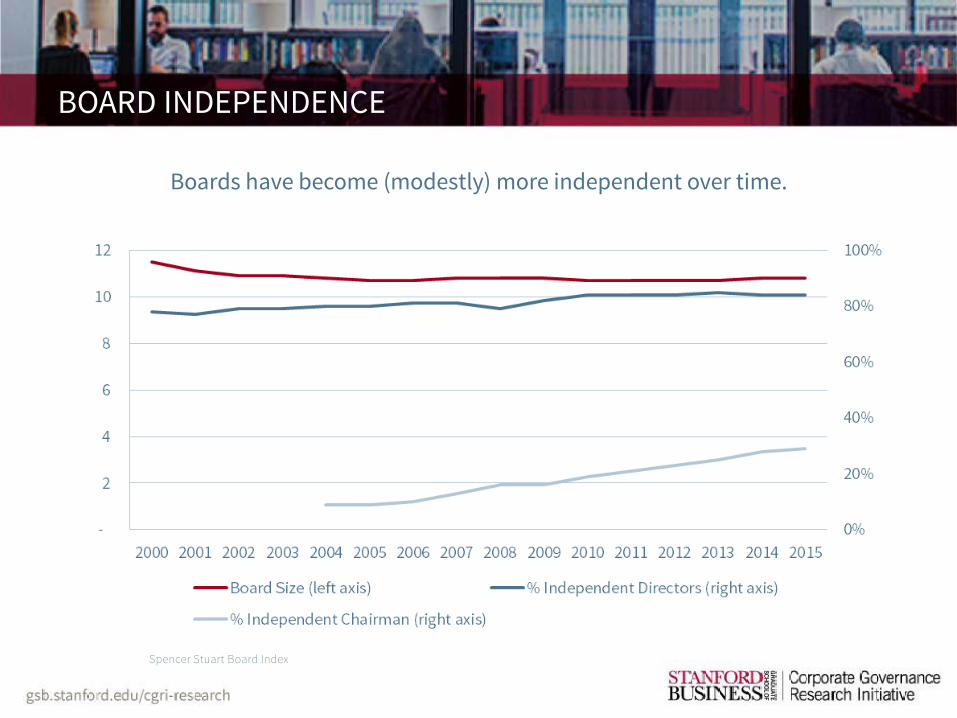
BOARD INDEPENDENCE
Boards have become (modestly) more independent over time.
Spencer Stuart Board Index

BOARD CHAIRMAN
Companies have gradually moved to separate the chairman and CEO roles.
Spencer Stuart Board Index
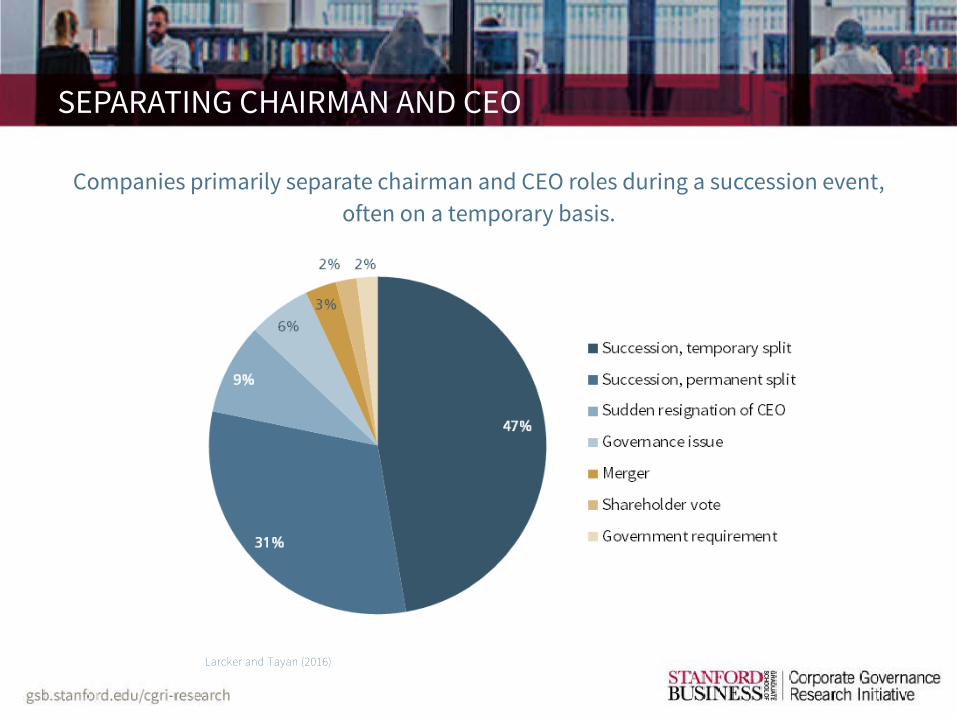
SEPARATING CHAIRMAN AND CEO
Companies primarily separate chairman and CEO roles during a succession event, often on a temporary basis.
Larcker and Tayan (2016)

COMBINING CHAIRMAN AND CEO
However, companies also often combine the two roles as part of a succession.
Larcker and Tayan (2016)
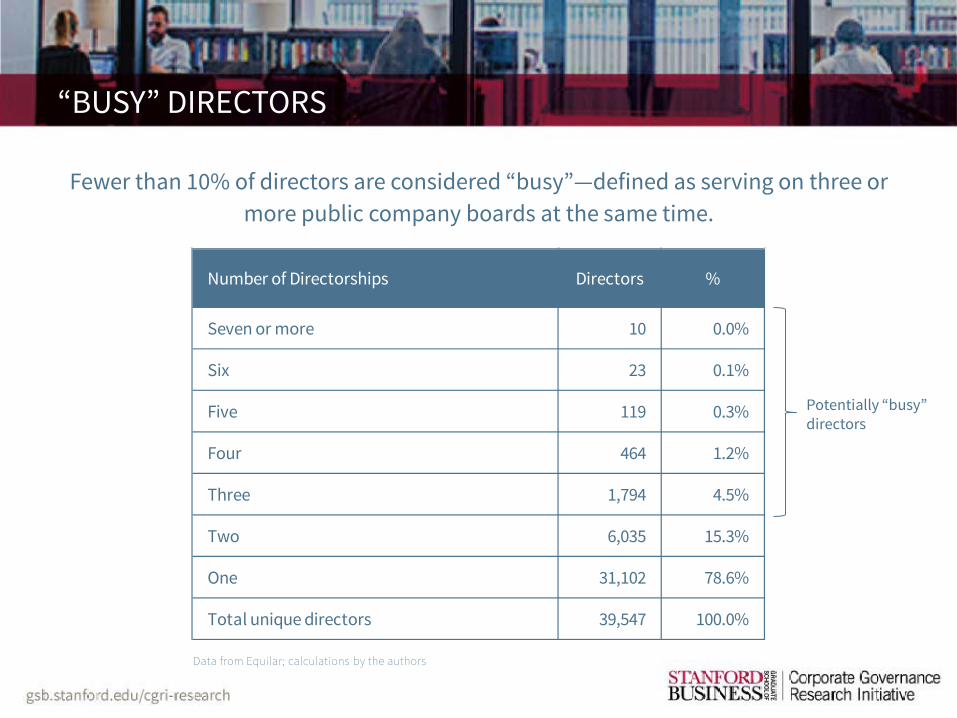
“BUSY” DIRECTORS
Number of Directorships Directors %
Seven or more 10 0.0%
Six 23 0.1%
Five 119 0.3%
Four 464 1.2%
Three 1,794 4.5%
Two 6,035 15.3%
One 31,102 78.6%
Total unique directors 39,547 100.0%
Data from Equilar; calculations by the authors
Fewer than 10% of directors are considered “busy”—defined as serving on three or more public company boards at the same time.
Potentially “busy” directors
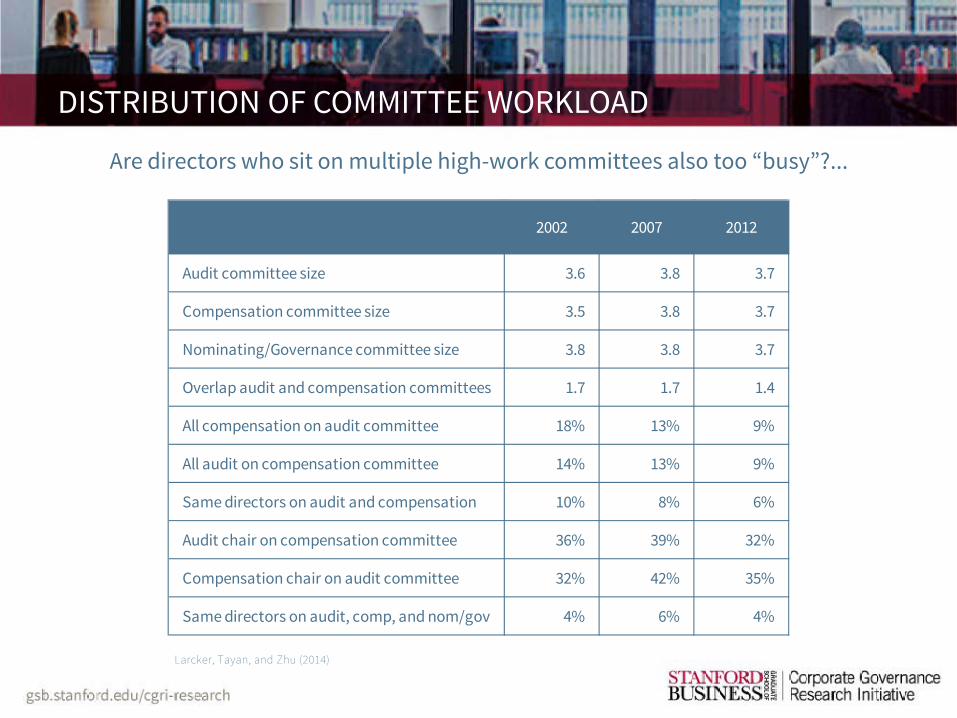
DISTRIBUTION OF COMMITTEE WORKLOAD
2002 2007 2012
Audit committee size 3.6 3.8 3.7
Compensation committee size 3.5 3.8 3.7
Nominating/Governance committee size 3.8 3.8 3.7
Overlap audit and compensation committees 1.7 1.7 1.4
All compensation on audit committee 18% 13% 9%
All audit on compensation committee 14% 13% 9%
Same directors on audit and compensation 10% 8% 6%
Audit chair on compensation committee 36% 39% 32%
Compensation chair on audit committee 32% 42% 35%
Same directors on audit, comp, and nom/gov 4% 6% 4%
Larcker, Tayan, and Zhu (2014)
Are directors who sit on multiple high-work committees also too “busy”?...
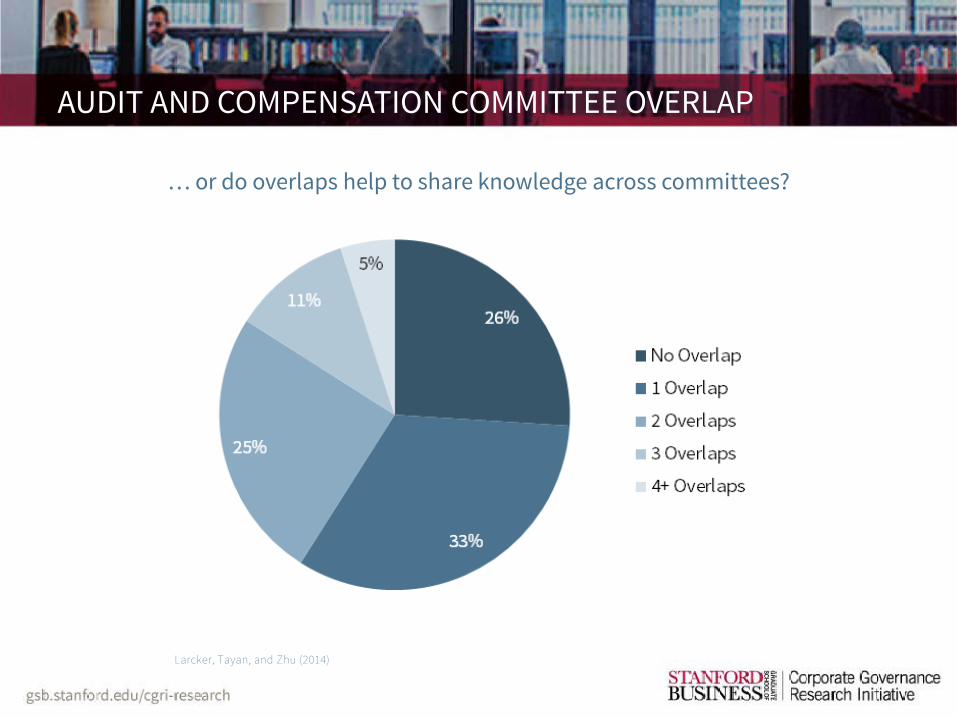
AUDIT AND COMPENSATION COMMITTEE OVERLAP
… or do overlaps help to share knowledge across committees?
Larcker, Tayan, and Zhu (2014)
BIBLIOGRAPHY
Note: Data varies across sources depending on the attributes of the companies included in the sample, such as size and industry.
Equilar directorship data. Fiscal year ending June 2012 to May 2013.
Equilar. S&P 1500 Board Profile Committee Fees: Parts 1 and 2. 2013.
David F. Larcker and Brian Tayan. Chairman and CEO: The Controversy over Board Leadership. June 24, 2016. Stanford Closer Look Series.
David F. Larcker, Brian Tayan, and Christina Zhu. A Meeting of the Minds: How Do Companies Distribute Knowledge and Workload across Board Committees? December 8, 2014. Stanford Closer Look Series.
MSCI. Governance Issue Report: 2014 Survey of Women on Boards. 2014.
NACD. Public Company Governance Survey. 2014.
SharkRepellent, FactSet Research Systems, Inc. S&P 1500 Staggered (Classified) Board Trend Analysis 1999-Present. 2015.
Spencer Stuart. Spencer Stuart U.S. Board Index. 2007-2015.