Board Presentation FY17 Results 15AUG17 Presentation FY… · › New products in US REIT market...
57
COMPUTERSHARE LIMITED Execution delivering sustained earnings growth 2017 Full Year Results Presentation Mark Davis Chief Financial Officer 16 August 2017 Stuart Irving Chief Executive Officer and President
Transcript of Board Presentation FY17 Results 15AUG17 Presentation FY… · › New products in US REIT market...

COMPUTERSHARE LIMITEDExecution delivering sustained earnings growth
2017 Full Year Results Presentation
Mark Davis
Chief Financial Officer
16 August 2017
Stuart Irving
Chief Executive Officer and President
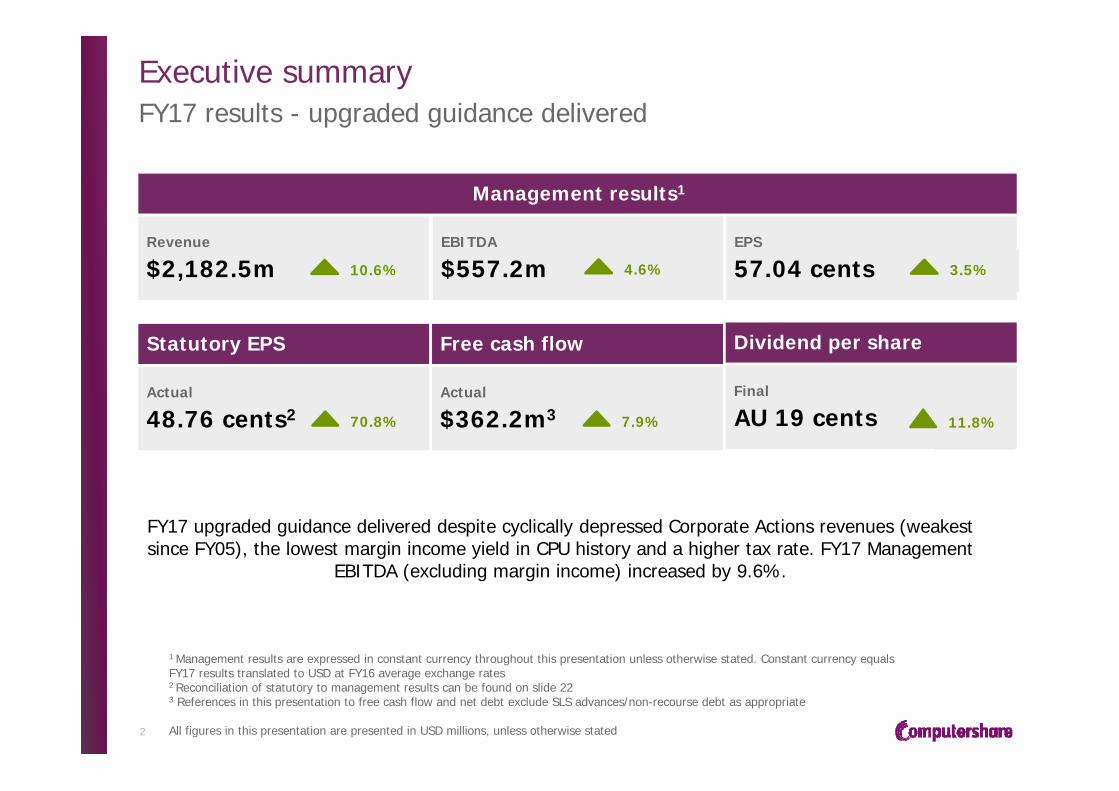
Executive summaryFY17 results - upgraded guidance delivered
2
FY17 upgraded guidance delivered despite cyclically depressed Corporate Actions revenues (weakest since FY05), the lowest margin income yield in CPU history and a higher tax rate. FY17 Management
EBITDA (excluding margin income) increased by 9.6%.
Statutory EPS
Actual
48.76 cents2
Free cash flow
Actual
$362.2m3
Dividend per share
Final
AU 19 cents
Management results1
Revenue
$2,182.5m 10.6%
EBITDA
$557.2mEPS
57.04 cents4.6% 3.5%
70.8% 7.9% 11.8%
1 Management results are expressed in constant currency throughout this presentation unless otherwise stated. Constant currency equals FY17 results translated to USD at FY16 average exchange rates2 Reconciliation of statutory to management results can be found on slide 223 References in this presentation to free cash flow and net debt exclude SLS advances/non-recourse debt as appropriate
All figures in this presentation are presented in USD millions, unless otherwise stated

Strategies driving performance and earnings power
3
Growth Profitability Capital Management
› Mortgage Services now making a significant contribution – 24.6% of total revenue
› US mortgage services strategy executing to plan – diversified revenue model gaining traction
› UK mortgage services integration ahead of schedule
› Ongoing structural growth in employee share plans – EBITDA (ex margin income) +58.2%
› C. $125bn of Share Plans assets under administration –earnings power
› Cost out program ahead of schedule with further benefits to come
› Process automation adoption underway. Widespread potential application
› US Registry margins improved on slightly lower revenues and EBITDA grew at faster rate than Group
› Margin income improved in 2H17: early benefits of rate increases
› $16.7bn of FY17 average client balances – significant leverage to rising rates
› Strong free cash flow
› Net debt fell by $260.8m down 23.1%
› Ongoing balance sheet deleveraging – 1.60x net debt to EBITDA. Increased capacity to drive improved shareholder returns
› AU 19 cents final dividend +11.8%
› New share buy-back announced – AUD 200m
› Simplifying business portfolio and recycling capital, Karvy asset disposal to be completed 1H18
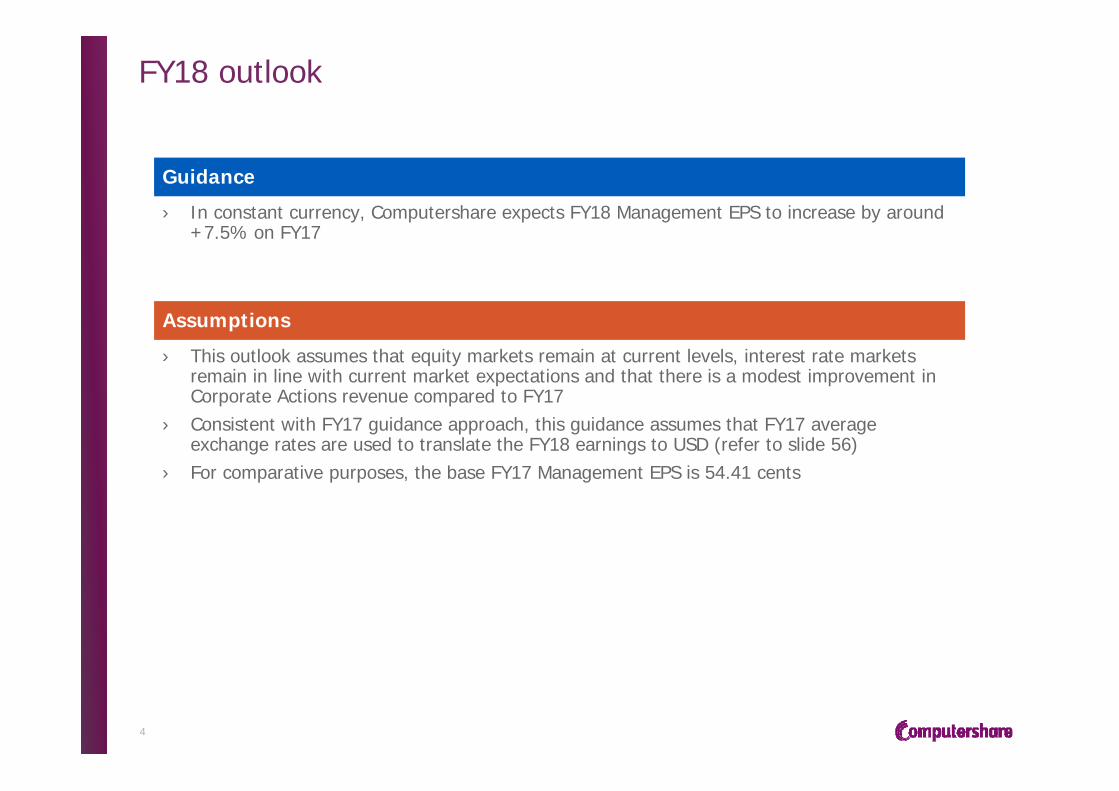
FY18 outlook
4
Guidance
› In constant currency, Computershare expects FY18 Management EPS to increase by around +7.5% on FY17
Assumptions
› This outlook assumes that equity markets remain at current levels, interest rate markets remain in line with current market expectations and that there is a modest improvement in Corporate Actions revenue compared to FY17
› Consistent with FY17 guidance approach, this guidance assumes that FY17 average exchange rates are used to translate the FY18 earnings to USD (refer to slide 56)
› For comparative purposes, the base FY17 Management EPS is 54.41 cents
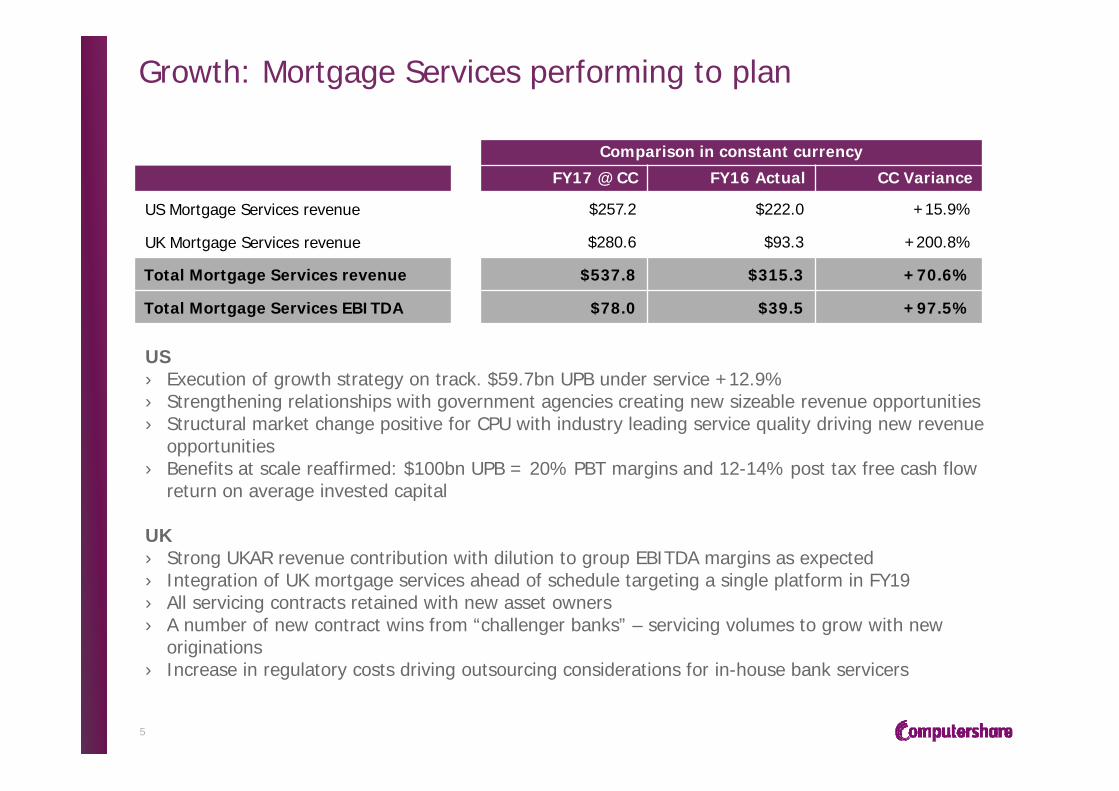
Growth: Mortgage Services performing to plan
US› Execution of growth strategy on track. $59.7bn UPB under service +12.9%› Strengthening relationships with government agencies creating new sizeable revenue opportunities› Structural market change positive for CPU with industry leading service quality driving new revenue
opportunities› Benefits at scale reaffirmed: $100bn UPB = 20% PBT margins and 12-14% post tax free cash flow
return on average invested capital
UK› Strong UKAR revenue contribution with dilution to group EBITDA margins as expected› Integration of UK mortgage services ahead of schedule targeting a single platform in FY19› All servicing contracts retained with new asset owners› A number of new contract wins from “challenger banks” – servicing volumes to grow with new
originations› Increase in regulatory costs driving outsourcing considerations for in-house bank servicers
5
Comparison in constant currency
FY17 @ CC FY16 Actual CC Variance
US Mortgage Services revenue $257.2 $222.0 +15.9%
UK Mortgage Services revenue $280.6 $93.3 +200.8%
Total Mortgage Services revenue $537.8 $315.3 +70.6%
Total Mortgage Services EBITDA $78.0 $39.5 +97.5%

Growth: Employee Share Plans performing well
6
Comparison in constant currencyFY17 @ CC FY16 Actual CC Variance
Transactional revenues $86.8 $64.5 +34.6%
Fee revenues $112.4 $109.9 +2.3%
Margin income $18.4 $29.7 -38.0%
Other revenues $18.0 $18.1 -0.6%
Total Employee Share Plans revenue $235.6 $222.2 +6.0%
Employee Share Plans EBITDA $60.8 $56.5 +7.6%
EBITDA margin % 25.8% 25.4% +40bps
EBITDA ex margin income $42.4 $26.8 +58.2%
› Strong recovery in transactional volumes driven by improved equity market strength and currency volatility
› Reduced margin income impacted by cut in UK interest rates and lower sharesave balances
› Investment in customer facing technologies and product refreshes improving competitive position
› Structural growth drivers intact with c. $125bn of assets under administration, over half ‘in the money’
› Asian share plans market developing strongly. CPU has leading position with unrivalled plan design and management expertise
- Significant new client wins following CPU recent entry into A share market e.g. HP3 and LeTV
- Entered Singapore market with strategic new client wins, Olam and Sea Ltd
- Designed and launched Lenovo’s Global ESPP (35 Jurisdictions, over 25,000 eligible participants). Strong participation
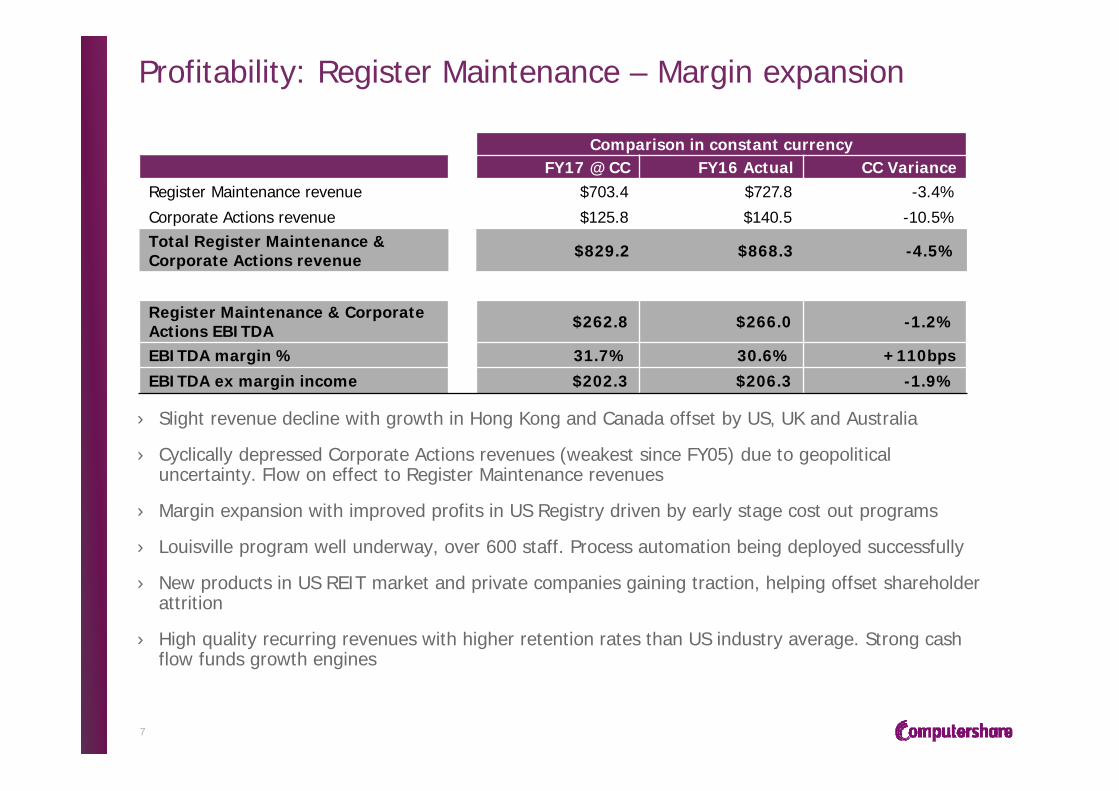
Profitability: Register Maintenance – Margin expansion
7
Comparison in constant currencyFY17 @ CC FY16 Actual CC Variance
Register Maintenance revenue $703.4 $727.8 -3.4%
Corporate Actions revenue $125.8 $140.5 -10.5%Total Register Maintenance & Corporate Actions revenue $829.2 $868.3 -4.5%
Register Maintenance & Corporate Actions EBITDA $262.8 $266.0 -1.2%
EBITDA margin % 31.7% 30.6% +110bpsEBITDA ex margin income $202.3 $206.3 -1.9%
› Slight revenue decline with growth in Hong Kong and Canada offset by US, UK and Australia
› Cyclically depressed Corporate Actions revenues (weakest since FY05) due to geopolitical uncertainty. Flow on effect to Register Maintenance revenues
› Margin expansion with improved profits in US Registry driven by early stage cost out programs
› Louisville program well underway, over 600 staff. Process automation being deployed successfully
› New products in US REIT market and private companies gaining traction, helping offset shareholder attrition
› High quality recurring revenues with higher retention rates than US industry average. Strong cash flow funds growth engines

Profitability: Structural cost out program progressing
8
› Stage 1 and 2 programs delivering ahead of expectations:
› Stage 1 delivered 28% of benefits in FY17 (originally 15%)
› Stage 2 delivered 45% of benefits (originally 20%)
› Process automation adoption underway. Widespread potential application
› Further cost savings to come with Stage 3 analysis well underway
Activity Total cost savingsestimates $m
Expected benefit realisation (cumulative)
FY17 FY18 FY19 FY20
Stage 1Louisville (unchanged) 25 - 30 28% 45% 70% 100%
Stage 2Spans of control ~15 45% 95% 100%
Operational efficiencies 10 - 15 - 20% 80% 100%
Procurement 5 - 8 - 50% 100%
Process Automation ~20 - 20% 80% 100%
Other 10 - 12 - 50% 100%
Total estimate 85 - 100 13.7 42.0 78.1 92.8
• Estimates of total cash costs to deliver Stage 1 remain unchanged at $80-85m, circa 65% opex. Estimates of stage 2 total cash costs also remain unchanged at $30-40m, circa 75% opex. All opex costs to be expensed and included in Management adjustments
• Expected FY18 post tax management adjustment of $15-20m for Stages 1 and 2 (FY17 post tax management adjustments $20.5m)
Capital management: enhancing shareholder returns
9
Recycling capital
› Completed the disposal of the Company’s global headquarters in Melbourne and investment in INVeSHARE Inc (excluded from management earnings in FY17)
› Subsequent to June 30th 2017, the Company announced the agreement to sell its 50% interest in Karvy Computershare Private Ltd. The sale is expected to complete in 1H18 and realise $90m after tax proceeds
Acquisitions
› Detailed examination of land registry opportunities. Valuation disciplines remain intact. Continued opportunities present themselves for evaluation. Criteria include scale, alignment with CPU core competencies and financially accretive
Deleveraging
› Net debt to EBITDA ratio down to 1.60x from 2.12x. Below board target range between 1.75x – 2.25x creating additional capacity to enhance shareholder returns
New share buy-back announced
› New on market buy-back to purchase up to AUD 200m over the following twelve months. Refer to separate ASX Appendix 3C announcement for further details
Increasing dividend
› Final dividend of AU 19 cents unfranked, +11.8% on pcp
› Full year dividends of AU 36 cents per share, +9.1% on pcp
› Given commencement of share buy-back, FY17 final dividend is unfranked. At the conclusion of the share buy-back, CPU intends to distribute the full value of available credits

FY17 Management Results summary
101 Excluding SLS advances/non-recourse SLS Advance debt as applicable2 FY17 Management tax rate 28.4% (FY16 27.9%) largely reflects growing share of US earnings
Comparison in constant currencyFY17 @ CC FY16 Actual CC Variance FY17 Actual
Total Revenue $2,182.5 $1,974.2 +10.6% $2,114.0
Margin income $141.6 $153.3 -7.6% $136.2
Operating Costs $1,626.1 $1,440.2 +12.9% $1,573.9
EBITDA $557.2 $532.6 +4.6% $540.8
EBITDA Margin % 25.5% 27.0% -150bps 25.6%
Depreciation $36.0 $38.7 -7.0% $35.2
Amortisation $24.0 $12.2 +96.7% $24.0
EBIT $497.2 $481.7 +3.2% $481.6
Interest Expense $54.6 $54.5 +0.2% $54.4
Profit Before Tax $442.5 $427.2 +3.6% $427.2
Income Tax Expense2 $125.6 $119.2 +5.4% $124.6
NPAT $311.6 $303.5 +2.7% $297.3
Management EPS (cents) 57.04 55.09 +3.5% 54.41
FY17 Actual FY16 Actual Variance
Net operating cash flow1 $420.3 $373.2 +12.6%
Free cash flow1 $362.2 $335.8 +7.9%
Net debt to EBITDA ratio1 1.60 times 2.12 times -0.52 times
Upgraded guidance delivered

FY17 management NPAT analysis9.6% management EBITDA growth (ex margin income)
11
Controllable External
USD
mill
ion
303.5 311.6
297.3
36.3
0.1 9.1 0.811.7
6.414.3
200
220
240
260
280
300
320
340
360
380
400
FY16
Act
ual
NPA
T
Mgt
EBI
TDA
(ex
MI)
Inte
rest
Dep
'n &
Amor
t
Non
-co
ntro
lling
inte
rest
Mar
gin
Inco
me
Tax
FY17
NPA
T@
CC
FX
FY17
Act
ual
NPA
T

Management revenue breakdown - Growth engines on track and performing well
12
Comparison in constant currencyBusiness stream FY17 @ CC FY16 Actual CC Variance FY17 Actual
Business Services $834.2 $605.7 +37.7% $785.9
Register Maintenance $703.4 $727.8 -3.4% $697.9
Corporate Actions $125.8 $140.5 -10.5% $125.8
Employee Share Plans $235.6 $222.2 +6.0% $220.5
Communication Services $175.4 $174.4 +0.6% $177.5
Stakeholder Relationship Mgt* $80.8 $70.1 +15.3% $79.8
Technology & Other Revenue* $27.3 $33.4 -18.3% $26.6
Total Management Revenue $2,182.5 $1,974.2 +10.6% $2,114.0
› Business Services revenue, +37.7% driven by growth in mortgage services, +70.6% and momentum building in class actions
› Excluding UK mortgage services, total management revenue increased by 1.1%
› Margin income fell to $141.6m with a small increase of $1.8m in 2H v 1H
› Register Maintenance slight revenue decline with growth in Hong Kong and Canada offset by US, UK and Australia
› Weak Corporate Actions revenue continued in 2H, lower than anticipated at time guidance provided
› Employee Share Plans benefited from higher transactional volumes on improved equity markets
* It is anticipated that in FY18, Stakeholder Relationship Mgt and Tech & Other streams will be consolidated into other business streams. Comparative revenues would be provided.
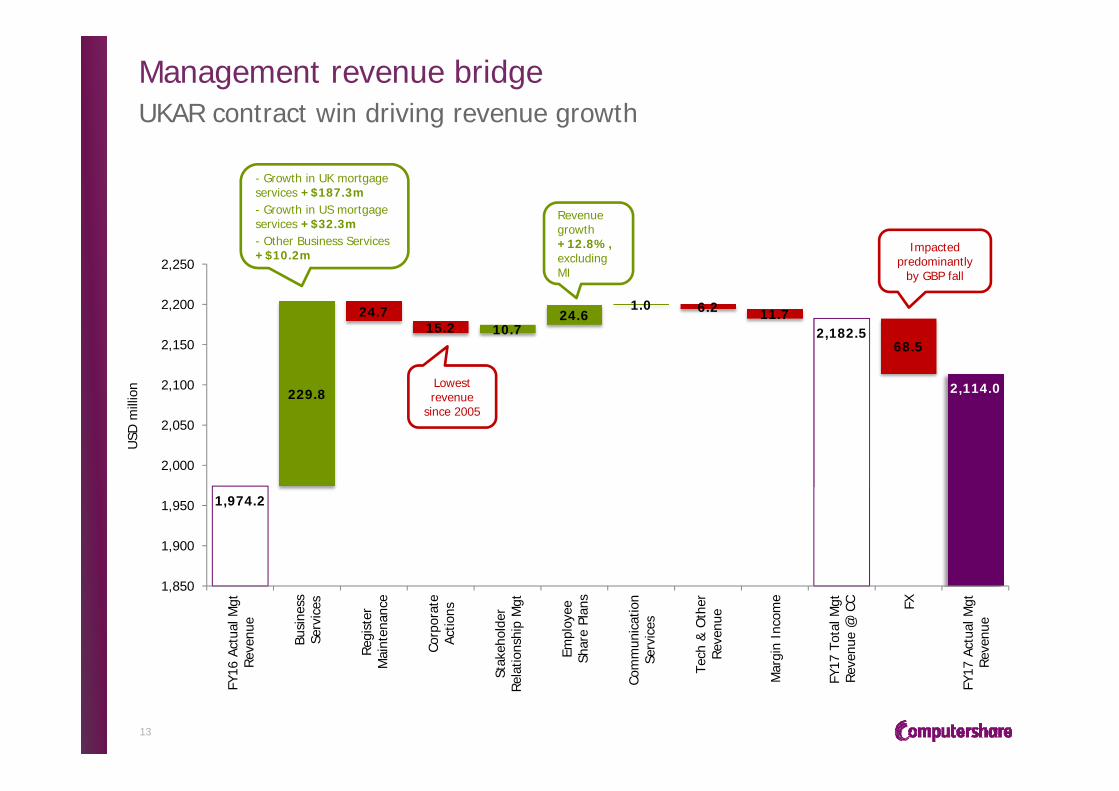
Management revenue bridgeUKAR contract win driving revenue growth
13
USD
mill
ion
1,974.2
2,182.5
2,114.0
24.715.2
6.2 11.7
68.5
229.8
10.724.6
1.0
1,850
1,900
1,950
2,000
2,050
2,100
2,150
2,200
2,250
FY16
Act
ual M
gtRe
venu
e
Busi
ness
Serv
ices
Regi
ster
Mai
nten
ance
Corp
orat
eAc
tions
Stak
ehol
der
Rela
tions
hip
Mgt
Empl
oyee
Shar
e Pl
ans
Com
mun
icat
ion
Serv
ices
Tech
& O
ther
Reve
nue
Mar
gin
Inco
me
FY17
Tot
al M
gtRe
venu
e @
CC FX
FY17
Act
ual M
gtRe
venu
e
- Growth in UK mortgage services +$187.3m- Growth in US mortgage services +$32.3m- Other Business Services +$10.2m
Lowest revenue
since 2005
Revenue growth +12.8%, excluding MI
Impacted predominantly
by GBP fall
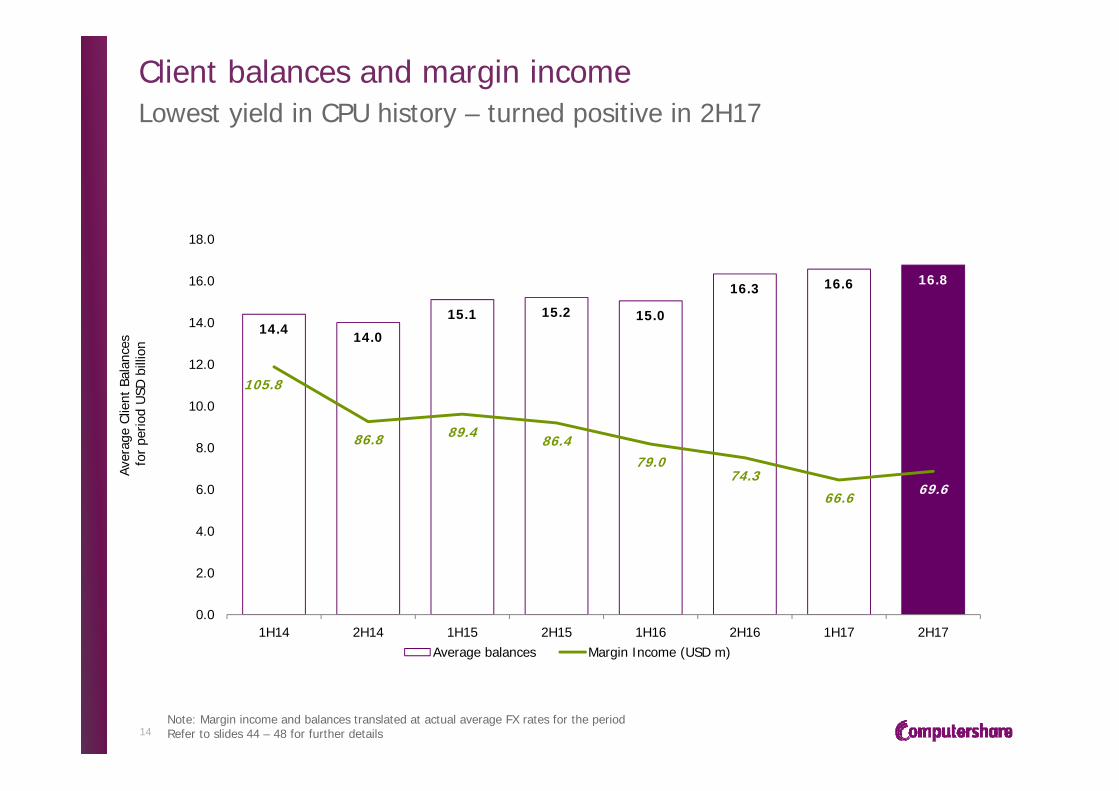
Client balances and margin income
14
Aver
age
Clie
nt B
alan
ces
for
perio
dU
SD b
illio
n
Lowest yield in CPU history – turned positive in 2H17
Note: Margin income and balances translated at actual average FX rates for the periodRefer to slides 44 – 48 for further details
14.4 14.0
15.1 15.2 15.0
16.3 16.6 16.8
105.8
86.8 89.4 86.479.0
74.366.6 69.6
0.0
2.0
4.0
6.0
8.0
10.0
12.0
14.0
16.0
18.0
1H14 2H14 1H15 2H15 1H16 2H16 1H17 2H17Average balances Margin Income (USD m)
EBITDA by business stream
15
Comparison in constant currency
Business StreamFY17 @ CC FY16
ActualCC Variance FY17
ActualFY17 Actual
EBITDA Margin %
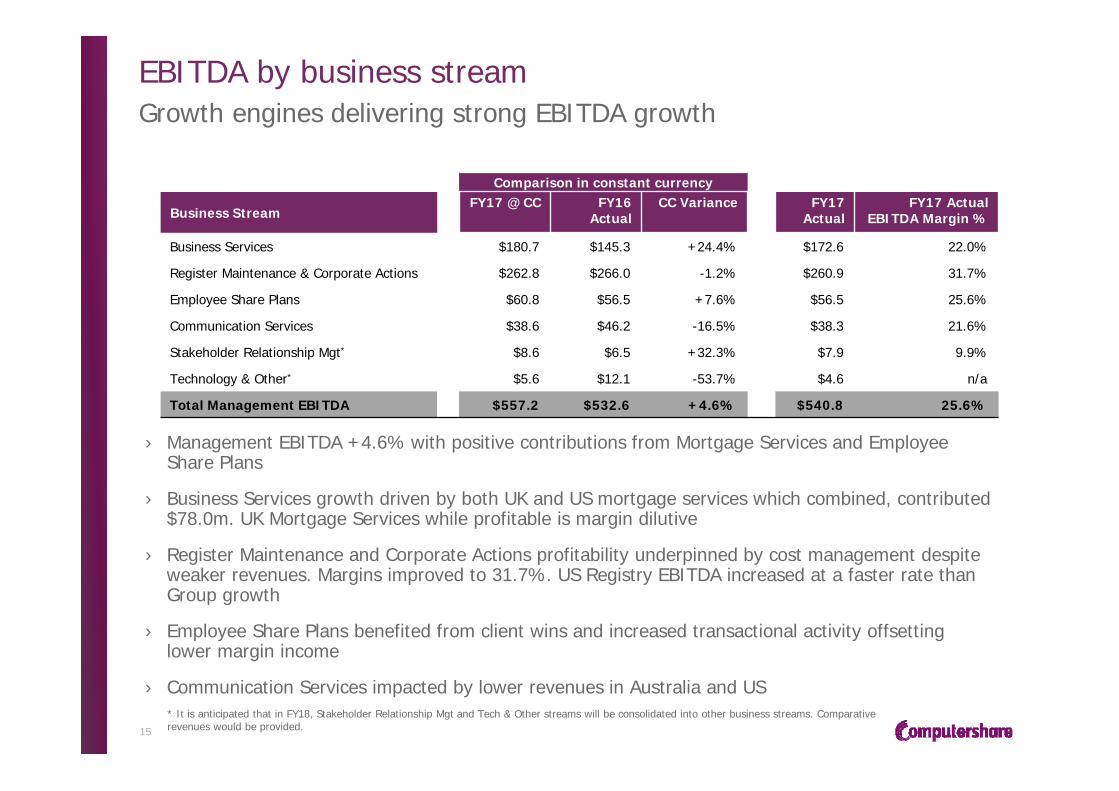
Business Services $180.7 $145.3 +24.4% $172.6 22.0%
Register Maintenance & Corporate Actions $262.8 $266.0 -1.2% $260.9 31.7%
Employee Share Plans $60.8 $56.5 +7.6% $56.5 25.6%
Communication Services $38.6 $46.2 -16.5% $38.3 21.6%
Stakeholder Relationship Mgt* $8.6 $6.5 +32.3% $7.9 9.9%
Technology & Other* $5.6 $12.1 -53.7% $4.6 n/a
Total Management EBITDA $557.2 $532.6 +4.6% $540.8 25.6%
› Management EBITDA +4.6% with positive contributions from Mortgage Services and Employee Share Plans
› Business Services growth driven by both UK and US mortgage services which combined, contributed $78.0m. UK Mortgage Services while profitable is margin dilutive
› Register Maintenance and Corporate Actions profitability underpinned by cost management despite weaker revenues. Margins improved to 31.7%. US Registry EBITDA increased at a faster rate than Group growth
› Employee Share Plans benefited from client wins and increased transactional activity offsetting lower margin income
› Communication Services impacted by lower revenues in Australia and US
Growth engines delivering strong EBITDA growth
* It is anticipated that in FY18, Stakeholder Relationship Mgt and Tech & Other streams will be consolidated into other business streams. Comparative revenues would be provided.

Margin income by business stream
16
Comparison in constant currency
Business StreamEBITDA MI EBITDA
ex MIEBITDA MI EBITDA
ex MICC
Variance
FY17 @ CC
FY17 @ CC
FY17 @ CC
FY16 Actual
FY16 Actual
FY16 Actual
Business Services $180.7 $62.6 $118.1 $145.3 $63.9 $81.4 +45.1%
Register Maintenance & Corporate Actions $262.8 $60.5 $202.3 $266.0 $59.7 $206.3 -1.9%
Employee Share Plans $60.8 $18.4 $42.4 $56.5 $29.7 $26.8 +58.2%
Communication Services $38.6 $0.0 $38.6 $46.2 $0.0 $46.2 -16.5%
Stakeholder Relationship Mgt* $8.6 $0.0 $8.6 $6.5 $0.0 $6.5 +32.3%
Technology & Other* $5.6 $0.0 $5.6 $12.1 $0.0 $12.1 -53.7%
Total Group $557.2 $141.6 $415.6 $532.6 $153.3 $379.3 +9.6%
› Margin income fell to $141.6m (versus $153.3m in pcp)
› Business Services and Employee Share Plans EBITDA growth excluding margin income 45.1% and 58.2% respectively
› Employee Share Plans margin income adversely affected by fall in UK interest rates. Registry and Corporate Actions balances predominantly held in USD
Operating costs analysis
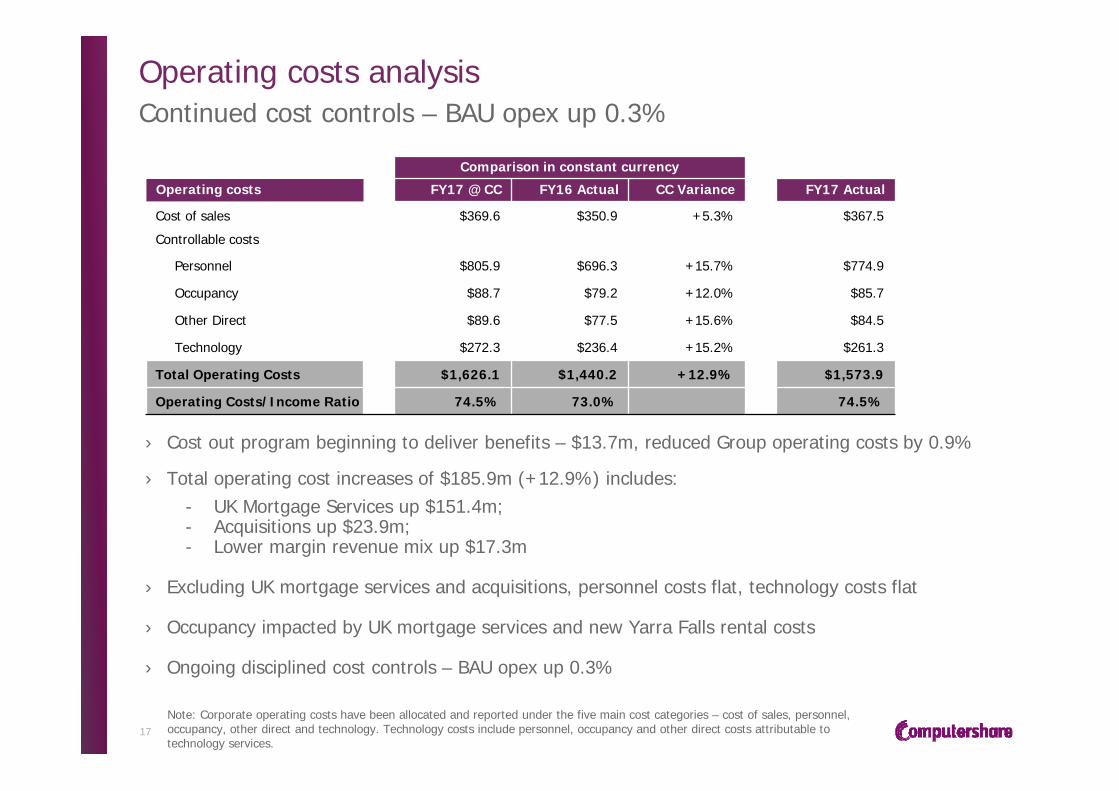
17Note: Corporate operating costs have been allocated and reported under the five main cost categories – cost of sales, personnel,occupancy, other direct and technology. Technology costs include personnel, occupancy and other direct costs attributable to technology services.
Continued cost controls – BAU opex up 0.3%
Comparison in constant currency
Operating costs FY17 @ CC FY16 Actual CC Variance FY17 Actual
Cost of sales $369.6 $350.9 +5.3% $367.5
Controllable costs
Personnel $805.9 $696.3 +15.7% $774.9
Occupancy $88.7 $79.2 +12.0% $85.7
Other Direct $89.6 $77.5 +15.6% $84.5
Technology $272.3 $236.4 +15.2% $261.3
Total Operating Costs $1,626.1 $1,440.2 +12.9% $1,573.9
Operating Costs/Income Ratio 74.5% 73.0% 74.5%
› Cost out program beginning to deliver benefits – $13.7m, reduced Group operating costs by 0.9%
› Total operating cost increases of $185.9m (+12.9%) includes:- UK Mortgage Services up $151.4m; - Acquisitions up $23.9m;- Lower margin revenue mix up $17.3m
› Excluding UK mortgage services and acquisitions, personnel costs flat, technology costs flat
› Occupancy impacted by UK mortgage services and new Yarra Falls rental costs
› Ongoing disciplined cost controls – BAU opex up 0.3%

Operating and investing cash flowsFree cash flows up 7.9% - funds growth and capital management
18
FY17 Actual FY16 ActualNet operating receipts and payments $530.4 $480.3 Net interest and dividends1 ($50.8) ($50.1)Income taxes paid ($59.3) ($57.0)Net operating cash flows excluding SLS advances $420.3 $373.2
Cash outlay on business capital expenditure ($34.2) ($25.3)Net cash outlay on MSR purchases – Maintenance2 ($23.9) ($12.1)
Free cash flow excluding SLS advances $362.2 $335.8
SLS advance funding requirements3 $23.8 ($26.7)
Cash flow post SLS advance funding3 $386.0 $309.1
Investing cash flowsNet cash outlay on MSR purchases – Investments2 ($61.9) ($39.6)Net acquisitions & disposals ($24.9) ($122.2)Disposal of Australian head office premises $66.2 -Disposal of investment in INVeSHARE inc. $23.8 -Other1 $1.5 ($18.9)
$4.7 ($180.7)
Net operating and investing cash flows $390.7 $128.4
1 Reclassification of dividends received from associates and joint ventures from investing cash flows to operating cash flows2 Maintenance MSR capex assumed to be equivalent to the amortisation charge for the period. Comparative figures have been adjusted3 Net operating and financing cash flows
Balance sheetNet debt falling and leverage down to 1.60x
19
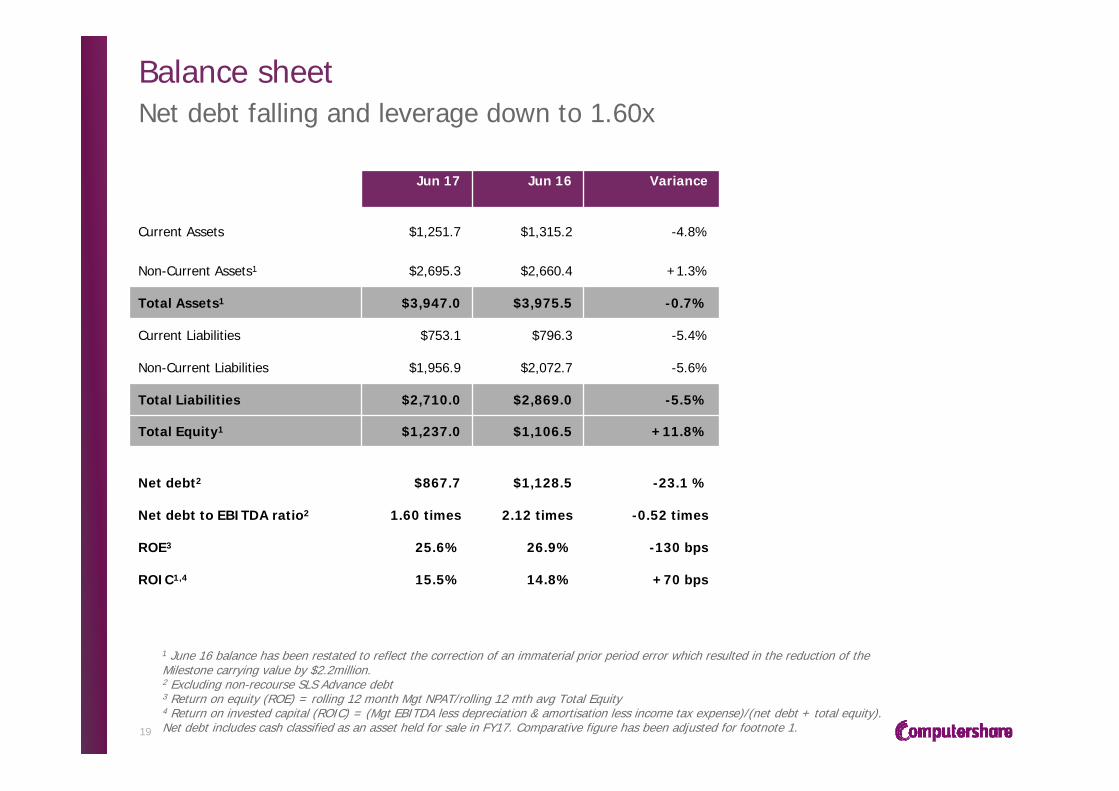
Jun 17 Jun 16 Variance
Current Assets $1,251.7 $1,315.2 -4.8%
Non-Current Assets1 $2,695.3 $2,660.4 +1.3%
Total Assets1 $3,947.0 $3,975.5 -0.7%
Current Liabilities $753.1 $796.3 -5.4%
Non-Current Liabilities $1,956.9 $2,072.7 -5.6%
Total Liabilities $2,710.0 $2,869.0 -5.5%
Total Equity1 $1,237.0 $1,106.5 +11.8%
Net debt2 $867.7 $1,128.5 -23.1 %
Net debt to EBITDA ratio2 1.60 times 2.12 times -0.52 times
ROE3 25.6% 26.9% -130 bps
ROIC1,4 15.5% 14.8% +70 bps
1 June 16 balance has been restated to reflect the correction of an immaterial prior period error which resulted in the reduction of the Milestone carrying value by $2.2million. 2 Excluding non-recourse SLS Advance debt3 Return on equity (ROE) = rolling 12 month Mgt NPAT/rolling 12 mth avg Total Equity4 Return on invested capital (ROIC) = (Mgt EBITDA less depreciation & amortisation less income tax expense)/(net debt + total equity). Net debt includes cash classified as an asset held for sale in FY17. Comparative figure has been adjusted for footnote 1.

Conclusions
20
› Delivered on FY17 upgraded guidance despite cyclically depressed Corporate Actions revenues
› Executing our growth, profitability and capital management strategies are driving sustained performance, earnings power and shareholder returns
› Growth: Mortgage services progressing to plan, Share Plans performing well
› Profitability: Cost out program on track with further benefits to come
› Margin income improved in 2H17, significant leverage to rising interest rates
› Capital: Strong cash flow and capital recycling self fund growth and improve returns
› In constant currency, Computershare expects FY18 Management EPS to increase by around +7.5% on FY17
› Transformation to a simpler, more transparent, disciplined and profitable CPU continues
APPENDICES
Statutory results
Company Overview
FY17 Computershare at a glance
Management EBITDA (ex MI)
Financial performance by half year at actual rates
Global Registry Maintenance and Employee Share Plans
Business Services revenue excluding mortgage services
Management revenue by region
Management EPS – AUD equivalent
Technology costs
CAPEX versus depreciation
Client balances
Debt facility maturity profile
Key financial ratios
Effective tax rate
Dividend history and franking
Mortgage Servicing
Exchange rates
Statutory results
22
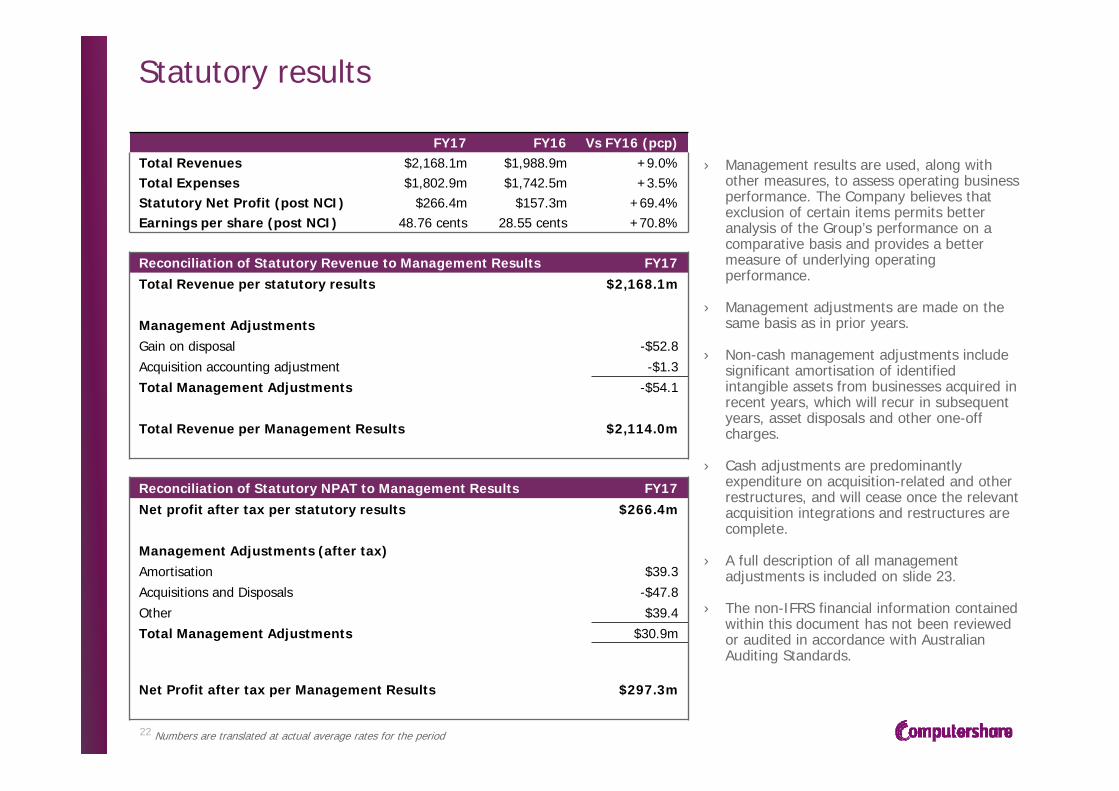
› Management results are used, along with other measures, to assess operating business performance. The Company believes that exclusion of certain items permits better analysis of the Group’s performance on a comparative basis and provides a better measure of underlying operating performance.
› Management adjustments are made on the same basis as in prior years.
› Non-cash management adjustments include significant amortisation of identified intangible assets from businesses acquired in recent years, which will recur in subsequent years, asset disposals and other one-off charges.
› Cash adjustments are predominantly expenditure on acquisition-related and other restructures, and will cease once the relevant acquisition integrations and restructures are complete.
› A full description of all management adjustments is included on slide 23.
› The non-IFRS financial information contained within this document has not been reviewed or audited in accordance with Australian Auditing Standards.
Reconciliation of Statutory Revenue to Management Results FY17Total Revenue per statutory results $2,168.1m
Management AdjustmentsGain on disposal -$52.8Acquisition accounting adjustment -$1.3Total Management Adjustments -$54.1
Total Revenue per Management Results $2,114.0m
Reconciliation of Statutory NPAT to Management Results FY17Net profit after tax per statutory results $266.4m
Management Adjustments (after tax)Amortisation $39.3Acquisitions and Disposals -$47.8Other $39.4Total Management Adjustments $30.9m
Net Profit after tax per Management Results $297.3m
FY17 FY16 Vs FY16 (pcp)Total Revenues $2,168.1m $1,988.9m +9.0%Total Expenses $1,802.9m $1,742.5m +3.5%Statutory Net Profit (post NCI) $266.4m $157.3m +69.4%Earnings per share (post NCI) 48.76 cents 28.55 cents +70.8%
Numbers are translated at actual average rates for the period
Management adjustment itemsAppendix 4E Note 3
23
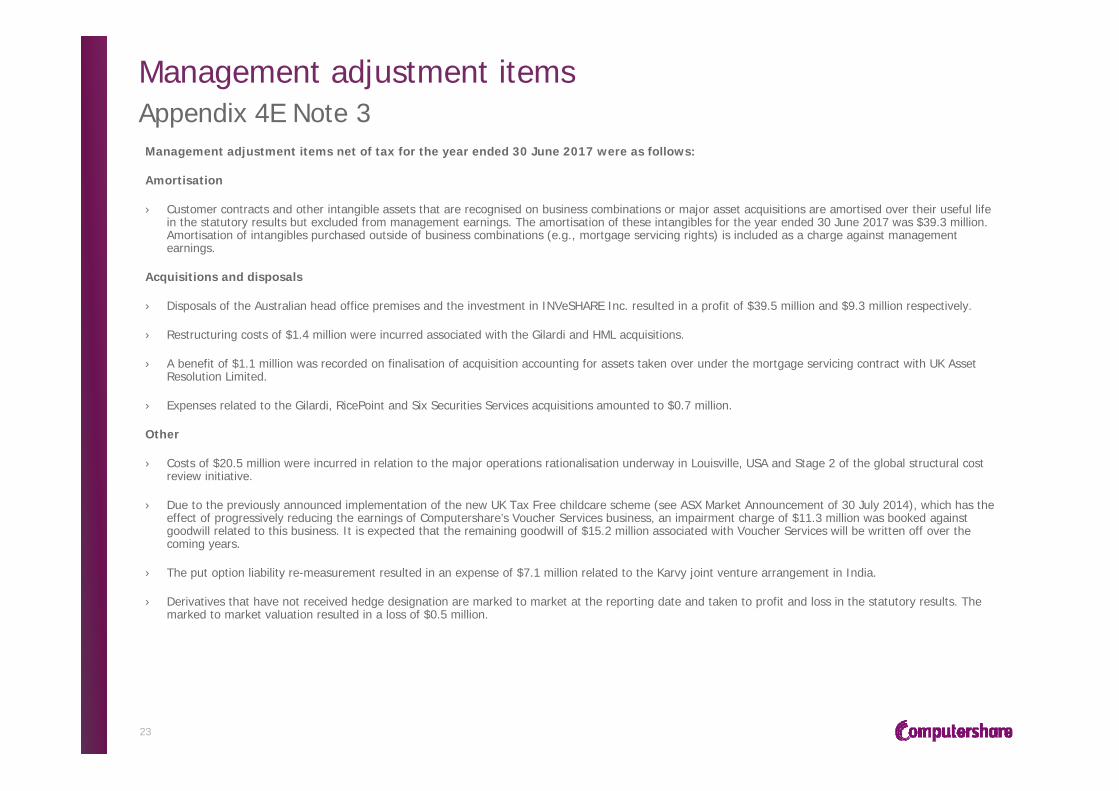
Management adjustment items net of tax for the year ended 30 June 2017 were as follows:
Amortisation
› Customer contracts and other intangible assets that are recognised on business combinations or major asset acquisitions are amortised over their useful life in the statutory results but excluded from management earnings. The amortisation of these intangibles for the year ended 30 June 2017 was $39.3 million. Amortisation of intangibles purchased outside of business combinations (e.g., mortgage servicing rights) is included as a charge against management earnings.
Acquisitions and disposals
› Disposals of the Australian head office premises and the investment in INVeSHARE Inc. resulted in a profit of $39.5 million and $9.3 million respectively.
› Restructuring costs of $1.4 million were incurred associated with the Gilardi and HML acquisitions.
› A benefit of $1.1 million was recorded on finalisation of acquisition accounting for assets taken over under the mortgage servicing contract with UK Asset Resolution Limited.
› Expenses related to the Gilardi, RicePoint and Six Securities Services acquisitions amounted to $0.7 million.
Other
› Costs of $20.5 million were incurred in relation to the major operations rationalisation underway in Louisville, USA and Stage 2 of the global structural cost review initiative.
› Due to the previously announced implementation of the new UK Tax Free childcare scheme (see ASX Market Announcement of 30 July 2014), which has the effect of progressively reducing the earnings of Computershare’s Voucher Services business, an impairment charge of $11.3 million was booked against goodwill related to this business. It is expected that the remaining goodwill of $15.2 million associated with Voucher Services will be written off over the coming years.
› The put option liability re-measurement resulted in an expense of $7.1 million related to the Karvy joint venture arrangement in India.
› Derivatives that have not received hedge designation are marked to market at the reporting date and taken to profit and loss in the statutory results. The marked to market valuation resulted in a loss of $0.5 million.
Company overviewA leading global provider of administration services in our selected markets
24
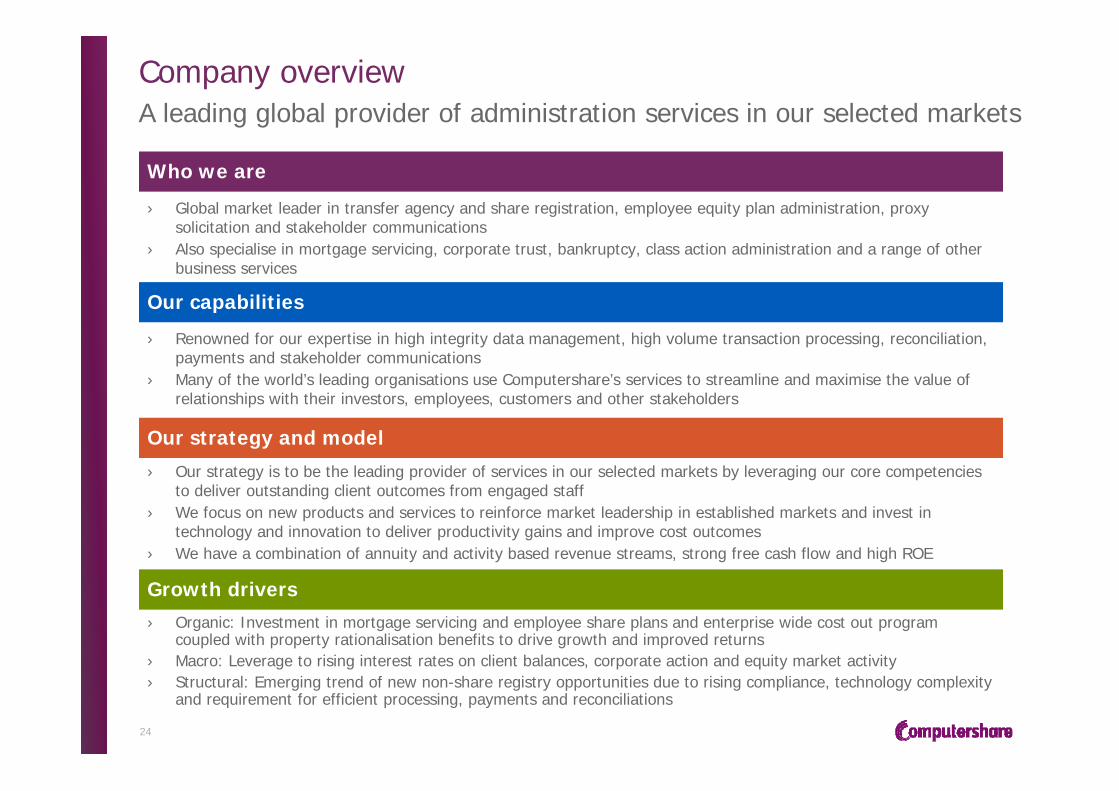
Who we are
› Global market leader in transfer agency and share registration, employee equity plan administration, proxy solicitation and stakeholder communications
› Also specialise in mortgage servicing, corporate trust, bankruptcy, class action administration and a range of other business services
Our capabilities
› Renowned for our expertise in high integrity data management, high volume transaction processing, reconciliation, payments and stakeholder communications
› Many of the world’s leading organisations use Computershare’s services to streamline and maximise the value of relationships with their investors, employees, customers and other stakeholders
Our strategy and model
Growth drivers
› Our strategy is to be the leading provider of services in our selected markets by leveraging our core competencies to deliver outstanding client outcomes from engaged staff
› We focus on new products and services to reinforce market leadership in established markets and invest in technology and innovation to deliver productivity gains and improve cost outcomes
› We have a combination of annuity and activity based revenue streams, strong free cash flow and high ROE
› Organic: Investment in mortgage servicing and employee share plans and enterprise wide cost out program coupled with property rationalisation benefits to drive growth and improved returns
› Macro: Leverage to rising interest rates on client balances, corporate action and equity market activity› Structural: Emerging trend of new non-share registry opportunities due to rising compliance, technology complexity
and requirement for efficient processing, payments and reconciliations
FY17 Computershare at a glance
25
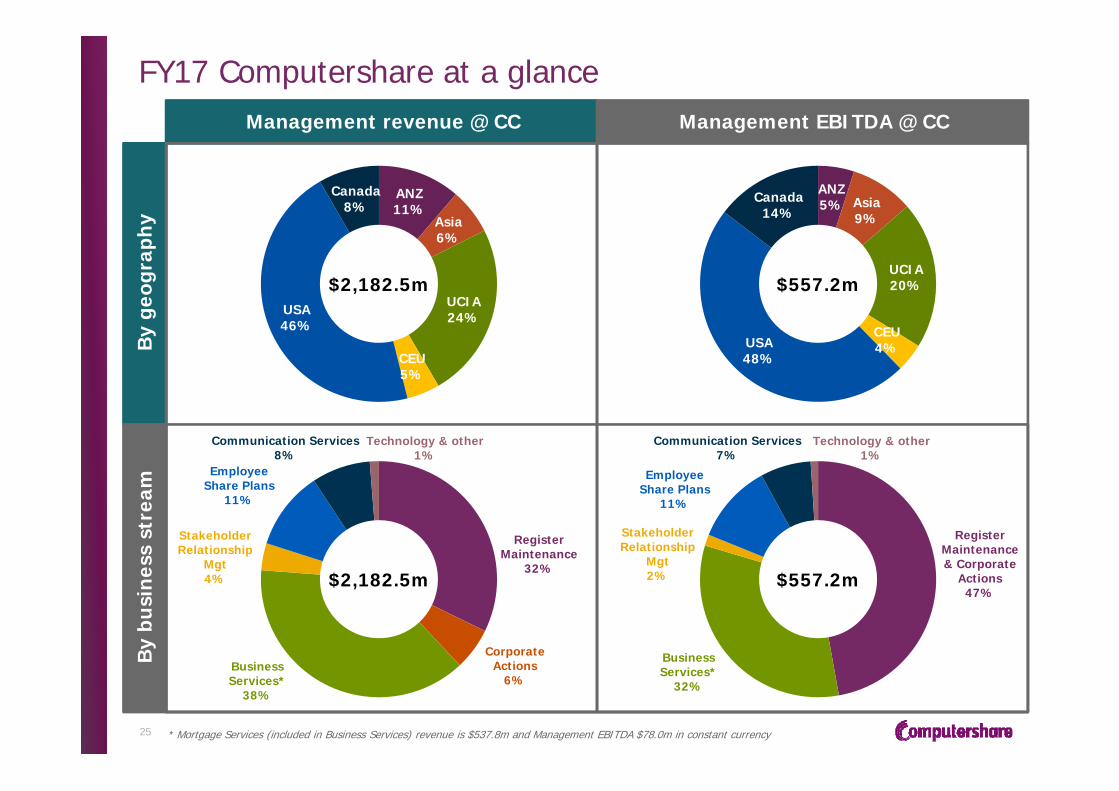
Management revenue @ CC Management EBITDA @ CCB
y ge
ogra
phy
ANZ5% Asia
9%
UCIA20%
CEU4%USA
48%
Canada14%
$557.2m
ANZ11%
Asia6%
UCIA24%
CEU5%
USA46%
Canada8%
$2,182.5m
By
busi
ness
str
eam
Register Maintenance
32%
Corporate Actions
6%Business Services*
38%
Stakeholder Relationship
Mgt4%
Employee Share Plans
11%
Communication Services8%
Technology & other1%
$2,182.5m
Register Maintenance & Corporate
Actions47%
Business Services*
32%
Stakeholder Relationship
Mgt2%
Employee Share Plans
11%
Communication Services7%
Technology & other1%
$557.2m
* Mortgage Services (included in Business Services) revenue is $537.8m and Management EBITDA $78.0m in constant currency
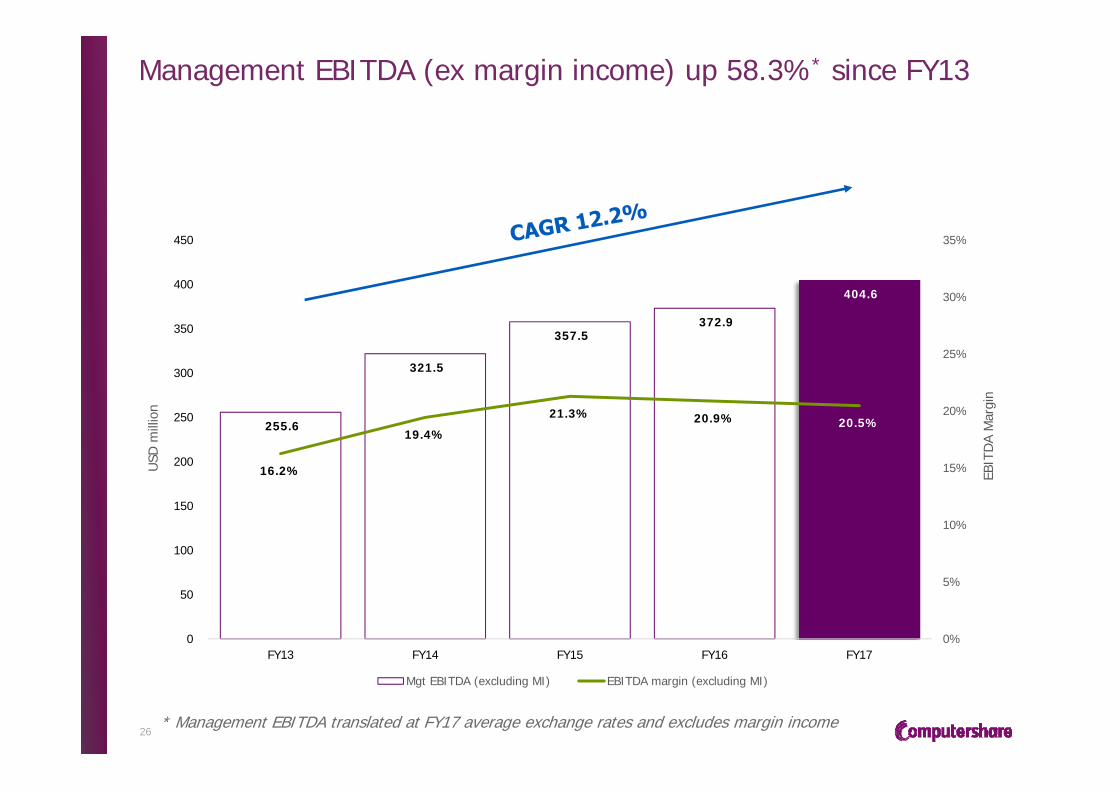
Management EBITDA (ex margin income) up 58.3%* since FY13
26* Management EBITDA translated at FY17 average exchange rates and excludes margin income
255.6
321.5
357.5 372.9
404.6
16.2%
19.4%
21.3% 20.9% 20.5%
0%
5%
10%
15%
20%
25%
30%
35%
0
50
100
150
200
250
300
350
400
450
FY13 FY14 FY15 FY16 FY17
EBIT
DA
Mar
gin
USD
mill
ion
Mgt EBITDA (excluding MI) EBITDA margin (excluding MI)
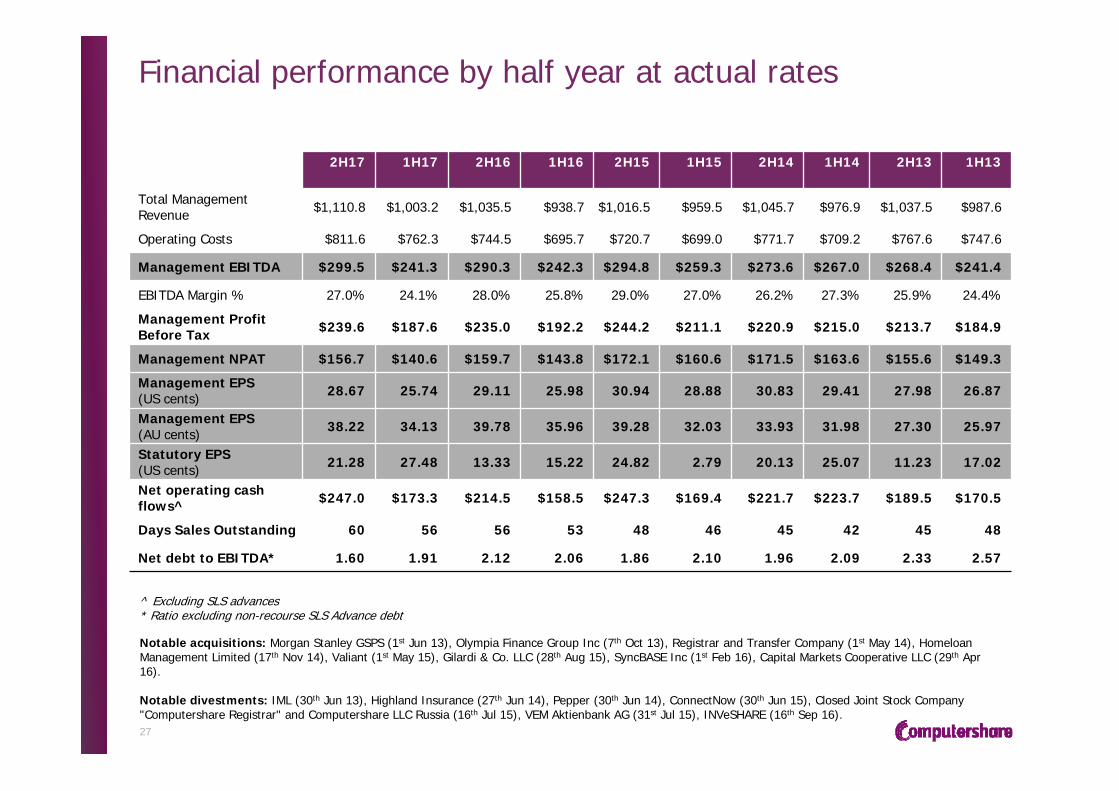
Financial performance by half year at actual rates
27
2H17 1H17 2H16 1H16 2H15 1H15 2H14 1H14 2H13 1H13
Total Management Revenue $1,110.8 $1,003.2 $1,035.5 $938.7 $1,016.5 $959.5 $1,045.7 $976.9 $1,037.5 $987.6
Operating Costs $811.6 $762.3 $744.5 $695.7 $720.7 $699.0 $771.7 $709.2 $767.6 $747.6
Management EBITDA $299.5 $241.3 $290.3 $242.3 $294.8 $259.3 $273.6 $267.0 $268.4 $241.4
EBITDA Margin % 27.0% 24.1% 28.0% 25.8% 29.0% 27.0% 26.2% 27.3% 25.9% 24.4%
Management Profit Before Tax $239.6 $187.6 $235.0 $192.2 $244.2 $211.1 $220.9 $215.0 $213.7 $184.9
Management NPAT $156.7 $140.6 $159.7 $143.8 $172.1 $160.6 $171.5 $163.6 $155.6 $149.3
Management EPS (US cents) 28.67 25.74 29.11 25.98 30.94 28.88 30.83 29.41 27.98 26.87
Management EPS (AU cents) 38.22 34.13 39.78 35.96 39.28 32.03 33.93 31.98 27.30 25.97
Statutory EPS (US cents) 21.28 27.48 13.33 15.22 24.82 2.79 20.13 25.07 11.23 17.02
Net operating cash flows^ $247.0 $173.3 $214.5 $158.5 $247.3 $169.4 $221.7 $223.7 $189.5 $170.5
Days Sales Outstanding 60 56 56 53 48 46 45 42 45 48
Net debt to EBITDA* 1.60 1.91 2.12 2.06 1.86 2.10 1.96 2.09 2.33 2.57
Notable acquisitions: Morgan Stanley GSPS (1st Jun 13), Olympia Finance Group Inc (7th Oct 13), Registrar and Transfer Company (1st May 14), Homeloan Management Limited (17th Nov 14), Valiant (1st May 15), Gilardi & Co. LLC (28th Aug 15), SyncBASE Inc (1st Feb 16), Capital Markets Cooperative LLC (29th Apr 16).
Notable divestments: IML (30th Jun 13), Highland Insurance (27th Jun 14), Pepper (30th Jun 14), ConnectNow (30th Jun 15), Closed Joint Stock Company "Computershare Registrar" and Computershare LLC Russia (16th Jul 15), VEM Aktienbank AG (31st Jul 15), INVeSHARE (16th Sep 16).
^ Excluding SLS advances* Ratio excluding non-recourse SLS Advance debt
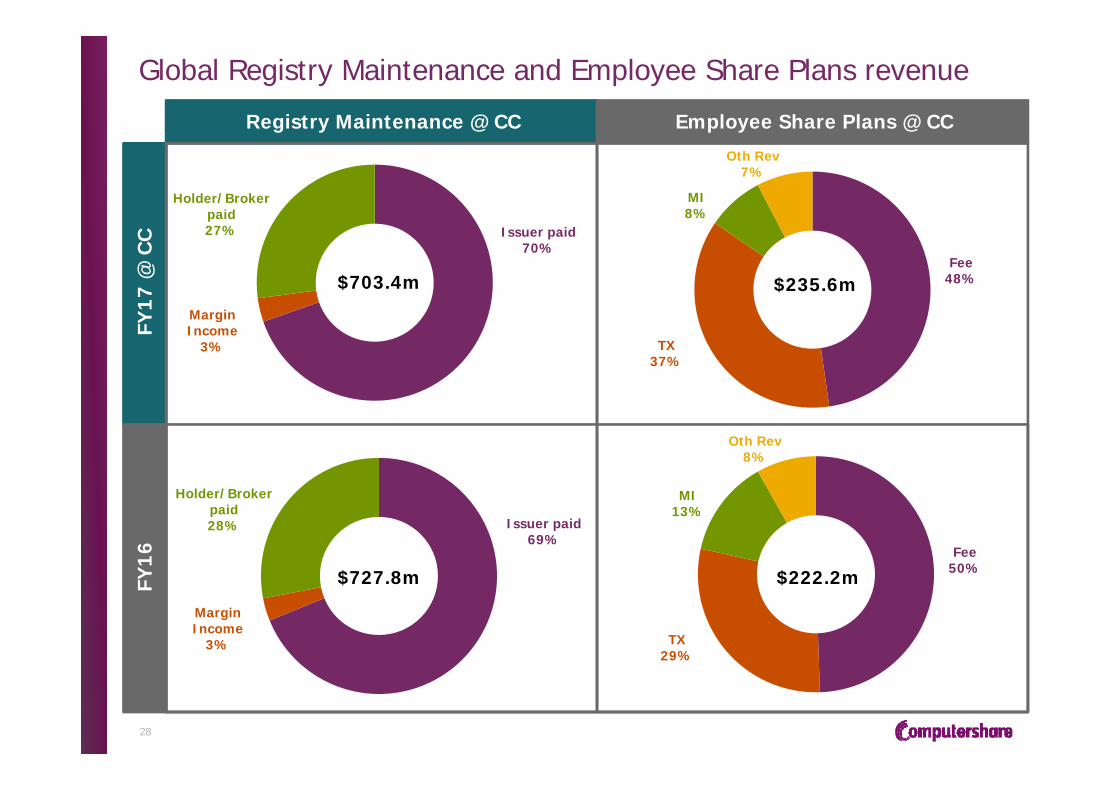
Global Registry Maintenance and Employee Share Plans revenue
28
Registry Maintenance @ CC Employee Share Plans @ CCFY
17 @
CC
FY16
Issuer paid70%
Margin Income
3%
Holder/Broker paid27%
$727.8m
Fee48%
TX37%
MI8%
Oth Rev7%
$222.2m
Issuer paid69%
Margin Income
3%
Holder/Broker paid28%
Fee50%
TX29%
MI13%
Oth Rev8%
$703.4m $235.6m
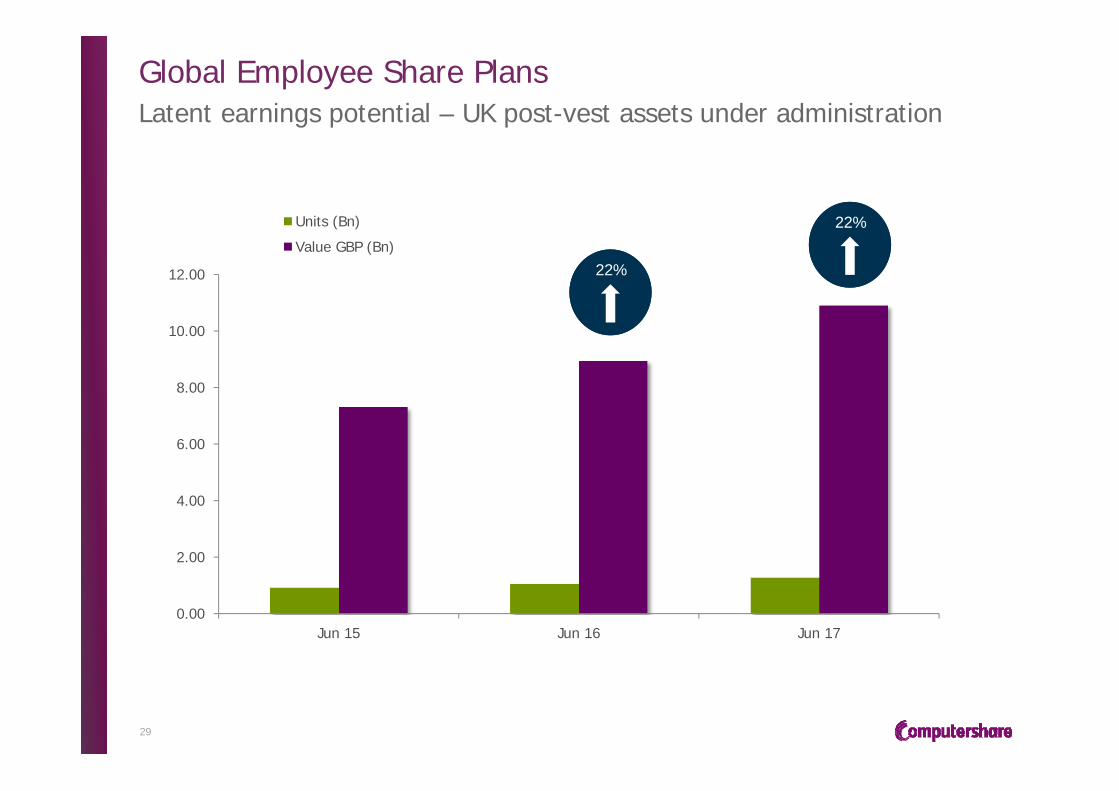
Global Employee Share PlansLatent earnings potential – UK post-vest assets under administration
29
0.00
2.00
4.00
6.00
8.00
10.00
12.00
Jun 15 Jun 16 Jun 17
Units (Bn)
Value GBP (Bn)
22%
22%
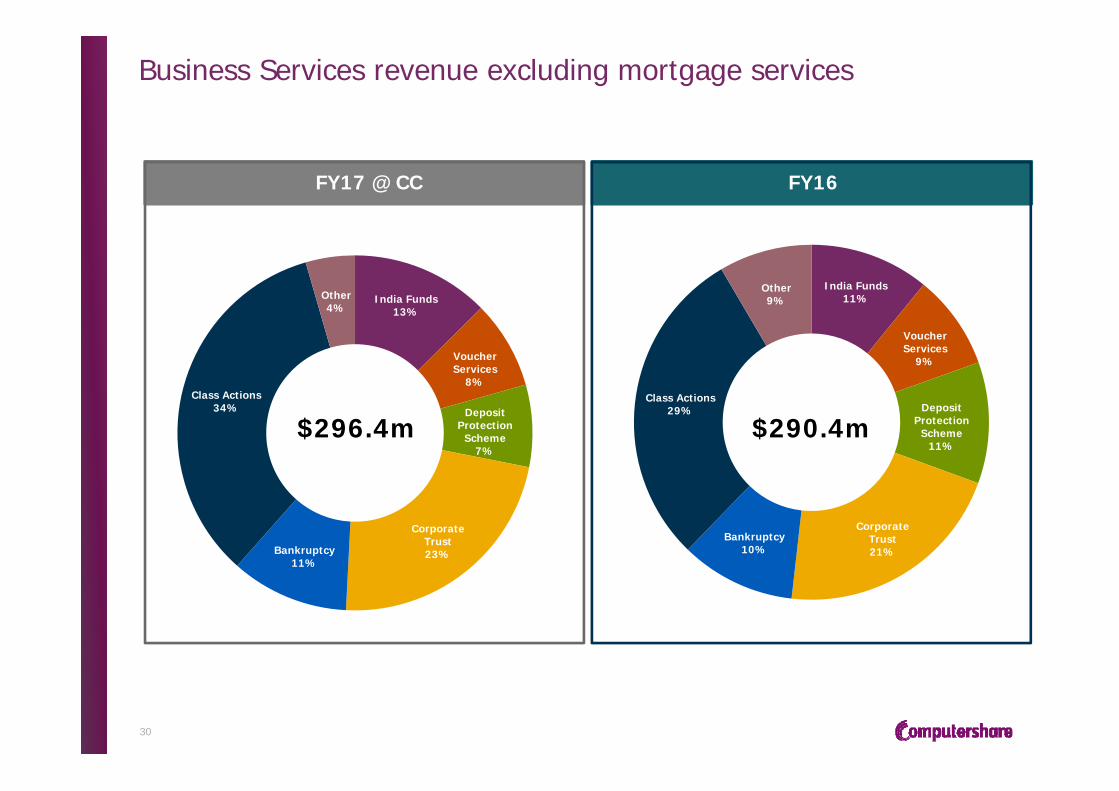
Business Services revenue excluding mortgage services
30
$290.4m
FY16
India Funds11%
Voucher Services
9%
Deposit Protection
Scheme11%
Corporate Trust21%
Bankruptcy10%
Class Actions29%
Other9%
$296.4m
FY17 @ CC
India Funds13%
Voucher Services
8%
Deposit Protection
Scheme7%
Corporate Trust23%Bankruptcy
11%
Class Actions34%
Other4%
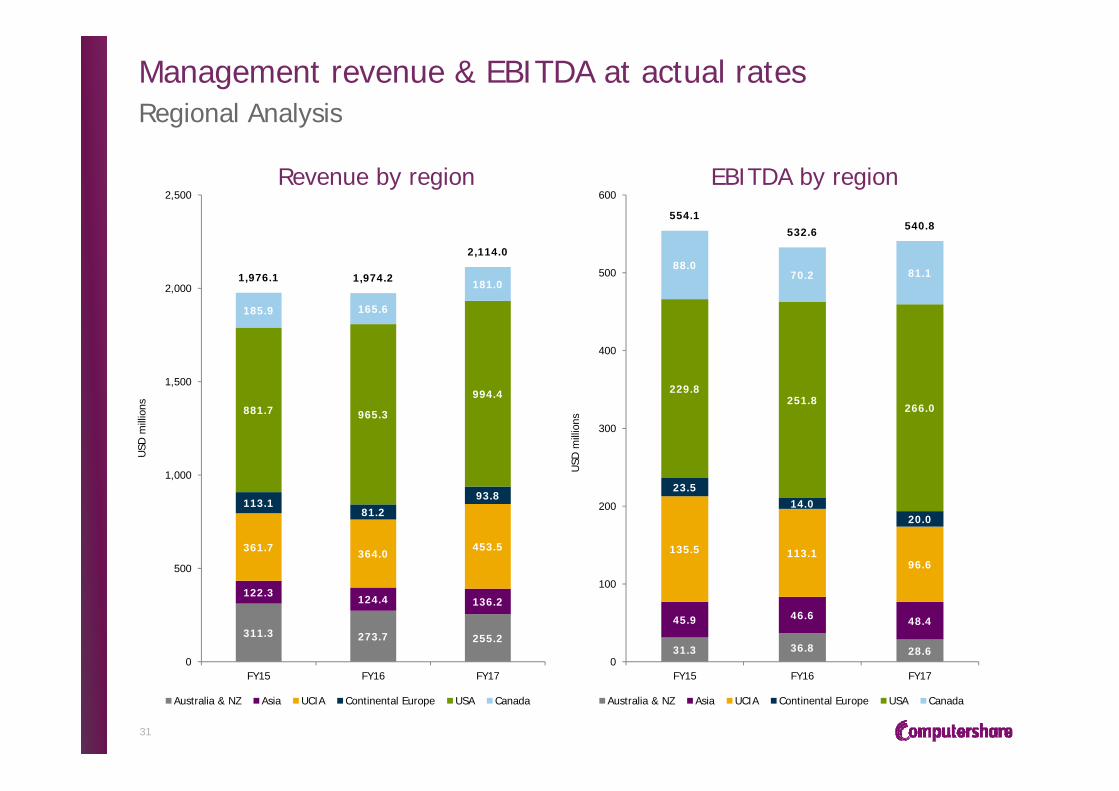
Management revenue & EBITDA at actual ratesRegional Analysis
31
311.3 273.7 255.2
122.3 124.4 136.2
361.7 364.0 453.5
113.1 81.2
93.8
881.7 965.3
994.4
185.9 165.6
181.0 1,976.1 1,974.2
2,114.0
0
500
1,000
1,500
2,000
2,500
FY15 FY16 FY17
USD
mill
ions
Australia & NZ Asia UCIA Continental Europe USA Canada
Revenue by region EBITDA by region
31.3 36.8 28.6
45.9 46.6 48.4
135.5 113.1 96.6
23.5 14.0
20.0
229.8 251.8
266.0
88.0 70.2 81.1
554.1 532.6 540.8
0
100
200
300
400
500
600
FY15 FY16 FY17
USD
mill
ions
Australia & NZ Asia UCIA Continental Europe USA Canada
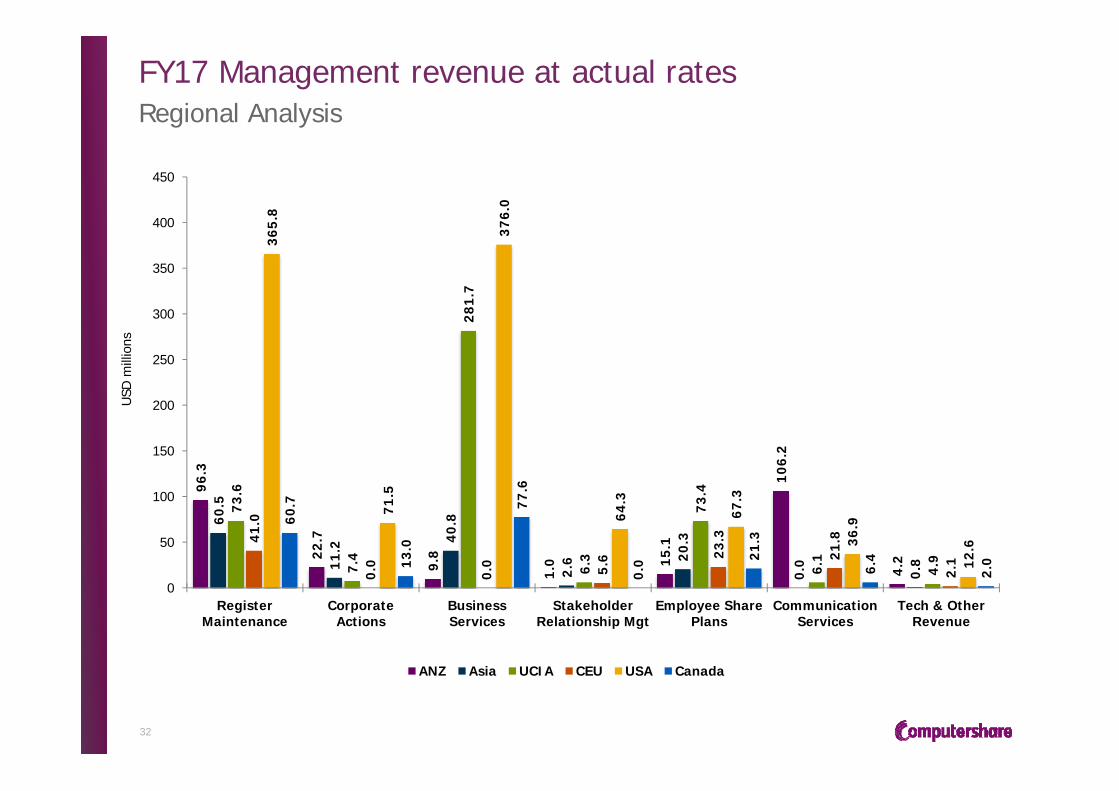
FY17 Management revenue at actual ratesRegional Analysis
32
96.3
22.7
9.8
1.0 15
.1
106.
2
4.2
60.5
11.2
40.8
2.6 20
.3
0.0
0.8
73.6
7.4
281.
7
6.3
73.4
6.1
4.9
41.0
0.0
0.0 5.6 23
.3
21.8
2.1
365.
8
71.5
376.
0
64.3
67.3
36.9
12.6
60.7
13.0
77.6
0.0 21
.3
6.4
2.0
0
50
100
150
200
250
300
350
400
450
RegisterMaintenance
CorporateActions
BusinessServices
StakeholderRelationship Mgt
Employee SharePlans
CommunicationServices
Tech & OtherRevenue
USD
mill
ions
ANZ Asia UCIA CEU USA Canada
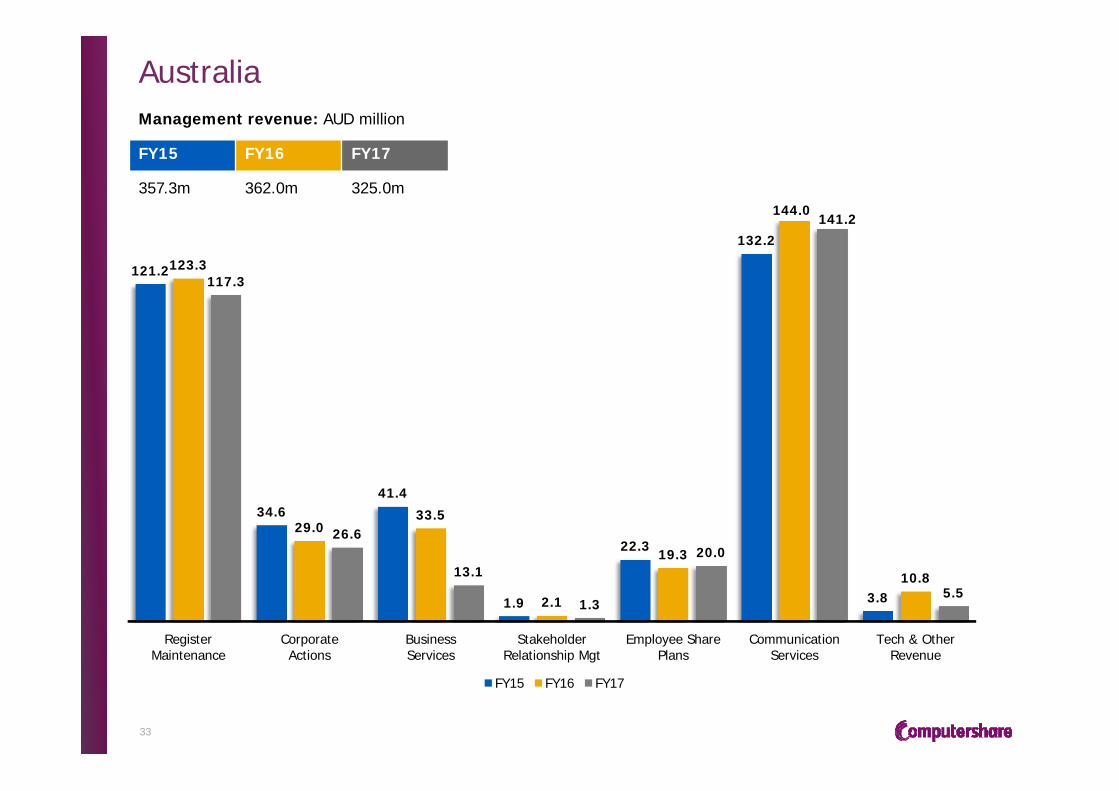
Australia
33
Management revenue: AUD million
FY15 FY16 FY17
357.3m 362.0m 325.0m
121.2
34.641.4
1.9
22.3
132.2
3.8
123.3
29.033.5
2.1
19.3
144.0
10.8
117.3
26.6
13.1
1.3
20.0
141.2
5.5
RegisterMaintenance
CorporateActions
BusinessServices
StakeholderRelationship Mgt
Employee SharePlans
CommunicationServices
Tech & OtherRevenue
FY15 FY16 FY17

Hong Kong
34
Management revenue: HKD million
FY15 FY16 FY17
575.4m 597.0m 631.8m
367.1
92.6
16.5
99.3
384.3
76.1
18.6
118.1
391.6
73.4
20.2
146.6
Register Maintenance Corporate Actions Stakeholder Relationship Mgt Employee Share Plans
FY15 FY16 FY17
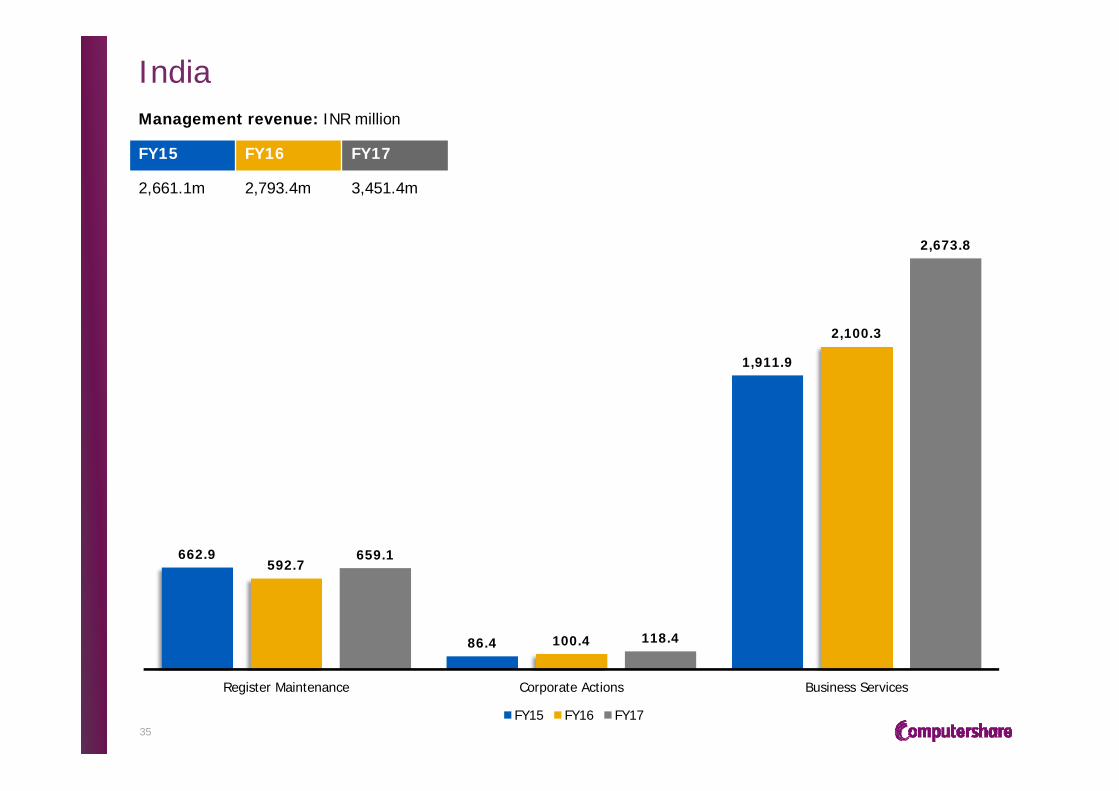
India
35
Management revenue: INR million
FY15 FY16 FY17
2,661.1m 2,793.4m 3,451.4m
662.9
86.4
1,911.9
592.7
100.4
2,100.3
659.1
118.4
2,673.8
Register Maintenance Corporate Actions Business Services
FY15 FY16 FY17
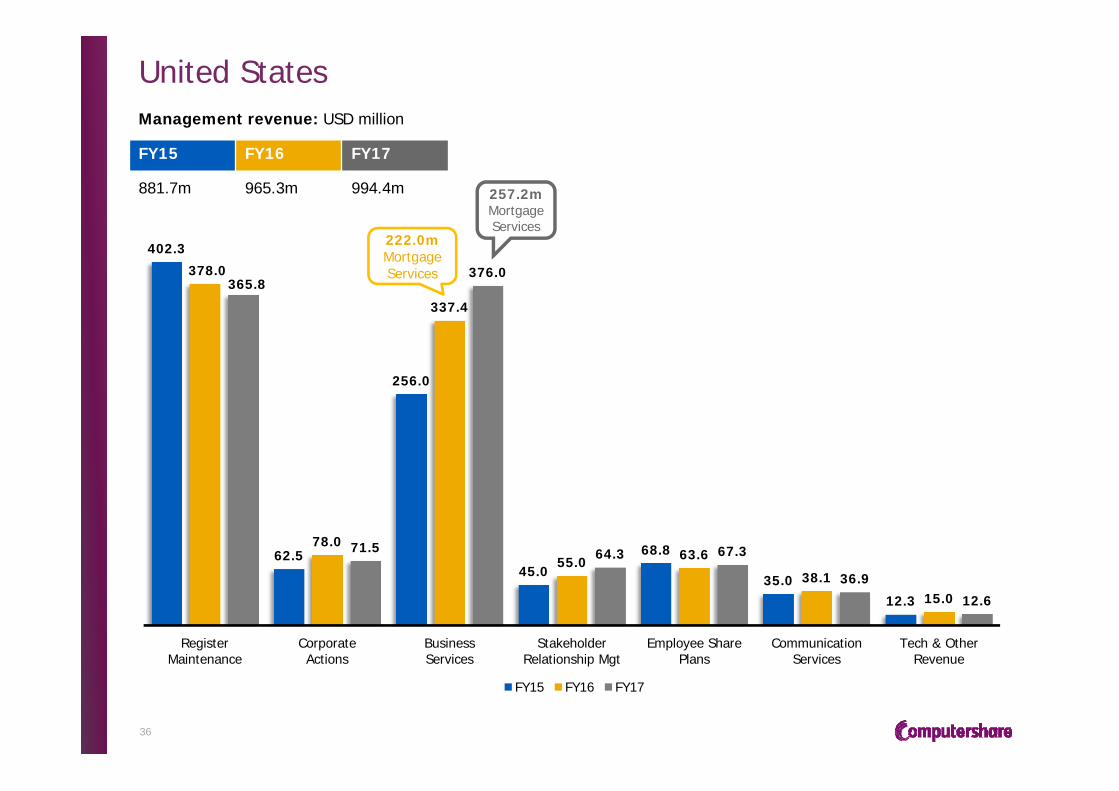
United States
36
Management revenue: USD million
FY15 FY16 FY17
881.7m 965.3m 994.4m 257.2mMortgage Services
402.3
62.5
256.0
45.0
68.8
35.012.3
378.0
78.0
337.4
55.0 63.6
38.115.0
365.8
71.5
376.0
64.3 67.3
36.9
12.6
RegisterMaintenance
CorporateActions
BusinessServices
StakeholderRelationship Mgt
Employee SharePlans
CommunicationServices
Tech & OtherRevenue
FY15 FY16 FY17
222.0mMortgage Services
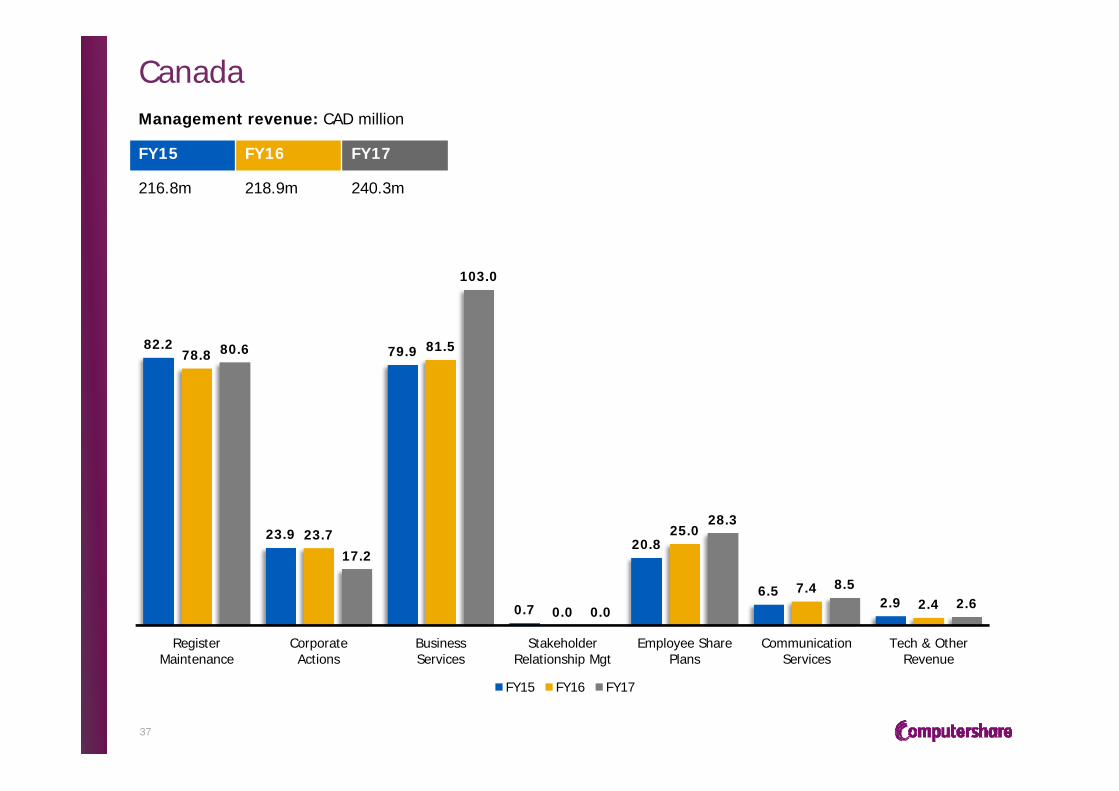
Canada
37
Management revenue: CAD million
FY15 FY16 FY17
216.8m 218.9m 240.3m
82.2
23.9
79.9
0.7
20.8
6.52.9
78.8
23.7
81.5
0.0
25.0
7.42.4
80.6
17.2
103.0
0.0
28.3
8.52.6
RegisterMaintenance
CorporateActions
BusinessServices
StakeholderRelationship Mgt
Employee SharePlans
CommunicationServices
Tech & OtherRevenue
FY15 FY16 FY17
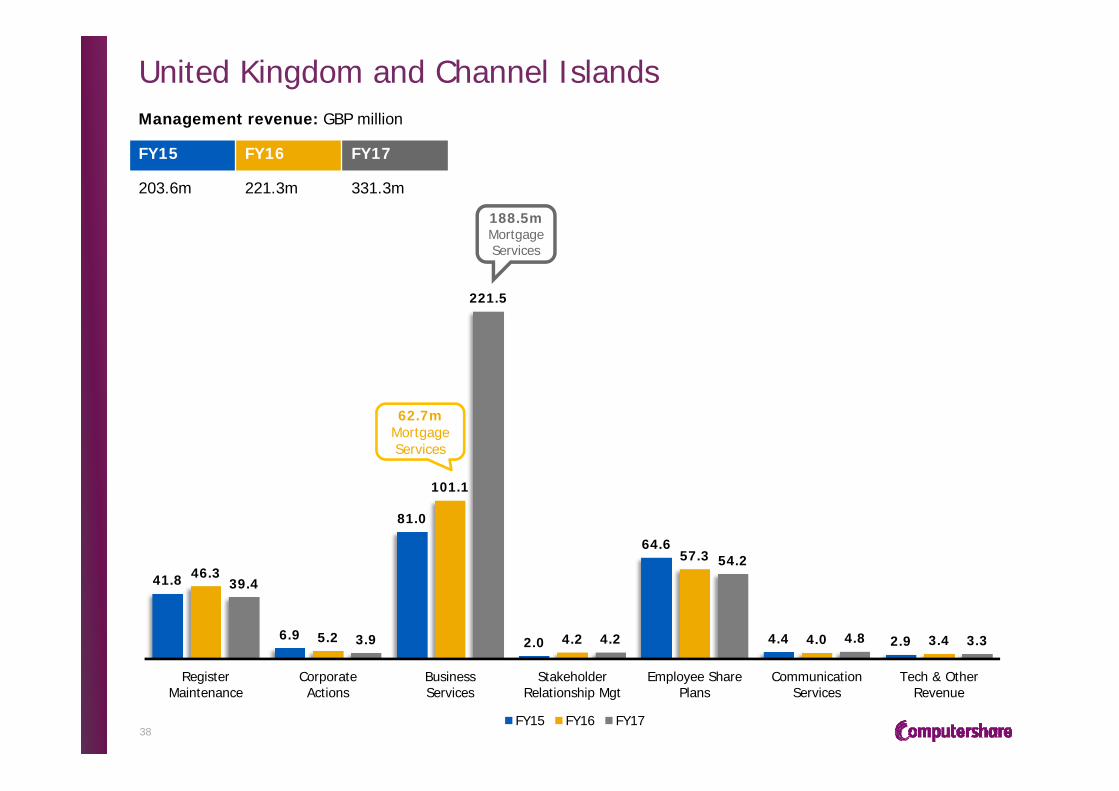
United Kingdom and Channel Islands
38
Management revenue: GBP million
FY15 FY16 FY17
203.6m 221.3m 331.3m
41.8
6.9
81.0
2.0
64.6
4.4 2.9
46.3
5.2
101.1
4.2
57.3
4.0 3.4
39.4
3.9
221.5
4.2
54.2
4.8 3.3
RegisterMaintenance
CorporateActions
BusinessServices
StakeholderRelationship Mgt
Employee SharePlans
CommunicationServices
Tech & OtherRevenue
FY15 FY16 FY17
62.7mMortgage Services
188.5mMortgage Services
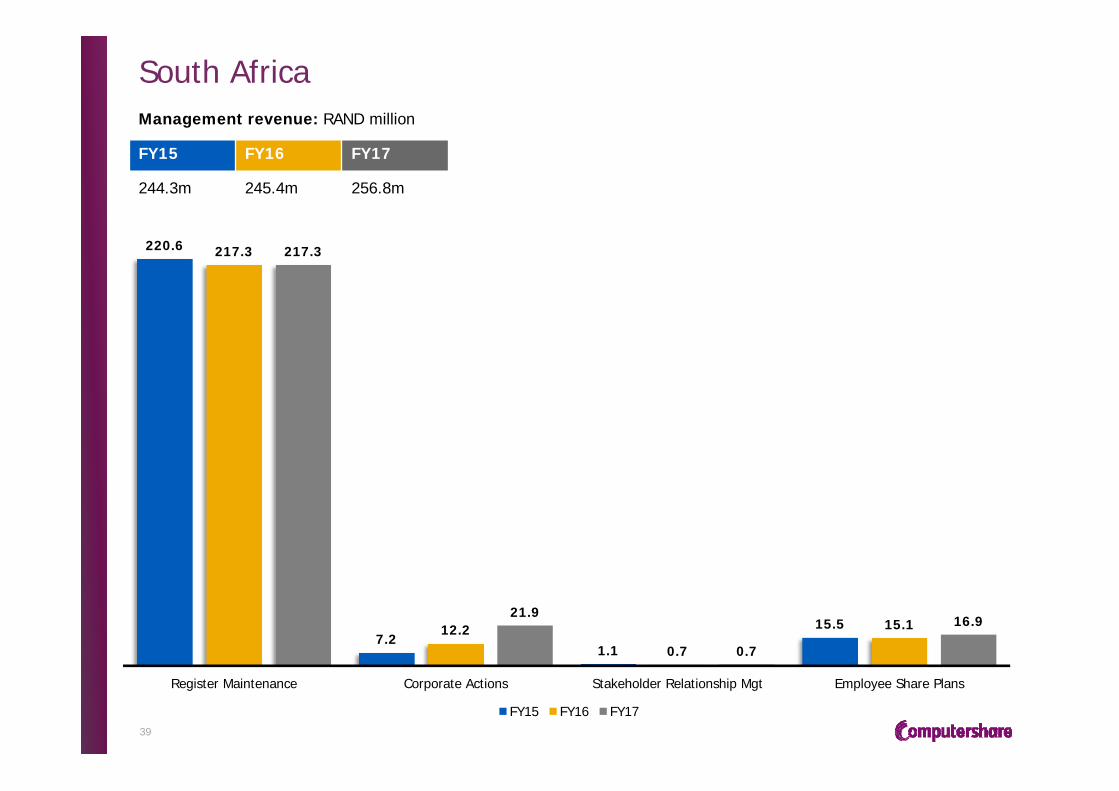
South Africa
39
Management revenue: RAND million
FY15 FY16 FY17
244.3m 245.4m 256.8m
220.6
7.21.1
15.5
217.3
12.20.7
15.1
217.3
21.9
0.7
16.9
Register Maintenance Corporate Actions Stakeholder Relationship Mgt Employee Share Plans
FY15 FY16 FY17
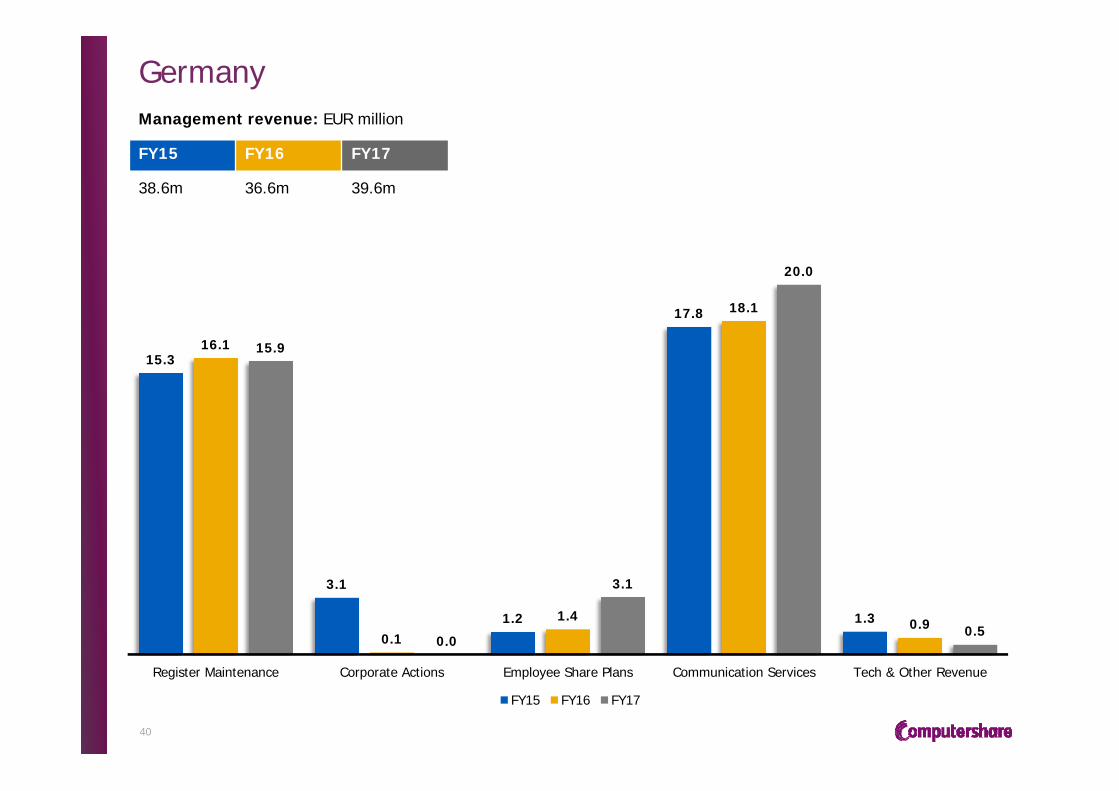
Germany
40
Management revenue: EUR million
FY15 FY16 FY17
38.6m 36.6m 39.6m
15.3
3.1
1.2
17.8
1.3
16.1
0.1
1.4
18.1
0.9
15.9
0.0
3.1
20.0
0.5
Register Maintenance Corporate Actions Employee Share Plans Communication Services Tech & Other Revenue
FY15 FY16 FY17

Management EPS – AUD equivalent
41
› For Australian investors, AUD equivalent EPS (actual) was weaker due to the combined impact of the weaker GBP and stronger AUD exchange rates.
AUD/USD average exchange rate
~
~53.27
65.92 71.31
75.74 72.35
1.0297
0.9139
0.8389
0.72730.7521
0
20
40
60
80
100
120
FY13 FY14 FY15 FY16 FY17
Cen
ts p
er s
hare
Management EPS (AUD)

Technology costs at actual rates
42
USD
mill
ion
Tech costs as a % of revenue
80.4 76.9 75.8
79.0 81.1 91.7
62.5 65.784.2
14.2 12.7
9.6236.0 236.4
261.3
11.9% 12.0%12.4%
0%
2%
4%
6%
8%
10%
12%
14%
0
50
100
150
200
250
300
350
FY15 FY16 FY17
Development Infrastructure Maintenance Admin Technology costs as a % of revenue

Capital expenditure versus depreciation at actual rates
43
Cape
xU
SD m
illio
n
25.6
16.820.8
2.1
2.51.7
8.7
8.1
11.1
2.2
2.5
1.9
38.6
29.9
35.4
0
5
10
15
20
25
30
35
40
45
50
0
10
20
30
40
50
60
70
FY15 FY16 FY17
Information Technology Communication Services Facilities Occupancy Other Depreciation
Depreciation
USD
million
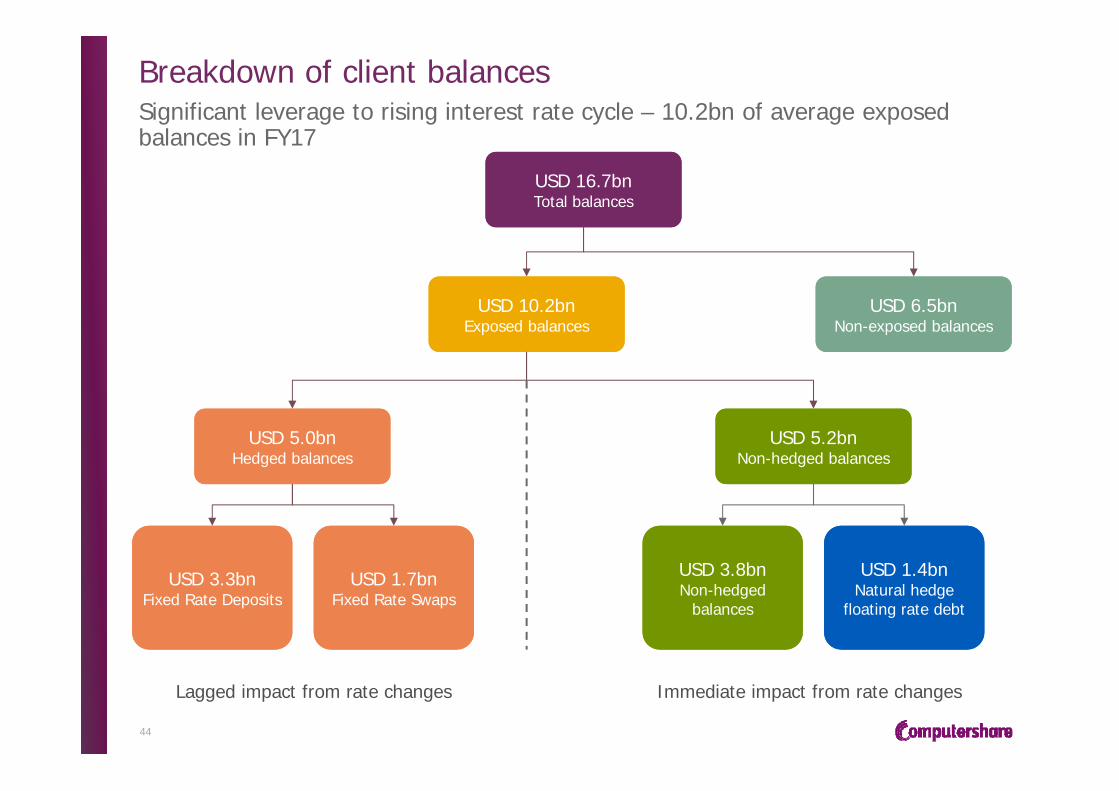
Breakdown of client balancesSignificant leverage to rising interest rate cycle – 10.2bn of average exposed balances in FY17
44
USD 16.7bnTotal balancesUSD 16.7bnTotal balances
USD 6.5bnNon-exposed balances
USD 6.5bnNon-exposed balances
USD 10.2bnExposed balances
USD 10.2bnExposed balances
USD 5.2bnNon-hedged balances
USD 5.2bnNon-hedged balances
USD 5.0bnHedged balances
USD 5.0bnHedged balances
USD 3.3bnFixed Rate Deposits
USD 3.3bnFixed Rate Deposits
USD 1.7bnFixed Rate Swaps
USD 1.7bnFixed Rate Swaps
USD 3.8bnNon-hedged
balances
USD 3.8bnNon-hedged
balances
USD 1.4bnNatural hedge
floating rate debt
USD 1.4bnNatural hedge
floating rate debt
Lagged impact from rate changes Immediate impact from rate changes
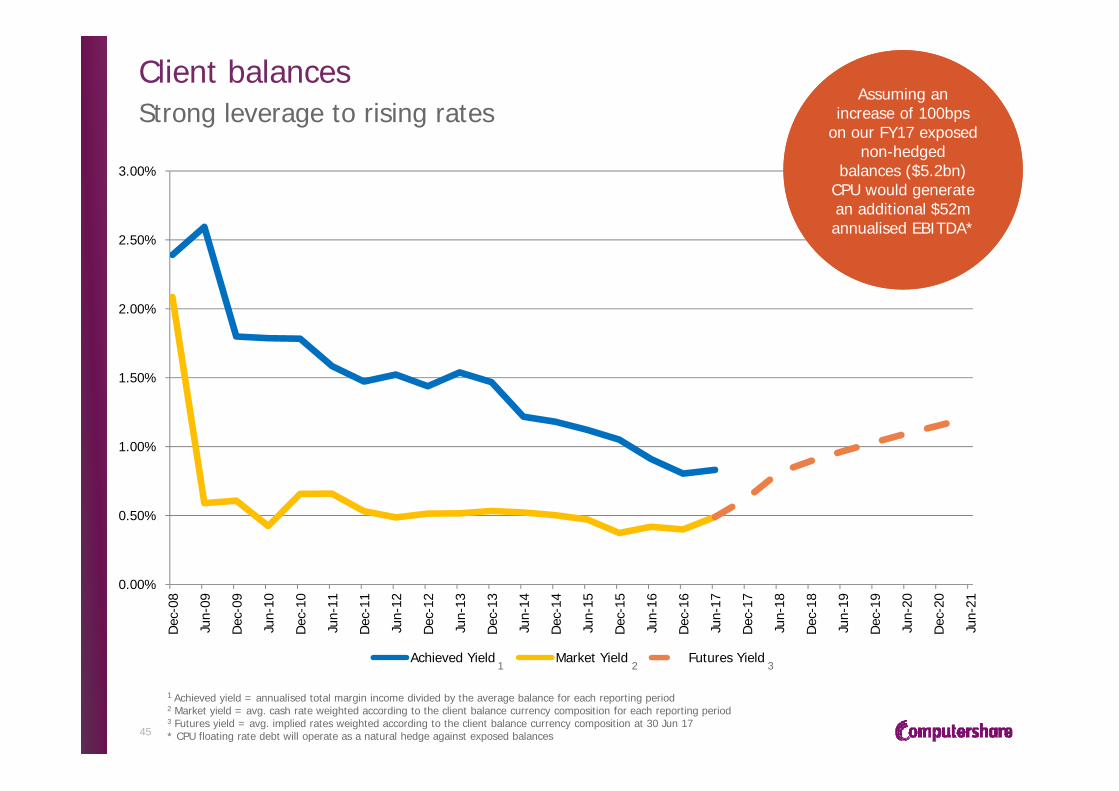
Client balancesStrong leverage to rising rates
45
1 Achieved yield = annualised total margin income divided by the average balance for each reporting period2 Market yield = avg. cash rate weighted according to the client balance currency composition for each reporting period3 Futures yield = avg. implied rates weighted according to the client balance currency composition at 30 Jun 17* CPU floating rate debt will operate as a natural hedge against exposed balances
1 2 3
0.00%
0.50%
1.00%
1.50%
2.00%
2.50%
3.00%D
ec-0
8
Jun-
09
Dec
-09
Jun-
10
Dec
-10
Jun-
11
Dec
-11
Jun-
12
Dec
-12
Jun-
13
Dec
-13
Jun-
14
Dec
-14
Jun-
15
Dec
-15
Jun-
16
Dec
-16
Jun-
17
Dec
-17
Jun-
18
Dec
-18
Jun-
19
Dec
-19
Jun-
20
Dec
-20
Jun-
21
Achieved Yield Market Yield Futures Yield
Assuming an increase of 100bps
on our FY17 exposed non-hedged
balances ($5.2bn) CPU would generate an additional $52m annualised EBITDA*
Assuming an increase of 100bps
on our FY17 exposed non-hedged
balances ($5.2bn) CPU would generate an additional $52m annualised EBITDA*
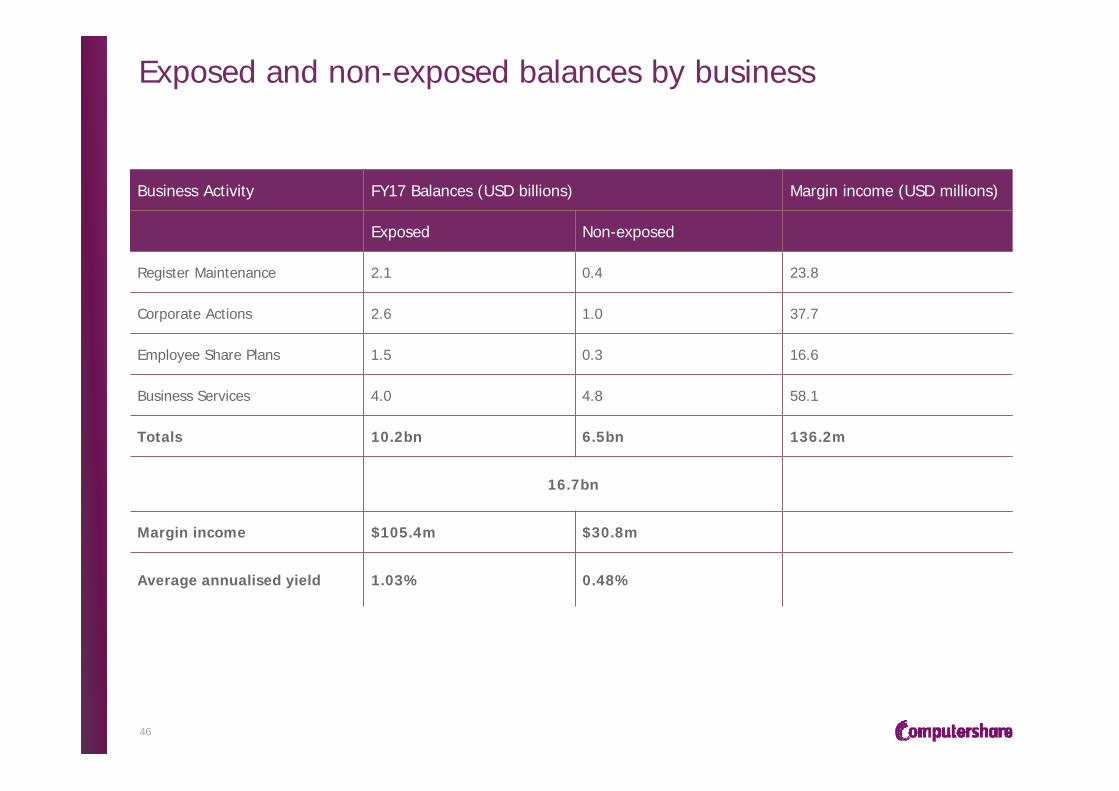
Exposed and non-exposed balances by business
46
Business Activity FY17 Balances (USD billions) Margin income (USD millions)
Exposed Non-exposed
Register Maintenance 2.1 0.4 23.8
Corporate Actions 2.6 1.0 37.7
Employee Share Plans 1.5 0.3 16.6
Business Services 4.0 4.8 58.1
Totals 10.2bn 6.5bn 136.2m
16.7bn
Margin income $105.4m $30.8m
Average annualised yield 1.03% 0.48%
CAD13%
GBP38%
USD49%
AUD4%
CAD13%
GBP32%
USD46%
Other5%
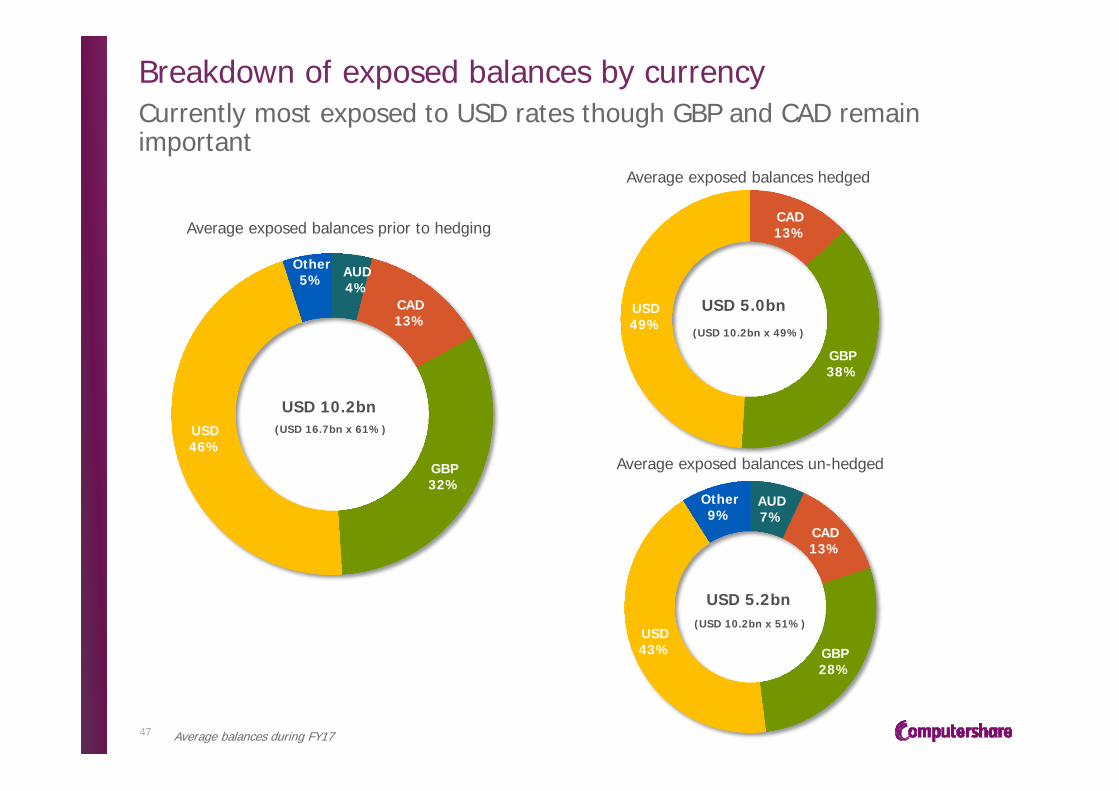
Breakdown of exposed balances by currencyCurrently most exposed to USD rates though GBP and CAD remain important
47
Average exposed balances prior to hedging
USD 10.2bn(USD 16.7bn x 61%)
AUD7%
CAD13%
GBP28%
USD43%
Other9%
USD 5.2bn
Average exposed balances un-hedged
(USD 10.2bn x 51%)
USD 5.0bn
(USD 10.2bn x 49%)
Average exposed balances hedged
Average balances during FY17
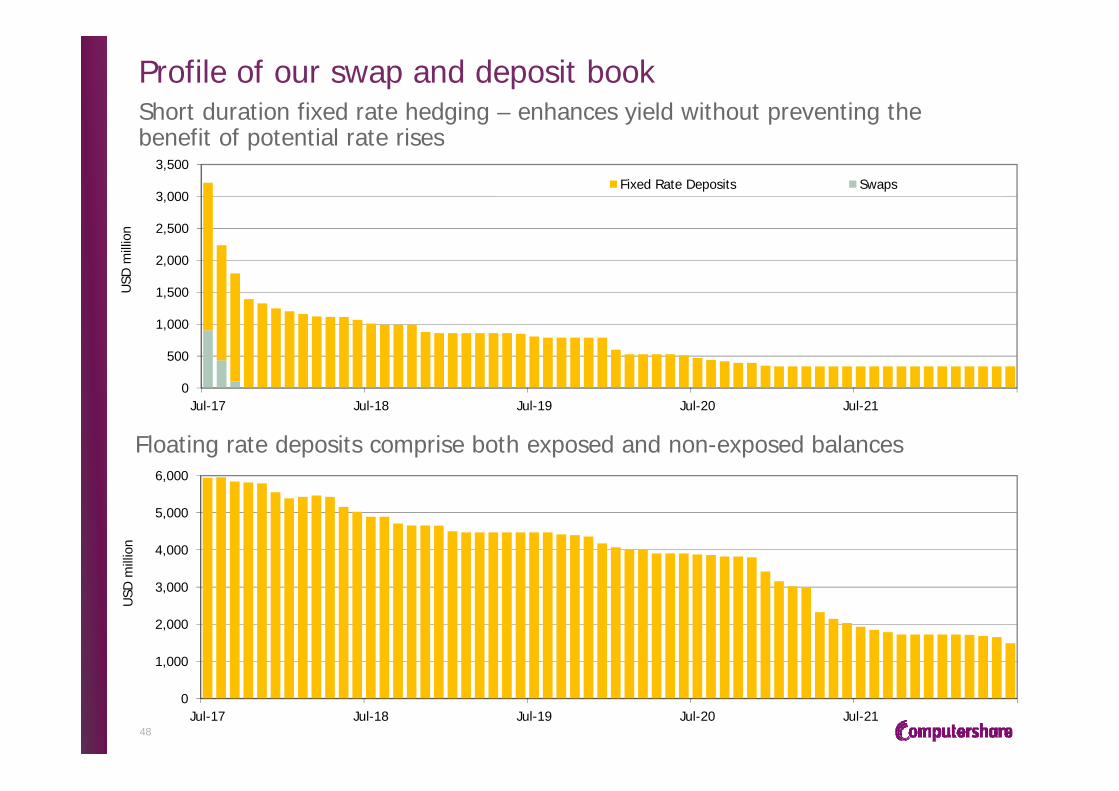
Profile of our swap and deposit book Short duration fixed rate hedging – enhances yield without preventing the benefit of potential rate rises
48
Floating rate deposits comprise both exposed and non-exposed balances
USD
mill
ion
USD
mill
ion
0
500
1,000
1,500
2,000
2,500
3,000
3,500
Jul-17 Jul-18 Jul-19 Jul-20 Jul-21
Fixed Rate Deposits Swaps
0
1,000
2,000
3,000
4,000
5,000
6,000
Jul-17 Jul-18 Jul-19 Jul-20 Jul-21

235.0
40.0
70.0
220.0 220.0
72.1
122.6
121.9
450.0
110
200
450
0.0
100.0
200.0
300.0
400.0
500.0
600.0
FY18 FY19 FY20 FY21 FY22 FY23 FY24 FY25
USPP SLS non-recourse advance facilities drawn Syndicated debt drawn Undrawn
Debt facility maturity profile
49
Maturity DatesUSD million
DebtDrawn
Committed Debt
Facilities
Bank Debt
Facility
Private Placement
Facility
SLSAdvanceFacility
FY18 Dec-17 72.1 110.0 110.0 Feb-18 40.0 40.0 40.0
FY19 Jul-18 235.0 235.0 235.0Dec-18 122.6 200.0 200.0Feb-19 70.0 70.0 70.0
FY20 Jul-19 121.9 450.0 450.0FY21 Jul-20 450.0 450.0 450.0FY22 Feb-22 220.0 220.0 220.0FY24 Feb-24 220.0 220.0 220.0
TOTAL $1,551.6 $1,995.0 $900.0 $785.0 $310.0
Note: Average debt facility maturity is 2.8 years as at 30-Jun-17
USD
mill
ion
$325m fixed $1,226.6m floating

Key financial ratios
50
Jun 17USD m
Jun 16USD m
VarianceJun 17 to Jun 16
Interest Bearing Liabilities including SLS advance debt $1,573.1 $1,863.3 -15.6%
Less Cash ($510.7) * ($526.6) -3.0%
Net Debt (including SLS advance debt) $1,062.4 $1,336.7 -20.5%
Management EBITDA $540.8 $532.6 +1.5%
Net Financial Indebtedness to EBITDA 1.96 times 2.51 times Down 0.55 times
Net Financial Indebtedness to EBITDA# 1.60 times 2.12 times Down 0.52 times
10.79.8 9.9
0.0
2.0
4.0
6.0
8.0
10.0
12.0
FY15 FY16 FY17
Tim
es
EBITDA Interest Coverage
1.862.12
1.60
2.10
2.51
1.96
0.0
0.5
1.0
1.5
2.0
2.5
3.0
FY15 FY16 FY17
Tim
es
Net Financial Indebtedness to EBITDA
Net debt (excl. non-recourse SLS Advance debt) to EBITDA ratio
Net debt to EBITDA ratio
# excludes non-recourse SLS advance debt
* FY17 includes cash that is classified as an asset held for sale
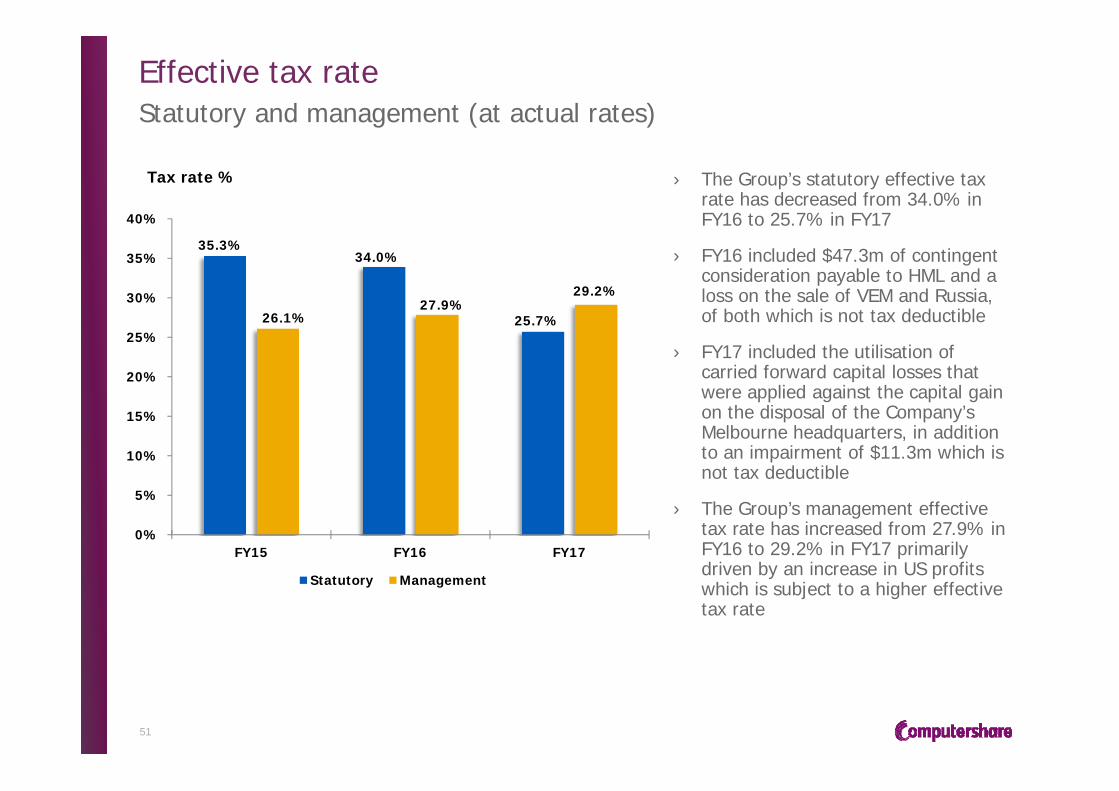
Effective tax rate Statutory and management (at actual rates)
51
Tax rate % › The Group’s statutory effective tax rate has decreased from 34.0% in FY16 to 25.7% in FY17
› FY16 included $47.3m of contingent consideration payable to HML and a loss on the sale of VEM and Russia, of both which is not tax deductible
› FY17 included the utilisation of carried forward capital losses that were applied against the capital gain on the disposal of the Company’s Melbourne headquarters, in addition to an impairment of $11.3m which is not tax deductible
› The Group’s management effective tax rate has increased from 27.9% in FY16 to 29.2% in FY17 primarily driven by an increase in US profits which is subject to a higher effective tax rate
35.3%34.0%
25.7%26.1%27.9%
29.2%
0%
5%
10%
15%
20%
25%
30%
35%
40%
FY15 FY16 FY17
Statutory Management
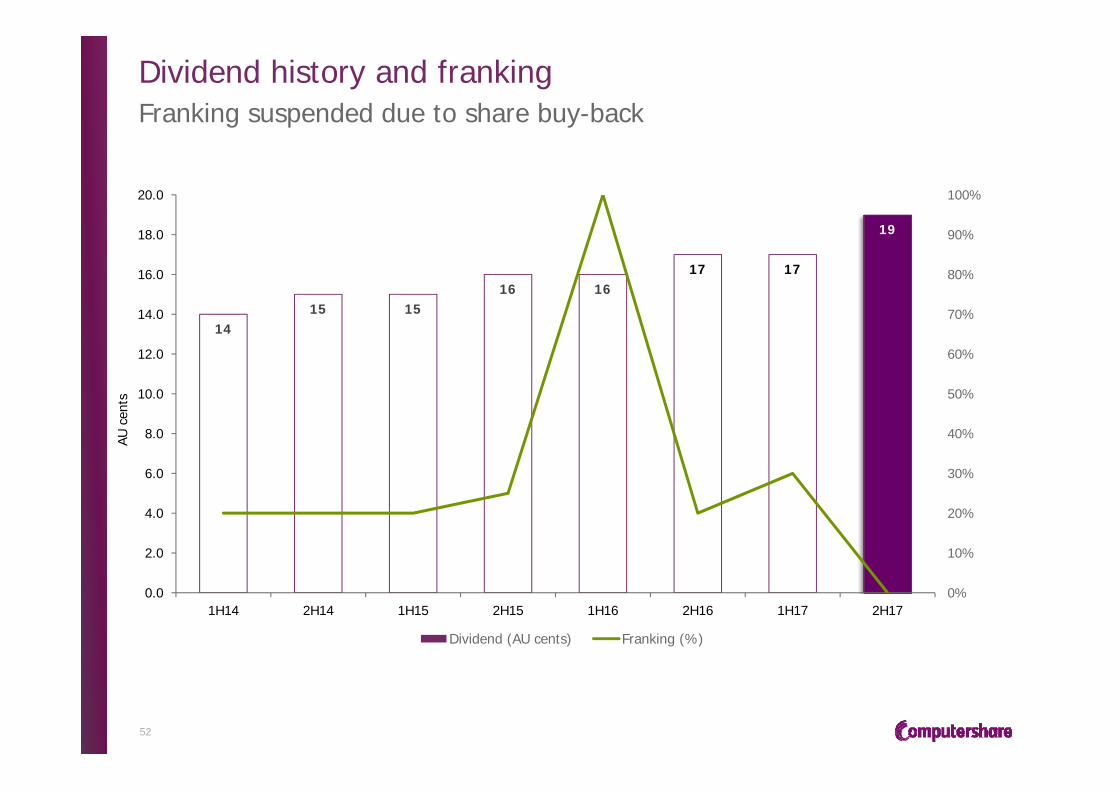
Dividend history and franking
52
1415 15
16 1617 17
19
0%
10%
20%
30%
40%
50%
60%
70%
80%
90%
100%
0.0
2.0
4.0
6.0
8.0
10.0
12.0
14.0
16.0
18.0
20.0
1H14 2H14 1H15 2H15 1H16 2H16 1H17 2H17
Dividend (AU cents) Franking (%)
AU c
ents
Franking suspended due to share buy-back

US and UK mortgage services - UPB and number of loans
53
1 CPU owns the MSR outright2 CPU has sold part of the MSR to a third party investor3 Servicing performed on a contractual basis* Comparative figure has been restated
US mortgage services UPB up 12.9% ($59.7bn v $52.9bn) on pcp
During the period, the US did a MSR Excess transaction to a 3rd
Party whereby $3.8bn was moved from Performing Fully-Owned MSRs to Performing Part-Owned MSRs.
CommentsPerforming Non-performing
At 30 Jun 17 At 30 Jun 16 At 30 Jun 17 At 30 Jun 16
U.S
.
$8.5bn 38K Loans
$4.9bn24K Loans
$12.4bn103K Loans
$8.8bn92K Loans
Fully-Owned MSRs 1
Excess strip deals$14.6bn
66K Loans
Excess strip deals$14.1bn
60K Loans
SPV deals$15.8bn
72K Loans
SPV deals$13.6bn
55K Loans
Part-Owned MSRs 2
Minimal $1.8bn5K Loans
Minimal $0.5bn1K Loans
$6.6bn88K Loans
$11.0bn97K LoansSubservicing 3
$24.9bn $19.5bn $34.8bn $33.4bnTotal US UPB
£60.0bn485K Loans
£64.9bn539K* Loans
£4.3bn37K Loans
£6.2bn51K Loans
Fee for Service 3U
.K.
Mor
tgag
e Se
rvic
ing

Financial Snapshot – US Mortgage Servicing
54
FY17 revenue composition
Base servicing
fees54%
Servicing related
fees21%
Other service fees
25%
$257.2m
Jun-17 Jun-16 FY16 Annual Report reference
Net Loan Servicing Advances $23.2 $46.9 • Note 15 Loan Servicing Advances• Note 13 Interest Bearing Liabilities
Loan servicing advances SLS non-recourse lending facility
Net MSR intangible asset $217.7 $155.7 • Note 9 Intangible Assets• Note 24 Other Liabilities
Mortgage servicing rights Mortgage servicing related liabilities
Investment in SPVs $29.3 $16.3 • Note 19 Available for sale equity securities Non current equity securitiesOther intangible assets1 $69.7 $56.6 • Note 9 Intangible Assets Goodwill; OtherTotal invested capital $339.9 $275.5
Net cash payments for MSR purchases $85.8 $51.7 • Cashflow Statement
Investing cash flow - Payments for purchase of controlled entities and businesses (net of cash acquired) and intangible assets
MSR amortisation $23.9 $12.1 • Note 1 revenue and expenses from continuing operations Total Amortisation (net)
• Base servicing fees, $138.6m, +15.8%
• Servicing related fees $53.1m, +22.1%
• Other services fees $65.5m, +11.4%
1 Other intangibles are largely goodwill and acquired client lists related to the CMC acquisition
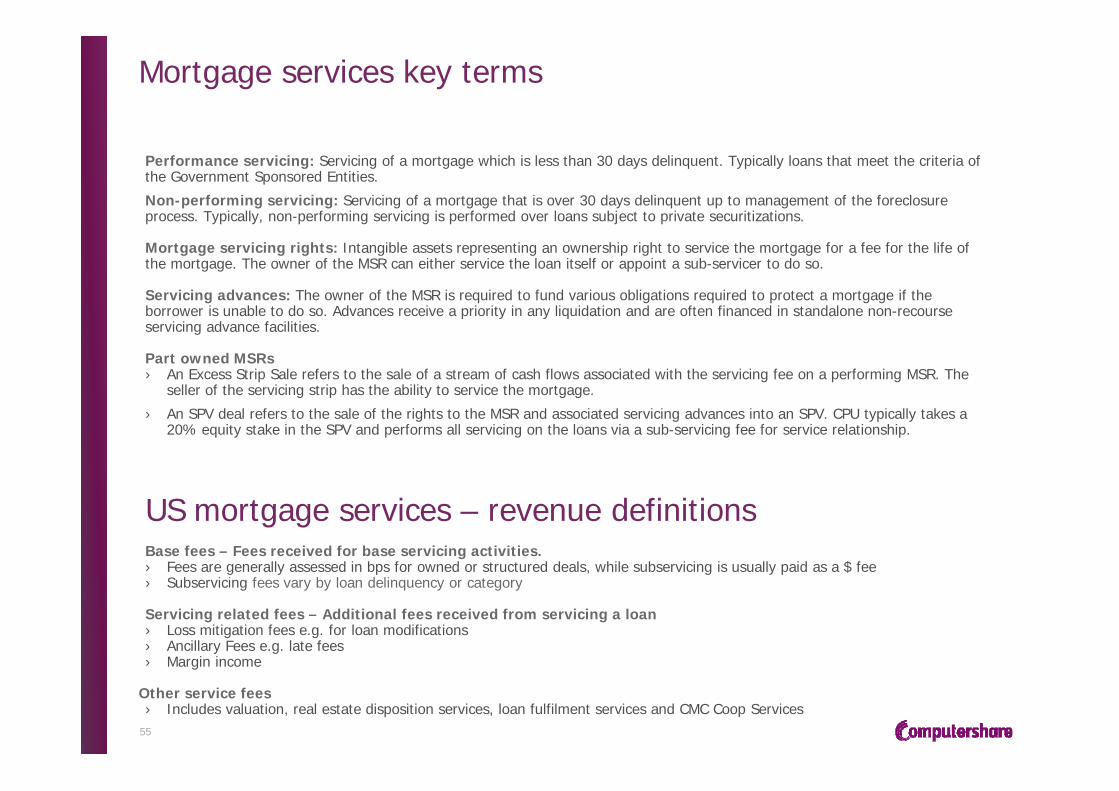
Mortgage services key terms
55
Performance servicing: Servicing of a mortgage which is less than 30 days delinquent. Typically loans that meet the criteria of the Government Sponsored Entities.
Non-performing servicing: Servicing of a mortgage that is over 30 days delinquent up to management of the foreclosure process. Typically, non-performing servicing is performed over loans subject to private securitizations.
Mortgage servicing rights: Intangible assets representing an ownership right to service the mortgage for a fee for the life of the mortgage. The owner of the MSR can either service the loan itself or appoint a sub-servicer to do so.
Servicing advances: The owner of the MSR is required to fund various obligations required to protect a mortgage if the borrower is unable to do so. Advances receive a priority in any liquidation and are often financed in standalone non-recourse servicing advance facilities.
Part owned MSRs› An Excess Strip Sale refers to the sale of a stream of cash flows associated with the servicing fee on a performing MSR. The
seller of the servicing strip has the ability to service the mortgage.
› An SPV deal refers to the sale of the rights to the MSR and associated servicing advances into an SPV. CPU typically takes a 20% equity stake in the SPV and performs all servicing on the loans via a sub-servicing fee for service relationship.
US mortgage services – revenue definitionsBase fees – Fees received for base servicing activities.› Fees are generally assessed in bps for owned or structured deals, while subservicing is usually paid as a $ fee› Subservicing fees vary by loan delinquency or category
Servicing related fees – Additional fees received from servicing a loan › Loss mitigation fees e.g. for loan modifications› Ancillary Fees e.g. late fees› Margin income
Other service fees › Includes valuation, real estate disposition services, loan fulfilment services and CMC Coop Services

Exchange rates
56
› Average exchange rates used to translate profit and loss to US dollars for key reporting currencies
Currency FY17 FY16 Var USD has:
USD 1.0000 1.0000AUD 1.3296 1.3749 -3.3% Weakened
HKD 7.7630 7.7586 0.1% Strengthened
NZD 1.4050 1.5017 -6.4% Weakened
INR 66.6241 66.2864 0.5% Strengthened
CAD 1.3278 1.3218 0.5% Strengthened
GBP 0.7862 0.6717 17.0% Strengthened
EUR 0.9186 0.9039 1.6% Strengthened
RAND 13.7301 14.4555 -5.0% Weakened
Important notice
57
Forward-looking statements
› This announcement may include 'forward-looking statements'. Such statements can generally be identified by the use of words such as 'may', 'will', 'expect', 'intend', 'plan', 'estimate', 'anticipate', 'believe', 'continue', 'objectives', 'outlook', 'guidance' and similar expressions. Indications of plans, strategies, management objectives, sales and financial performance are also forward-looking statements.
› Such statements are not guarantees of future performance, and involve known and unknown risks, uncertainties and other factors, many of which are outside the control of Computershare. Actual results, performance or achievements may vary materially from any forward-looking statements. Readers are cautioned not to place undue reliance on forward-looking statements, which are current only as at the date of this announcement.