
Board of Livestock Meeting -...
85
Board of Livestock Meeting Agenda Request Form From: George Edwards Division/Program: LLB Meeting Date: 2/21/18 Agenda Item: Livestock Loss Board claims numbers Background Info: Recommendation: Time needed: Attachments: Yes Board vote required? No
Transcript of Board of Livestock Meeting -...

Board of Livestock Meeting Agenda Request Form
From: George Edwards
Division/Program: LLB Meeting Date: 2/21/18
Agenda Item: Livestock Loss Board claims numbers Background Info: Recommendation: Time needed: Attachments: Yes Board vote required? No

Montana LLB George Edwards
PO Box 202005 Executive SecretaryDirector
Helena MT 59620 (406) 444-5609
www.llb.mt.gov [email protected]
Counties Cattle Sheep Goats Guard Horse Swine Totals Payments
Beaverhead 22 2 24 $23,668.54
Carbon 16 16 $17,365.65
Cascade 3 25 28 $10,159.93
Flathead 4 4 $1,394.42
Gallatin 1 3 3 7 $1,936.77
Glacier 12 12 $11,811.90
Judith Basin 4 4 $4,120.72
Lake 2 2 4 8 $2,999.70
L&C 9 4 13 $10,320.50
Lincoln 8 8 $2,086.05
Madison 19 19 $29,190.58
Missoula 1 1 $125.00
Park 7 7 $8,236.43
Pondera 20 2 22 $47,454.66
Powell 10 1 11 $10,565.95
Ravalli 2 2 $2,130.10
Sanders 1 2 3 $1,486.59
Silver Bow 1 1 $906.69
Teton 14 2 5 21 $19,310.63
Totals 143 49 15 0 0 4 211 $205,270.81
Wolves
Confirmed 52 6
Probable 7 2
Value $61,176.70 $2,956.24
Owners 25 4
Grizzly Bears
Confirmed 54 11 5
Probable 30 1 4
Value $130,702.08 $3,196.37 $762.50 $643.16
Owners 35 3 1 2
Mtn Lion
Confirmed 27 9
Probable 2 1
Value $8,663.36 $2,290.82
Owners 4 5
2017 Jan 29 2018

Milk Control Bureau Submission for Board of Livestock February 21, 2018 Meeting Consent Agenda Update on Milk Control Study
• Dairy Technomics submitted a study status report as of January 31, 2018. The report discussed research activities carried out by the firm, information received from the bureau, major analyses underway, and major observations to-date.
• Since the last report submitted to the Board of Livestock, the bureau has continued to send significant amounts of information to Dairy Technomics, including information organized in a manner conducive to modeling alternatives for milk price formulas and other mechanisms that affect the valuation of producers’ milk.
• Dairy Technomics believes that the project seems to be on schedule. The target time for a draft report of the study is mid to late March 2018.
Filing for Notice of Adoption of MAR 32-17-288 Proposal to Amend ARM 32.24.450 The comment period for the proposal to amend ARM 32.24.450 (milk control assessments) that was noticed in MAR 32-17-288 ended on February 9, 2018. No comments were received. After consulting the chair of the Board of Milk Control, the bureau requested the department administrative rules clerk to file a notice of adoption with the office of the Secretary of State. The notice of adoption will be published on February 23, 2018. The amendments will become effective on July 1, 2018. The amendments set new rates for milk control assessments for fiscal year 2019 and establish the milk equivalent conversion factors used to calculate milk control assessments on sales of manufactured dairy products, which implements 2017 HB377. Drop in Montana Milk Prices Beginning in February 2018, milk prices will decline substantially (compared to the prior 18 months). Diminished prices are anticipated to endure for at least five months. Out-of-State / Out-of-Country Travel Request The bureau is requesting that the Board of Livestock approve travel for Chad Lee to attend the International Association of Milk Control Agencies (IAMCA) 2018 conference – contingent upon approval of the chair of the Board of Milk Control or the Board of Milk Control. The conference is being held July 23 – 25, 2018 in Winnipeg, Manitoba. The Milk Control Bureau has attended IAMCA conferences many years and participates in the meetings of the organization’s executive committee. The bureau attends the conference to learn about developments in milk market regulation and the dairy industry. Attending provides opportunity for the bureau to build relationships with and have candid conversations with other milk market regulators. This interaction and relationship building proves beneficial when the bureau communicates with regulators regarding the sales of Montana milk into other regulated markets, when the bureau makes inquiries to other regulators about techniques and methods used to carry out certain functions, and when the bureau is pursuing information or expertise. The conference agenda has not yet been set beyond starting and ending times. The bureau is requesting travel approval at this time to enable it to purchase airplane tickets at better prices and on dates that may reduce lodging costs. Tickets will not be purchased until after approval has been received from the chair of the Board of Milk Control.

Veterinary Diagnostic Lab Consent Agenda Report for Board of Livestock February 21, 2018 Meeting
As I have described previously, we are getting closer to having part-time contract pathologists
in place at the lab. One contractor completed paperwork at a local employment agency today
(2/16/18), and intends to start working one half-day per week soon. We are putting the
finishing touches on a system to ensure that contractors have read and agreed to comply with
pertinent aspects of our quality management system and initially, I will be reviewing contractor
reports before release for accuracy and content. A second potential contractor is less
interested because of the amount we are offering per case (about half what she makes
elsewhere), but may still be willing to do some cases just to help us out. It will be important to
get these contractors up to speed as soon as possible, because it may not be possible to fully
keep up with cases with only one pathologist on staff in April, even with contractors working at
full capacity.
Another staff retirement was announced last week, in one of the positions in our front
office. The payout for this particular employee will be roughly equivalent to the savings from
leaving the position open for the remainder of the fiscal year, so that is my current plan, if
possible. Rather than re-hiring this position as it existed, I intend to use the FTE to create a
much-needed new position at the lab for a business administrator and assistant director, and it
is my intention to develop the new position description in the coming months, in preparation
for board review, approval, and recruitment in FY2019.
The lab study committee meeting scheduled for 2/15/18 was canceled due to road conditions,
and a rescheduled meeting has not yet been announced. The deadline for responses for the
previously described RFQ was 2/13/18, and I am aware of at least two highly qualified firms
that were excited about the project and submitted proposals. I expect that the interview
committee to select a consultant for the initial planning work will form within the next several
weeks, and hopefully we will be able to move forward with programming and cost analysis in
the next few months.

Milk and Egg Bureau Report of Activities
February 2018
• Milk licensing is complete for the year of 2018 and has gone well. Darcy has been able to
use the computer system for licenses, though it is not entirely reliable. We also use an
Excel program to back it up.
• We have begun to print the renewal applications for Egg Licenses which will be sent out
the first of March.
• The annual egg producer visits required by USDA to verify “cage free” and “Non-GMO”
are being completed. Working with USDA to clarify documentation needed for “Non-
GMO” claims.
• The Montana Egg facility is consistently operating 4-12 hour days per week currently.
We anticipate those days to increase as egg production increases from producers
throughout the spring. Also some eggs are currently being sent to Washington for
processing.
• Reviewing plans for a small scale glass bottle filling and washing operation for fluid milk
at Kalispell Kreamery. There has not been such an operation in the State for at least 30-
40 years.
• Reviewing plans for processing sheep’s milk into yogurt. Yogurt is a Grade A product and
will require a higher degree of oversight by the Department.
• Completing the final review of construction for a new sheep dairy and small scale Grade
B processing plant for cheese to start production this spring.
• This month we will conduct a State Sanitation and Compliance Rating for one producer
group for listing on the Interstate Milk Shippers List.
• Reviewing plans to process Organic Milk shipped into the State for processing and filling.
This will require special handling and record keeping to insure complete separation from
the non-organic processing and storage.

1
Montana Department of Livestock
Board of Livestock Meeting Report
Meat and Poultry Inspection
February 21, 2018
Annual Self-assessment – Civil Rights
Montana has received its annual determination from the FSIS Civil Rights Staff (CRS)
that is based upon the self-assessment that was submitted in November of 2017. The
CRS reviewed Montana in eight areas of civil rights. Those eight areas are as follows:
1. Civil Rights Assurances – written assurances that federally assisted programs are
conducted with Title IV of the Civil Rights Act of 1964.
2. State infrastructure and Program accountability – Identify individuals or offices to
ensure accountability with civil rights laws regulations, policies and regulations.
3. Public Notification -- mandates the MPI programs include a public notification
system to inform applicants and participants and potentially eligible persons of the
policy of non-discrimination.
4. Complaints of Discrimination – assesses the complaint procedures to all complaints
alleging discrimination in state MPI programs on the basis of race, color, national
origin, age, sex, and disability.
5. Civil rights training – do states provide civil rights training to employees under civil
rights laws?
6. Disability Compliance – Makes sure that state agencies ensure equal access to
inspection programs for persons with disabilities. This includes IT resources.
7. Limited English Proficiency (LEP) – Requires MPI programs provide free language
access services to potentially eligible applicants and program participants who are
LEP
8. Compliance with the age discrimination act of 1975 – Requires federal agencies to
annually report on steps taken to enforce the Act. Including non-employment related
affirmative outreach actions of its recipients of federal assistance.
After the review, Montana has received a designation of “at least equal to.”
Meeting with Ron Eckel - FSAB
I recently met with Ron Eckel from the Federal State Audit Branch. He discussed the
upcoming audit that will take place in the May/June time frame. Mr. Eckel’s message
was that his staff will be focusing on jerky, sanitation and HACCP issues. Because staff
have been adequately trained, he stressed the importance of not having significant
findings in these areas.
I am preparing staff for the upcoming audit by assigning sections of the Code of Federal
Regulations for reading and application. In addition, notices and directives will be
assigned to staff for further reading and application.

2
As we get closer to the audit, the Federal State Audit Branch will notify the Montana
Meat and Poultry Inspection Bureau (MPIB) of which establishments have been selected
for review. Once those establishments are identified, I will send a communication to the
selected establishments to inform them of the audit. In that communication, I will be
outlining the types of issues the auditor will be looking for. In addition, I will encourage
establishments to review their plants for accurate record keeping, proper assessments of
HACCP plans, and maintaining their establishment in a sanitary condition as required by
regulation.
In preparation for the audit, Inspection Program Personnel (IPP) will be focused on jerky
issues, sanitation, and HACCP requirements. NR’s will be written for noncompliance
situations, red tags will be used to control insanitary equipment, and process
improvement plans will be developed for issues taking longer than a day or two to rectify.
If IPP have identified deficiencies in advance, they are not considered audit findings.
In the weeks prior to the audit, a team will be formed to travel to selected establishments
to review records and assess sanitation needs. This will help assure that there are no
long-standing issues within the selected plants.
The MPIB takes audits seriously – the upcoming audit is no exception. Through proper
planning and application of regulation, I anticipate this audit to be a success.
Communication with Establishments
The MPIB has increased its communication with the industry significantly over the last
few months. For example, quarterly new issuances that discuss how regulation is applied
to the industry have been shared with establishment owners in two ways.
First, IPP have been directed to discuss each notice or directive with establishment
owners when it is released. Those discussions take place during weekly meetings with
establishment personnel. Second, once a quarter, each of the applicable issuances are
summarized and IPP discuss the information with plant personnel. Other examples of
communication with the industry includes summarized reports of meetings with my
counterparts in other states and presentations to the industry association.
As stated earlier, staff have been directed to hold weekly meetings with plant
management. Staff have been further directed to document each meeting that takes place
with plant management with a record of what was discussed, who was there, questions
that were asked and other applicable information.
In addition to meetings with establishments, district supervisors now meet once per
month with inspectors to discuss meat and poultry issues. A standard base agenda is
developed by an assigned supervisor. That information is shared with other supervisors
from which their individual agendas are based. Consequently, inspectors across the
entire state will be discussing the same base set of issues. IPP then take the information
3
learned in the meetings back to their assigned establishments for review with plant
personnel. This format will help develop consistency with the information being
disseminated to establishments.
The Meat and Poultry Inspection Bureau is continually working to find ways to get
consistent, on-point regulatory information to industry members. We hope that the
industry is finding the information useful. The goal is to ensure that the industry is well
informed and understands the regulations and how they are applied to establishments.
Animal Health & Food Safety Division
Meat and Poultry Inspection Bureau
FY2017 Annual Report

1
Montana Department of Livestock Animal Health & Food Safety Division
Meat and Poultry Inspection Bureau, FY2017
Mission
Montana’s Meat and Poultry Inspection Bureau mission is to ensure that meat and poultry slaughtered, processed, and stored within the state meet all state and federal requirements for wholesome and unadulterated products. This is accomplished through product and site inspections, licensing, product labeling and laboratory testing.
According to the Center for Disease Controls E. coli O157:H7, the pathogen most commonly associated with ground beef, causes an estimated 96,000 illnesses, 3,200 hospitalizations and 31 deaths in the U.S. each year, adding up to $405 million in annual healthcare expenses; Rates for Salmonella infection have remained steady for the past 15 years; Listeria monocytogenes sickens approximately 1600 Americans per year.
Authorization
According to section two of the Federal Meat Inspection Act, “Meat and meat food products are an important source of the nation’s total supply of food. They are consumed throughout the nation and the major portion thereof moves in interstate or foreign commerce. It is essential in the public interest that the health and welfare of consumers be protected by assuring that meat and meat food products distributed to them are wholesome, not adulterated, and properly marked, labeled and packaged...”
The Montana Meat and Poultry Inspection Bureau operates in a manner similar to the other 26 states with a cooperative state meat inspection program. Montana carries out its own inspection services in a manner that is at least equal to inspection services provided by the United States Department of Agriculture (USDA), as well as utilizing the federal Public Health Information System (PHIS) a web-based data driven system that utilizes role assignments and predictive analytics to collect, consolidate and analyze establishment data to generate and assign specific inspection tasks to improve food safety.
To accomplish this, Montana has adopted both federal law and rule. Under 81-9-219, Montana Code Annotated (MCA), Montana adopts the Federal Meat Inspection Act, the Federal Poultry Inspection Act, and the Federal Humane Methods of Slaughter Act. Each of these federal acts addresses various aspects of how the Montana program operates.
Further, Administrative Rules of Montana (ARM) 32.6.712 adopts Title 9 of the Code of Federal Regulations. These rules outline how Montana is to carry out its meat and poultry inspection program. In addition, Montana Meat and Poultry Inspection utilizes other laws and rules under Title 81 of MCA and Title 32 of ARM.
Organization and Funding
The Meat and Poultry Bureau operates on an annual budget of approximately $1.7 million which consists of 50% federal funding and 50% state general fund.
2
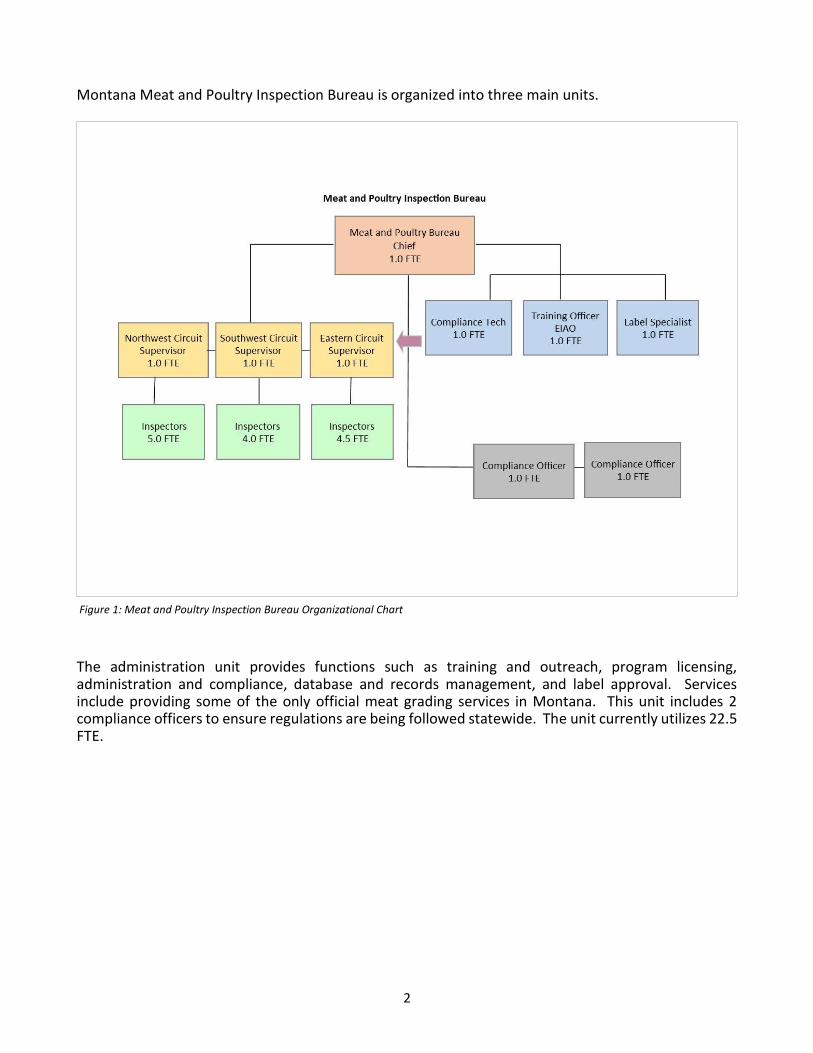
Montana Meat and Poultry Inspection Bureau is organized into three main units.
Figure 1: Meat and Poultry Inspection Bureau Organizational Chart
The administration unit provides functions such as training and outreach, program licensing, administration and compliance, database and records management, and label approval. Services include providing some of the only official meat grading services in Montana. This unit includes 2 compliance officers to ensure regulations are being followed statewide. The unit currently utilizes 22.5 FTE.

3
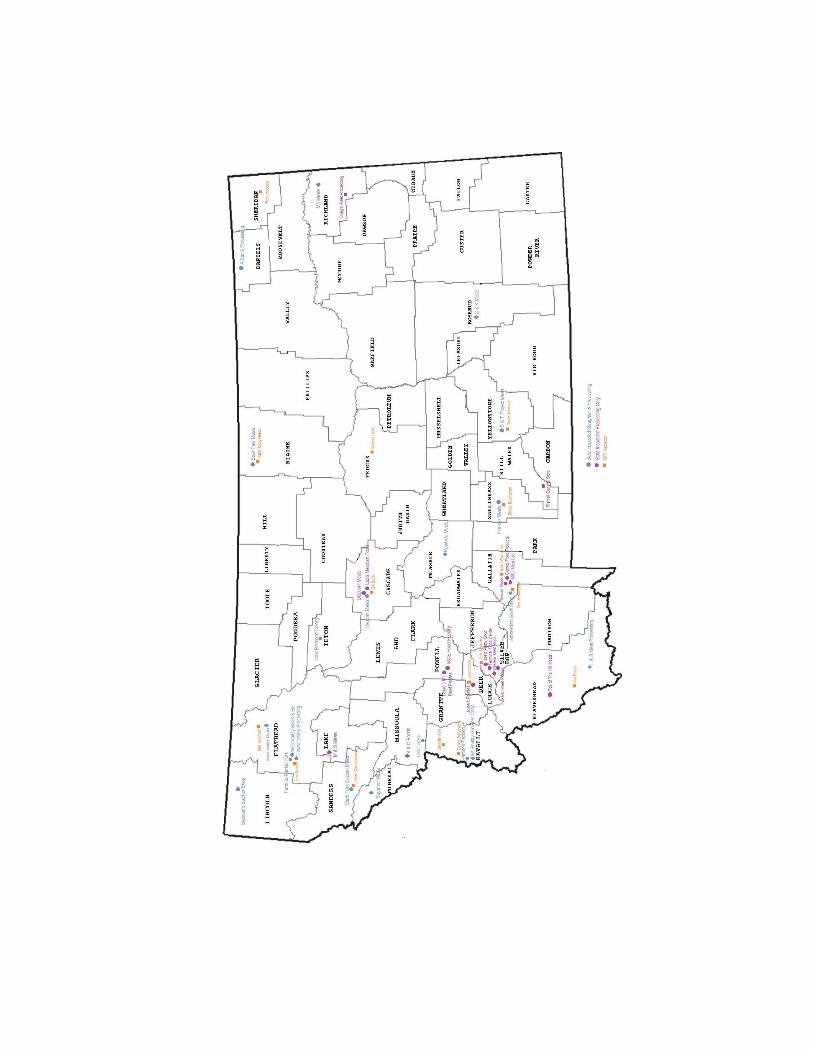
The image below represents the three supervisory circuits in Montana: Northwest, Southwest and Eastern.
Figure 2: Meat and Poultry Inspection Bureau map of supervisory districts
Because of its large geographical size, meat inspection staff members travel continually throughout the state to carry out their functions. The Bureau provides services to establishments, meeting the necessary requirements, in any location that personnel can reasonably reach in an 8-hour shift. Districts are determined by establishment and inspector locations’ rather than by city or county. Scheduling new inspection services can become difficult depending on the inspector’s current inspection schedule.
Along with the training officer the three district supervisors may also provide training to the field inspectors. Each new inspector receives approximately 280 hours of on-the-job and classroom training. This training is extensive covering all aspects of livestock slaughter, including strict humane handling requirements and identifying disease to identify hazards and critical control points in production of each product to bear the mark of state inspection. Staff must also learn general computers skills along with their role functions in the federal PHIS system.
In 2017 FSIS provided Montana staff with an additional 24 hours of regulatory training to assure staff was up to date with the ongoing regulatory changes for all aspects of slaughter and processing inspection and food safety.
Staff also received training for data security awareness and understanding limited English proficiency through USDA AgLearn online courses. These mandatory courses vary from year to year and must be completed and passed to remain with the Level II access required to gain access to the PHIS which generates the daily inspection task schedule and records the data.
See Appendix 1 for staffing details

4
Inspection Services
The inspection unit carries out day to day inspection of livestock and poultry products at officially inspected establishments. Those same inspectors also inspect all custom exempt operations and meat storage units throughout the year. As of the end of FY16 this included 40 officially inspected establishments, 121 custom exempt operations, 116 meat storage units and 20 federally inspected facilities.
An inspector must be onsite during slaughter operations. Animal carcasses and organs exhibiting questionable conditions or disease symptoms are retained for final disposition by a veterinarian under contract with the agency for their services. All slaughter operations are done under the sanitation guidelines required by USDA and establishments must adhere to strict humane handling regulations.
Inspectors also oversee the processing of meat and poultry products. Staff is trained in food safety Hazard Analysis Critical Control Points (HACCP) and record keeping. All products produced under inspection must follow a HACCP plan and staff must document hazard analysis steps, critical control points and all record keeping in the PHIS. Documenting daily duties can be extensive and time consuming. These records are available to view by supervisors and FSIS at any time.
Inspectors also check for correct labeling of products, including review of ingredients and net weights; look for any safety hazards or sanitation concerns in the production area; and conduct meetings with plant management regarding various subjects and regulations.
See Appendix 2 for FY17 inspected slaughter headcounts.
See Appendix 3 for FY17 inspected products poundage report.
Custom Exempt Slaughter & Processing Operations
Montana Meat and Poultry Inspection staff also provides inspection services to custom exempt facilities. These facilities may only slaughter and process product for use by the owner, members of his household, and non-paying guests. Products from custom operations may not be resold and must be marked “not for sale”. Like officially inspected establishments custom exempt facilities meet and follow all sanitation guidelines. Although not subject to animal by animal inspection, custom exempt facility inspections are conducted no less than twice per year.
See Appendix 4 for slaughter headcounts at licensed custom exempt operations. The charted month only reflects that month in which totals were collected during onsite review.
Microbiological Testing
Montana’s inspection program conducts product sampling for detecting pathogens in meat and poultry products. Inspection staff must follow strict guidelines for sampling frequencies for each product produced.
Montana currently works with two laboratories to test for a variety of pathogens such as Salmonella, E.coli O157:H7, all non-O157 shiga toxin producing E.coli (STECS), and Listeria Monocytogenes. The

5
Bureau also works with Montana State University Animal Science laboratory for water activity readings. Inspection staff conduct residue sampling for both the National Residue Program and local kidney swab testing (KIS) for residue testing of show animals or any animal that may be suspected of recent injection. There are also testing requirements for fat content and moisture protein levels in certain products.
In any twelve-month period meat and poultry inspectors will collect approximately 220 raw beef samples and 140 ready-to-eat product samples for testing. The office staff keeps records of when and where the samples were taken and monitors the results should any further actions or further testing be required. Montana’s sampling program is a critical component for assuring that products produced under inspection are safe for consumers.
Compliance
Montana Meat and Poultry Inspection has two fulltime compliance investigators whose responsibility is to check that retail establishments are meeting the new requirement of keeping raw ground beef grinding logs and conduct meat and poultry related investigations. They have attended the FSIS compliance training course. They travel statewide to assure local meat supply is unadulterated and labeled properly. They work in unison with the USDA compliance officer based out of the Port of Sweet Grass.
Food Safety Assessments
In accordance with requirements of meeting the “equal to” status of USDA FSIS Montana must have an Enforcement Investigations and Analysis Officer (EIAO). An EIAO must have completed the USDA FSIS intensive four-week classroom training session. This position is critical in assuring that any business can and will meet the requirements to operate under a Grant of Inspection.
The EIAO must conduct comprehensive Food Safety Assessments (FSAs) at all establishments prior to, and during operations under a Grant of Inspection. During an assessment, the EIAO must consider all food safety aspects that relate to the plant and its products, the nature and source of all materials received, the establishment’s processes, and the environment of the plant. A primary focus is on the design and validity of the hazard analysis, HACCP plan, Sanitation Standard Operating Procedure (SSOP), pre-requisite programs, testing programs, written procedures and any other procedure that may be part of a food safety system.
Assessments are entered into the PHIS system as a permanent record for each establishment. Additional FSAs may also be required after certain situations like a product testing positive for E.coli, a repeated failure in sanitation requirements, humane handling violation, etc.
Office Administration
In addition to inspection and compliance duties the Meat and Poultry Inspection Bureau assists local producers with labeling issues. Proper labeling contains important consumer information such as product identification, net weights, ingredients, allergens, and the state mark of inspection and must be approved by the bureau’s labeling specialist. The label specialist will visit state inspected
6
establishments annually and audit labels to assure products are being marketed to consumers with correct information.
Program staff are required to record inspection activities on the federal PHIS system. Staff must obtain and maintain clearance to this federal system which is utilized throughout the U.S. The office compliance tech is responsible for ordering and maintaining the FSIS issued laptops as well as assuring each staff member obtains USDA clearance. This position also creates and maintains assignments of establishments and appropriate tasks in the system; creates and must maintain the state’s districting and contact information in PHIS; enter each establishment’s data upon the issuance of their Grant of Inspection; and keep current for any updates or changes at an establishment.
Office staff issues licenses and renewals annually using the LIVAPPS data system. All slaughter records and meat and poultry products poundage are also entered into this system and compiled for quarterly statistical reporting.
USDA FSIS requires a fee be charged for any overtime, holiday or weekend inspection services as well as inspection provided for a species non-amenable to the Federal Meat Inspection Act (i.e. Bison). Office staff invoices establishments directly for these charges. Fees are tracked and reported as required.
7
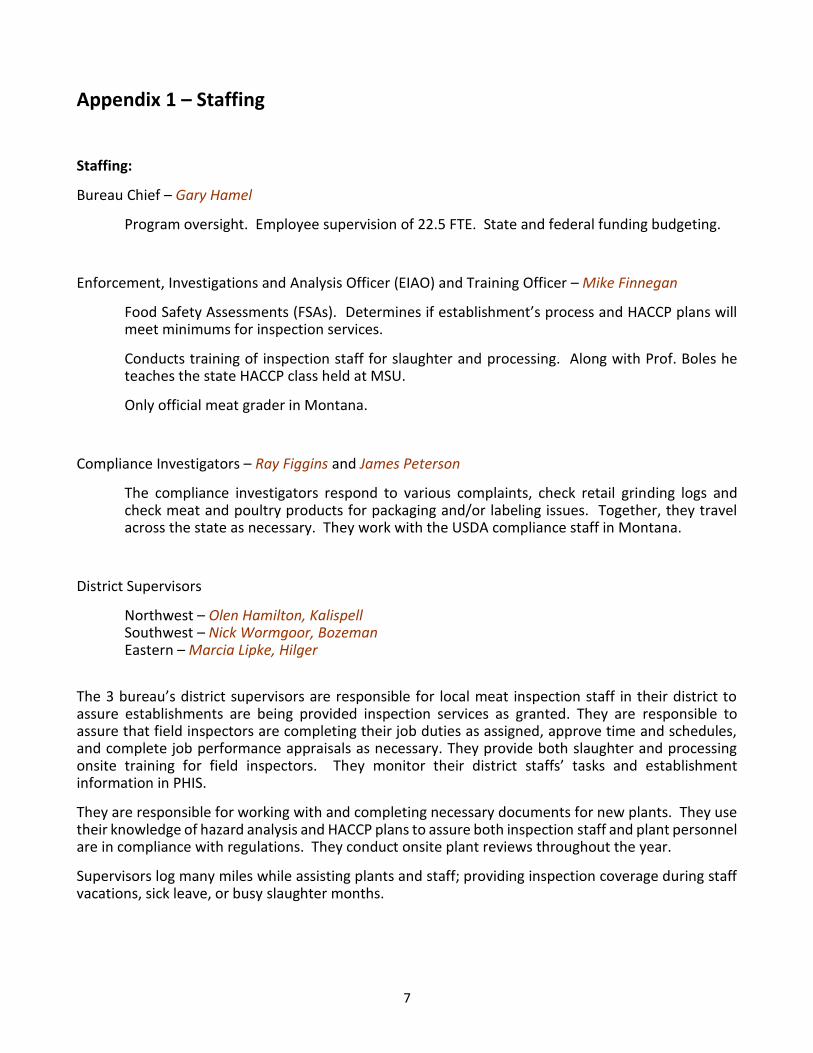
Appendix 1 – Staffing
Staffing:
Bureau Chief – Gary Hamel
Program oversight. Employee supervision of 22.5 FTE. State and federal funding budgeting.
Enforcement, Investigations and Analysis Officer (EIAO) and Training Officer – Mike Finnegan
Food Safety Assessments (FSAs). Determines if establishment’s process and HACCP plans will meet minimums for inspection services.
Conducts training of inspection staff for slaughter and processing. Along with Prof. Boles he teaches the state HACCP class held at MSU.
Only official meat grader in Montana.
Compliance Investigators – Ray Figgins and James Peterson
The compliance investigators respond to various complaints, check retail grinding logs and check meat and poultry products for packaging and/or labeling issues. Together, they travel across the state as necessary. They work with the USDA compliance staff in Montana.
District Supervisors
Northwest – Olen Hamilton, Kalispell Southwest – Nick Wormgoor, Bozeman Eastern – Marcia Lipke, Hilger
The 3 bureau’s district supervisors are responsible for local meat inspection staff in their district to assure establishments are being provided inspection services as granted. They are responsible to assure that field inspectors are completing their job duties as assigned, approve time and schedules, and complete job performance appraisals as necessary. They provide both slaughter and processing onsite training for field inspectors. They monitor their district staffs’ tasks and establishment information in PHIS.
They are responsible for working with and completing necessary documents for new plants. They use their knowledge of hazard analysis and HACCP plans to assure both inspection staff and plant personnel are in compliance with regulations. They conduct onsite plant reviews throughout the year.
Supervisors log many miles while assisting plants and staff; providing inspection coverage during staff vacations, sick leave, or busy slaughter months.
8
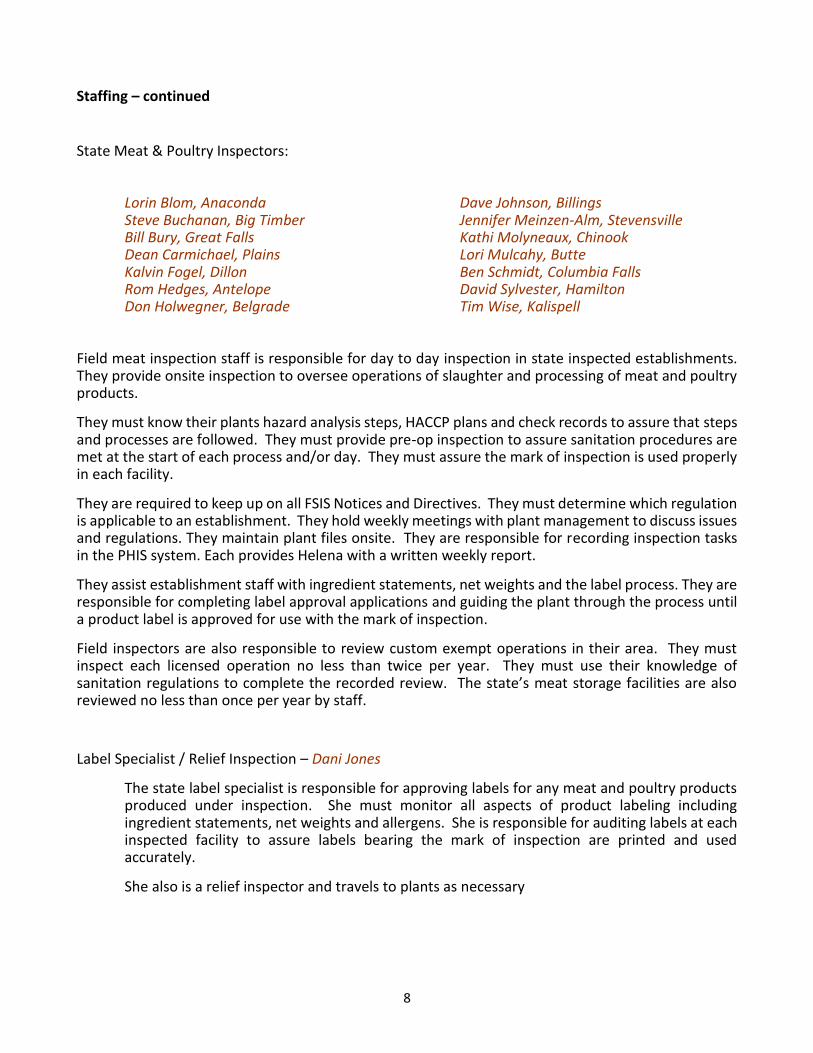
Staffing – continued
State Meat & Poultry Inspectors:
Lorin Blom, Anaconda Dave Johnson, Billings Steve Buchanan, Big Timber Jennifer Meinzen-Alm, Stevensville Bill Bury, Great Falls Kathi Molyneaux, Chinook Dean Carmichael, Plains Lori Mulcahy, Butte Kalvin Fogel, Dillon Ben Schmidt, Columbia Falls Rom Hedges, Antelope David Sylvester, Hamilton Don Holwegner, Belgrade Tim Wise, Kalispell Field meat inspection staff is responsible for day to day inspection in state inspected establishments. They provide onsite inspection to oversee operations of slaughter and processing of meat and poultry products.
They must know their plants hazard analysis steps, HACCP plans and check records to assure that steps and processes are followed. They must provide pre-op inspection to assure sanitation procedures are met at the start of each process and/or day. They must assure the mark of inspection is used properly in each facility.
They are required to keep up on all FSIS Notices and Directives. They must determine which regulation is applicable to an establishment. They hold weekly meetings with plant management to discuss issues and regulations. They maintain plant files onsite. They are responsible for recording inspection tasks in the PHIS system. Each provides Helena with a written weekly report.
They assist establishment staff with ingredient statements, net weights and the label process. They are responsible for completing label approval applications and guiding the plant through the process until a product label is approved for use with the mark of inspection.
Field inspectors are also responsible to review custom exempt operations in their area. They must inspect each licensed operation no less than twice per year. They must use their knowledge of sanitation regulations to complete the recorded review. The state’s meat storage facilities are also reviewed no less than once per year by staff.
Label Specialist / Relief Inspection – Dani Jones
The state label specialist is responsible for approving labels for any meat and poultry products produced under inspection. She must monitor all aspects of product labeling including ingredient statements, net weights and allergens. She is responsible for auditing labels at each inspected facility to assure labels bearing the mark of inspection are printed and used accurately.
She also is a relief inspector and travels to plants as necessary

9
Compliance Tech – Bonnie Marceau
State sampling program oversight; directs all sampling in accordance with FSIS projects and frequencies. Directs staff when to takes samples and documents the results for FSIS reporting requirements.
PHIS: Trained and fulfills Grant Curator, Role Management Analyst, and User Administrator roles in this role based inspection task recording system.
Serves as the FSIS State Coordinator to assure inspections staff can obtain the level of clearance necessary for use of government issued computers, LincPass ID cards, AgLearn system, and PHIS system. She orders and tracks all FSIS issued equipment and monitors FSIS service desks tickets.
As administrative assistant, she processes all licenses and renewals for meat and poultry operations in Montana, maintains plant’s official files; compiles all FSIS required statistical information for quarterly/annual reports.
10
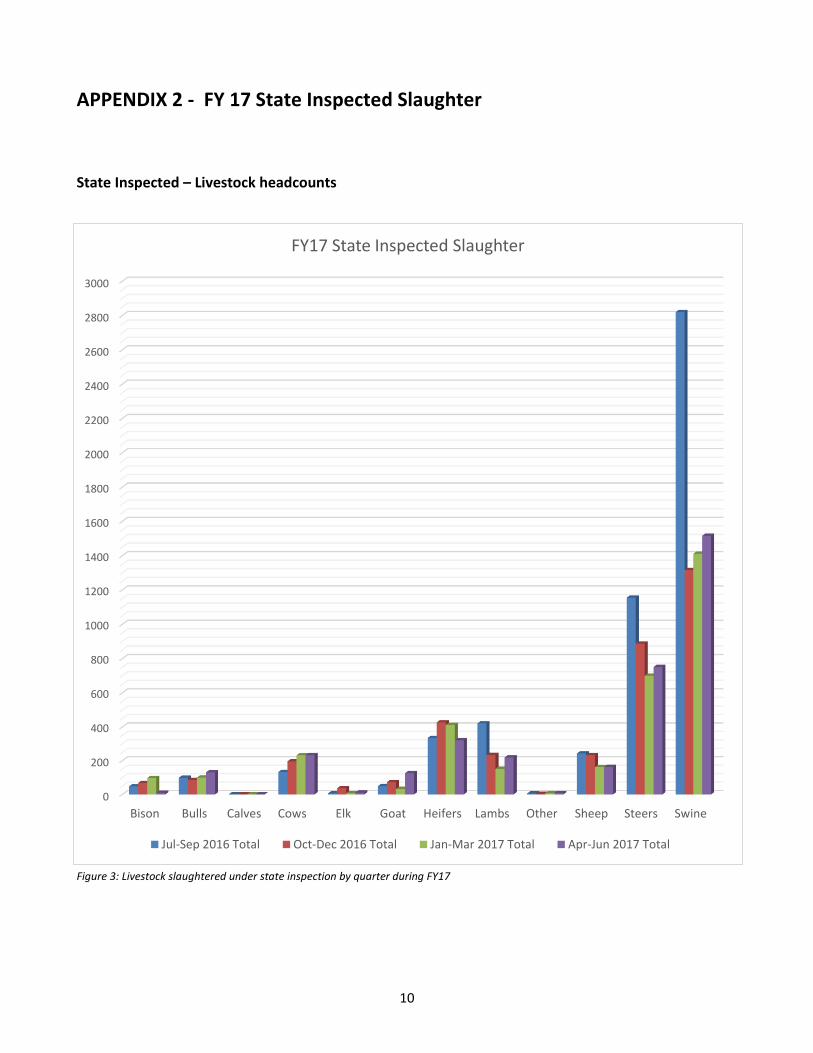
APPENDIX 2 - FY 17 State Inspected Slaughter
State Inspected – Livestock headcounts
Figure 3: Livestock slaughtered under state inspection by quarter during FY17
0
200
400
600
800
1000
1200
1400
1600
1800
2000
2200
2400
2600
2800
3000
Bison Bulls Calves Cows Elk Goat Heifers Lambs Other Sheep Steers Swine
FY17 State Inspected Slaughter
Jul-Sep 2016 Total Oct-Dec 2016 Total Jan-Mar 2017 Total Apr-Jun 2017 Total

11
State Inspected – Poultry headcounts
Figure 4: Poultry slaughtered under state inspection by quarter during FY17
0
500
1000
1500
2000
2500
3000
3500
4000
4500
5000
5500
6000
6500
7000
7500
Emu Rabbits Chicken Duck Goose Turkey
FY17 State Inspected Poultry Slaughter
Jul-Sep 2016 Total Oct-Dec 2016 Total Jan-Mar 2017Total Apr-Jun 2017 Total

12
Appendix 3 – Inspected Product Poundage Produced
Products produced under inspection services are tracked by the HACCP categories outlined in CFR 417.2. They include:
▪ Raw Ground – raw product that is put through a grinding process; like ground beef and ground pork ▪ Raw Not Ground – product that is not ground and intact; like carcass halves & quarters, cuts (bone-in
or boned), primals & sub-primals (steaks, chops) ▪ Not Heat Treated Shelf Stable – product is acidified/fermented processed without heat/cooking ▪ Heat Treated Shelf Stable – product is processed with heat and/or drying until shelf stable, like jerky
and snack sticks ▪ Fully Cooked Not Shelf Stable – products that are brought up to required cooking temperatures but not
shelf stable, like some hams and sausages ▪ Heat Treated Not Fully Cooked Not Shelf Stable – products are processed with heat but not fully
cooked and therefore not shelf stable, like bacon, sausages, or even some pasties and burritos.
MEAT Jul-Sep 2016
Oct- Dec 2016
Jan-Mar 2017
Apr-Jun 2017
03B Raw Ground 422387 420177 352659 371704
03C Raw Not Ground 695224 531958 516360 475598
03E Not Heat Treated Shelf Stable 0 0 0 54
03F Heat Treated Shelf Stable 4240 5198 6409 4224
03G Not Fully Cooked Not Shelf Stable 152888 136774 141394 136757
03H Heat Treated Not Fully Cooked NSS 56717 49278 41905 42449
POULTRY Jul-Sep 2016
Oct- Dec 2016
Jan-Mar 2017
Apr-Jun 2017
03B Raw Ground 0 0 0 0
03C Raw Not Ground 39616 71133 26006 42044
03E Not Heat Treated Shelf Stable 0 0 0 0
03F Heat Treated Shelf Stable 0 0 0 0
03G Not Fully Cooked Not Shelf Stable 18990 21539 16863 11173
03H Heat Treated Not Fully Cooked NSS 200 261 278 115 Table 1: State inspected meat and poultry products produced by HACCP category each quarter in FY17

13
FY17 Inspected Poundage continued
Figure 5: Quarterly poundage totals of meat and poultry products produced under state inspection by HACCP category during FY17.
0
25000
50000
75000
100000
125000
150000
175000
200000
225000
250000
275000
300000
325000
350000
375000
400000
425000
450000
475000
500000
525000
550000
575000
600000
625000
650000
675000
700000
Meat Poultry Meat Poultry Meat Poultry Meat Poulty
1st Qtr Jul-Sep 2016 2nd Qtr Oct- Dec 2016 3rd Qtr Jan-Mar 2017 4th Qtr Apr-Jun 2017
FY17 Total Inspected Product Poundage by Quarter
03B Raw Ground 03C Raw Not Ground
03E Not Heat Treated Shelf Stable 03F Heat Treated Shelf Stable
03G Not Fully Cooked Not Shelf Stable 03H Heat Treated Not Fully Cooked NSS

14
APPENDIX 4 – FY17 Custom Exempt Slaughter
Custom Exempt facilities are only reviewed twice per year therefore monthly counts only reflect the month the plant headcounts were recorded by agency inspectors.
Figure 6: Livestock slaughtered custom exempt by quarter during FY17
0
200
400
600
800
1000
1200
1400
1600
1800
2000
2200
2400
2600
2800
Bison Bulls Cows Elk Goat Heifers Lambs Other Sheep Steers Swine
FY17 Custom Exempt Livestock Slaughter
Jul-Sep 2016 Oct-Dec 2106 Jan-Mar 2017 Apr-Jun 2017

15
Custom Exempt Slaughter – continued
Figure 7: Poultry slaughtered custom exempt by quarter during FY17
0
2000
4000
6000
8000
10000
12000
14000
16000
18000
20000
22000
24000
26000
28000
30000
32000
34000
36000
Chicken Ducks Geese Turkey
FY17 Custom Exempt Poultry Slaughter
2016 Jul-Sep 2016 2016 Oct-Dec 2106 2017 Jan-Mar 2017 2017 Apr-Jun 2017

Board of Livestock Meeting Agenda Request Form
From: Tahnee Szymanski
Division/Program: Animal Health Bureau
Meeting Date: February 21, 2018
Agenda Item: Request for Out of State Travel to Bovine Tuberculosis Eradication Training Background Info: USDA is offering a three-day Bovine Tuberculosis Eradication Training Program in Manhattan, KS March 20-22,2018. Dr. Szymanski has been approved by the USDA to attend this course. Travel expenses will be covered out of the USDA Umbrella Cooperative Agreement. Cost:
• Flight: $1200
• Hotel: $120/night for 4 nights= $480
• Per Diem:
o Monday $46
o Tuesday $46
o Wednesday $46
o Thursday $46
o Friday $46
Total including registration: $1910
Car Rental (if needed): $190 for 5 days Recommendation: Board Approval Time needed: 5 minutes Attachments: Yes Board vote required? Yes
Time needed: 10 minutes Attachments: Yes Board vote required: No
Time needed: 15 minutes Attachments: Yes Board vote required? No Agenda Item: Background Info: Recommendation: Time needed: Attachments: Yes No Board vote required Yes No Agenda Item: Background Info: Recommendation: Time needed: Attachments: Yes No Board vote required: Yes No
Agenda Item:


Bovine Tuberculosis Eradication Program Training
March 20-22, 2018
Agenda
Manhattan, Kansas Page 1 of 3
Tuesday, March 20, 2018
7:30 a.m. Registration All
8:00 Greetings, Logistics, & Course Objectives
Rob Dickens/Dana Nelson
8:15 NBAF Progress Update Ron Trewyn
8:30 History of the U.S. Bovine Tuberculosis Eradication
Program
Dana Nelson
9:30 Program Epidemiology Mark Schoenbaum
10:15 National Tuberculosis Eradication Program Update Mark Camacho
11:15 Mycobacterium bovis: Immunology Tyler Thacker
12:15 p.m. Lunch
1:15 Mycobacterium bovis: Bacteriology and Introduction
to Whole Genomic Sequencing
Suelee Robbe-Austerman
2:00 Mycobacterium bovis: Genomic Sequencing of
Isolates, Phylogeny, and Interpretation
Suelee Robbe-Austerman
2:45 Harmonizing bovine TB genotyping between HHS
(CDC) and USDA (NVSL
Suelee Robbe-Austerman
3:00 Mycobacterium bovis in Cervidae
Byron Schick
3:45 bTB Surveillance in 2017 and Future Opportunities
Byron Schick
4:30 Group Discussion and Class Photo All
5:00 p.m. Adjourn

Bovine Tuberculosis Eradication Program Training
March 20-22, 2018
Agenda
Manhattan, Kansas Page 2 of 3
Wednesday, March 21, 2018
8:00 a.m. Bovine Tuberculosis Research Tyler Thacker
9:00 State Animal Health Official Perspective: Present
Issues and Future Concerns
Robert Meyer, Justin Smith
10:15 National and International One Health Perspective -
Human Tuberculosis and Mycobacteria bovis
Andrea Mikolon
11:15 Mycobacteria bovis and Human Health from a State
Perspective
Andrea Mikolon
12:00 p.m. Lunch
1:00
Mycobacterium bovis in California and Mexico:
International One Health Perspective
Andrea Mikolon
1:45 Importation of Mexican and Canadian Cattle: Risks
and Regulations
Dr. Rick Tanner/Dr. John Hunt
2:30 Break
2:45 Management of Affected Herds
Mark Schoenbaum
3:30 USDA Compensation Process Eric Patt/Brenda Reddell
4:00 Recent TB Trace Investigations Involving Detection
of bTB Affected Herds, and the Tracing of Exposed
Cattle
SD – Lynn Tesar
NE – Gary Stevens
KS – Brad Christensen
5:00 p.m. Adjourn

Bovine Tuberculosis Eradication Program Training
March 20-22, 2018
Agenda
Manhattan, Kansas Page 3 of 3
Thursday, March 22, 2018
8:00 a.m. Bovine Tuberculosis in Wildlife and Feral Swine Tom Gidlewski
8:15
Tuberculosis Prevention and Management in Zoos
Douglas L Armstrong
9:15 Review and Update of bTB and Molokai, HI Tom Gidlewski
10:15
Overview of USDA Databases and Applications
Cody Garten (EMRS)
Linda Trapp (USA Herds)
Barbara Cockerill (MIMS)
11:15 Characteristics and Application of TB Tests Mark Schoenbaum/Mark
Camacho
12:15 p.m. Lunch
1:15 Mycobacterium bovis: Pathology and Histology Aaron Lehmkuhl
2:15 Post Mortem Diagnostics/Case Study
Mark Schoenbaum
3:15 FSIS perspective and regulatory activities Evan Sumner
4:30 Evaluation All
5:00 p.m.
Adjourn


Board of Livestock Meeting Agenda Request Form
From: Evan Waters
Division/Program: Centralized Services
Meeting Date: 02/21/2018
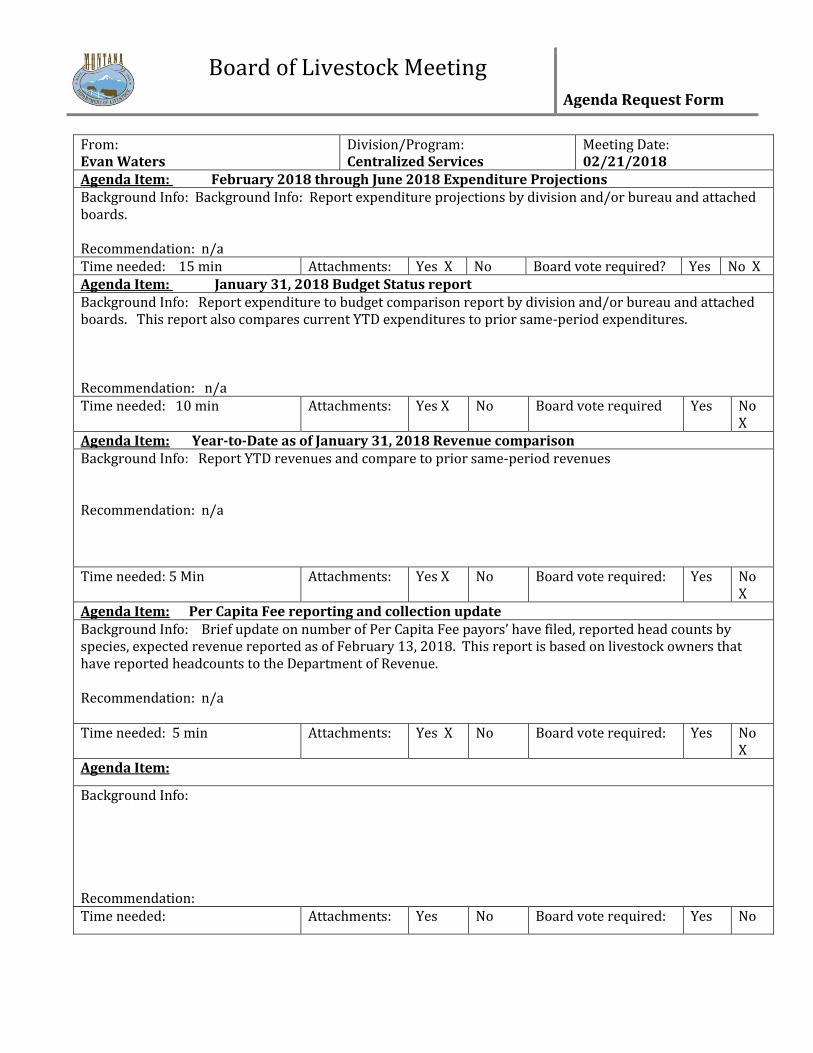
Agenda Item: February 2018 through June 2018 Expenditure Projections Background Info: Background Info: Report expenditure projections by division and/or bureau and attached boards. Recommendation: n/a Time needed: 15 min Attachments: Yes X No Board vote required? Yes No X Agenda Item: January 31, 2018 Budget Status report Background Info: Report expenditure to budget comparison report by division and/or bureau and attached boards. This report also compares current YTD expenditures to prior same-period expenditures. Recommendation: n/a Time needed: 10 min Attachments: Yes X No Board vote required Yes No
X Agenda Item: Year-to-Date as of January 31, 2018 Revenue comparison Background Info: Report YTD revenues and compare to prior same-period revenues Recommendation: n/a
Time needed: 5 Min Attachments: Yes X No Board vote required: Yes No X
Agenda Item: Per Capita Fee reporting and collection update Background Info: Brief update on number of Per Capita Fee payors’ have filed, reported head counts by species, expected revenue reported as of February 13, 2018. This report is based on livestock owners that have reported headcounts to the Department of Revenue. Recommendation: n/a Time needed: 5 min Attachments: Yes X No Board vote required: Yes No
X Agenda Item:
Background Info: Recommendation: Time needed: Attachments: Yes No Board vote required: Yes No

DIVISION: DEPARTMENT OF LIVESTOCK
PROGRAM: DEPARTMENT OF LIVESTOCK
Year‐to‐Date
Actual
Expenses
January
FY 2018
BUDGETED FTE 135.62
HOUSE BILL 2 AND PAYPLAN APPROPRIATED EXPENDITURES
61000 PERSONAL SERVICES
61100 SALARIES 3,224,204$ 2,857,810$ 6,082,014$ 5,618,407$ (463,607)$
61200 OVERTIME 100,975 11,376 112,351 91,034 (21,317)
61300 OTHER/PER DIEM 2,750 2,350 5,100 6,700 1,600
61400 BENEFITS 1,401,470 1,255,952 2,657,422 2,524,228 (133,194)
TOTAL PERSONAL SERVICES 4,729,399 4,127,488 8,856,887 8,240,369 (616,518)
62000 OPERATIONS
62100 CONTRACT 956,868 462,441 1,419,309 1,563,944 144,635
62200 SUPPLY 365,565 355,366 720,931 781,106 60,175
62300 COMMUNICATION 99,180 111,974 211,154 200,529 (10,625)
62400 TRAVEL 71,663 92,515 164,178 172,606 8,428
62500 RENT 273,491 223,235 496,726 516,288 19,562
62600 UTILITIES 35,572 25,562 61,134 59,679 (1,455)
62700 REPAIR & MAINT 111,663 71,725 183,388 180,975 (2,413)
62800 OTHER EXPENSES 281,084 244,672 525,756 574,118 48,362
TOTAL OPERATIONS 2,195,086 1,587,490 3,782,576 4,049,245 266,669
63000 EQUIPMENT
63100 EQUIPMENT 16,100 ‐ 16,100 15,000 (1,100)
TOTAL EQUIPMENT 16,100 ‐ 16,100 15,000 (1,100)
68000 TRANSFERS
68000 TRANSFERS 97,391 241,127 338,518 335,326 (3,192)
TOTAL TRANSFERS 97,391 241,127 338,518 335,326 (3,192)
69000 CAPITAL LEASES
69000 LEASES 8,341 6,917 15,258 13,836 (1,422)
TOTAL LEASES 8,341 6,917 15,258 13,836 (1,422)
TOTAL EXPENDITURES 7,046,317$ 5,963,022$ 13,009,339$ 12,653,776$ (355,563)$
BUDGETED FUNDS
01100 GENDERAL FUND 1,630,145$ 1,108,625$ 2,738,770$ 2,365,861$ (372,909)$
02262 SHIELDED EGG GRADING FEES 70,240 84,008 154,248 344,173 189,925
02425 BRAND INSPECTION FEES 2,103,152 879,995 2,983,147 2,983,147 ‐
02426 PER CAPITA FEE 1,687,989 1,859,809 3,547,798 3,211,373 (336,425)
02427 ANIMAL HEALTH ‐ 5,718 5,718 5,718 ‐
02701 MILK INSPECTION FEES 157,466 153,686 311,152 348,619 37,467
02817 MILK CONTROL 159,119 197,688 356,807 388,593 31,786
03209 MEAT & POULTRY INSPECTION 440,761 478,508 919,269 919,269 ‐
03032‐1 NATIONAL LAB NETWORK ‐ 30,585 30,585 30,585 ‐
03032‐2 SHELL EGG FEDERAL INSPECTION FEES 9,954 8,256 18,210 21,000 2,790
03427 FEDERAL UMBRELLA PROGRAM 174,225 587,829 762,054 853,857 91,803
06026 DIAGNOSTIC LABORATORY FEES 613,266 568,315 1,181,581 1,181,581 ‐
TOTAL BUDGETED FUNDS 7,046,317$ 5,963,022$ 13,009,339$ 12,653,776$ (355,563)$
Projected
Expenses
January to June
2018
FY 2018
Projected Year
End Expense
Totals
FY 2018
Budget
Projected
Budget
Excess/
(Deficit)
MONTANA DEPARTMENT OF LIVESTOCK
PROJECTED EXPENSE BUDGET COMPARISON REPORT
JANUARY 31, 2018
Predator control is statutorily appropriated and is not included in this projection. It is paid from Per Capita Fees in the amount of
$350,000.
The personal services projections include SB 418 pay plan increase.
1

DIVISION: CENTRALIZED SERVICES
PROGRAM: CENTRAL SERVICES AND BOARD OF LIVESTOCK and BOARD OF LIVESTOCK
Year‐to‐Date
Actual Expenses
JanuaryFY 2018
BUDGETED FTE 12.00
HOUSE BILL 2 AND PAYPLAN APPROPRIATED EXPENDITURES
61000 PERSONAL SERVICES
61100 SALARIES 351,018$ 319,294$ 670,312$ 603,668$ (66,644)$
61300 OTHER/PER DIEM 1,200 1,350 2,550 2,250 (300)
61400 BENEFITS 128,347 119,664 248,011 218,203 (29,808)
TOTAL PERSONAL SERVICES 480,565 440,308 920,873 824,121 (96,752)
62000 OPERATIONS
62100 CONTRACT 139,440 20,501 159,941 233,975 74,034
62200 SUPPLY 61,640 25,374 87,014 120,753 33,739
62300 COMMUNICATION 30,362 12,529 42,891 49,849 6,958
62400 TRAVEL 6,776 5,471 12,247 18,026 5,779
62500 RENT 85,190 57,075 142,265 142,265 ‐
62700 REPAIR & MAINT 433 665 1,098 1,649 551
62800 OTHER EXPENSES 6,901 7,227 14,128 18,424 4,296
TOTAL OPERATIONS 330,742 128,842 459,584 584,941 125,357
68000 TRANSFERS
68000 TRANSFERS 97,391 1,127 98,518 95,326 (3,192)
TOTAL TRANSFERS 97,391 1,127 98,518 95,326 (3,192)
TOTAL EXPENDITURES 908,698$ 570,277$ 1,478,975$ 1,504,388$ 25,413$
BUDGETED FUNDS
02426 PER CAPITA 908,698$ 570,277$ 1,478,975$ 1,504,388$ 25,413$
TOTAL BUDGETED FUNDS 908,698$ 570,277$ 1,478,975$ 1,504,388$ 25,413$
MONTANA DEPARTMENT OF LIVESTOCK
EXPENSE PROJECTION TO YEAR‐END ACTUAL EXPENSE COMPARISON REPORT
JANUARY 31, 2018
Projected
Expenses
January to June
2018
FY 2018
Projected Year
End Expense
Totals
FY 2018
Budget
Projected
Budget
Excess/
(Deficit)
In transfers, the total expenditure is expected to be the 2% collection fee to Department of Revenue (DOR) for the collection
on the Per Capita Fee (PCF). The projected expense is higher than the budgeted amount because DOR has collected more
PCF than was collected in the department's base budget year, FY 2014.
Due to the lag in timing that expenses are able to be posted to the accounting system, projected expenses are calculated
using six months to the end of the year instead of the anticipated seven months.
Projected expenses are calculated using prior years actual expenses by month, then adjusting for known non‐consistent
items. Non‐consistent expenses include out of state travel or known employees ready to retire. The department has not
calculated potential retirements in the projections at this time.
The department replaces computers every five years. The replacement of computers is done using a rotating basis so that
the department will replace appoximately 20% of the computers annually. IT is in the process of ordering the replacement
computers. The projected cost of the replacement computers is $26,000 and is included in the projections above.
2

DIVISION: CENTRALIZED SERVICES
PROGRAM: LIVESTOCK LOSS BOARD
Year‐to‐Date
Actual
Expenses
JanuaryFY 2018
BUDGETED FTE 1.00
HOUSE BILL 2 AND PAYPLAN APPROPRIATED EXPENDITURES
61000 PERSONAL SERVICES
61100 SALARIES 32,064$ 28,747$ 60,811$ 52,303$ (8,508)$
61300 OTHER/PER DIEM 350 400 750 600 (150)
61400 BENEFITS 12,068 11,526 23,594 20,970 (2,624)
TOTAL PERSONAL SERVICES 44,482 40,673 85,155 73,873 (11,282)
62000 OPERATIONS
62100 CONTRACT 545 555 1,100 669 (431)
62200 SUPPLY 204 1,013 1,217 775 (442)
62300 COMMUNICATION 819 1,638 2,457 1,484 (973)
62400 TRAVEL 2,030 347 2,377 1,525 (852)
62500 RENT 3,127 2,234 5,361 3,252 (2,109)
62700 REPAIR & MAINT 1,060 39 1,099 644 (455)
62800 OTHER EXPENSES 505 150 655 439 (216)
TOTAL OPERATIONS 8,290 5,976 14,266 8,788 (5,478)
TOTAL EXPENDITURES 52,772$ 46,649$ 99,421$ 82,661$ (16,760)$
BUDGETED FUNDS
01100 GENERAL FUND 52,772$ 46,649$ 99,421$ 82,661$ (16,760)$
TOTAL BUDGETED FUNDS 52,772$ 46,649$ 99,421$ 82,661$ (16,760)$
MONTANA DEPARTMENT OF LIVESTOCK
EXPENSE PROJECTION TO YEAR‐END ACTUAL EXPENSE COMPARISON REPORT
JANUARY 31, 2018
Projected expenses are calculated using prior years actual expenses by month, then adjusting for known non‐consistent
items. Non‐consistent expenses include out of state travel or known employees ready to retire. The department has not
calculated potential retirements in the projections at this time.
FY 2018
Budget
Projected
Budget
Excess/
(Deficit)
The standard budget shown in this table has been adjusted for the Governor's 10% General Fund Reductions enacted
during the 2017 special session persuant to MCA 17‐7‐140. The total reduction for the Livestock Loss Board was $9,185.
Due to the lag in timing that expenses are able to be posted to the accounting system, projected expenses are calculated
using six months to the end of the year instead of the anticipated seven months.
Projected
Expenses
January to June
2018
FY 2018
Projected Year
End Expense
Totals
3

DIVISION: CENTRALIZED SERVICES
PROGRAM: MILK CONTROL BUREAU
Year‐to‐Date
Actual Expenses
JanuaryFY 2018
BUDGETED FTE 3.00
HOUSE BILL 2 AND PAYPLAN APPROPRIATED EXPENDITURES
61000 PERSONAL SERVICES
61100 SALARIES 91,287$ 67,433$ 158,720$ 167,205$ 8,485$
61300 OTHER/PER DIEM 1,200 600 1,800 2,350 550
61400 BENEFITS 34,939 33,621 68,560 75,800 7,240
TOTAL PERSONAL SERVICES 127,426 101,654 229,080 245,355 16,275
62000 OPERATIONS
62100 CONTRACT 14,188 86,574 100,762 113,675 12,913
62200 SUPPLY 818 1,288 2,106 3,049 943
62300 COMMUNICATION 797 1,866 2,663 3,042 379
62400 TRAVEL 5,322 3,000 8,322 11,115 2,793
62500 RENT 5,583 3,034 8,617 8,542 (75)
62700 REPAIR & MAINT 187 228 415 313 (102)
62800 OTHER EXPENSES 4,798 44 4,842 3,502 (1,340)
TOTAL OPERATIONS 31,693 96,034 127,727 143,238 15,511
TOTAL EXPENDITURES 159,119$ 197,688$ 356,807$ 388,593$ 31,786$
BUDGETED FUNDS
02817 MILK CONTROL 159,119$ 197,688$ 356,807$ 388,593$ 31,786$
TOTAL BUDGETED FUNDS 159,119$ 197,688$ 356,807$ 388,593$ 31,786$
Projected
Budget
Excess/
(Deficit)
MONTANA DEPARTMENT OF LIVESTOCK
EXPENSE PROJECTION TO YEAR‐END ACTUAL EXPENSE COMPARISON REPORT
JANUARY 31, 2018
Projected
Expenses
January to June
2018
FY 2018
Projected Year
End Expense
Totals
FY 2018
Budget
Due to the lag in timing that expenses are able to be posted to the accounting system, projected expenses are calculated
using six months to the end of the year instead of the anticipated seven months.
Projected expenses are calculated using prior years actual expenses by month, then adjusting for known non‐consistent
items. Non‐consistent expenses include out of state travel or known employees ready to retire. The department has not
calculated potential retirements in the projections at this time.
4

DIVISION: ANIMAL HEALTH DIVISION ‐ STATE VETERINARIAN
PROGRAM: STATE VETERINARIAN IMPORT OFFICE
Year‐to‐Date
Actual
Expenses
JanuaryFY 2018
BUDGETED FTE 8.50
HOUSE BILL 2 AND PAYPLAN APPROPRIATED EXPENDITURES
61000 PERSONAL SERVICES
61100 SALARIES 231,894$ 221,072$ 452,966$ 478,309$ 25,343$
61400 BENEFITS 84,007 97,371 181,378 185,861 4,483
TOTAL PERSONAL SERVICES 315,901 318,443 634,344 664,170 29,826
62000 OPERATIONS
62100 CONTRACT 4,521 13,498 18,019 16,881 (1,138)
62200 SUPPLY 7,250 8,328 15,578 9,355 (6,223)
62300 COMMUNICATION 14,338 19,335 33,673 21,914 (11,759)
62400 TRAVEL (1,555) 10,818 9,263 4,592 (4,671)
62500 RENT 5,283 8,225 13,508 3,913 (9,595)
62700 REPAIR & MAINT 1,340 483 1,823 6,277 4,454
62800 OTHER EXPENSES 5,485 6,897 12,382 7,352 (5,030)
TOTAL OPERATIONS 36,662 67,584 104,246 70,284 (33,962)
TOTAL EXPENDITURES 352,563$ 386,027$ 738,590$ 734,454$ (4,136)$
BUDGETED FUNDS
02426 PER CAPITA FEE 352,563$ 386,027$ 738,590$ 734,454$ (4,136)$
TOTAL BUDGET FUNDING 352,563$ 386,027$ 738,590$ 734,454$ (4,136)$
MONTANA DEPARTMENT OF LIVESTOCK
PROJECTED EXPENSE BUDGET COMPARISON REPORT
JANUARY 31, 2018
Projected
Expenses
January to June
2018
FY 2018
Projected Year
End Expense
Totals
FY 2018
Budget
Projected
Budget
Excess/
(Deficit)
Due to the lag in timing that expenses are able to be posted to the accounting system, projected expenses are calculated
using six months to the end of the year instead of the anticipated seven months.
Projected expenses are calculated using prior years actual expenses by month, then adjusting for known non‐consistent
items. Non‐consistent expenses include out of state travel or known employees ready to retire. The department has not
calculated potential retirements in the projections at this time.
5

DIVISION: ANIMAL HEALTH DIVISION ‐ STATE VETERINARIAN
PROGRAM: DESIGNATED SURVEILLANCE AREA (DSA)
Year‐to‐Date
Actual
Expenses
JanuaryFY 2018
BUDGETED FTE 2.00
HOUSE BILL 2 AND PAYPLAN APPROPRIATED EXPENDITURES
61000 PERSONAL SERVICES
61100 SALARIES 64,799$ 74,597$ 139,396$ 117,326$ (22,070)$
61400 BENEFITS 23,530 28,266 51,796 44,376 (7,420)
TOTAL PERSONAL SERVICES 88,329 102,863 191,192 161,702 (29,490)
62000 OPERATIONS
62100 CONTRACT 608,100 40,929 649,029 576,174 (72,855)
62200 SUPPLY 489 1,584 2,073 2,082 9
62300 COMMUNICATION 829 2,179 3,008 2,958 (50)
62400 TRAVEL 3,294 2,788 6,082 6,108 26
62700 REPAIR & MAINT 50 514 564 566 2
62800 OTHER EXPENSES 4,158 313 4,471 3,579 (892)
TOTAL OPERATIONS 616,920 48,307 665,227 591,467 (73,760)
TOTAL EXPENDITURES 705,249$ 151,170$ 856,419$ 753,169$ (103,250)$
BUDGETED FUNDS
01100 GENERAL FUND 705,249$ 151,170$ 856,419$ 753,169$ (103,250)$
TOTAL BUDGETED FUNDS 705,249$ 151,170$ 856,419$ 753,169$ (103,250)$
MONTANA DEPARTMENT OF LIVESTOCK
PROJECTED EXPENSE BUDGET COMPARISON REPORT
JANUARY 31, 2018
Due to the lag in timing that expenses are able to be posted to the accounting system, projected expenses are calculated using
six months to the end of the year instead of the anticipated seven months.
Projected
Expenses
January to June
2018
FY 2018
Projected Year
End Expense
Totals
FY 2018
Budget
Projected
Budget
Excess/
(Deficit)
Projected expenses are calculated using prior years actual expenses by month, then adjusting for known non‐consistent items.
Non‐consistent expenses include out of state travel or known employees ready to retire. The department has not calculated
potential retirements in the projections at this time.
6

DIVISION: ANIMAL HEALTH DIVISION ‐ STATE VETERINARIAN
PROGRAM: ANIMAL FEDERAL UMBRELLA GRANTS
Year‐to‐Date
Actual
Expenses
JanuaryFY 2018
BUDGETED FTE 3.75
HOUSE BILL 2 AND PAYPLAN APPROPRIATED EXPENDITURES
61000 PERSONAL SERVICES
61100 SALARIES 59,011$ 71,867$ 130,878$ 152,675$ 21,797$
61400 BENEFITS 23,243 30,436 53,679 66,914 13,235
TOTAL PERSONAL SERVICES 82,254 102,303 184,557 219,589 35,032
62000 OPERATIONS
62100 CONTRACT 15,495 187,828 203,323 249,835 46,512
62200 SUPPLY 7,783 9,899 17,682 18,463 781
62300 COMMUNICATION 3,073 2,979 6,052 6,538 486
62400 TRAVEL 7,886 4,990 12,876 15,330 2,454
62500 RENT 42,225 12,793 55,018 51,364 (3,654)
62700 REPAIR & MAINT 13,177 7,622 20,799 10,490 (10,309)
62800 OTHER EXPENSES ‐ 19,415 19,415 42,248 22,833
TOTAL OPERATIONS 91,971 245,526 337,497 394,268 56,771
68000 TRANSFERS
68000 TRANSFERS ‐ 240,000 240,000 240,000 ‐
TOTAL TRANSFERS ‐ 240,000 240,000 240,000 ‐
TOTAL EXPENDITURES 174,225$ 587,829$ 762,054$ 853,857$ 91,803$
BUDGETED FUNDS
03427 174,225$ 587,829$ 762,054$ 853,857$ 91,803$
TOTAL BUDGETED FUNDS 174,225$ 587,829$ 762,054$ 853,857$ 91,803$
Projected
Expenses
January to June
2018
FY 2018
Projected Year
End Expense
Totals
FY 2018
Budget
Projected
Budget
Excess/
(Deficit)
MONTANA DEPARTMENT OF LIVESTOCK
PROJECTED EXPENSE BUDGET COMPARISON REPORT
JANUARY 31, 2018
The Federal fiscal year is different than state fiscal year. While MDOL may only spend what is appropriated in House Bill
2, the department has until the following March to spend money awarded for the different grants.
Projected expenses are calculated using prior years actual expenses by month, then adjusting for known non‐consistent
items. Non‐consistent expenses include out of state travel or known employees ready to retire. The department has
not calculated potential retirements in the projections at this time.
The Federal Umbrella budget was reduce by approximately $128,000 from FY 2017 to FY 2018. The Federal Umbrella
program ended with $153,000 excess budget over expenditures in FY 2017. These projections indicate there may be a
surplus of $145,000 in personal services and a $153,000 deficit in operations in FY 2018. In FY 2017, the Department
executed a BCD to transfer $88,000 from personal services to operations and may need to submit a similar BCD in FY
Due to the lag in timing that expenses are able to be posted to the accounting system, projected expenses are
calculated using six months to the end of the year instead of the anticipated seven months.
AH FEDERAL UMBRELLA
7

DIVISION: DIAGNOSTIC LABORATORY
PROGRAM: DIAGNOSTIC LABORATORY
Year‐to‐Date
Actual
Expenses
January
FY 2018
BUDGETED FTE 20.01
HOUSE BILL 2 AND PAYPLAN APPROPRIATED EXPENDITURES
61000 PERSONAL SERVICES
61100 SALARIES 525,012$ 515,519$ 1,040,531$ 919,688$ (120,843)$
61400 BENEFITS 216,141 212,502 428,643 355,712 (72,931)
TOTAL PERSONAL SERVICES 741,153 728,021 1,469,174 1,275,400 (193,774)
62000 OPERATIONS
62100 CONTRACT 52,092 47,838 99,930 98,558 (1,372)
62200 SUPPLY 210,202 233,067 443,269 490,598 47,329
62300 COMMUNICATION 6,635 17,034 23,669 37,817 14,148
62400 TRAVEL 4,910 1,575 6,485 7,527 1,042
62500 RENT 2,740 954 3,694 2,109 (1,585)
62600 UTILITIES 24,612 22,899 47,511 49,890 2,379
62700 REPAIR & MAINT 75,692 37,829 113,521 93,823 (19,698)
62800 OTHER EXPENSES 65,865 51,091 116,956 124,245 7,289
TOTAL OPERATIONS 442,748 412,287 855,035 904,567 49,532
63000 EQUIPMENT
63100 EQUIPMENT 16,100 ‐ 16,100 15,000 (1,100)
TOTAL EQUIPMENT 16,100 ‐ 16,100 15,000 (1,100)
69000 CAPITAL LEASES
69000 LEASES 8,341 6,917 15,258 13,836 (1,422)
TOTAL LEASES 8,341 6,917 15,258 13,836 (1,422)
TOTAL EXPENDITURES 1,208,342$ 1,147,225$ 2,355,567$ 2,208,803$ (146,764)$
BUDGETED FUNDS
01100 GENERAL FUND 168,348$ 355,146$ 523,494$ 545,967$ 22,473$
02426 PER CAPITA FEE 426,728 193,179 619,907 450,670 (169,237)
03673 FEDERAL ANIMAL HEALTH DISEASE GRAN ‐ 30,585 30,585 30,585 ‐
06026 DIAGNOSTIC LABORATORY FEES 613,266 568,315 1,181,581 1,181,581 ‐
TOTAL BUDGET FUNDING 1,208,342$ 1,147,225$ 2,355,567$ 2,208,803$ (146,764)$
MONTANA DEPARTMENT OF LIVESTOCK
PROJECTED EXPENSE BUDGET COMPARISON REPORT
JANUARY 31, 2018
Due to the lag in timing that expenses are able to be posted to the accounting system, projected expenses are calculated
using months to the end of the year instead of the anticipated months.
Projected payouts for employees that have submitted resignation of employment is $30,384. The department expects to pay
this within the next three months.
Projected
Expenses
January to June
2018
FY 2018
Projected Year
End Expense
Totals
FY 2018
Budget
Projected
Budget
Excess/
(Deficit)
8

DIVISION: DIAGNOSTIC LABORATORY
PROGRAM: MILK LABORATORY
Year‐to‐Date
Actual
Expenses
January
FY 2018
BUDGETED FTE 1.50
HOUSE BILL 2 AND PAYPLAN APPROPRIATED EXPENDITURES
61000 PERSONAL SERVICES
61100 SALARIES 44,299$ 34,493$ 78,792$ 72,791$ (6,001)$
61400 BENEFITS 20,545 17,229 37,774 36,506 (1,268)
TOTAL PERSONAL SERVICES 64,844 51,722 116,566 109,297 (7,269)
62000 OPERATIONS
62100 CONTRACT 3,828 4,211 8,039 5,056 (2,983)
62200 SUPPLY 16,693 12,863 29,556 23,964 (5,592)
62300 COMMUNICATION 33 546 579 510 (69)
62400 TRAVEL 75 1,960 2,035 1,633 (402)
62600 UTILITIES 2,128 2,663 4,791 3,289 (1,502)
62700 REPAIR & MAINT 8,199 1,021 9,220 7,190 (2,030)
62800 OTHER EXPENSES 5,662 4,475 10,137 7,511 (2,626)
TOTAL OPERATIONS 36,618 27,739 64,357 49,153 (15,204)
TOTAL EXPENDITURES 101,462$ 79,461$ 180,923$ 158,450$ (22,473)$
BUDGETED FUNDS
01100 GENERAL FUND 101,462$ 79,461$ 180,923$ 158,450$ (22,473)$
TOTAL BUDGETED FUNDS 101,462$ 79,461$ 180,923$ 158,450$ (22,473)$
MONTANA DEPARTMENT OF LIVESTOCK
PROJECTED EXPENSE BUDGET COMPARISON REPORT
January 31, 2018
Projected
Expenses
January to June
2018
FY 2018
Projected Year
End Expense
Totals
FY 2018
Budget
Projected
Budget
Excess/
(Deficit)
Due to the lag in timing that expenses are able to be posted to the accounting system, projected expenses are calculated
using six months to the end of the year instead of the anticipated seven months.
Projected expenses are calculated using prior years actual expenses by month, then adjusting for known non‐consistent
items. Non‐consistent expenses include out of state travel or known employees ready to retire. The department has not
calculated potential retirements in the projections at this time.
This report compares the department's second month of projections (March 2016) to the year‐end actual expenses. This evaluation will aid
the department to improve future projection process.
The department began allocating utilities and MSU recharges to the milk lab in FY 2017. In prior years, these expenses
were paid from the diagnostic lab budget. In determining budgets for the 2018‐19 biennium, these expenses were
captured in the diagnostic lab budget, not the milk lab budget. The annual recharge expense for the milk lab will be
$6,840 and utilities are estimated to be $4,800. The Department anticipates the milk lab may over spend appropriations
9

DIVISION: MILK & EGG BUREAU
PROGRAM: MILK & EGG INSPECTION
Year‐to‐Date
Actual
Expenses
JanuaryFY 2018
BUDGETED FTE 4.75
HOUSE BILL 2 AND PAYPLAN APPROPRIATED EXPENDITURES
61000 PERSONAL SERVICES
61100 SALARIES 103,634$ 93,329$ 196,963$ 211,609$ 14,646$
61400 BENEFITS 41,992 39,755 81,747 90,690 8,943
TOTAL PERSONAL SERVICES 145,626 133,084 278,710 302,299 23,589
62000 OPERATIONS
62100 CONTRACT 3,311 1,307 4,618 7,582 2,964
62200 SUPPLY 1,543 4,635 6,178 9,389 3,211
62300 COMMUNICATION 2,172 3,229 5,401 7,795 2,394
62400 TRAVEL 5,743 9,027 14,770 20,044 5,274
62500 RENT 2,210 2,507 4,717 5,517 800
62700 REPAIR & MAINT 246 809 1,055 2,820 1,765
62800 OTHER EXPENSES 6,569 7,344 13,913 13,258 (655)
TOTAL OPERATIONS 21,794 28,858 50,652 66,405 15,753
TOTAL EXPENDITURES 167,420$ 161,942$ 329,362$ 368,704$ 39,342$
BUDGETED FUNDS
02701 MILK INSPECTION FEES 157,466$ 153,686$ 311,152$ 347,704$ 36,552$
03032‐2 SHELL EGG FEDERAL INSPECTION FEES 9,954 8,256 18,210 21,000 2,790
TOTAL BUDGET FUNDING 167,420$ 161,942$ 329,362$ 368,704$ 39,342$
MONTANA DEPARTMENT OF LIVESTOCK
PROJECTED EXPENSE BUDGET COMPARISON REPORT
JANUARY 31, 2018
This report compares the department's second month of projections (March 2016) to the year‐end actual expenses. This evaluation will aid the
department to improve future projection process.
Milk inspection has a significant excess of budget authority over projected expenses due to reducing expenses to correlate with
milk assessment fee revenues.
Due to the lag in timing that expenses are able to be posted to the accounting system, projected expenses are calculated using six
months to the end of the year instead of the anticipated seven months.
Projected
Expenses
January to June
2018
FY 2018
Projected
Year End
Expense
Totals
FY 2018
Budget
Projected
Budget
Excess/
(Deficit)
Projected expenses are calculated using prior years actual expenses by month, then adjusting for known non‐consistent items.
Non‐consistent expenses include out of state travel or known employees ready to retire. The department has not calculated
potential retirements in the projections at this time.
The Shielded Egg Grading expense projections are shown seperatlely from the milk and egg inspection program.
10
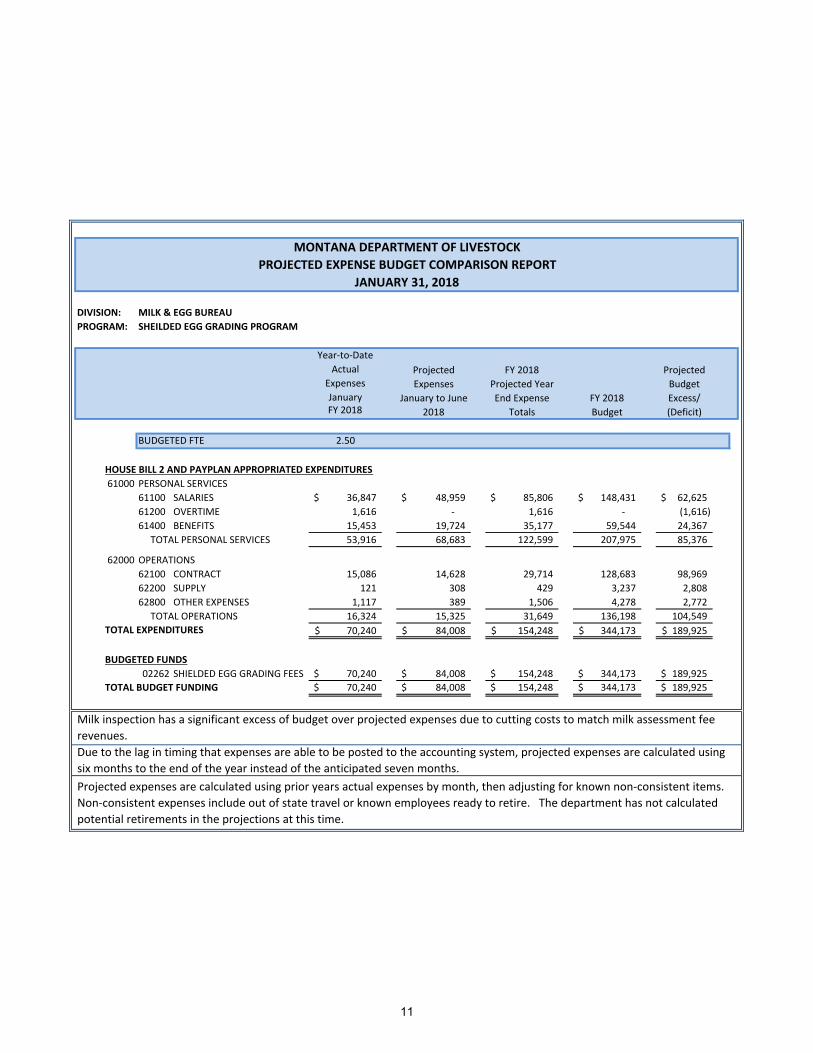
DIVISION: MILK & EGG BUREAU
PROGRAM: SHEILDED EGG GRADING PROGRAM
Year‐to‐Date
Actual
Expenses
JanuaryFY 2018
BUDGETED FTE 2.50
HOUSE BILL 2 AND PAYPLAN APPROPRIATED EXPENDITURES
61000 PERSONAL SERVICES
61100 SALARIES 36,847$ 48,959$ 85,806$ 148,431$ 62,625$
61200 OVERTIME 1,616 ‐ 1,616 ‐ (1,616)
61400 BENEFITS 15,453 19,724 35,177 59,544 24,367
TOTAL PERSONAL SERVICES 53,916 68,683 122,599 207,975 85,376
62000 OPERATIONS
62100 CONTRACT 15,086 14,628 29,714 128,683 98,969
62200 SUPPLY 121 308 429 3,237 2,808
62800 OTHER EXPENSES 1,117 389 1,506 4,278 2,772
TOTAL OPERATIONS 16,324 15,325 31,649 136,198 104,549
TOTAL EXPENDITURES 70,240$ 84,008$ 154,248$ 344,173$ 189,925$
BUDGETED FUNDS
02262 SHIELDED EGG GRADING FEES 70,240$ 84,008$ 154,248$ 344,173$ 189,925$
TOTAL BUDGET FUNDING 70,240$ 84,008$ 154,248$ 344,173$ 189,925$
MONTANA DEPARTMENT OF LIVESTOCK
PROJECTED EXPENSE BUDGET COMPARISON REPORT
JANUARY 31, 2018
Milk inspection has a significant excess of budget over projected expenses due to cutting costs to match milk assessment fee
revenues.
Due to the lag in timing that expenses are able to be posted to the accounting system, projected expenses are calculated using
six months to the end of the year instead of the anticipated seven months.
Projected
Expenses
January to June
2018
FY 2018
Projected Year
End Expense
Totals
FY 2018
Budget
Projected
Budget
Excess/
(Deficit)
Projected expenses are calculated using prior years actual expenses by month, then adjusting for known non‐consistent items.
Non‐consistent expenses include out of state travel or known employees ready to retire. The department has not calculated
potential retirements in the projections at this time.
11

DIVISION: MEAT & POULTRY INSPECTION PROGRAM
PROGRAM: MEAT INSPECTION
Year‐to‐Date
Actual
Expenses
January
FY 2018
BUDGETED FTE 24.50
HOUSE BILL 2 AND PAYPLAN APPROPRIATED EXPENDITURES
61000 PERSONAL SERVICES
61100 SALARIES 490,091$ 470,492$ 960,583$ 802,212$ (158,371)$
61200 OVERTIME 20,970 ‐ 20,970 16,643 (4,327)
61400 BENEFITS 240,698 218,044 458,742 416,890 (41,852)
TOTAL PERSONAL SERVICES 751,759 688,536 1,440,295 1,235,745 (204,550)
62000 OPERATIONS
62100 CONTRACT 27,997 16,273 44,270 41,291 (2,979)
62200 SUPPLY 3,590 9,786 13,376 11,062 (2,314)
62300 COMMUNICATION 9,017 12,156 21,173 16,911 (4,262)
62400 TRAVEL 22,663 26,466 49,129 38,700 (10,429)
62500 RENT 79,746 80,967 160,713 116,598 (44,115)
62700 REPAIR & MAINT 2,021 13,697 15,718 12,547 (3,171)
62800 OTHER EXPENSES 146,282 112,544 258,826 277,747 18,921
TOTAL OPERATIONS 291,316 271,889 563,205 514,856 (48,349)
TOTAL EXPENDITURES 1,043,075$ 960,425$ 2,003,500$ 1,750,601$ (252,899)$
BUDGETED FUNDS
01100 GENDERAL FUND 602,314$ 476,199$ 1,078,513$ 825,614$ (252,899)$
02427 ANIMAL HEALTH FEES ‐ 5,718 5,718 5,718 ‐
03209 MEAT & POULTRY INSPECTION FEES 440,761 478,508 919,269 919,269 ‐
TOTAL BUDGET FUNDING 1,043,075$ 960,425$ 2,003,500$ 1,750,601$ (252,899)$
Due to the lag in timing that expenses are able to be posted to the accounting system, projected expenses are calculated using six
months to the end of the year instead of the anticipated seven months.
Projected expenses are calculated using prior years actual expenses by month, then adjusting for known non‐consistent items. Non‐
consistent expenses include out of state travel or known employees ready to retire. The department has not calculated potential
retirements in the projections at this time.
Projected
Expenses
January to June
2018
FY 2018
Projected Year
End Expense
Totals
FY 2018
Budget
Projected
Budget
Excess/
(Deficit)
MONTANA DEPARTMENT OF LIVESTOCK
PROJECTED EXPENSE BUDGET COMPARISON REPORT
JANUARY 31, 2018
The department has evaluated the list of employees who are eligible to retire but have not indicated to management that they intend
to retire during this fiscal year. Since employees may retire at anytime, the department has deemed it appropriate to include
employees payout liabilities in the projections. Employees who have indicated they do not intend to retire this fiscal year are not
included in the projections. Payouts for employees age 62 and over are included in the projections and are estimated to be $30,600 to
June 30, 2017.
12

DIVISION: BRANDS ENFORCEMENT
PROGRAM: BRANDS ENFORCEMENT
Year‐to‐Date
Actual
Expenses
JanuaryFY 2018
BUDGETED FTE 53.11
HOUSE BILL 2 AND PAYPLAN APPROPRIATED EXPENDITURES
61000 PERSONAL SERVICES
61100 SALARIES 1,194,248$ 912,008$ 2,106,256$ 1,888,572$ (217,684)$
61200 OVERTIME 78,389 11,376 89,765 74,391 (15,374)
61400 BENEFITS 560,507 427,814 988,321 957,579 (30,742)
TOTAL PERSONAL SERVICES 1,833,144 1,351,198 3,184,342 2,920,542 (263,800)
62000 OPERATIONS
62100 CONTRACT 72,265 28,299 100,564 119,914 19,350
62200 SUPPLY 55,232 47,221 102,453 126,078 23,625
62300 COMMUNICATION 31,105 38,483 69,588 72,838 3,250
62400 TRAVEL 14,519 26,073 40,592 42,488 1,896
62500 RENT 47,387 55,446 102,833 100,099 (2,734)
62600 UTILITIES 6,500 ‐ 6,500 6,500 ‐
62700 REPAIR & MAINT 9,258 8,818 18,076 44,826 26,750
62800 OTHER EXPENSES 33,742 34,783 68,525 71,723 3,198
TOTAL OPERATIONS 270,008 239,123 509,131 584,466 75,335
TOTAL EXPENDITURES 2,103,152$ 1,590,321$ 3,693,473$ 3,505,008$ (188,465)$
BUDGETED FUNDS
02425 BRAND INSPECTION FEES 2,103,152$ 879,995$ 2,983,147$ 2,983,147$ ‐$
02426 PER CAPITA FEES ‐ 710,326 710,326 521,861 (188,465)
TOTAL BUDGET FUNDING 2,103,152$ 1,590,321$ 3,693,473$ 3,505,008$ (188,465)$
Due to the lag in timing that expenses are able to be posted to the accounting system, projected expenses are calculated using
six months to the end of the year instead of the anticipated seven months.
Projected expenses are calculated using prior years actual expenses by month, then adjusting for known non‐consistent items.
Non‐consistent expenses include out of state travel or known employees ready to retire.
In FY 2016, the Department approved salary increases for employees who were below 80% of market. The increases were
implemented after the Budget Office performed the bienium personnel snap‐shot, therefore the increases were not included in
the 2018‐19 biennium budget. Since the salary increases were not included in the 2018 ‐ 19 budget, personal services
expenditures are projected to in excess of budgeted appropriations by $263,800.
Projected
Expenses
January to June
2018
FY 2018
Projected Year
End Expense
Totals
FY 2018
Budget
Projected
Budget
Excess/
(Deficit)
MONTANA DEPARTMENT OF LIVESTOCK
PROJECTED EXPENSE BUDGET COMPARISON REPORT
JANUARY 31, 2018
13

DIVISION: DEPARTMENT OF LIVESTOCK
PROGRAM: DEPARTMENT OF LIVESTOCK
FY 2018
Adjusted
Year‐to‐Date
Actual
Expenses
January
Same Period
Prior Year
Actual Expenses
January Year to Year
Balance of
Budget
Budget FY 2018 FY 2017 Comparison Available
BUDGETED FTE 135.62
61000 PERSONAL SERVICES
61100 SALARIES 5,618,407$ 3,224,204$ 2,898,150$ 326,054$ 2,394,203$
61200 OVERTIME 91,034 100,975 67,750 33,225 (9,941)
61300 OTHER/PER DIEM 6,700 2,750 2,600 150 3,950
61400 BENEFITS 2,524,228 1,401,470 1,334,238 67,232 1,122,758
TOTAL PERSONAL SERVICES 8,240,369 4,729,399 4,302,738 426,661 3,510,970
62000 OPERATIONS
62100 CONTRACT 1,563,944 956,868 751,101 205,767 607,076
62200 SUPPLY 781,106 365,565 335,422 30,143 415,541
62300 COMMUNICATION 200,529 99,180 109,491 (10,311) 101,349
62400 TRAVEL 172,606 71,663 69,789 1,874 100,943
62500 RENT 516,288 273,491 225,278 48,213 242,797
62600 UTILITIES 59,679 35,572 32,418 3,154 24,107
62700 REPAIR & MAINT 180,975 111,663 106,318 5,345 69,312
62800 OTHER EXPENSES 574,118 281,084 234,598 46,486 293,034
TOTAL OPERATIONS 4,049,245 2,195,086 1,864,415 330,671 1,854,159
63000 EQUIPMENT
63100 EQUIPMENT 15,000 16,100 ‐ 16,100 (1,100)
TOTAL EQUIPMENT 15,000 16,100 ‐ 16,100 (1,100)
68000 TRANSFERS
68000 TRANSFERS 335,326 97,391 111,246 (13,855) 237,935
TOTAL TRANSFERS 335,326 97,391 111,246 (13,855) 237,935
69000 CAPITAL LEASES
69000 LEASES 13,836 8,341 8,340 1 5,495
TOTAL LEASES 13,836 8,341 8,340 1 5,495
TOTAL 12,653,776$ 7,046,317$ 6,286,739$ 759,578$ 5,607,459$
FUND
01100 GENDERAL FUND 2,365,861 1,630,145$ 1,169,908$ 460,237$ 735,716$
02262 SHIELDED EGG GRADING FEES 344,173 70,240 69,888 352 273,933
02425 BRAND INSPECTION FEES 2,983,147 2,103,152 1,832,895 270,257 879,995
02426 PER CAPITA FEE 3,211,373 1,687,989 1,193,899 494,090 1,523,384
02427 ANIMAL HEALTH 5,718 ‐ 996,783 (996,783) 5,718
02701 MILK INSPECTION FEES 348,619 157,466 144,855 12,611 191,153
02817 MILK CONTROL 388,593 159,119 140,604 18,515 229,474
03209 MEAT & POULTRY INSPECTION 919,269 440,761 423,273 17,488 478,508
03032‐1 NATIONAL LAB NETWORK 30,585 ‐ ‐ ‐ 30,585
03032‐2 SHELL EGG FEDERAL INSPECTION FEES 21,000 9,954 10,160 (206) 11,046
03427 AH FEDERAL UMBRELLA 853,857 174,225 268,948 (94,723) 679,632
06026 DIAGNOSTIC LABORATORY FEES 1,181,581 613,266 ‐ 613,266 568,315
TOTAL BUDGET FUNDING 12,653,776$ 7,046,317$ 6,286,739$ 759,578$ 5,607,459$
The Department of Livestock is budgeted for $12,653,776 and 135.62 FTE in FY 2017. Personal services budget is 57%
expended with 50% of payrolls complete. Personal services expended as of January 2018 was $426,661 higher than January
2017. Operations are 54% expended with 50% of the budget year lapsed. Operation expenses as of January 2018 were
$330,671 higher than January 2017. Overall, Department of Livestock total expenditures were $759,578 higher than the same
period last year. With 50% of the budget year lapsed, 56% of the budget is expended.
At fiscal year end, invoices for June expenses are received in July. Although the invoices are received in July, they are
appropriately recorded in June of the prior fiscal year. Subsequently, however, invoices are recorded in the month they are
received and approved. For example, July's expenses are recorded in August when the invoices are due to be paid. This leads to
expenditures being recorded in the month following the date the expense had occurred. Due to the lag in recording expenses,
it may appear that expensese double in June. This is because May and June's expenses are both recorded in June.
MONTANA DEPARTMENT OF LIVESTOCK
HOUSE BILL 2 AND PAYPLAN
BUDGETARY EXPENSE COMPARISON REPORT
JANUARY 31, 2018
BUDGET TO ACTUAL EXPENSE
COMPARISON REPORT
14

DIVISION: CENTRALIZED SERVICES
PROGRAM: CENTRAL SERVICES AND BOARD OF LIVESTOCK
FY 2018
Year‐to‐Date
Actual
Expenses
January
Same Period
Prior Year
Actual Expenses
January Year to Year
Balance of
BudgetBudget FY 2018 FY 2017 Comparison Available
BUDGETED FTE 13.00
HOUSE BILL 2 AND PAYPLAN APPROPRIATED EXPENDITURES
61000 PERSONAL SERVICES
61100 SALARIES 603,668$ 351,018$ 352,601$ (1,583)$ 252,650$
61300 OTHER/PER DIEM 2,250 1,200 1,400 (200) 1,050
61400 BENEFITS 218,203 128,347 141,459 (13,112) 89,856
TOTAL PERSONAL SERVICES 824,121 480,565 495,460 (14,895) 343,556
62000 OPERATIONS
62100 CONTRACT 233,975 139,440 55,139 84,301 94,535
62200 SUPPLY 120,753 61,640 24,001 37,639 59,113
62300 COMMUNICATION 49,849 30,362 9,977 20,385 19,487
62400 TRAVEL 18,026 6,776 6,407 369 11,250
62500 RENT 142,265 85,190 77,554 7,636 57,075
62700 REPAIR & MAINT 1,649 433 380 53 1,216
62800 OTHER EXPENSES 18,424 6,901 6,298 603 11,523
TOTAL OPERATIONS 584,941 330,742 179,756 150,986 254,199
68000 TRANSFERS
68000 TRANSFERS 95,326 97,391 95,325 2,066 (2,065)
TOTAL TRANSFERS 95,326 97,391 95,325 2,066 (2,065)
TOTAL EXPENDITURES 1,504,388$ 908,698$ 770,541$ 138,157$ 595,690$
BUDGETED FUNDS
02426 PER CAPITA 1,504,388$ 908,698$ 770,541$ 138,157$ 595,690$
TOTAL BUDGETED FUNDS 1,504,388$ 908,698$ 770,541$ 138,157$ 595,690$
MONTANA DEPARTMENT OF LIVESTOCK
BUDGETARY EXPENSE COMPARISON REPORT
BUDGET TO ACTUAL EXPENSE
COMPARISON REPORT
JANUARY 31, 2018
Personal Services were higher in FY 2017 than FY 2018. The difference was the former Executive Officer payout.
Rent is higher in FY 2018 than FY 2017. The Department began expensing rent in the month the expense accured. In prior years, rent was expensed
when it was paid, which was the month after it was incurred. Rent is not due at the beginning of the month.
Contract services are higher in FY 2018 than FY 2017. During 2017 Legislative Session, all of SITSD (State Information Technology Services Division)
was budgeted in CSD. In prior years, SITSD was expensed to the other divisions and bureaus.
Supply expense is considerable higher in FY 2018. The Department has started purchasing replacing computers earlier in FY 2018 than FY 2017. The
majority of the replacement computers for FY 2017 were purchased before the end of August 2017.
15

DIVISION: CENTRALIZED SERVICES
PROGRAM: LIVESTOCK LOSS BOARD
FY 2018
Year‐to‐Date
Actual
Expenses
January
Same Period
Prior Year
Actual Expenses
January Year to Year
Balance of
BudgetBudget FY 2018 FY 2017 Comparison Available
BUDGETED FTE 1.00
HOUSE BILL 2 AND SB 418 APPROPRIATED EXPENDITURES
61000 PERSONAL SERVICES
61100 SALARIES 52,303$ 32,064$ 29,500$ 2,564$ 20,239$
61300 OTHER/PER DIEM 600 350 400 (50) 250
61400 BENEFITS 20,970 12,068 11,816 252 8,902
TOTAL PERSONAL SERVICE 73,873 44,482 41,716 2,766 29,391
62000 OPERATIONS
62100 CONTRACT 669 545 610 (65) 124
62200 SUPPLY 775 204 510 (306) 571
62300 COMMUNICATION 1,484 819 1,130 (311) 665
62400 TRAVEL 1,525 2,030 1,764 266 (505)
62500 RENT 3,252 3,127 2,754 373 125
62700 REPAIR & MAINT 644 1,060 23 1,037 (416)
62800 OTHER EXPENSES 439 505 674 (169) (66)
TOTAL OPERATIONS 8,788 8,290 7,465 825 498
TOTAL EXPENDITURES 82,661$ 52,772$ 49,181$ 3,591$ 29,889$
BUDGETED FUNDS
01100 GENERAL FUND 82,661$ 52,772$ 49,181$ 3,591$ 29,889$
TOTAL BUDGETED FUNDS 82,661$ 52,772$ 49,181$ 3,591$ 29,889$
BUDGET TO ACTUAL EXPENSE
COMPARISON REPORT
MONTANA DEPARTMENT OF LIVESTOCK
BUDGETARY EXPENSE COMPARISON REPORT
JANUARY 31, 2018
At fiscal year end, invoices for June expenses are received in July. Although the invoices are received in July, they
are appropriately recorded in June of the prior fiscal year. Subsequently, however, invoices are recorded in the
month they are received and approved. For example, July's expenses are recorded in August when the invoices are
due to be paid. This leads to expenditures being recorded in the month following the date the expense had
occurred. Due to the lag in recording expenses, it may appear that expensese double in June. This is because May
and June's expenses are both recorded in June.In FY 2017, the Livestock Loss Board is budgeted $91,846 with 1.00 FTE funded with general fund.The personal
services budget is 56% expended with 50% of payrolls complete. Personal services expended as of January 2018
was $2,766 higher than January 2017. Operations are 94% expended with 50% of the budget year lapsed.
Operation expenses as of January 2018 were $825 higher than January 2017. Overall, Livestock Loss Board total
expenditures were $3,591 higher than the same period last year. With 50% of the budget year lapsed, 64% of the
budget is expended.
Under direction of the Budget Director, the Department submitted a plan to reduce General Fund programs by
10%. The reduction is established by 17‐7‐140, MCA. The amount of the reduction for the Livestock Loss Board is
$9,185.
16

DIVISION: CENTRALIZED SERVICES BUDGET YEAR LAPSED: 50%
PROGRAM: LIVESTOCK LOSS BOARD PAYROLL PERIODS COMPLETED: 50%
FY 2018
Year‐to‐Date
Actual
Expenses
January
Same Period
Prior Year
Actual Expenses
January Year to Year
Balance of
BudgetBudget FY 2018 FY 2017 Comparison Available
STATUTORY AND BUDGET AMENDED EXPENDITURES
62000 OPERATIONS
62100 OTHER SERVICES 82,149$ 82,149$ ‐$ 82,149$ ‐$
TOTAL OPERATIONS 82,149 82,149 ‐ 82,149 ‐
66000 GRANTS
66100 FROM STATE SOURCES 82,149 58,400 ‐ 58,400 23,749
66200 FROM FEDERAL SOURCES 145,000 100,113 78,537 21,576 44,887
TOTAL GRANTS 227,149 158,513 78,537 79,976 68,636
67000 BENEFITS AND CLAIMS
67200 FROM STATE SOURCES 203,422 150,903 222,500 (71,597) 52,519
TOTAL STATE SOURCES 203,422 150,903 222,500 (71,597) 52,519
512,720$ 391,565$ 301,037$ 90,528$ 121,155$
STATATORY APPROPRIATED FUND
02124 LIVESTOCK LOSS MEDIATION 203,422$ 105,903$ 175,257$ (69,354)$ 97,519$
02125 LIVESTOCK LOSS REDUCTION 164,298 144,549 ‐ 144,549 19,749
BUDGET AMENDED FUNDS
03345 LIVESTOCK LOSS MEDIATION FEDERAL 145,000 141,113 125,780 15,333 3,887
TOTAL STATUTORY AND BUDGET AMENDED FUNDS 512,720$ 391,565$ 301,037$ 90,528$ 121,155$
MONTANA DEPARTMENT OF LIVESTOCK
BUDGETARY EXPENSE COMPARISON REPORT
JANUARY 31, 2018
BUDGET TO ACTUAL EXPENSE COMPARISON
REPORT
TOTAL STATATORY AND BUDGET AMENDED
EXPENDITURES
In FY 2017, the Livestock Loss Board is budgeted $93,065 with 1.00 FTE funded with general fund.The personal services budget is 78%
expended with 50% of payrolls complete. Personal services expended as of January 2018 was $1,786 higher than January 2017.
Operations are 84% expended with 50% of the budget year lapsed. Operation expenses as of January 2018 were $245 higher than
January 2017. Overall, Livestock Loss Board total expenditures were $2,031 higher than the same period last year. With 50% of the
budget year lapsed, 79% of the budget is expended.
The Livestock Loss Board has paid $105,903 out of statutory appropriated state funds for loss of livestock which was $69,354 lower
than last year. The Livestock Loss Board also paid $141,113 out of budget amended federal funds which is $15,333 higher than last
year.
Fund 02125 was established pursuant to MCA 81‐1‐113 during 2015 legislation. Appropriations were not set during the 2017
biennium. The 2017 legislation funded MCA 81‐1‐113 for the 2019 biennium beginning with fiscal year 2017. This account is to
restricted to the purposes of reducing predation on livestock by wolves and grizzly bears and reducing expenses incurred by livestock
owners, including but not limited to veterinary bills, caused by wolves and grizzly bears.
At fiscal year end, invoices for June expenses are received in July. Although the invoices are received in July, they are appropriately
recorded in June of the prior fiscal year. Subsequently, however, invoices are recorded in the month they are received and approved.
For example, July's expenses are recorded in August when the invoices are due to be paid. This leads to expenditures being recorded
in the month following the date the expense had occurred. Due to the lag in recording expenses, it may appear that expensese double
in June. This is because May and June's expenses are both recorded in June.
The budget amount of $164,298 was set by MCA 81‐1‐112 (4) which states that "on June 30 of each year, any enemcumbered funds int
the account (Fund 02124 Livestock Loss Mediation) in excess of$300,000 must be transferred to the livestock loss reduction restricted
special revenue account (Fund 02125 Livestock Loss Reduction Fund) established in 81‐1‐113".
17

DIVISION: CENTRALIZED SERVICES
PROGRAM: MILK CONTROL BUREAU
FY 2018
Year‐to‐Date
Actual
Expenses
January
Same Period
Prior Year
Actual
Expenses
January Year to Year
Balance of
Budget
Budget FY 2018 FY 2017 Comparison Available
BUDGETED FTE 3.00
HOUSE BILL 2 AND SB 418 APPROPRIATED EXPENDITURES
61000 PERSONAL SERVICES
61100 SALARIES 167,205$ 91,287$ 83,721$ 7,566$ 75,918$
61300 OTHER/PER DIEM 2,350 1,200 800 400 1,150
61400 BENEFITS 75,800 34,939 33,820 1,119 40,861
TOTAL PERSONAL SERVICES 245,355 127,426 118,341 9,085 117,929
62000 OPERATIONS
62100 CONTRACT 113,675 14,188 8,679 5,509 99,487
62200 SUPPLY 3,049 818 1,610 (792) 2,231
62300 COMMUNICATION 3,042 797 1,965 (1,168) 2,245
62400 TRAVEL 11,115 5,322 3,673 1,649 5,793
62500 RENT 8,542 5,583 4,443 1,140 2,959
62700 REPAIR & MAINT 313 187 147 40 126
62800 OTHER EXPENSES 3,502 4,798 1,746 3,052 (1,296)
TOTAL OPERATIONS 143,238 31,693 22,263 9,430 111,545
TOTAL EXPENDITURES 388,593$ 159,119$ 140,604$ 18,515$ 229,474$
BUDGETED FUNDS
02817 MILK CONTROL 291,012$ 159,119$ 140,604$ 18,515$ 131,893$
TOTAL BUDGETED FUNDS 291,012$ 159,119$ 140,604$ 18,515$ 131,893$
At fiscal year end, invoices for June expenses are received in July. Although the invoices are received in July, they are
appropriately recorded in June of the prior fiscal year. Subsequently, however, invoices are recorded in the month they
are received and approved. For example, July's expenses are recorded in August when the invoices are due to be paid.
This leads to expenditures being recorded in the month following the date the expense had occurred. Due to the lag in
recording expenses, it may appear that expensese double in June. This is because May and June's expenses are both
recorded in June.
BUDGET TO ACTUAL EXPENSE
COMPARISON REPORT
MONTANA DEPARTMENT OF LIVESTOCK
BUDGETARY EXPENSE COMPARISON REPORT
JANUARY 31, 2018
In FY 2017, The Milk Control Bureau is budgeted $291,012 and has 3.00 FTE. The bureau is funded with milk industry fees.
The personal services budget is 52% expended with 50% of payrolls complete. Personal services expended as of January
2018 were $9,085 higher than January 2017. Operations are 22% expended with 50% of the budget year lapsed.
Operation expenses as of January 2018 were $9,430 higher than January 2017. Overall, Milk Control Bureau total
expenditures were $18,515 higher than the same period last year. With 50% of the budget year lapsed, 55% of the
budget is expended.
18

DIVISION: ANIMAL HEALTH DIVISION ‐ STATE VETERINARIAN
PROGRAM: STATE VETERINARIAN IMPORT OFFICE
FY 2018
Year‐to‐Date
Actual
Expenses
January
Same Period
Prior Year
Actual
Expenses
January Year to Year
Balance of
BudgetBudget FY 2018 FY 2017 Comparison Available
BUDGETED FTE 8.50
61000 PERSONAL SERVICES
61100 SALARIES 478,309$ 231,894$ 221,979$ 9,915$ 246,415$
61300 OTHER/PER DIEM ‐ ‐ ‐ ‐ ‐
61400 BENEFITS 185,861 84,007 88,503 (4,496) 101,854
TOTAL PERSONAL SERVICES 664,170 315,901 310,482 5,419 348,269
62000 OPERATIONS
62100 CONTRACT 16,881 4,521 17,704 (13,183) 12,360
62200 SUPPLY 9,355 7,250 11,551 (4,301) 2,105
62300 COMMUNICATION 21,914 14,338 21,439 (7,101) 7,576
62400 TRAVEL 4,592 (1,555) 3,707 (5,262) 6,147
62500 RENT 3,913 5,283 3,760 1,523 (1,370)
62600 UTILITIES ‐ ‐ ‐ ‐ ‐
62700 REPAIR & MAINT 6,277 1,340 26,302 (24,962) 4,937
62800 OTHER EXPENSES 7,352 5,485 6,597 (1,112) 1,867
TOTAL OPERATIONS 70,284 36,662 91,060 (54,398) 33,622
TOTAL 734,454$ 352,563$ 401,542$ (48,979)$ 381,891$
FUND
02426 PER CAPITA FEE 734,454$ 352,563$ 401,542$ (48,979)$ 381,891$
TOTAL BUDGET FUNDING 734,454$ 352,563$ 401,542$ (48,979)$ 381,891$
BUDGET TO ACTUAL EXPENSE
COMPARISON REPORT
At fiscal year end, invoices for June expenses are received in July. Although the invoices are received in July, they are
appropriately recorded in June of the prior fiscal year. Subsequently, however, invoices are recorded in the month they
are received and approved. For example, July's expenses are recorded in August when the invoices are due to be paid.
This leads to expenditures being recorded in the month following the date the expense had occurred. Due to the lag in
recording expenses, it may appear that expensese double in June. This is because May and June's expenses are both
recorded in June.
MONTANA DEPARTMENT OF LIVESTOCK
BUDGETARY EXPENSE COMPARISON REPORT
JANUARY 31, 2018
The State Veteriniarn Office includes Import and Alternative Livestock. In FY 2017, the State Veterinarian Import Office
is budgeted $734,454 with 8.10 FTE funded with per capita fees. The personal services budget is 48% expended with
50% of payrolls complete. Personal services expended as of January 2018 was $5,419 higher than January 2017.
Operations are 52% expended with 50% of the budget year lapsed. Operation expenses as of January 2018 were
$54,398 lower than January 2017. The repair and maintenance includes a contract for the US Herds system of
$25,000. The total budget is 48% expended with 50% of the year lapsed. This is $48,979 less than the same period in
FY 2016.
19

DIVISION: ANIMAL HEALTH DIVISION ‐ STATE VETERINARIAN
PROGRAM: DESIGNATED SURVEILLANCE AREA (DSA)
FY 2018
Year‐to‐Date
Actual
Expenses
January
Same Period
Prior Year Actual
Expenses
January Year to Year
Balance of
BudgetBudget FY 2018 FY 2017 Comparison Available
BUDGETED FTE 2.00
HOUSE BILL 2 AND PAYPLAN APPROPRIATED EXPENDITURES
61000 PERSONAL SERVICES
61100 SALARIES 117,326$ 64,799$ 60,468$ 4,331$ 52,527$
61400 BENEFITS 44,376 23,530 23,182 348 20,846
TOTAL PERSONAL SERVICES 161,702 88,329 83,650 4,679 73,373
62000 OPERATIONS
62100 CONTRACT 576,174 608,100 500,542 107,558 (31,926)
62200 SUPPLY 2,082 489 1,422 (933) 1,593
62300 COMMUNICATION 2,958 829 1,747 (918) 2,129
62400 TRAVEL 6,108 3,294 2,916 378 2,814
62700 REPAIR & MAINT 566 50 460 (410) 516
62800 OTHER EXPENSES 3,579 4,158 512 3,646 (579)
TOTAL OPERATIONS 591,467 616,920 507,599 109,321 (25,453)
TOTAL EXPENDITURES 753,169$ 705,249$ 591,249$ 114,000$ 47,920$
BUDGETED FUNDS
01100 GENERAL FUND 753,169$ 705,249$ 591,249$ 114,000$ 47,920$
TOTAL BUDGETED FUNDS 753,169$ 705,249$ 591,249$ 114,000$ 47,920$
The Designated Surveillance Area (DSA) is budgeted for $753,169 and 2.00 FTE in FY 2018 and is funded with
general funds. The personal services budget is 55% expended with 50% of payrolls complete. Personal services
expended as of January 2018 was $4,679 higher than January 2017. Operations are 104% expended with 50% of
the budget year lapsed. Operation expenses as of January 2018 were $109,321 higher than January 2017. Overall,
DSA total expenditures were $114,000 higher than the same period last year with 94% of the budget expended.
BUDGET TO ACTUAL EXPENSE
COMPARISON REPORT
At fiscal year end, invoices for June expenses are received in July. Although the invoices are received in July, they
are appropriately recorded in June of the prior fiscal year. Subsequently, however, invoices are recorded in the
month they are received and approved. For example, July's expenses are recorded in August when the invoices are
due to be paid. This leads to expenditures being recorded in the month following the date the expense had
occurred. Due to the lag in recording expenses, it may appear that expensese double in June. This is because May
Contract services are higher in FY 2018 than FY 2017. There has been an increase in testing over the prior year.
Under direction of the Budget Director, the Department submitted a plan to reduce General Fund programs by 10%.
The reduction is established by 17‐7‐140, MCA. The amount of the reduction for the DSA is $83,685.
MONTANA DEPARTMENT OF LIVESTOCK
BUDGETARY EXPENSE COMPARISON REPORT
JANUARY 31, 2018
20

DIVISION: ANIMAL HEALTH DIVISION ‐ STATE VETERINARIAN
PROGRAM: FEDERAL ANIMAL HEALTH DISEASE GRANTS
FY 2018
Year‐to‐Date
Actual
Expenses
January
Same Period
Prior Year
Actual Expenses
January Year to Year
Balance of
BudgetBudget FY 2018 FY 2017 Comparison Available
BUDGETED FTE 3.75
HOUSE BILL 2 AND SB 418 APPROPRIATED EXPENDITURES
61000 PERSONAL SERVICES
61100 SALARIES 152,675$ 59,011$ 90,064$ (31,053)$ 93,664$
61400 BENEFITS 66,914 23,243 38,461 (15,218) 43,671
TOTAL PERSONAL SERVICES 219,589 82,254 128,525 (46,271) 137,335
62000 OPERATIONS
62100 CONTRACT 249,835 15,495 35,296 (19,801) 234,340
62200 SUPPLY 18,463 7,783 5,305 2,478 10,680
62300 COMMUNICATION 6,538 3,073 4,225 (1,152) 3,465
62400 TRAVEL 15,330 7,886 4,062 3,824 7,444
62500 RENT 51,364 42,225 51,108 (8,883) 9,139
62700 REPAIR & MAINT 10,490 13,177 4,251 8,926 (2,687)
62800 OTHER EXPENSES 42,248 ‐ 20,255 (20,255) 42,248
TOTAL OPERATIONS 394,268 91,971 124,502 (32,531) 302,297
68000 TRANSFERS
68000 TRANSFERS 240,000 ‐ 15,921 (15,921) 240,000
TOTAL TRANSFERS 240,000 ‐ 15,921 (15,921) 240,000
TOTAL EXPENDITURES 853,857$ 174,225$ 268,948$ (94,723)$ 679,632$
BUDGETED FUNDS
03427 AH FEDERAL UMBRELLA 853,857$ 174,225$ 268,948$ (94,723)$ 679,632$
TOTAL BUDGETED FUNDS 853,857$ 174,225$ 268,948$ (94,723)$ 679,632$
The Federal Animal Health Disease Grants are budgeted for $853,857 and 3.75 FTE in FY 2017 funded with Animal
Health Federal Umbrella grants. The 3.75 FTE are bison workers. Personal services budget is 37% expended with 50%
of payrolls complete. Personal services expended as of January 2018 was $46,271 lower than January 2017.
Operations are 23% expended with 50% of the budget year lapsed. Operation expenses as of January 2018 were
$32,531 lower than January 2017. Overall, Federal Animal Health Disease Grants total expenditures were $94,723
lower than the same period last year with 20% of the budget expended.
At fiscal year end, invoices for June expenses are received in July. Although the invoices are received in July, they are
appropriately recorded in June of the prior fiscal year. Subsequently, however, invoices are recorded in the month they
are received and approved. For example, July's expenses are recorded in August when the invoices are due to be paid.
This leads to expenditures being recorded in the month following the date the expense had occurred. Due to the lag in
recording expenses, it may appear that expensese double in June. This is because May and June's expenses are both
recorded in June.
BUDGET TO ACTUAL EXPENSE
COMPARISON REPORT
MONTANA DEPARTMENT OF LIVESTOCK
BUDGETARY EXPENSE COMPARISON REPORT
JANUARY 31, 2018
21

DIVISION: DIAGNOSTIC LABORATORY
PROGRAM: MAIN LAB
FY 2018
Year‐to‐Date
Actual
Expenses
January
Same Period
Prior Year
Actual Expenses
January Year to Year
Balance of
BudgetBudget FY 2018 FY 2017 Comparison Available
BUDGETED FTE 20.01
HOUSE BILL 2 AND SB 418 APPROPRIATED EXPENDITURES
61000 PERSONAL SERVICES
61100 SALARIES 919,688$ 525,012$ 426,327$ 98,685$ 394,676$
61400 BENEFITS 355,712 216,141 191,884 24,257 139,571
TOTAL PERSONAL SERVICES 1,275,400 741,153 618,211 122,942 534,247
62000 OPERATIONS
62100 CONTRACT 98,558 52,092 35,994 16,098 46,466
62200 SUPPLY 490,598 210,202 224,371 (14,169) 280,396
62300 COMMUNICATION 37,817 6,635 17,726 (11,091) 31,182
62400 TRAVEL 7,527 4,910 5,875 (965) 2,617
62500 RENT 2,109 2,740 1,328 1,412 (631)
62600 UTILITIES 49,890 24,612 23,344 1,268 25,278
62700 REPAIR & MAINT 93,823 75,692 55,748 19,944 18,131
62800 OTHER EXPENSES 124,245 65,865 63,254 2,611 58,380
TOTAL OPERATIONS 904,567 442,748 427,640 15,108 461,819
63000 EQUIPMENT
63100 EQUIPMENT 15,000 16,100 ‐ 16,100 (1,100)
TOTAL EQUIPMENT 15,000 16,100 ‐ 16,100 (1,100)
69000 LEASES 13,836 8,341 8,340 1 5,495
TOTAL LEASES 13,836 8,341 8,340 1 5,495
TOTAL 2,208,803$ 1,208,342$ 1,054,191$ 154,151$ 1,000,461$
BUDGETED FUNDS
01100 GENERAL FUND 545,967$ 168,348$ 66$ 168,282$ 377,619$
02426 PER CAPITA FEE 450,670 426,728 21,816 404,912 23,942
02427 ANIMAL HEALTH LAB FEES ‐ ‐ 996,783 (996,783) ‐
03673 FEDERAL ANIMAL HEALTH DISEASE GRANTS 30,585 ‐ 35,526 (35,526) 30,585
06026 DIAGNOSTIC LABORATORY FEES 1,181,581 613,266 ‐ 613,266 568,315
TOTAL BUDGET FUNDING 2,208,803$ 1,208,342$ 1,054,191$ 154,151$ 1,000,461$
MONTANA DEPARTMENT OF LIVESTOCK
BUDGETARY EXPENSE COMPARISON REPORT
JANUARY 31, 2018
The main lab is budgeted for $2,208,803 and 20.01 FTE in FY 2017. It is funded with general fund of $545,967, per capita fee
of $450,670, federal funds of $30,585, and diagnostic laboratory feesof $1,181,581. Personal services are 58% expended
with 50% of payrolls complete. Personal services expended as of January 2018 were $122,942 higher than January 2017.
Operations are 49% expended with 50% of the budget year lapsed. Operation expenses as of January 2018 were $15,108
higher than January 2017. Overall, Main Lab total expenditures were $154,151 higher than the same period last year. With
50% of the budget year lapsed, 53% of the budget is expended.
BUDGET TO ACTUAL EXPENSE
COMPARISON REPORT
At fiscal year end, invoices for June expenses are received in July. Although the invoices are received in July, they are
appropriately recorded in June of the prior fiscal year. Subsequently, however, invoices are recorded in the month they are
received and approved. For example, July's expenses are recorded in August when the invoices are due to be paid. This leads to
expenditures being recorded in the month following the date the expense had occurred. Due to the lag in recording expenses, it
may appear that expensese double in June. This is because May and June's expenses are both recorded in June.
During the 2017 legislative session, legislation was passed which created a proprietary fund for the Diagnostic Laboratory fees.
To compare the current year to prior year, Fund 02427 Animal Health Lab Fees expenses are similar to the 06026 Diagnostic
Laboratory Fees.
Under direction of the Budget Director, the Department submitted a plan to reduce General Fund programs by 10%. The
reduction is established by 17‐7‐140, MCA. The amount general fund reduced from the diagnostic laboratory budget is
$70,577. This includes the milk laboratory reduction requirement.
22

DIVISION: DIAGNOSTIC LABORATORY
PROGRAM: MILK LABORATORY
FY 2018
Year‐to‐Date
Actual
Expenses
January
Same Period
Prior Year
Actual
Expenses
January Year to Year
Balance of
BudgetBudget FY 2018 FY 2017 Comparison Available
BUDGETED FTE 1.50
HOUSE BILL 2 AND PAYPLAN APPROPRIATED EXPENDITURES
61000 PERSONAL SERVICES
61100 SALARIES 72,791$ 44,299$ 26,923$ 17,376$ 28,492$
61400 BENEFITS 36,506 20,545 11,216 9,329 15,961
TOTAL PERSONAL SERVICES 109,297 64,844 38,139 26,705 44,453
62000 OPERATIONS
62100 CONTRACT 5,056 3,828 4,504 (676) 1,228
62200 SUPPLY 23,964 16,693 19,752 (3,059) 7,271
62300 COMMUNICATION 510 33 490 (457) 477
62400 TRAVEL 1,633 75 73 2 1,558
62500 RENT ‐ ‐ ‐ ‐ ‐
62600 UTILITIES 3,289 2,128 2,574 (446) 1,161
62700 REPAIR & MAINT 7,190 8,199 6,331 1,868 (1,009)
62800 OTHER EXPENSES 7,511 5,662 5,216 446 1,849
TOTAL OPERATIONS 49,153 36,618 38,940 (2,322) 12,535
TOTAL 158,450$ 101,462$ 77,079$ 24,383$ 56,988$
BUDGETED FUNDS
01100 GENERAL FUND 158,450$ 101,462$ 77,079$ 24,383$ 56,988$
TOTAL BUDGETED FUNDS 158,450$ 101,462$ 77,079$ 24,383$ 56,988$
MONTANA DEPARTMENT OF LIVESTOCK
BUDGETARY EXPENSE COMPARISON REPORT
JANUARY 31, 2018
In FY 2017, the Milk Laboratory budget is $158,450, and has 1.50 FTE funded with general fund. Personal services budget is
59% expended with 50% of payrolls complete. Personal services expended as of January 2018 was $26,705 higher than
January 2017. Operations are 74% expended with 50% of the budget year lapsed. Operation expenses as of January 2018
were $2,322 lower than January 2017. Overall, milk lab total expenditures were $24,383 higher than the same period last
year. The total milk lab budget is 64% expended with % of the budget year complete. Although the Milk Lab is over‐budget,
it is combined with the Diagnostic Laboratory for final budgetary analysis. In FY 2017, it was deemed appropriate that the
Milk Laboratory was charged for it's portion of utilities and recharges. While this increases the Milk Lab's expenses, it
decreased the Diagnostic Lab's expenses by equal amount. These expenses were not in the Milk Lab's budget.
BUDGET TO ACTUAL EXPENSE
COMPARISON REPORT
At fiscal year end, invoices for June expenses are received in July. Although the invoices are received in July, they are
appropriately recorded in June of the prior fiscal year. Subsequently, however, invoices are recorded in the month they are
received and approved. For example, July's expenses are recorded in August when the invoices are due to be paid. This leads
to expenditures being recorded in the month following the date the expense had occurred. Due to the lag in recording
expenses, it may appear that expensese double in June. This is because May and June's expenses are both recorded in June.
23

DIVISION: MILK & EGG INSPECTION BUREAU
PROGRAM: MILK AND EGG INSPECTION
FY 2018
Year‐to‐Date
Actual
Expenses
January
Same Period
Prior Year
Actual
Expenses
January Year to Year
Balance of
BudgetBudget FY 2018 FY 2017 Comparison Available
BUDGETED FTE 4.75
HOUSE BILL 2 AND PAYPLAN APPROPRIATED EXPENDITURES
61000 PERSONAL SERVICES
61100 SALARIES 211,609$ 103,634$ 90,879$ 12,755$ 107,975$
61400 BENEFITS 90,690 41,992 39,539 2,453 48,698
TOTAL PERSONAL SERVICES 302,299 145,626 130,418 15,208 156,673
62000 OPERATIONS
62100 CONTRACT 7,582 3,311 2,939 372 4,271
62200 SUPPLY 9,389 1,543 4,533 (2,990) 7,846
62300 COMMUNICATION 7,795 2,172 2,892 (720) 5,623
62400 TRAVEL 20,044 5,743 5,670 73 14,301
62500 RENT 5,517 2,210 2,117 93 3,307
62700 REPAIR & MAINT 2,820 246 1,825 (1,579) 2,574
62800 OTHER EXPENSES 13,258 6,569 4,622 1,947 6,689
TOTAL OPERATIONS 66,405 21,794 24,598 (2,804) 44,611
TOTAL 368,704$ 167,420$ 155,016$ 12,404$ 201,284$
BUDGETED FUNDS
02701 MILK INSPECTION FEES 347,704$ 157,466$ 144,856$ 12,610$ 190,238
03032‐2 SHELL EGG FEDERAL INSPECTION FEE 21,000 9,954 10,160 (206) 11,046
TOTAL BUDGET FUNDING 368,704$ 167,420$ 155,016$ 12,404$ 201,284$
BUDGET TO ACTUAL EXPENSE
COMPARISON REPORT
MONTANA DEPARTMENT OF LIVESTOCK
BUDGETARY EXPENSE COMPARISON REPORT
JANUARY 31, 2018
At fiscal year end, invoices for June expenses are received in July. Although the invoices are received in July, they are
appropriately recorded in June of the prior fiscal year. Subsequently, however, invoices are recorded in the month they
are received and approved. For example, July's expenses are recorded in August when the invoices are due to be paid.
This leads to expenditures being recorded in the month following the date the expense had occurred. Due to the lag in
recording expenses, it may appear that expensese double in June. This is because May and June's expenses are both
recorded in June.
In FY 2017, the Milk and Egg Inspection program is budgeted $368,704 with 4.75 FTE. It is mainly funded with Milk
Inspection Fees of $347,704 and Shell Egg Federal Inspection Fees of $21,000. The personal services budget is 48%
expended with % of payrolls complete. Personal services expended as of January 2018 was $15,208 higher than January
2017. Operations are 33% expended with 50% of the budget year lapsed. Overall, operation expenses as of January
2018 were $2,804 lower than January 2017. Total Milk Inspection expenditures were $12,404 higher than the same period
last year. With 50% of the budget year lapsed, 45% of the budget is expended.
24

DIVISION: MILK & EGG INSPECTION BUREAU
PROGRAM: SHIELDED EGG GRADING PROGRAM
FY 2018
Year‐to‐Date
Actual
Expenses
January
Same Period
Prior Year
Actual Expenses
January Year to Year
Balance of
BudgetBudget FY 2018 FY 2017 Comparison Available
BUDGETED FTE 2.50
HOUSE BILL 2 AND PAYPLAN APPROPRIATED EXPENDITURES
61000 PERSONAL SERVICES
61100 SALARIES 144,319$ 36,847$ 38,665$ (1,818)$ 107,472$
61102 OVERTIME 2,771 1,616 1,376 240 1,155
61400 BENEFITS 60,885 15,453 16,644 (1,191) 45,432
TOTAL PERSONAL SERVICES 207,975 53,916 56,685 (2,769) 154,059
62000 OPERATIONS
62100 CONTRACT 128,683 15,086 12,646 2,440 113,597
62200 SUPPLY 3,237 121 217 (96) 3,116
62800 OTHER EXPENSES 4,278 1,117 340 777 3,161
TOTAL OPERATIONS 136,198 16,324 13,203 3,121 119,874
TOTAL 344,173$ 70,240$ 69,888$ 352$ 273,933$
BUDGETED FUNDS
02262 SHIELDED EGG GRADING FEES 344,173$ 70,240$ 69,888$ 352$ 273,933$
TOTAL BUDGET FUNDING 344,173$ 70,240$ 69,888$ 352$ 273,933$
MONTANA DEPARTMENT OF LIVESTOCK
BUDGETARY EXPENSE COMPARISON REPORT
JANUARY 31, 2018
The Shielded Egg Grading Program is budgeted $344,173 with 2.50 FTE in FY 2016 funded with Egg Grading fees. Personal
services budget is 26% expended with 50% of payrolls complete. Personal services expended as of January 2018 was
$2,769 lower than January 2017. Operations are 12% expended with 50% of the budget year lapsed. Operation expenses
as of January 2018 were $3,121 higher than January 2017. Overall, the Egg Grading program total expenditures were $352
higher than the same period last year with 20% of the budget expended.
BUDGET TO ACTUAL EXPENSE
COMPARISON REPORT
At fiscal year end, invoices for June expenses are received in July. Although the invoices are received in July, they are
appropriately recorded in June of the prior fiscal year. Subsequently, however, invoices are recorded in the month they
are received and approved. For example, July's expenses are recorded in August when the invoices are due to be paid.
This leads to expenditures being recorded in the month following the date the expense had occurred. Due to the lag in
recording expenses, it may appear that expensese double in June. This is because May and June's expenses are both
recorded in June.
25

DIVISION: MEAT & POULTRY INSPECTION PROGRAM
PROGRAM: MEAT INSPECTION
FY 2018
Year‐to‐Date
Actual
Expenses
January
Same Period
Prior Year
Actual
Expenses
January Year to Year
Balance of
BudgetBudget FY 2018 FY 2017 Comparison Available
BUDGETED FTE 24.50
HOUSE BILL 2 AND PAYPLAN APPROPRIATED EXPENDITURES
61000 PERSONAL SERVICES
61100 SALARIES 802,212$ 490,091$ 450,278$ 39,813$ 312,121$
61102 OVERTIME 16,643 20,970 2,243 18,727 (4,327)
61400 BENEFITS 416,890 240,698 227,089 13,609 176,192
TOTAL PERSONAL SERVICES 1,235,745 751,759 679,610 72,149 483,986
62000 OPERATIONS
62100 CONTRACT 41,291 27,997 21,943 6,054 13,294
62200 SUPPLY 11,062 3,590 6,002 (2,412) 7,472
62300 COMMUNICATION 16,911 9,017 6,012 3,005 7,894
62400 TRAVEL 38,700 22,663 21,651 1,012 16,037
62500 RENT 116,598 79,746 47,924 31,822 36,852
62700 REPAIR & MAINT 12,547 2,021 2,247 (226) 10,526
62800 OTHER EXPENSES 277,747 146,282 90,217 56,065 131,465
TOTAL OPERATIONS 514,856 291,316 195,996 95,320 223,540
TOTAL EXPENDITURES 1,750,601$ 1,043,075$ 875,606$ 167,469$ 707,526$
BUDGETED FUNDS
01100 GENDERAL FUND 825,614$ 602,314$ 452,333$ 149,981$ 223,300$
02427 ANIMAL HEALTH FEES 5,718 ‐ ‐ ‐ 5,718
03209 MEAT & POULTRY INSPECTION FEES 919,269 440,761 423,273 17,488 478,508
TOTAL BUDGET FUNDING 1,750,601$ 1,043,075$ 875,606$ 167,469$ 707,526$
Under direction of the Budget Director, the Department submitted a plan to reduce General Fund programs by 10%. The
reduction is established by 17‐7‐140, MCA. The amount of the reduction for the Meat and Poultry Inspection program is
$91,735. This could affect the 50‐50 federal matching program and cause a reduction of a similar amount of federal
funds. The federal fund matching reduction is not shown in the adjusted budget shown above.At fiscal year end, invoices for June expenses are received in July. Although the invoices are received in July, they are
appropriately recorded in June of the prior fiscal year. Subsequently, however, invoices are recorded in the month they
are received and approved. For example, July's expenses are recorded in August when the invoices are due to be paid.
This leads to expenditures being recorded in the month following the date the expense had occurred. Due to the lag in
recording expenses, it may appear that expensese double in June. This is because May and June's expenses are both
recorded in June.
In FY 2018, Meat Inspection is budgeted $1,750,601 with 24.50 FTE. The bureau is funded with genderal fund of
$825,614, Meat & Poultry Inspection Fees of $919,269 and $5,718 animal health fees levied from licensing as per 81‐9‐
201(1)MCA. Personal services budget is 61% expended with 50% of payrolls complete. Personal services expended as
of January 2018 was $72,149 higher than January 2017. Operations are 57% expended with 50% of the budget year
lapsed. Operation expenses as of January 2018 were $95,320 higher than January 2017. The increase in contract
services was for tort liability insurance which was paid to the Department of Administration. Overall, Meat Inspection
total expenditures were $167,469 higher than the same period last year with 60% of the budget expended. The total
budget is 60% expended with 50% of the budget year lapsed.
Other expenses are $40,000 lower than the prior year. Indirect costs that the Department charges FSIS have not been
recognized and recorded as of September 30, 2017. The Department files quarterly reports with FSIS and will record the
expense at that time. Indirect costs will be relatively similar to the prior year.
MONTANA DEPARTMENT OF LIVESTOCK
BUDGETARY EXPENSE COMPARISON REPORT
JANUARY 31, 2018
BUDGET TO ACTUAL EXPENSE
COMPARISON REPORT
26
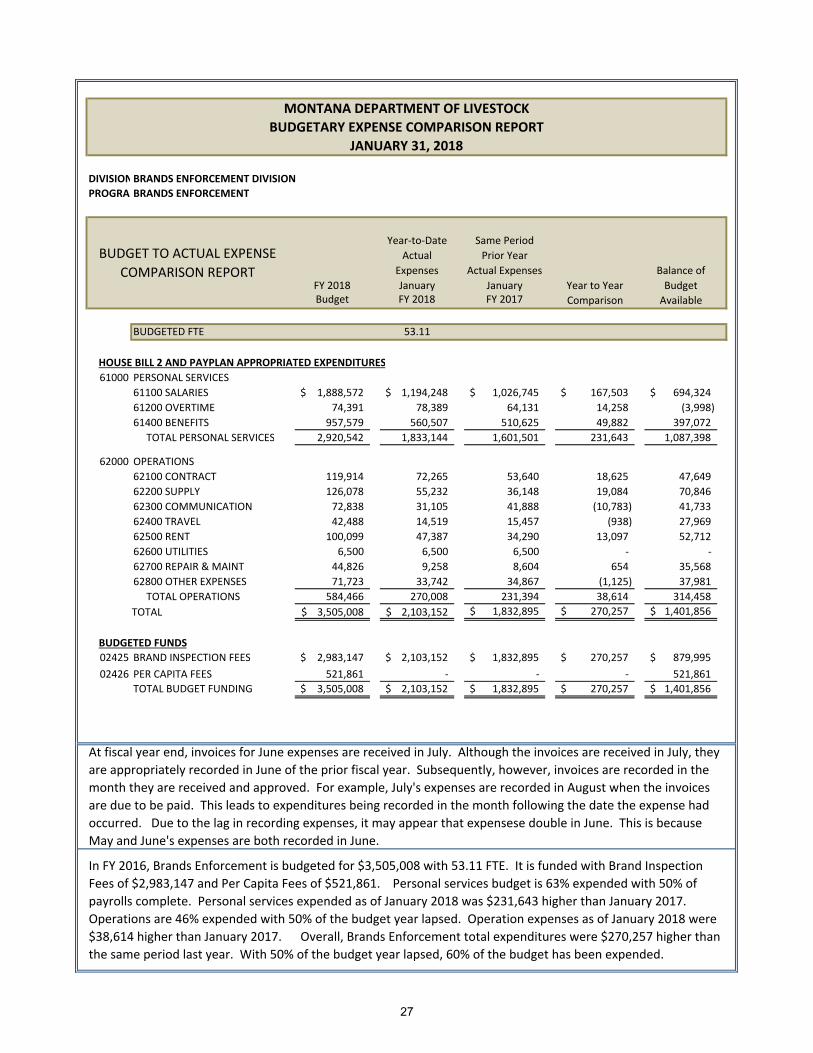
DIVISIONBRANDS ENFORCEMENT DIVISION
PROGRAMBRANDS ENFORCEMENT
FY 2018
Year‐to‐Date
Actual
Expenses
January
Same Period
Prior Year
Actual Expenses
January Year to Year
Balance of
BudgetBudget FY 2018 FY 2017 Comparison Available
BUDGETED FTE 53.11
HOUSE BILL 2 AND PAYPLAN APPROPRIATED EXPENDITURES
61000 PERSONAL SERVICES
61100 SALARIES 1,888,572$ 1,194,248$ 1,026,745$ 167,503$ 694,324$
61200 OVERTIME 74,391 78,389 64,131 14,258 (3,998)
61400 BENEFITS 957,579 560,507 510,625 49,882 397,072
TOTAL PERSONAL SERVICES 2,920,542 1,833,144 1,601,501 231,643 1,087,398
62000 OPERATIONS
62100 CONTRACT 119,914 72,265 53,640 18,625 47,649
62200 SUPPLY 126,078 55,232 36,148 19,084 70,846
62300 COMMUNICATION 72,838 31,105 41,888 (10,783) 41,733
62400 TRAVEL 42,488 14,519 15,457 (938) 27,969
62500 RENT 100,099 47,387 34,290 13,097 52,712
62600 UTILITIES 6,500 6,500 6,500 ‐ ‐
62700 REPAIR & MAINT 44,826 9,258 8,604 654 35,568
62800 OTHER EXPENSES 71,723 33,742 34,867 (1,125) 37,981
TOTAL OPERATIONS 584,466 270,008 231,394 38,614 314,458
TOTAL 3,505,008$ 2,103,152$ 1,832,895$ 270,257$ 1,401,856$
BUDGETED FUNDS
02425 BRAND INSPECTION FEES 2,983,147$ 2,103,152$ 1,832,895$ 270,257$ 879,995$
02426 PER CAPITA FEES 521,861 ‐ ‐ ‐ 521,861
TOTAL BUDGET FUNDING 3,505,008$ 2,103,152$ 1,832,895$ 270,257$ 1,401,856$
MONTANA DEPARTMENT OF LIVESTOCK
BUDGETARY EXPENSE COMPARISON REPORT
In FY 2016, Brands Enforcement is budgeted for $3,505,008 with 53.11 FTE. It is funded with Brand Inspection
Fees of $2,983,147 and Per Capita Fees of $521,861. Personal services budget is 63% expended with 50% of
payrolls complete. Personal services expended as of January 2018 was $231,643 higher than January 2017.
Operations are 46% expended with 50% of the budget year lapsed. Operation expenses as of January 2018 were
$38,614 higher than January 2017. Overall, Brands Enforcement total expenditures were $270,257 higher than
the same period last year. With 50% of the budget year lapsed, 60% of the budget has been expended.
At fiscal year end, invoices for June expenses are received in July. Although the invoices are received in July, they
are appropriately recorded in June of the prior fiscal year. Subsequently, however, invoices are recorded in the
month they are received and approved. For example, July's expenses are recorded in August when the invoices
are due to be paid. This leads to expenditures being recorded in the month following the date the expense had
occurred. Due to the lag in recording expenses, it may appear that expensese double in June. This is because
May and June's expenses are both recorded in June.
BUDGET TO ACTUAL EXPENSE
COMPARISON REPORT
JANUARY 31, 2018
27

FY 2017 as of January 31,
2017
FY 2018 as of January 31,
2018
Difference January 31,
FY17 & FY18
Budgeted Revenue FY 2018
Fund Description
New Brands & Transfers 129,710$ 138,655$ 8,945$ 250,455$ Re‐Recorded Brands 271,079 271,078 (1) 464,705 Security Interest Filing Fee 11,824 44,309 32,485 45,253 Livestock Dealers License 12,719 27,288 14,569 76,764 Local Inspections 185,605 167,426 (18,179) 333,338 Market Inspection Fees 969,902 1,125,088 155,186 1,671,659 Investment Earnings 11,996 23,322 11,326 29,638 Other Revenues 39,338 79,915 40,577 104,453
1,632,173$ 1,877,081$ 244,908$ 2,976,265$
Livestock Taxes ‐ Per Capita Fees 4,813,213$ 4,970,336$ 157,123$ 4,809,627$ Non Federal Indirect Cost Recovery 72,099 94,528 22,429 154,000 Federal Indirect Cost Recovery 70,271 84,852 14,581 146,400 Investment Earnings 19,113 44,522 25,409 25,000 Other Revenues 1,176 565 (611) 4,000
4,975,872$ 5,199,053$ 218,931$ 5,139,027$
Books 4,670$ 5,133$ 463$ 8,600$ Animal Health Licenses & Permits 225 7,363 7,138 8,300 Other Revenues 14,936 7,517 (7,419) 1,000
Total Animal Health Revenue 19,831$ 20,013$ 182$ 17,900$
Inspectors Assessment 217,334$ 221,564$ 4,230$ 347,704$ Total Milk Inspection 217,334$ 221,564$ 4,230$ 347,704$
06026 Diagnostic Lab Fees (FY 2017 amount is from Fund 02427)Lab Fees -$ 505,396$ 505,396$ 1,181,581$ Other Revenues 388 1,592 1,204 17,317$ Lab Fees (Fund 02427) 474,310 - (474,310) -
474,698$ 506,988$ 32,290$ 1,181,581$
Combined State Special Revenue Total 7,319,908$ 7,824,699$ 500,541$ 9,662,477$
Total Per Capita Fee Revenue
02427 Animal Health
02701 Milk Inspection
Security interest filing fees revenue is significantly higher than the same period FY 2017. This was due to re-evaluating the unearned revenue in FY 2017 and adusting the balance.
Laboratory fee revenue is recorded in the month that statements are mailed to customers. This leads to revenues being recorded in the financial statements a month after they are earned. Accordingly, the revenue for laboratory fees in the amount of $505,396 are for the period ending November 2017. At fiscal year end, however, revenues earned in June will be recorded in FY 2017.
02426 Per Capita Fee
02425 Brands
Total Brands Division Revenue
DEPARTMENT OF LIVESTOCKSTATE SPECIAL REVENUE COMPARISON FY 2018
28

Total Per Capita Fee reported 3,179,851$
Amount Paid 1,405,710
Amount Due 1,774,141$
Rate Count PCF
Cattle 2.29 1,257,817 2,880,401$
Horses 5.85 25,770 150,755
Sheep & Goats 0.54 76,040 41,062
Swine 0.78 34,019 26,535
Poultry 0.05 422,118 21,106
Bees 0.41 13,208 5,415
Llamas 9.73 491 4,777
Bison 6.38 6,293 40,149
Domestic Ungulates 26.33 337 8,873
Ratites 9.73 80 778 1,836,173 3,179,851$
The total number of reporting forms received for the 2017 reporting
period was 18,495. Total PCF receivable was $4,933,723. The
Department projects an additional 8,800 reporting forms to be
submitted for the current reporting period.
MONTANA DEPARTMENT OF LIVESTOCK
PER CAPITA FEE REPORTING AND COLLECTIONS REPORT
FEBRUARY 15, 2018
Per Capita Fee by Livestock Class
Approximately 9,620 livestock owners have submitted livestock
reporting forms. The total per capita fee reported is $3,179,851.
Livestock owners have paid $1,405,710 as of February 15, 2018.
The reports are due March 1, 2018 and the Per Capita Fee payments
are due May 31, 2018
29

Board of Livestock Meeting Agenda Request Form
From: Tahnee Szymanski
Division/Program: Animal Health Bureau
Meeting Date: February 21, 2018
Agenda Item: Update on Preparation for 3-Day Functional FMD Exercise (May 8-10, 2018) Background Info: The Animal Health Bureau is preparing for a 3-day functional Foot and Mouth Disease (FMD) exercise. The exercise will occur May 8-10, 2018 in real-time. The goal of participating in this exercise is to evaluate our current preparedness efforts and to identify systemic gaps in our program in order to improve emergency preparedness planning. To prepare for the upcoming exercise, AHB is working to complete certain recommended activities ahead of the exercise date. The AHB has previously reported on three table top exercises conducted in preparation for this event. The exercises focused on establishment of an Incident Command System (ICS), resource management, unified command, and requesting a National Incident Management Team. February 6-7, 2018 Dr. Szymanski, Liska, and Kaleczyc attended a two-day, ICS 300 level training hosted by Montana DES. The training focused on how to use ICS during an expanding incident, how to implement the planning process detailed by ICS, and how to use ICS to establish a unified command and manage resources. ICS 300 training is a prerequisite for other, more advanced ICS trainings. An important lesson learned from the ICS 300 course is that Montana will need to rely extensively on other state or federal agencies with experience using ICS to fully staff the positions required to respond to a large-scale animal disease outbreak. There is a need to identify potential partner agencies pre-event and to develop MOUs allowing MDOL access to the necessary personnel. Those personnel from other state agencies should also receive training in the specific, unique, characteristics of an animal disease response. Additionally, there is a need to identify MDOL personnel who should be familiar with ICS and acquire the appropriate training for those individuals. Additional preparation includes:
• February 20-21 – ICS 400, hosted by MT DES in Helena • April 26 – National Veterinary Stockpile (NVS) table top, working with national NVS team to host the
exercise and validate the MT NVS Plan Recommendation: NA Time needed: 10 minutes Attachments: Yes Board vote required? No Agenda Item: Import Office Overview Background Info: The Animal Health Import Office is comprised of the following personnel:
• Manager • Three full time permanent employees • One part-time permanent employee • One part-time modified employee
The primary function of the import office is the issuance of import permits for animals entering Montana. MCA 81-2-703 requires that all animals, animal semen, and animal biologics imported into Montana have a certificate of veterinary inspection (CVI) and an import permit. CVI import and export data is compiled into USAHerds by import staff. This data is the basis of our state traceability program. Additionally, import office staff administer several disease programs and permits that facilitate the movement of animals and animal products. Examples of these programs include:
• Annual permits for poultry, horses, and semen • Brucella ovis Flock certification program • Alternative Livestock program
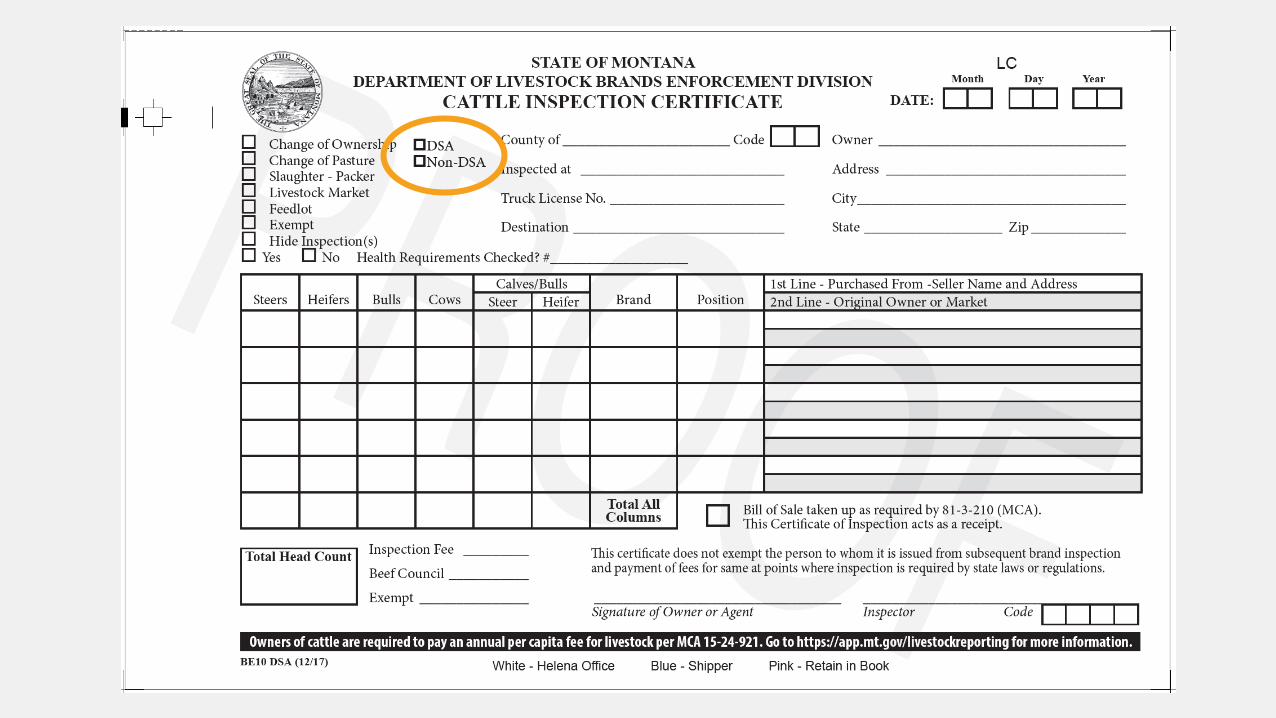


IMPORT OFFICE
Animal Health Bureau

2017 TOTAL CVIs EXPORT IMPORT TOTAL 20,802 14,943 35,745
2017 TOTAL CALLS IMPORT PERMIT LINE STATE VETERINARIAN LINE TOTAL 15,157 9004 24,161

PROGRAMS:
• Annual Permits:
• Equine
• Semen
• Poultry
• Blanket Permits
• Brucella ovis Flock certification
• Alternative Livestock
• Six Month Horse Passports
• Biologics
• Seasonal Grazers
• Import Quarantines
• Disease Quarantines
• Veterinary Accreditation
• Approved tagging sites, bull studs, and
trich approved feedlot

ADMINISTRATIVE:
• Processing MT origin CVIs
• Data entry of export CVI data
• CVI compliance
• No permit letters
• Missing CVIs
• Supplies
• CVI books, forms, tags, tuberculin, seals
• Administrative Rules
• USAHerds Annual Contract
• Monthly and annual reporting
• Records management
• Mail processing

PERSONNEL
Manager
2 FTELicense Permit Technicians
1 FTE Compliance
Specialist
0.5 FTE Program Specialist
0.5 FTE Compliance
Aide

Incident Commander:Assistant State Veterinarian
Public Information Officer:Department of Agriculture PIO
Liaison Officer:DOL Emergency Planner
Safety Officer:DOL Brands Enforcement/HAZMAT/DOLI
Finance/Administration Section Chief:DOL CSD/other state resource/USDA regional
Logistics Section Chief:Type I experienced person, coordinate with DES/PPQ
Operations Section Chief:DOL/VS MT/PPQ
Plans Section Chief:Coordinate with DES to request
Time Unit Leader:
Cost Unit Leader:
Procurement Unit Leader:DES to coordinate state type III teams to start (96 hrs)/follow up with USDA
Service Branch Director:DES
Communications Unit Leader:DES
Dispatch Manager:DES
Communications Manager:DES
Food Unit Leader:DES
Medical Unit Leader:DPHHS, look into MT state law about prophylactic use of anitvirals
Medically Qualified Person:State Medical Officer
Support Branch Director:USDA/DOL
Ordering Manager:DES
3D Contractor Task Force:VS MT Demobilization Unit Leader:
Coordinate with DES/PPQ
Resources Unit Leader:DESNVS Mobile Logistics
Team:VS MTSupply Unit Leader
(Warehouse Manager):Commodities Warehouse Manager
Receiving and Distribution Manager:Commodities Warehouse Staff
Ground Support Unit Leader:DOL Brands Enforcement
Facilities Unit Leader:DES
Drivers and Equipment: DOL Brands Enforcement
Security Manager:DES/MATIC/Brands Enforcement
Facilities Maintenance Specialist:Commodities Warehouse Staff
Warehouse Facility Liaison:Commodities Staff
DOL Personnel
DES to supply or coordinate
Other state agency personnel
USDA or VS MT personnel

Time needed: 15 minutes Attachments: Yes Board vote required: No
Time needed: Attachments: Board vote required? Agenda Item: Background Info: Recommendation: Time needed: Attachments: Yes No Board vote required Yes No Agenda Item: Background Info: Recommendation: Time needed: Attachments: Yes No Board vote required: Yes No
Agenda Item: Background Info: Recommendation: Time needed: Attachments: Yes No Board vote required: Yes No
Agenda Item:
Background Info: Recommendation: Time needed: Attachments: Yes No Board vote required: Yes No
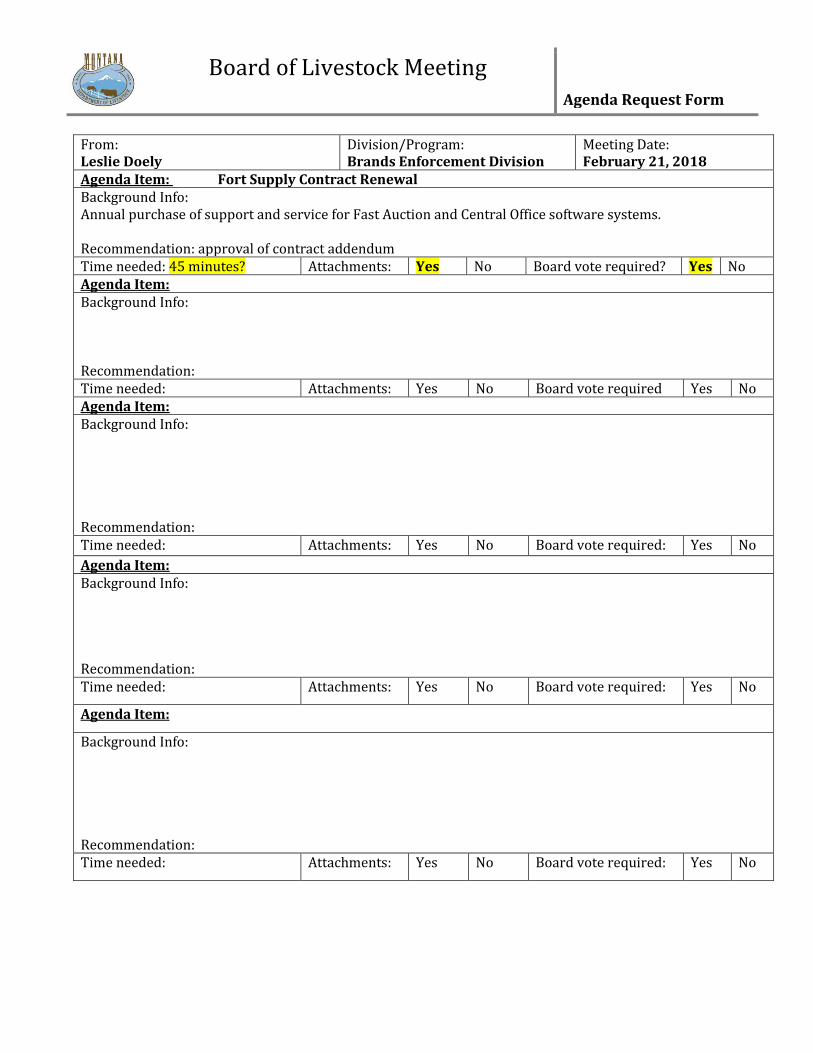
Board of Livestock Meeting Agenda Request Form
From: Leslie Doely
Division/Program: Brands Enforcement Division
Meeting Date: February 21, 2018
Agenda Item: Fort Supply Contract Renewal Background Info: Annual purchase of support and service for Fast Auction and Central Office software systems. Recommendation: approval of contract addendum Time needed: 45 minutes? Attachments: Yes No Board vote required? Yes No Agenda Item: Background Info: Recommendation: Time needed: Attachments: Yes No Board vote required Yes No Agenda Item: Background Info: Recommendation: Time needed: Attachments: Yes No Board vote required: Yes No
Agenda Item: Background Info: Recommendation: Time needed: Attachments: Yes No Board vote required: Yes No
Agenda Item:
Background Info: Recommendation: Time needed: Attachments: Yes No Board vote required: Yes No

1
CONTRACT AMENDMENT NO. 5 CONTRACT FOR
LIVESTOCK IDENTIFICATION SYSTEM (LIS) CONTRACT # LIV‐12‐BE1201
This CONTRACT AMENDMENT is to amend the above‐referenced contract between the State of Montana,
Department of Livestock (STATE), whose address and phone number are 301 North Roberts, Helena MT, 406‐
444‐7323 and Fort Supply Technologies (CONTRACTOR), whose address and phone number are 1773 W. 200 N.,
Kaysville UT, 888‐650‐6446. This Contract is amended for the following purpose(s):
To continue extended service and support for desktop and hand‐held systems installed in thirteen livestock
markets and one central office in Montana.
1 EFFECTIVE DATE, DURATION, AND RENEWAL
1.1 Contract Term. This contract shall take effect on April 1, 2018, and terminate on March 31, 2019,
unless terminated earlier in accordance with the terms of this contract.
2 SCOPE OF WORK, SERVICES AND/OR SUPPLIES
The State requires the use of a knowledgeable professional employed by the Contractor for the maintenance
and support of the LIS. Contractor agrees to perform the following:
2.1 Support Hours: a. Hours are rounded to the nearest half‐hour with a minimum half‐hour charge per activity. b. All hours will be logged and tracked by the Contractor. c. Contractor shall not accrue State of Montana leave, retirement, or insurance benefits as a
result of this agreement. d. There is no State compensation for travel, lodging, vehicle use or per diem. e. Standard Service Hours: The Contractor shall be compensated at a rate of $110.00 per hour
for 170 standard service hours. i. Standard service hours may be used for user support, software enhancements/
modifications. ii. Upon renewal of this contract, unused hours, not to exceed 50 standard service
hours, will roll over into the next contract year. f. After‐Hours User Support: The Contractor shall be compensated at a rate of $150.00 per
hour for 25 service hours outside regular business hours of 8:00 AM to 5:00 PM Monday through Friday.
i. After‐hours user support hours may be used for user support when requested by the State.
ii. Upon renewal of this contract, unused hours, not to exceed 10 after‐hours support hours, will roll over into the next contract year.
2.2 Mobi Control a. Mobi Control service for 25 devices at a rate of $92 per device is included for this contract
year for a total cost of $2,300. 2.3 Service Level Agreement
a. Upon completion or resolution of a service request, Contractor shall provide an explanation of services and/or how the issue(s) were resolved.
b. The Contractor shall notify the State’s Liaison: i. Prior to updating or modifying the State’s systems, ii. Prior to updating or modifying other software that could potentially affect the
State’s systems. c. The Contractor shall send the State’s Liaison a monthly report summarizing Standard Service
and After‐Hours Support. The report shall be sent by the 5th of the following month and

2
include the total After‐Hours and Standard Service hours for the month and the balance of remaining hours.
3 CONSIDERATION/PAYMENT 3.1 Payment Schedule. Payment will be made in full ($xx,xxx) at time of signing this addendum
a. Standard Service Hours: $xx,xxx i. Quantity: xxx hours ii. Rate: $110/hour
b. After Hours Support: $x,xxx i. Quantity: xx ii. Rate: $150/hour
c. Mobi Control: $2,300 3.2 Purchase of Additional Support: If all service hours in the contract are exhausted, additional hours
may be purchased at the rates specified in the contract. Additional hours should be logged on the
shared document and invoiced monthly.
4 OWNERSHIP AND USE OF INFORMATION
4.1 Data collected by the State using the Contractor’s software is owned exclusively by the State. Data
may not be used by the Contractor or any third party for marketing or business development, and
may not be sold or distributed to any third party.
5 WARRANTIES
5.1 Warranty for Hardware section 22.3 of the original contract is void for all hardware purchased under
previous contracts.
6 LIAISON AND SERVICE OF NOTICES
All project management and coordination on behalf of the State shall be through a single point of contact
designated as the State’s liaison. Contractor shall designate a liaison that includes a primary point of contact
and at least one secondary point of contact, or multiple primary points of contact for management and
coordination of Contractor's work. All work performed pursuant to this contract shall be coordinated
between the State's liaison and the Contractor's liaison.
The State’s Liaison includes both of the following:
[email protected] (MDOL IT Team)
[email protected] (Assistant Administrator, 406‐439‐2645)
Department of Livestock
P.O. Box 202001
Helena, Montana 59620 – 2001
Phone 406‐444‐7323
__________________, will be the liaison for the Contractor.
Fort Supply Technologies
1773 W. 200 N.
Kaysville, UT 84037
Phone: ______________
___________@fort‐supply.com
Except as modified above, all other terms and conditions of Contract # LIV‐12‐BE1201 remain unchanged.

3
STATE OF MONTANA
Department of Livestock
301 North Roberts
Helena, MT 59620
FORT OF SUPPLY TECHNOLOGIES
1773 W. 200 N.
Kaysville UT, 84037
FEDERAL ID # 26‐0680929
Mike Honeycutt (Date)
Executive Officer
Malcolm Harvey (Date)
President
Approved for Content:
Evan Waters (Date)
Finance and Accounting Bureau Chief, CSD
Approved for Form:
State Procurement (Date)
Department Administration


