Board of Directors’ Responsiveness to Shareholders ......
61
08-048 Copyright © 2005-2008 by Yonca Ertimur, Fabrizio Ferri, and Stephen R. Stubben. Working papers are in draft form. This working paper is distributed for purposes of comment and discussion only. It may not be reproduced without permission of the copyright holder. Copies of working papers are available from the author. Board of Directors’ Responsiveness to Shareholders: Evidence from Shareholder Proposals Yonca Ertimur Fabrizio Ferri Stephen R. Stubben
Transcript of Board of Directors’ Responsiveness to Shareholders ......

08-048
Copyright © 2005-2008 by Yonca Ertimur, Fabrizio Ferri, and Stephen R. Stubben.
Working papers are in draft form. This working paper is distributed for purposes of comment and discussion only. It may not be reproduced without permission of the copyright holder. Copies of working papers are available from the author.
Board of Directors’ Responsiveness to Shareholders: Evidence from Shareholder Proposals Yonca Ertimur Fabrizio Ferri Stephen R. Stubben

Board of Directors’ Responsiveness to Shareholders: Evidence from Shareholder Proposals
Yonca Ertimur* Duke University
Fabrizio Ferri
Harvard Business School
Stephen R. Stubben The University of North Carolina at Chapel Hill
Abstract: Using a sample of 620 non-binding, majority-vote (MV) shareholder proposals between 1997 and 2004, we analyze the frequency, determinants and consequences of boards’ implementation decisions. The frequency of implementation has almost doubled after 2002, reaching more than 40%. Shareholder pressure (e.g. the voting outcome and the influence of the proponent) and the type of proposals are the main determinants of the implementation decision, while traditional governance indicators do not seem to matter. Outside directors implementing MV shareholder proposals experience a one-fifth reduction in the likelihood of losing their board seat and in the likelihood of losing other directorships.
* Corresponding Author: Fuqua School of Business, Duke University, 1 Towerview Drive, Durham, NC 27708, phone: (919) 660-7765, email: [email protected] We thank discussants and participants at the 2005 Center for Corporate Reporting and Governance Haskell and White Corporate Governance Seminar, the 2006 American Accounting Association Meeting, the 2006 Eastern Finance Meeting, the 2006 Financial Management Association annual meeting, the 2006 Accounting Research Symposium at Brigham Young University, the 2006 Financial Economics and Accounting Conference, the 2006 Midwest Finance Meeting, the Third Annual Conference on Corporate Governance (Washington University, St. Louis), the 2007 Management Accounting Section Meeting, the workshops at Harvard Business School and Massachusetts Institute of Technology for their comments and suggestions. We also thank Qi Chen, Paul Gompers, April Klein and David Maber. Data on shareholder lawsuits was gracefully provided by Woodruff-Sawyer & Co. All errors remain our own.

1
1. Introduction
We study boards’ responsiveness to shareholders by examining the frequency,
determinants and consequences of their decisions to implement non-binding, governance-related
shareholder proposals supported by a majority of the votes cast at the annual meeting (hereafter
MV shareholder proposals). MV shareholder proposals constitute a powerful setting to explore
boards’ responsiveness to shareholders, because they are indicative of an unresolved and clear
conflict between shareholders and boards on matters that relate to the “rules of the game.” These
proposals were opposed by the board both when submitted and when voted upon. The decision to
implement them after a majority vote (in spite of their non-binding nature) reflects a reversal in
this initial opposition.
Shareholder proposals have long been considered a weak mechanism to drive governance
reform (Black, 1990; Bebchuk, 2005). Until the late 1990s only a few proposals received a
majority vote; furthermore, even MV proposals were mostly ignored by boards, due to their non-
binding nature.1 For example, at Bristol-Myers Squibb, a proposal to declassify the board was
ignored despite obtaining a majority vote for six consecutive years (Business Week, 2002).
However, in the aftermath of Enron-type scandals, faced with an increase in the
frequency of shareholder proposals and majority votes, boards have become significantly more
responsive to shareholder resolutions. In 1997 only 31 of the 294 proposals submitted for a vote
at S&P 1500 firms received a majority vote (i.e., 10.5%) and only 5 of those 31 (16.1%) were
implemented. In contrast, in 2003, 156 of the 479 proposals voted upon won a majority vote
(32.5%) and 66 of them were implemented (42.3%).
1 For a comprehensive summary of the early evidence on the effects of shareholder proposals, see Black (1998), Gillan and Starks (1998), Karpoff (2001), Romano (2001) and Gillan and Starks (2007).

2
The emergence of MV shareholder proposals as an important driver of governance
change calls for a better understanding of the frequency, determinants and consequences of
boards’ decisions to implement these proposals. To address this question, we analyze a sample of
620 governance-related, non-binding MV shareholder proposals between 1997 and 2004.
In terms of frequency, we find that 193 of these proposals (i.e., 31.1%) were
implemented within one year from the majority vote. The rate of implementation has increased
dramatically after 2002, doubling to more than 40%. We also compute the rate of
implementation at the firm level and over the life of the proposal. We find that 50.5% of the
firms targeted by MV proposals implemented at least one MV proposal and that 50.3% of all
MV proposals were eventually implemented. Compared to the 31.1% rate at the proposal-year
level, these figures suggest a greater degree of board responsiveness.
With respect to the determinants of the implementation decision, we predict and find that
the likelihood of implementation is increasing in the degree of shareholder pressure. In
particular, we document a positive relation between the percentage of votes in favor of the
proposal and the likelihood of implementation. All else equal, a MV proposal supported by 70%
of the votes cast (3rd quartile of majority votes distribution) has a 10% higher likelihood of
implementation relative to a MV proposal supported by 55% of the votes cast (1st quartile). In
addition, proposals brought to a vote by shareholders with higher ownership or with greater
ability to exert pressure (e.g. unions and institutions) are more likely to be implemented. Finally,
there is some evidence that firms whose peers recently implemented a similar MV proposal are
more likely to follow suit. To the extent that shareholder pressure is correlated with the quality of
the proposal, our findings are also consistent with boards being more responsive to higher quality
proposals. Contrary to expectations, traditional indicators of governance (e.g. shareholder rights

3
index, board independence) and voting thresholds sometimes used as a benchmark by firms,
proxy voting services and regulators (formal approval of the proposal, support by majority of
shares outstanding) are not associated with the likelihood of implementation.
We then examine the consequences of the implementation decision for board members’
reputations. Specifically, we focus on the labor market for outside directors. We find that the
implementation of a MV shareholder proposal is associated with approximately a one-fifth
reduction in the probability of director turnover at the targeted firm. The reduction increases to
one-third for directors implementing MV proposals with 70% or higher voting support. In
addition, implementing a MV proposal is associated with approximately a one-fifth reduction in
the probability of losing directorships held in other firms, while the effect on the likelihood of
gaining additional seats in other firms is positive but insignificant.
We make several contributions. Our study is the first to examine and document a relation
between the degree of responsiveness to shareholders (as captured by the decision to implement
non-binding MV shareholder proposals) and labor market consequences for outside directors.
Thus, we contribute to the body of research on the reputation penalties for directors (e.g. Fama
and Jensen, 1983; Gilson, 1990; Harford, 2003; Coles and Hoi, 2003; Srinivasan, 2005; Fich and
Shivdasani, 2007). Most of this research focuses on firm-level, indirect evidence of board
performance (e.g. restatements, fraud, firm performance). Our unique setting allows us to
examine the effects of a direct and observable board-level action—the decision to implement
MV proposals. Hence, our evidence of economically significant effects of this decision speaks to
the degree of efficiency and sophistication of the labor market for directors.
We also contribute to the literature on shareholder activism and, more specifically, on
shareholder proposals. First, while earlier studies have examined the effect of shareholder

4
proposals on firms’ performance and governance, this is the first study to examine the effect of
boards’ responses to shareholder proposals. Second, assuming that the labor market for
directors penalizes suboptimal behavior, our finding of reputation penalties for unresponsive
directors may be viewed as indirect evidence of the optimality of MV shareholder proposals (on
average)—an important question not examined in previous research. Third, our finding of a
strong effect of the degree of voting support on the implementation decision complements recent
evidence on the growing impact of shareholder proposals on firms’ governance practices.2
Finally, our paper extends prior work on the determinants of boards’ responses to shareholder
proposals (Thomas and Cotter, 2007) by exploring the impact of a number of additional factors
of interest to practitioners and regulators—such as the history of the proposal, the behavior of
peer firms, proponents’ and activists’ ownership, key voting thresholds and board characteristics.
Our findings may also inform the current debate on whether and how to redesign the
proxy process and proxy voting rules. A controversial proposal, for example, would replace non-
binding shareholder proposals with online communications between shareholders and companies
(SEC, 2007a). More generally, by examining a clear divergence in preferences between
shareholders and boards, our study speaks to the broader issue of boards’ responsiveness and
accountability to shareholders (e.g. Bebchuk, 2003).
The paper proceeds as follows. Section 2 describes the institutional background and our
research setting. Section 3 discusses the related literature and develops our predictions. Section
4 describes the sample selection and the data used in the analysis. Section 5 presents descriptive
statistics and examines the results. Section 6 discusses the findings and concludes.
2 Guo, Kruse and Nohel (2005), Akyol and Carroll (2006) and Ferri and Sandino (2006) analyze, respectively, firms’ decision to de-classify their boards, to remove poison pills and to expense employee stock options, and find that the presence of a related shareholder proposal significantly increases the likelihood of these decisions.

5
2. Institutional Background and Research Setting
2.1 Institutional Background
Under Rule 14a-8 of the Securities Exchange Act of 1934, any shareholder continuously
holding shares worth $2,000 (or 1% of the market value of equity) for at least one year is
allowed to include one (and only one) proposal with a 500-word supporting statement in the
proxy statement distributed by a company for its annual shareholder meeting. These proposals
request a vote in favor or against a particular issue from all shareholders and must be submitted
at least 120 days before the proxy statement is mailed to shareholders prior to the company’s
annual meeting. The company may request that the SEC exclude a proposal if it violates certain
conditions.3 Alternatively, the company may persuade the proponent to withdraw the proposal
either by agreeing to it or by agreeing to other concessions. If the proposal is neither withdrawn
by the proponent nor excluded by the SEC, it will be included in the proxy statement—together
with a statement of the board explaining its opposition—and will then be voted upon at the
annual meeting by all shareholders of record as of a given date indicated in the proxy materials.
Among the bases for a proposal to be excluded, of particular relevance to our study is the
exclusion of proposals considered improper under the company’s state laws. Generally,
proposals that would be binding on the company are regarded as improper, reflecting states’
aversion to limit a board’s ability to exercise business judgment and its fiduciary role. As a
3 Rule 14a-8(i) stipulates that firms may request the exclusion of proposals that are not a proper action for shareholders under the company’s state law, proposals that address ordinary business matters, proposals that would result in the violation of state or federal laws, proposals related to a personal claim or grievance, proposals that are materially false or misleading, proposals of limited relevance (e.g., related to operations accounting for less than 5% of the company’s total assets), proposals that the company has no authority to implement, proposals related to an election for membership on the company’s board of directors, and proposals that request specific amounts of cash and stock dividends. A proposal may also be excluded if it is essentially similar to another proposal already included in the proxy, if it is already substantially implemented by the company, or if it conflicts with one of the management proposals to be submitted to shareholders at the same meeting. Finally, the company may request an exclusion of proposals already submitted in the past that received less than a certain percentage of votes in favor (3% if presented once, 6% if presented twice, 10% if presented three times). See http://www.sec.gov/interps/legal/cfslb14.htm.

6
result, almost all shareholder proposals are written in the form of a recommendation to the board
and are non-binding on the company, even if approved at the annual meeting.
2.2 Research Setting
Our overall objective is to further our understanding of the determinants and the
consequences of boards’ responsiveness to shareholders. Governance-related, majority-vote
shareholder proposals constitute a powerful setting to investigate a conflict between
shareholders’ and boards’ preferences on matters that relate to the “rules of the game”—i.e., the
balance of power between shareholders and management.4 Because these proposals are
presented well in advance of the annual meeting, boards have the opportunity to evaluate them,
discuss with management, hear from major shareholders, observe the behavior of peer
companies, and decide to either implement them (or some modified version of them) or let
shareholders vote upon them. Hence, the occurrence of the vote indicates that the board opposed
the proposal, and the decision to implement it after a majority vote reflects a reversal in this
initial opposition.5
Our focus on majority-vote proposals is a key feature of our study. Ex ante, it is not clear
whether all proposals are value-enhancing and therefore should be implemented. Presumably,
shareholders will not lend support to proposals perceived to be detrimental. By focusing on MV
proposals we are studying the board’s response to proposals that shareholders controlling a
4 Our focus on governance-related proposals distinguishes this form of activism from hedge fund activism, which typically focuses on strategic, operating and financing practices of targeted firms (Brav, Jiang, Partnoy and Thomas, Forthcoming; Becht, Franks, Mayer and Rossi, 2007; Klein and Zur, Forthcoming). Also, we do not examine shareholder proposals related to social and environmental issues because they may pursue objectives other than shareholder value maximization. Thus, it is less clear how to assess board’s responsiveness in that context. Incidentally, none of these proposals received a majority vote between 2002 and 2004 (Thomas and Cotter, 2007). 5 In our sample, there are only two cases where the board does not actively oppose a shareholder proposal and defers the decision until after the annual meeting. For example, the 2000 proxy statement of Health Net Inc., in response to a shareholder proposal to de-classify the board of directors, states: “The Board of Directors is not making a recommendation on how stockholders should vote on this Stockholder Proposal, but instead wants to receive a clear indication of how the Company’s stockholders would like it to proceed on this issue.”

7
majority of the votes cast perceive to be value-enhancing in spite of the board’s arguments to the
contrary.6 Hence, our setting captures a clear divergence in preferences between (the majority of)
shareholders and the board. The resolution of this type of conflict is at the heart of the agency
problem in publicly traded firms (Berle and Means, 1932; Jensen and Meckling, 1976).
Another potential setting to study boards’ responsiveness to shareholder activism is
represented by shareholder proposals privately negotiated with targeted firms before their
inclusion in the proxy statement or withdrawn before the vote (Carleton, Nelson, and Weisbach,
1997; Smith, 1996). The determinants of agreements between activists and targeted firms may
differ from the determinants of boards’ decisions to implement MV proposals. For example, the
board may simply agree with the merit of the proposal (and has already decided to adopt it), may
acquiesce to maintain good relations with the proponent (often a large institutional investor) or
may believe that its adoption will have limited economic effects (possibly because actions can be
taken to reduce its impact) and prefer to avoid the publicity associated with a vote. In contrast,
because MV proposals were opposed by the board both when initially presented and when voted
upon, the existence of a strong conflict between boards’ and shareholders’ preferences and the
economic relevance of the proposal to the targeted firm are less ambiguous. Hence, our setting is
particularly well suited to explore the notion of boards’ responsiveness to shareholders. 7
6 Thomas and Cotter (2007) analyze the determinants of the implementation decision in a sample of all shareholder proposals. As a result, they classify as “not implemented” even shareholder proposals receiving low voting support. Arguably, not implementing these proposals was the “correct” way to respond to shareholder preferences given that these proposals were opposed by the majority of the shareholders. Classifying all proposals failing receive a majority vote as “not implemented” may reduce the power of the tests and lead to wrong inferences about the determinants of the implementation decision. 7 As a practical matter, large sample data on private agreements between activists and targeted firms are not readily available. Hence, researchers have been forced to examine small and potentially biased samples of data made available by single activist institutions, such as TIAA-CREF (Carleton, Nelson, and Weisbach, 1997) and CalPERS (Smith, 1996).

8
3. Related Literature and Predictions
3.1 Determinants of Boards’ Decisions to Implement Majority-Vote Shareholder Proposals
We conjecture that the likelihood that a board implements a shareholder proposal after a
majority vote will depend on the degree of shareholder pressure faced by the targeted firm, its
governance structure and financial performance, the proposal type, and the time period. We
develop these predictions in more detail in the following sections.
3.1.1 Shareholder Pressure
We predict that boards are more likely to implement MV proposals when facing higher
pressure from shareholders. One way shareholder pressure manifests itself is the degree of
voting support for the proposal. Stronger voting support is likely to galvanize shareholders
supporting the proposal, resulting in a more intense campaign for its implementation, and to
attract greater press coverage, increasing the political costs from ignoring the vote. For example,
after the 2007 proxy season, the Council for Institutional Investors—a nonprofit association of
pension funds with combined assets exceeding $3 trillion—sent a series of letters to all firms
targeted by MV proposals urging for their implementation (Riskmetrics, 2008). A second factor
driving the extent of shareholder pressure is the influence of the shareholders submitting the
proposal and those voting for it. Certain shareholders, such as CalPERS, have been historically
more effective in initiating governance changes (Smith, 1996; Del Guercio and Hawkins, 1999;
Prevost and Rao, 2000; Wu, 2000; Barber, 2006). A third channel of shareholder pressure is the
voting outcome of individual directors’ election (or re-election), because of its potential effect on
directors’ standing in the labor market (Del Guercio, Wallis, and Woidtke, 2006). Finally,
another potential source of shareholder pressure is peer firms’ governance practices—often
mentioned by shareholder proponents in their supporting statement. To the extent that boards

9
perceive some costs from deviating from competitors’ practices, we expect a positive association
between implementation of the proposal and peer firms’ past adoption of a similar proposal.
An alternative reason for the predicted positive relation between shareholder pressure and
implementation decision is that boards may interpret stronger shareholder pressure—in
particular, a high and stable voting support for the proposal (see ftnt.5) or its adoption by a peer
firm—as an indication and signal of the quality of the proposal.
3.1.2 Governance Structure
In general, conditional on being targeted by a MV proposal, we would expect boards to
be more responsive to shareholders in firms with better governance structures. A number of
different firm-level mechanisms interact to determine the governance structure of corporations,
including internal (board of directors, insiders’ ownership) and external (anti-takeover measures
and the market for corporate control) monitoring mechanisms (Cremers and Nair, 2006).
With respect to the board of directors, we expect a positive relation between board
independence and the likelihood of implementation. Independent directors have a stronger
incentive to build and maintain a reputation as effective monitors in the director labor market
(Fama and Jensen, 1983). Ignoring MV proposals may lead to highly publicized no-vote
campaigns and hurt their reputation in the labor market (Del Guercio, Wallis, and Woidtke,
2006). Besides, it is conceivable that those independent directors supporting the proposal before
the vote may be able to make their position matter in the boardroom only after a majority vote.
Insiders’ ownership, if viewed as a measure of management power, would be expected to
be negatively associated with the likelihood of implementation, because insiders initially
opposed the proposal. However, if insiders view the proposal as value-creating and had opposed
it because of a trade-off with other private benefits (i.e. job retention), then, conditional on a

10
majority vote (and the subsequent shareholder pressure), higher insider ownership may be
positively related to the likelihood of implementation.
With respect to the relationship between external governance mechanisms and the
likelihood of implementation, on the one hand, we expect firms with stronger shareholder rights
(e.g. fewer takeover defenses) to be generally more responsive to their shareholders’ concerns—
if the strength of shareholder rights is viewed as a measure of responsiveness in itself. On the
other hand, the pressure to implement a proposal or its expected benefits may be lower if the firm
fares well in terms of other measures of shareholder rights.
3.1.3 Financial Characteristics, Type of Proposals, and Time Effects
Poorly performing firms face more pressure to enact governance changes. Larger firms
may face higher political costs from ignoring shareholder resolutions due to their visibility.
Hence, we expect the likelihood of implementation to be negatively associated with past firm
performance and positively associated with firm size. In terms of time effects, we expect boards’
responsiveness to be higher after 2001. In the post-Enron era, ignoring MV resolutions has likely
become more costly for both firms and individual directors. In recent years, directors failing to
implement MV proposals have often been targeted by vote-no campaigns (Del Guercio, Wallis,
and Woidtke, 2006) and received a “withhold vote” recommendation by the Institutional
Shareholder Services, the influential proxy voting service (ISS, 2006). Firms ignoring MV
proposals end up on CalPERS’ “focus list” of poor financial and governance performers
(CFO.com, 2005; CalPERS, 2007), receive lower ratings from governance services, such as The
Corporate Library, and attract negative press coverage (CFO.com, 2003; The Economist, 2002).8
8 Besides, in the post-2001 reform-oriented environment, real or perceived governance failures—such as the failure to act upon MV shareholder proposals—may strengthen the position of those supporting radical changes opposed by the corporate community. For example, in a December 2003 letter to the SEC, the Council for Institutional Investors asked the SEC to include a pattern of ignoring majority-vote shareholder resolutions among the “triggers” for

11
As for the proposal types, we make no predictions because it is difficult to rank different
proposal types without modeling explicitly costs and benefits accruing to shareholders and
boards. For example, while one may expect stronger board resistance to proposals threatening
their job security (e.g. proposals to declassify the board), shareholder pressure will also be higher
if these proposals are perceived to be the most value enhancing.
3.2 Consequences of Boards’ Decisions to Implement Majority-vote Shareholder Proposals
Fama (1980) and Fama and Jensen (1983) suggest that the labor market incentivizes
directors to develop their reputations as effective monitors. Consistent with this hypothesis,
several studies document that the directors’ labor market is generally efficient—poorly
performing directors experience higher turnover, are more likely to lose other directorships held
and less likely to be offered new seats. As a proxy for directors’ performance, these studies have
used various measures of firm performance (Gilson, 1990; Kaplan and Reishus, 1990; Farrell
and Whidbee, 2000; Harford, 2003; Yermack, 2004) or ex post evidence of poor monitoring,
such as accounting restatements (Srinivasan, 2005), allegations of fraud (Fich and Shivdasani,
2007) and the presence of vote-no campaigns (Del Guercio, Wallis, and Woidtke, 2006).
In this study, we focus instead on a specific board action as evidence of directors’
performance—the decision to implement MV shareholder proposals. If market participants
perceive MV shareholder proposals to be, on average, value-maximizing, then an efficient
directors’ labor market should reward directors’ responsiveness to these proposals. The absence
of this relation (the finding of the opposite relation) would suggest either that these proposals are
not value-creating (are value-destroying) or that the director labor market is captured by CEOs
who tend to appoint directors less likely to challenge them or to give in to shareholder pressures
providing shareholders the right to put their nominees on the ballot. The then Chairman of the SEC, W. Donaldson, reportedly embraced this idea (Reuters, 2003).

12
(Shivdasani and Yermack, 1999). To shed light on this question, we investigate whether outside
directors in firms implementing a MV proposal are more likely to retain their seat on the board
and are more (less) likely to experience gains (losses) in the number of other directorships. 9
Note that in our setting the interpretation of director labor market effects is less
ambiguous than in the context of restatements, litigation or even poor firm performance. For
example, as discussed by Srinivasan (2005) and Fich and Shivdasani (2007), observed turnover
after these events may be forced (penalty for poor monitoring) or voluntary (avoid the additional
work or limit the negative reputation effect of being associated with a troubled firm). Similarly,
the loss of other seats may be forced (penalty for poor monitoring) or voluntary (focus time and
energy on firm with more problems, reduce future exposure to litigation in other firms, etc.). In
contrast, the implementation decision seems less likely to result in voluntary resignations.
4. Sample Selection, Research Design, and Variable Description
4.1 Sample Selection
We obtain our sample from the Investor Responsibility Research Center (IRRC), which
has collected data on shareholder proposals since 1986 for all firms in the Standard & Poor’s
1500 index. The IRRC dataset contains the company name, the date of the annual meeting, the
name of the shareholder proponent, a brief description and categorization of the proposal
content, the percentage of votes cast in favor of the proposal, an indicator for whether the
proposal received a majority vote, an indicator for whether the proposal was formally approved,
and the requirement for proposal approval. The IRRC dataset defines as MV proposals those
where the votes cast in favor are higher than the votes cast against (without counting abstentions
9 An alternative approach to infer whether investors perceive such implementations, on average, to be value-creating is to test the stock price reaction around their announcement. However, based on our analysis for a subset of the sample, announcement dates appear to be rarely available.

13
or broker non-votes). However, a proposal is formally approved only if it meets the threshold
required by state laws. Thus, a MV proposal may fail to be formally approved if its approval
requires a majority (or super-majority) of all votes cast or of all shares outstanding. Our final
sample consists of 2,546 governance-related shareholder proposals over the 1997-2004 period, of
which 620 (24.4%) received a majority vote and 555 were formally approved.10
The dataset also contains a brief description of any subsequent action taken by the
company in response to the proposal, but only for the sub-sample of MV proposals.11 Using this
information as a starting point, we identify the action taken by the firm, and code as
“implemented” any MV proposal where the board takes a significant step toward a partial or full
implementation within one year from the majority vote, resulting in 193 MV proposals coded as
implemented (31.1% of all MV proposals).12
Similar to previous studies, we aggregate shareholder proposals into five major groups
based on their content: Board, Defense, Executive Compensation, Shareholder Rights, and
Others. The Board category includes proposals concerning board’s composition, directors’
10 In 38 cases, majority-vote proposals failed to pass because their approval required a majority (20 cases) or supermajority of shares outstanding (18 cases), while in the remaining 27 cases they failed to pass because either abstention votes (22) or abstention votes and broker non-votes (5 cases) were counted as votes against the proposal. 11According to IRRC, the rate of implementation of non-majority-vote proposals is negligible. To verify their claim, we identify 301 proposals that received between 30% and 50% votes in favor the last year they were put on the ballot during our sample period. Then, we select a subset of 126 proposals for which, due to their binary nature, implementation can be easily verified using the IRRC Governance dataset and proxy statements (e.g. proposals to remove poison pills, proposals to declassify the board, proposals requesting the use of confidential voting or cumulative voting, proposals requesting the right to call a special meeting or act by written consent, and proposals to expense stock options). We find only 4 cases of implementation, corresponding to a 3.2% implementation rate. In all 4 cases, the percentage of votes in favor was greater than 40%. 12 We choose the one-year horizon to increase the likelihood that the adoption of the proposal is a response to the majority vote and because the proposal may be presented again at the next annual meeting. An alternative approach is to code as “implemented” only cases where the firm explicitly links its action to the shareholder proposal in a press release (Thomas and Cotter, 2007). However, the lack of an explicit link may be due to researchers’ inability to find it or to a deliberate management choice to “hide” the causal linkage—maybe to avoid setting a precedent or creating the impression that the company gave in to shareholders. Besides, it seems unlikely that a proposal opposed up to the time of the vote a few months earlier is adopted for reasons completely unrelated to shareholder pressure. If we allow for that possibility, then it is equally plausible that managers make an explicit link in the press release only to let shareholders believe they have had an impact, while the decision is completely independent from the voting outcome of the proposal. Hence, we prefer to follow a more objective coding scheme and let the empirical analysis detect the effect of shareholder pressure in the implementation decision.

14
independence, compensation and qualifications. The Defense category includes proposals aimed
at removing anti-takeover measures, mostly poison pills and a classified board structure. The
Executive Compensation category includes proposals concerning executive compensation, such
as proposals requiring shareholder approval of severance packages, disclosure of specific
compensation items, use of certain compensation schemes (e.g. performance-based options), as
well as proposals to expense employees’ stock options or cap CEO pay. The Shareholder Rights
category includes proposals to eliminate supermajority provisions, to adopt confidential voting,
etc. Finally, “Others” includes proposals dealing with a variety of issues (e.g. prohibiting
auditors from doing non-audit work for the firm).
We also classify the proponents in five groups: Individuals, Unions (labor union funds),
Public Pension (public pension funds), Religious (religious groups funds), and Other Groups
(investment advisors, investment management firms and mutual funds).
4.2 Research Design – Determinants of the Implementation Decision
To test our hypotheses on the determinants of the implementation decision we estimate
the following Probit model for the sub-sample of MV proposals:
Probability of Implementation = f (Shareholder Pressure, Governance Structure,
Financial Characteristics, Type of Proposal, Time Effects) (1)
To account for selection bias due to the fact that the IRRC dataset only tracks the
implementation decision for MV proposals,13 we also employ a maximum likelihood Probit
model with sample selection where the first step is the Probit model (1a) described below and the
second stage is the Probit model in (1):
13 Note, however, that there is another potential source of selection bias. Similar to other studies in this area, due to data availability we only observe proposals eventually voted upon, but not proposals withdrawn before being included in the proxy statement.

15
Probability of a Majority Vote = f (Shareholder Composition, History of Proposal,
Governance Structure, Financial Characteristics, Identity of Proponent, Type of
Proposal, Time Effects) (1a)
Dependent Variable: IMPLEMENTED
The dependent variable in equation (1) is an indicator variable that equals to one if the
firm implements the proposal within one year from the majority vote, and zero otherwise.
Independent Variables
We proxy for the degree of shareholder pressure resulting from the voting outcome with
VOTES_FOR, the percentage of votes cast in favor of the proposal, and with N_MAJ_CONS, the
number of consecutive years the proposal has received a majority vote.
As a proxy for the influence of the shareholders submitting the proposal, we use an
indicator variable that equals one if the proponent owns more than 1% of the shares outstanding
(PROPONENT_OWN). Also, we construct two indicator variables for the proponent identity:
INSTIT_PROP (equal to one if the proponent is Public pensions or Other Groups and zero
otherwise) and UNION_PROP (equal to one if the proponent is Unions, and zero otherwise). As
a proxy for the influence of the shareholders who voted for the proposal we use the percentage of
shares held by activist pension funds (ACTIVIST_OWN), who are known to generally support the
type of proposals we analyze (Cremers and Nair, 2006).14
To measure the degree of shareholder pressure exerted through the votes on individual
directors up for re-election, we construct an indicator variable (VOTES_WITHHELD) that equals
14 Ideally, we would like to measure the level of ownership by institutions which voted in favor of the proposal. For a given voting outcome, we expect stronger pressure to implement the proposal if institutions with a large stake in the firm voted in favor of the proposal. Because shareholder votes are not disclosed (except for mutual funds starting in 2004), we only focus on ownership by activist pension funds, who are known to support most of the MV proposals in our dataset. In robustness tests, we also control for the total level of institutional ownership, though we do not have a directional prediction about its effect on the likelihood of implementation.

16
one if at least 20% of votes were withheld from at least one of the directors up for re-election.
Because votes withheld in vote-no campaigns average 13% (Del Guercio, Wallis, and Woidtke,
2006), we choose 20% to ensure we are capturing a significant level of dissatisfaction.
Finally, to measure the shareholder pressure which may result from peers’ practice on the
governance issue raised in the proposal, we use the variable PEER_IMPLEMENTED, an
indicator variable equal to one if at least one peer firm (i.e., firms in the S&P 1500 with the same
two-digit SIC code) has implemented a similar proposal during the prior two years.
As discussed in Section 3.1.1, some of the above variables (namely VOTES_FOR,
N_MAJ_CONS, PEER_IMPLEMENTED and, to some extent, PROPONENT_OWN) may also be
viewed by boards as a signal of the quality of the proposal and (in the case of N_MAJ_CONS)
the stability of shareholders’ preferences.15
We employ four variables to capture the governance structure of the firm. %INDEP
(percentage of directors classified as independent based on the IRRC classification) and
CEOCHAIR (an indicator variable equal to one if the firm’s CEO is also chair of the board of
directors) are intended to measure the degree of board independence and the level of CEO
influence on the board. The third variable is the percentage of equity held by insiders,
INSIDER_OWN, which proxies for the influence of management and directors relative to outside
shareholders. Finally, to capture the external governance structure of the firm, we use the
shareholder rights index, G, developed by Gompers, Ishii and Metrick (2003).
15 For example, in response to a shareholder proposal to de-classify the board, in its 2004 Proxy Statement, Baker Hughes Incorporated states, “While continuing a classified board is believed to be in the best interest of the stockholders at this time, if this proposal receives at least the same support by the stockholders of all outstanding shares at the 2004 Annual Meeting as it did in 2003, the Board intends to introduce and support a binding proposal at the 2005 Annual Meeting to amend the Company’s Restated Certificate of Incorporation in order to eliminate the provision classifying our Board.”

17
As for financial characteristics, we measure performance and size, respectively, as the
size-adjusted stock returns over the 3-year period prior to the annual meeting (ABRET3YR_PRE)
and the natural log of equity market value at the time of the annual meeting (LNSIZE).
Finally, we include two indicator variables to capture the different types of proposals,
based on the classification described in Section 4.1, DEFENSE and SHAREHOLDER RIGHTS.
Hence, the intercept in (1) captures the combined effect of Executive Compensation, Board and
Others. We collapse these three types of proposals into one category because of their low rate of
implementation. To control for the time effects we use AFTER_2001, an indicator variable equal
to one if the year of the annual meeting is 2002 or later, zero otherwise.
4.3 Research Design – Consequences of the Implementation Decision
To test our hypotheses on the consequences of the implementation decision on outside
directors’ turnover, we estimate the following logit model for the sample of non-employee
directors (as classified by IRRC):
Probability of Director Turnover = f (Implementation of MV Proposal, Controls) (2)
To test our hypotheses on the consequences of the implementation decision on the
number of other directorships held, we estimate the following OLS regression model:
Net Change in Other Directorships = f (Implementation of MV Proposal, Controls) (3)
To gain further insight into the direction of the change in other directorships, we also
estimate the following logit models:
Probability of Loss (Gain) of Other Directorships = f (Implementation of MV Proposal,
Controls) (4)
We estimate (2)-(4) at the director level and limit the sample to director-firm-year
observations where the firm had at least one MV proposal. We estimate the probability of loss of

18
other directorships for the sample of directors who hold at least one other directorship (and, thus,
can experience a decrease in the number of other directorships).
Dependent Variables: DIR_TURNOVER, CHG_N_BOARDS, SEATS_LOSS and SEATS_GAIN
The dependent variable in equation (2) above, DIR_TURNOVER, is an indicator variable
that is equal to one if the outside director of a firm receiving a MV proposal is no longer a board
member at the time of the annual meeting in the subsequent year, and zero otherwise. The
dependent variable in equation (3) above, CHG_N_BOARDS, is the net change in number of
other directorships (in S&P 1500 firms) held by an outside director of a firm receiving a MV
proposal over the year subsequent to the majority vote. The dependent variable in equation (4)
above, SEATS_LOSS (SEATS_GAIN) is an indicator variable taking the value of one if the
outside director experiences a decrease (increase) in the number of other S&P 1500 directorships
held over the year subsequent to the majority vote, and the value of zero if there is no change.
Independent Variables
Our main variable of interest in equations (2)-(4) is the indicator variable
IMPLEMENTED. Because the unit of observation is now director-firm-year (rather than
proposal-firm-year as in Section 4.2), we re-define IMPLEMENTED to be equal to one if the
firm implements at least one MV proposal in a given year and zero otherwise.
Following previous studies (e.g. Denis and Sarin, 1999; Farrell and Whidbee, 2000;
Coles and Hoi, 2003; Yermack, 2004; Del Guercio, Wallis, and Woidtke, 2006), we expect that
the probability of turnover is higher for directors close to or older than 70 years (indicator
variables AGE_65_to_69 and AGE_70), because many firms have mandatory retirement policy
around that age; directors with longer tenure (TENURE), because firms may prefer to replace
them with new members bringing a fresh perspective; affiliated directors (GRAY), more subject

19
to external pressure due to their potential conflicts of interest and various regulations introduced
over the sample period imposing tighter independence criteria; and directors in firms with worse
contemporaneous or lagged stock performance (ABRET1YR_POST and ABRET1YR_PRE),
because the negative performance may lead shareholders to request board changes or may induce
the directors themselves to resign to avoid negative reputation effects. We also expect the
probability of turnover to be lower for directors with a higher number of other directorships
(N_BOARDS, viewed as a proxy for directors’ expertise); for directors sitting on the audit,
compensation or nominating committees (AUDIT_COMM, COMP_COMM, NOM_COMM),
because their services may be more valuable to the firm and they may be closer to management;
for FEMALE directors, in view of the trend toward more diversity on boards; for directors in
larger firms (LNSIZE), because these directors are less likely to resign due to the benefits (e.g.
additional seats) associated with the visibility of a seat in a large firm; and for directors with
higher equity ownership (DIR_OWN), because they have a stronger incentive to remain and
monitor. Because CEO changes are often accompanied by board turnover, we include an
indicator variable (CEO_TURNOVER) equal to one if during the same year the CEO changes.
To account for the effect of directors’ elections and their outcomes, we include an
indicator variable, ELECTION, equal to one if the director is up for re-election in the year of the
MV proposal, and we then interact it with VOTES_WITHHELD>20%, an indicator variable
equal to one if at least 20% of the votes are withheld from that particular director. Finally, we
control for time effects through year indicator variables.
We use the same control variables in equations (3) and (4), as determinants of change in
other directorships held, except we exclude CEO_TURNOVER, DIR_OWN and the indicator
variables denoting board committees, because these variables are generally not expected to affect

20
the likelihood of losing or gaining board seats in other firms. Also, we include an indicator
variable (OFF_OWN_BOARD) equal to one for directors losing the seat at their own firm (i.e.
when DIR_TURNOVER equals one in equation (2)). Table 6, Panel B, summarizes the predicted
effect of the variables included in (3) and (4), based on prior studies.16
5. Empirical Results
5.1 Characteristics of Shareholder Proposals
5.1.1 Frequency of Proposals, Majority Votes and Implementations
Figure 1 displays a significant increase in the number of shareholder proposals, their
voting outcome, and their rate of implementation after the governance scandals of 2001-2002.
The number of proposals voted upon (top panel) jumps from about 300 (1997-2002) to more
than 400 proposals (2003-2004). The fraction of proposals receiving a majority vote (middle
panel) increases steadily over the sample period, averaging more than 30% after 2001. The
fraction of MV proposals implemented (bottom panel) averages 22% until 2002, and then spikes
to more than 40%.17 In both the middle and the bottom panels, a similar pattern emerges if we
focus on formal approvals rather than majority votes.
Figure 2 highlights the differences in the frequency and outcome of shareholder proposals
across proposal types. Over the sample period, the frequency of Defense, Board and Executive
Compensation proposals is broadly similar (25%-28% each group), but Executive Compensation
proposals have been dominant in 2003-2004 (top panel). The middle panel reveals that,
respectively, 65% and 61% of Defense and Shareholder Rights proposals receive a majority vote, 16 To control for the potential effect of institutional selling (“voting with your feet’) on director turnover and reputation, as suggested by Del Guercio, Wallis, and Woidtke (2006), we also control for the change in institutional ownership over the two years prior to the majority vote. The variable is insignificant and does not affect our findings. Since its inclusion reduces the sample size by about 20%, we do not tabulate it. 17 Anecdotal evidence suggests that withdrawn proposals have increased in recent years (WSJ, 2007). To the extent that these proposals are withdrawn because the board implements them, the increase in implementation rate we document may understate the increase in boards’ responsiveness to shareholder proposals.

21
versus only 13% (2%) for Executive Compensation (Board) proposals.18 Over time, the
frequency of majority votes has increased across most types of proposals. Conditional on a
majority vote (bottom panel), Shareholder Rights proposals have the highest rate of
implementation (45% of the cases), followed by Defense and Executive Compensation (30%).19
The rate of implementation for Defense and Shareholder Rights proposals has increased
significantly in the latter part of the sample period.20
Finally, Figure 3 presents the frequency and outcome of shareholder proposals by
proponent identity. Over the sample period most proposals are presented either by Individuals
(54%) or by Unions (26%), with Unions becoming significantly more active after 2002 (top
panel). Proposals presented by Pubic Pensions, while not frequent, are more likely to receive a
majority vote (37% versus approximately 25%) relative to Individuals and Unions, but only in
the first part of the sample period (middle panel) Conditional on a majority vote (bottom panel),
proposals presented by Public Pensions, Unions, or Individuals do not differ significantly in
terms of implementation rate (approximately 30-32%), with MV proposals by Other Groups
enjoying the highest rate of adoption (40%). MV proposals by Individuals and Other Groups
enjoy a significant increase in implementation rate after 2002.
18 Among the proposals most frequently winning a majority-vote are proposals to eliminate supermajority provisions (majority vote in 86% of the cases) and confidential voting (47%), and proposals to remove poison pills (74%) and classified boards (61%). Among the executive compensation proposals only proposals to expense stock options and submit large golden parachutes to shareholder approval received significant support (majority votes, respectively, in 50% and 31% of the cases). See Appendix 1 for details. 19 The higher rate of implementation for MV Shareholder Rights proposals is mostly due to the confidential voting proposals (69%). Within MV Defense proposals, the higher implementation rate for poison pill proposals relative to classified board proposals (40% versus 22%) is noteworthy. Other proposals with high likelihood of implementation are proposals requiring shareholder approval for golden parachutes (67%) and proposals to eliminate super-majority provisions (37%). See Appendix 1 for details. 20 Note that the high implementation rate for MV Executive Compensation and Board proposals in 1997-2002 (and the subsequent drop) is an artifact of the low frequency of majority votes in these two categories in 1997-2002.
22
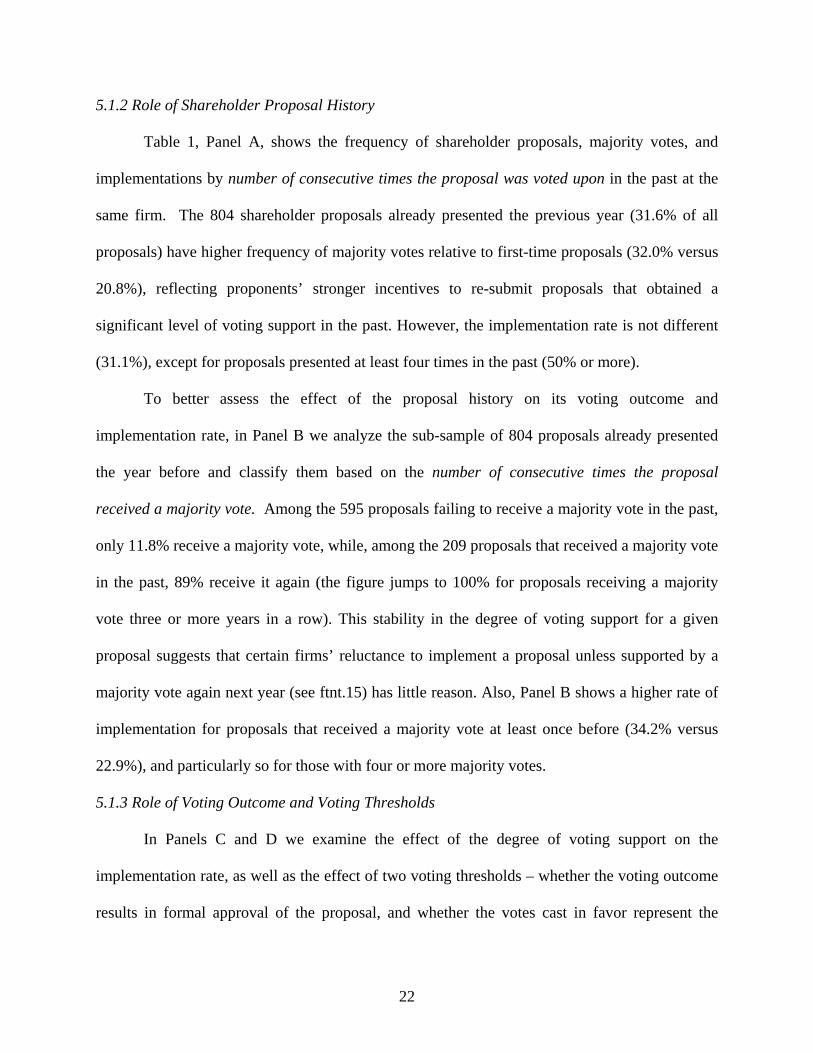
5.1.2 Role of Shareholder Proposal History
Table 1, Panel A, shows the frequency of shareholder proposals, majority votes, and
implementations by number of consecutive times the proposal was voted upon in the past at the
same firm. The 804 shareholder proposals already presented the previous year (31.6% of all
proposals) have higher frequency of majority votes relative to first-time proposals (32.0% versus
20.8%), reflecting proponents’ stronger incentives to re-submit proposals that obtained a
significant level of voting support in the past. However, the implementation rate is not different
(31.1%), except for proposals presented at least four times in the past (50% or more).
To better assess the effect of the proposal history on its voting outcome and
implementation rate, in Panel B we analyze the sub-sample of 804 proposals already presented
the year before and classify them based on the number of consecutive times the proposal
received a majority vote. Among the 595 proposals failing to receive a majority vote in the past,
only 11.8% receive a majority vote, while, among the 209 proposals that received a majority vote
in the past, 89% receive it again (the figure jumps to 100% for proposals receiving a majority
vote three or more years in a row). This stability in the degree of voting support for a given
proposal suggests that certain firms’ reluctance to implement a proposal unless supported by a
majority vote again next year (see ftnt.15) has little reason. Also, Panel B shows a higher rate of
implementation for proposals that received a majority vote at least once before (34.2% versus
22.9%), and particularly so for those with four or more majority votes.
5.1.3 Role of Voting Outcome and Voting Thresholds
In Panels C and D we examine the effect of the degree of voting support on the
implementation rate, as well as the effect of two voting thresholds – whether the voting outcome
results in formal approval of the proposal, and whether the votes cast in favor represent the

23
majority of shares outstanding. This analysis is important in view of the current policy-making
debate on the proxy voting system (SEC 2007a)21 and the emphasis put on certain thresholds by
firms and proxy voting services.22 Panel C shows that the likelihood of implementation increases
with the degree of voting support, ranging from 23.9% for proposals receiving 50%-60% of
votes in favor to more than 39% for proposals in the 70%-90% range. As for the voting
thresholds, Panel C indicates that the rate of implementation is higher for MV proposals formally
approved (32.3% versus 21.5%). However, within the only voting range with a meaningful
sample size (50%-60%) the difference in rate of implementation is minimal (24.4% versus
21.7%). Similarly, for MV proposals also representing the majority of shares outstanding (Panel
D), there appears to be a higher implementation rate, (41.1% versus 27.6%), but within the
voting ranges with a meaningful sample size (60%-70% and 70%-80%), the difference is small.
Overall, four key results emerge from the combined analysis of Figures 1-3 and Table 1.
First, there has been a significant increase in the frequency of shareholder proposals after 2002,
mostly due to new initiatives by labor unions in the area of executive compensation. Second,
there also has been a parallel increase in the frequency of majority votes and an even more
pronounced increase in the rate of implementation of MV proposals, particularly for Defense and
Shareholder Rights proposals. Third, the voting outcome of proposals presented multiple times
tends to be stable, and proposals achieving a series of majority votes are more likely to be
21 A number of issues related to proxy voting have emerged in the last couple of years. First, in 2006 the NYSE ended the practice of letting brokerages vote shares held on behalf of their owners in directors’ elections. Second, in 2007 the SEC issued a new rule allowing electronic delivery of proxy material and proxy voting (SEC, 2007b). Finally, there are growing concerns with “empty voting,” i.e. the practice of borrowing shares to obtain the right to vote (Hu and Black, 2007). Further evidence of the growing importance of shareholder votes is provided by Christoffersen, Geczy, Musto and Reed (2007), who document an active market for votes within the U.S. equity loan market and show that vote trading corresponds to support for shareholder proposals and opposition to management proposals. In response to the growing interest in voting-related issues, recently the SEC held a series of roundtable discussions concerning potential changes to proxy rules (SEC 2007a). 22 For example, firms not implementing a MV proposal sometimes note that the votes in favor of the proposal do not represent the majority of shares outstanding. The ISS recommends to withhold votes from the entire board if the board fails to act on a proposal supported by the majority of the shares outstanding (ISS, 2006).
24
implemented. Finally, the rate of implementation is not substantially higher when the majority
vote also represents the majority of shares outstanding or translates into a formal approval.
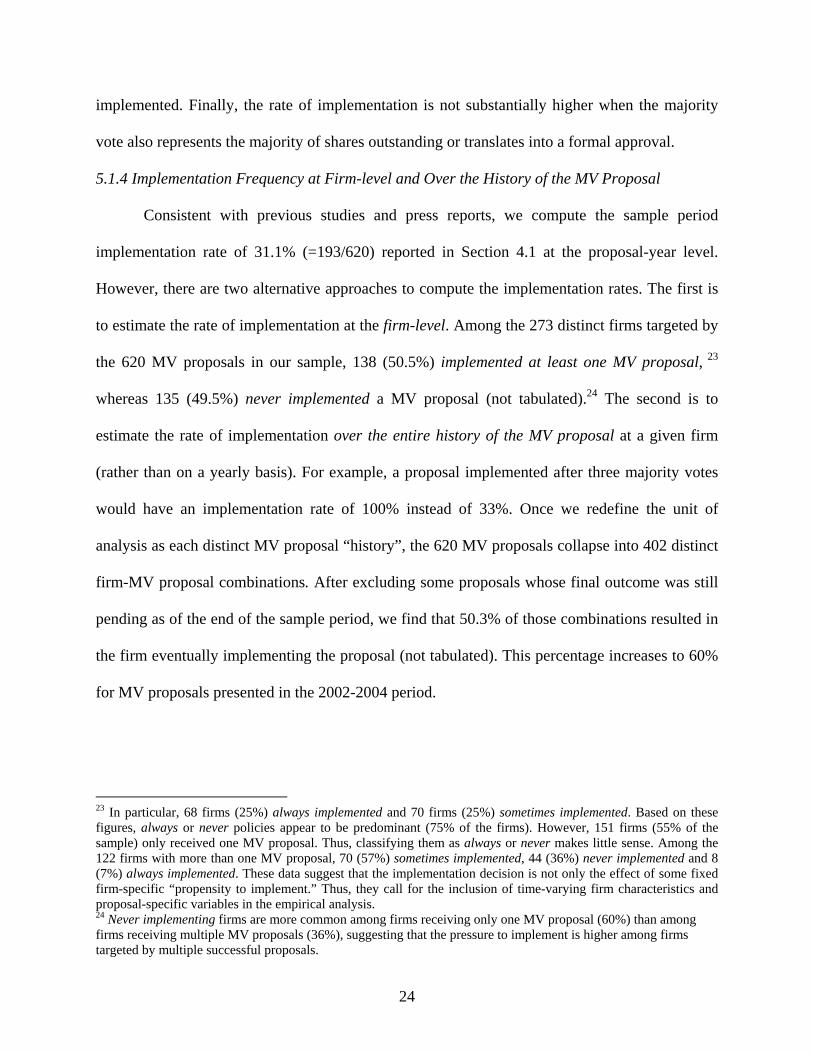
5.1.4 Implementation Frequency at Firm-level and Over the History of the MV Proposal
Consistent with previous studies and press reports, we compute the sample period
implementation rate of 31.1% (=193/620) reported in Section 4.1 at the proposal-year level.
However, there are two alternative approaches to compute the implementation rates. The first is
to estimate the rate of implementation at the firm-level. Among the 273 distinct firms targeted by
the 620 MV proposals in our sample, 138 (50.5%) implemented at least one MV proposal, 23
whereas 135 (49.5%) never implemented a MV proposal (not tabulated).24 The second is to
estimate the rate of implementation over the entire history of the MV proposal at a given firm
(rather than on a yearly basis). For example, a proposal implemented after three majority votes
would have an implementation rate of 100% instead of 33%. Once we redefine the unit of
analysis as each distinct MV proposal “history”, the 620 MV proposals collapse into 402 distinct
firm-MV proposal combinations. After excluding some proposals whose final outcome was still
pending as of the end of the sample period, we find that 50.3% of those combinations resulted in
the firm eventually implementing the proposal (not tabulated). This percentage increases to 60%
for MV proposals presented in the 2002-2004 period.
23 In particular, 68 firms (25%) always implemented and 70 firms (25%) sometimes implemented. Based on these figures, always or never policies appear to be predominant (75% of the firms). However, 151 firms (55% of the sample) only received one MV proposal. Thus, classifying them as always or never makes little sense. Among the 122 firms with more than one MV proposal, 70 (57%) sometimes implemented, 44 (36%) never implemented and 8 (7%) always implemented. These data suggest that the implementation decision is not only the effect of some fixed firm-specific “propensity to implement.” Thus, they call for the inclusion of time-varying firm characteristics and proposal-specific variables in the empirical analysis. 24 Never implementing firms are more common among firms receiving only one MV proposal (60%) than among firms receiving multiple MV proposals (36%), suggesting that the pressure to implement is higher among firms targeted by multiple successful proposals.

25
Relative to the 31.1% rate at the proposal-year level, these alternative estimates provide a
different and more positive perspective on the degree of boards’ responsiveness to MV proposals
and the degree of success of shareholder activists.
5.2 Determinants of the Implementation Decision
5.2.1 Descriptive Statistics and Univariate Tests
Table 2 Panel A provides descriptive statistics for the sample of targeted firms, with a
comparison to the other S&P 1500 firm-years covered by IRRC and to the Compustat universe.25
Consistent with previous studies (e.g. Karpoff, 2001; Thomas and Cotter, 2007), targeted firms
tend to be larger, poorly performing firms with weaker external governance (higher G-score).26
Panel B provides descriptive statistics for the sample of shareholder proposals. The
average percentage of votes cast in favor (VOTES_FOR) is 31.4%—with 24.4% of the proposals
receiving a majority vote (MAJ_VOTE) and 32% already presented the previous year (PRES1).
Firms targeted by proposals receiving a majority vote (MV Proposals) tend to be smaller, with
higher institutional ownership, lower insider ownership and weaker external governance (higher
G score). MV Proposals are more likely to have been presented in the previous year (PRES1).
Panel C reports descriptive statistics for the sample of MV proposals and compares those
subsequently implemented (Implemented) to those not implemented. As predicted, all our
proxies for shareholder pressure (VOTES_FOR, N_MAJ_CONS, ACTIVIST_OWN,
PROPONENT_OWN, VOTES_WITHHELD, PEER_IMPLEMENTED) are significantly higher in
25 IRRC tracks firms in the S&P 1500 only. Hence, we do not know whether firms in Compustat not included in the S&P 1500 were targeted by shareholder proposals. Therefore, the appropriate comparison is between targeted firms and non-targeted firms in the S&P 1500. Nonetheless, as a benchmark we also present data for all non-targeted firms in Compustat. According to IRRC, the vast majority of shareholder proposals are submitted at the S&P 1500 firms. 26 We estimate a logit regression for the probability of being targeted by a shareholder proposal as a function of the variables in Panel A. The results (not reported) show that targeted firms tend to be larger, more leveraged, with worse stock performance, weaker external governance (higher G-score), higher frequency of dual CEO-chairman role, and lower insider ownership.
26
the Implemented sub-sample. In contrast, only one proxy for governance quality (the external
shareholder rights index – the inverse of G) is higher in the Implemented sub-sample.
The correlation analysis in Table 3 confirms the findings above, except that CEOCHAIR
and N_MAJ_CONS are (positively but) not significantly correlated with IMPLEMENTED.
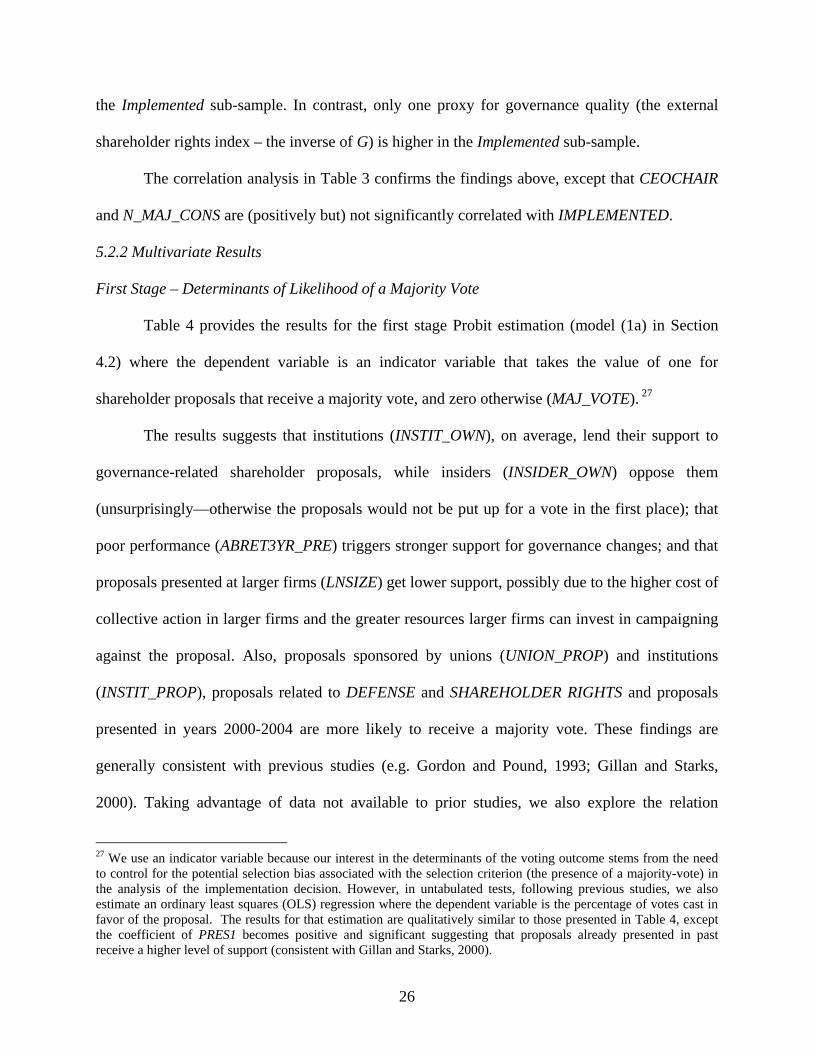
5.2.2 Multivariate Results
First Stage – Determinants of Likelihood of a Majority Vote
Table 4 provides the results for the first stage Probit estimation (model (1a) in Section
4.2) where the dependent variable is an indicator variable that takes the value of one for
shareholder proposals that receive a majority vote, and zero otherwise (MAJ_VOTE). 27
The results suggests that institutions (INSTIT_OWN), on average, lend their support to
governance-related shareholder proposals, while insiders (INSIDER_OWN) oppose them
(unsurprisingly—otherwise the proposals would not be put up for a vote in the first place); that
poor performance (ABRET3YR_PRE) triggers stronger support for governance changes; and that
proposals presented at larger firms (LNSIZE) get lower support, possibly due to the higher cost of
collective action in larger firms and the greater resources larger firms can invest in campaigning
against the proposal. Also, proposals sponsored by unions (UNION_PROP) and institutions
(INSTIT_PROP), proposals related to DEFENSE and SHAREHOLDER RIGHTS and proposals
presented in years 2000-2004 are more likely to receive a majority vote. These findings are
generally consistent with previous studies (e.g. Gordon and Pound, 1993; Gillan and Starks,
2000). Taking advantage of data not available to prior studies, we also explore the relation
27 We use an indicator variable because our interest in the determinants of the voting outcome stems from the need to control for the potential selection bias associated with the selection criterion (the presence of a majority-vote) in the analysis of the implementation decision. However, in untabulated tests, following previous studies, we also estimate an ordinary least squares (OLS) regression where the dependent variable is the percentage of votes cast in favor of the proposal. The results for that estimation are qualitatively similar to those presented in Table 4, except the coefficient of PRES1 becomes positive and significant suggesting that proposals already presented in past receive a higher level of support (consistent with Gillan and Starks, 2000).

27
between voting outcome and external governance structure and find a higher probability of a
majority vote in firms with poor external governance structure (G), suggesting that shareholders
take into account the existing governance provisions in assessing the quality of the proposal.
Second Stage – Determinants of Likelihood of Implementation
Table 5, Models (1) and (2), presents the results for the analysis of the determinants of
the implementation decision, based on the maximum likelihood Probit estimation with selection
(joint estimation of equations (1a) and (1) in Section 4.2).
With respect to the variables that capture the extent of shareholder pressure, there is a
strong, significantly positive association between the likelihood of implementation and the
percentage of votes in favor of the proposal (VOTES_FOR). This finding suggests that the
implementation is likely to be the result of the proposal rather than some other underlying factor
affecting all targeted firms equally.28 To provide a sense of the economic significance of this
result, moving from the 1st quartile (VOTES_FOR=55%) to the 3rd quartile (VOTES_FOR=70%),
while keeping the other variables at the mean or median, increases the predicted probability of
implementation by approximately 10%.
The number of peer firms implementing a similar proposal in the past two years
(PEER_IMPLEMENTED) is significantly positively associated with the likelihood of
implementation. This finding suggests that it may be more efficient for activists to target firms in
the same industry (or in few industries) and exploit these spillover effects.
28 We cannot completely rule out the possibility that the percentage of voting support is correlated with determinants of the probability of adoption of the governance change advocated by the proposal (independently from the occurrence of the proposal and its voting outcome). However, two factors favor our interpretation. First, these firms had refused to implement the proposal just few months earlier. Second, the presence of a shareholder proposal has been shown to increase the likelihood of firms’ decision to de-classify their boards (Guo, Kruse and Nohel, 2005), remove poison pills (Akyol and Carroll, 2006) and expense employee stock options (Ferri and Sandino, 2006) after controlling for the other known economic determinants.

28
In addition, the coefficients of UNION_PROP and INSTIT_PROP are positive,
suggesting that MV proposals by investors with more resources and influence are more likely to
be implemented. There is also a positive association with the ownership by activist shareholders
(ACTIVIST_OWN), though not significant at conventional levels (p = 0.16), while the other two
measures of shareholder pressure—number of consecutive years a proposal received majority
support (N_MAJ_CONS) and the opposition to directors’ re-election (VOTES_WITHHELD)29—
are not significantly associated with the likelihood of implementation, possibly because of their
correlation with VOTES_FOR (see Table 3).30
Consistent with our expectation and the findings in Tables 1 and 2, the coefficient on
AFTER_2001 is positive and significant, suggesting an increase in boards’ responsiveness to MV
proposals subsequent to the governance scandals and reforms of 2001-2002, after controlling for
any temporal changes in other factors. SHAREHOLDER RIGHTS and DEFENSE proposals are
more likely not only to receive a majority vote (Table 4) but also to be implemented. None of the
variables that proxy for governance and financial characteristics of the firm are associated with
the likelihood of implementation, but most of them have the predicted sign.
In Model (2), we add the indicator variable for the percentage ownership by the
proponent (PROPONENT_OWN)—available only for a subset of the MV proposals. As
predicted, the coefficient on this variable is positive and significant.31 In both models, the Wald
29 In untabulated tests we replace VOTES_WITHHELD with an indicator variable equal to one if the board is targeted by a publicly announced vote-no campaign and the coefficient remains insignificant. To test whether voting opposition affects the implementation decision when combined with the publicity of a vote-no campaign, we also interact this indicator variable with VOTES_WITHHELD. The interaction term is not significant. 30 An alternative explanation for the lack of significance is that both variables are an ex post measure of ineffective governance (beyond what is captured by our governance variables), rather than a proxy for shareholder pressure. If so, one would predict a negative, rather than positive, relation with the likelihood of implementation. 31 Note that ownership by activist shareholders (ACTIVIST_OWN) and stock performance (ABRET3YR_PRE) become significant, while PEER_IMPLEMENTED loses significance (p-value = 0.18). Unreported tests show that these changes are not due to the inclusion of PROPONENT_OWN, but to the different (smaller) sample.

29
test of independent equations rejects the null hypothesis that the two equations are independent
(respectively, p = 0.09 and p = 0.05), supporting the need of a correction for the selection bias.32
The results on VOTES_FOR, PROPONENT_OWN and PEER_IMPLEMENTED are also
consistent with boards viewing stronger voting support, ownership of the proponent and similar
actions by peer firms as an indication of the quality of the proposal.
Thomas and Cotter (2007) also analyze the determinants of the implementation decision
(over the period 2002-2004) and find that the likelihood of implementation is positively
associated with past stock performance and the percentage of votes in favor of the proposal. Our
analysis extends their work in two important ways. First, we examine the effect of a broader set
of variables of interest to academics and regulators—such as history of the proposal, the
behavior of peer firms, proponents’ and activists’ ownership, key voting thresholds and board
characteristics. Second, because their sample includes all proposals voted upon, the association
between implementation and percentages of votes cast in favor may be the result of a correlated
omitted variable—whether the proposal received a majority-vote. In contrast, because we focus
on MV proposals (and control for selection bias), we provide unambiguous evidence of that
relation—an important finding in view of the current debate on proxy voting rules (SEC, 2007a).
5.3 Consequences of the Implementation Decision
Table 6 provides the results for the consequences of the implementation decision on
outside directors’ turnover (Panel A) and other directorships held (Panels B, C and D).
32 In untabulated analyses we also consider: i) the presence of a new CEO in the year of, or the year prior to, the majority vote; ii) the presence of board members who also sit on boards of S&P 1500 firms that implemented a MV proposal over the previous two years; iii) an indicator variable that equals one if independent board members own at least one percent of the shares outstanding; iv) the level of institutional ownership; v) an indicator variable for whether the proposal was formally approved; vi) an indicator variable for whether votes in favor also represent the majority of the shares outstanding; vii) abnormal returns over the 6-month period leading up to the annual meeting (rather than 3-year abnormal stock returns) to account for the effect of performance between the time the proposal was submitted and the annual meeting. These variables are not significant and do not affect our inferences.

30
Outside Director Turnover
The key result in Panel A, Model (1), is the negative and significant association between
IMPLEMENTED and the probability of outside director turnover. Holding all other variables at
their mean, the marginal effect of IMPLEMENTED on the likelihood of turnover is 2.8%
(untabulated analysis).33 To assess its economic significance, consider that the frequency of
director turnover in our sample is 14.8% (=583/3,942).34 Hence, a 2.8% decrease translates to a
19% decrease in the unconditional probability of turnover (=2.8%/14.8%).
In Model (2), to understand whether this effect is more pronounced when the conflict
between board and shareholders is most apparent, we interact IMPLEMENTED with an indicator
variable (VOTES_FOR>70%) equal to one if the implemented MV proposals faced by the
director averaged voting support in excess of 70% (the top quartile of the voting distribution for
MV proposals). The coefficient of IMPLEMENTED remains negative but becomes insignificant
(p=0.151). However, the coefficient of the interaction term IMPLEMENTED x VOTES_FOR>70
% and the sum of coefficients are both significantly negative (respectively, p = 0.093 and χ2 =
8.11). Hence, it appears that the turnover penalty for failure to implement MV proposals
documented in Model (1) is driven by MV proposals with the strongest shareholder support.35
The marginal effect of IMPLEMENTED on the likelihood of turnover for the VOTES_FOR>70%
subsample is 4.9% (untabulated analysis), implying a 33% decrease in the unconditional
probability of turnover (=4.9%/14.8%).
33 The marginal effect of IMPLEMENTED varies between 1% and 6% depending on the values of the other indicator variables. Interestingly, holding all other variables at their mean, it increases from 2.3% to 5.5% when CEO_TURNOVER changes from 0 to 1, consistent with enhanced sensitivity of outside director turnover to directors’ actions when there are changes at the helm of the company. 34 For comparison, the unconditional frequency of director turnover in a sample of Fortune 500 firms between 1994 and 1996 is 4.6%. The higher rate in our sample is consistent with the notion that firms targeted by MV proposals tend to be poorly performing firms and, thus, are more likely to undergo significant governance changes. It is also likely to reflect differences in the sample period (e.g. board changes to comply with recent regulatory reforms). 35 We also augment Model (2) to interact IMPLEMENTED with proposal types and proponent identities. The coefficient on IMPLEMENTED x VOTES_FOR>70 % remains significantly negative (p-value < 0.10).
31
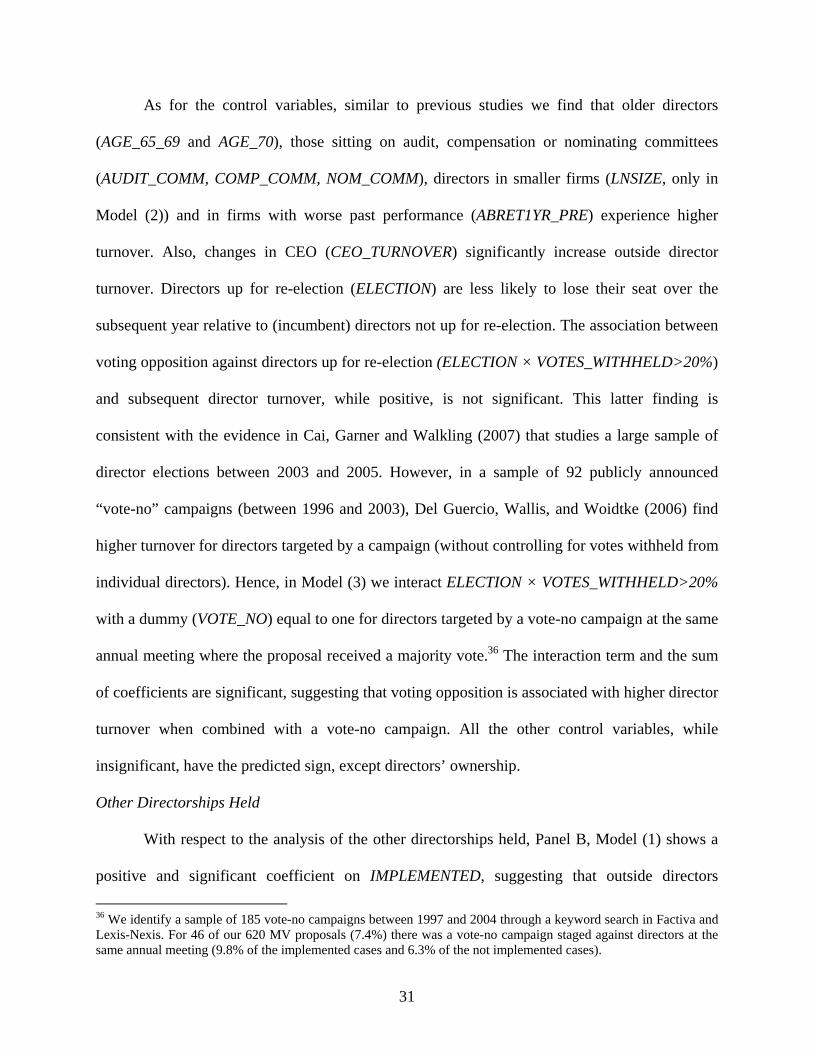
As for the control variables, similar to previous studies we find that older directors
(AGE_65_69 and AGE_70), those sitting on audit, compensation or nominating committees
(AUDIT_COMM, COMP_COMM, NOM_COMM), directors in smaller firms (LNSIZE, only in
Model (2)) and in firms with worse past performance (ABRET1YR_PRE) experience higher
turnover. Also, changes in CEO (CEO_TURNOVER) significantly increase outside director
turnover. Directors up for re-election (ELECTION) are less likely to lose their seat over the
subsequent year relative to (incumbent) directors not up for re-election. The association between
voting opposition against directors up for re-election (ELECTION × VOTES_WITHHELD>20%)
and subsequent director turnover, while positive, is not significant. This latter finding is
consistent with the evidence in Cai, Garner and Walkling (2007) that studies a large sample of
director elections between 2003 and 2005. However, in a sample of 92 publicly announced
“vote-no” campaigns (between 1996 and 2003), Del Guercio, Wallis, and Woidtke (2006) find
higher turnover for directors targeted by a campaign (without controlling for votes withheld from
individual directors). Hence, in Model (3) we interact ELECTION × VOTES_WITHHELD>20%
with a dummy (VOTE_NO) equal to one for directors targeted by a vote-no campaign at the same
annual meeting where the proposal received a majority vote.36 The interaction term and the sum
of coefficients are significant, suggesting that voting opposition is associated with higher director
turnover when combined with a vote-no campaign. All the other control variables, while
insignificant, have the predicted sign, except directors’ ownership.
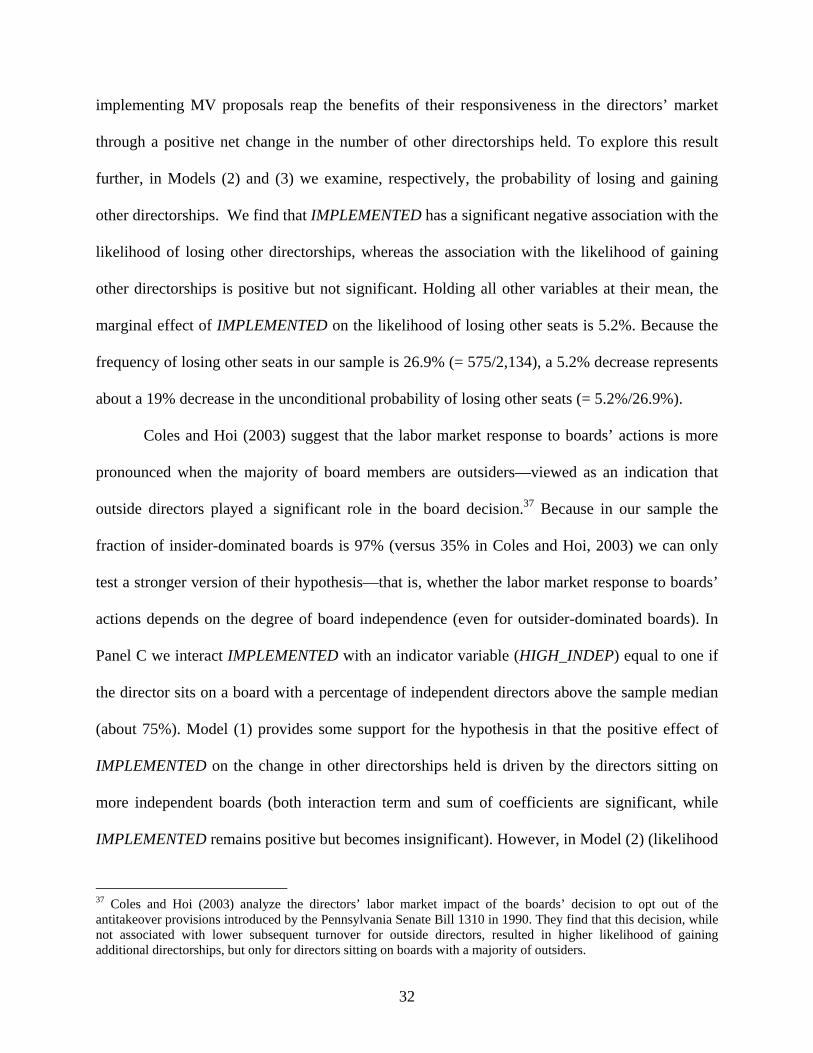
Other Directorships Held
With respect to the analysis of the other directorships held, Panel B, Model (1) shows a
positive and significant coefficient on IMPLEMENTED, suggesting that outside directors
36 We identify a sample of 185 vote-no campaigns between 1997 and 2004 through a keyword search in Factiva and Lexis-Nexis. For 46 of our 620 MV proposals (7.4%) there was a vote-no campaign staged against directors at the same annual meeting (9.8% of the implemented cases and 6.3% of the not implemented cases).
32
implementing MV proposals reap the benefits of their responsiveness in the directors’ market
through a positive net change in the number of other directorships held. To explore this result
further, in Models (2) and (3) we examine, respectively, the probability of losing and gaining
other directorships. We find that IMPLEMENTED has a significant negative association with the
likelihood of losing other directorships, whereas the association with the likelihood of gaining
other directorships is positive but not significant. Holding all other variables at their mean, the
marginal effect of IMPLEMENTED on the likelihood of losing other seats is 5.2%. Because the
frequency of losing other seats in our sample is 26.9% (= 575/2,134), a 5.2% decrease represents
about a 19% decrease in the unconditional probability of losing other seats (= 5.2%/26.9%).
Coles and Hoi (2003) suggest that the labor market response to boards’ actions is more
pronounced when the majority of board members are outsiders—viewed as an indication that
outside directors played a significant role in the board decision.37 Because in our sample the
fraction of insider-dominated boards is 97% (versus 35% in Coles and Hoi, 2003) we can only
test a stronger version of their hypothesis—that is, whether the labor market response to boards’
actions depends on the degree of board independence (even for outsider-dominated boards). In
Panel C we interact IMPLEMENTED with an indicator variable (HIGH_INDEP) equal to one if
the director sits on a board with a percentage of independent directors above the sample median
(about 75%). Model (1) provides some support for the hypothesis in that the positive effect of
IMPLEMENTED on the change in other directorships held is driven by the directors sitting on
more independent boards (both interaction term and sum of coefficients are significant, while
IMPLEMENTED remains positive but becomes insignificant). However, in Model (2) (likelihood
37 Coles and Hoi (2003) analyze the directors’ labor market impact of the boards’ decision to opt out of the antitakeover provisions introduced by the Pennsylvania Senate Bill 1310 in 1990. They find that this decision, while not associated with lower subsequent turnover for outside directors, resulted in higher likelihood of gaining additional directorships, but only for directors sitting on boards with a majority of outsiders.

33
of losing seats) both IMPLEMENTED and the sum of coefficients are significant, while the
interaction term is not, suggesting that outside directors are accountable for the actions of
outsider-dominated boards regardless the degree of board independence. Also, in Model (3), the
effect of board independence on the likelihood of gaining seats is positive but not significant.38
In Panel D we explore a similar idea—whether director labor market effects are more
pronounced for directors more likely to be responsible for the implementation decisions—by
interacting IMPLEMENTED with an indicator variable (NOM_COMM) equal to one for
nominating committee members, who are typically in charge of reviewing and recommending
governance practices to the board of directors. Model (1) shows that the positive effect of
IMPLEMENTED on the change in other directorship held is not limited to, nor is more
pronounced for, nominating committee members (both IMPLEMENTED and the sum of
coefficients are significant). Model (2) provides some support for the hypothesis in that the
negative association between IMPLEMENTED and the loss of other seats is driven by the subset
of directors sitting on nominating committees (only the sum of coefficients is significant). The
inclusion of the interaction term has no effect on the likelihood of gaining seats (Model (3)).
Regarding the control variables, in line with our predictions and previous studies, older
directors (AGE_65_69 and AGE_70) are more likely to lose and less likely to gain other seats,
resulting in a negative net effect on CHG_N_BOARDS. Directors holding many seats
(N_BOARDS) are more likely to lose other seats—consistent with N_BOARDS being a proxy for
“busy” directors (Ferris, Jagannathan and Pritchard, 2003; Fich and Shivdasani, 2006)—but they
are also more likely to gain other seats (consistent with N_BOARDS being a proxy for directors’
expertise), though the overall effect on CHG_N_BOARDS remains significantly negative, as in
38 Unlike Models (2) and (3), the dependent variable in Model (1), takes into account the number of other directorships gained/lost. This may be the reason why the interaction term is significant in Model (1), but not in Models (2) and (3).

34
previous studies. Directors losing their own seat (OFF_OWN_BOARD) are more likely to lose
other seats (resulting in a negative effect on CHG_N_BOARDS).39 As expected, the effect of
FEMALE directors on CHG_N_BOARDS is positive and reflects the lower likelihood of losing
seats. Directors in larger firms (LNSIZE) are more likely to gain additional seats (resulting in a
positive net effect on CHG_N_BOARDS), consistent with more visible appointments enhancing
directors’ reputations in the labor market. Surprisingly, better current stock performance at the
sample firms (ABRET1YR_POST) is associated with higher (lower) probability of losing
(gaining) other seats (with an overall negative effect on CHG_N_BOARDS). One possibility is
that directors prefer to concentrate their appointments in well performing firms. While directors
up for (re-)election (ELECTION) are less likely to gain other seats (possibly the effect of first-
time directors), voting opposition against directors up for re-election (ELECTION ×
VOTES_WITHHELD>20%) has a negative but not significant effect on CHG_N_BOARDS. 40
Overall, the results in Table 6 suggest a significant association between boards’ response
to MV shareholder proposals and directors’ standing in the labor market. Implementing MV
shareholder proposals is associated with lower director turnover, while failure to implement MV
proposals is associated with a loss of other directorships. Assuming that the labor market for
directors penalizes sub-optimal behavior, our findings on the penalties for unresponsive directors
may also be viewed as indirect evidence of the optimality of MV proposals (on average).
39 To further ensure that the effect of IMPLEMENTED on other directorships held is not driven by directors losing their seat at the sample firm (OFF_OWNBOARD=1), we re-run Models (1)-(3) of Panel B for the sample of directors who retain their seat at the sample firm (OFF_OWNBOARD=0). IMPLEMENTED remains significant in both Models (1) and (2) (respectively, p-value=0.003 and p-value=0.016) and most of the other variables are unaffected. 40 The lack of a significant effect is consistent with Cai, Garner and Walkling (2007). Del Guercio, Wallis, and Woidtke (2006) find a significantly negative effect of publicly announced “vote-no” campaigns on the net change in other directorships but only for directors explicitly singled out in these campaigns. When we interact VOTE_NO with ELECTION × VOTES_WITHHELD>20%, the coefficient is not significant (untabulated test).

35
5.4 Additional Tests: The Effect of Other Events
Previous studies have shown that certain events are associated with director labor market
effects, such as restatements (Srinivasan, 2005) and allegations of financial fraud (Fich and
Shivdasani, 2007), though these findings are not consistent across all studies (e.g. Agrawal and
Jaffe, 1999; Helland, 2006). If these events are correlated with the implementation decision (e.g.
boards implement MV proposals to offset the negative effect of these events on shareholder
sentiment), then they might drive the findings in Table 6. To test for this possibility, we construct
three indicator variables equal to one, respectively, i) if the firm announces a restatement over
the 24-month period centered around the annual meeting where the proposal receives a majority
vote; ii) if a securities class action lawsuit alleging financial misrepresentation is filed against the
firm over the same period; iii) if there was a proxy contest at the same annual meeting.41 Then, in
unreported tests, we include these variables in the regressions in Table 5 (implementation
decision) and Table 6 (director labor market effects). None of them is significant and the other
results are unchanged. Most importantly, in all models in Table 6 IMPLEMENTED and the other
variables of interest preserve their significance level.
6. Conclusion
Using a sample of 620 governance-related majority-vote (MV) shareholder proposals
between 1997 and 2004, in this study we analyze the frequency, determinants and consequences
41 Our restatement sample is based on the latest report from the General Accounting Office (GAO) covering the period 1997-2006. Of the 620 MV proposals in our sample, 94 (15.2%) were preceded or followed by a restatement announcement within a year (16.5% of the implemented proposals and 14.5% of the not implemented proposals). Our litigation sample is based on a database compiled by Woodruff-Sawyer & Co. based on a variety of sources (e.g. Securities Class Action Clearinghouse, Securities Class Action Alert). Of the 620 MV proposals in our sample, 73 (11.8%) were preceded or followed by a federal securities class action lawsuit within a year (11.9% of the implemented proposals and 11.7% of the not implemented proposals). The proxy contests sample is based on the Corporate Governance Wrap-Up annually published by Georgeson Shareholder. Of the 620 MV proposals in our sample, 32 (5.1%) were accompanied by a simultaneous proxy contest at the annual meeting (4.1% of the implemented proposals and 5.6% of the not implemented proposals).
36
of boards’ responses to these proposals. Because MV shareholder proposals capture an
unambiguous and unresolved conflict between the board and a significant portion of the
shareholder base in terms of preferences over key rules of the game (i.e. governance provisions),
our setting is well suited to explore the notion of boards’ responsiveness to shareholder concerns.
We document that the frequency of implementation has almost doubled after 2002,
reaching more than 40%, consistent with higher reputation costs to both firms and individual
directors from ignoring shareholder resolutions in the post-Enron era. We predict and find that
the likelihood of implementation of MV shareholder proposals is increasing in shareholder
pressure, as measured by the percentage of votes in favor of the proposal and the influence of the
proponent. Governance indicators do not play a key role.
In terms of the consequences of the implementation decision, we find that the
implementation of a MV shareholder proposal is associated with approximately a one-fifth
reduction in both the probability of director turnover and the probability of losing directorships
held in other firms. To the extent that the director labor market penalizes sub-optimal behavior,
these findings represent indirect evidence of the optimality of MV proposals (on average).
Our study contributes to the literature on the reputation penalties for directors, which has
focused mostly on firm-level evidence of poor monitoring (e.g. restatements, fraud) rather than
direct board-level actions. Our findings on frequency, determinants and consequences of
implementation decisions also contribute to the growing literature on shareholder activism and,
in particular, shareholder proposals, traditionally viewed as an ineffective governance
mechanism. Finally, our evidence may inform the current policy-making debate on the proxy
process and voting system, and, more generally, the broader debate on whether regulatory reform
is needed to enhance boards’ accountability to shareholders.

37
References
Agrawal, A., Jaffe, J.F., Karpoff, J.M., 1999. Management turnover and governance changes following the revelation of fraud. Journal of Law and Economics 42, 309–342. Akyol A. and Carroll C., 2006. Removing Poison Pills: A Case of Shareholder Activism, Working Paper.
Barber B., 2006. Monitoring the Monitor: Evaluating CalPERS’ Shareholder Activism, Working Paper.
Bebchuk, Lucian A., 2003, The Case for Shareholder Access to the Ballot, Business Lawyer, Vol. 59, pp. 43-66.
Bebchuk, Lucian A., 2005, The Case for Increasing Shareholder Power, Harvard Law Review, Vol. 18, pp. 835-.
Becht M., Franks J., Mayer C. and Rossi S., 2007. Returns to Shareholder Activism: Evidence from a Clinical Study of the Hermes U.K. Focus Fund, Review of Financial Studies, forthcoming.
Berle, Adolf A. and Gardiner C. Means, 1932. The modern corporation and private property. New York: the Macmillan Company.
Black, Bernard S., 1990. Shareholder Passivity Reexamined. Michigan Law Review 89, 520-608.
Black, Bernard S., 1998. Shareholder Activism and Corporate Governance in the United States. The New Palgrave Dictionary of Economics and the Law. Peter Newman, ed.
Brav A., Jiang W., Partnoy F. and Thomas R., 2006. Hedge Fund Activism, Corporate Governance and Firm Performance, Journal of Financial Economics, forthcoming.
Business Week, How shareholder votes are legally rigged, 05/20/2002 Cai J., Garner J.L. and Ralph A. Walkling, 2007. Electing directors, Working Paper, Drexel University.
CalPERS, 2007; CalPERS 2007 Focus List at http://www.calpers-governance.org/alert/focus/
Carleton, W., Nelson, J., and Weisbach, M., 1997. The Influence of Institutions on Corporate Governance through Private Negotiations: Evidence from TIAA-CREF. Journal of Finance 53: 1335-1362.
Coles, Jeffrey and Chun-Keung Hoi, 2003. New evidence on the market for directors: Board membership and Pennsylvania senate bill 1310. Journal of Finance 58, 197-230. Cremers, Martijn K. J. and Vinay B. Nair, 2006. Governance Mechanisms and Equity Prices. The Journal of Finance 60, 2859-2894

38
CFO.com, August 19, 2003, “Shareholders Just Can’t be Ignored”
CFO.com, April 16, 2005, “Two Pension Funds Target 16 Companies”
Christoffersen, Susan E.K., Christopher C. Geczy, Musto David K. and Adam V. Reed, 2007. Vote trading and information aggregation. The Journal of Finance 62, 2897-2929
Del Guercio, Diane and Jennifer Hawkins, 1999. The motivation and impact of pension fund activism. Journal of Financial Economics 52, 293-340. Del Guercio, Diane, Wallis, Laura and Tracie Woidtke, 2006. Do Boards Pay Attention When Institutional Investors “Just Vote No”? CEO and Director Turnover associated with Shareholder Activism, Working Paper. Denis, David J. and Atulya Sarin, 1999. Ownership and board structures in publicly traded corporations. Journal of Financial Economics 52, 187-223. Fama, Eugene F., 1980. Agency problems and the theory of the firm. Journal of Political Economy 88, 288-307. Fama, Eugene F. and Michael C. Jensen, 1983. Separation of Ownership and Control. Journal of Law and Economics 26, 301-325. Farrell, K.A., and D.A. Whidbee, 2000. The Consequences of Forced CEO Succession for Outside Directors. Journal of Business 73, 597-628. Ferri F. and T. Sandino, 2006. The Impact of Shareholder Activism on Financial Reporting and Compensation: The Case of Employee Stock Option Expensing, Working Paper. Ferris, S., Jagannathan M. and A. Pritchard, 2003. Too Busy to Mind the Business? Monitoring by Directors with Multiple Board Appointments? Journal of Finance 58, 1087-1111. Fich, Eliezer M. and Anil Shivdasani, 2006. Are busy boards effective monitors? Journal of Finance 61, 689-724. Fich, Eliezer M. and Anil Shivdasani, 2007. Financial fraud, director reputation, and shareholder wealth. Journal of Financial Economics 86, 306-336. Gillan, Stuart and Laura Starks, 1998, A Survey of Shareholder Activism: Motivation and Empirical Evidence, Working paper, 1998. Gillan, Stuart and Laura Starks, 2000, Corporate Governance Proposals and Shareholder Activism: The Role of Institutional Investors, Journal of Financial Economics, 57, 275-305. Gillan, Stuart and Laura Starks, 2007, The Evolution of Shareholder Activism in the United States, Journal of Applied Corporate Finance, 19, 55-73.

39
Gilson, S.C., 1990, Bankruptcy, Boards, Banks and Bondholders: Evidence on Changes in Corporate Ownership and Control when Firms Default, Journal of Financial Economics, 27, 355-388. Gompers, Paul A., Joy L. Ishi, and Andrew Metrick, 2003. Corporate Governance and Equity Prices. The Quarterly Journal of Economics 118, 107-155. Gordon, L., and Pound, J., 1993. Information, Ownership Structure, and Shareholder Voting: Evidence from Shareholder-sponsored corporate governance proposals. Journal of Finance 48: 697-718. Guo R., Kruse T. and T. Nohel, 2005. Undoing the Powerful Anti-takeover Force of Staggered Boards, Working Paper. Harford, Jarrad, 2003. Takeover bids and target directors’ incentives: the impact of a bid on directors’ wealth and board seats. Journal of Financial Economics 69, 51-83. Helland, E., 2006. Reputational penalties and the merits of class action securities litigation. Journal of Law and Economics 49, 365–395. Hu, Henry T.C., and Bernard Black, 2007. Hedge Funds, Insiders and the Decoupling of Economic and Voting Ownership: Empty Voting and Hidden (Morphable) Ownership, Journal of Corporate Finance. ISS (Institutional Shareholder Services), 2006. U.S. Proxy Voting Guidelines Jensen, Michael C. and William H. Meckling, 1976. Theory of firm – Managerial behavior, agency costs and ownership structure, Journal of Financial Economics, 3: 305. Kaplan, S.N., and D. Reihsus, 1990. Outside directorships and Corporate Performance. Journal of Financial Economics 27, 389-410. Karpoff, J. M. 2001. The Impact of Shareholder Activism on Target Companies: A Survey of Empirical Findings. Working Paper, University of Washington, Seattle, WA. Klein, April and Emanuel Zur. Hedge Fund Activism. Journal of Finance, forthcoming. Prevost, Andrew K. and Ramesh P. Rao, 2000. Of What Value Are Shareholder Proposals Sponsored by Public Pension Funds? Journal of Business 73, 177-204. Reuters 2003, Lifting the Lid: Ignoring Shareholders May Cost Board Seats, 08/09/2003. Riskmetrics, 2008. Investors push for proposal adoption, Risk & Governance Blog, 02/26/2008. Romano, Roberta, 2001. Less is more: making institutional investor activism a valuable mechanism of corporate governance. Yale Journal on Regulation 18, 174-251

40
Securities Exchange and Commission, 2007a. Roundtable Discussions Regarding the Proxy Process, http://www.sec.gov/news/openmeetings.shtml Securities Exchange and Commission, 2007b. Release Nos. 34-56135 Shareholder Choice Regarding Proxy Materials, http://www.sec.gov/rules/final/2007/34-56135.pdf Shivdasani Anil and David Yermack, 1999. CEO Involvement in the selection of new board members: an empirical analysis. Journal of Finance 54, 1829-1853. Smith, Michael P., 1996. Shareholder Activism by Institutional Investors: Evidence from CalPERS. The Journal of Finance 51, 227-252. Srinivasan, Suraj, 2005. Consequences of financial reporting failure for outside directors: Evidence from accounting restatements and audit committee members. Journal of Accounting Research 43, 291 – 334. The Economist, Will The Owners Please Stand Up? October 31, 2002. Thomas, Randall and James F. Cotter, 2007. Shareholder Proposals in the New Millennium: Shareholder Support, Board Response and Market Reaction. Journal of Corporate Finance, 13, 368-391. Wall Street Journal, Firms, Investors Trying More Talk, Less Acrimony. July 16, 2007. Wu, YiLin, 2000. Honey, CalPERS shrunk the board! Working Paper. Yermack, David, 2004. Remuneration, retention, and reputation incentives for outside directors. Journal of Finance 59, 2281-2308.

41
Appendix 1 Frequency of Shareholder Proposals Voted Upon (VU), Majority Votes (MV) and Implementations (I) by Year, Proposal Type and Proponent Identity
VU MV I VU MV I VU MV I VU MV I VU MV I VU MV I VU MV I VU MV I VU MV I
All Proposals 294 31 5 255 32 7 287 54 14 263 63 15 266 66 14 292 98 24 479 156 66 410 120 48 2546 620 193
By Proposal Type
Defense 64 25 4 65 26 5 93 48 10 81 54 11 72 51 8 94 76 17 127 95 44 80 68 35 676 443 134 Poison Pills 20 13 4 13 9 1 28 22 7 26 20 9 23 17 7 50 39 11 80 56 27 43 34 17 283 210 83 Classified Board 43 12 0 49 17 4 64 26 3 53 34 2 46 32 1 42 37 6 45 39 17 34 33 17 376 230 50 Other - Defense 1 0 0 3 0 0 1 0 0 2 0 0 3 2 0 2 0 0 2 0 0 3 1 1 17 3 1
Board 116 2 0 87 0 0 79 1 1 76 2 1 75 0 0 83 3 0 90 1 0 101 4 0 707 13 2 Board Independence 21 0 0 17 0 0 20 1 1 18 2 1 13 0 0 22 2 0 39 0 0 48 3 0 198 8 2 Board Elections 52 0 0 52 0 0 39 0 0 37 0 0 47 0 0 44 1 0 39 1 0 42 1 0 352 3 0 Board Qualifications 11 1 0 8 0 0 14 0 0 8 0 0 8 0 0 7 0 0 8 0 0 5 0 0 69 1 0 Board Compensation 30 1 0 8 0 0 6 0 0 9 0 0 4 0 0 2 0 0 2 0 0 1 0 0 62 1 0 Board-Others 2 0 0 2 0 0 0 0 0 4 0 0 3 0 0 8 0 0 2 0 0 5 0 0 26 0 0
Executive Compensation 55 1 0 48 0 0 67 1 1 44 0 0 59 0 0 53 4 2 205 49 18 178 37 6 709 92 27 Shr Approval for Golden 4 1 0 5 0 0 11 0 0 7 0 0 13 0 0 19 2 2 18 14 14 23 14 5 100 31 21 Expense Options 0 0 0 0 0 0 0 0 0 0 0 0 0 0 0 2 0 0 71 32 4 33 21 1 106 53 5 Shr Approval for Option Repricings 0 0 0 3 0 0 3 1 1 1 0 0 1 0 0 2 0 0 1 0 0 0 0 0 11 1 1 Exec Pay process 12 0 0 18 0 0 11 0 0 6 0 0 5 0 0 5 1 0 19 2 0 13 1 0 89 4 0 Link Pay to Perf 3 0 0 0 0 0 3 0 0 3 0 0 11 0 0 9 1 0 63 1 0 35 1 0 127 3 0 Restrict/Cap Exec Pay 27 0 0 12 0 0 30 0 0 14 0 0 16 0 0 6 0 0 27 0 0 59 0 0 191 0 0 Link Pay to Social Criteria 9 0 0 9 0 0 9 0 0 13 0 0 13 0 0 10 0 0 5 0 0 14 0 0 82 0 0 Exec Comp -Others 0 0 0 1 0 0 0 0 0 0 0 0 0 0 0 0 0 0 1 0 0 1 0 0 3 0 0
Shareholder Rights 8 2 1 12 6 2 10 4 2 14 7 3 23 14 6 17 14 5 12 10 4 11 8 6 107 65 29 Eliminate Supermajority Provision 0 0 0 2 1 0 3 2 1 7 5 1 12 10 3 10 9 3 9 9 3 7 7 5 50 43 16 Confidential Voting 4 1 1 7 3 1 5 1 1 5 2 2 7 4 3 5 4 2 0 0 0 1 1 1 34 16 11 Right to Act by Written Consent 3 1 0 3 2 1 2 1 0 1 0 0 1 0 0 0 0 0 1 0 0 0 0 0 11 4 1 Right to Call Special Meeting 0 0 0 0 0 0 0 0 0 1 0 0 2 0 0 0 0 0 2 1 1 0 0 0 5 1 1 Shrd. Rights - Others 1 0 0 0 0 0 0 0 0 0 0 0 1 0 0 2 1 0 0 0 0 3 0 0 7 1 0
Others 51 1 0 43 0 0 38 0 0 48 0 0 37 1 0 45 1 0 45 1 0 40 3 1 347 7 1 Auditor Independence 1 0 0 1 0 0 1 0 0 1 0 0 1 0 0 25 0 0 21 0 0 16 2 1 67 2 1 Strategic Alternatives 23 0 0 22 0 0 21 0 0 32 0 0 19 0 0 2 0 0 2 0 0 5 1 0 126 1 0 Various - Others 27 1 0 20 0 0 16 0 0 15 0 0 17 1 0 18 1 0 22 1 0 19 0 0 154 4 0
By Proponent
Individual 172 8 0 167 17 2 170 17 2 169 34 6 169 44 7 159 65 13 195 75 30 184 66 37 1385 326 97Labor Unions 40 9 2 49 9 2 56 23 6 35 17 6 37 8 3 56 13 5 209 59 21 175 43 9 657 181 54Public pensions 9 2 1 17 5 3 17 7 3 17 9 2 8 2 0 18 7 2 8 5 2 17 4 0 111 41 13Religious Organizations 18 0 0 11 0 0 17 0 0 10 0 0 8 0 0 5 3 0 7 0 0 12 0 0 88 3 0Other shareholder groups 51 12 2 10 1 0 27 7 3 28 3 1 18 4 2 17 6 3 22 6 5 19 7 2 192 46 18Not disclosed 4 0 0 1 0 0 0 0 0 4 0 0 26 8 2 37 4 1 38 11 8 3 0 0 113 23 11
2002 20031997 1998 1999 2004 1997-20042000 2001

42
Figure 1 Frequency of Shareholder Proposals Voted Upon, Majority Votes, Formal Approvals and Implementations by Year
Frequency of Shareholder Proposals Voted Upon by Year
0
100
200
300
400
500
600
1997 1998 1999 2000 2001 2002 2003 2004 Year
N
Frequency of Majority Vote Proposals and Formal Approvals by Year
0.0%
10.0%
20.0%
30.0%
40.0%
1997 1998 1999 2000 2001 2002 2003 2004 Year
% Majority VoteFormal Approval
Frequency of Implementations by Year
0.0%
10.0%
20.0%
30.0%
40.0%
50.0%
1997 1998 1999 2000 2001 2002 2003 2004 Year
%
Majority VoteFormal Approval
Figure 1 shows the frequency of shareholder proposals voted upon (top panel), majority votes and formal approvals as a percentage of proposals voted upon (middle panel), and implementations as a percentage of majority votes and formal approvals (bottom panel) by year. The sample consists of 2,546 shareholder proposals, 620 majority votes (555 formally approved) and 193 implementations over the 1997-2004 period. See Appendix 1 for details.

43
Figure 2 Frequency of Shareholder Proposals Voted Upon, Majority Votes, and Implementations by Proposal Type
Frequency of Proposals Voted Upon by Proposal Type
0.0%
10.0%
20.0%
30.0%
40.0%
Proposal Type
%
Defense Board Exec. Comp. Shareholder Rights Other
1997 - 2004 Period 1997 - 2002 Period 2003 - 2004 Period
Frequency of Majority Votes by Proposal Type
0.0%
15.0%
30.0%
45.0%
60.0%
75.0%
Proposal Type
%
1997 - 2004 Period 1997 - 2002 Period 2003 - 2004 Period Frequency of Implementations by Proposal Type
0.0%
15.0%
30.0%
45.0%
60.0%
Proposal Type
%
1997 - 2004 Period 1997 - 2002 Period 2003 - 2004 Period Figure 2 shows the frequency of shareholder proposals voted upon (top panel), majority votes as a percentage of proposals voted upon (middle panel), and implementations as a percentage of majority votes (bottom panel) by proposal type for the entire sample period as well as for two sub-periods. The sample consists of 2,546 shareholder proposals, 620 majority votes (555 formally approved) and 193 implementations over the 1997-2004 period. See Appendix 1 for details.

44
Figure 3 Frequency of Shareholder Proposals Voted Upon, Majority Votes, and Implementations by Proponent Identity
Frequency of Proposals Voted Upon by Proponent Identity
0.0%
10.0%
20.0%
30.0%
40.0%
50.0%
60.0%
Proponent Identity
%
Individual Labor Unions Public Pensions Religious Organizations Other Shareholder Groups
1997 - 2004 Period 1997 - 2002 Period 2003 - 2004 Period
Frequency of Majority Votes by Proponent Identity
0.0%
10.0%
20.0%
30.0%
40.0%
Proponent Identity
%
1997 - 2004 Period 1997 - 2002 Period 2003 - 2004 Period
Frequency of Implementations by Proponent Identity
0.0%
15.0%
30.0%
45.0%
60.0%
75.0%
Proponent Identity
%
1997 - 2004 Period 1997 - 2002 Period 2003 - 2004 Period
Figure 3 shows the frequency of shareholder proposals voted upon (top panel), majority votes as a percentage of proposals voted upon (middle panel), and implementations as a percentage of majority votes (bottom panel) by proponent identity for the entire sample period as well as for two sub-periods. The sample consists of 2,546 shareholder proposals, 620 majority votes (555 formally approved) and 193 implementations over the 1997-2004 period. See Appendix 1 for details.
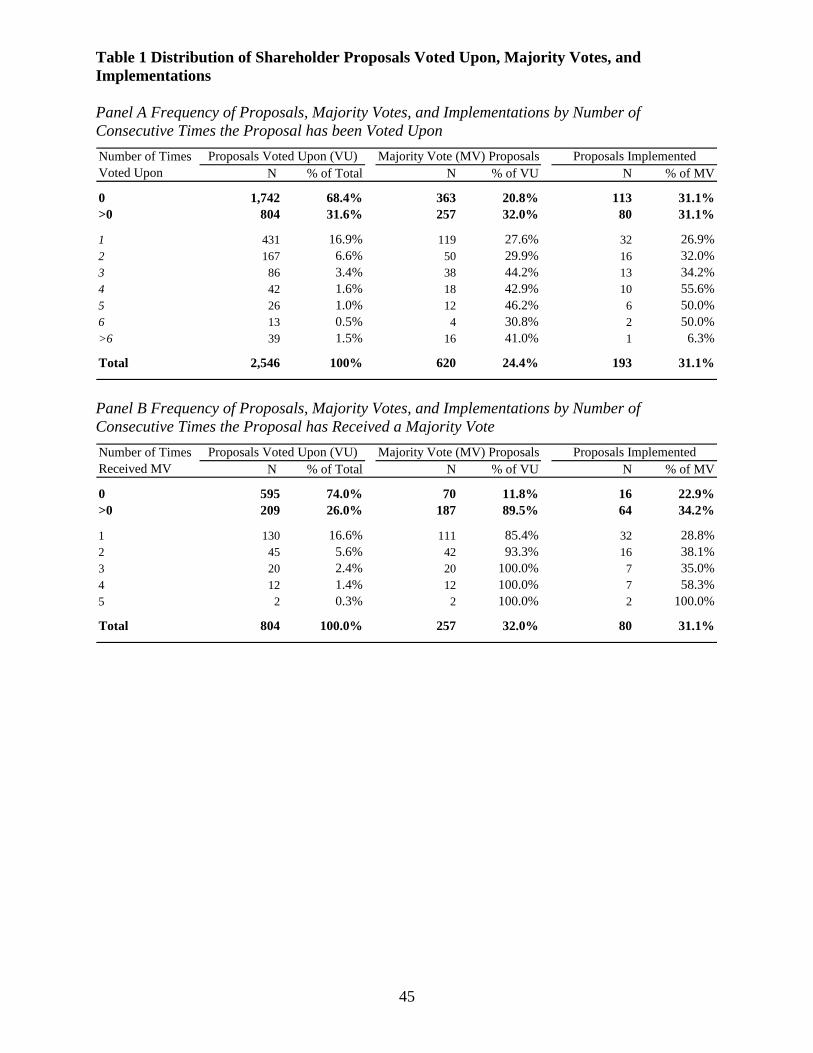
45
Table 1 Distribution of Shareholder Proposals Voted Upon, Majority Votes, and Implementations Panel A Frequency of Proposals, Majority Votes, and Implementations by Number of Consecutive Times the Proposal has been Voted Upon
N % of Total N % of VU N % of MV
0 1,742 68.4% 363 20.8% 113 31.1%>0 804 31.6% 257 32.0% 80 31.1%
1 431 16.9% 119 27.6% 32 26.9%2 167 6.6% 50 29.9% 16 32.0%3 86 3.4% 38 44.2% 13 34.2%4 42 1.6% 18 42.9% 10 55.6%5 26 1.0% 12 46.2% 6 50.0%6 13 0.5% 4 30.8% 2 50.0%>6 39 1.5% 16 41.0% 1 6.3%
Total 2,546 100% 620 24.4% 193 31.1%
Number of Times Voted Upon
Proposals ImplementedProposals Voted Upon (VU) Majority Vote (MV) Proposals
Panel B Frequency of Proposals, Majority Votes, and Implementations by Number of Consecutive Times the Proposal has Received a Majority Vote
N % of Total N % of VU N % of MV
0 595 74.0% 70 11.8% 16 22.9%>0 209 26.0% 187 89.5% 64 34.2%
1 130 16.6% 111 85.4% 32 28.8%2 45 5.6% 42 93.3% 16 38.1%3 20 2.4% 20 100.0% 7 35.0%4 12 1.4% 12 100.0% 7 58.3%5 2 0.3% 2 100.0% 2 100.0%
Total 804 100.0% 257 32.0% 80 31.1%
Number of Times Received MV
Majority Vote (MV) ProposalsProposals Voted Upon (VU) Proposals Implemented
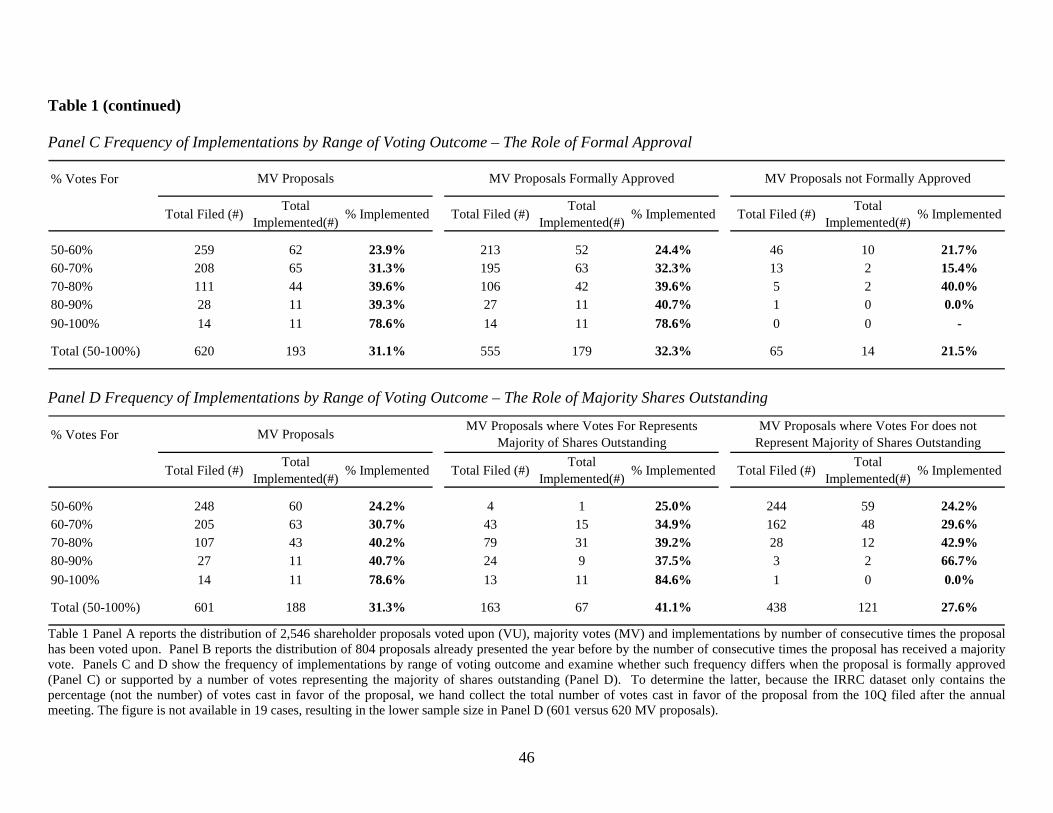
46
Table 1 (continued) Panel C Frequency of Implementations by Range of Voting Outcome – The Role of Formal Approval
% Votes For
Total Filed (#) Total Implemented(#) % Implemented Total Filed (#) Total
Implemented(#) % Implemented Total Filed (#) Total Implemented(#) % Implemented
50-60% 259 62 23.9% 213 52 24.4% 46 10 21.7%60-70% 208 65 31.3% 195 63 32.3% 13 2 15.4%70-80% 111 44 39.6% 106 42 39.6% 5 2 40.0%80-90% 28 11 39.3% 27 11 40.7% 1 0 0.0%90-100% 14 11 78.6% 14 11 78.6% 0 0 -
Total (50-100%) 620 193 31.1% 555 179 32.3% 65 14 21.5%
MV Proposals MV Proposals Formally Approved MV Proposals not Formally Approved
Panel D Frequency of Implementations by Range of Voting Outcome – The Role of Majority Shares Outstanding
% Votes For
Total Filed (#) Total Implemented(#) % Implemented Total Filed (#) Total
Implemented(#) % Implemented Total Filed (#) Total Implemented(#) % Implemented
50-60% 248 60 24.2% 4 1 25.0% 244 59 24.2%60-70% 205 63 30.7% 43 15 34.9% 162 48 29.6%70-80% 107 43 40.2% 79 31 39.2% 28 12 42.9%80-90% 27 11 40.7% 24 9 37.5% 3 2 66.7%90-100% 14 11 78.6% 13 11 84.6% 1 0 0.0%
Total (50-100%) 601 188 31.3% 163 67 41.1% 438 121 27.6%
MV Proposals MV Proposals where Votes For Represents Majority of Shares Outstanding
MV Proposals where Votes For does not Represent Majority of Shares Outstanding
Table 1 Panel A reports the distribution of 2,546 shareholder proposals voted upon (VU), majority votes (MV) and implementations by number of consecutive times the proposal has been voted upon. Panel B reports the distribution of 804 proposals already presented the year before by the number of consecutive times the proposal has received a majority vote. Panels C and D show the frequency of implementations by range of voting outcome and examine whether such frequency differs when the proposal is formally approved (Panel C) or supported by a number of votes representing the majority of shares outstanding (Panel D). To determine the latter, because the IRRC dataset only contains the percentage (not the number) of votes cast in favor of the proposal, we hand collect the total number of votes cast in favor of the proposal from the 10Q filed after the annual meeting. The figure is not available in 19 cases, resulting in the lower sample size in Panel D (601 versus 620 MV proposals).

47
Table 2 Descriptive Statistics and Univariate Tests Panel A Descriptive Statistics for Targeted Firms, IRRC Universe and Compustat Universe
Variable Mean Median Mean Median Mean Median
LEVERAGE 0.29 0.28 0.25 0.23 0.23 0.17 0.04 *** 0.05 ***BM_RATIO 0.54 0.45 0.55 0.46 0.60 0.55 -0.01 -0.01SIZE (in millions) 25,608 7,376 7,444 1,164 2,102 164 18,163 *** 6,213 ***RET1YR_PRE 0.06 0.02 0.13 0.04 0.20 0.00 -0.07 *** -0.02G 9.78 10.00 8.97 9.00 - - 0.81 *** 1.00 ***%INDEP 0.68 0.71 0.62 0.64 - - 0.06 *** 0.08 ***CEOCHAIR 0.79 1.00 0.65 1.00 - - 0.14 *** 0.00 ***INSIDER_OWN 0.05 0.01 0.09 0.03 - - -0.04 *** -0.02 ***INSTIT_OWN 0.61 0.61 0.61 0.63 0.32 0.25 0.01 -0.02
Mean (t-test) Median (Wilcox)
Target vs. IRRCTargets (N = 1,123) IRRC (N = 7,283) Compustat (N = 38,062)

48
Panel B Descriptive Statistics for the Sample of Shareholder Proposals Voted Upon
VOTES_FOR 2,523 31.4% 10.4% 27.6% 49.6% 1,903 20.9% 17.1% 620 63.7% 61.9% 42.8% *** 44.8% ***MAJ_VOTE 2,546 0.24 - - - 1,926 0.00 - 620 1.00 - - -INSTIT_OWN 2,244 60.6% 50.6% 60.0% 72.2% 1,683 58.1% 57.9% 561 68.1% 68.4% 10.0% *** 10.5% ***INSIDER_OWN 1,866 4.8% 0.2% 0.8% 2.7% 1,354 5.6% 0.8% 512 2.8% 0.7% -2.8% *** -0.1% *SIZE (in millions) 2,495 31,461 2,030 8,708 33,090 1,882 36,723 9,827 613 15,308 6,603 -21,415 *** -3,224 ***ABRET3YR_PRE 2,452 -0.07 -0.54 -0.13 0.33 1,854 -0.07 -0.13 598 -0.09 -0.14 -0.02 -0.02PRES1 2,546 0.32 - - - 1,926 0.28 - 620 0.41 - 0.13 *** -G 2,515 9.43 8 9 11 1,904 9.10 9.00 611 10.46 11.00 1.36 *** 2.00 ***
All Proposals Voted Upon Not MV Proposals MV Proposals MV vs. Not MV
Variable N Mean Q1 Median Q3 N Mean Median N Median (Wilcox)Mean Median Mean (t-test)

49
Table 2 (continued) Panel C Descriptive Statistics for the Sample of Majority-Vote (MV) Shareholder Proposals
IMPLEMENTED 620 0.31 - - - 427 0.00 - 193 1.00 - - -
CEOCHAIR 620 0.80 - - - 427 0.78 - 193 0.84 - 0.06 * -%INDEP 607 75.4% 69.2% 77.8% 85.7% 416 75.8% 77.8% 191 74.4% 77.8% -1.4% 0.0%INSIDER_OWN 512 2.8% 0.3% 0.7% 2.0% 344 2.6% 0.7% 168 3.3% 0.8% 0.7% 0.1%
G 611 10.46 9.00 11.00 12.00 420 10.55 11.00 191 10.27 10.00 -0.28 -1.00 *
VOTES_FOR 620 63.7% 55.5% 61.9% 69.9% 427 62.2% 60.7% 193 66.9% 65.0% 4.7% *** 4.3% ***N_MAJ_CONS 620 0.50 0.00 0.00 1.00 427 0.44 0.00 193 0.64 0.00 0.19 ** 0.00ACTIVIST_OWN 562 2.7% 2.1% 2.7% 3.2% 390 2.6% 2.6% 172 3.0% 3.0% 0.4% *** 0.4% ***PROPONENT_OWN 424 4.5% - - - 295 2.7% - 129 8.5% - 5.8% *** -VOTES_WITHHELD 611 0.21 - - - 423 0.19 - 188 0.27 - 0.08 ** -PEER_IMPLEMENTED 620 0.24 - - - 427 0.21 - 193 0.31 - 0.10 *** -
SIZE (in millions) 613 15,308 1,720 6,603 15,469 425 14,644 6,281 188 16,809 7,404 2,166 1,123ABRET3YR_PRE 598 -0.09 -0.57 -0.14 0.36 415 -0.09 -0.13 183 -0.09 -0.15 0.01 -0.02
AFTER_2001 620 0.60 - - - 427 0.55 - 193 0.72 - 0.16 *** -
Median Q3
All Majority-vote Proposals
Variable N Mean Q1 N Mean Median
Not Implemented Implemented Implemented vs. Not Implemented
Mean (t-test) Median (Wilcox)N Mean Median
Table 2 Panel A presents descriptive statistics for firms that are targeted by a shareholder proposal, the IRRC universe (which corresponds to the S&P 1500, excluding targeted firms) and the Compustat universe (also excluding targeted firms). Panel B presents descriptive statistics for the sample of 2,546 shareholder proposals voted upon, the 620 proposals that received a majority vote and the 1,926 proposals that did not. Panel C presents descriptive statistics for the sample of 620 shareholder proposals that received a majority vote, the 193 MV proposals that were implemented and the 427 that were not implemented. In each panel, we also provide the results for tests of differences in means (medians) with two-sample t-tests (Wilcoxon tests), between targeted firms and IRRC universe (Panel A), majority vote and non-majority vote proposals (Panel B), and implemented and not implemented MV proposals (Panel C). *** (**, *) denotes significance at the 0.01 (0.05, 0.10) level.

50
Variables in Panel A are defined as follows: LEVERAGE = the leverage ratio defined as current liabilities plus long-term debt scaled by total assets (Source: Compustat). BM_RATIO = book value of equity scaled by market value of equity (Source: Compustat). SIZE = equity market value measured at the end of the fiscal year expressed in millions of dollars (Source: Compustat). RET1YR_PRE = fiscal year stock return (Source: CRSP). G = governance index as developed by Gompers, Ishii, and Metrick (2003). The index is available in the years 1995, 1998, 2000, 2002, and 2004. We use the most recent governance index in or before the year of the annual meeting (Source: IRRC Governance Dataset). %INDEP = percentage of board members classified as independent by IRRC (Source: IRRC Directors Dataset). CEOCHAIR = indicator variable equal to 1 if the firm’s CEO is also chair of the board of directors, and 0 otherwise (Source: IRRC Directors Dataset). INSIDER_OWN = percentage of shares outstanding held by executives, measured on the date of the annual meeting (Source: Execucomp), plus the percentage of shares outstanding held by independent directors, measured on the most recent quarter end before the annual meeting (Source: IRRC Directors Dataset). INSTIT_OWN = percentage of shares outstanding held by institutions, measured on the most recent quarter end before the annual meeting (Source: Thomson Financial). Variables in Panel B (not already included in Panel A) are defined as follows: VOTES_FOR = percentage of votes cast in favor of the proposal (Source: IRRC Voting Dataset). MAJ_VOTE = Indicator variable equal to 1 if the proposal received a majority of votes cast, and 0 otherwise. (Source: IRRC Voting Dataset). SIZE = equity market value measured at the time of the annual meeting expressed in millions of dollars (Source: Compustat). ABRET3YR_PRE = size-adjusted stock return over the three years leading up to the annual meeting. The size-adjusted return is calculated as the monthly compounded buy-and-hold stock return less the mean stock return for firms in the same equity market value decile compounded over the same period. (Source: CRSP) PRES1 = indicator variable equal to 1 if the same proposal was presented the prior year, and 0 otherwise (Source: IRRC Voting Dataset for 1997-2004; for proposals presented in 1997, we hand-collect data from earlier proxy statements and 10-Qs to determine past history of the proposal and its voting outcome). Variables in Panel C (not already included in Panels A and B) are defined as follows: IMPLEMENTED = indicator variable equal to 1 if the proposal is implemented during the year following a majority vote, and 0 otherwise (Source: IRRC Voting Dataset). N_MAJ_CONS = number of consecutive years the proposal has received a majority vote (Source: IRRC Voting Dataset for 1997-2004; for proposals presented in 1997, we hand-collect data from earlier proxy statements and 10-Qs to determine past history of the proposal and its voting outcome). ACTIVIST_OWN = percentage of shares outstanding held by activist pension funds, as identified in Cremers and Nair (2006). PROPONENT_OWN = indicator variable equal to 1 if the shareholder submitting the proposal owns more than 1% of shares outstanding (Source: hand-collected from proxy statements, when disclosed). VOTES_WITHHELD = indicator variable equal to 1 if at least 20% of votes were withheld from at least one director and 0 otherwise (Source: hand collected from 10-Qs filed after the annual meeting) PEER_IMPLEMENTED = number of firms in the S&P 1500 with the same two-digit SIC code that implemented a similar proposal during the prior two years. AFTER_2001 = indicator variable equal to 1 if the year of the annual meeting where the proposal wins a majority vote is 2002 or later, and 0 otherwise.

51
Table 3 Correlations (Pearson above diagonal / Spearman below diagonal)
Variable 1 2 3 4 5 6 7 8 9 10 11 12 13 14
1 IMPLEMENTED 0.06 -0.02 0.06 -0.04 0.25 *** 0.08 * 0.13 *** 0.24 *** 0.08 * 0.15 *** -0.08 * -0.01 0.15 ***
2 CEOCHAIR 0.06 0.16 *** -0.01 0.06 0.03 0.04 -0.03 0.00 0.09 * 0.04 0.04 0.03 0.10 **
3 %INDEP -0.01 0.12 *** -0.26 *** 0.06 0.02 0.13 *** -0.09 * -0.10 * -0.01 -0.03 0.17 *** 0.10 ** 0.074 INSIDER_OWN 0.04 -0.18 *** -0.30 *** 0.09 ** -0.07 -0.08 0.09 * 0.19 *** 0.05 -0.05 -0.25 *** -0.04 0.015 G -0.06 0.06 0.01 0.12 *** 0.10 ** 0.08 * -0.12 *** 0.08 0.04 -0.09 ** -0.13 *** -0.03 -0.12 ***
6 VOTES_FOR 0.23 *** 0.03 0.03 -0.06 0.13 *** 0.17 *** 0.04 0.11 ** 0.22 *** 0.14 *** -0.15 *** -0.05 0.16 ***
7 N_MAJ_CONS 0.04 0.04 0.13 *** -0.14 *** 0.06 0.14 *** -0.03 -0.11 ** 0.23 *** 0.05 0.12 *** -0.02 0.14 ***
8 ACTIVIST_OWN 0.18 *** 0.03 -0.01 0.08 * -0.12 *** 0.10 ** -0.04 -0.05 0.16 *** 0.09 * -0.08 * 0.20 *** 0.38 ***
9 PROPONENT_OWN 0.24 *** 0.00 -0.01 0.19 *** 0.09 0.10 * -0.13 ** -0.03 -0.04 -0.01 -0.28 *** -0.19 *** -0.11 *
10 VOTES_WITHHELD 0.08 * 0.09 * 0.00 -0.01 0.05 0.20 *** 0.31 *** 0.21 *** -0.04 0.06 0.05 0.04 0.31 ***
11 PEER_IMPLEMENTED 0.15 *** 0.04 0.00 -0.05 -0.11 ** 0.15 *** 0.07 0.08 * -0.01 0.06 -0.05 0.10 0.21 ***
12 LNSIZE -0.07 0.01 0.13 *** -0.44 *** -0.15 *** -0.14 *** 0.11 ** -0.04 -0.25 *** 0.04 -0.03 0.33 *** 0.13 ***
13 ABRET3YR_PRE -0.03 0.04 0.11 ** -0.08 * -0.03 -0.01 0.00 0.29 *** -0.19 *** 0.06 0.10 ** 0.34 *** 0.44 ***
14 AFTER_2001 0.15 *** 0.10 ** 0.09 * -0.09 * -0.15 *** 0.16 *** 0.11 ** 0.54 *** -0.11 ** 0.31 *** 0.21 *** 0.12 *** 0.47 ***
Table 3 displays the correlations for the variables of interest for the subset of observations with available data for the multivariate analysis. Pearson (Spearman) correlations are displayed above (below) the diagonal. *** (**, *) denotes significance at the 0.01 (0.05, 0.10) level. Variables are defined as follows (more details about the sources for each variable are at the bottom of Table 2): IMPLEMENTED = indicator variable equal to 1 if the proposal is implemented during the year following a majority vote, and 0 otherwise. CEOCHAIR = indicator variable equal to 1 if the firm’s CEO is also chair of the board of directors, and 0 otherwise. %INDEP = percentage of board members classified as independent by IRRC. INSIDER_OWN = percentage of shares outstanding held by executives and independent directors. G = governance index as developed by Gompers, Ishii, and Metrick (2003). VOTES_FOR = percentage of votes cast in favor of the proposal. N_MAJ_CONS = number of consecutive years the proposal has received a majority vote. ACTIVIST_OWN = percentage of shares outstanding held by activist pension funds, as identified in Cremers and Nair (2006). PROPONENT_OWN = indicator variable equal to 1 if the shareholder submitting the proposal owns more than 1% of shares outstanding. VOTES_WITHHELD = indicator variable equal to 1 if at least 20% of votes were withheld from at least one director, and 0 otherwise. PEER_IMPLEMENTED = number of firms in the S&P 1500 with the same two-digit SIC code that implemented a similar proposal during the prior two years. LNSIZE = natural log of equity market value measured at the time of the annual meeting expressed in millions of dollars. ABRET3YR_PRE = size-adjusted stock return over the three years leading up to the annual meeting. AFTER_2001 = indicator variable equal to 1 if the year of the annual meeting where the proposal wins a majority vote is 2002 or later, and 0 otherwise.

52
Table 4 Multivariate Analysis of the Determinants of Voting Outcome Dependent Variable: MAJ_VOTE
Variable Predicted Sign Coefficient
Intercept -3.93 -8.98 ***
INSTIT_OWN + 2.07 6.85 ***
INSIDER_OWN - -4.32 -6.00 ***
LNSIZE - -0.06 -2.04 **
ABRET3YR_PRE - -0.18 -2.80 ***
PRES1 + 0.01 0.12G + 0.05 2.86 ***
UNION_PROP ? 0.58 6.44 ***
INSTIT_PROP + 0.25 2.13 ***
DEFENSE ? 2.45 26.11 ***
SHAREHOLDER RIGHTS ? 2.52 15.16 ***
YEAR = 1999 0.16 1.02
YEAR = 2000 0.37 2.31 **
YEAR = 2001 0.57 3.58 ***
YEAR = 2002 1.06 7.13 ***
YEAR = 2003 1.13 6.95 ***
YEAR = 2004 1.35 8.14 ***
t-statistic
Table 4 presents results from a probit regression estimated for the sample of 1,675 shareholder proposals that meet the data availability requirements. ***, **, and * denote significance at the 0.01, 0.05, and 0.10 level, respectively. We estimate and report heteroskedasticity-adjusted standard errors clustered by firm to account for the fact that we have multiple observations for certain firms in our sample. Variables are defined as follows (more details about the sources for each variable are at the bottom of Table 2): MAJ_VOTE = indicator variable equal to 1 if the proposal received a majority of votes cast, and 0 otherwise. INSTIT_OWN = percentage of shares outstanding held by institutions. INSIDER_OWN = percentage of shares outstanding held by executives and independent directors. LNSIZE = natural log of equity market value measured at the time of the annual meeting (millions of dollars.) ABRET3YR_PRE = size-adjusted stock return over the three years leading up to the annual meeting. PRES1 = indicator variable equal to 1 if the same proposal was presented the prior year, and 0 otherwise. G = governance index as developed by Gompers, Ishii, and Metrick (2003). UNION_PROP = indicator variable equal to 1 if the proponent is a labor union fund, and 0 otherwise. INSTIT_PROP = indicator variable equal to 1 if the proponent is a public pension or another shareholder group (e.g., investment advisors, mutual funds, etc.), and 0 otherwise. DEFENSE = indicator variable equal to 1 if the shareholder proposal requests the removal of an anti-takeover provision, and 0 otherwise (see Appendix 1 for examples). SHAREHOLDER RIGHTS = indicator variable equal to 1 if the shareholder proposal deals with a provision concerning shareholder rights, and 0 otherwise (see Appendix 1 for examples). YEAR = year of the annual meeting where the proposal is voted upon.

53
Table 5 Multivariate Analysis of the Determinants of the Implementation Decision Dependent Variable: IMPLEMENTED
Variable Predicted Sign Coefficient Coefficient
Intercept -4.12 -4.94 *** -4.93 -4.96 ***
CEOCHAIR - 0.16 1.08 0.25 1.29%INDEP + 0.06 0.12 -0.51 -0.80
INSIDER_OWN -/? -0.16 -0.11 -0.70 -0.49
G ? 0.00 -0.05 0.00 -0.11
VOTES_FOR + 0.03 4.27 *** 0.03 2.85 ***
N_MAJ_CONS + 0.06 0.95 0.06 0.71
ACTIVIST_OWN + 9.72 1.40 17.63 2.21 **
PROPONENT_OWN + 1.67 3.75 ***
VOTES_WITHHELD + -0.08 -0.48 -0.23 -1.18
UNION_PROP + 0.44 2.23 ** 0.65 2.72 ***
INSTIT_PROP + 0.41 2.24 ** 0.39 1.72 *
PEER_IMPLEMENTED + 0.30 1.95 ** 0.26 1.35LNSIZE + -0.04 -0.86 0.02 0.48
ABRET3YR_PRE - -0.11 -0.98 -0.25 -1.95 ***
DEFENSE ? 0.95 2.40 *** 1.06 2.59 ***
SHAREHOLDER RIGHTS ? 1.50 3.37 *** 1.70 3.20 ***
AFTER_2001 + 0.58 3.05 *** 0.76 3.66 ***
N 451 310
Model (1) Model (2)t-statistic t-statistic
Table 5 presents results from a probit regression with a correction for selection bias estimated for the sample of 451 shareholder proposals that received a majority vote and meet the data availability requirements. ***, **, and * denote significance at the 0.01, 0.05, and 0.10 level, respectively. We estimate and report heteroskedasticity-adjusted standard errors clustered by firm to account for the fact that we have multiple observations for certain firms in our sample. A Wald test of independent equations (ρ = 0) produces Χ 2 = 2.87 (p = 0.09) in Model (1) and Χ 2 = 3.93 (p = 0.05) in Model (2). Variables are defined as follows (more details about the sources for each variable are at the bottom of Table 2): IMPLEMENTED = indicator variable equal to 1 if the proposal is implemented during the year following a majority vote, and 0 otherwise. CEOCHAIR = indicator variable equal to 1 if the firm’s CEO is also chair of the board of directors, and 0 otherwise. %INDEP = percentage of board members classified as independent by IRRC. INSIDER_OWN = percentage of shares outstanding held by executives and independent directors. G = governance index as developed by Gompers, Ishii, and Metrick (2003). VOTES_FOR = percentage of votes cast in favor of the proposal. N_MAJ_CONS = number of consecutive years the proposal has received a majority vote. ACTIVIST_OWN = percentage of shares outstanding held by activist pension funds, as identified in Cremers and Nair (2006).
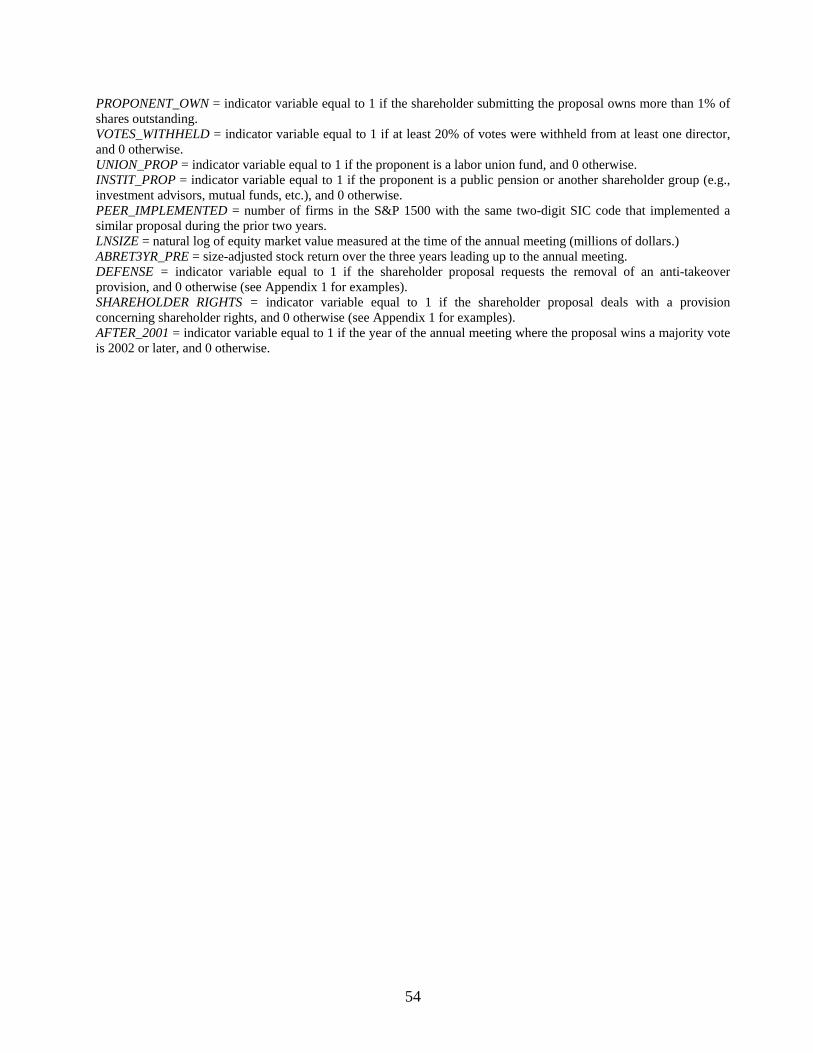
54
PROPONENT_OWN = indicator variable equal to 1 if the shareholder submitting the proposal owns more than 1% of shares outstanding. VOTES_WITHHELD = indicator variable equal to 1 if at least 20% of votes were withheld from at least one director, and 0 otherwise. UNION_PROP = indicator variable equal to 1 if the proponent is a labor union fund, and 0 otherwise. INSTIT_PROP = indicator variable equal to 1 if the proponent is a public pension or another shareholder group (e.g., investment advisors, mutual funds, etc.), and 0 otherwise. PEER_IMPLEMENTED = number of firms in the S&P 1500 with the same two-digit SIC code that implemented a similar proposal during the prior two years. LNSIZE = natural log of equity market value measured at the time of the annual meeting (millions of dollars.) ABRET3YR_PRE = size-adjusted stock return over the three years leading up to the annual meeting. DEFENSE = indicator variable equal to 1 if the shareholder proposal requests the removal of an anti-takeover provision, and 0 otherwise (see Appendix 1 for examples). SHAREHOLDER RIGHTS = indicator variable equal to 1 if the shareholder proposal deals with a provision concerning shareholder rights, and 0 otherwise (see Appendix 1 for examples). AFTER_2001 = indicator variable equal to 1 if the year of the annual meeting where the proposal wins a majority vote is 2002 or later, and 0 otherwise.

55
Table 6 Multivariate Analysis of the Consequences of the Implementation Decision Panel A Likelihood of Director Turnover Subsequent to a Majority Vote
VariablePredicted Sign Coefficient Coefficient Coefficient
Intercept -2.21 -5.61 *** -2.17 -5.53 *** -2.17 -5.52 ***
AGE_65_to_69 + 0.30 2.53 *** 0.30 2.48 *** 0.30 2.53 ***
AGE_70 + 1.65 9.89 *** 1.66 9.94 *** 1.65 9.91 ***
TENURE + 0.01 0.99 0.01 0.95 0.01 0.95
N_BOARDS - -0.01 -0.22 -0.01 -0.19 -0.01 -0.23
GRAY + 0.23 1.54 0.23 1.56 0.23 1.56
FEMALE - -0.06 -0.41 -0.06 -0.42 -0.06 -0.42COMP_COMM - -0.26 -2.40 ** -0.26 -2.38 ** -0.26 -2.41 **
AUDIT_COMM - -0.42 -3.97 *** -0.41 -3.93 *** -0.42 -4.02 ***
NOM_COMM - -0.37 -3.58 *** -0.36 -3.56 *** -0.37 -3.60 ***
DIR_OWN - 3.01 1.33 2.90 1.28 2.88 1.28ABRET1YR_POST - -0.15 -1.03 -0.13 -0.91 -0.15 -1.03
ABRET1YR_PRE - -0.51 -3.37 *** -0.50 -3.38 *** -0.50 -3.33 ***
LNSIZE - -0.05 -1.58 -0.06 -1.76 * -0.06 -1.67 *
CEO_TURNOVER + 1.30 12.04 *** 1.31 12.09 *** 1.30 12.05 ***
ELECTION ? -0.30 -2.98 *** -0.32 -3.11 *** -0.30 -2.98 ***
ELECTION × VOTES_WITHHELD>20% + 0.15 0.70 0.19 0.89 -0.04 -0.14ELECTION × VOTES_WITHHELD>20% × VOTE_NO + 1.08 2.43 ***
IMPLEMENTED - -0.28 -2.61 *** -0.18 -1.44 -0.29 -2.67 ***
IMPLEMENTED × VOTES_FOR>70% - -0.33 -1.68 *
Year Indicator Variables Yes Yes Yes
N 3,942 3,942 3,942N Dependent Variable = 1 583 583 583Pseudo R2 13.28% 13.46% 13.48%
F-tests Coefficient Coefficient
0.74 3.83 ***
-0.51 8.11 ***IMPLEMENTED + IMPLEMENTED × VOTES_FOR>70%
χ2
Model (2)
t-statistict-statistic
Model (1) Model (3)
t-statistic
χ2
ELECTION + ELECTION × VOTES_WITHHELD>20% + ELECTION × VOTES_WITHHELD>20%
DIR_TURNOVER DIR_TURNOVER DIR_TURNOVER

56
Table 6 (continued) Panel B Changes in Other Directorships Subsequent to a Majority Vote
VariablePredicted Sign Coefficient Predicted Sign Coefficient Predicted Sign Coefficient
Intercept 0.06 1.04 -1.98 -4.96 *** -2.70 -6.28 ***
AGE_65_to_69 - -0.08 -3.64 *** + 0.27 2.08 ** - -0.49 -2.84 ***
AGE_70 - -0.21 -5.71 *** + 1.14 4.83 *** - -1.32 -3.18 ***
TENURE ? 0.00 -1.47 ? 0.00 -0.51 ? -0.04 -3.39 ***
N_BOARDS -/? -0.15 -13.18 *** + 0.49 8.46 *** + 0.18 4.48 ***
GRAY - 0.01 0.42 + -0.13 -0.64 - -0.14 -0.68FEMALE + 0.06 2.54 *** - -0.43 -2.76 *** + 0.14 0.90ABRET1YR_POST + -0.06 -2.43 ** - 0.33 2.03 ** + -0.37 -1.92 **
ABRET1YR_PRE + -0.01 -0.46 - -0.01 -0.09 + -0.02 -0.11LNSIZE + 0.01 2.19 ** - 0.01 0.26 + 0.12 2.90 ***
ELECTION ? -0.03 -1.83 * ? 0.07 0.64 ? -0.27 -2.09 **
ELECTION × VOTES_WITHHELD>20% - -0.03 -0.79 + 0.11 0.45 - -0.48 -1.20OFF_OWN_BOARD - -0.11 -3.21 *** + 0.66 4.29 *** ? 0.24 1.34IMPLEMENTED + 0.05 2.85 *** - -0.29 -2.39 ** + 0.10 0.77
Year Dummies Yes Yes Yes
N 4,059 2,134 3,484N Dependent Variable = 1 N/A 575 310R2 14.27% 9.87% 6.06%
SEATS_LOSS SEATS_GAINt-statistic
Model (1) Model (2) Model (3)
t-statistic t-statisticCHG_N_BOARDS
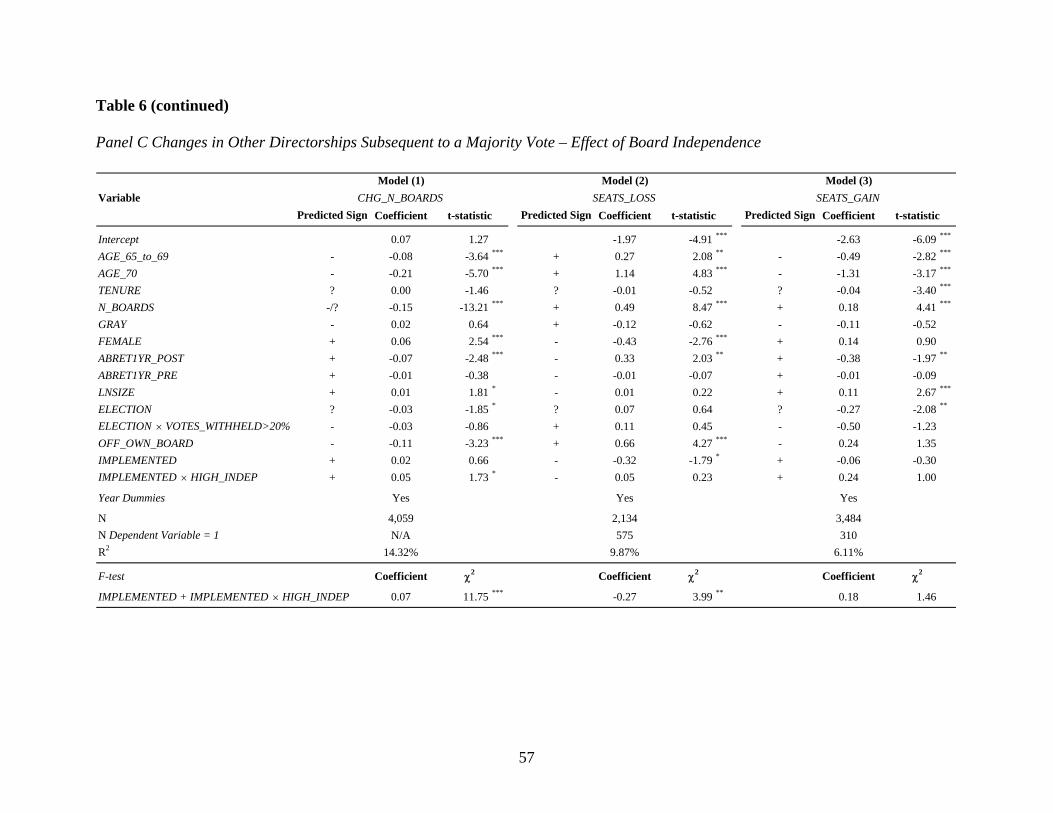
57
Table 6 (continued) Panel C Changes in Other Directorships Subsequent to a Majority Vote – Effect of Board Independence
VariablePredicted Sign Coefficient Predicted Sign Coefficient Predicted Sign Coefficient
Intercept 0.07 1.27 -1.97 -4.91 *** -2.63 -6.09 ***
AGE_65_to_69 - -0.08 -3.64 *** + 0.27 2.08 ** - -0.49 -2.82 ***
AGE_70 - -0.21 -5.70 *** + 1.14 4.83 *** - -1.31 -3.17 ***
TENURE ? 0.00 -1.46 ? -0.01 -0.52 ? -0.04 -3.40 ***
N_BOARDS -/? -0.15 -13.21 *** + 0.49 8.47 *** + 0.18 4.41 ***
GRAY - 0.02 0.64 + -0.12 -0.62 - -0.11 -0.52FEMALE + 0.06 2.54 *** - -0.43 -2.76 *** + 0.14 0.90ABRET1YR_POST + -0.07 -2.48 *** - 0.33 2.03 ** + -0.38 -1.97 **
ABRET1YR_PRE + -0.01 -0.38 - -0.01 -0.07 + -0.01 -0.09LNSIZE + 0.01 1.81 * - 0.01 0.22 + 0.11 2.67 ***
ELECTION ? -0.03 -1.85 * ? 0.07 0.64 ? -0.27 -2.08 **
ELECTION × VOTES_WITHHELD>20% - -0.03 -0.86 + 0.11 0.45 - -0.50 -1.23OFF_OWN_BOARD - -0.11 -3.23 *** + 0.66 4.27 *** - 0.24 1.35IMPLEMENTED + 0.02 0.66 - -0.32 -1.79 * + -0.06 -0.30IMPLEMENTED × HIGH_INDEP + 0.05 1.73 * - 0.05 0.23 + 0.24 1.00
Year Dummies Yes Yes Yes
N 4,059 2,134 3,484N Dependent Variable = 1 N/A 575 310R2 14.32% 9.87% 6.11%
F-test Coefficient Coefficient Coefficient
0.07 11.75 *** -0.27 3.99 ** 0.18 1.46
χ2
IMPLEMENTED + IMPLEMENTED × HIGH_INDEP
χ2 χ2
SEATS_LOSS SEATS_GAINt-statistic
Model (1) Model (2) Model (3)
t-statistic t-statisticCHG_N_BOARDS

58
Table 6 (continued) Panel D Changes in Other Directorships Subsequent to a Majority Vote – Effect of Nominating Committee Members
VariablePredicted Sign Coefficient Predicted Sign Coefficient Predicted Sign Coefficient
Intercept 0.06 1.05 -1.99 -4.96 *** -2.70 -6.29 ***
AGE_65_to_69 - -0.08 -3.64 *** + 0.27 2.10 ** - -0.49 -2.83 ***
AGE_70 - -0.21 -5.72 *** + 1.16 4.88 *** - -1.32 -3.18 ***
TENURE ? 0.00 -1.52 ? 0.00 -0.41 ? -0.04 -3.39 ***
N_BOARDS -/? -0.15 -13.17 *** + 0.50 8.46 *** + 0.19 4.45 ***
GRAY - 0.01 0.43 + -0.13 -0.66 - -0.14 -0.69FEMALE + 0.06 2.54 *** - -0.43 -2.75 *** + 0.14 0.90ABRET1YR_POST + -0.06 -2.44 ** - 0.34 2.06 ** + -0.37 -1.91 *
ABRET1YR_PRE + -0.01 -0.46 - -0.01 -0.09 + -0.02 -0.11LNSIZE + 0.01 2.18 ** - 0.01 0.24 + 0.12 2.91 ***
ELECTION ? -0.03 -1.81 * ? 0.07 0.61 ? -0.27 -2.09 **
ELECTION × VOTES_WITHHELD>20% - -0.03 -0.81 + 0.12 0.50 - -0.48 -1.19OFF_OWN_BOARD - -0.10 -3.20 *** + 0.66 4.27 *** ? 0.24 1.34IMPLEMENTED + 0.04 1.98 ** - -0.17 -1.15 + 0.11 0.68IMPLEMENTED × NOM_COMM + 0.01 0.48 - -0.24 -1.25 + -0.02 -0.10
Year Dummies Yes Yes Yes
N 4,059 2,134 3,484N Dependent Variable = 1 N/A 575 310R2 14.27% 9.94% 6.06%
F-test Coefficient Coefficient Coefficient
0.05 6.19 *** -0.41 6.51 ** 0.09 0.25
χ2
IMPLEMENTED + IMPLEMENTED × NOM_COMM
χ2 χ2
SEATS_LOSS SEATS_GAINt-statistic
Model (1) Model (2) Model (3)
t-statistic t-statisticCHG_N_BOARDS
Panel A presents results from a logit regression for the sample of outside directors of firms with MV proposals. The dependent variable (DIR_TURNOVER) is equal to one if the director no longer sits on the board of the sample firm in the year following the MV, and zero otherwise. Panel B, Model (1), presents results from an OLS regression for the sample of outside directors of firms with MV proposals. The dependent variable (CHG_N_BOARDS) is the net change in number of other S&P 1500 directorships held by the director over the year subsequent to the MV. Panel B, Model (2), presents results from a logit regression for the sample of outside directors of firms with MV proposals holding at least one additional directorship in a firm in the S&P 1500. The dependent variable (SEATS_LOSS) is equal to one (zero) if the director experiences a decrease (no change) in the number of other S&P 1500 directorships held over the year

59
subsequent to the MV. Panel B, Model (3), presents results from a logit regression for the sample of outside directors of firms with MV proposals. The dependent variable (SEATS_GAIN) is equal to one (zero) if the director experiences an increase (no change) in the number of other S&P 1500 directorships held over the year subsequent to the MV. Panel C, Models (1) – (3) repeat the analysis in Panel B after the addition of IMPLEMENTED × HIGH_INDEP, an interaction term that captures the degree of board independence. Panel D, Models (1) – (3) repeat the analysis in Panel B after the addition of IMPLEMENTED × NOM_COMM, an interaction term that captures the effect of the implementation decision on board members that serve in the nominating committee. ***, **, and * denote significance at the 0.01, 0.05, and 0.10 level, respectively. We estimate and report heteroskedasticity-adjusted standard errors clustered by director to account for the fact that we have multiple observations for certain directors in our sample. Independent variables are defined as follows: AGE_65_69 = indicator variable equal to 1 if director is between 65 and 69 years old, 0 otherwise (Source: IRRC Directors dataset). AGE_70 = indicator variable equal to 1 if director is more than 70 years old, 0 otherwise (Source: IRRC Directors dataset). TENURE = number of years the director was a member of the board (Source: IRRC Directors dataset). N_BOARDS = number of other directorships in the S&P 1500 firms held by a given director (Source: IRRC Directors dataset). GRAY = indicator variable equal to 1 if the director is classified as ‘linked’ by IRRC, and 0 otherwise (Source: IRRC Directors dataset). FEMALE = indicator variable equal to 1 for female directors and 0 otherwise (Source: IRRC Directors dataset). COMP_COMM = indicator variable equal to 1 if the director sits on the Compensation Committee at the time of the majority vote proposal, 0 otherwise (Source: IRRC Directors dataset). AUDIT_COMM = indicator variable equal to 1 if the director sits on the Audit Committee at the time of the majority vote proposal, 0 otherwise (Source: IRRC Directors dataset). NOM_COMM = indicator variable equal to 1 if the director sits on the Nominating Committee at the time of the majority vote proposal (Source: IRRC Director). DIR_OWN = percentage of firm’s equity held by director at the time of the annual meeting of when the firm receives a MV proposal, and 0 otherwise. (Source: IRRC Directors dataset). ABRET1YR_POST = size-adjusted stock return over the year subsequent to the annual meeting when the firm receives the majority-vote (MV) proposal. The size-adjusted return is calculated as the monthly compounded buy-and-hold stock return less the mean stock return for firms in the same equity market value decile compounded over the same period (Source: CRSP). ABRET1YR_PRE = size-adjusted stock return over the year before the annual meeting when the firm receives the majority-vote (MV) proposal. The size-adjusted return is calculated as the monthly compounded buy-and-hold stock return less the mean stock return for firms in the same equity market value decile compounded over the same period (Source: CRSP). LNSIZE = natural logarithm of the equity market value measured at the time of the annual meeting, expressed in millions of dollars. CEO_TURNOVER = indicator variable equal to 1 if the firm has a new CEO during the year subsequent to receiving a majority vote proposal, and 0 otherwise (Source: IRRC). ELECTION = indicator variable equal to 1 if the director was up for re-election at the annual meeting where there was a MV proposal, and 0 otherwise (Source: 10-Q filed after the annual meeting). VOTES_WITHHELD>20% = indicator variable equal to 1 if at least 20% of votes were withhold from the director at the annual meeting where there was a MV proposal, and 0 otherwise (Source: 10-Q filed after the annual meeting). OFF_OWN_BOARD = indicator variable equal to 1 for directors losing the seat at their own firm (i.e. when DIR_TURNOVER = 1). IMPLEMENTED = indicator variable equal to 1 if the firm implements at least one MV proposal in a given year and zero otherwise (Source: IRRC Voting). VOTES_FOR>70% = indicator variable equal to 1 if the implemented MV proposals faced by the director averaged a percentage of votes cast in favor greater than 70% (top quartile of distribution of VOTES_FOR for MV proposals), and zero otherwise. VOTE_NO= indicator variable equal to 1 if the board is targeted by a vote-campaign at the same annual meeting where the proposal receives a majority vote, and zero otherwise (Source: keyword search through press articles in Factiva). HIGH_INDEP = indicator variable equal to 1 if %INDEP is above the sample median (about 75%), and zero otherwise.