BOARD MEMBER DUALITY, AGENCY COSTS, PERFORMANCE…vuir.vu.edu.au/34337/1/WIDODO...
404
BOARD MEMBER DUALITY, AGENCY COSTS, PERFORMANCE, AND ACCOUNTABILITY: THE EVIDENCE IN PARENT AND SUBSIDIARY OF STATE-OWNED ENTERPRISES IN INDONESIA Agus Puruhitaarga Purnomo Widodo BA (Econ.Sci) MBA College of Law and Justice Victoria University This thesis is presented in fulfilment of the requirements of the degree of Doctor of Philosophy The Governance Research Program College of Law and Justice Victoria University January 2017
-
Upload
duonghuong -
Category
Documents
-
view
231 -
download
0
Transcript of BOARD MEMBER DUALITY, AGENCY COSTS, PERFORMANCE…vuir.vu.edu.au/34337/1/WIDODO...
BOARD MEMBER DUALITY, AGENCY COSTS, PERFORMANCE, AND ACCOUNTABILITY:
THE EVIDENCE IN PARENT AND SUBSIDIARY OF STATE-OWNED ENTERPRISES IN INDONESIA
Agus Puruhitaarga Purnomo Widodo BA (Econ.Sci) MBA
College of Law and Justice Victoria University
This thesis is presented in fulfilment of the requirements of
the degree of Doctor of Philosophy
The Governance Research Program College of Law and Justice
Victoria University
January 2017

P a g e | ii
P a g e | i
ABSTRACT
The study of corporate governance of parent and subsidiary companies in the State-
Owned Enterprises (BUMN) in Indonesia has received little attention from the public. In
fact, an interlocking directorship between a parent company and a subsidiary is a
common occurrence in BUMN in Indonesia; it is called “board member duality”, a new
terminology proposed in this research. This terminology refers to the director of a
parent company who is simultaneously serving as the commissioner of a subsidiary
company. This addresses the gap found among several types of director duality which
generally fall under CEO duality, Interlocking, and Multiple Directorships.
Three research instruments used in this research were panel data, a survey, and in-
depth interviews. The results obtained by these instruments were compared,
integrated, and analyzed using an integrated matrix analysis as the triangulation
method.
The research revealed that board member duality influences agency costs; on the
other hand, it does not affect firm performance. The six dimensions of accountability of
the board member duality reveal that the age of the parent company may reflect the
level of BUMN's maturity which contributes to shaping ethics and integrity, and reflects
that the regulations regarding conflicts of interest have been included in corporate
policies. The attribute of income is the best predictor of how the board member holding
these dual directorships performs his/her tasks, and finally, the holders of board
member duality tend to favor the parent company when making decisions.
The immediate implication of this research is the establishment of guidelines for the
board member duality, as part of the parent and subsidiary governance. The agency
problems, demographic and company characteristic regarding the accountability of
board member duality examined in this research can be used to enhance the decision
about dual board member appointment.
P a g e | iii
ACKNOWLEDGEMENTS
When I began with my research, I felt as if I were undertaking a journey to an alien
territory. I was challenged by the questions: Did I know how to explore the unpredicted
alien territory? Did I have a compass to show the direction? Could I finish the
complicated exploration on time? When the exploration was completely recorded in a
thesis, then I understood that research was the process; not the end result; and the
research itself was the measure of success in this exploration. This research was
conducted over four years approximately, and this would not have been possible
without the support of numerous people, whom I wish to acknowledge.
First of all, my deepest gratitude goes to my supervisor Professor Anona Armstrong for
her dedication, invaluable guidance, scholarly support and commitment of time
throughout this process; without this, the thesis would not have become a reality. I also
received valuable assistance from my co-supervisors Dr. James McConvill and Dr.
YongQiang Li, at key stages of the thesis’ finalization.
I would like to thank the Dean of the College of Law and Justice and the Dean of
Graduate Research Victoria University Australia, Professor Andrew Clarke and
Professor Helen Borland, the Researchers and the senior lecturer in the College of
Business, Dr. Guneratne Wickremasinghe. I would like to thank all the staff and my
colleagues at Victoria University, especially Dr. Kumi Heenitigala, the Graduate
Research Administration Manager, Tina Jeggo and Sian Ellet.
I am particularly grateful to my sponsor for the Australia Award Scholarship (AAS), and
to Margaret Jones and Keith Ong as the Liaison Officers of AAS.
I am also grateful to the Head of the Finance and Development Supervisory Agency of
the Republic of Indonesia (BPKP), Prof. Mardiasmo and Dr. Ardan Adi Perdana with
the Echelon 1, Meidyah Indreswari Ph.D., and Dr. Binsar H. Simanjuntak.
I also extend my sincere thanks to the Senior Secretary of the Ministry of State-Owned
Enterprises, Dr. Imam Apriyanto Putro, along with Deputies, Dr. Gatot Trihargo, Dr.
Harry Susetyo, Dr. Achiran Pandu Djajanto and senior officers, Seger Budiarjo, MMA,
Dr. Bin Nahadi, and Nanang Sugianto, who expedited the interview process of directors
and commissioners of SOE and who generously gave their time. I also owe thanks to
all the directors, commissioners, and senior managers of the parent and subsidiary
P a g e | iv
companies of the State-Owned Enterprises who participated in the survey and
interview.
I am also grateful to the Member of the Supreme Auditor of the Republic of Indonesia,
Prof. Dr. Edy Mulyadi Soepardi who gave invaluable insight for the research theme and
the Academic Staff of Gadjah Mada University, Danardono Ph.D. who gave invaluable
insight in statistics
I also would like to express my gratitude to my colleagues in BPKP, Bambang Utoyo,
MBA, Ratna Tianti Ernawati M.PSI., Dr. Ersi Soenarsih, Iwan Taufik MBA, Sally
Salamah, M.Prof.Acc.,Heli Restiati, M.Comm, Buyung Wiromo Samudro, MBA, Setya
Nugraha, MIBA, Eden Sinurat Ak, and Tien Martini, Ak, also my colleagues in program
and reporting of BPKP-Jakarta Branch, the Executive Director at Ernst & Young
Indonesia, Saguh Pangaribowo, MBA, and other people whom I cannot name
individually because they are too numerous to mention.
Special thanks with love for my wife, Septi Wifasari, my daughter Wikasita Laras
Purudita, Irdhina Naurasari Purudita, and my son Argiv Malik Puruhita for their prayers,
endless support, and understanding over the past four years, my parents and parents-
in-law for the encouragement and support that gave me on my academic journey.
Finally, I thank Almighty God for assisting me to be steadfast in my purpose and belief,
so that all my aspirations could be realized.
I dedicate my work to a better Indonesia.
P a g e | v
LIST OF PUBLICATIONS AND AWARDS
Peer Reviewed Proceedings
1. Widodo, Agus; Armstrong, Anona, 2013, “The duality dilemma faced by directors
of state-owned enterprises who are appointed to represent their parent companies
in their subsidiaries: a conflict or an interest?” Paper presented at the 27th
Australian and New Zealand Anzam Academy of Management (ANZAM)
Conference, Hobart Tasmania 4-6 December.
2. Widodo, Agus; Armstrong, Anona, 2015, “Board member duality and its
relationship with corporate performance in state-owned enterprises in Indonesia”.
Paper presented at the Contemporary Challenges and Solutions in Governance
Conference, Victoria University, Melbourne, 14—16 April.
3. Widodo, Agus; Armstrong, Anona, 2016, “Board member duality and its
relationship with corporate performance in state-owned enterprises in Indonesia”.
Journal of Law and Governance, Vol.II (1) pp.26-35

P a g e | vi
This page is intentionally left blank
P a g e | vii
TABLE OF CONTENTS
ABSTRACT ........................................................................................................................................ I DECLARATION ................................................................................................................................... II ACKNOWLEDGEMENTS ..................................................................................................................... III LIST OF PUBLICATIONS AND AWARDS ................................................................................................ V TABLE OF CONTENTS ...................................................................................................................... VII LIST OF TABLES ............................................................................................................................. XIII LIST OF PIE CHARTS ...................................................................................................................... XV LIST OF FIGURES ........................................................................................................................... XV LIST OF ABBREVIATIONS ................................................................................................................. XVI
CHAPTER 1: INTRODUCTION TO THE STUDY ......................................................................... 1
1.1. BACKGROUND TO THE RESEARCH ............................................................................................. 1 1.2. RESEARCH PROBLEM ................................................................................................................ 7 1.3. OBJECTIVES OF THE STUDY ..................................................................................................... 8 1.4. CONTRIBUTION TO KNOWLEDGE ................................................................................................ 8 1.5. STATEMENT OF SIGNIFICANCE ................................................................................................... 9 1.6. SCOPE OF THE RESEARCH ........................................................................................................ 9 1.7. DEFINITION OF KEY TERMS ...................................................................................................... 10 1.8. THE ORGANISATION OF THE THESIS ........................................................................................ 12
CHAPTER 2: LITERATURE REVIEW ........................................................................................ 16
INTRODUCTION .............................................................................................................................. 16 2.1. THEMES OF DUALITY POSITION AND RESEARCH GAP............................................................. 16 2.2. THE BOARD MEMBER DUALITY: CONCEPT AND DEFINITION .................................................... 18 2.3. TYPES OF DUALITY IN PREVIOUS RESEARCH ......................................................................... 20
2.3.1. CEO Duality ................................................................................................................. 20 2.3.2. Interlocking Directorship .............................................................................................. 21 2.3.3. Multiple Directorships ................................................................................................... 22
2.4. THEORETICAL PERSPECTIVES ON CORPORATE GOVERNANCE AND CORPORATE BOARD ......... 22 2.4.1. The Milestones of Corporate Governance Development ............................................ 22
1) The First Pre-Modern Corporation Prototype ..................................................................... 23 2) Industrial Revolution Era .................................................................................................. 23 3) Management Era ............................................................................................................ 24 4) Governance Era.............................................................................................................. 24
2.4.2. The Definition of Corporate Governance ..................................................................... 25 1) The Etymology, Lexical and Grammatical Concept of Corporate Governance ....................... 25 2) The First Theory of Corporate Governance ........................................................................ 26 3) Contemporary Definition and Concept ............................................................................... 26 4) Diversity of Corporate Governance Forms ......................................................................... 28 5) Board of Director as an Essential Element in Corporate Governance ................................... 28
2.4.3. A Comparison of Corporate Governance Theories ..................................................... 29 1) Agency Theory ............................................................................................................... 29 2) Stewardship Theory ........................................................................................................ 31 3) Agency Theory versus Stewardship Theory ....................................................................... 33 4) Social Contract Theory .................................................................................................... 34 5) Institutional Theory .......................................................................................................... 36 6) Managerial and Class Hegemony Theory .......................................................................... 36
P a g e | viii
7) Stakeholder Theory ......................................................................................................... 37 8) Resource Dependency Theory ......................................................................................... 38
2.4.4. Corporate Board .......................................................................................................... 39 1) A Glance at the History and Origin of Corporate Boards...................................................... 39 2) Corporate Board as the Prime Organ of a Corporation ........................................................ 40 3) Board Model ................................................................................................................... 40 4) Board Design.................................................................................................................. 43
(1) Board structures: size, leadership, and the committees.................................................. 44 (2) Board Compositions: the mix of experience, skills and other attributes ............................ 45 (3) Board processes: effort norm, cognitive conflict, and the board’s use of its knowledge and skills .............................................................................................................................. 46
5) Board Duties .................................................................................................................. 47 6) Board Activities ............................................................................................................... 48 7) Board Accountability........................................................................................................ 49
2.5. PARENT AND SUBSIDIARY RELATIONSHIP .............................................................................. 51 2.5.1. The Establishment of Parent and Subsidiary Relationship .......................................... 51 2.5.2. Typology of Group companies and Conflict of Interest ................................................ 53
1) The 100% Subsidiary ................................................................................................. 53 2) The Subsidiary with Minority Shareholders ................................................................... 54 3) Publicly Listed Companies .......................................................................................... 54 4) Holding Companies .................................................................................................... 54 5) Parent and Subsidiary Engaged in the Same Line of Business ....................................... 55 6) Companies with a State Interest .................................................................................. 56
2.5.3. Board Ethics and Conflict of Interest in Parent and Subsidiary Relationship .............. 56 2.6. AGENCY COST .................................................................................................................... 59
2.6.1. Definition ...................................................................................................................... 59 2.6.2. Measurements ............................................................................................................. 60
2.7. GAP IDENTIFIED IN ACADEMIC RESEARCH ............................................................................. 62 2.8. CONCLUSION ....................................................................................................................... 63
CHAPTER 3: STATE-OWNED ENTERPRISES IN INDONESIA: THE CHRONICLE, STRATEGIC ROLES AND DIRECTION, AND CORPORATE GOVERNANCE DEVELOPMENT ..................................................................................................................................................... 64
INTRODUCTION .............................................................................................................................. 64 3.1. THE CHRONICLE .................................................................................................................. 64
3.1.1. The Dutch Era (before 1942) ....................................................................................... 65 1) Vereenigde Oost-Indische Compagnie (VOC) .................................................................... 66 2) The Colonial Government of the Dutch .............................................................................. 68
3.1.2. The Japan Era (1942—1945) ...................................................................................... 71 3.1.3. The Old Order Era (1945—1965) ................................................................................ 74 3.1.4. The New Order Era (1965—1998) ............................................................................... 78 3.1.5. The Reform Era (1998—Current) ................................................................................ 83
3.2. STRATEGIC ROLES .............................................................................................................. 89 3.2.1. Profile and Development of BUMN .............................................................................. 89 3.2.2. BUMN Roles ................................................................................................................ 93
3.3. SCENARIO AND DIRECTION ................................................................................................. 100 3.3.1. Master Plan BUMN of 2005—2009 and 2010—2014 ................................................ 100
1) Rightsizing ................................................................................................................... 101 2) Revitalization ................................................................................................................ 102 3) Profit-maximization........................................................................................................ 103
3.3.2. Road Map BUMN 2015-2019..................................................................................... 104
P a g e | ix
3.4. CORPORATE GOVERNANCE DEVELOPMENT ........................................................................ 105 3.4.1. The Separation of Powers, Legal System, and Board Model in Indonesia ............... 106
1) The Separation of Powers .............................................................................................. 106 2) Legal System................................................................................................................ 107 3) The Legal Basis of the State-Owned Enterprises for Operational Activities ......................... 108
3.4.2. The External Governance of BUMNS ........................................................................ 110 3.4.3. The Internal Governance of BUMNS ......................................................................... 111 3.4.4. Structure and Process ............................................................................................... 113
1) Structure ...................................................................................................................... 114 2) Process ....................................................................................................................... 115
3.4.5. Linking the Corporate Board with the Bureaucracy as “shareholding agent” ............ 115 3.5. THE CONTEXT OF PARENT AND SUBSIDIARY RELATIONSHIP OF BUMN WITH THE GOVERNMENT
118 3.5.1. The level of entity involvement and governance structure ........................................ 118 3.5.2. Rule of the game ........................................................................................................ 120
CHAPTER 4: RESEARCH FRAMEWORK .............................................................................. 122
INTRODUCTION ............................................................................................................................ 122 4.1. RESEARCH QUESTIONS ..................................................................................................... 123 4.2.CONCEPTUAL FRAMEWORK .................................................................................................... 126
4.2.1. Conceptual Framework of Board Member Duality, Theories, and Measurement ..... 127 4.2.2. Conceptual Framework of the Flow-In and Out of Agency Costs .............................. 128 4.2.3. Conceptual Framework for Measuring the Agency Costs and Performance ............ 129 4.2.4. Conceptual Framework for accountability .................................................................. 130
4.3. HYPOTHESIS DEVELOPMENT .............................................................................................. 132 4.3.1. Board Member Duality and Agency Costs ................................................................. 133 4.3.2. Board Member Duality and Corporate Performance ................................................. 133 4.3.3. Endogenous variables ............................................................................................... 135 4.3.4. Control or Explanatory Variables ............................................................................... 136 4.3.5. The Hypotheses of attribute variables ....................................................................... 139
4.4. SUMMARY ......................................................................................................................... 143
CHAPTER 5: RESEARCH METHODOLOGY .......................................................................... 146
INTRODUCTION ............................................................................................................................ 146 5.1. RESEARCH PROCESS ........................................................................................................ 148 5.2. RESEARCH QUALITY .......................................................................................................... 150
5.2.1. Validity ........................................................................................................................ 150 5.2.2. Reliability .................................................................................................................... 152 5.2.3. Generalisability .......................................................................................................... 152 5.2.4. Objectivity ................................................................................................................... 153
5.3. RESEARCH DESIGN ........................................................................................................... 154 5.3.1. Research Method ....................................................................................................... 154
1) Triangulation Method ..................................................................................................... 154 2) Justification for the Method ............................................................................................ 156
5.3.2. Research Instrumentation .......................................................................................... 157 1) Panel Data ................................................................................................................... 157
(1) Data structure and sample ........................................................................................ 157 (2) Endogenous Variables and Description ...................................................................... 158 (3) Model choices and equation ...................................................................................... 159
2) Survey ......................................................................................................................... 163 (1) Questionnaire development ...................................................................................... 163
P a g e | x
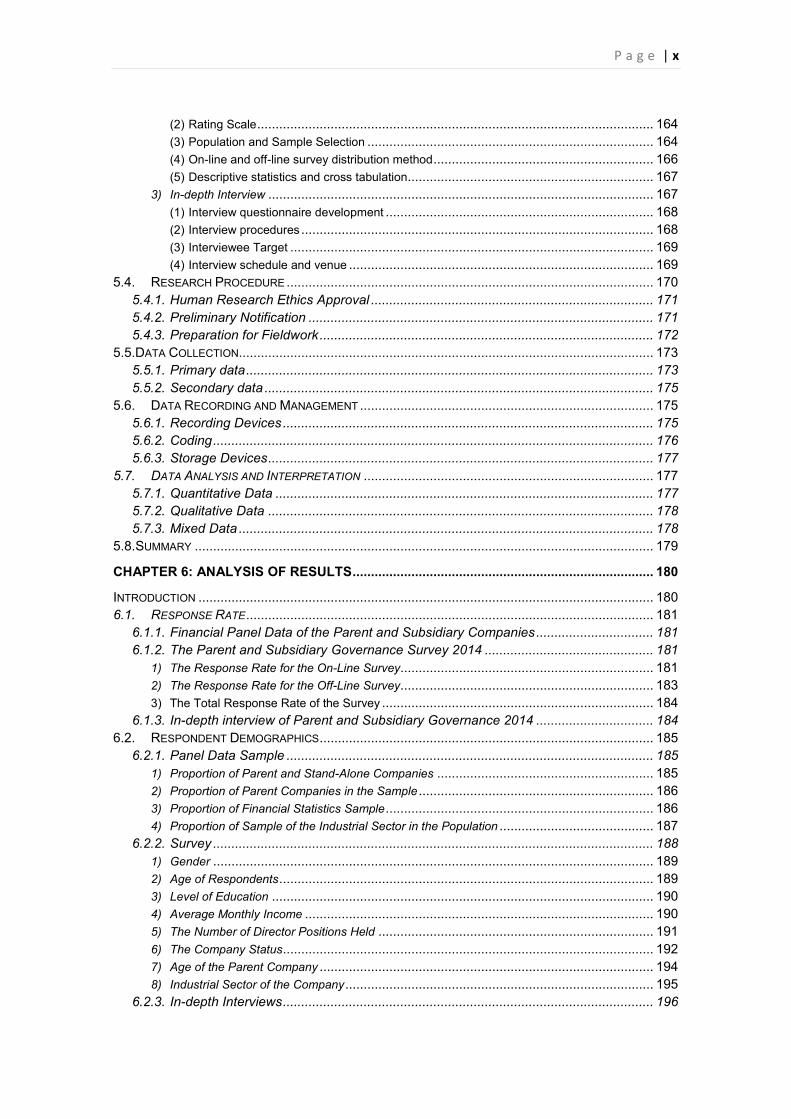
(2) Rating Scale ............................................................................................................ 164 (3) Population and Sample Selection .............................................................................. 164 (4) On-line and off-line survey distribution method ............................................................ 166 (5) Descriptive statistics and cross tabulation................................................................... 167
3) In-depth Interview ......................................................................................................... 167 (1) Interview questionnaire development ......................................................................... 168 (2) Interview procedures ................................................................................................ 168 (3) Interviewee Target ................................................................................................... 169 (4) Interview schedule and venue ................................................................................... 169
5.4. RESEARCH PROCEDURE .................................................................................................... 170 5.4.1. Human Research Ethics Approval ............................................................................. 171 5.4.2. Preliminary Notification .............................................................................................. 171 5.4.3. Preparation for Fieldwork ........................................................................................... 172
5.5.DATA COLLECTION ................................................................................................................. 173 5.5.1. Primary data ............................................................................................................... 173 5.5.2. Secondary data .......................................................................................................... 175
5.6. DATA RECORDING AND MANAGEMENT ................................................................................ 175 5.6.1. Recording Devices ..................................................................................................... 175 5.6.2. Coding ........................................................................................................................ 176 5.6.3. Storage Devices ......................................................................................................... 177
5.7. DATA ANALYSIS AND INTERPRETATION ............................................................................... 177 5.7.1. Quantitative Data ....................................................................................................... 177 5.7.2. Qualitative Data ......................................................................................................... 178 5.7.3. Mixed Data ................................................................................................................. 178
5.8.SUMMARY ............................................................................................................................. 179
CHAPTER 6: ANALYSIS OF RESULTS .................................................................................. 180
INTRODUCTION ............................................................................................................................ 180 6.1. RESPONSE RATE ............................................................................................................... 181
6.1.1. Financial Panel Data of the Parent and Subsidiary Companies ................................ 181 6.1.2. The Parent and Subsidiary Governance Survey 2014 .............................................. 181
1) The Response Rate for the On-Line Survey ..................................................................... 181 2) The Response Rate for the Off-Line Survey ..................................................................... 183 3) The Total Response Rate of the Survey .......................................................................... 184
6.1.3. In-depth interview of Parent and Subsidiary Governance 2014 ................................ 184 6.2. RESPONDENT DEMOGRAPHICS ........................................................................................... 185
6.2.1. Panel Data Sample .................................................................................................... 185 1) Proportion of Parent and Stand-Alone Companies ........................................................... 185 2) Proportion of Parent Companies in the Sample ................................................................ 186 3) Proportion of Financial Statistics Sample ......................................................................... 186 4) Proportion of Sample of the Industrial Sector in the Population .......................................... 187
6.2.2. Survey ........................................................................................................................ 188 1) Gender ........................................................................................................................ 189 2) Age of Respondents ...................................................................................................... 189 3) Level of Education ........................................................................................................ 190 4) Average Monthly Income ............................................................................................... 190 5) The Number of Director Positions Held ........................................................................... 191 6) The Company Status ..................................................................................................... 192 7) Age of the Parent Company ........................................................................................... 194 8) Industrial Sector of the Company .................................................................................... 195
6.2.3. In-depth Interviews ..................................................................................................... 196
P a g e | xi
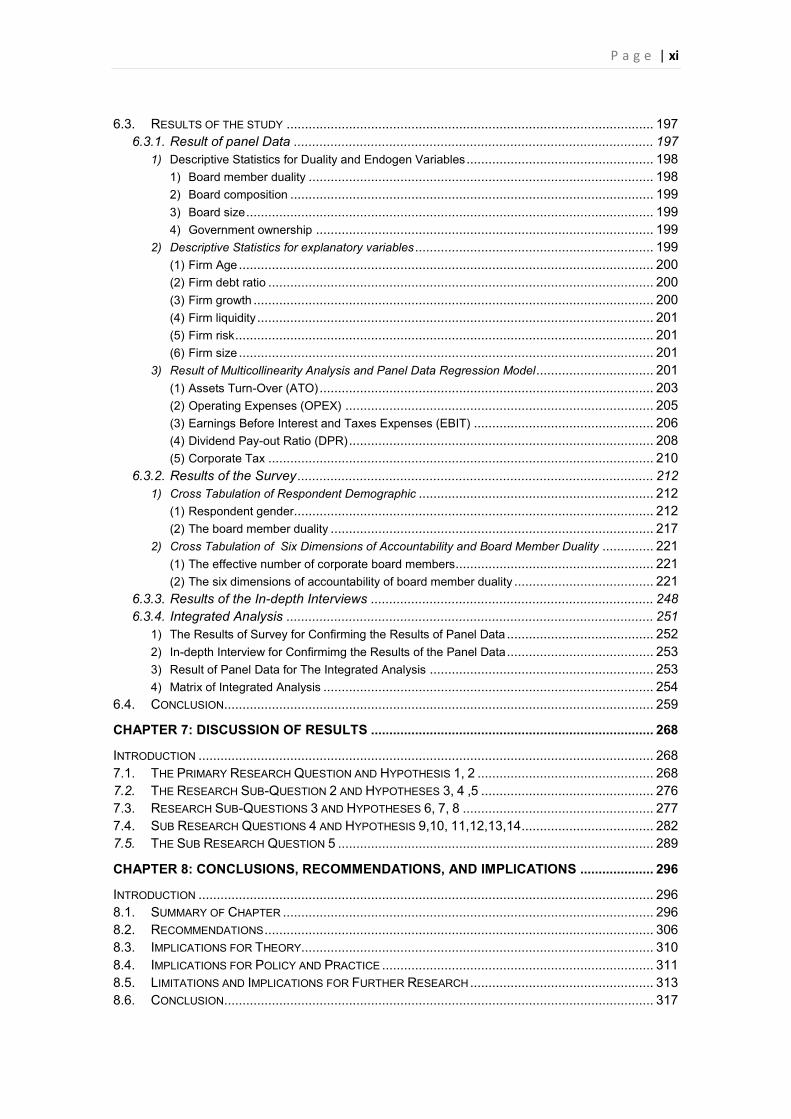
6.3. RESULTS OF THE STUDY .................................................................................................... 197 6.3.1. Result of panel Data .................................................................................................. 197
1) Descriptive Statistics for Duality and Endogen Variables ................................................... 198 1) Board member duality .............................................................................................. 198 2) Board composition ................................................................................................... 199 3) Board size ............................................................................................................... 199 4) Government ownership ............................................................................................ 199
2) Descriptive Statistics for explanatory variables ................................................................. 199 (1) Firm Age ................................................................................................................. 200 (2) Firm debt ratio ......................................................................................................... 200 (3) Firm growth ............................................................................................................. 200 (4) Firm liquidity ............................................................................................................ 201 (5) Firm risk .................................................................................................................. 201 (6) Firm size ................................................................................................................. 201
3) Result of Multicollinearity Analysis and Panel Data Regression Model ................................ 201 (1) Assets Turn-Over (ATO) ........................................................................................... 203 (2) Operating Expenses (OPEX) .................................................................................... 205 (3) Earnings Before Interest and Taxes Expenses (EBIT) ................................................. 206 (4) Dividend Pay-out Ratio (DPR) ................................................................................... 208 (5) Corporate Tax ......................................................................................................... 210
6.3.2. Results of the Survey ................................................................................................. 212 1) Cross Tabulation of Respondent Demographic ................................................................ 212
(1) Respondent gender.................................................................................................. 212 (2) The board member duality ........................................................................................ 217
2) Cross Tabulation of Six Dimensions of Accountability and Board Member Duality .............. 221 (1) The effective number of corporate board members...................................................... 221 (2) The six dimensions of accountability of board member duality ...................................... 221
6.3.3. Results of the In-depth Interviews ............................................................................. 248 6.3.4. Integrated Analysis .................................................................................................... 251
1) The Results of Survey for Confirming the Results of Panel Data ........................................ 252 2) In-depth Interview for Confirmimg the Results of the Panel Data ........................................ 253 3) Result of Panel Data for The Integrated Analysis ............................................................. 253 4) Matrix of Integrated Analysis .......................................................................................... 254
6.4. CONCLUSION ..................................................................................................................... 259
CHAPTER 7: DISCUSSION OF RESULTS ............................................................................. 268 INTRODUCTION ............................................................................................................................ 268 7.1. THE PRIMARY RESEARCH QUESTION AND HYPOTHESIS 1, 2 ................................................ 268 7.2. THE RESEARCH SUB-QUESTION 2 AND HYPOTHESES 3, 4 ,5 ............................................... 276 7.3. RESEARCH SUB-QUESTIONS 3 AND HYPOTHESES 6, 7, 8 .................................................... 277 7.4. SUB RESEARCH QUESTIONS 4 AND HYPOTHESIS 9,10, 11,12,13,14 .................................... 282 7.5. THE SUB RESEARCH QUESTION 5 ...................................................................................... 289
CHAPTER 8: CONCLUSIONS, RECOMMENDATIONS, AND IMPLICATIONS .................... 296 INTRODUCTION ............................................................................................................................ 296 8.1. SUMMARY OF CHAPTER ..................................................................................................... 296 8.2. RECOMMENDATIONS .......................................................................................................... 306 8.3. IMPLICATIONS FOR THEORY................................................................................................ 310 8.4. IMPLICATIONS FOR POLICY AND PRACTICE .......................................................................... 311 8.5. LIMITATIONS AND IMPLICATIONS FOR FURTHER RESEARCH .................................................. 313 8.6. CONCLUSION ..................................................................................................................... 317
P a g e | xii
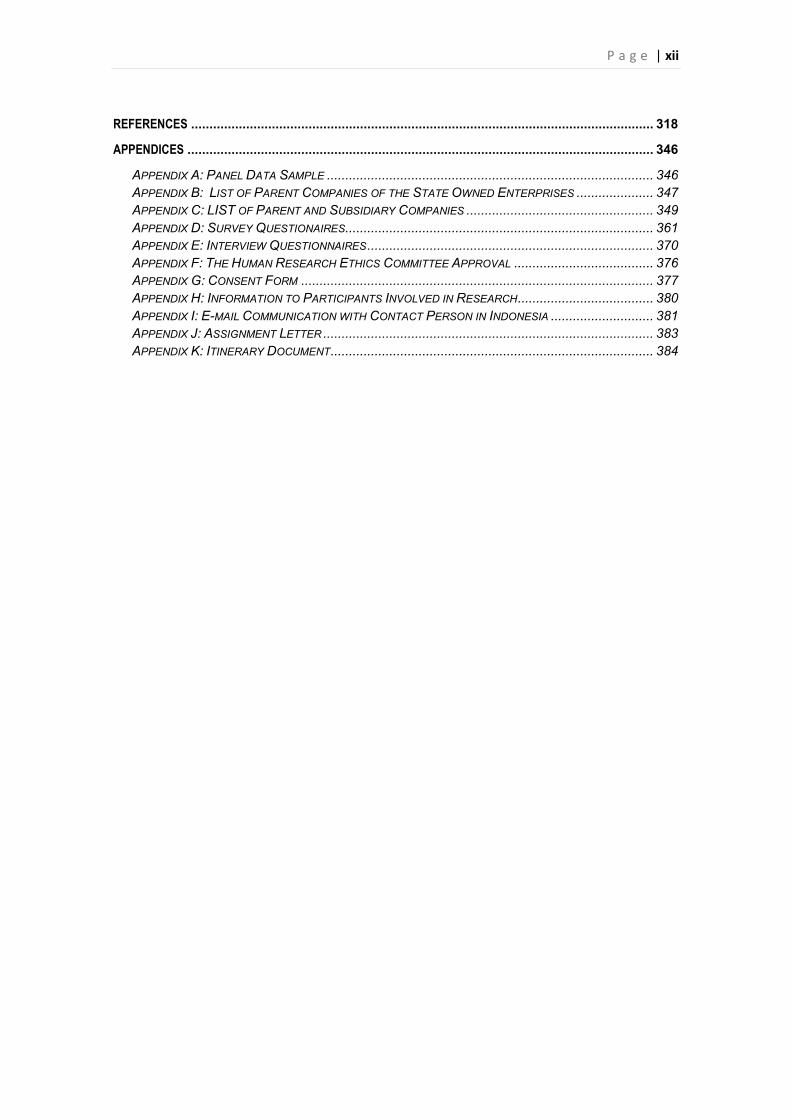
REFERENCES .............................................................................................................................. 318
APPENDICES ............................................................................................................................... 346
APPENDIX A: PANEL DATA SAMPLE ......................................................................................... 346 APPENDIX B: LIST OF PARENT COMPANIES OF THE STATE OWNED ENTERPRISES ..................... 347 APPENDIX C: LIST OF PARENT AND SUBSIDIARY COMPANIES ................................................... 349 APPENDIX D: SURVEY QUESTIONAIRES .................................................................................... 361 APPENDIX E: INTERVIEW QUESTIONNAIRES .............................................................................. 370 APPENDIX F: THE HUMAN RESEARCH ETHICS COMMITTEE APPROVAL ...................................... 376 APPENDIX G: CONSENT FORM ................................................................................................ 377 APPENDIX H: INFORMATION TO PARTICIPANTS INVOLVED IN RESEARCH ..................................... 380 APPENDIX I: E-MAIL COMMUNICATION WITH CONTACT PERSON IN INDONESIA ............................ 381 APPENDIX J: ASSIGNMENT LETTER .......................................................................................... 383 APPENDIX K: ITINERARY DOCUMENT ........................................................................................ 384
P a g e | xiii
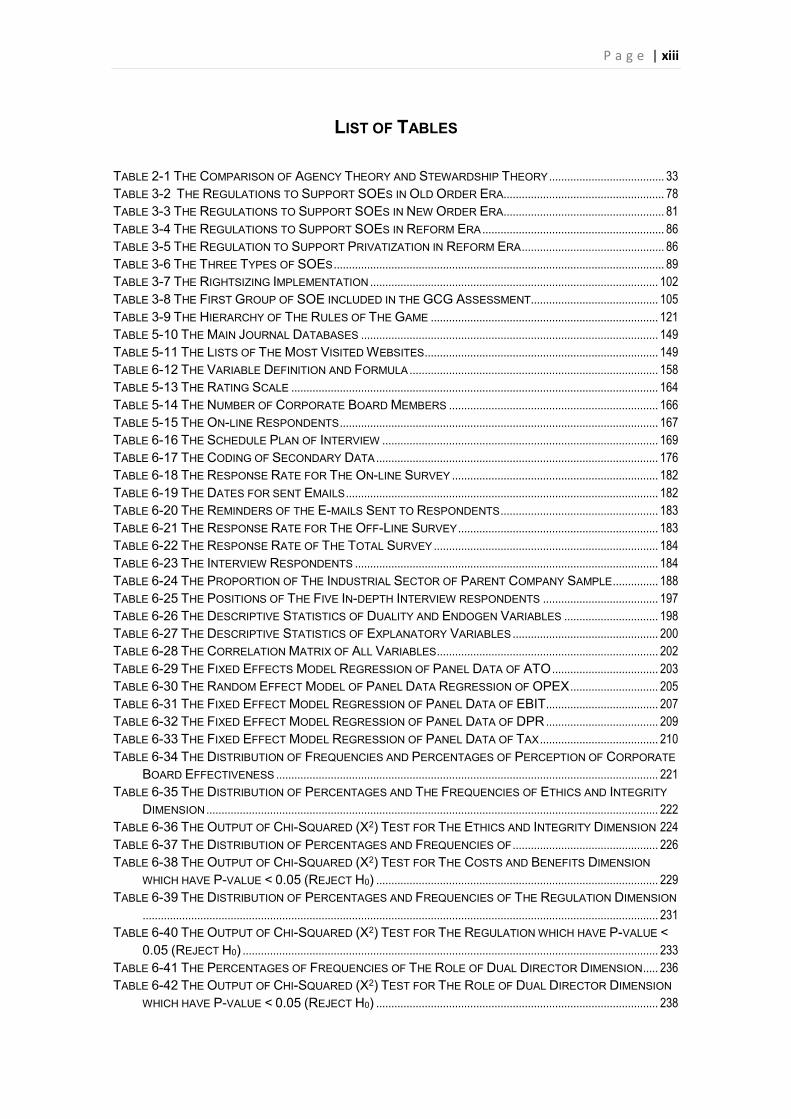
LIST OF TABLES
TABLE 2-1 THE COMPARISON OF AGENCY THEORY AND STEWARDSHIP THEORY ...................................... 33 TABLE 3-2 THE REGULATIONS TO SUPPORT SOES IN OLD ORDER ERA ..................................................... 78 TABLE 3-3 THE REGULATIONS TO SUPPORT SOES IN NEW ORDER ERA ..................................................... 81 TABLE 3-4 THE REGULATIONS TO SUPPORT SOES IN REFORM ERA ............................................................ 86 TABLE 3-5 THE REGULATION TO SUPPORT PRIVATIZATION IN REFORM ERA ............................................... 86 TABLE 3-6 THE THREE TYPES OF SOES ............................................................................................................. 89 TABLE 3-7 THE RIGHTSIZING IMPLEMENTATION ............................................................................................... 102 TABLE 3-8 THE FIRST GROUP OF SOE INCLUDED IN THE GCG ASSESSMENT .......................................... 105 TABLE 3-9 THE HIERARCHY OF THE RULES OF THE GAME ........................................................................... 121 TABLE 5-10 THE MAIN JOURNAL DATABASES .................................................................................................. 149 TABLE 5-11 THE LISTS OF THE MOST VISITED WEBSITES ............................................................................. 149 TABLE 6-12 THE VARIABLE DEFINITION AND FORMULA .................................................................................. 158 TABLE 5-13 THE RATING SCALE ......................................................................................................................... 164 TABLE 5-14 THE NUMBER OF CORPORATE BOARD MEMBERS ..................................................................... 166 TABLE 5-15 THE ON-LINE RESPONDENTS ......................................................................................................... 167 TABLE 6-16 THE SCHEDULE PLAN OF INTERVIEW ........................................................................................... 169 TABLE 6-17 THE CODING OF SECONDARY DATA ............................................................................................. 176 TABLE 6-18 THE RESPONSE RATE FOR THE ON-LINE SURVEY .................................................................... 182 TABLE 6-19 THE DATES FOR SENT EMAILS ....................................................................................................... 182 TABLE 6-20 THE REMINDERS OF THE E-MAILS SENT TO RESPONDENTS .................................................... 183 TABLE 6-21 THE RESPONSE RATE FOR THE OFF-LINE SURVEY .................................................................. 183 TABLE 6-22 THE RESPONSE RATE OF THE TOTAL SURVEY .......................................................................... 184 TABLE 6-23 THE INTERVIEW RESPONDENTS .................................................................................................... 184 TABLE 6-24 THE PROPORTION OF THE INDUSTRIAL SECTOR OF PARENT COMPANY SAMPLE ............... 188 TABLE 6-25 THE POSITIONS OF THE FIVE IN-DEPTH INTERVIEW RESPONDENTS ...................................... 197 TABLE 6-26 THE DESCRIPTIVE STATISTICS OF DUALITY AND ENDOGEN VARIABLES ............................... 198 TABLE 6-27 THE DESCRIPTIVE STATISTICS OF EXPLANATORY VARIABLES ................................................ 200 TABLE 6-28 THE CORRELATION MATRIX OF ALL VARIABLES ......................................................................... 202 TABLE 6-29 THE FIXED EFFECTS MODEL REGRESSION OF PANEL DATA OF ATO ................................... 203 TABLE 6-30 THE RANDOM EFFECT MODEL OF PANEL DATA REGRESSION OF OPEX ............................. 205 TABLE 6-31 THE FIXED EFFECT MODEL REGRESSION OF PANEL DATA OF EBIT ..................................... 207 TABLE 6-32 THE FIXED EFFECT MODEL REGRESSION OF PANEL DATA OF DPR ..................................... 209 TABLE 6-33 THE FIXED EFFECT MODEL REGRESSION OF PANEL DATA OF TAX ....................................... 210 TABLE 6-34 THE DISTRIBUTION OF FREQUENCIES AND PERCENTAGES OF PERCEPTION OF CORPORATE
BOARD EFFECTIVENESS .............................................................................................................................. 221 TABLE 6-35 THE DISTRIBUTION OF PERCENTAGES AND THE FREQUENCIES OF ETHICS AND INTEGRITY
DIMENSION ..................................................................................................................................................... 222 TABLE 6-36 THE OUTPUT OF CHI-SQUARED (X2) TEST FOR THE ETHICS AND INTEGRITY DIMENSION 224 TABLE 6-37 THE DISTRIBUTION OF PERCENTAGES AND FREQUENCIES OF ................................................ 226 TABLE 6-38 THE OUTPUT OF CHI-SQUARED (X2) TEST FOR THE COSTS AND BENEFITS DIMENSION
WHICH HAVE P-VALUE < 0.05 (REJECT H0) ............................................................................................. 229 TABLE 6-39 THE DISTRIBUTION OF PERCENTAGES AND FREQUENCIES OF THE REGULATION DIMENSION
.......................................................................................................................................................................... 231 TABLE 6-40 THE OUTPUT OF CHI-SQUARED (X2) TEST FOR THE REGULATION WHICH HAVE P-VALUE <
0.05 (REJECT H0) ......................................................................................................................................... 233 TABLE 6-41 THE PERCENTAGES OF FREQUENCIES OF THE ROLE OF DUAL DIRECTOR DIMENSION ..... 236 TABLE 6-42 THE OUTPUT OF CHI-SQUARED (X2) TEST FOR THE ROLE OF DUAL DIRECTOR DIMENSION
WHICH HAVE P-VALUE < 0.05 (REJECT H0) ............................................................................................. 238
P a g e | xiv
TABLE 6-43 THE PERCENTAGES AND FREQUENCIES OF THE FINANCIAL ACCOUNTABILITY DIMENSION .......................................................................................................................................................................... 240
TABLE 6-44THE OUTPUT OF CHI-SQUARED (X2) TEST FOR THE FINANCIAL ACCOUNTABILITY WHICH HAVE P-VALUE < 0.05 (REJECT H0) .......................................................................................................... 242
TABLE 6-45 THE DISTRIBUTION OF PERCENTAGES AND FREQUENCIES OF THE LEADERSHIP DIMENSION .......................................................................................................................................................................... 245
TABLE 6-46THE OUTPUT OF CHI-SQUARED (X2) TEST FOR THE LEADERSHIP WHICH HAVE P-VALUE LESS THAN 0.05 (REJECT H0) ..................................................................................................................... 246
TABLE 6-47 THE SUMMARY OF THE RESPONDENT’S ANSWER FOR THE CLOSED-END QUESTIONS .... 248 TABLE 6-48 THE SUMMARY OF THE RESPONDENT’S ANSWER FOR THE OPEN-END QUESTIONS ......... 250 TABLE 6-49 THE COST AND BENEFIT DIMENSION FOR PANEL DATA RESULTS ......................................... 252 TABLE 6-50 THE ROLE OF DUAL DIRECTOR DIMENSION FOR PANEL DATA RESULTS .............................. 252 TABLE 6-51 THE FINANCIAL ACCOUNTABILITY DIMENSION FOR PANEL DATA RESULTS .......................... 252 TABLE 6-52 SEVERAL QUESTIONS OF IN-DEPTH INTERVIEW FOR PANEL DATA ........................................ 253 TABLE 6-53 RESULTS OF PANEL DATA .............................................................................................................. 253 TABLE 6-54 THE MATRIX OF INTEGRATED ANALYSIS ...................................................................................... 255 TABLE 6-55 THE P-VALUE AND CORRELATION OF THE AGENCY COSTS WITH THE BOARD MEMBER
DUALITY .......................................................................................................................................................... 260 TABLE 6-56 THE P-VALUE OF PERFORMANCE AND CORRELATION WITH .................................................... 261 TABLE 6-57 THE P-VALUES OF THE ENDOGENOUS VARIABLES .................................................................... 261 TABLE 6-58 THE P-VALUE OF THE EXPLANATORY VARIABLE FOR THE EFFICIENCY AND PERFORMANCE
MEASUREMENTS ........................................................................................................................................... 262 TABLE 7-59 THE INTEGRATED MATRIX ANALYSIS OF BOARD MEMBER DUALITY AGAINST AGENCY
COSTS ............................................................................................................................................................. 269 TABLE 7-60 THE P-VALUES OF THE ENDOGEN VARIABLES ........................................................................... 278 TABLE 7-61 THE BOARD SIZE IN SEVERAL COUNTRIES ................................................................................. 280 TABLE 7-62 THE P-VALUE OF THE EXPLANATORY VARIABLES ON THE EFFICIENCY AND PERFORMANCE
MEASUREMENTS ........................................................................................................................................... 283
P a g e | xv
LIST OF PIE CHARTS
PIE CHART 6-1 THE PROPORTION OF PARENT COMPANIES AND STAND-ALONE COMPANIES ............... 186 PIE CHART 6-2 THE PERCENTAGE OF SAMPLE IN THE POPULATION ........................................................... 186 PIE CHART 6-3 THE DISTRIBUTION OF FREQUENCIES AND PERCENTAGE OF RESPONDENT GENDER .. 189 PIE CHART 6-4 THE DISTRIBUTION OF FREQUENCIES OF COMMISSIONER AND DIRECTOR ..................... 193 PIE CHART 6-5 THE PROPORTION OF MALE AND FEMALE EDUCATION ....................................................... 213 PIE CHART 6-6 THE PROPORTION OF NUMBER OF COMPANY ...................................................................... 214 PIE CHART 6-7 THE PROPORTION OF THE COMPANY STATUS ..................................................................... 215 PIE CHART 6-8 THE PROPORTION OF THE AVERAGE MONTHLY INCOME ................................................... 216
LIST OF FIGURES
FIGURE 1-1 THE ORGANIZATION OF THESIS ....................................................................................................... 12 FIGURE 2-2 THE PRINCIPAL—MANAGER CHOICE MODEL ............................................................................... 34 FIGURE 2-3 ONE-TIER BOARD VERSUS TWO-TIER BOARD ............................................................................... 42 FIGURE 2-4 THE FRAMEWORK ANALYSING BOARD ACTIVITIES ........................................................................ 49 FIGURE 3-5 THE PRIVATIZATION OF THE STATE-OWNED ENTERPRISES 1991—2001 .............................. 82 FIGURE 3-6 THE PRIVATIZATION OF THE STATE-OWNED ENTERPRISES 2002—2004 .............................. 87 FIGURE 3-7 THE PRIVATIZATION OF THE STATE-OWNED ENTERPRISES 2006—2011 .............................. 88 FIGURE 3-8 THE REALIZATION OF MASTER PLAN 2005--2009 ..................................................................... 101 FIGURE 3-9 THE LEGAL AND OPERATIONAL BASIS OF BUMNS ................................................................... 109 FIGURE 3-10 THE CORPORATE GOVERNANCE MECHANISM IN BUMNS .................................................... 111 FIGURE 3-11 THE INTERNAL MECHANISM OF CORPORATE GOVERNANCE IN BUMNS ............................ 113 FIGURE 3-12 THE STRUCTURE AND PROCESS OF CORPORATE GOVERNANCE IN BUMNS ................... 114 FIGURE 4-13 THE CONCEPTUAL FRAMEWORK FOR THE RESEARCH ........................................................... 127 FIGURE 4-14 THE FLOWS OF AGENCY COSTS, INVESTMENT, RETURN, AND EXPENSE IN THE SOE AND
SUBSIDIARY COMPANY ................................................................................................................................ 129 FIGURE 4-15 THE CONCEPTUAL FRAMEWORK FOR MEASURING AGENCY COSTS AND PERFORMANCE
.......................................................................................................................................................................... 130 FIGURE 4-16 THE CONCEPTUAL FRAMEWORK OF THE ATTRIBUTES TESTED ACCORDING TO SIX
DIMENSIONS OF ACCOUNTABILITY .............................................................................................................. 131 FIGURE 4-17 THE MAIN HYPOTHESES OF THE RESEARCH ............................................................................ 143 FIGURE 4-18 THE HYPOTHESES OF ENDOGENOUS VARIABLES .................................................................... 144 FIGURE 4-19 THE HYPOTHESES OF CONTROL VARIABLES ............................................................................ 144 FIGURE 4-20 THE HYPOTHESIS OF DEMOGRAPHIC AND COMPANY CHARACTERISTIC ATTRIBUTES
AGAINST THE ACCOUNTABILITY OF THE BOARD MEMBER DUALITY ....................................................... 145 FIGURE 5-21 THE RESEARCH PROCESS ........................................................................................................... 148 FIGURE 5-22 THE TRIANGULATION ANALYSIS SCHEME .................................................................................. 155
P a g e | xvi
LIST OF ABBREVIATIONS
ABCD America, British, China, Dutch
ABRI Angkatan Bersenjata Republik Indonesia (National Army Forces)
ACW Artilerie Constructie Winkel
AI Artilerie Inrichtingen
ANIEM Indische Electriteit Maatschappij
ASEAN Association of South East Asian Nations
ATO Asset Turn Over
BC Before Christ
BCOM Board Composition
BD Board Member Duality
BFO Bijeenkomst voor Federal Overleg
BOD Board of Director
BOC Board of Commissioner
BPM Bataviaasche Petroleum Maaschappij
BPIS Badan Pengelola Industry Strategis (the Strategic Industry Management
Board)
BSIZE Board Size
BUMN Badan Usaha Milik Negara (State-Owned Enterprise)
BTW Banka Tin Winning Bedrijf
CAPEX Capital Expenditure
CEO Chief Executive Officer
CFO Chief Financial Officer
CIO Chief Information Officer
COO Chief Operating Officer
DPR Dividend Payout Ratio
DR Debt Ratio
EBIT Earnings Before Interest and Tax
ECM Error Component Model
EKON Ekonomi (Economy)
FAGE Firm Age
FCGI Forum for Corporate Governance in Indonesia
FGROWTH Firm Growth
P a g e | xvii
FSIZE Firm Size
GCG Good Corporate Governance
GLS Generalized Least Square
GMB Gemeenschappelijke Mijnbouw Maatschappij
GDP Gross National Product
GMOS General Meeting of Shareholders
GOWN Government Ownership
GW Geweemarkelschool
H0 Null Hypothesis
Ha Alternative Hypothesis
IBRA Indonesian Banking Restructuring Agency
IBW Indische Bedrijvenwet
ICW Indische Comptabiiteitswet
IDR Indonesia Rupiah
IFRS International Financial Reporting Standard
IGGI Inter Governmental Group on Indonesia
IMF International Monetary Fund
INKA Industry Kereta Api (Train Industry)
INTI Industri Telekomunikasi Indonesia (Indonesia Telecommunication
Industry)
KEP Keputusan (Decree)
KLM Koningkelijke Luchvaart Maatschappij
KPM Koninlijke Paketvaart Maatschappij
KPI Key Performance Indicator
LEN Lembaga Elektronika (Electronic Institute)
LIQ Liquidity
LSDV Least Square Dummy Variable
LKBN Lembaga Kantor Berita Nasional (The National News Agency Institute)
LKIP Laporan Kinerja Instansi Pemerintah (the Performance Report of the
Government Institution)
MBCfPE Malcolm Baldridge Criteria for Performance Excellent
MP3EI Master Plan Percepatan dan Perluasan Pembangunan Ekonomi
Indonesia (Master Plan for the Acceleration and Expansion of
Indonesia’s Economic Development)
MSOE The Ministry of State-Owned Enterprises
NCCG National Committee on Corporate Governance
P a g e | xviii
NHM Nederlandsche Handel Maatschappij
NIEM Nederlandsche Indische Electriciteit Maatschaapij
NVNISM Naamloze Vennoostchap Nederlandsch Indische Spoorweg Maatshappij
NVSITEM Naamloze Vennoostchap Singkep Tin Exploitatie Maatschappij
OECD The Organization for Economic Co-operation and Develpopment
OPEX Operating Expenditure
PAL Penataran Angkatan Laut (Navy Yard Industry)
PELNI Pelayaran Nasional Indonesia (National Shipping Company)
PF Proyektiel Fabriek
PERJAN Perusahaan Jawatan (Bureau Company)
PERUM Perusahaan Umum Negara (Special Purpose Entity)
PINDAD Perusahaan Industri Angkatan Darat (Army Industrial Company)
PPA Perusahaan Pengelola Aset (Asset Management Company)
PPKI Panita Persiapan Kemerdekaan Indonesia (the Indonesian
Independency Preparatory Committee)
PSO Public Service Obligation
PTPN Perseroan Terbatas Perkebunan Nusantara (Plantation State Company)
ROA Return on Assets
ROE Return on Equity
REIT Real Estate Investment Trust
SLA Service Level Agreement
SOE State-Owned Enterprise
SUPERSEMAR Surat Perintah Sebelas Maret (The Presidential Decree of March, 11th)
TARIF Transparency Accountability Responsibility Independence Fairness
Tbk Terbuka (Listed)
US United States
UNCI United Nation Commission for Indonesia
UK United Kingdom
VOC Vereenigde Oost-Indische Compagnie
P a g e | 1
CHAPTER 1: INTRODUCTION TO THE STUDY “Logic will get you from A to B. Imagination will take
you everywhere” (Albert Enstein, 1879)
1.1. BACKGROUND TO THE RESEARCH
1. State-Owned Enterprises Need Better Performance
The increased role of the State-Owned Enterprises (SOE) or BUMN1 in economic
development is going to receive more attention from governments, especially when
capitalism cannot prevent market failure which leads to financial crises worldwide such as
the crisis of neoliberal capitalism in 2008, capitalism crisis in the mid-1970s, and at the end
of 1920s (Kotz, 2009). However, from the evidence, the performance of SOEs in
developing economies often falls below stakeholders’ expectations (Tivedi, 2008). Even
when SOEs have shown a better performance compared to their ‘counterparts’ in the
private sector, governments will constantly encounter pressures from stakeholders to
improve SOE’s performance.
There are three theories why the State-Owned Enterprises underperform, namely
monopoly theory, property theory, and principal-agent theory (Siahaan, 2005). According
to the monopoly theory, State-Owned Enterprises are usually given a privilege as a
monopoly to explore and/or exploit particular goods and/or services. As a result, often they
are trapped into doing the business inefficiently. The second theory is property right
theory. State-Owned Enterprises are owned by the state not by the public. In reality, the
state is not defined clearly, so the State-Owned Enterprises are perceived as having no
owner. Hence, there is little incentive for management to conduct the business efficiently.
The principal-agent theory assumes that a relationship exists between principal and
1 BUMN stands for Badan Usaha Milik Negara, a popular terminology referring to State-Owned Enterprises in Indonesia.
P a g e | 2
agent, where government is the principal and the State-Owned Enterprise is the agent.
However, since the ultimate beneficiaries of State-Owned Enterprises are actually the
people of the country, then the government and SOEs in a broader context are also the
agents susceptible to political intervention, thereby complicating the situation. According to
this theory, principal and agent have different goals and each will try to maximise its
opportunities. This relationship between principal and agent will incur agency costs which
become the principal’s expenses (Jensen and Meckling, 1976).
2. Corporate Board as a Priority Target for Improving Company Performance
Frederick (2011) revealed in an interview describing his research that directors in many
OECD countries admitted that, generally, the top priority target to increase SOE
performance is to reform the function of the SOE boards. One strategic issue in terms of
reforming the SOE corporate boards is that of duality whereby a corporate board member
has more than one role or position at director level in more than one company. Previous
research on duality is usually one of three types: chief executive director (CEO) duality,
interlocking directorship, and multiple directorships. CEO duality, the most popular duality
occurring in companies which follow a one-tier system, exists when a director holds two
positions simultaneously, that is, as a chief executive officer and as a chairman of the
board of directors (Dalton and Dalton, 2011). Hence, a duality holder has a management
function as a CEO and an oversight function as a chairman of the board that may influence
a corporate decision. The results of previous research show that impact of CEO duality on
company performance is not consistent and seems to vary. Donaldson and Davis (1991b),
Boyd (1995), and Brickley et al. (2005) found that CEO duality had a positive impact on
company performance, whereas Rechner and Dalton (1991), Pi and Timme (1993), and
Daily and Dalton (1994) found the opposite. However, the findings of Berg and Smith
(1978), Chaganti et al. (1985b), and Baliga et al. (1996) did not support the results of either
P a g e | 3
of the other researcher groups. The latter’s results indicate that there is no systematic
relationship between CEO duality and company performance.
The other dualities are the interlocking directorships and the multiple directorships. These
dualities occur when a director of a company also serves as a director of another
company/s. The difference between those the two dualities is the relative position of the
director to the company, where an interlocking director will interlock two companies, let us
say A and B. Each director in companies A and B holds a duality position as a director in
the two companies, A and B (direct interlocking), or director A and B also serves as a
director in C company (indirect interlocking), (Gabrielsen et al., 2011), (Shropshire, 2010),
and (Hallock, 1997), whereas a multiple director does not interlock the companies in
his/her role as a member of the board of directors of the companies.
This research proposes a new terminology to describe a new type of duality which is
slightly different from the three dualities mentioned above. This terminology is Board
Member Duality, and refers to the situation in which a director of a parent company also
has a position as a commissioner in a subsidiary company/s. Board member duality occurs
in the context of a relationship between parent and subsidiary company. To date, no
corporate governance literature has explored this board member duality situation.
Furthermore, this type of duality has rarely been addressed in previous research although
board member duality is a very common occurrence in companies which follow a two-tier
board system.
Why has duality rarely been explored in previous research? Previous researchers may
have loosely assumed that all companies are basically the same and are viewed as a
single entity, without considering the parent and subsidiary relationship. The parent and
subsidiary relationship should be differentiated from the nonparent-subsidiary company,
P a g e | 4
especially if a subsidiary is fully controlled by the parent company2 (Kirk, 2009). The parent
company can constrain its subsidiary company to conform to parent company policy,
thereby substantially influencing the subsidiary’s own policy. In particular, a parent
company can influence a subsidiary company’s policy through a decision resulting from a
general meeting of shareholders of the subsidiary company, or by channeling the parent's
policy through directors and/or commissioners originating from the parent company.
3. Board Member Duality in Indonesia
Corporations in a country which follows a two-tier board system, generally have two
corporate boards: a board of directors which is responsible for managing company
operations, and a board of commissioners responsible for the oversight of the company
(Belot et al., 2014). In the context of parent and subsidiary relationships which follow the
two-tier board system, it is very common for a director of a parent company to be
appointed as a commissioner in a subsidiary company. In this case, board member duality
would occur. The implication of board member duality is drawn from agency theory which
states that the interests of principal and agent are different, and therefore a conflict of
interests may occur. This situation raises the question of loyalty. Will the agent give
his/her loyalty to the parent company or to the subsidiary company? There are at least
two main sources of potential conflict regarding board member duality. Firstly, the conflict
of interests could arise at the administration level where the duality holder who is a parent
director/s is also involved in setting the agenda and becoming a chairman of a general
meeting of shareholders of the subsidiary company. Secondly, at the technical level, the
conflict of interests could arise when the duality holders are involved in deciding
intercompany transactions such as dividend payments, subcontracting a project, transfer
pricing and taxes allocation, purchases or swaps of assets.
2 From the accounting perspective, the consolidated financial statement indicates that a parent company can control a subsidiary company even though its ownership is less than 50% of shares.
P a g e | 5
Board member duality occurs in companies which operate in countries which follow the
two-tier board structure, which is common in companies operating in Indonesia. The
corporate law3 does not prohibit a director from serving as a commissioner in a subsidiary
company. As a result, if a parent company has many subsidiary companies, then a parent
company director could have more than one position as commissioner in the subsidiary
companies. In fact, the tasks of director and commissioner are different. The director’s
tasks are more focused on execution functions whereas commissioner tasks are more
focused on oversight functions. This duality leads to several issues that are typical of
corporate boards such as span of control, conflict of interests, dual roles, efficiency, and
control. Will these positions potentially leverage the SOE’s performance by aligning,
accelerating, and cost-efficient decision making process in both parent and subsidiary
company? Or will the duality position holders abuse their position for their own self-interest
that inflicts a financial loss on companies?
The corporate law allows a director to hold more than one position as a director and/or
commissioner. However, there is a principle in law called the ‘special law repeals general
law’ (lex specialis derogat legi generali) that can be applied (Zimmermann, 1997) and may
specify terms and conditions for the position of director and commissioner. For example, in
Indonesia, if corporations are going to go public or be listed in the capital market, then the
appointment of the directors and commissioners must follow regulations enacted by the
Financial Services Authority4. In addition, the companies also must follow their sector’s
regulations. For example, in the financial services sector, especially in the banking
business, the Central Bank, ‘Bank Indonesia’ prohibits a director of a bank to have other
positions as a commissioner, director or executive officer at another bank, company, or
3 Undang-Undang Nomor 40 Tahun 2007 Tentang Perseroan Terbatas [Law No.40 of 2007 on Limited Liability Companies) (Indonesia) art 93 and art 110. 4 Peraturan Otoritas Jasa Keuangan Nomor 33/POJK.04/2014 Tentang Direksi dan Komisaris Emiten atau Perusahaan Publik [Regulation of Financial Services Authority No.33/POJK.04/2014 Regarding Directors and Issuer Commissioner or Public Company.
P a g e | 6
other institution5; as a consequence, at the same time a banking director cannot serve as a
commissioner in its group or its subsidiary company. The Ministry of State-Owned
Enterprises prohibits a director of a state-owned enterprise from having a duality position
at the same level of board directors in other corporations6. The duality position in a
company is also tightly regulated by the Commission for the Supervision of Business
Competition which identifies monopolistic practices and unfair business competition which
could occur in a dual director and/or commissioner position7.
If the Central Bank and the Commission for the Supervision of Business Competition
regulate director duality mainly to prevent monopolistic practices and unfair business
competition, then the Ministry of State-Owned Enterprises regulates the duality position
mainly to prevent a conflict of interests which harms the performance of State-Owned
Enterprises. However, according to State-Owned Enterprise Law8, the Ministry of State-
Owned Enterprises can regulate only the state-owned enterprise, and not the subsidiary
company. The State-Owned Enterprise is defined as a corporation in which all or a
majority of its shares are owned by the state through direct investment from state wealth
which is separated from state budget9. This means that by definition, a subsidiary
company is not a state-owned enterprise and is therefore not included in the legislation.
5 Peraturan Bank Indonesia Nomor 8/14/PBI/2006 Tentang Amandemen peraturan bank Indonesia Nomor 8/4/PBI Mengenai Penerapan Tata Kelola Yang Baik bagi Bank-Bank Komersiil [Regulation of Bank Indonesia No. 8/14/PBI/2006 on amendment to Regulation of Bank Indonesia Number 8/4/PBI/2006 Regarding Implementation of Good Corporate Governance for Commercial Banks] (Indonesia) art 22 6 Peraturan Menteri BUMN Nomor PER-01/MBU/2012 Tentang Persyaratan dan Tata Cara Pengangkatan dan Pemberhentian Anggota Direksi Badan Usaha Milik Negara [Ministerial Decree No. PER-01/MBU/2012 on Terms and Procedures for Appointment and Dismissal of Director of the State-owned Enterprises] (Indonesia) art 36 7 Undang-Undang Nomor 5 Tahun 1999 Tentang Larangan Praktek Monopoli dan Persaingan Usaha Tidak Sehat [Law No.5 of 1999 on The Prohibition of Monopolistic Practices and Unfair Business Competition] (Indonesia) art 26 8 Undang-Undang Nomor 19 Tahun 2003 Tentang Badan Usaha Milik Negara [Law No.19 of 2003 on Stateowned Enterprise) (Indonesia) art 1.1 9 Ibid
P a g e | 7
The government cannot directly control the subsidiary companies, but it can control them
indirectly through parent company directors who are appointed by the government and
who also act as shareholders of the subsidiary company. This governing structure seems
to overlap (when duality occurs) if the parent director/s is also appointed as a
commissioner of the subsidiary company. There are at least three positions which are held
by the parent company director at the same time. The first position is as a parent company
director, the second position is as a shareholder of the subsidiary company/s, and the third
position is as a commissioner of subsidiary company/s. This board member duality which
occurs in SOEs in Indonesia is the focus of this research.
1.2. RESEARCH PROBLEM
Board member duality is embedded in the parent and subsidiary relationship, in which a
parent director also serves as a commissioner in a subsidiary company, and this produces
several challenges. The first role is an executive function which more heavily focuses on
managing the day-to-day business of the parent company, and the second role is an
oversight function, which more heavily focuses on oversight of the subsidiary company.
Common issues arising as a result of duality include: how many companies a parent
director can serve as a commissioner in a subsidiary company/s (span of control); to
whom the duality holder should give his/her allegiance, to the parent company or the
subsidiary company, and does it involve self-interest (conflict of interests); how to
differentiate a leadership style for the executive role and oversight role (dual roles); will it
be efficient if integrating executive and oversight function in one person; and it be better
control? All and all, according to agency theory, the process involved in the relationship
between principal and agent, or in this context between shareholder and corporate board,
will incur costs, called agency costs. Thus, board member duality and agency costs are
the main theme of this research. This research will address a main research question:
P a g e | 8
“Does the duality position of the board of directors in parent and subsidiary impact
on the agency cost of the State-Owned Enterprises in Indonesia?”
1.3. OBJECTIVES OF THE STUDY
The three primary objectives of the study are to:
1. Measure agency costs incurred by board member duality from the two-tiered board
perspective and a parent—subsidiary relationship, and also their impact on the
company performance of state-owned enterprises.
2. Determine the progress of accountability of parent and subsidiary governance in
State-Owned Enterprise based on dimension of ethics and integrity, cost and
benefit, regulation, role of dual director, financial accountability, and leadership.
3. Recommend to the Ministry of State-Owned Enterprises how to improve parent
and subsidiary governance in SOE and proposals to amend or improve the SOE
Act if needed.
1.4. CONTRIBUTION TO KNOWLEDGE
This research contributes to the international literature on corporate governance in the
two-tiered model and has potential, through synthesizing the strands of literature into
‘Agency Theory and ‘Stewardship Theory, to bring together these themes into a coherent
investigation of a corporate board role. This study will result an original contribution to
knowledge in the following areas:
1. It will enhance an understanding of agency costs incurred in a board member
duality in the two-tiered context;
2. It will contribute to a better understanding of the different variables that influence a
better corporate governance implementation in parent—subsidiary governance
relationship.
P a g e | 9
3. It will add a new horizon and opportunity for improvement of the performance
corporate board in connection with parent—subsidiary governance relationship in
Indonesia and this might be useful beyond the research site—both nationally and
internationally;
1.5. STATEMENT OF SIGNIFICANCE
This research is intended to make several practical contributions in the following ways:
1. It will assist shareholders, investors, regulators and stakeholders of State-Owned
Enterprises with their analyses, evaluations and decision-making and more
importantly, it is significant for further improving corporate governance policy
regarding the parent—subsidiary governance relationship.
2. It will generate recommendations and a framework for better appointment of board
membership and composition of both SOEs and their subsidiaries.
3. The research could help relevant personnel to better understand agency problems,
such as conflicts of interest that might occur and agency costs associated with the
agency problem of duality positions.
4. This research is of particular relevance to the parent and subsidiary governance
relationship of SOEs in the context of board member duality in the two-tiered board
system (European model) used in Indonesia. The increase in value and
performance of SOEs as a result of this research is very significant given the
ongoing pressure to improve the transparency and accountability SOEs.
1.6. SCOPE OF THE RESEARCH
The research project is intriguing, complex and challenging due to the dynamic nature of
state-owned enterprises which are usually encumbered with various political interests. The
scope of the research is board member duality in state-owned enterprises having
subsidiary/s in Indonesia, ranging from 2009 to 2013. The number of state-owned
P a g e | 10
enterprises in Indonesia as of December 31, 2013 was 139 SOEs comprised of 20 listed
SOEs in the capital market, 105 non-listed SOEs, and 14 Special Purpose Entities
(Perum), plus 12 enterprises with minority government ownership (BUMN, 2015). In fact,
74 out of 139 are State-owned Enterprises which have subsidiaries. The total number of
subsidiary companies owned by the 74 state owned enterprises is 270.
This research will focus on investigating the impact of the parent directors (SOEs directors)
who also serve as commissioners in subsidiary/s, and agency costs in the state-owned
enterprises in Indonesia. The main challenge of this research was to source data and
information from subsidiary companies, which by definition are not state-owned, and which
usually means that they are less transparent than parent companies. However, in order to
acquire and explore an adequate amount of information about subsidiary companies, this
research will use the triangulation method (sometimes called mix method) which combines
three different sources of information - survey, interview and secondary data - in order to
obtain more comprehensive results.
1.7. DEFINITION OF KEY TERMS
Agency Costs are the sum of the monitoring expenditure incurred by the principal/owner,
the bonding expenditures by the agent and the residual loss (Jensen and
Meckling, 1976). The agency costs may increase when a conflict of interests
between principal/owner and agent/manager occurs, moral hazard of the agents,
and shirking and perquisite consumption by agents. This research uses efficiency
ratios to measure the agency costs.
Board refers to “a group of people who officially administer a company”
Board Member Duality is a situation in which a director of a parent company also serves
as a commissioner in its subsidiary company/s.
P a g e | 11
Board of Commissioners is a company organ which has the task of being an oversight
board in the context of a two-tier board system. A member of a board of
commissioners is called a commissioner.
Board of Directors is a company organ which has a task to manage company day-to-day
operations. A member of a board of directors is called a director.
BUMN stands for Badan Usaha Milik Negara, an Indonesian terminology for the State-
Owned Enterprise.
CEO Duality is a situation in which a chief executive officer of a company also serves as
chairman of a board of director
Conflict of Interests is a situation in which the public interests conflict with company
interests.
Corporate Governance is “the system by which companies are directed and controlled”
(Cadbury, 1992).
Duality is the state or quality of being two or in two parts.
Efficiency Ratio measures how well a company utilizes its assets to generate income.
This research uses two efficiency ratios: expense ratio and asset utilization ratio.
Interlocking Directorship can be direct or indirect. A direct interlocking directorship
refers to a situation in which a director in company A is also a member of the
board of directors in company B, or vice versa, (Chhaochharia and Grinstein,
2007). Whereas, an indirect interlocking directorship refers to a situation in which a
director in companies A and B also serves on the board of directors in company C.
Multiple Directorship is a situation in which a director sits on more than one corporate
board (Scott, 1997).
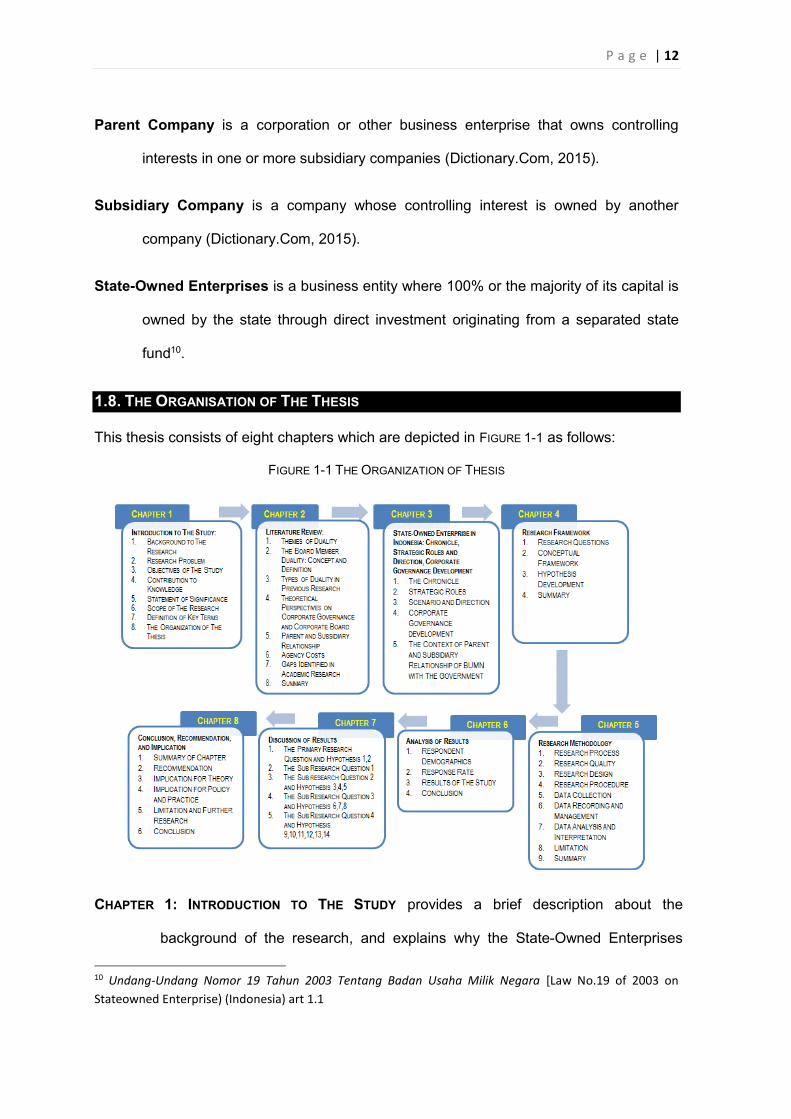
P a g e | 12
Parent Company is a corporation or other business enterprise that owns controlling
interests in one or more subsidiary companies (Dictionary.Com, 2015).
Subsidiary Company is a company whose controlling interest is owned by another
company (Dictionary.Com, 2015).
State-Owned Enterprises is a business entity where 100% or the majority of its capital is
owned by the state through direct investment originating from a separated state
fund10.
1.8. THE ORGANISATION OF THE THESIS
This thesis consists of eight chapters which are depicted in FIGURE 1-1 as follows:
FIGURE 1-1 THE ORGANIZATION OF THESIS
CHAPTER 1: INTRODUCTION TO THE STUDY provides a brief description about the
background of the research, and explains why the State-Owned Enterprises
10 Undang-Undang Nomor 19 Tahun 2003 Tentang Badan Usaha Milik Negara [Law No.19 of 2003 on Stateowned Enterprise) (Indonesia) art 1.1
P a g e | 13
(BUMN) needs better performance, a corporate board target for improving a
SOEs performance, and the regulation of board member duality in Indonesia.
The research problem, objective of the study and scope of the research guides
to the major focus of this research. Contribution of knowledge, statement of
significance and definition of key terms are the integral parts of this chapter.
CHAPTER 2: LITERATURE REVIEW explains previous research and research gap which is
found in a theme of corporate board duality such as CEO duality, interlocking
directorship, and multiple directorship, whereas the board member duality is a
new terminology which introduced in this chapter. Furthermore, this chapter also
examines theories relevant to duality positions in corporations and compares
and contrasts various theories in order to acquire a more comprehensive
understanding about the research project. In addition, the history of corporate
governance and corporate boards, the relationship of parent and subsidiary
companies, and agency costs are explored in this chapter.
CHAPTER 3: STATE-OWNED ENTERPRISES IN INDONESIA: CHRONICLE, STRATEGIC ROLES AND
DIRECTION, AND CORPORATE GOVERNANCE DEVELOPMENT examines the history
of State-Owned Enterprises in Indonesia which comprises five periods: the
Dutch era, the Japan era, the Old Order era, the New Order, and the Reform
era. This chapter also outlines the strategic role and direction of state-owned
enterprises which are formulated by the Ministry of State-Owned Enterprises.
Corporate governance development is also an important part of this chapter
which explains the legal infrastructure system, board model, internal and
external corporate governance, structure and process of the governing body in
Indonesia.
CHAPTER 4: RESEARCH FRAMEWORK begins with a formulation of the research questions.
Then this chapter explores the theoretical perspectives on corporate boards,
P a g e | 14
focusing on the two-tier board model, duality versus non-duality, and agency
costs associated with costs incurred in the principal-agent relationship. The two
competing theories, namely agency theory and stewardship theory, are
compared and elaborated to develop a theoretical framework for the research.
Maximising shareholder value, internal governing rules, process and structure
and the relationship between parent and subsidiary company is the basis for the
development of the conceptual framework of board member duality. This chapter
concludes with the development of hypotheses.
CHAPTER 5: RESEARCH METHODOLOGY explains what scientific method is used in this
research. The chapter starts with research design which is inspired by the
triangulation method or previously called a mixed method. This method
combines quantitative and qualitative data resulting from surveys, interviews,
and empirical quantitative data processing. This chapter also outlines the
research procedures which cover ethics including confidentiality, questionnaire
preparation, data collection management, analyses, and interpretation. In
addition, research quality and limitations are included in this chapter.
CHAPTER 6: ANALYSIS OF RESULTS presents the analysis of the research data resulting
from field work, surveys, interviews, and secondary data collection which
basically are categorized as primary and secondary data. Descriptive and
inferential statistical analyses explained the population group characterised by
board member duality in state-owned enterprises. The response rate and
sources of data are also included in this chapter.
CHAPTER 7: DISCUSSION OF RESULTS explains and elaborates the results from the previous
chapter and answers the research questions formulated in Chapter 1 and
Chapter 4

P a g e | 15
CHAPTER 8: CONCLUSION, IMPLICATIONS AND RECOMMENDATIONS presents the concluding
remarks for the current research, along with the implications of the results, and
recommendations to the Legislative and the Ministry of State-Owned
Enterprises, in order to improve corporate governance in general, and
specifically the parent and subsidiary governance of State-Owned Enterprises.
P a g e | 16
CHAPTER 2: LITERATURE REVIEW “Power tends to corrupt, and absolute power corrupts absolutely. Great Men are almost all bad men”, the Lord Acton expressed his opinion in a letter to Bishop Mandell Creighton on April, 5 1887
(Waterlow, 1907).
INTRODUCTION
This chapter is intended to provide a detailed background of the research in the field of
duality of corporate board membership in the corporate governance arena, and to show
that there is a gap in the current research regarding the practice of corporate board
members serving in more than one position as directors. There are seven sections in this
chapter: the Introduction is followed by section 2.1: Themes of Duality Position and
Research Gap; section 2.2: The Board Member Duality: Concept and Definition; section
2.3: Types of Duality in Previous Research; section 2.4: Theoretical Perspective on
Corporate Governance and Corporate Board; and section 2.5: Parent and Subsidiary
Relationship; 2.6: Agency Cost; 2.7: Gap identified in Academic Research, and
Conclusion.
2.1. THEMES OF DUALITY POSITION AND RESEARCH GAP
In previous research themes related to duality positions in corporate boards generally fall
into three categories, namely: CEO Duality, Interlocking Directorships, and Multiple
Directorships. Research on CEO Duality focuses on matters associated with the position of
a chief executive officer who also holds the position of company chairman (see Dalton and
Dalton (2011), Dey et al. (2011), Bliss (2011), Horner (2010), Ramdani and Witteloostuijn
(2010)), whereas a multiple directorship is one where a person holds a position as a
director in more than one company (see Ahn et al. (2010), Jiraporn et al. (2008), Kiel and
Nicholson (2006), Wells (2000)). Then, slightly more specific is the interlocking
P a g e | 17
directorship, which can be either direct or indirect (see Gabrielsen et al. (2011), Shropshire
(2010), Hallock (1997), Mizruchi (1996)). A direct interlock occurs if two companies, let us
say A and B, share the same director; an indirect interlock occurs when two companies
have the same director serving as a board member in a third company.
This research differs from previous studies in that it investigates the duality position of an
executive board member in a parent company who also serves as an the oversight board
member in a subsidiary company in a state-owned enterprise. There is little research on
the duality position of corporate board members that specifically focuses on the parent and
subsidiary companies’ relationship. This lack of research may be due to the loose
assumption that all companies basically are the same so that the parent company and
subsidiary company are viewed as a single entity compared to other companies. This
researcher argues that the parent and subsidiary companies should be differentiated from
the nonparent-subsidiary company, especially if the parent company has full control over
the subsidiary11. This is because, naturally, the parent company as the major shareholder
will have a substantial influence on the subsidiary company’s policy. The influence can
formally be enforced through the General Meeting of Shareholders (GMOS) or informally
through the executive board members who have executive positions in the subsidiary
company.
This research will propose a new terminology - “the board member duality” - to differentiate
it from CEO Duality, Interlocking Directorship and Multiple Directorship as previously
researched. This thesis argues that each of the previous duality themes is different from
this current research for a number of reasons. Firstly, the board member duality occurs in
more than one company, whereas the CEO duality occurs in only one company. Secondly,
compared to interlocking directorship, the board member duality occurs only as a result of 11 In accounting terms, the consolidated financial statement indicates that the parent company has control over the subsidiary company even though it may own less than 50% of shares.
P a g e | 18
an appointment made by the parent company, not by the subsidiary. However, in the
interlocking directorship, both companies have an equal position. Thirdly, regarding the
terminology, the board member duality is in fact a part of a multiple directorship. However,
only a limited amount of major research has focused on the duality functions which are the
execution function and oversight function in parent company-subsidiary relationship. Most
of the research on multiple directorship focuses on the multiple positions of an executive
director who usually has the same role in more than one company, and it may be assumed
that the companies in which he or she holds the duality positions are equal. For example,
an executive director may have the same position and function in two or more companies.
The current research identifies the gap in previous research concerning the issue of
duality. In general, previous research addressed the accountability of executive directors
from the perspective of Agency theory and comparability with the common interest in
Stewardship theory. However, not much research has addressed the potential conflicts
that can arise as a result of executive directors having a duality position in both the parent
and the subsidiary company, especially for duality in the State-Owned Enterprises. This
thesis argues that the present laws and governance guidelines offer little guidance to the
directors holding these positions when they are faced with having to make ethical
decisions.
2.2. THE BOARD MEMBER DUALITY: CONCEPT AND DEFINITION
According to the Collins English Dictionary—Complete and unabridged (Harper, 2003), the
word “duality” means “the state or quality of being two or in two parts; dichotomy”;
whereas, the word “board” refers to “a group of people who officially administer a
company, trust, etc”. Thus, the words “board member duality” means “a group of people
who officially administer a company who has a quality of being two or in two parts”. The
terminology of “board member duality” is unknown in the corporate governance area. The
related common terminologies are CEO duality, interlocking directorship and multiple
P a g e | 19
directorships. In addition, the majority of research on those dualities has focused on the
one-tier board structure. For that reason, this research proposes a new terminology -
“board member duality” - to define what occurs specifically in a parent-subsidiary
governance relationship in order to differentiate this terminology from others used for
previous research.
The problems that may arise in a board member duality structure are essentially similar to
those experienced in a multiple directorship structure in the sense that the duality holders
who have a position in more than one board may be less effective in monitoring the
companies. This argument is frequently expressed by shareholder activists and
institutional investors (Ferris et al., 2003). The duality holders have to proportionately
balance their executive function in the parent company with their oversight function in the
subsidiary company. Interestingly, in State-Owned Enterprises, if the duality holder is a
CEO of the parent company, then he/she also has an additional role as ex-officio
shareholder. With three significant functions allocated to the duality holder, he/she
becomes more powerful and susceptible to conflict of interests that may emerge as a
result of those functions. There is a saying “power tends to corrupt, absolute power
corrupts abolutely”12 . Given the power held by the duality holder, especially the one who
has a dual position as CEO of a parent company and also as chairman of the board of
commissioners in the subsidiary company, he/she will be in a dominant position to decide
policies that will affect both companies. If companies have poor accountability, duality
holders could abuse their power. At the very least, two types of conflict of interests may
occur.
The first is conflict of interests occuring between the entities, meaning that there is a
conflict between the best interests of the parent company and the best interests of a
12 The Lord Acton expressed his opinion in a letter to Bishop Mandell Creighton on April 5, 1887
P a g e | 20
subsidiary company. The second type of conflict of interests occurs between the best
interests of the company and the private interests. There is an increased chance of conflict
of interests occurring in board member duality in the two-tier board model. As identified by
Aste (1999), the principal-agent problem could occur in the two–tiered board model in
which the board member duality also uses the two-tier board model. These principal-agent
problems include: the problems that arise in the interlocking directorship situation (see
Chapter 2), the appointment of the corporate board members based on political rather than
economic reasons, and creating an alternate scenario where it appears that the two-tier
board process is being followed, but in fact it operates as a one-tier board because of the
power of the executive director. All these problems can produce agency costs for both
parent and subsidiary companies; ultimately, this will influence the shareholders’ returns; in
this case, it is the state’s income.
2.3. TYPES OF DUALITY IN PREVIOUS RESEARCH
2.3.1. CEO Duality
CEO duality is the situation in which a CEO of a company and a chairman of the board of
directors is the same person (Baliga et al., 1996), and is within the corporate governance
context of a one-tier system (Anglo American model). In US, until the early 1990s, more
than 70% of the companies had CEO duality, but now the companies are under pressure
to abolish it (Yang and Zhao, 2012). This issue has prompted researchers to investigate
its impact on company performance (see Rashid (2012), Dey et al. (2011) Cashen (2011),
Horner (2010), and Tuggle et al. (2008) among others). However, the majority of the
research in recent years has produced inconsistent and varying results. Kim and
Buchanan (2008) state that some researchers such as Donaldson and Davis (1991b),
Boyd (1995), and Brickley et al. (2005) have found a positive impact of Chief Executive
Officer (CEO) duality on company performance. On the other hand, researchers such as
Rechner and Dalton (1991), Pi and Timme (1993), and Daily and Dalton (1994) have
P a g e | 21
found opposite results. Furthermore, Kim and Buchanan (2008) also note that some
researchers such as Berg and Smith (1978), Chaganti et al. (1985b), and Baliga et al.
(1996) find that there is no consistent relationship between CEO duality and company
performance.
Bezemer et al. (2012) argue that CEO duality in the two-tier context (European model) is
impossible. This is quite understandable since the position of chairman on a single-tiered
board model is very different from the two-tiered model. The board of directors in the
single-tiered board model comprises executive and non-executive directors integrating
control and management decisions (Fama and Jensen, 1983), whereas the two-tiered
board model separates the two functions into management decisions by the management
board and control decisions by the supervisory board (du Plessis and Saenger, 2012,
Benedicte and Ronald, 2010, Jungmann, 2006, Hubert and Tine De, 2002).
2.3.2. Interlocking Directorship
Another type of corporate board executive duality is the “interlocking director” whereby the
CEO of company A is also a member of the board of company B, and vice versa where
the CEO of company B is also a member of the board of company A (Chhaochharia and
Grinstein, 2007). The interlocking directorship could occur indirectly where a CEO of
company A and B also serve on the board of company C. Chhaochharia and Grinstein
(2007) argue that interlocking directorship leads to ineffective monitoring because
directors are likely to look out for their own interests rather than those of the shareholders.
This argument is consistent with that of Hallock (1997) who states that a CEO in an
interlocking directorship situation tends to receive a higher salary than others. According
to Chhaochharia and Grinstein (2007), percentage of interlocking directorships in the USA
decreased from 1993 to 2003 regardless of the size of firms. This trend is similar to a
previous research finding in the UK for the period 1906 to 1973 (Hughes et al., 1977).
P a g e | 22
2.3.3. Multiple Directorships
A person who sits on more than one corporate board is called a multiple director (Scott,
1997) but according to the company status, not all multiple directors are in an interlocking
directorship situation. The maximum number of directorships that may be held
simultaneously is open to debate (see Kiel and Nicholson (2006), (Ferris et al., 2003)).
Shareholder activists and institutional investors often criticize multiple directorships,
arguing that the multiple directorships in multiple companies are not effective in monitoring
a management (Ferris et al., 2003). However, research conducted by Ferris et al. (2003)
found that the number of appointments held by a director has a positive effect on
company performance. The fundamental issues associated with multiple directorships, the
conflict of interests, and the fiduciary duties that could potentially arise when one director
serves more than one company (Wells, 2000).
2.4. THEORETICAL PERSPECTIVES ON CORPORATE GOVERNANCE AND CORPORATE BOARD
2.4.1. The Milestones of Corporate Governance Development
The Romans in the early 3rd century BC, applied a corporation concept in the natural
science area instead of in jurisprudence, and its meaning was much broader than today’s
concept (Patterson, 1983). Many corporate attributes can be found in the Roman natural
science area conceptualized in The Stoic’s Scientific Theory. This theory is considered to
be the origin of the general theory of corpora which suggests that “all objects which
appear as separate things possess an inner spirit, called a species or spiritus, which
made that object into a separate body, or corpus” (ibid. p. 90).
Eventually, the "corpora" concept evolved into the corporation concept and became the
modern corporation concept in Europe. The milestones in the development of the modern
corporation concept are described below.
P a g e | 23
1) The First Pre-Modern Corporation Prototype
Historically, the emergence of pre-modern corporation can be traced back to 1601
when the State-General of the Netherlands established the Dutch East India
Company called the Vereenigde Oost-Indische Compagnie, VOC and granted a 21-
year monopoly to exploit Asia. Then, the VOC issued its shares to business
chambers in the Netherlands’ major harbor cities and, through them, many smaller
investors also bought the VOC’s shares. At the end of the annual financial period,
investors who had bought the VOC’s share would receive dividends. The
establishment of the VOC, the schema of share selling, and dividend payment were
a significant improvement on the first corporate model. The VOC survived for over
200 years with that schema and it was considered to be a highly successful
business model (Ibid. page 7).
2) Industrial Revolution Era
The Industrial Revolution that began in England in the 19th century, was a major
turning point in the world’s history. This revolution influenced almost all aspects of
daily life (Johnston, 2002). The application of technology to new manufacturing
processes occurred during that period, with machines taking over manual tasks. The
innovations of the Industrial Revolution were applied to three main sectors: textiles,
steam power and iron making. This era saw the emergence of “entrepreneurship”,
with entrepreneurs being the heroes and central figures of the Industrial Revolution
era (More, 2000). Historians noted that the number of businessmen during this time
was increasing and they were coming from various backgrounds such as mercantile
families, manufacturing families, and farmers. The number of companies that quickly
became large-scale companies increased rapidly. In consequence, there developed
an important distinction between blue collar workers, white collar employees, and
owners.
P a g e | 24
3) Management Era
A century later, “management” become a phenomenal theme even though the early
writings on management can be traced back to several ancient military texts such as
The Art of War of Sun Tzu, a Chinese General, in the 6th century BC, Arthashastra
of Chanakya, Indian, around 300 BC, and The Prince of Niccolo Machiavelli, Italian
(c 1515) (Gomez-Mejia et al., 2005). Many prominent figures in management in the
20th century introduced the management concept more comprehensively. For
example, there are the works of Frederick Winslow Taylor with The Principle of
Scientific Management (Copley, 1923), Gilbreth and Gilbreth (1919) with Applied
Motion Study, Henry L. Gantt with Chart of Gantt (Gantt, 1961), and Yoichi Ueno
with The Japanese-management Style (Tsutsui, 2001). Furthermore, principles from
other disciplines such as economics, psychology and sociology contributed to the
development of the management concept. A notable writer of the era, Henry Fayol,
saw management as having six functions: forecasting, planning, organizing,
commanding, coordinating and controlling (George, 1972).
4) Governance Era
Nowadays, in the 21th century, “corporate governance” has been the strategic
agenda for the stock market and for corporations. The US stock market crash of
2001/2002 and the corporate collapse of Enron Corp. in December 2001, from which
not only their investors but also many people in US suffered, have been a wake-up
call for policy makers, business leaders, governments, regulators, investors,
academicians and politicians around the world, especially in developed countries, all
of whom saw that it was necessary to change the way in which stock markets and
companies conduct business. Since then, the term “corporate governance” has gone
“viral” worldwide. Every company collapse is assumed to be caused by bad
corporate governance practice. World class companies such as Enron, World Com,
P a g e | 25
Qwest, Swissair, Parmalat, HIH Insurance, Arthur Andersen, and Lehman Brothers
are just a few examples of companies that have collapsed due to perceived bad
corporate governance practices.
2.4.2. The Definition of Corporate Governance
1) The Etymology, Lexical and Grammatical Concept of Corporate Governance
The term ‘corporate governance’ comprises two words: corporate and governance
which originated from Latin and Ancient Greek respectively. The word ‘corporate’ is
derived from Latin word ‘corpus’ meaning ‘body’. Then, ‘corpus’ as a noun is
changed into the Latin verb ‘corporare’ meaning “to form into one body or united in
one body”. Therefore, a corporation is a group of people to do as an individual. The
word ‘governance’ is derived from the Latinized Greek ‘gubernatio’ that means
government or management. The word ‘gubernatio’ originates from the Ancient
Greek ‘kybernao’ meaning to steer, to drive, to guide, to act as a pilot (Clarke, 2007).
The original meaning of corporate governance was explained by Sir Adrian Cadbury
who also cited Cicero as follows:
Governance is a word with a pedigree that dates back to Chaucer and
in his day the word carried with it the connotation wise and
responsible, which is appropriate. It means either the action of
governing or the method of governing and it is in the latter sense it is
used with reference to companies …A quotation which is worth
keeping in mind in this context is: ‘He that governs sits quietly at the
stern and scarce is seen to stir’.
It appeals to me, because it suggests that governance need not be
heavy-handed. The governor should be able to keep the corporate
ship on course with a minimum use of the tiller.
(Cadbury 2002: 1)
P a g e | 26
2) The First Theory of Corporate Governance
It is quite surprising that even though the notion of corporate governance has gained
popularity in the 21st century, the root of corporate governance theory can be traced
back to the 18th century when Adam Smith (1776) in The Wealth of Nations wrote:
Being the managers of other people’s money rather their own, it
cannot be expected that they [managers] should watch over it with the
same anxious vigilance which [they would] watch over their own.
Negligence and profusion, therefore, must always prevail, more or
less, in the management of the affairs of such a company.
This philosophical concept may have influenced Berle and Means (1932), Jensen
and Meckling (1976) and Fama and Jensen (1983) when constructing their theories
regarding a corporation.
The next event that greatly affected the development of the corporate governance
concept was the UK’s introduction of the Limited Liability Act 1855 that subsequently
passed into English Law13. This Act legislates the basic structure of a company
board (Mahoney, 2000). These two significant milestones above seem phenomenal
because Adam Smith’s statement is still relevant until today and is often cited by
many corporate governance theorists; the Limited Liability Act 1855 drives modern
corporate law which is very important to the construction of corporate governance.
3) Contemporary Definition and Concept
The earliest formal work on corporate governance can be found in the publication of
a series papers by the UK’s Institute of Chartered Secretaries and Administrators in
13 However, historically, the pre-modern corporation was created in The Netherlands when The Dutch East India Company was established in 1601. See CALDER, A. & EBOOKS CORPORATION, L. 2008. Corporate governance: a practical guide to the legal frameworks and international codes of practice, London, Kogan Page.
P a g e | 27
1979. However, the term “corporate governance” was firstly popularised by Robert
Tricker when he used it in his book titled The Independent Director (Calder, 2008)
He explained corporate governance as being “concerned with the way corporate
entities are governed, as distinct from the way businesses within those companies
are managed. Corporate Governance addresses the issues faced by boards of
directors, such as the interaction with top management, and relationships with the
owners and others interested in the affairs of the company” (ibid. Page 10).
In its development, far before corporate governance become a buzzword in this
decade, Sir Adrian Cadbury, a pioneer in raising the awareness and stimulating
corporate governance issues, defined Corporate governance as “the system by
which companies are directed and controlled (Cadbury, 1992)”. This definition is
short and succinct. In 1999, the Organization for Economic Co-operation and
Development (OECD) elaborated the definition of corporate governance by
incorporating its structures and objectives. Then, in 2004, the OECD developed a
corporate governance definition as “a set of relationships between a company’s
management, its board, its stakeholders and other stakeholders” (Organisation for
Economic et al., 2004).
Shortly after Sir Adrian Cadbury raised the corporate governance issue, a number of
authors offered definitions of corporate governance from various perspectives.
Farinha (2003) considered the definitions suggested by several authors such as
Zingales (1997), Shleifer and Vishny (1997), Garvey and Swan (1994), John and
Senbet (1998), and Caramanolis-Cötelli et al. (1996). Farinha concluded that
implicitly or explicitly, a conflict of interests between insiders and outsiders of a
company caused by the separation of ownership and control (see Jensen and
Meckling, 1976) was the common element shared by the definitions.
P a g e | 28
4) Diversity of Corporate Governance Forms
The diversity of corporate governance structures has encouraged many authors to
amalgamate various corporate governance models with similar characteristics into
one group. Paradoxically, this created a new type of corporate governance model.
Examples of various models include: Outsider System versus Insider System
(Clarke, 2007: 9), Market-Based System versus Bank-Based System (Boyd and
Cohen, 2000), Anglo American Model versus Continental European Model (Hubert
and Tine De, 2002). There is also a bulk of research on corporate governance
models based on the major economy countries: Germany, Japan, the United
Kingdom and the United States (Correia da Silva et al., 2004, Dignam et al., 2009,
Mallin, 2006, Clarke, 2007), the emerging market countries: Asia countries (OECD,
2007, Braga-Alves and Morey, 2012, John and Pamela, 2011, Minna, 2011), listed
companies (Sakulrat and Institute of Southeast Asian, 2006, Minh and Walker, 2008,
Shanthy, 2010, Rachagan, 2010) non-listed companies (McCahery and Vermeulen,
2008, Njoya, 2009, Wanjiru, 2009, Publishing et al., 2006); and state-owned
companies (Kaen, 2005, Whincop, 2005, Lowy, 2003). Even though all forms of
corporate governance mentioned above have individual characteristics, in general,
the board of directors is the prime factor in corporate governance issues (Hopt,
2012).
5) Board of Director as an Essential Element in Corporate Governance
Corporate governance provides a mechanism for resolving a conflict of interests that
could occur among the entities of a corporation, namely shareholders, corporate
board, management and stakeholders. The conflict of interests has a wide spectrum;
it can occur between or within the various entities of a corporation. From empirical
evidences, when bad corporate governance practices lead to the bankruptcy or
collapse of a corporation, many parties blame the board of directors, such as in the
P a g e | 29
Enron case (Gerald, 2002), HIH Insurance case (Westfield, 2003), and WorldCom
(Romero and Atlas, 2002). Hence, it is not surprising that there are numerous
research studies and reports on the corporate governance issue that focus on the
role and responsibilities of the board of directors.
Higgs and Britain (2003) described past board structures and practices, and
prescribed various effective corporate governance practices that need to be
improved or undertaken. Dalton and Dalton (2005) investigated the relationship
between board structure and company financial performance. They concluded that
personnel with the highest integrity and soundness of character will contribute much
to the effective boardroom process, so no amount of structural prescription can
guarantee an effective board of directors. Muth and Donaldson (2002) conducted a
research on the validity of several theoretical frameworks which resulted in different
predictions about the effect, on the company, of the board structure.
2.4.3. A Comparison of Corporate Governance Theories
1) Agency Theory
Agency theory is much influenced by the brilliant argument of Berle and Means
(1932) in their early works; they posited that, in a modern corporation, those who
legally have ownership over companies have been separated from their control.
When the company is on the small-capital scale, the owners could maximize their
utility by managing their own company. However, in line with the company’s growth,
the owners will require more capital and management to transform into a modern
corporation. At this stage, it is impossible for owners to manage their own company.
In consequence, the owners will hire an agent to manage the business. In corporate
governance terminology, this agent is known as the corporate board.
P a g e | 30
In terms of corporate governance, Agency theory makes two basic assumptions.
The first assumption is that the participants of a corporation are simplified into two
actors: principal (shareholder/owner) and agent (manager/director) whose interests
lie in maximizing their utility. This assumption is clear and consistent. Then, the
second assumption is that humans are unwilling to sacrifice their personal interests
for the interests of others; hence, they tend to be self-interested (Daily et al., 2003b).
This theory is known as the principal-agency theory.
Agency theory first gained prominence when Jensen and Meckling (1976)
formulated a theory relating to the ownership structure of the firm. They developed
their theory by integrating various elements of agency theory, property right theory,
and finance theory. Since then, the majority of researchers into corporate
governance who cite the agency theory very often refer to the theory proposed by
Jensen and Meckling (1976).
Jensen and Meckling (1976) defined an agency relationship from the perspective of
contract whereby the owners (s)/principal (s) engage the agent (manager) to
undertake services on behalf of the owner; this involves the owner delegating some
decision-making authority to the agent. The problem arises when principal and agent
have different interests arising from asymmetric information that is owned by each
party. The manager as an agent would not act in the best interests of shareholders
(principal) but acts in the best interests of himself/herself as a manager (agent).
According to Jensen and Meckling (1976), the principal’s losses resulting from the
principal’s and agent’s divergent interests can be reduced by imposing a control
structure (corporate governance structure) upon the agent. In the context of the
modern corporation, this means that shareholders should apply a control mechanism
to the corporate board.
P a g e | 31
From the historical development perspective of agency theory, there is still no
consensus about who was the first scholar to formulate the agency theory. Mitnick
(2006) claims that Stephen Ross and Barry Mitnick were the first scholars to
explicitly propose a theory of agency. Stephen Ross introduced the theory of agency
from an economic perspective where there is a problem in compensation contracting
known as the incentive problem; whereas, Barry Mitnick considered it from the
institutional perspective where there is an inherent imperfection in the agency
relationship. They developed the agency theory concurrently and independently.
However, some previous researchers in different subject areas, such as Cooper
(1949) in accounting and control literature; Downs (1957) in economic theory of
democracy; Arrow (1963) in medical care; Pitkin (1967) in political science; Tussman
(1960) in political philosophy; and Swanson (1971) in sociology; all contributed to the
shaping of an agency theory, well before Ross and Mitnick formally proposed their
own versions of it (ibid.7).
Agency theory may argue that the execution function and oversight function of a
corporate board have to be separated and should not be the responsibility of the
same person. It is a reason why various countries have introduced company
legislation to separate the role of a corporate board. Such legislation ensures that in
a unitary board or single-tier board, the execution function will be performed by
executive directors and the oversight function by non-executive directors and or
committees. Alternatively, in a two-tier board, the execution function will be
performed by the management board and oversight function by supervisory board
and or committees (Millet-Reyes and Zhao, 2010).
2) Stewardship Theory
Stewardship Theory was conceptualised by Donaldson and Davis (1991) in
response to the need for a more positive view of manager or agent, and to explain
P a g e | 32
the inconsistent findings of several research studies on Agency theory (Stigler and
Friedland, 1983, Vance, 1978, Donaldson and Davis, 1991b). Some researchers in
sociology and psychology fields identified the limitation imposed by the assumptions
underlying agency theory (Hirsch et al., 1987). The agency theory’s assumption that
states that motivations of maximizing an individual utility that cause the divergence
of interests in principal-agent relationships, may not hold true for all managers, so
that an alternative theory should be developed in order to explain the phenomenon.
The stewardship theory proposes an assumption that is in contrast to that of Agency
theory. It assumes that managers and principals have converging goals and their
interests are aligned so that the managers’ behaviour will not diverge from the
principal’s expectations. Managers do not have an inner motivational problem such
as the executive compensation problem, and because of having the same goal, they
will both establish a mechanism and a structure that will enable them to coordinate
effectively (Donaldson and Davis, 1990). Thus, it is assumed that managers will
maximize the shareholders’ interests (Donaldson and Davis, 1991b).
In order to adhere to the goal-oriented behaviour that is aligned with the principal’s
expectations, a manager’s actions are motivated by several factors. Donaldson
(2008) explains that there are two different motivations for managers who follow
stewardship theory, namely a reward type and a non-utilitarian type. The first
motivation type is identified when managers are satisfied if they act pro-
organizationally. Thus, the psychological needs such as achievement, responsibility,
work challenge, and performing well, are important considerations for the managers.
The second motivation type is when a reward and psychological factors are not the
reasons for performing the tasks.
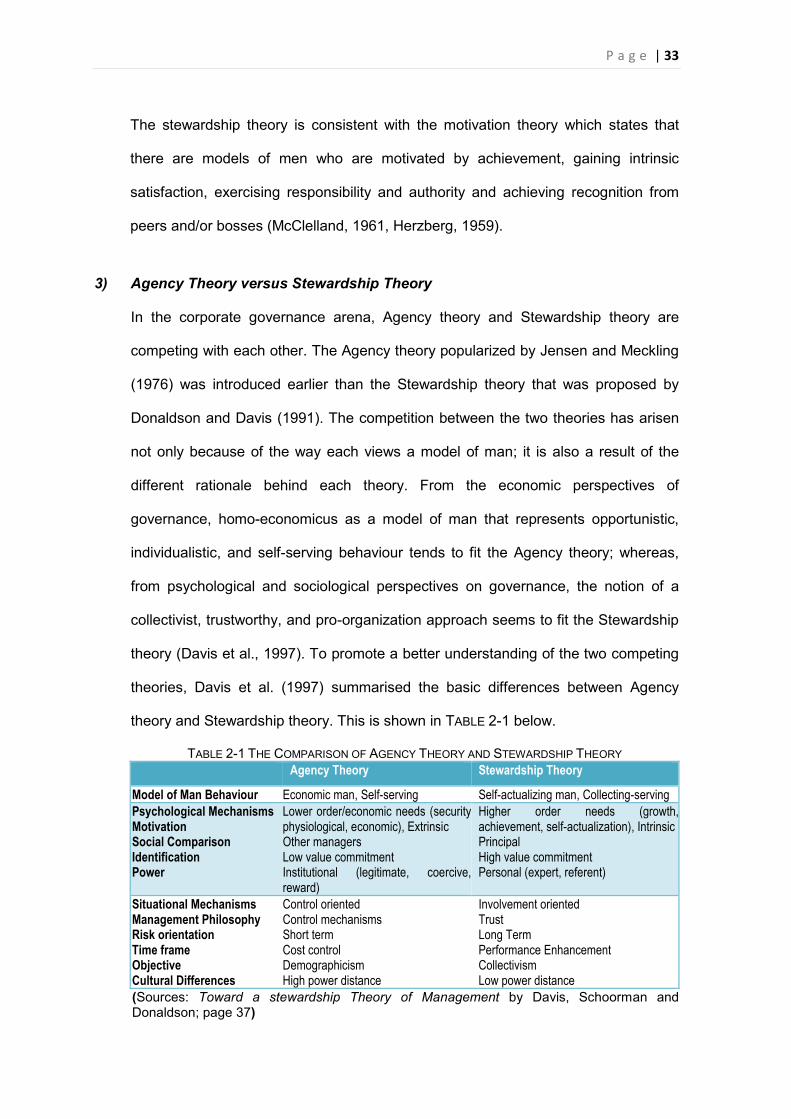
P a g e | 33
The stewardship theory is consistent with the motivation theory which states that
there are models of men who are motivated by achievement, gaining intrinsic
satisfaction, exercising responsibility and authority and achieving recognition from
peers and/or bosses (McClelland, 1961, Herzberg, 1959).
3) Agency Theory versus Stewardship Theory
In the corporate governance arena, Agency theory and Stewardship theory are
competing with each other. The Agency theory popularized by Jensen and Meckling
(1976) was introduced earlier than the Stewardship theory that was proposed by
Donaldson and Davis (1991). The competition between the two theories has arisen
not only because of the way each views a model of man; it is also a result of the
different rationale behind each theory. From the economic perspectives of
governance, homo-economicus as a model of man that represents opportunistic,
individualistic, and self-serving behaviour tends to fit the Agency theory; whereas,
from psychological and sociological perspectives on governance, the notion of a
collectivist, trustworthy, and pro-organization approach seems to fit the Stewardship
theory (Davis et al., 1997). To promote a better understanding of the two competing
theories, Davis et al. (1997) summarised the basic differences between Agency
theory and Stewardship theory. This is shown in TABLE 2-1 below.
TABLE 2-1 THE COMPARISON OF AGENCY THEORY AND STEWARDSHIP THEORY Agency Theory Stewardship Theory
Model of Man Behaviour Economic man, Self-serving Self-actualizing man, Collecting-serving Psychological Mechanisms Motivation Social Comparison Identification Power
Lower order/economic needs (security physiological, economic), Extrinsic Other managers Low value commitment Institutional (legitimate, coercive, reward)
Higher order needs (growth, achievement, self-actualization), Intrinsic Principal High value commitment Personal (expert, referent)
Situational Mechanisms Management Philosophy Risk orientation Time frame Objective Cultural Differences
Control oriented Control mechanisms Short term Cost control Demographicism High power distance
Involvement oriented Trust Long Term Performance Enhancement Collectivism Low power distance
(Sources: Toward a stewardship Theory of Management by Davis, Schoorman and Donaldson; page 37)
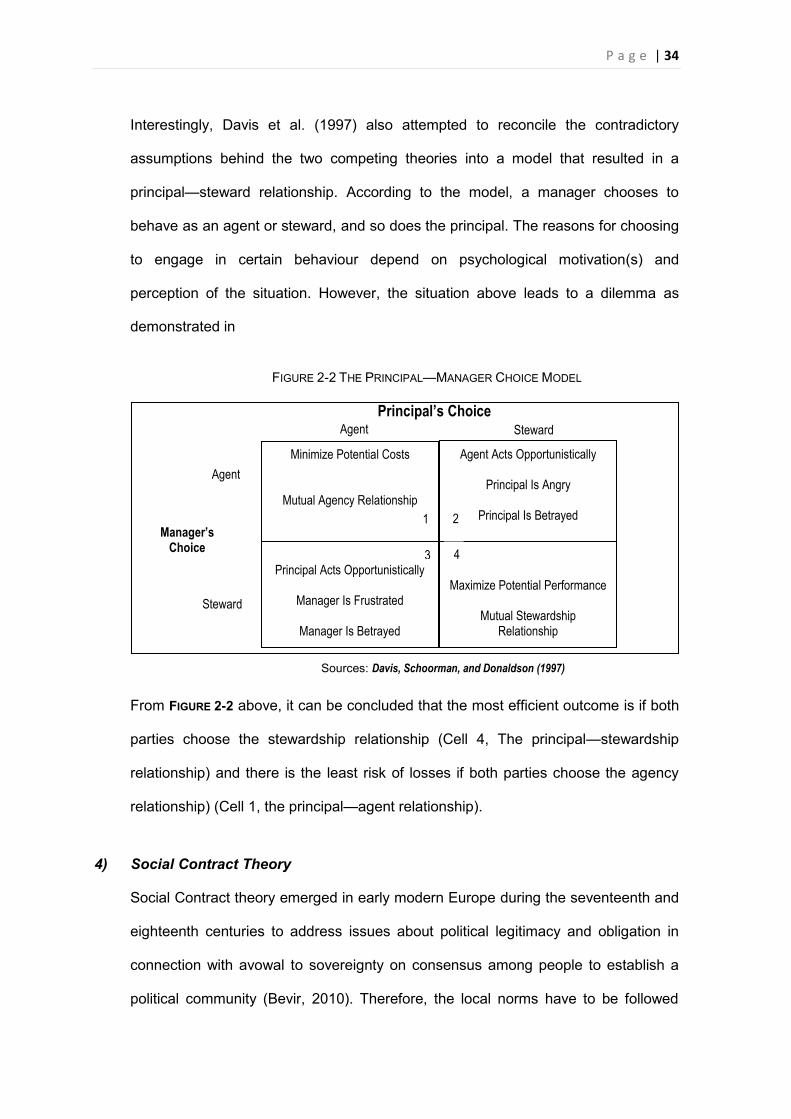
P a g e | 34
Interestingly, Davis et al. (1997) also attempted to reconcile the contradictory
assumptions behind the two competing theories into a model that resulted in a
principal—steward relationship. According to the model, a manager chooses to
behave as an agent or steward, and so does the principal. The reasons for choosing
to engage in certain behaviour depend on psychological motivation(s) and
perception of the situation. However, the situation above leads to a dilemma as
demonstrated in
Principal’s Choice
Sources: Davis, Schoorman, and Donaldson (1997)
From FIGURE 2-2 above, it can be concluded that the most efficient outcome is if both
parties choose the stewardship relationship (Cell 4, The principal—stewardship
relationship) and there is the least risk of losses if both parties choose the agency
relationship) (Cell 1, the principal—agent relationship).
4) Social Contract Theory
Social Contract theory emerged in early modern Europe during the seventeenth and
eighteenth centuries to address issues about political legitimacy and obligation in
connection with avowal to sovereignty on consensus among people to establish a
political community (Bevir, 2010). Therefore, the local norms have to be followed
Agent Steward
Minimize Potential Costs
Mutual Agency Relationship
Agent Acts Opportunistically
Principal Is Angry
Principal Is Betrayed
Maximize Potential Performance
Mutual Stewardship Relationship
Principal Acts Opportunistically
Manager Is Frustrated
Manager Is Betrayed
Agent
Steward
Manager’s Choice
1 2
3 4
FIGURE 2-2 THE PRINCIPAL—MANAGER CHOICE MODEL
P a g e | 35
when a company needs legitimacy and sets an ethical standard. This theory is the
opposite of the theory that states that the King has a grounded political authority
mandate from God. Some of the major political theorists who espoused Social
Contract theory are Hugo Grotius, Thomas Hobbes, Samuel von Pufendorf, John
Locke, Jean-Jacques Rousseau, and Immanuel Kant (ibid. p. 1287). Social Contract
theory inspired several theorists, called neo-Hobbesian, to formulate models to
explain the internal structure of a firm such as those based on agency theory
(Alchian and Demsetz, 1972, Eisenhardt, 1989, Jensen and Meckling, 1976),
transaction cost theory (Williamson, 1975, Williamson, 1985), game theoretic
reputation model, and narrow economic (functionalist) approaches to organizational
culture (Camerer and Vepsalainen, 1988, Kreps, 1990), because models rely on
opportunism as a basic concept (Mahoney et al., 1994).
In the context of corporate governance, social contract theory reveals the limitation
of agency theory in explaining the ethics involved in the human behaviour in the
principal-manager relationship. Thus, Mahoney et al. (1994) argued that because
the description of agent behaviour and its assumption in agency theory is too limited,
agency theory is less useful as a guide to productive firm alliances. Mccarthy and
Puffer (2008) extended the work of Mahoney et al. (1994) when they investigated
the ethicality interpretation of corporate governance decisions in Russia, using
Integrative Social Contract Theory. They concluded that in Russia, the norms under
the agency theory are not appropriate since the economic system in Russia tends to
be a central planned economy rather than a market-oriented economy. More
importantly, the theory is more able to explain the conflict that often occurs between
the traditional Russian values and market-oriented values.
P a g e | 36
5) Institutional Theory
Two centuries later, after the social contract theory had sparked a comprehensive
review by researchers, the Institutional theory emerged as one of the dominant
theoretical views at the end of the nineteenth century. This theory established
authoritative guidelines for social behaviour in terms of certain processes and
mechanisms that involve structures, schemas, rules and routines (Scott, 2004). The
core assumptions of Institutional theory are: “(1) institutions are governance
structures, embodying rules for social conduct, (2) groups and organizations
conforming to these rules are accorded legitimacy, a condition contributing to their
survival, (3) institutions are characterized by inertia, a tendency to resist change,
and (4) history matters, in the sense that past institutional structures constrain and
channel new arrangements (ibid p. 408).” However, a strong criticism of Institutional
theory is that it is too focused on control and constraint, but neglects innovation and
choice.
6) Managerial and Class Hegemony Theory
Managerial hegemony and class hegemony basically originated from the Hegemony
theory. This theory was developed by Antonio Gramsci (1891-1937), a Marxist
philosopher, who argued that a single group or class can rule a society that
comprises various groups and subcultures having different values and goals (Bretz,
2010). This is made possible because the subordinate groups believe that the
dominant group can serve their interests and goals (Ibid p. 350). Gramsci
conceptualised Hegemony theory to explain why the working class movement in
Western Europe after World War I collapsed (Vallas, 2003).
Kosnik (1987) summarised the notions posited by Galbraith (1967), Mace (1971),
Herman (1981), Vance (1964), and Wolfson (1984) in relation to Managerial
Hegemony theory. Kosnik depicts the corporate board as a legal fiction, in the sense
P a g e | 37
that the board is only an appendage of a firm that is a necessary formality to comply
with a regulation, whereas in fact, the management is more dominant than the
corporate board. Thus, the corporate board may not be able to address effectively
the conflicts of interests between shareholders and management. The cynicism
associated with the role of the corporate board according to this theory is evident in
comments by some researchers such as Pfeffer (1972) who argued that the role of
the corporate board in corporate governance is co-opted to being “another
management [-dominated] tool”, and Herman (1981) who argued with even greater
cynicism that the corporate board is only the rubber stamp for management’s
decisions and management's proposals.
Vallas (2003) questioned the hegemony theory, when the result of an ethnographic
analysis of four manufacturing plants showed little evidence of an increase in worker
integration within a new management regime. He concluded the finding after
analysing the data regarding the connection among the various levels of
management, the significance of class boundaries, and instances of worker defiance
in both traditional and team-based production areas.
7) Stakeholder Theory
In 1963, the Stanford Research Institute (SRI) used the word “stakeholder” for the
first time in an internal memorandum of management literature as part of a corporate
planning process to generalize the thoughts of stockholders. The SRI defined the
stockholders as “those groups without whose support the organization would cease
to exist” (Freeman, 2010). Freeman (1984), a scholar and consultant at The
Wharton School, refined the stakeholder concept, making it more comprehensive in
response to the prevailing trend which focused on understanding the theories of
business and management, which are generally formulated during times when
business conditions are less turbulent.
P a g e | 38
Freeman (1984) sketchily proposed that the Stakeholder theory is basically a theory
about business, how it works at best and how it could work. The theory states that
business basically is a set of relationships among parties having a stake in the
business activity, and they can affect or be affected by their actions in the business.
The parties include (at least) customers, employees, suppliers, the community and
financiers.
In the broader sense, there are three specific problems that are addressed by the
stakeholder theory: value creation and trade, ethics of capitalism, and managerial
mindset. It is interesting that stakeholder theory proposes that the business and
ethics cannot be separated; they are similar to a coin having two sides. In today's
more complex and turbulent business world, changes in business relationships
occur frequently. These changes definitely influence the value creation and business
trade across national boundaries and industries. In addition, because of the
successful penetration of capitalism in almost all business activities, ethics issues
emerge that are related to capitalism. Finally, the stakeholder theory encourages
managers to acquire a better understanding of the business. If managers have an
understanding of the stake or interest of groups or individuals in the business, and
how those groups or people can affect or be affected by decisions and actions, the
managers will have a better chance of dealing effectively with the three
aforementioned problems.
8) Resource Dependency Theory
Compared to the Stakeholder theory, Resource Dependency theory has a different
focus. The type of inter-organization relations that have caused recent ‘market
failure’, mergers of business entities, and interlocking boards in some corporations,
have given rise to the Resource Dependency theory, which offers an alternative
explanation of the economic theory behind those events (Pfeffer and Salancik,
P a g e | 39
2003). This theory has three core elements to explain why organizations act
internally or externally: “(1) social context matters; (2) organization’s strategies to
enhance their autonomy and pursue interest; and (3) power (not just rationality or
efficiency)” (Davis and Cobb, 2010).
2.4.4. Corporate Board
1) A Glance at the History and Origin of Corporate Boards
The long history of corporations in England has pioneered the worldwide concept of
corporate board. The Charter of the Bank of England 1694 was the first charter to
use the term “director” and it is considered as a pioneer in the use of this
terminology (Gevurtz, 2004). Then, the term “corporate director” as a governing
body of a corporation became popular in England. However, the notion of a
governing body to govern a corporation can be found long before establishment of
the Bank of England. For example, in 1606, the Virginia Company and Plymouth
Company that were established to trade and colonize in North America, have
knights, merchants, gentlemen, and merchant adventurers named in their charters.
The governing body named in a charter is also found in other corporations such as
the East India Company, the Russian Company, the Eastland Company, the Levant
Company, the Hudson’s Bay Company, and the South Sea Company (ibid p.22).
Gevurtz (2004) stated that a representative board working with a chief executive
officer is a reflection of the political practice and ideas that were widespread in the
Western Europe in the Middle Ages. This is because at that time the political
ideology and practice in Europe tended to use collective governance by a body of
representatives. Along with the term “director”, the use of the term “committee” for
the first time was attributed to the two earliest English trading companies - The
P a g e | 40
Company of the Merchants of the Staple and the Company of Merchant Adventurers
(ibid p.27).
2) Corporate Board as the Prime Organ of a Corporation
Corporate boards are the important governing bodies of corporations who decide the
corporations’ activities. They are the link between fund providers and those who
manage the funds, the bridge between shareholders to whom the board is
accountable and managers who are accountable to the board, and the connection
between companies and their stakeholders. For these reasons, the corporate boards
are the centre of the corporate governance system (Cadbury, 2002).
The board-centre model derives from three underlying concepts: shareholders elect
the directors, a group composed of peers acting together makes a collective
decision, and a group has the ultimate responsibility for selecting and supervising
the corporate senior executives (Gevurtz, 2004). The various rationales behind a
concept of the board-centre structure in corporate governance can be summarised
as follows: (1) the need for central management; (2) group decision making; (3)
representation of corporate constituents and mediating claims to distributions; and
(4) monitoring of management (ibid p.6-10). However, those rationales seem to
place more emphasis on the internal corporate side, whereas the corporate board
should have both internal and external responsibilities. Stiles and Taylor (2001)
stated that the board should be responsible internally for the guidance and
leadership of the corporation, and externally for investors and the wider
stakeholders.
3) Board Model
The board structures usually follow board models that are enshrined in a company
law and/or capital market regulation. Companies that operate in countries using a
P a g e | 41
common law code, such as England and its former colony, USA, Singapore and
some other countries, generally follow the single-tiered model which evolves from
the UK Corporate Law. This board model is characterized by the integration of the
management function and supervisory function within a single board, in the sense
that executive and non-executive members are on the same board. The executives
who run the day-to-day business are known as the Chief Executive Officer (CEO),
Chief Financial Officer (CFO) and Chief Operation Officer (COO), and in some large
corporations, the board very often needs a Chief Information Officer (CIO) as well.
The non-executives have an oversight function on the executive board. A chairman
leads the board and is appointed by shareholders at a general meeting, based on a
recommendation by the nominating committee or by the board as a whole (Jonge,
2013).
The single-tiered model has only a one-tier board comprising executive and non-
executive members. Hence, the number of board members is relatively large. It is
often the case that the CEO is also the chairman of the board; this situation is called
CEO duality. In the US, until the 1990s, the statistic figure of the CEO duality
occurred in US companies shows on average 70%, but in today’s situation the
statistic figure or the trend of it has been decreasing significantly. This is because of
pressure from the outside to abolish CEO duality (Yang and Zhao, 2012).
According to Heidrick and Struggles who published the 2007 report on corporate
governance in Europe that is cited by Millet-Reyes and Zhao (2010), the board
model is classified into three types. The first type is the two-tiered structure; the
German two-tier system and the French board system strongly influence 22% of
companies in Europe. The second type is a unitary board structure adopted by
England and Spain which is also followed by several other countries. Lastly, the third
type is a modified two-tiered board which allows some executive directors to sit on
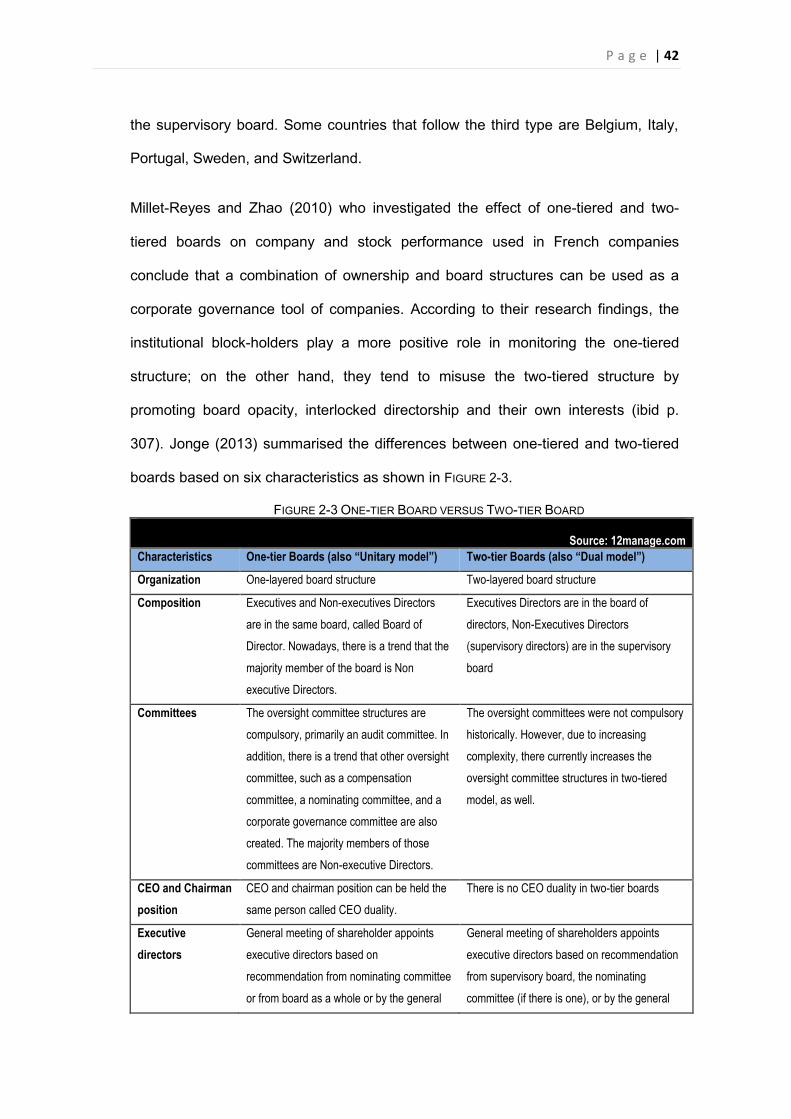
P a g e | 42
the supervisory board. Some countries that follow the third type are Belgium, Italy,
Portugal, Sweden, and Switzerland.
Millet-Reyes and Zhao (2010) who investigated the effect of one-tiered and two-
tiered boards on company and stock performance used in French companies
conclude that a combination of ownership and board structures can be used as a
corporate governance tool of companies. According to their research findings, the
institutional block-holders play a more positive role in monitoring the one-tiered
structure; on the other hand, they tend to misuse the two-tiered structure by
promoting board opacity, interlocked directorship and their own interests (ibid p.
307). Jonge (2013) summarised the differences between one-tiered and two-tiered
boards based on six characteristics as shown in FIGURE 2-3.
FIGURE 2-3 ONE-TIER BOARD VERSUS TWO-TIER BOARD
Source: 12manage.com Characteristics One-tier Boards (also “Unitary model”) Two-tier Boards (also “Dual model”)
Organization One-layered board structure Two-layered board structure
Composition Executives and Non-executives Directors are in the same board, called Board of Director. Nowadays, there is a trend that the majority member of the board is Non executive Directors.
Executives Directors are in the board of directors, Non-Executives Directors (supervisory directors) are in the supervisory board
Committees The oversight committee structures are compulsory, primarily an audit committee. In addition, there is a trend that other oversight committee, such as a compensation committee, a nominating committee, and a corporate governance committee are also created. The majority members of those committees are Non-executive Directors.
The oversight committees were not compulsory historically. However, due to increasing complexity, there currently increases the oversight committee structures in two-tiered model, as well.
CEO and Chairman position
CEO and chairman position can be held the same person called CEO duality.
There is no CEO duality in two-tier boards
Executive directors
General meeting of shareholder appoints executive directors based on recommendation from nominating committee or from board as a whole or by the general
General meeting of shareholders appoints executive directors based on recommendation from supervisory board, the nominating committee (if there is one), or by the general
P a g e | 43
meeting. Some jurisdictions also allowed the board to appoint executive directors if there is a vacancy arising on death or resignation, or adding to the existing directors. ,
meeting.
Non-executive (supervisory) directors
General meeting of shareholder appoints executive directors based on recommendation from nominating committee or from board as a whole or by the general meeting. Some jurisdictions also allowed the board to appoint executive directors if there is a vacancy arising on death or resignation, or adding to the existing directors.
General meeting of shareholders appoints executive directors based on recommendation from supervisory board, the nominating committee (if there is one), or by the general meeting. Sometimes, some of the supervisory directors are appointed by third parties, such as the government, a bank or the employees
Even though the one-tiered and two-tiered board structures seem to be predominant
across the globe, companies may implement these in various ways due to different
jurisdictions, local customs and policy implementations. Clarke (2007) gave the
following examples of board models that have different characteristics: US Boards,
UK Boards, European Boards (Germanic), European Boards (Latin), Asian Boards,
and Japanese Boards.
4) Board Design
Corporate boards face the challenge of improving corporate governance and best
practice in today’s business environment that is constantly changing. The increase in
accountability, transparency and responsibility imposed from the outside is the
reason why shareholders and corporate boards have to take initiatives to reform the
boards. The establishment of a board design is a guide to reforming the board and
will help the decision makers of a corporation to establish board structures that are
appropriate for the business environment and industry characteristics.
Board design is important in order to determine the function and role of the board in
the future. Carter and Lorsch (2004) propose three elements for the board design,
namely: (1) the board structure, (2) the board composition, (3) and the board
P a g e | 44
processes. All the elements combined with the board’s culture will shape the
directors’ behaviour. In order to promote the right behaviours, the boards should
encourage the members to behave according to certain expectations and
discourage unacceptable behaviour.
(1) Board structures: size, leadership, and the committees
The board size plays a significant role in achieving efficiency and effectiveness
of the board process. Carter and Lorsch (2004) identified two factors that
influence board size. The first factor is the skill set that the boards need and
second factor is the efficient use of time. The more skill is needed, the bigger the
board size will be. For example, in the United States, the Sarbanes-Oxley Act
requires at least one member of the audit committee to have accounting and
financial expertise. Moreover, the larger boards need more time to coordinate
meetings and arrive at decisions. Carter and Lorsch (2004) argued that the
boards should strive to be as small as possible. Recently, many studies have
proposed average board numbers for various regions. Stuart (2006) concluded
that on average, a US company has 12 directors, down from around 16 in 1980s;
in Europe, it is around 13 directors, although in Germany, it is around 20
directors. In addition, Partner (2001) conducted a survey regarding the board
size and revealed that European and North American directors believe that the
maximum number of board members should be about fourteen (ibid p.90).
The important aspect of a leader on a corporate board is whether his/her
capacity to lead the board can create profit for companies. In companies that
have a one-tiered board, sometimes the CEOs are also appointed as chairmen
of their boards (CEO Duality). As a result, the chairman has greater authority
and power compared to other directors. Previous research that investigated CEO
duality related to company performance has produced divergent conclusions. On
P a g e | 45
the other hand, companies that follow two-tiered board system take the view that
the CEO and the chairman of the board should be separated. “Most American
can’t imagine how a company can operate with shared leadership, while the
British, Australians, and many European have difficulty understanding how a
CEO can also be chairman” (Carter and Lorsch, 2004). To increase the
transparency and decision quality, shareholders might appoint independent
directors to the corporate board. Currently, almost all capital market regulators
have established a regulation stipulating that some of the board members should
be independent directors.
(2) Board Compositions: the mix of experience, skills and other attributes
The mix of experiences and skills of board members creates a balance in the
composition of the board. The experiences and skills which are considered when
forming the board include strategic expertise, accounting and finance, legal, risk
management, managing people, and management of change. The board
composition should also consider the proportion of outside/independent directors
and inside directors. Shareholders who espouse the agency theory tend to argue
that a greater proportion of outside/independent directors is needed to increase
shareholder value. This view may correspond to those of researchers such as
Lorsch and MacIver (1989), Zahra and Pearce (1989), and Mizruchi (1983) who
investigated issues associated with boards of directors and financial
performance. On the other hand, shareholders who adhere to the stewardship
theory may argue that high financial performance is mainly due to inside
directors. This view is supported by the research findings of Kesner (1987) who
investigated Fortune 500 companies, and Vance (1978) in his early work.
However, several researchers such as Daily and Dalton (1992), and Chaganti et
al. (1985a) found that there is no relationship between board composition and
P a g e | 46
financial performance. Thus, Dalton et al. (1998) conclude that the research
findings on board composition and financial performance shows little
consistency.
(3) Board processes: effort norm, cognitive conflict, and the board’s use of its
knowledge and skills
There are fewer studies on board processes than there are on board structure
and board performance. This is because it is extremely difficult to have access to
the interaction of corporate board members in a boardroom (see Leblanc and
Schwartz (2007), Zald (1969), and Zahra and Pearce (1989)). Effort norms,
cognitive conflict, and knowledge and skills are the three board processes
investigated by Forbes and Milliken (1999) in order to determine their influence
on a board’s cohesiveness and the performance of its tasks.
This research finds that effort norms will ensure preparation, increase
participation and create better analysis. Then cognitive conflict will leverage
different perspectives among the board members. Finally, knowledge and skills
in functional and firm-specific areas will be needed in order to access external
networks to obtain information and assist with problem solving. The board
members use their collective knowledge and skills to undertake their tasks. Effort
norms refer to the effort of each individual to adhere to the group’s shared beliefs
when completing a task. Cognitive conflict refers to a difference in task-
orientation among group members when they judge events, whereas the board’s
use of its knowledge and skill refers to the board members’ ability to use their
knowledge and skills when carrying out their tasks (Wageman, 1995).
McNulty et al. (2012) who researched risk management, similarly found that
effort norms, cognitive conflict, and cohesiveness affect financial risk. They
P a g e | 47
suggested that the non-executive directors who have high effort norms, for
example by scrutinizing and researching the relevant information or issues and
involvement in discussions critically prior to the board meeting, will contribute to
lowering financial risk. On the other hand, the board members who do not have
high effort norms frequently are less likely to engage in constructive and fruitful
discussions, and this will impact on the quality of decisions. Excessive financial
risk will be diminished if the degree of cognitive conflict is high, such as when the
board frequently challenges and presents different perspectives on issues under
discussion. However, the cohesiveness of the board will reduce the cognitive
conflict.
5) Board Duties
Most boards of directors are familiar with the legal and fiduciary concept of duty of
care and duty of loyalty. The concept of duty of care obliges boards of directors to
carry out their duties in good faith, with care, and in a manner that is in the best
interests of a company. The concept of duty of loyalty obliges boards of directors to
give their undivided loyalty to the company (Hyatt and Charney, 2005). Svehla
(2006) stated that a board of directors has four duties when undertaking their
performance and conformance roles, namely: (1) statutory duties; (2) common law
duties; (3) contractual duties; and (4) equitable duties.
The statutory duties are imposed upon the board of directors by the provisions of a
corporation act. These duties include acting in good faith in the best interests of the
company and for appropriate purposes, not engaging in self-interested behaviour
such as using insider information for their own or others’ advantage that is
detrimental to the company, and exercising their powers and discharging their duties
with a level of care and diligence that a reasonable person would take if they were in
P a g e | 48
a similar position in a company given the company’s circumstances and the same
responsibilities.
The common law states that corporate directors have a fiduciary duty to
owners/shareholders. As fiduciaries, the corporate directors act in the interests of
the owners/shareholders (Boatright, 1994). Hence, corporate directors are required
to exercise care and skill when performing their roles.
The contractual duties oblige the corporate directors to follow the terms stated in
their contracts. To discharge these duties, according to Bainbridge (2002), the board
of directors uses a corporation as a vehicle to deliver various factors of production.
Therefore, not only are the board directors acting as agent of shareholders, but they
also serve as the nexus of various contracts.
Corporate directors also have equitable duties that usually align with the common
law duties. Even though corporate directors act in the best interests of shareholders,
they should consider other stakeholders when they make decisions. Corporate
directors will face a complicated situation when equitable duties involve business
judgement. This is because business judgement sometimes emphasizes return on
investment (ROI) that involves commercial risk acceptance and entrepreneurial flair
(Svehla, 2006).
6) Board Activities
Hilmer and Tricker (1990) are the pioneers who formulated a framework for
analysing the activities and functions of a board of directors (Clarke, 2007). The
framework depicts the multi-dimensional roles and responsibilities of the board of
directors who should maintain a balance between their conformance role and
performance role, monitoring the present and preparing for the future, outward

P a g e | 49
looking and inward looking, providing accountability and endorsing a strategy
formulation. The framework is depicted in FIGURE 2-4.
Source: Hilmer, F. and Tricker, R.I. (1991), An Effective Board, Company Director’s Manual, Sydney: Athol Yeomans, Pearson/Prentice Hall.
The inward looking perspectives emphasizes the corporate board’s monitoring,
supervising and policy making in the context of both past and present, whereas the
outward looking perspective inspires the corporate board to more heavily focus on
providing accountability and formulating business strategy. Clarke (2007) who refers
to Zahra and Pearce (1989), Johnson et al. (1996) and Daily et al. (2003a)
concluded that the key roles of corporate boards are: (1) Control: Monitoring the
company management and ensuring accountability; (2) Strategy: Approving and
monitoring the company’s strategic direction; (3) Counsel: Providing advice and
counsel to the executives of company on critical matters; (4) Institutional: Building
institutional relationships with stakeholders, investors and communities.
7) Board Accountability
“Accountability” is a word that is not easily understood by ordinary people. The
Cambridge dictionary (2011) explains accountability as follows “someone who is
accountable is completely responsible for what they do and must be able to give a
satisfactory reason for it”. In order to clarify the lexical meaning of accountability,
Giddens (1984) explains it: “[T]o be accountable for one’s activities is to explicate
Conformance Performance
Providing accountability
Monitoring & Supervising
Strategy formulation Outward Looking
Inward Looking Policy making
Past and present focus Future focus
FIGURE 2-4 THE FRAMEWORK ANALYSING BOARD ACTIVITIES
P a g e | 50
the reasons for them and to supply the normative grounds whereby they may be
justified.” However, it is not easy to understand the contextual meaning of board
accountability. The popular idea of board accountability in the corporate world,
again, is very often initially inspired by the legal duty and fiduciary duty of directors
which oblige directors to act in good faith, with care and in the best interests of the
company. A company is only an artificial entity which cannot do anything or take a
legal action without a real person representing it. Directors are appointed to fulfil this
role; therefore, the essence of accountability of the board of directors based on the
fiduciary and legal duty initially is for the best interests of the company. Huse (2005)
perceived that the notion of accountability proposed by Roberts et al. (2005) was
intended to bridge the gap between what is expected of the board and its actual
performance.
In the context of the principal and agent relationship, directors as agent have to be
accountable to shareholders as principal and devote all their efforts to maximizing
principal value popularly known as shareholder value. Cadbury (1992) stated that
strengthening the board’s accountability to shareholders is essential when a
corporation needs to improve its corporate governance practice. Corporate law14 has
provided a mechanism for shareholders to obtain all information about the company
from the board of directors and board of commissioners as a part of their
accountability. At the end of the accounting period, an external auditor who is
appointed by shareholders will audit a company’s financial statement and annual
account provided by the board of directors as part of their accountability. The
gathered information and the auditor’s report are used by shareholders at the
general shareholder meeting to ask about the accountability of the board of directors
and board of commissioners regarding their fiduciary duties. If shareholders agree to 14 Undang-Undang Nomor 40 Tahun 2007 Tentang Perseroan Terbatas [Law No.40 of 2007 on Limited Liability Companies) (Indonesia) art 75
P a g e | 51
all the accountability undertaken by the board of directors and board of
commissioners, then shareholders will give a release and discharge (acquit et de
charge) to them for their management and supervision during the past financial year,
which is stated in the financial statement audited as long as there has been no
criminal action, and is reflected in the Annual Report of the company.
The board accountability issue has been extended not only to shareholders, but also
to stakeholders. Blair and Stout (2001) proposed two antecedent questions in order
to understand the director accountability: “To whom should directors be
accountable? And for what?” They attacked the argument of shareholder primacy
which emphasises that directors are obliged to be accountable only to shareholders
because the shareholder is a residual claimant. In fact, the current development in
economics science suggests that there is a wide variety of stakeholders bearing
significant residual risk and at the same time having a right to residual claims on
company earnings (ibid p.404). These stakeholders include employees, customers,
creditors, investors, government, and other parties which have a stake or interest in
the company. In short, Blair and Stout (2001) considered directors as “mediating
hierarchs” rather than as “agents”.
2.5. PARENT AND SUBSIDIARY RELATIONSHIP
2.5.1. The Establishment of Parent and Subsidiary Relationship
The concept of separation of ownership and control for a modern corporation cannot
be avoided when the corporation grows and needs more capital to expand the
business (Berle and Means, 1932). A growing company forms a subsidiary when a
number of situations exist. These include: local changes and opportunities in the
market that need to be anticipated and responded to quickly; some authority needs
to be delegated to lower management; and succession plans for managers and
P a g e | 52
directors need to be put in place for the next generation; (Strikwerda, 2003). Huston
and Edward (2013) identify four common reasons why a corporation forms a
subsidiary company: a corporation develops a new line of business which is
unrelated to the current business; a corporation develops a new business that
carries risk which is unacceptable to the parent company; the shareholders have a
specific reason; and lastly, the parent company wants to protect its assets. Even
though the subsidiary is part of the parent company, it is a legally independent entity
that is differentiated from the parent company. In practice, parent and subsidiary
companies still follow the Berle and Means (1932)’s concept in which they separate
the ownership by issuing stocks and maintain control by appointing the supervisory
board and management board of the subsidiary. A subsidiary can be established as
a result of a merger or acquisition, buying shares of other companies or as a spin-off
of a branch or division of a company. When a subsidiary is created, then control
becomes an important element that determines how far a parent company can
influence a subsidiary company.
The International Financial Reporting Standard (IFRS)15 defines “parent company”
as an entity which controls one or more other entities. The control over another
entity is applied when a company has power over the entity including control over
the specified entity’s assets, having rights to have variable returns and the ability to
use its power to affect variable returns from the entity, and it also involves the type of
principal-agent relationship. This control arrangement will differ if the subsidiaries
are classed as investment entities, that is: (a) they obtain funds from one or more
investors for the purpose of providing investment management services; (b) their
business purpose is to invest funds solely for returns from capital appreciation,
15 IFRS 10 consolidated Financial Statement, http://www.ifrs.org/IFRSs/IFRS-technical-summaries/Documents/English%20Web%20Summaries%202013/IFRS%2010.pdf
P a g e | 53
investment income, or both; and (c) the performance of their investments are
measured and evaluated on a fair value basis16.
2.5.2. Typology of Group companies and Conflict of Interest
When a company shows a constantly increasing growth rate of its earnings and
assets resulting from the growth of several businesses, generally the board of
directors may propose to shareholders that subsidiary companies be established to
double the growth. Then, the company will evolve to become a conglomerate
company which has multi businesses which are not concentrated only on the main
core business (Maksimovic and Phillips, 2013). However, when a company has
multiple businesses, it runs the risk of having various interests associated with many
parties including its subsidiaries. Wymeersch (2003) stated that the issue of conflict
of interests in groups of companies has attracted much attention in Europe and
needs to be analysed. Prohibition, structures, and procedures are commonly used to
regulate the groups of companies in most European states. The conflict of interests
among members of a group of companies is very often complicated. Hence,
Wymeerschp (2003) suggested considering a typology of groups of companies prior
to analysing the conflict of interests within them. This typology is summarised below.
1) The 100% Subsidiary
Generally, if a parent company has 100% shares in its subsidiary companies, the
conflict of interests occurring between them is minimal. The parent company can
freely direct its subsidiaries. As a result, there is no restriction on the parent
company’s influence over the subsidiary’s decisions.
16 See above
P a g e | 54
2) The Subsidiary with Minority Shareholders
According to this typology, minority shareholders will introduce some conflict in a
group companies. The minority shareholder commonly has to accept the
decision of the director and the majority of shareholders. Any conflict issues
regarding minority shareholder protection are resolved according to an
agreement prior to joining the company. If no such prior protection of minority
shareholders is given by a contractual agreement, then the legal system
provides protection for minority shareholders by offering withdrawal rights from
company share ownership.
3) Publicly Listed Companies
Issues regarding investor protection wil add an exposure of conflict of interest
when the company policy will be monitored by regulator to safeguard the
reliability of the capital market and prevent the destabilization of the financial
system. Thus, the directors’ fiduciary duties are intensified proportionally to
maintain investor confidence where the company has been listed in securities
markets. The control influence which is exercised by controlling shareholders
may change frequently, because directors sometimes try to benefit themselves
by obtaining a management fee, excessive remuneration, or benefits in kind from
the company.
4) Holding Companies
A holding company is a company whose main purpose is to control another
company or companies by owning shares in it or in them (McIntosh, 2013).
Tuving et al. (2003) divided holding companies into two categories, namely
investment holding companies and operating holding companies. The main
difference between them is that an investment holding company usually holds a
minority stake, is committed to owning the share for the long term, and is
P a g e | 55
relatively stable. On the other hand, the operating holding company invests in a
mix of majority, minority, and sometimes 100% wholly owned companies, is not
committed to owning the shares for a long term, and its portfolios are subject to
modification. The operating holding companies very often put directors in the
subsidiary company to represent the parent company and act as executive
directors. The possibility of conflict of interests in holding companies is greater
when there are so many intercompany transactions, cross subsidies, even
financial transactions between the parent company and its subsidiary and/or
among the member of the holding companies. “Synergy” and “integrated basis”
are the keys to leveraging the company performance. Transactions without
noticeable justification such as sweetheart deals, management fee, even
excessive rents could frequently occur and the minority shareholders of the
parent company frequently have no clear picture of the financial situation of the
group. In addition, the other minority shareholders in subsidiary companies may
be afraid that the parent company will engage in activities associated with
shifting profits, salary, transfer pricing, subsidized personal loans, or non-arm-
length asset transactions to other group members, known as “tunnelling” (Porta
et al., 2002).
5) Parent and Subsidiary Engaged in the Same Line of Business
Having a subsidiary that is engaged in the same line of business could create
competition with parent company, especially if the parent company has only a
minority interest in the subsidiary company. Normally, when it comes to projects,
the parent company will give preference to its subsidiaries which are fully owned
or majority owned by the parent company. The potential for conflict of interests in
this typology may occur in the form of “corporate opportunities” such as research
P a g e | 56
initiative, know-how, research, and production facilities that are transferred to
other group members.
6) Companies with a State Interest
When setting goals, the aims of companies with a state-based interest frequently
differ from those of companies with no state interest. The profit motive will be
combined with other motives such as social motives or those in the interest of
the general public, and/or political motives. In addition, the state’s interest
sometimes is structurally opposed to the company’s interest. For example, the
company’s interest is profit maximization; on the other hand, the state’s actions
may reduce company profits as a result of taxes, price regulation, safeguards
introduced by public policy makers and employment policy makers. Hopt and
Wymeersch (2003) stated: “when the state, directly or indirectly, owns a
significant part of the shares, and even more when it owns a majority, the sets of
conflicting issues become even more acute”. Furthermore, in order to limit a
conflict of interests, in some cases the state declares that it will not intervene in
the company’s management.
2.5.3. Board Ethics and Conflict of Interest in Parent and Subsidiary Relationship
The agency relationship arises when the parent company forms a subsidiary. As a
consequence, the principal-agent risk may occur in that relationship. In the context
of agency theory, the parent company that invests in the subsidiary’s stocks is called
the principal, whereas the subsidiary is the agent. The agency theory argues that the
agent will not perform in the best interests of the principal unless the letter applies an
appropriate control structure (Jensen and Meckling, 1976). However, the appropriate
control structure will incur an agency cost which is the sum of the bonding
expenditure by both the principal and agent, and the residual loss (Ibid., p. 5-6)
P a g e | 57
A conflict of interests may arise when a director encounters a situation in which
his/her official actions regarding a primary interest will be unduly influenced by a
secondary interest or private interest (MacKenzie and Cronstein, 2006). To prevent
such conflict of interests, control devices are established such as a code of conduct,
standard operation procedures, and an ethics committee. However, those control
devices will never be perfectly effective since there is an inadequate understanding
of the whole picture of the conflict of interests (Demski, 2003).
The conflict of interests and issue of board of director duality in corporations have
attracted much interest from researchers. Some researchers investigated the CEO
duality (see Dalton and Dalton (2011), Dey et al. (2011), Bliss (2011), Horner (2010),
Ramdani and Witteloostuijn (2010)). Others have focused on multiple directorships
(see Ahn et al. (2010), Jiraporn et al. (2008), Kiel and Nicholson (2006), Wells
(2000)), and some are slightly more specific, focusing on interlocking directorships
(see Gabrielsen et al. (2011), Shropshire (2010), Hallock (1997), Mizruchi (1996)).
Even though the above research does not specifically focus on the conflict of
interests, their discussions imply that all those positions are not immune to such
conflict.
The conflict of interests in relation to a director who serves on the boards of
companies that involve the subsidiaries was investigated by Major et al. (1986).
Major et al. (1986) argued that under the English Law, there are three director’s
duties that may give rise to conflicts, namely “the duty to act bona fide in the best
interests of company; the duty ‘to have regard, among other things’ to the interest of
the company in general as well as to its members; and the duty to carry on the
company’s business with intent to defraud creditors or for any fraudulent purpose,
and not to continue its business when they ‘knew or ought to have concluded that
P a g e | 58
there was no reasonable prospect that the company would avoid going into insolvent
liquidation’ (the reasonable prospect rule)”.
It is common for parent companies as shareholders to appoint their management to
their board of directors and/or the supervisory board in their subsidiary. This may be
in order to simplify the coordination and integration of the subsidiary’s resources to
support the parent company’s mission and vision. Biao et al. (2012) identified two
basic functions of the parent company in relation to their subsidiaries, namely the
creating value function and the prevention of loss function. In order to maintain those
two functions, on the one hand, the parent company must anticipate the possible
loss that is caused by the self-interested behavior of the subsidiary managers under
the principal-agent risk. On the other hand, the parent company should allow the
subsidiary manager to exercise flexible creativity in order to create value (Ibid., p.
198)
Biao et al. (2012) argued that there must be a management control system, called
an interactive control mechanism, to support the two basic functions of the parent
company. The placement of a parent’s director to represent that parent on the
subsidiary may be the one of examples to facilitate the interactive control
mechanism. However, when a parent company’s director is transferred to a
subsidiary company, this creates the director duality situation. Since the subsidiary is
an independent legal entity, the director duality in the board structure of the parent
and subsidiary may increase the conflict of interests when the directors have to
discharge the three directors’ duties as explained by Major et al. (1986).
P a g e | 59
2.6. AGENCY COST
The principal-agent relationship occurs when under a contract, one or more persons as a
principal/s engages another person as agent to provide some services on behalf of the
principals (Jensen and Meckling, 1976). This relationship enables the principal to delegate
some decision-making authority to the agent. This can be found in the relationship
between shareholders and managers, voters and politicians, and members of the public
and their government officers. Based on Agency Theory, the principal agent relationships
will lead to the agency problem which incurs an agency cost.
In `its broader meaning, the cost arising from the agency problem is called an agency
cost. Agency cost may arise from the conflict of interests between principal and agents,
moral hazard of the agents, shirking, and perquisite consumption by agents (“perks”).
Agency theory assumes that the interests of principal and agent may not be aligned, and
more importantly, they also often have divergent goals in the sense the principals may
demand a high principal’s return but agents often tend to maximize their own benefits.
2.6.1. Definition
In academic terms, Jensen and Meckling (1976) define agency cost as the sum of: (1) the
monitoring expenditures by the principal, (2) the bonding expenditures by the agent, and
(3) the residual loss. The monitoring expenditures are those paid by the principal in order
to monitor and control an agent’s behavior that may include an audit and activities to
ensure budget restrictions, the compensation policies, the operating rules, etc. Whereas,
the bonding expenditure is what is paid by an agent when he/she acts or compensates in
the best interests of the principal which have been established by the particular system or
structure of the firm. The bonding cost is not always financial, but may include the
provision of up-dated and accurate information to relevant stakeholders (Baker et al.,
2010). Finally, the residual loss is the net loss (in excess of any accrued benefits)
P a g e | 60
resulting from the impact of agency losses that are cause by the divergent interests of the
principal and the agent.
2.6.2. Measurements
Many researchers have been motivated to confirm the Jensen and Meckling (1976) theory
regarding agency cost. They have used diverse methods and approaches to measure it.
However, the precise measurement of agency cost is a difficult and challenging task,
requiring cost information transparency. Generally, researchers use a performance
approach to measure it, either using a firm performance such as expense ratio or
efficiency, or a market performance such as Tobin’s Q. Some research has applied these
agency cost measurements to certain issues such as payout policies, assets
diversifications, capital structure, and cash holding, to name a few (Gesser et al., 2010).
However, using profit as a measurement of performance is unreliable since profit can be
manipulated by the accounting process (Rashid, 2012). Other researchers have
measured agency cost by examining the ownership structure (Ang et al., 2000, Gesser et
al., 2010), the corporation structure (Smith and Jensen, 2000), and the CEO duality
(Rashid, 2012).
Ang et al. (2000) conducted a research on agency costs and ownership structure, and
provided two measurements called an absolute and relative of equity agency costs
measurements for firms having different management structures and ownerships. The
research uses two alternate measures of agency costs, namely the direct agency cost and
a proxy for revenue losses. The first measure is calculated by measuring the gap or
differences in dollar expenses between two firms having different ownership and
management structures where one of them is a no-agency-cost-based firm. For this
proposition, Ang et al. (2000) referred to Jensen and Meckling (1976) who argued that the
zero-agency-cost occurs if the manager is also the owner of a firm. The direct agency cost
captures excessive costs that include ‘perks’. The second measure is used to determine
P a g e | 61
inefficient asset utilization that can result from poor investment decisions and/or
management’s shirking. Technically, the direct agency cost measure uses a standardized
expense per annual sales, and the revenue loss measure uses efficiency ratios. Ang et al.
(2000) found evidence that supports several predictions of agency cost theory: 1) Agency
cost tends to be significantly higher if an outsider manages the firm; (2) Agency costs are
inversely related to the manager’s share of ownership; (3) Agency costs increase in
proportion to the number of non-manager shareholders; and (4) Agency costs are lower
when there is greater monitoring by banks.
Gesser et al. (2010) compared three measures related to the agency problem and
ownership dispersion. The first two measures use managerial fractional holdings in the
equity and Tobin’s Q which has been used by prior researchers, and the third measure
uses managerial equity wealth. Generally, the fractional holding in the equity is measured
by the number of stocks held by management per total stock outstanding; Tobin’s Q is
measured by the market value of equity plus the book value of debt divided by the book
value of equity and debt; and managerial equity wealth is measured by the dollar value of
shares held by management. Gesser et al. (2010) argued that the managerial equity
wealth measure performs better than the other two measures, the fractional holding in the
equity and Tobin’s Q. Rashid (2012) used two efficiency ratios, ‘expense ratio’ and
‘utilization ratio’, to measure agency cost. The expense ratio indicates how effectively the
management controls the operating costs of a firm, whereas the utilization ratio indicates
how effectively the management utilizes the firm’s assets. Rashid concludes that there is
no significant relationship between CEO duality and agency cost.
P a g e | 62
2.7. GAP IDENTIFIED IN ACADEMIC RESEARCH
As previously mentioned in Chapter 1, there are three types of director duality: CEO
duality, interlocking directorship, and multiple directorships. Most of the research studies
on those three types of director duality have focused on the one-tier board system which
has only one board called the board of directors, which cannot occur in the two-tier board
system which differentiates between the management board (Board of Directors) and the
oversight board (Board of Commissioners) (Bezemer et al., 2012).
The practice of the board member duality in the two-tier board system compared to the
academic research about director duality which is elaborated comprehensively in the
literature review presented in this chapter, has enabled this researcher to identifying the
gap. This is summarised as follows:
1) Board member duality is different from the other three types of duality, namely: CEO
duality (Bezemer et al., 2012), (Cashen, 2011), (Donaldson and Davis, 1991c),
(Baliga et al., 1996), interlocking directorship (Chhaochharia and Grinstein,
2007), (Hallock, 1997), (Hughes et al., 1977)), and multiple directorships (Kiel and
Nicholson, 2006), (Ferris et al., 2003), and (Scott, 1997), in terms of the board
system, the company status, and the number of companies that have directors who
are duality holders.
2) The structure of the board member duality defined in this research is found in the
structure of the director duality occurring in the parent and subsidiary company
which follows the two-tier board system.
3) The structure of the parent and company also differentiates this research from the
previous research on the director duality has loosely assumed that all companies
are basically the same, in terms of the entity which is assumed to be independent. In
fact, the parent company can force its subsidiary company to conform to the parent
P a g e | 63
company’s policy, and this will substantially influence the subsidiary company’s
policy.
4) Specifically, the board member duality identified in this research will focus only on
the duality occurring in the State-Owned Enterprises in Indonesia.
2.8. CONCLUSION
The review of literature pertaining to the director duality explored in this chapter covers a
broad spectrum of duality structures that exist in both one-tier and the two-tier board
systems. This chapter examined the different types of duality that have been investigated
in previous research and has presented the theoretical perspectives which have been the
basis of the corporate board systems. Taking a historical perspective, this chapter traced
the development of the notion of corporate governance from its origins to its contemporary
meaning. Several theories relevant to the structure and process of the corporate board
were presented. The structure of the parent and subsidiary company and its impact on
agency costs and performance was discussed. Lastly, the gap in the relevant extant
literature was identified. The majority of the previous research has produced inconsistent
findings regarding the relationship between director duality and agency costs and
performance, regardless of the types of director dualities. The research will contribute to
the current body of literature as it will consider board member duality and its impact on
agency cost.
P a g e | 64
CHAPTER 3: STATE-OWNED ENTERPRISES IN INDONESIA: THE CHRONICLE, STRATEGIC ROLES AND DIRECTION, AND CORPORATE
GOVERNANCE DEVELOPMENT “One cannot step twice in the same river.” –
Heraclitus (ca. 540 – ca. 480 BCE)(Lorton, 2012)
INTRODUCTION
This chapter which discusses the State-Owned Enterprises (SOEs), or BUMNs, in
Indonesia addresses three main topics in order to provide a better understanding of the
research context. The first topic, The Chronicle, will explore the BUMNs from the historical
perspective and give an overview of them before and after the Proclamation of
Independence of the Republic of Indonesia on August 17, 1945. The second topic
concerns the strategic roles and direction of BUMNs in the context of the current situation
and economic perspective since BUMNs are one of the pillars in Indonesia’s economy.
They are the main drivers of national development, the machine of economic growth, and
the supporters of small and medium enterprises (Sinaga, 2013). Finally, the third topic
covers the development and current progress of corporate governance of BUMNs in
Indonesia.
3.1. THE CHRONICLE
“History has to be rewritten in every generation, because although the past does not change, the present does; each generation asks new questions of the past, and finds new areas of sympathy as it re-lives different aspects of the experiences of its predecessors.”
Christopher Hill, an English Marxist historian (6 February 1912 – 23 February 2003) (Bowen, 1984)
This section examines five periods in the history of the State-Owned Enterprises in
Indonesia. The first period was the Dutch Colonialism period before the Dutch were
defeated by Japan in 1942. Dutch Colonialism influenced the cultures of the State-Owned
P a g e | 65
Enterprises, the board model used, and also the legal infrastructure of corporations in
Indonesia’s law system. The second period is known as the Japan era (1942-1945).
However, during the relatively short Japan era, Indonesia was stripped of enormous
amounts of company assets and resources (Anderson, 1988). The third era is popularly
called the Old Order era (1945—1965). During this time, the majority of State-Owned
Enterprises were born when Soekarno, the first president of the Republic of Indonesia,
ordered the nationalization of companies owned by the colonials, especially the Dutch
companies (Robison, 2009). The fourth period is called the New Order era during which
the second president of the Republic of Indonesia, Soeharto, led the country (Vatikiotis,
2004). During this period, there was a significant increase in the number of State-Owned
Enterprises. More importantly, Soeharto focused his attention on developing strategic
industries, having business as the main instrument of defense systems, aeroplanes, ships,
and trains. Lastly, the fifth period is the Reform Order which was marked by the fall of
Soeharto regime in 1998, to the present.
3.1.1. The Dutch Era (before 1942)
Long before 1945, the year in which the Republic of Indonesia proclaimed its
independence, the Dutch had colonized the Indonesian territory for almost 3.5 centuries,
although the length of the colonial period is still arguable. The number of years may be
misleading, because they were counted from the time that De Houtman’s ships landed in
the port of Banten in June 1596 headed by Cornelis De Houtman (see Ricklefs (2001)), up
until the proclamation of independence by Soekarno-Hatta on August 17th, 1945. In fact,
the Dutch controlled only some parts of Indonesia’s territory such as Java after the Java
War (1825—1830) during the 19th century, Aceh, after bitterly being contested from
1873—1904, and other kingdoms, such as South Bali and Bone (South Sulawesi) which
could not be defeated until 1906 (Dick, 2002). The words “3.5 centuries” may have been
P a g e | 66
intentionally used by Soekarno, the “Great Revolution Indonesia Leader” to strengthen the
Indonesian people’s patriotic spirit during the struggle for independence (Airlangga, 2015).
The colonialism era had two phases, namely the Vereenigde Oost-Indische Compagnie
(VOC) phase and the Colonial Government of the Dutch phase. These phases are
described briefly below.
1) Vereenigde Oost-Indische Compagnie (VOC)
The Vereenigde Oost-Indische Compagnie (VOC) was a company formed from the
merger of Dutch companies that had competed for the spice business in East India;
the merger had been proposed by the State-General of the Netherlands in March
1602 (Ricklefs, 2001). The merger was aimed to benefit the mutual interests of six
different regions in the Netherlands having competing interests that were
represented by the Chamber System of the Netherlands. The VOC comprised 17
directors who were approved by each chamber; they were called the Heeren XVII
(Seventeen Gentlemen). Since almost a half of them (8 directors) came from
Amsterdam, the headquarters of VOC was located there. More importantly, the
State-General of the Netherlands granted the VOC a charter that enabled it to have
quasi-sovereign powers to obtain personnel on an oath of allegiance, declare war,
build forts, and conclude treaties throughout Asia (ibid; p. 31).
Even though the VOC was a Dutch organization, in actual fact, many personnel
were not Dutch. They came from various places throughout Europe and many of
them were wanderers, adventurers, criminals, and the unfortunates who had sworn
an oath of allegiance. It was not surprising, therefore, that negative behaviors such
as inefficiency, dishonesty, alcoholism, and nepotism, were widespread in the VOC
(Ricklefs, 2001).
P a g e | 67
The VOC occupied Ambon, located in the eastern part of Indonesia, in 1605 and
built a headquarters there. However, in order to impose a monopoly over all spices,
the Dutch conquest of Ambon was still a far cry from their ultimate goals. The VOC
wanted to find a better place for ‘rendezvous’ and found Jayakerta or Batavia (now
Jakarta) on Java Island, establish permanent headquarters there (Ricklefs, 2001).
From the perspective of geographical areas that they wanted to control, basically the
VOC was a multinational company with several preliminary features of a global
company. Dick (2002) argued that at least two features of the VOC made it similar to
a global company. Firstly, the VOC was an organization with a high degree of
centralization. All policies and orders pertaining to all the VOC’s organizations
scattered across the Asian state were issued by the Governor-General’s office in the
Batavia headquarters. Secondly, the VOC basically was an armed organization,
because it had a militia and powerful warships that patrolled the Asian waters. The
maximization of profits was the sole goal of the VOC. However, to achieve this goal,
the VOC did not practise good corporate governance, in the sense that it did not
calculate profit and loss correctly and did not accurately use a book-keeping method
(Ricklefs, 2001).
After establishing headquarters in Jayakerta, the VOC focused more on exploiting
Java Island. Its presence outside Java until the mid-1830s was not significant. The
VOC had only 15 small offices - in Bengkulu, Palembang, Padang, Muntok, Riau,
Sambas, Pontianak, Banjarmasin, Makasar, Menado, Ternate, Ambon, Kupang,
Banda and Bima. Products that were exploited at that time and controlled seriously
by the VOC were the spices of Banda and the tin of Bangka (Dick, 2002). During
this colonial era, tin mining in Bangka was managed by “Banka Tin Winning Bedrijf”
(BTW), a colonial state enterprise, whereas the tin companies on Belitung Island
and Singkep Island were managed by a private Dutch company called
P a g e | 68
Gemeenschappelijke Mijnbouw Maatschappij Biliton (GMB), and NV Singkep Tin
Exploitatie Maatschappij (NV SITEM), respectively. These tin companies were
nationalized during the Old Order era and merged into PT Timah Tbk, an Indonesian
state-owned enterprise. The VOC also took control of the major ports in the Indies
such as Batavia, Banten, Surabaya, Makasar, Menado, and Malacca and also
smaller islands such as Ambon and Banda (Drakeley, 2005). These ports, except for
Malacca, are now under the management of Indonesia Port Corporations, the State-
Owned Enterprises of Indonesia.
More than 150 years after VOC’s arrival in the Indies, a powerful political and
economic position had been successfully established by this hybrid company-
colony. For example, the VOC could enforce several treaties, constraining local
rulers to supply rice, indigo and coffee in large quantities, and also to ensure that the
VOC had a monopoly on spices, textiles, and opium (ibid p.34). However, at the
same time, the VOC was almost bankrupt due to very poor corporate governance,
which incurred huge costs. These costs were always much greater than expected,
and corruption occurred because the VOC’s officials engaged in collusive behavior
at the company’s expense. There was a greater acceleration towards bankruptcy
when the greater portion of wealth did not flow to investors but into private hands.
Finally, the VOC was declared bankrupt in 1799 and when the Government of Dutch
took over the VOC’s affairs and assets, the new era of Dutch Government began.
2) The Colonial Government of the Dutch
The transition period from the VOC to the Dutch Government was not effective
because in Europe the Netherlands and Britain were at war from 1780 to 1784.
Then, a decade later, the Netherlands was invaded by France until the end of the
Napoleonic Wars in 1815 (Drakeley, 2005). When situation enabled the Dutch
Government to re-take control of the Netherlands Indies, the Dutch continued to
P a g e | 69
colonize it. It was noted that the international treaty defining the territorial area in
which Indonesia was born, was called the Netherlands (East) Indies (Nederlandsch-
Indië) which was under colonial state rule but with sovereignty of the Dutch crown
(Dick, 2002). However, even though the Dutch claimed this territory and utilized
international recognition of borders by bringing all local rulers or kingdoms under the
rule of the colonial state, the British and Portuguese, and also the local rulers,
exerted their influences on the territory and had no intention of recognizing the
sovereignty of the Dutch (ibid p.21).
In this colonial government era, the infamous mechanism called Cultuurstelsel (the
Cultivation System) was forced on the Netherlands Indies people by Johannes van
den Bosch, the Governor General of the Netherlands Indies in 1830. This system
obliged every village to give 20% of its land to be planted with exported commodities
such as coffee, sugar cane, and indigo. The harvests had to be sold to the colonial
government for a fixed, predetermined price. If people did not have land, then they
were required to work for 75 days per year (20%) on farms owned by the colonial
government (Drakeley, 2005). In reality, the lands provided for the exported
commodities were more than 20% and all yields had to be given to the colonial
government. All cultivated and harvested crops were shipped to Europe by
Nederlandsche Handel-Maatschappij (Netherlands Trading Company). This
agricultural system was the most exploitative period of the colonial era, squeezed
out of the Netherlands Indies’ natural wealth by means of “revenue farming”; this era
proved to be harsher and crueler than the VOC era. This agricultural (cultivation)
system contributed significantly to the Dutch Government’s wealth. The Dutch could
pay off their debts including those that were left by the VOC. They were able to pay
for the massive public works in the Netherlands, and in their colonies, the Dutch
P a g e | 70
could build roads, railways and ports to transport plantation crops. It was a golden
era for colonial government; conversely, it was the worst era for Indonesia’s people.
Several public corporations were established during the cultuurstelsel period, one of
which was the Nederlandsche Handel Maatschappij (NHM), an organization that
coordinated the Cultivation System, and opened an office in Batavia in 1826. The
De Javasche Bank was established by the Dutch in 1828, and Naamlooze
Venootschap Nederlandsch Indische Spoorweg Maatschappij (NV. NISM) began to
build the first railway in Indonesia in 1864. Other organizations were established
after the cultuurstelsel period and included Nederlandche Indische Electriciteit
Maatschappij [NIEM], an electricity company that was established in 1897 in
Batavia, Koninlijke Paketvaart Maatschappij (KPM), a shipping company that built
an operational head office in Batavia in 1888, and The Post, Telegraph, and
Telephone Service Office that was established by the Post- Telegraaf- en
Telefoondienst in 1906 in Bandung. The public corporations established by the
colonial government were governed under Indische Comptabiliteitswet (ICW) of
1864, an Indonesian Treasury Law introduced by the colonial government and which
controlled the financial and budgetary aspects of the colonial government, and
Indische Bedrijvenwet (IBW) of 1927, a new Indonesian law regarding enterprises
(Pangestu and Habir, 1989). This is why both of these laws, ICW and IBW, have
greatly influenced Indonesia’s law system.
People were suffering during the Cultivation System period; moreover, the
exploitation and corruption associated with the system exacerbated the suffering.
Eduard Douwes Dekker, a former colonial official, wrote a novel titled Max Havelaar
that effectively exposed the situation. Its publication pricked the consciences of the
Dutch. As a result, from the 1860s, the colonial government gradually began to
abolish this cultivation system and it had vanished completely by 1919 (Drakeley,
P a g e | 71
2005). After the end of the cultivation system period, the Dutch reformers brought
modern capitalism to Indonesia and the Liberal era began.
The Ethical policy was introduced by the Dutch Government to the Netherlands
Indies. It was intended to improve indigenous welfare because the Dutch felt they
owed “a debt of honor” to the Netherlands Indies. A significant amount of public
funds was injected into the building of public infrastructures such as bridges, roads,
ports, storehouses, irrigations and the like, and also a raft of policies were
implemented to improve the health and education of the indigenous Indonesian
people. However, the results of the Ethical policy were disappointing. For instance,
in 1931, only 8% of indigenous children attended school, and there were only 178
Indonesian students at universities (ibid p.46). The colonial government rule did not
bring modernity to the Netherlands Indies.
3.1.2. The Japan Era (1942—1945)
The background history of the Japan era in Indonesia is related to Japan’s desire to unify
Asia under the concept of Hakko Ichiu ideology which emerged at the end of the 1930s,
and which brought Japan into World War II (Edwards, 2003). Hakko Ichiu literally means
“eight crown cords, one roof” that is “all the world under one roof”, a Japanese slogan
popularised by the Prime Minister of Japan, Fumimaro Konoe, in his speech on January 8,
1940 (Beasley, 1987). World War II was the global war that endured from 1933 to 1945,
and involved many countries. These countries eventually formed two opposing military
alliances, namely the Allies and the Axis. The Allies were originally France, Poland, and
Britain. Subsequently, many countries joined them, including the Dutch. Finally, in order to
stop the aggression of Germany, Japan, and Italy which by then were Axis members, The
USA was motivated to join the Allies (Gilbert, 2004). In the Pacific, the Dutch joined with
the ABCD front comprising America (USA), the British, China and the Dutch to combat
Japan (Tugiyono et al., 2004). On May 1940, Holland was invaded and occupied by the
P a g e | 72
Germans (Warmbrunn, 1963) This situation prompted the Netherland Indies which ruled
the Indonesian colony in that period, to announce a state of alert since this colony was a
source of income for the Dutch, accounting for one-seventh of Holland’s income (Friend,
1988).
In search of oil to support its war efforts, on March 1, 1942, the Japanese16th army,
headed by General Immamura Hitoshi, landed on Java, the mostly densely populated
island of Indonesia (Van De Ryt, 2002). The three coastal cities where the Japanese
landed were Banten, Indramayu, and Rembang.17 The conquest of Indonesia occurred
rapidly and the Dutch surrendered unconditionally to Japan on March 8, 1942. In the
handover ceremony, Holland was represented by General Governor Tjarda van
Starkenborgh and General Ter Poorten; Japan was represented by General Imamura
Hitoshi. This handover also included all companies owned by the Dutch in the Netherland
Indies being handed to Japan’s emperor. At first, most Indonesians welcomed the
Japanese, seeing them as “liberators” from the Netherland Indies government, but they
quickly realized their mistake.18
After the conquest of Indonesia, Japan imposed a military administration and bureaucratic
system which was set out by Tokyo, but the guidelines were vague and unorganized (Van
De Ryt, 2002). Japan argued that this system would utilize the existing administrative
structure while simultaneously not disrupting the social customs. However, The Japanese
did not realize that the higher-ranking bureaucrats had been removed from Indonesia by
the Dutch, leaving only a little administrative structure.19 Those who stayed in the
bureaucrat structure refused to pledge loyalty to Emperor Hirohito and were eventually
17 Banten and Indramayu are coastal cities in West Java Province, whereas Rembang is a coastal city in Central Java. 18 Ibid p.59 19 Ibid p.59
P a g e | 73
removed. Thus, the military and bureaucratic administration was not effective, and finally
Japan ruled Indonesia by trial and error (Satō, 1994).
Both economically and socially, Japan exploited all Indonesia’s resources to support its
war industries. Even the Indonesians were forced to become Roomusha, “laborers in the
war effort”. It is estimated that this involved between four to eight million workers (see
Satō (1994) and Friend (1988)). All plantation production, manufacturing, banks, and
strategic companies were seized. The administration and organization of companies were
changed into a military system (Pindad, 2015). The names of companies were changed
as well. For example, Artilerie Inrichtingen (AI)20, a company in the defense industry
which had four installations, had a name change. Artillerie Constructie Winkel (ACW)21
had its name changed to Daichi Ichi Kozo, Geweemarkelschool (GW)22 became Dai Ni
Kozo, Proyektiel Fabriek (PF)23 became Dai San Kozo, Pyrotechnische Werkplaats
(PW)24 became Dai Shi Kozo, Monrage Artilerie25 became Dai Go Kazo. Japan took
over the electricity company, Algemeene Nederlandsche Indische Electriciteit
Maatschappij (ANIEM), and formed an organization called Djawa Denki Djigjo Kosja to
handle all electricity matters in Java then, changed it into Djawa Denki Djigjo Sja as the
branch of Hosjoden Kabusiki Kaisja of Tokyo (Pegadaian, 2014). The change of
administration, organization, and name also occurred in all companies which had been
taken over by Japan. For example, LKBN Antara26, a news agency, became Yoshima
(universal), and Bank van Leening27 became Sitji Eigeikyuku, which also changed the
20 PT Pindad, a BUMN having a domicile in Bandung, West Java was born from this Artilerie Inrichtingen company. 21 ACW produced artillery weapons 22 GW was an educational institute for maintenance and repair of weapons 23 PF produced projectiles 24 PW produced ammunition and other explosive materials 25 The fragment of ACW 26 A BUMN having a legal form of Perum 27 An embryo of Pegadaian, a BUMN in finance industry
P a g e | 74
head of Bank van Leening to Japanese, Ohno-san (Pegadaian, 2014). However, the
military and bureaucratic system applied by Japan during the period of Japanese
occupation in Indonesia which lasted for only 3.5 years had not changed the corporate
culture of all companies which had already been established by the Dutch.
3.1.3. The Old Order Era (1945—1965)
The proclamation of Independence of the Republic of Indonesia on August 17, 1945 by
Soekarno and Hatta was the first milestone in the formation of Indonesia as a State. Then,
the next day on August 18, 1945 the Indonesian Independence Preparatory Committee
(PPKI) ratified the 1945 Constitution of the Republic of Indonesia as a basic law for the
State of the Republic of Indonesia. The founding fathers of the Republic of Indonesia had
formulated the philosophical and economic principles of the State in Chapter XIV titled
“Social Welfare”, which were detailed in paragraphs 1 to 3 of article 33 of the 1945
Constitution. Social welfare is one of the pillars and embraces the spirit of the State’s
vision, in addition to other pillars that are enshrined in the preamble of the 1945
Constitution: “to protect the whole people of Indonesia and the entire homeland of
Indonesia, and in order to advance general prosperity, to develop the nation's intellectual
life, and to contribute to the implementation of a world order based on freedom, lasting
peace and social justice.” Paragraphs 1 to 3 of article 33 of the 1945 Constitution stated
that:
(1) The economy is to be structured as a common endeavour based on familial
principles;
(2) Production sectors that are vital to the state and that affect the livelihood of a
considerable part of the population are to be controlled by the state;
(3) The land and the waters as well as the natural riches therein are to be controlled by
the state to be exploited to the greatest of the people.
P a g e | 75
Article 33 of the 1945 Constitution provided a very strong legal basis for the creation and
establishment of State-Owned Enterprises in Indonesia.
The economic situation of the new state was disorganized, with the Dutch business
interests still controlling the modern sector and the exports of primary commodities (Dick,
2002). Nan G. Amstutz stated that the indigenous Indonesian had only 19% of the
privately owned non-agricultural capital, whereas the Dutch owners had 52%
(Glassburner, 1962). It was estimated that in 1952, four Dutch firms still held 50% of all
consumer imports, and eight Dutch firms held 60% of exports. Moreover, the private
banking industry was shared by seven foreign banks, three of which were Dutch (ibid
p.120).
The formal transfer of Dutch sovereignty over the Netherland Indies to the Republic of the
United States of Indonesia28, a federation of sixteen states, of which the Republic of
Indonesia was one, began on 27th of December 1949 (Glassburner, 1962). However, the
Republic of the United States of Indonesia did not bring political stability, so the interim
legislature and the Senate of the Republic of the United States of Indonesia decided to go
back to the Unitary State of Republic of Indonesia on 17th of August 1950. The transfer
process from Dutch sovereignty ended with Dutch-owned business property being taken
over in 1957 (ibid p.113).
The transfer of nationalization was both voluntary and involuntary. The voluntary
nationalizations took the form of share acquisitions. For example, the Government of
Indonesia purchased all the privately held Java bank shares on the Amsterdam Stock
Exchange (soon to become the Bank of Indonesia); as a new state, Indonesia
experienced problems with price negotiation and the financing of purchases such as the
28 The United States of Indonesia was established on 27th of December 1949 as a result of roundTable conference attended by delegations from Indonesia, the Dutch, BFO and UNCI
P a g e | 76
public utilities (gas and electricity) companies in Jakarta, Cirebon, Central and East Java,
Balik Papan and Ambon; public transport in Jakarta; port facilities in Surabaya; and Dutch-
owned railway companies in Java and Sumatra. The involuntary nationalization occurred
when the Government of Indonesia issued the government decree number 23 of 1958
dated April 16, 1958 which was applied from April 17, 1958 to nationalize all the Dutch
companies operating in Indonesia. Then, on December 27, 1958, the law for the
nationalization of Dutch companies was established and was made retroactive from
December 3, 1957.
It was noted that from the period of 1957 to 1960, approximately 700 Dutch companies
were nationalized under military command (Lindblad, 2012). The military were given
positions in SOEs by President Soekarno which might have been intended as a strategy
to maintain national stability and military loyalty so the term ‘entrepreneurial military
officer’ was quite popular at that time (Nugroho and Wrihatnolo, 2008). Then, 90%
ownership of agricultural companies were taken over by the Government of Indonesia,
60% of export trading value and 246 companies comprising fabric manufacturers, mining
companies, banking companies, shipping companies, and service sectors were taken
over as well (Robison, 1986). Therefore, the majority of Dutch companies nationalized by
the Government of the Republic of Indonesia became State-Owned Enterprises, and
several of them were privatized and acquired by Chinese conglomerates (Lindblad, 2012).
For example, all agricultural companies were placed under the umbrella of a new national
organization: the Central State-owned Estates, New-styled (Pusat Perkebunan Negara-
Baru, PPN-Baru) (ibid p.15); Koningkelijke Paketvaart Maatschappij (KPM) became the
national shipping company (Perusahaan Pelayaran Nasional Indonesia—PELNI);
Koningkelijke Luchvaart Maatschappij (KLM) became the national airline company
(Garuda Indonesia Airways); Bataviaasche Petroleum Maatschappij (BPM) became the
national oil and gas company (Perusahaan Minyak Nasional—Pertamin). However, the
P a g e | 77
majority of Dutch companies that were nationalized had already transferred their assets to
Holland, so the government of Indonesia only obtained a remnant of assets that did not
contribute much to the economy, and even these companies turned out to be a burden
(Nugroho and Wrihatnolo, 2008). During this period, the SOEs that initially numbered
more than 600 were restructured into 223 companies (Ibid p.6).
Two years after the nationalization process, the Government of Indonesia issued the law
and the government regulation in lieu of law number 19 of 1960 regarding State-Owned
Enterprises in order to integrate all State-Owned Enterprises into economic government
programs as outlined in the political manifesto of the Republic of Indonesia on August 17,
1959. This required mandatory reorganization in terms of production and distribution
directed towards the implementation of article 33 of the constitution. This government
regulation was intended to establish more uniformity in the management and control of
State-Owned Enterprises, taking into account the legal form of the State-Owned
Enterprises in order to guide the economic structure. This concept of a guided economy
was intended to achieve “a just and prosperous society” in which decisions about
resources allocation, production, investment and distribution are made by a central
governmental institution (Tan, 1966). In addition, this regulation was used to synchronize
all economic activities of both the State-Owned Enterprises and the local, autonomous
cooperatives and private sectors. Regulations related to the SOE in the Old Order era
provided a foundation for further development in the New Order Era. These are
summarized in TABLE 3-2.
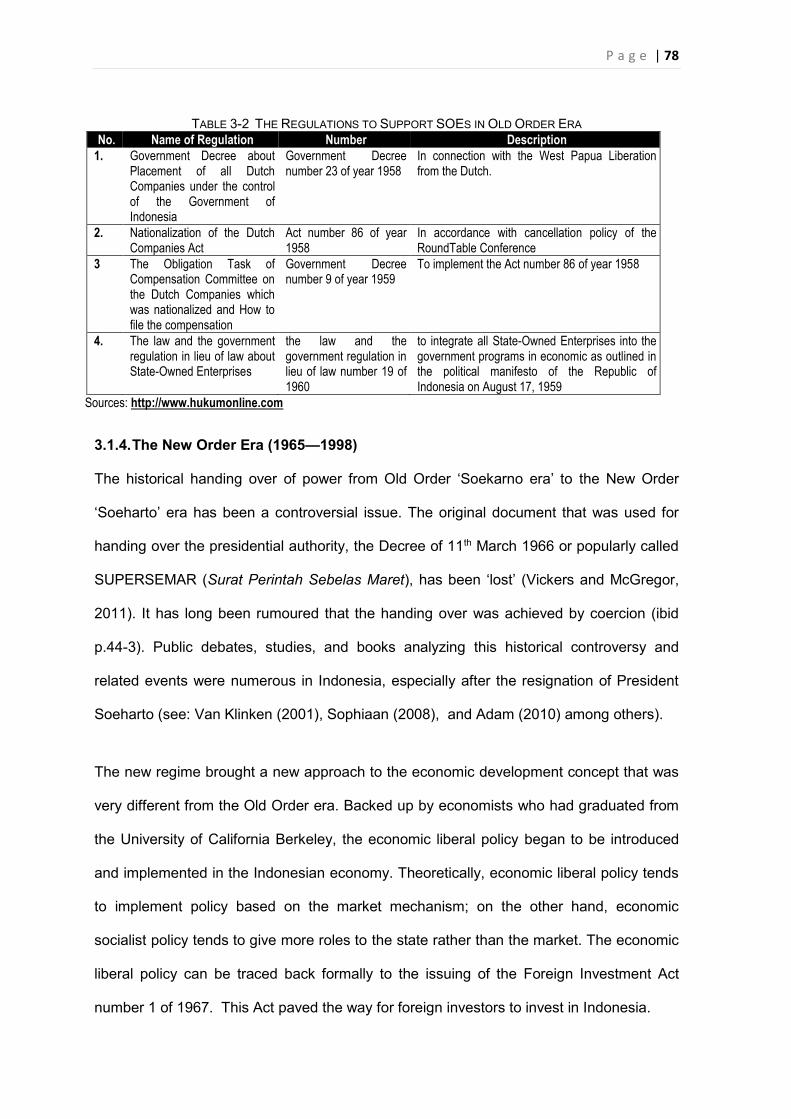
P a g e | 78
TABLE 3-2 THE REGULATIONS TO SUPPORT SOES IN OLD ORDER ERA No. Name of Regulation Number Description
1. Government Decree about Placement of all Dutch Companies under the control of the Government of Indonesia
Government Decree number 23 of year 1958
In connection with the West Papua Liberation from the Dutch.
2. Nationalization of the Dutch Companies Act
Act number 86 of year 1958
In accordance with cancellation policy of the RoundTable Conference
3 The Obligation Task of Compensation Committee on the Dutch Companies which was nationalized and How to file the compensation
Government Decree number 9 of year 1959
To implement the Act number 86 of year 1958
4. The law and the government regulation in lieu of law about State-Owned Enterprises
the law and the government regulation in lieu of law number 19 of 1960
to integrate all State-Owned Enterprises into the government programs in economic as outlined in the political manifesto of the Republic of Indonesia on August 17, 1959
Sources: http://www.hukumonline.com
3.1.4. The New Order Era (1965—1998)
The historical handing over of power from Old Order ‘Soekarno era’ to the New Order
‘Soeharto’ era has been a controversial issue. The original document that was used for
handing over the presidential authority, the Decree of 11th March 1966 or popularly called
SUPERSEMAR (Surat Perintah Sebelas Maret), has been ‘lost’ (Vickers and McGregor,
2011). It has long been rumoured that the handing over was achieved by coercion (ibid
p.44-3). Public debates, studies, and books analyzing this historical controversy and
related events were numerous in Indonesia, especially after the resignation of President
Soeharto (see: Van Klinken (2001), Sophiaan (2008), and Adam (2010) among others).
The new regime brought a new approach to the economic development concept that was
very different from the Old Order era. Backed up by economists who had graduated from
the University of California Berkeley, the economic liberal policy began to be introduced
and implemented in the Indonesian economy. Theoretically, economic liberal policy tends
to implement policy based on the market mechanism; on the other hand, economic
socialist policy tends to give more roles to the state rather than the market. The economic
liberal policy can be traced back formally to the issuing of the Foreign Investment Act
number 1 of 1967. This Act paved the way for foreign investors to invest in Indonesia.
P a g e | 79
Indonesia a more friendly country for foreigner investors when Law number 6 of 1968
regarding Domestic Investment was issued. This law enables foreigners to invest in the
industries that previously were closed to them by law number 1 of 1967. Since the
issuance of those two laws, gradually the multinational companies began to control
several important natural resources owned by Indonesia. Then, the international financial
institutions such as World Bank, International Monetary Fund (IMF), Inter Governmental
Group on Indonesia (IGGI)29, and Paris Club competed to lend money to Indonesia,
expecting that Indonesia would be trapped by its debts and be forced to sell its State-
Owned Enterprises to its competitors.
Although he took a different approach to economic development, Soeharto continued to
implement the Soekarno strategy; in particular, he appointed military personnel to key
positions in the State-Owned Enterprises. There are two reasons why the military still
predominate in these positions. Firstly, from the historical perspective, the military played
a significant role when the government of Indonesia under Soekarno decided to
nationalize the Dutch companies. Secondly, the government policy during the Soeharto
era applied the dual function doctrine of the military, called “Dwi Fungsi ABRI30”; that is,
the military has a social function and a political function. In fact, the application of the “Dwi
Fungsi ABRI” has been overused. Almost all key positions in regional administrations, the
bureaucracy, and the State-Owned Enterprises are controlled by the military.
The strategy to generate economic activity by implementing a more liberal economic
policy, has been gradually achieving success even though the policy is considered to be
too pragmatic (Glassburner, 1971). Due to a perception that the State-Owned Enterprises
29 The international organization established in 1967 initiated by United States of America to coordinate the multilateral financing for Indonesia. The group members are the Asian Development Bank, International Monetary Fund, United Nations Development Programme, World Bank, Australia, Belgium, UK, Canada, France, Germany, Italy, Japan, New Zealand, Swiss, and United States of America. 30 Abbreviation of Angkatan Bersenjata Republik Indonesia (The Armed Forces of the Republic of Indonesia)
P a g e | 80
have run businesses inefficiently, the people consultative assembly enacted the decree
number XXII/MPRS/1966 and then, law number 9 of 1969 to revise the government
regulation in lieu of Law No. 19 of 1960. This law categorizes SOEs into three types
based on their socio-economic functions. Firstly, the Bureau Company (popularly called
PERJAN (Perusahaan Jawatan)) is a State-Owned Enterprise established and governed
by the provision contained in the Indonesische Bedrijvennwet31 (stbl. 1927:419 as it has
been amended and supplemented several times). This act contains regulations that are
still greatly influenced by the Dutch Law. Secondly, the Special Purpose Entity (popularly
called PERUM (Abbreviation of Perusahaan Umum)) is a State-Owned Enterprise
established and governed by the provision contained in government regulation in lieu of
Law No.19 of 1960. Thirdly, Limited Liability Company (popularly called PERSERO) is a
State-Owned Enterprise established as a limited liability company that is governed by the
provisions of the Code of Commercial Law (stbl. 1847: 23 amended and supplemented
several times).
The economic liberal policy that enables foreigners to buy shares in State-Owned
Enterprises shares began to be implemented when the Foreign Investment Act No. 1 of
1967 and the Domestic Investment Act No. 6 of 1968 were issued at the beginning of the
Soeharto era. The purpose of Act No. 6/1968 was to encourage economic and business
growth, and also to encourage people to have shares in State-Owned Enterprises, which
is consistent with article 33 of the Constitution 1945. However, at the same time, Act No.
6/1968 also enables foreigners to invest in the negative investment list in accordance with
Act No.1/1967. This may not be in the spirit of article 33 of the Constitution 1945.
In 1995, the New Order Era enacted two new laws which are very important to support
legal infrastructure of corporate governance. The first law is Limited Liability Company Act
31 This act still uses the legacy of the Ducth
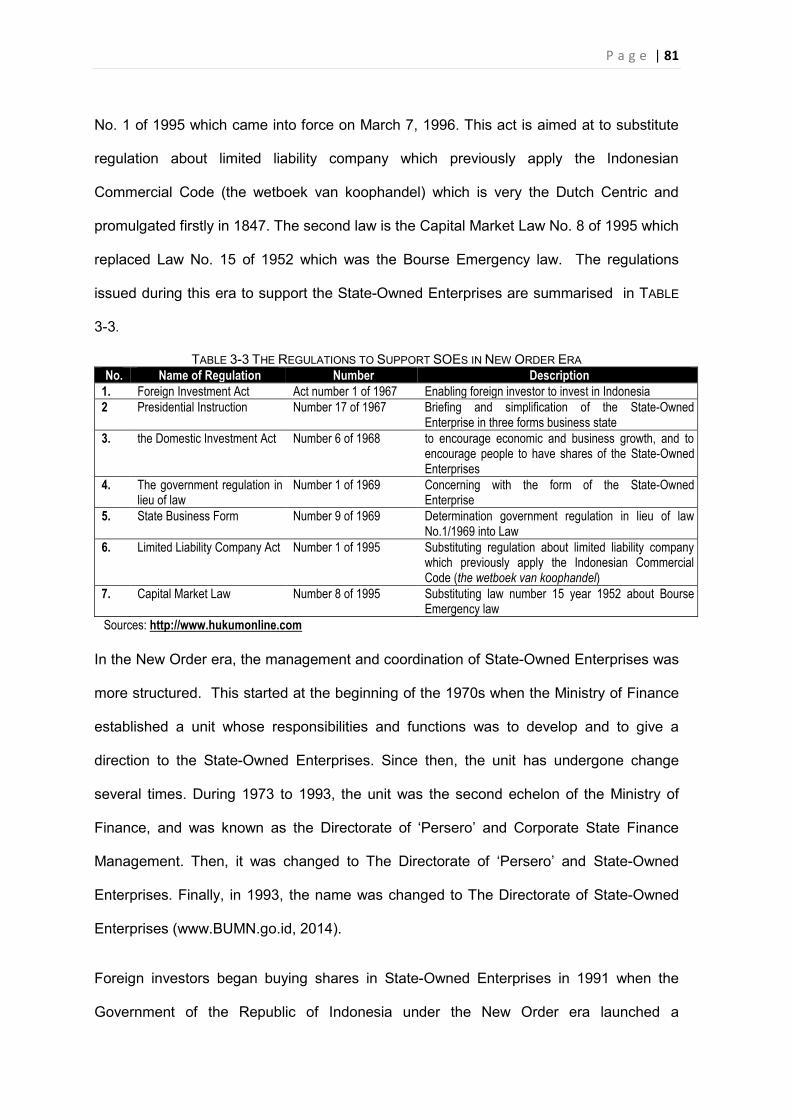
P a g e | 81
No. 1 of 1995 which came into force on March 7, 1996. This act is aimed at to substitute
regulation about limited liability company which previously apply the Indonesian
Commercial Code (the wetboek van koophandel) which is very the Dutch Centric and
promulgated firstly in 1847. The second law is the Capital Market Law No. 8 of 1995 which
replaced Law No. 15 of 1952 which was the Bourse Emergency law. The regulations
issued during this era to support the State-Owned Enterprises are summarised in TABLE
3-3.
TABLE 3-3 THE REGULATIONS TO SUPPORT SOES IN NEW ORDER ERA No. Name of Regulation Number Description
1. Foreign Investment Act Act number 1 of 1967 Enabling foreign investor to invest in Indonesia 2 Presidential Instruction Number 17 of 1967 Briefing and simplification of the State-Owned
Enterprise in three forms business state 3. the Domestic Investment Act Number 6 of 1968 to encourage economic and business growth, and to
encourage people to have shares of the State-Owned Enterprises
4. The government regulation in lieu of law
Number 1 of 1969 Concerning with the form of the State-Owned Enterprise
5. State Business Form Number 9 of 1969 Determination government regulation in lieu of law No.1/1969 into Law
6. Limited Liability Company Act Number 1 of 1995 Substituting regulation about limited liability company which previously apply the Indonesian Commercial Code (the wetboek van koophandel)
7. Capital Market Law Number 8 of 1995 Substituting law number 15 year 1952 about Bourse Emergency law
Sources: http://www.hukumonline.com
In the New Order era, the management and coordination of State-Owned Enterprises was
more structured. This started at the beginning of the 1970s when the Ministry of Finance
established a unit whose responsibilities and functions was to develop and to give a
direction to the State-Owned Enterprises. Since then, the unit has undergone change
several times. During 1973 to 1993, the unit was the second echelon of the Ministry of
Finance, and was known as the Directorate of ‘Persero’ and Corporate State Finance
Management. Then, it was changed to The Directorate of ‘Persero’ and State-Owned
Enterprises. Finally, in 1993, the name was changed to The Directorate of State-Owned
Enterprises (www.BUMN.go.id, 2014).
Foreign investors began buying shares in State-Owned Enterprises in 1991 when the
Government of the Republic of Indonesia under the New Order era launched a
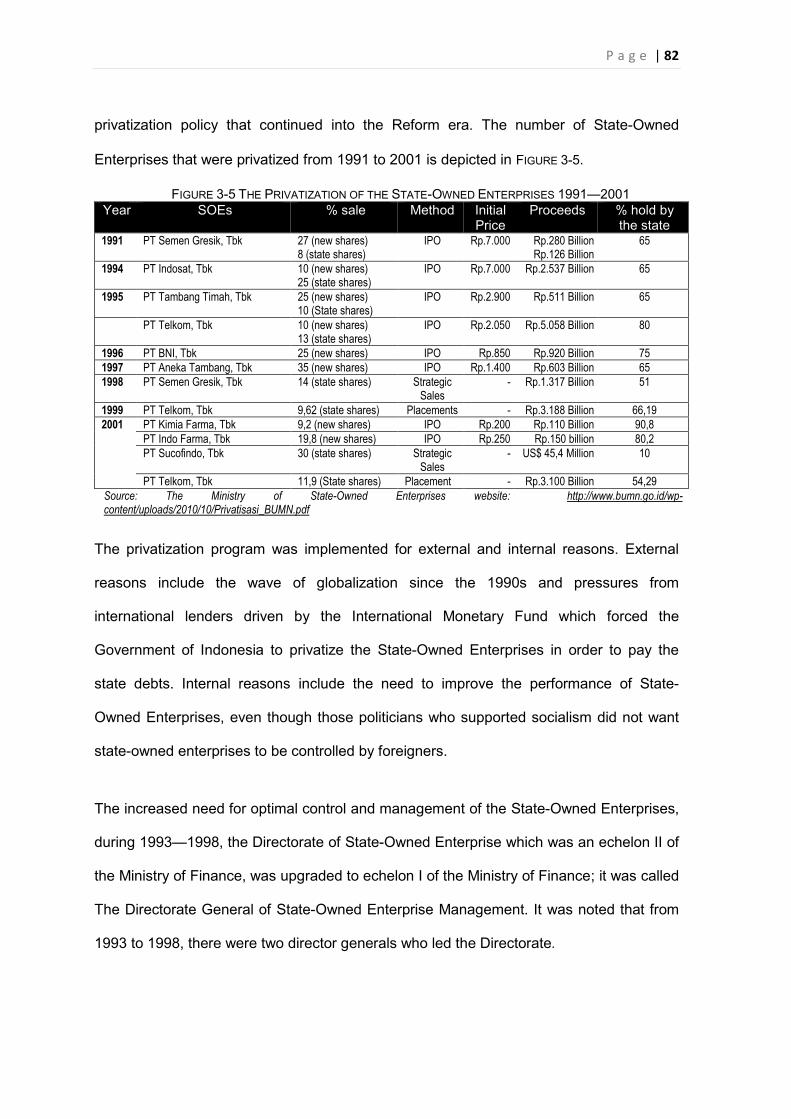
P a g e | 82
privatization policy that continued into the Reform era. The number of State-Owned
Enterprises that were privatized from 1991 to 2001 is depicted in FIGURE 3-5.
FIGURE 3-5 THE PRIVATIZATION OF THE STATE-OWNED ENTERPRISES 1991—2001 Year SOEs % sale Method Initial
Price Proceeds
% hold by the state
1991 PT Semen Gresik, Tbk 27 (new shares) 8 (state shares)
IPO Rp.7.000
Rp.280 Billion Rp.126 Billion
65
1994 PT Indosat, Tbk 10 (new shares) 25 (state shares)
IPO Rp.7.000 Rp.2.537 Billion 65
1995 PT Tambang Timah, Tbk 25 (new shares) 10 (State shares)
IPO Rp.2.900 Rp.511 Billion 65
PT Telkom, Tbk 10 (new shares) 13 (state shares)
IPO Rp.2.050 Rp.5.058 Billion 80
1996 PT BNI, Tbk 25 (new shares) IPO Rp.850 Rp.920 Billion 75 1997 PT Aneka Tambang, Tbk 35 (new shares) IPO Rp.1.400 Rp.603 Billion 65 1998 PT Semen Gresik, Tbk 14 (state shares) Strategic
Sales - Rp.1.317 Billion 51
1999 PT Telkom, Tbk 9,62 (state shares) Placements - Rp.3.188 Billion 66,19 2001 PT Kimia Farma, Tbk 9,2 (new shares) IPO Rp.200 Rp.110 Billion 90,8
PT Indo Farma, Tbk 19,8 (new shares) IPO Rp.250 Rp.150 billion 80,2 PT Sucofindo, Tbk 30 (state shares) Strategic
Sales - US$ 45,4 Million 10
PT Telkom, Tbk 11,9 (State shares) Placement - Rp.3.100 Billion 54,29 Source: The Ministry of State-Owned Enterprises website: http://www.bumn.go.id/wp-content/uploads/2010/10/Privatisasi_BUMN.pdf
The privatization program was implemented for external and internal reasons. External
reasons include the wave of globalization since the 1990s and pressures from
international lenders driven by the International Monetary Fund which forced the
Government of Indonesia to privatize the State-Owned Enterprises in order to pay the
state debts. Internal reasons include the need to improve the performance of State-
Owned Enterprises, even though those politicians who supported socialism did not want
state-owned enterprises to be controlled by foreigners.
The increased need for optimal control and management of the State-Owned Enterprises,
during 1993—1998, the Directorate of State-Owned Enterprise which was an echelon II of
the Ministry of Finance, was upgraded to echelon I of the Ministry of Finance; it was called
The Directorate General of State-Owned Enterprise Management. It was noted that from
1993 to 1998, there were two director generals who led the Directorate.
P a g e | 83
At first, the State-Owned Enterprises achieved much developmental progress. For
example, the government assisted the State-Owned Enterprises with business in strategic
industries by establishing the Strategic Industry Management Board (Badan Pengelola
Industry Strategis—BPIS). BPIS managed ten State-Owned Enterprises which were
categorized as strategic; these were: Dahana Inc. (explosive material industry), Barata
Indonesia Inc. (heavy equipment industry), Boma Bisma Indra Inc. (equipment industry),
LEN Inc.(Electronic industry), INKA Inc.(train industry), INTI Inc.(telecommunication
industry), Dirgantara Indonesia Inc. (aircraft industry), Krakatau Steel Inc.(steel industry),
PAL Inc., (ship industry), and Pindad Inc. (weapons industry). However, by the end of the
New Order era, the State-Owned Enterprises had a poor reputation. They were not
efficient, were very often mismanaged, and were also cash cows for political groups and
other parties who had a network within the ruling regime (Agung, 2008). According to Prof.
Dawam Rahardjo, an Indonesian economist, the State-Owned Enterprises in the New
Order had the following characteristics: (1) key positions of SOEs were dominated by
military personnel and bureaucrats; (2) the corporate decisions were influenced by much
political nuances; (3) the SOEs had a tendency to be social institutions rather than
corporations; (4) they were less innovative; and (5) they conformed less to the
Constitution goals (Putra, 2013).
At the end of the New Order’s government which was foreshadowed by the fall of
President Suharto, The Directorate General of State-Owned Enterprises was upgraded to
a ministerial level named The Ministry of Empowerment of the State-Owned
Enterprise/Chief of the State-Owned Enterprise Development Board.
3.1.5. The Reform Era (1998—Current)
The Reform Era began in May 1998 when Asia’s longest serving (32 years) strongman,
Suharto, stepped down from his presidency after he failed to address various crises that
had occurred in Indonesia since the beginning of 1997 (King, 2003). The crises also led to
P a g e | 84
widespread political turmoil and social unrest. The handover of authority from Soeharto to
his successor did not run smoothly. Over a short five-year period, the national leadership
succession changed three times: Prof. Dr. Ing. Habibie, Adurrahman Wahid (Gus Dur),
and Megawati Sukarnoputri. Ironically, the management of State-Owned Enterprises
usually depends on the cabinet formed by the new president; as a result, the organization
of the Ministry of State-Owned Enterprises changed several times since the beginning of
the Reform Order. From 26th October 1999 until 24th April 2000 it changed its name to the
Ministry of State Investment and State-Owned Enterprise Development. Then, on 24th
April 2000, the position of Minister of State Investment and State-Owned Enterprise
Development was removed and became echelon I in the Ministry of Finance. Finally, on
9th of August 2004 the “Gotong Royong” Cabinet under President Megawati re-established
the Ministry of State-Owned Enterprise, and this continues to this day.
At the beginning of the Reform era, the Government was determined to reform the
corporate sector, especially the banking industry, which had experienced crises which led
to monetary crises and finally economic disaster as a legacy from the New Order era. The
crises were mainly caused by poor corporate governance in the banking sector which was
connected to many corporations which also had weak corporate governance practices.
Therefore, the Government of Indonesia established a series of strategic policies in
response to the crises. One of the policies involved the establishment of an ad hoc
agency called the Indonesian Banking Restructuring Agency (IBRA) that has a lifespan for
five years by issuing Presidential Decree No. 27 dated January 26, 1998. The main goals
of the IBRA were to restructure the banking sector, resolve the problem of assets, and
recover the state money and funds that had been channeled to the banking sector. The
technical details of the overall objective were to administer the government’s blanket
P a g e | 85
guarantee program32, and supervise, manage and restructure distressed banks. Then, a
year later, on February 27, 1999 the government issued more objectives to the IBRA
including the management of the government’s assets in those banks undergoing a
restructure and the optimization of the recovery rate of assets from distressed banks.
When the IBRA was terminated, many assets were clear and free, so the government
considered it necessary to establish a State-Owned Enterprise to manage those assets.
Then, the government issued government regulation No. 10 of 2004 on February 27,
2004, which established the PT Perusahaan Pengelola Aset (PPA) to manage the free
and clear assets of the IBRA.
In the macro context, the Reform government made it a priority to improve the quality of
both public and corporate governance. Subsequently, the Coordinating Minister of
Economics, Finance and Industry issued decree number KEP/31/M.EKUIN/8/1999 which
established the National Committee on Corporate Governance (NCCG) which had the
task of providing Corporate Governance Guidelines for corporations in Indonesia.
Subsequently, on February 8 of 2000, five professional and business associations
namely, the Association of Indonesian Public Listed Companies, the Indonesian
Accountant Association—Management Compartment, the Indonesian Financial Expert
Association, the Indonesian Netherlands Association, and the Indonesian Society for
Transparency formed the Forum for Corporate Governance in Indonesia (FCGI), the main
goal of which was to improve corporate governance in Indonesia (FCGI, 2011). In 2004,
the Coordinating Minister of Economics, Finance and Industry issued decree number
KEP-49/M.EKON/11/TAHUN 2004 to revitalize the National Committee on Corporate
Governance that was established by a previous decree.
32 A declaration by the government that all deposits and perhaps other financial instruments will be protected
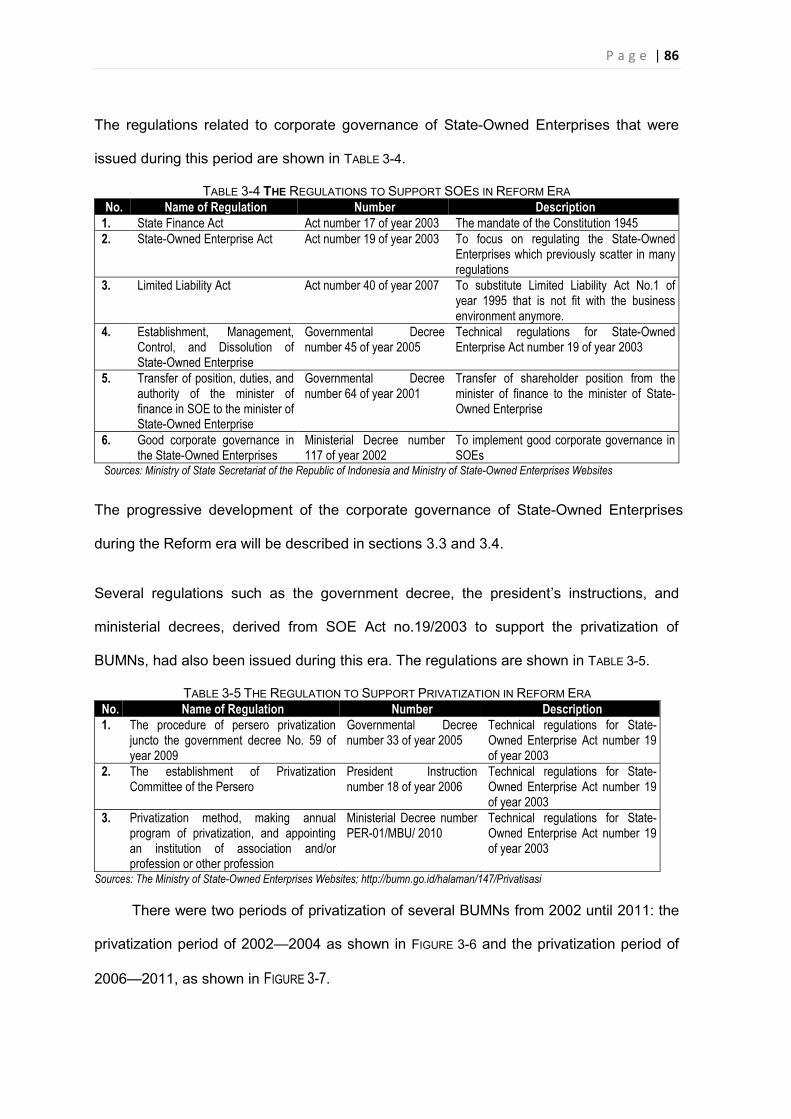
P a g e | 86
The regulations related to corporate governance of State-Owned Enterprises that were
issued during this period are shown in TABLE 3-4.
TABLE 3-4 THE REGULATIONS TO SUPPORT SOES IN REFORM ERA No. Name of Regulation Number Description
1. State Finance Act Act number 17 of year 2003 The mandate of the Constitution 1945 2. State-Owned Enterprise Act Act number 19 of year 2003 To focus on regulating the State-Owned
Enterprises which previously scatter in many regulations
3. Limited Liability Act Act number 40 of year 2007 To substitute Limited Liability Act No.1 of year 1995 that is not fit with the business environment anymore.
4. Establishment, Management, Control, and Dissolution of State-Owned Enterprise
Governmental Decree number 45 of year 2005
Technical regulations for State-Owned Enterprise Act number 19 of year 2003
5. Transfer of position, duties, and authority of the minister of finance in SOE to the minister of State-Owned Enterprise
Governmental Decree number 64 of year 2001
Transfer of shareholder position from the minister of finance to the minister of State-Owned Enterprise
6. Good corporate governance in the State-Owned Enterprises
Ministerial Decree number 117 of year 2002
To implement good corporate governance in SOEs
Sources: Ministry of State Secretariat of the Republic of Indonesia and Ministry of State-Owned Enterprises Websites
The progressive development of the corporate governance of State-Owned Enterprises
during the Reform era will be described in sections 3.3 and 3.4.
Several regulations such as the government decree, the president’s instructions, and
ministerial decrees, derived from SOE Act no.19/2003 to support the privatization of
BUMNs, had also been issued during this era. The regulations are shown in TABLE 3-5.
TABLE 3-5 THE REGULATION TO SUPPORT PRIVATIZATION IN REFORM ERA No. Name of Regulation Number Description 1. The procedure of persero privatization
juncto the government decree No. 59 of year 2009
Governmental Decree number 33 of year 2005
Technical regulations for State-Owned Enterprise Act number 19 of year 2003
2. The establishment of Privatization Committee of the Persero
President Instruction number 18 of year 2006
Technical regulations for State-Owned Enterprise Act number 19 of year 2003
3. Privatization method, making annual program of privatization, and appointing an institution of association and/or profession or other profession
Ministerial Decree number PER-01/MBU/ 2010
Technical regulations for State-Owned Enterprise Act number 19 of year 2003
Sources: The Ministry of State-Owned Enterprises Websites; http://bumn.go.id/halaman/147/Privatisasi
There were two periods of privatization of several BUMNs from 2002 until 2011: the
privatization period of 2002—2004 as shown in FIGURE 3-6 and the privatization period of
2006—2011, as shown in FIGURE 3-7.
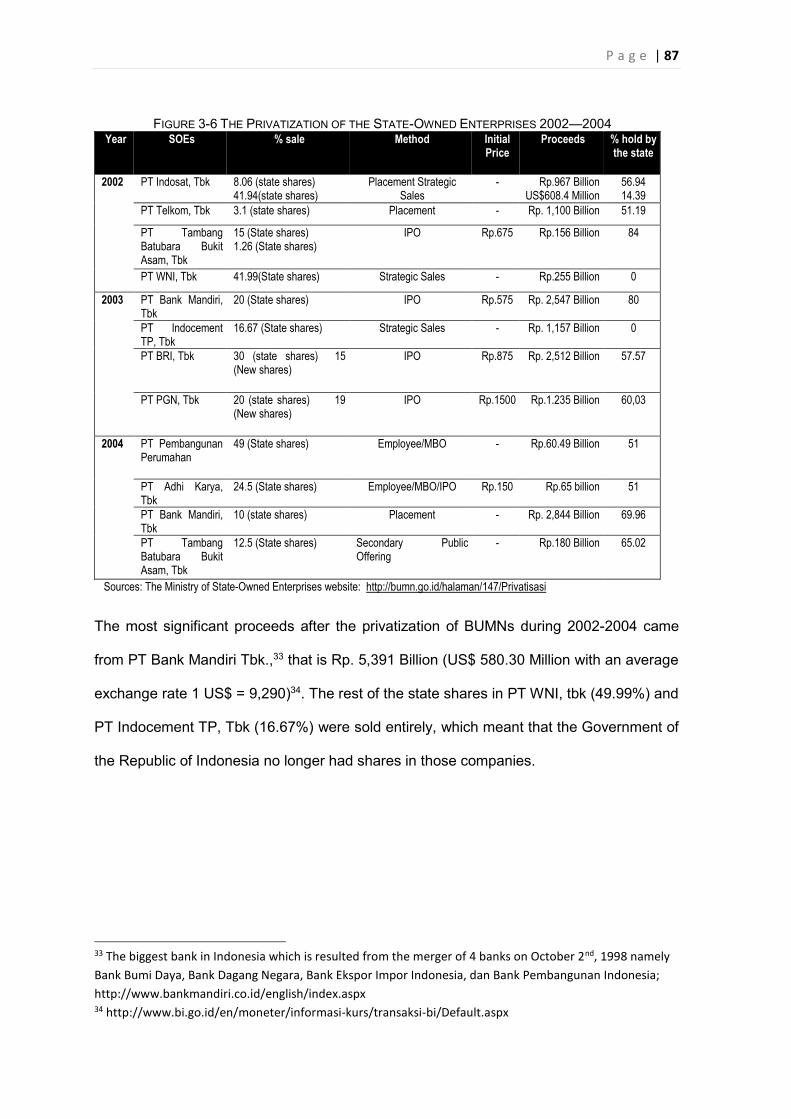
P a g e | 87
FIGURE 3-6 THE PRIVATIZATION OF THE STATE-OWNED ENTERPRISES 2002—2004 Year SOEs % sale Method Initial
Price Proceeds
% hold by the state
2002 PT Indosat, Tbk 8.06 (state shares) 41.94(state shares)
Placement Strategic Sales
-
Rp.967 Billion US$608.4 Million
56.94 14.39
PT Telkom, Tbk 3.1 (state shares) Placement - Rp. 1,100 Billion 51.19
PT Tambang Batubara Bukit Asam, Tbk
15 (State shares) 1.26 (State shares)
IPO Rp.675 Rp.156 Billion 84
PT WNI, Tbk 41.99(State shares) Strategic Sales - Rp.255 Billion 0
2003 PT Bank Mandiri, Tbk
20 (State shares) IPO Rp.575 Rp. 2,547 Billion 80
PT Indocement TP, Tbk
16.67 (State shares) Strategic Sales - Rp. 1,157 Billion 0
PT BRI, Tbk 30 (state shares) 15 (New shares)
IPO Rp.875 Rp. 2,512 Billion 57.57
PT PGN, Tbk 20 (state shares) 19 (New shares)
IPO Rp.1500 Rp.1.235 Billion 60,03
2004 PT Pembangunan Perumahan
49 (State shares) Employee/MBO - Rp.60.49 Billion 51
PT Adhi Karya, Tbk
24.5 (State shares) Employee/MBO/IPO Rp.150 Rp.65 billion 51
PT Bank Mandiri, Tbk
10 (state shares) Placement - Rp. 2,844 Billion 69.96
PT Tambang Batubara Bukit Asam, Tbk
12.5 (State shares) Secondary Public Offering
- Rp.180 Billion 65.02
Sources: The Ministry of State-Owned Enterprises website: http://bumn.go.id/halaman/147/Privatisasi
The most significant proceeds after the privatization of BUMNs during 2002-2004 came
from PT Bank Mandiri Tbk.,33 that is Rp. 5,391 Billion (US$ 580.30 Million with an average
exchange rate 1 US$ = 9,290)34. The rest of the state shares in PT WNI, tbk (49.99%) and
PT Indocement TP, Tbk (16.67%) were sold entirely, which meant that the Government of
the Republic of Indonesia no longer had shares in those companies.
33 The biggest bank in Indonesia which is resulted from the merger of 4 banks on October 2nd, 1998 namely Bank Bumi Daya, Bank Dagang Negara, Bank Ekspor Impor Indonesia, dan Bank Pembangunan Indonesia; http://www.bankmandiri.co.id/english/index.aspx 34 http://www.bi.go.id/en/moneter/informasi-kurs/transaksi-bi/Default.aspx
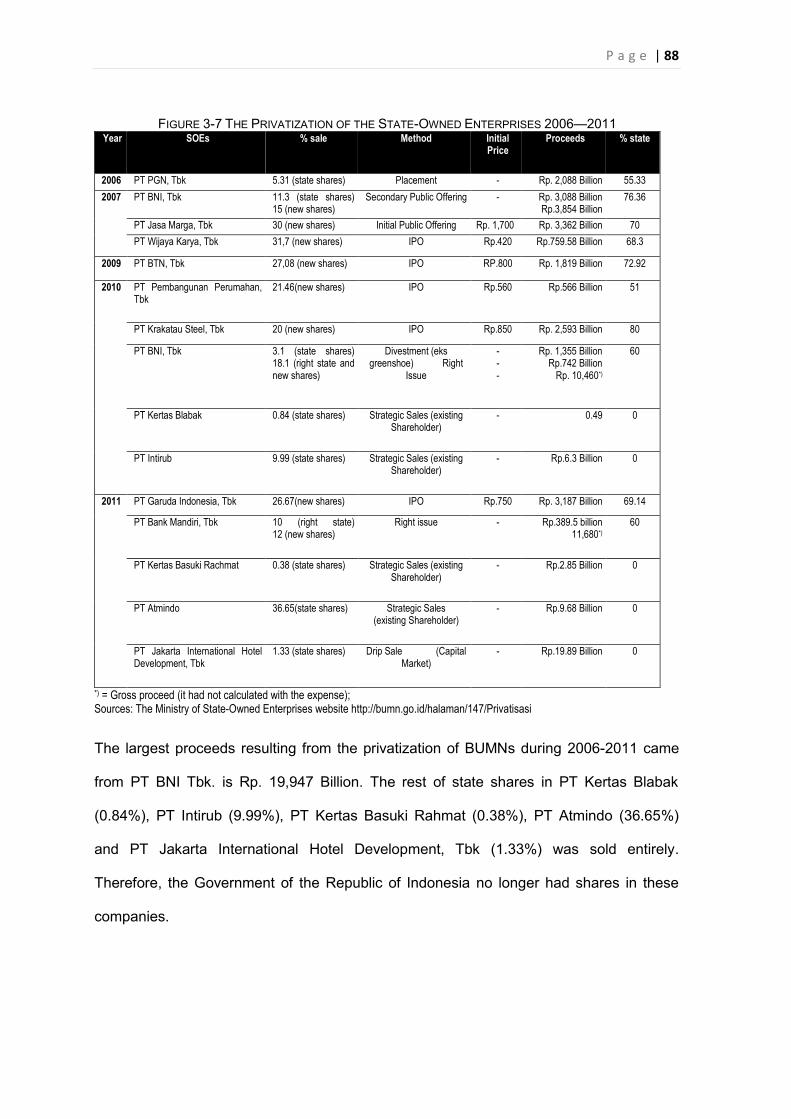
P a g e | 88
FIGURE 3-7 THE PRIVATIZATION OF THE STATE-OWNED ENTERPRISES 2006—2011 Year SOEs % sale Method Initial
Price Proceeds
% state
2006 PT PGN, Tbk 5.31 (state shares) Placement - Rp. 2,088 Billion 55.33 2007 PT BNI, Tbk 11.3 (state shares)
15 (new shares) Secondary Public Offering - Rp. 3,088 Billion
Rp.3,854 Billion 76.36
PT Jasa Marga, Tbk 30 (new shares) Initial Public Offering Rp. 1,700 Rp. 3,362 Billion 70 PT Wijaya Karya, Tbk 31,7 (new shares) IPO Rp.420 Rp.759.58 Billion 68.3
2009 PT BTN, Tbk 27,08 (new shares) IPO RP.800 Rp. 1,819 Billion 72.92
2010 PT Pembangunan Perumahan, Tbk
21.46(new shares) IPO Rp.560 Rp.566 Billion 51
PT Krakatau Steel, Tbk 20 (new shares) IPO Rp.850 Rp. 2,593 Billion 80
PT BNI, Tbk 3.1 (state shares) 18.1 (right state and new shares)
Divestment (eks greenshoe) Right
Issue
- - -
Rp. 1,355 Billion Rp.742 Billion
Rp. 10,460*)
60
PT Kertas Blabak 0.84 (state shares) Strategic Sales (existing Shareholder)
- 0.49 0
PT Intirub 9.99 (state shares) Strategic Sales (existing Shareholder)
- Rp.6.3 Billion 0
2011 PT Garuda Indonesia, Tbk 26.67(new shares) IPO Rp.750 Rp. 3,187 Billion 69.14
PT Bank Mandiri, Tbk 10 (right state) 12 (new shares)
Right issue - Rp.389.5 billion 11,680*)
60
PT Kertas Basuki Rachmat 0.38 (state shares) Strategic Sales (existing Shareholder)
- Rp.2.85 Billion 0
PT Atmindo 36.65(state shares) Strategic Sales (existing Shareholder)
- Rp.9.68 Billion 0
PT Jakarta International Hotel Development, Tbk
1.33 (state shares) Drip Sale (Capital Market)
- Rp.19.89 Billion 0
*) = Gross proceed (it had not calculated with the expense); Sources: The Ministry of State-Owned Enterprises website http://bumn.go.id/halaman/147/Privatisasi
The largest proceeds resulting from the privatization of BUMNs during 2006-2011 came
from PT BNI Tbk. is Rp. 19,947 Billion. The rest of state shares in PT Kertas Blabak
(0.84%), PT Intirub (9.99%), PT Kertas Basuki Rahmat (0.38%), PT Atmindo (36.65%)
and PT Jakarta International Hotel Development, Tbk (1.33%) was sold entirely.
Therefore, the Government of the Republic of Indonesia no longer had shares in these
companies.
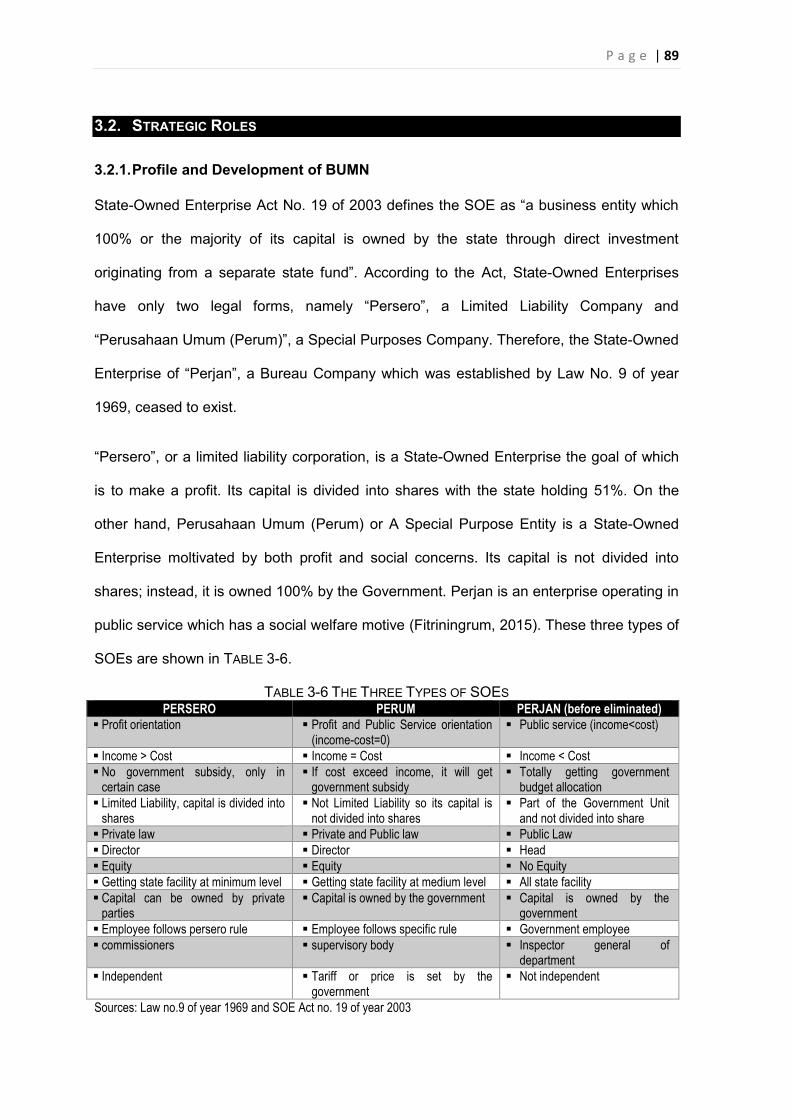
P a g e | 89
3.2. STRATEGIC ROLES
3.2.1. Profile and Development of BUMN
State-Owned Enterprise Act No. 19 of 2003 defines the SOE as “a business entity which
100% or the majority of its capital is owned by the state through direct investment
originating from a separate state fund”. According to the Act, State-Owned Enterprises
have only two legal forms, namely “Persero”, a Limited Liability Company and
“Perusahaan Umum (Perum)”, a Special Purposes Company. Therefore, the State-Owned
Enterprise of “Perjan”, a Bureau Company which was established by Law No. 9 of year
1969, ceased to exist.
“Persero”, or a limited liability corporation, is a State-Owned Enterprise the goal of which
is to make a profit. Its capital is divided into shares with the state holding 51%. On the
other hand, Perusahaan Umum (Perum) or A Special Purpose Entity is a State-Owned
Enterprise moltivated by both profit and social concerns. Its capital is not divided into
shares; instead, it is owned 100% by the Government. Perjan is an enterprise operating in
public service which has a social welfare motive (Fitriningrum, 2015). These three types of
SOEs are shown in TABLE 3-6.
TABLE 3-6 THE THREE TYPES OF SOES PERSERO PERUM PERJAN (before eliminated)
� Profit orientation � Profit and Public Service orientation (income-cost=0)
� Public service (income<cost)
� Income > Cost � Income = Cost � Income < Cost � No government subsidy, only in
certain case � If cost exceed income, it will get
government subsidy � Totally getting government
budget allocation � Limited Liability, capital is divided into
shares � Not Limited Liability so its capital is
not divided into shares � Part of the Government Unit
and not divided into share � Private law � Private and Public law � Public Law � Director � Director � Head � Equity � Equity � No Equity � Getting state facility at minimum level � Getting state facility at medium level � All state facility � Capital can be owned by private
parties � Capital is owned by the government � Capital is owned by the
government � Employee follows persero rule � Employee follows specific rule � Government employee � commissioners � supervisory body � Inspector general of
department � Independent � Tariff or price is set by the
government � Not independent
Sources: Law no.9 of year 1969 and SOE Act no. 19 of year 2003
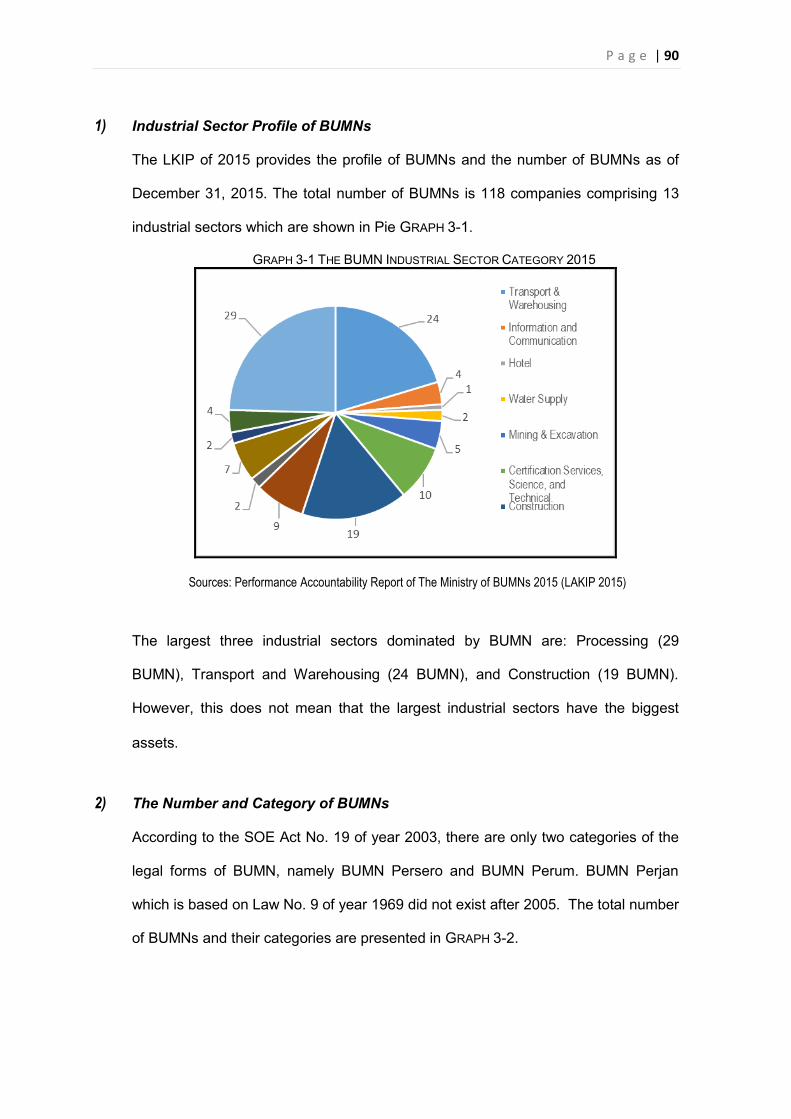
P a g e | 90
1) Industrial Sector Profile of BUMNs
The LKIP of 2015 provides the profile of BUMNs and the number of BUMNs as of
December 31, 2015. The total number of BUMNs is 118 companies comprising 13
industrial sectors which are shown in Pie GRAPH 3-1.
GRAPH 3-1 THE BUMN INDUSTRIAL SECTOR CATEGORY 2015
Sources: Performance Accountability Report of The Ministry of BUMNs 2015 (LAKIP 2015)
The largest three industrial sectors dominated by BUMN are: Processing (29
BUMN), Transport and Warehousing (24 BUMN), and Construction (19 BUMN).
However, this does not mean that the largest industrial sectors have the biggest
assets.
2) The Number and Category of BUMNs
According to the SOE Act No. 19 of year 2003, there are only two categories of the
legal forms of BUMN, namely BUMN Persero and BUMN Perum. BUMN Perjan
which is based on Law No. 9 of year 1969 did not exist after 2005. The total number
of BUMNs and their categories are presented in GRAPH 3-2.
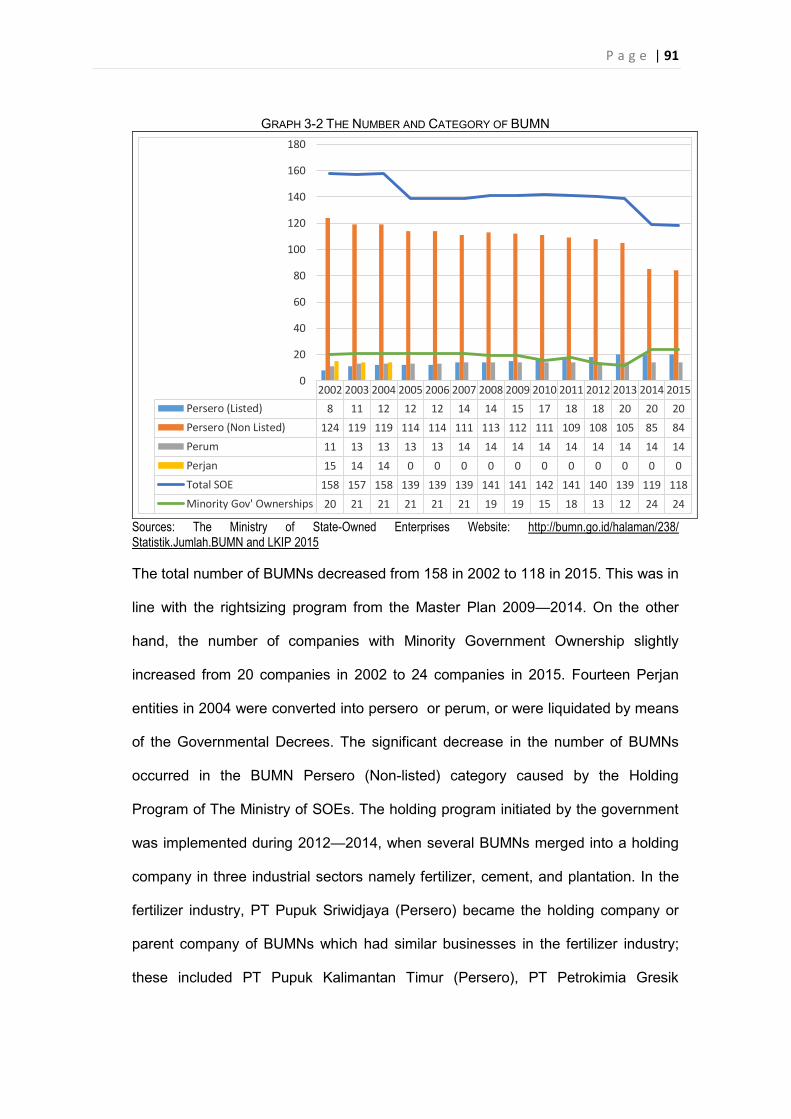
P a g e | 91
GRAPH 3-2 THE NUMBER AND CATEGORY OF BUMN
2002 2003 2004 2005 2006 2007 2008 2009 2010 2011 2012 2013 2014 2015Persero (Listed) 8 11 12 12 12 14 14 15 17 18 18 20 20 20Persero (Non Listed) 124 119 119 114 114 111 113 112 111 109 108 105 85 84Perum 11 13 13 13 13 14 14 14 14 14 14 14 14 14Perjan 15 14 14 0 0 0 0 0 0 0 0 0 0 0Total SOE 158 157 158 139 139 139 141 141 142 141 140 139 119 118Minority Gov' Ownerships 20 21 21 21 21 21 19 19 15 18 13 12 24 24
0
20
40
60
80
100
120
140
160
180
Sources: The Ministry of State-Owned Enterprises Website: http://bumn.go.id/halaman/238/ Statistik.Jumlah.BUMN and LKIP 2015 The total number of BUMNs decreased from 158 in 2002 to 118 in 2015. This was in
line with the rightsizing program from the Master Plan 2009—2014. On the other
hand, the number of companies with Minority Government Ownership slightly
increased from 20 companies in 2002 to 24 companies in 2015. Fourteen Perjan
entities in 2004 were converted into persero or perum, or were liquidated by means
of the Governmental Decrees. The significant decrease in the number of BUMNs
occurred in the BUMN Persero (Non-listed) category caused by the Holding
Program of The Ministry of SOEs. The holding program initiated by the government
was implemented during 2012—2014, when several BUMNs merged into a holding
company in three industrial sectors namely fertilizer, cement, and plantation. In the
fertilizer industry, PT Pupuk Sriwidjaya (Persero) became the holding company or
parent company of BUMNs which had similar businesses in the fertilizer industry;
these included PT Pupuk Kalimantan Timur (Persero), PT Petrokimia Gresik
P a g e | 92
(Persero), PT Kudjang (Persero), and PT Pupuk Iskandar Muda (Persero)35. Then,
PT Pupuk Sriwidjaya changed its name to PT Pupuk Indonesia Holding Company
(Persero).36 In the cement industry, PT Semen Gresik (Persero) Tbk became the
holding company or parent company of BUMNs which had similar business in the
cement industry; these included PT Semen Padang, and PT Semen Tonasa. On
December 12th, 2012, PT Semen Gresik (Persero) Tbk changed its name to PT
Semen Indonesia (Persero) Tbk. In the plantation industry, PT PN III became the
holding company or parent company of BUMNs which had similar business in the
plantation industry.37
3) Financial Profile of the BUMN for a decade of 2005--2014
All the financial profiles of BUMNs for a decade (2005—2014) show an increasing
trend. On the balance sheet side, the assets of BUMN over a decade had an almost
fourfold increase from 1,291 trillion rupiahs in 2005 to 4,577 trillion rupiahs in 2014,
but the liability and equity for the same period increased linearly with the assets. For
example, the liability increased from 921 trillion rupiahs in 2005 to 3,487 trillion
rupiahs in 2014, while the equity increased from 370 trillion rupiahs to 1,091 trillion
rupiahs in 2014. The financial profiles of BUMN assets and income statements for
the period of 2005—2014 are shown in GRAPH 3-3.
35 On August 7, 1997, the Government issued the Governmetal Decree number 28 of year 1997 to appoint indirectly PT Pupuk Sriwidjaya as a holding company for several BUMN in fertilizer. Then, in 1998 the share of ownership PT Mega Eltra was given to PT Pupuk Sriwidjaya, and in 2010 PT Pupuk Sriwidjaya spinned-off PT Pupuk Sriwidjaya Palembang into a unit production. 36 Based on the Ministerial Decree of Law and Hman Right of the Republic of Indonesia number AHU-17695.AH.01.02 of year 2012 37 The Government of Republic of Indonesia issued the Government Decree number 72 of year 2014 about The Additional Investment Capital of The Republic of Indonesia Into The Capital Stock of BUMN PT Perkebunan Nusantara III (PT PN III)
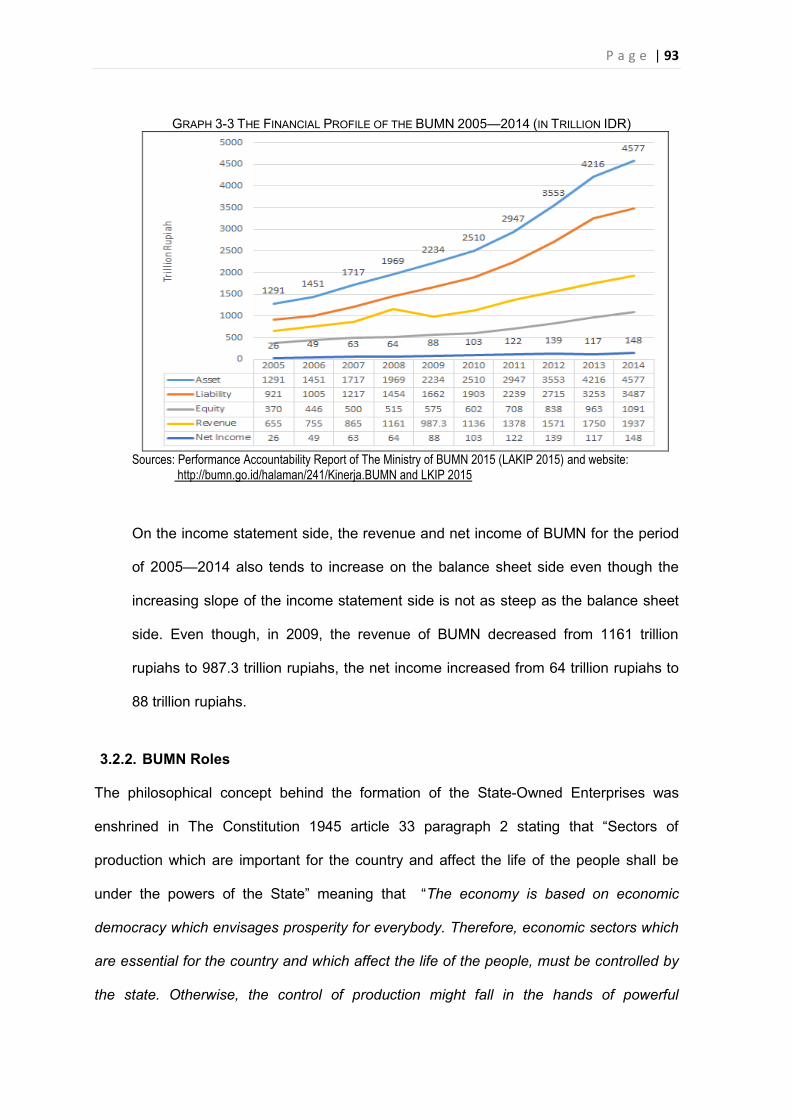
P a g e | 93
GRAPH 3-3 THE FINANCIAL PROFILE OF THE BUMN 2005—2014 (IN TRILLION IDR)
Sources: Performance Accountability Report of The Ministry of BUMN 2015 (LAKIP 2015) and website: http://bumn.go.id/halaman/241/Kinerja.BUMN and LKIP 2015
On the income statement side, the revenue and net income of BUMN for the period
of 2005—2014 also tends to increase on the balance sheet side even though the
increasing slope of the income statement side is not as steep as the balance sheet
side. Even though, in 2009, the revenue of BUMN decreased from 1161 trillion
rupiahs to 987.3 trillion rupiahs, the net income increased from 64 trillion rupiahs to
88 trillion rupiahs.
3.2.2. BUMN Roles
The philosophical concept behind the formation of the State-Owned Enterprises was
enshrined in The Constitution 1945 article 33 paragraph 2 stating that “Sectors of
production which are important for the country and affect the life of the people shall be
under the powers of the State” meaning that “The economy is based on economic
democracy which envisages prosperity for everybody. Therefore, economic sectors which
are essential for the country and which affect the life of the people, must be controlled by
the state. Otherwise, the control of production might fall in the hands of powerful
P a g e | 94
demographics who could exploit people. Hence; only enterprises which do not affect the
life of the general population may be left to private demographics”38. However, the
meaning of “under the powers of the state” was questioned and became a polemical issue
when the Electricity Law No.30 of year 2009 which enabled private sectors to enter the
electricity business (more liberal economic policy) was undergoing judicial review. The
arguments from all experts regarding this polemical issue in the judicial review process
were summarized by Ilyas (2011) as follows:
Mustafa Abubakar39, the Minister of SOE in the judicial review argues that
“under the powers of the state meaning that state as regulator, facilitator, and
operator which dynamically towards only as a regulator and facilitator. This
argument is accepted by the Constitutional Court;
The Constitutional Court40 interprets that “Under the powers of the State”
means that people collectively give a mandate to the State to establish
policies (beleid), acts of management (bestuursdaad), regulation
(regelendaad) and controlling (toezichthhoudensdaad) for maximizing of
people’s prosperity. Then, the Constitutional Court concluded that “the share-
ownership by the Government in business entity which relates to the sectors
of production which are important for the country and affect the lives of the
people, and as long as the government is the relative majority shareholder,
then the government legally remains in the position of determining the
decision-making of the business entity in question. The majority shareholder
38 Annotation of Constitution 1945 article 33 paragraph 2 39 Mustafa Abubakar is the 5th Minister of State-Owned Enterprise of Indonesia of the Second United Indonesia Cabinet, under President Susilo Bambang Yudhoyono Administration. 40The Decision, No 36/PUU-X/2012 (‘the Decision’) November 13th of 2012; http://www.mahkamahkonstitusi.go.id/public/content/persidangan/risalah/Putusan%2036.PUU-X.2012%20dan%20Perkara%20Nomor%2078,79,80,81,82.PHPU.D-X.2012,%2013%20November%202012.pdf
P a g e | 95
can be characterized as an absolute majority (> 50%) or as a relative majority
(< 50%).
Prof. Sri Edi Swasono41, senior economist from the University of Indonesia
who supports the people’s economy argues that from an imperative point of
view of a constitution, “under the powers of the state” must be followed
“having”, because, if it does not follow by “having”, then state control would
not be effective, more importantly in a globalization era (Court, 2013).
Dr. Muhammad Hatta, the founding father of Indonesia cooperative who was
also the former first vice president of the Republic of Indonesia provides a
loose explanation of the meaning of “under the powers of the state” in article
33 of Constitution 1945. According to Dr. Hatta, this does not mean that the
state becomes entrepreneur, businessman, or ordernemer42. It is better if
“under the powers of the state” is taken to mean that the state establishes
regulations to support economic development and prevent exploitation of the
weak by the capital owners (Magnar et al.).
In practice, the Government of Indonesia has the power to control the State-Owned
Enterprises listed in the Capital Market by issuing a golden share (Siahaan, 2005), called
a “Red—White share” (the color of the national flag), a share which has a privilege vote or
veto in: (i) nomination, appointment, and termination of directors; (ii) nomination,
appointment, and termination of commissioners; (iii) issuance of new shares; (iv) changes
in corporate charter; including merger, divestiture, increase in or decrease in authorized
capital or decrease in subscribed capital. The Government of the Republic of Indonesia
urged SOEs to become a developmental locomotive and make a real contribution to every
aspect of the national developmental agenda, through poverty alleviation programs, food
41 A former of a member of People’s Consultative Assembly of the Emissary Group Orde Baru Era. 42 Dutch Language meaning an Entrepreneur
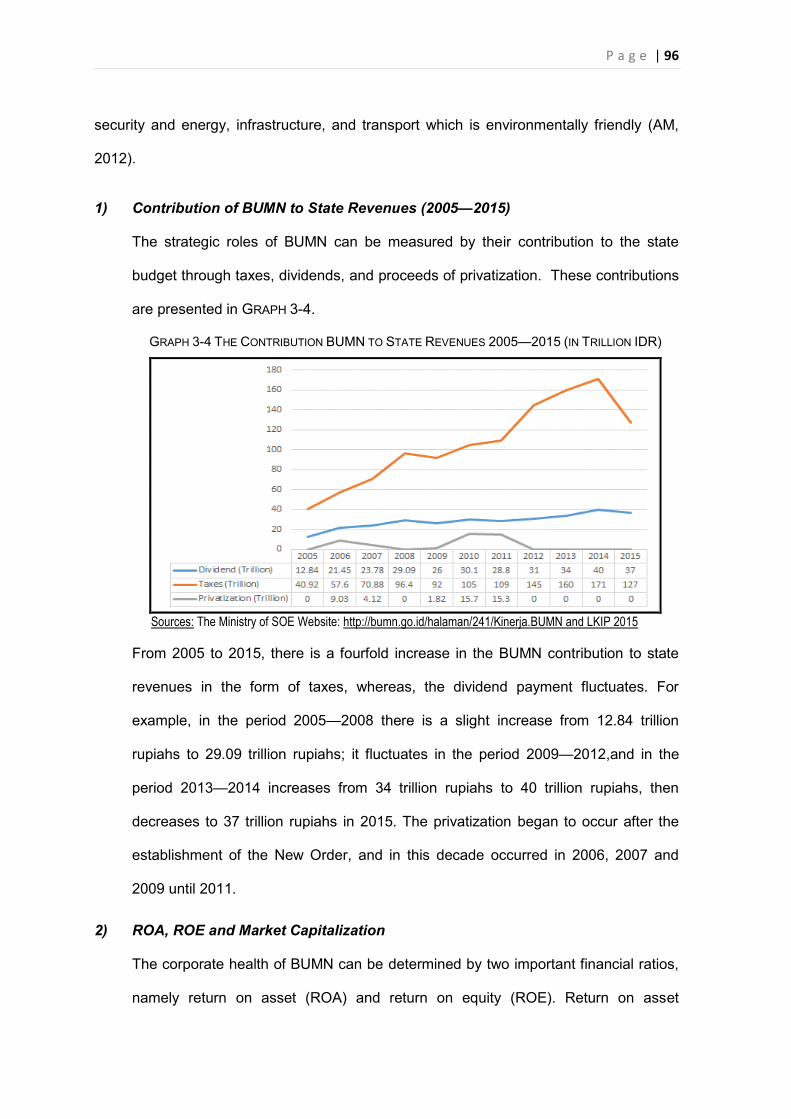
P a g e | 96
security and energy, infrastructure, and transport which is environmentally friendly (AM,
2012).
1) Contribution of BUMN to State Revenues (2005—2015)
The strategic roles of BUMN can be measured by their contribution to the state
budget through taxes, dividends, and proceeds of privatization. These contributions
are presented in GRAPH 3-4.
GRAPH 3-4 THE CONTRIBUTION BUMN TO STATE REVENUES 2005—2015 (IN TRILLION IDR)
Sources: The Ministry of SOE Website: http://bumn.go.id/halaman/241/Kinerja.BUMN and LKIP 2015
From 2005 to 2015, there is a fourfold increase in the BUMN contribution to state
revenues in the form of taxes, whereas, the dividend payment fluctuates. For
example, in the period 2005—2008 there is a slight increase from 12.84 trillion
rupiahs to 29.09 trillion rupiahs; it fluctuates in the period 2009—2012,and in the
period 2013—2014 increases from 34 trillion rupiahs to 40 trillion rupiahs, then
decreases to 37 trillion rupiahs in 2015. The privatization began to occur after the
establishment of the New Order, and in this decade occurred in 2006, 2007 and
2009 until 2011.
2) ROA, ROE and Market Capitalization
The corporate health of BUMN can be determined by two important financial ratios,
namely return on asset (ROA) and return on equity (ROE). Return on asset
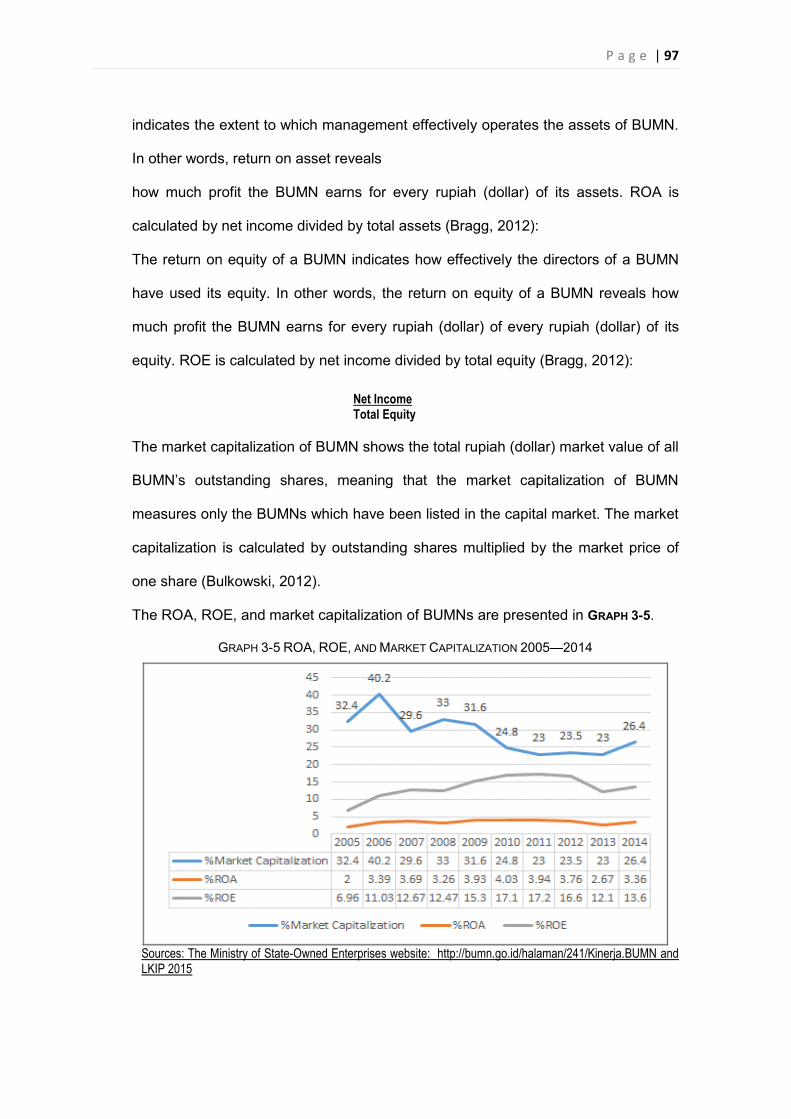
P a g e | 97
indicates the extent to which management effectively operates the assets of BUMN.
In other words, return on asset reveals
how much profit the BUMN earns for every rupiah (dollar) of its assets. ROA is
calculated by net income divided by total assets (Bragg, 2012):
The return on equity of a BUMN indicates how effectively the directors of a BUMN
have used its equity. In other words, the return on equity of a BUMN reveals how
much profit the BUMN earns for every rupiah (dollar) of every rupiah (dollar) of its
equity. ROE is calculated by net income divided by total equity (Bragg, 2012):
The market capitalization of BUMN shows the total rupiah (dollar) market value of all
BUMN’s outstanding shares, meaning that the market capitalization of BUMN
measures only the BUMNs which have been listed in the capital market. The market
capitalization is calculated by outstanding shares multiplied by the market price of
one share (Bulkowski, 2012).
The ROA, ROE, and market capitalization of BUMNs are presented in GRAPH 3-5.
GRAPH 3-5 ROA, ROE, AND MARKET CAPITALIZATION 2005—2014
Sources: The Ministry of State-Owned Enterprises website: http://bumn.go.id/halaman/241/Kinerja.BUMN and LKIP 2015
Net Income Total Equity
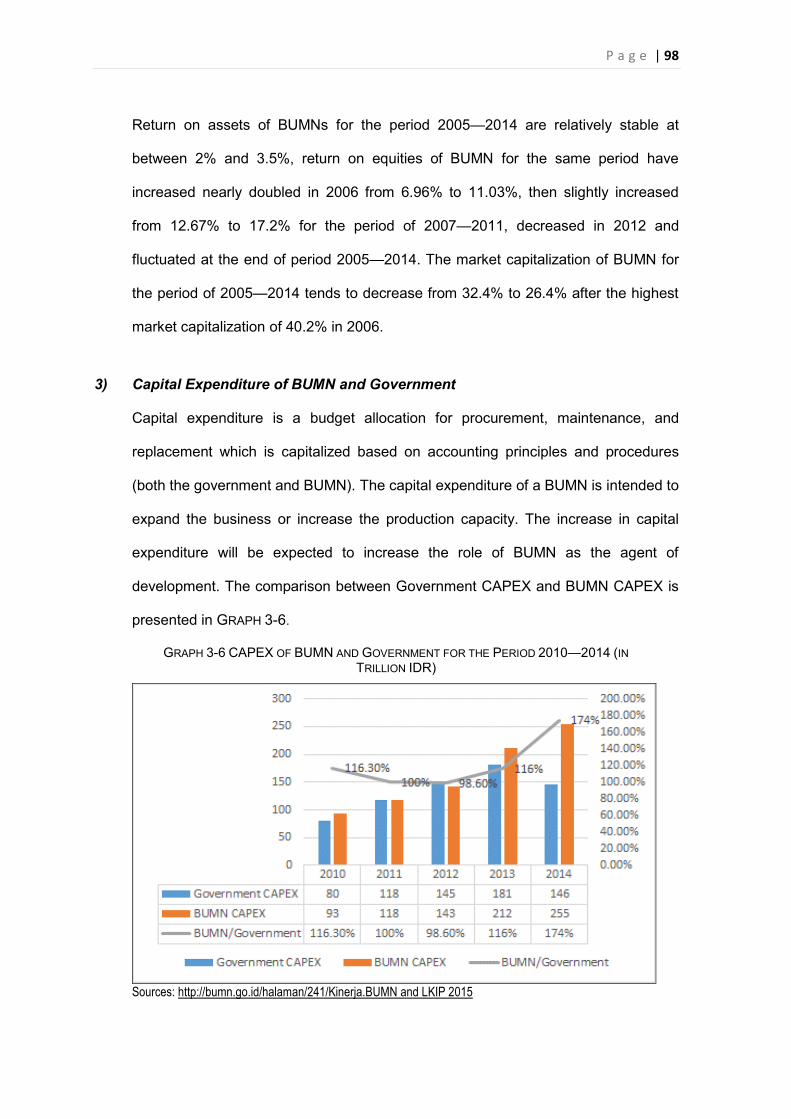
P a g e | 98
Return on assets of BUMNs for the period 2005—2014 are relatively stable at
between 2% and 3.5%, return on equities of BUMN for the same period have
increased nearly doubled in 2006 from 6.96% to 11.03%, then slightly increased
from 12.67% to 17.2% for the period of 2007—2011, decreased in 2012 and
fluctuated at the end of period 2005—2014. The market capitalization of BUMN for
the period of 2005—2014 tends to decrease from 32.4% to 26.4% after the highest
market capitalization of 40.2% in 2006.
3) Capital Expenditure of BUMN and Government
Capital expenditure is a budget allocation for procurement, maintenance, and
replacement which is capitalized based on accounting principles and procedures
(both the government and BUMN). The capital expenditure of a BUMN is intended to
expand the business or increase the production capacity. The increase in capital
expenditure will be expected to increase the role of BUMN as the agent of
development. The comparison between Government CAPEX and BUMN CAPEX is
presented in GRAPH 3-6.
GRAPH 3-6 CAPEX OF BUMN AND GOVERNMENT FOR THE PERIOD 2010—2014 (IN TRILLION IDR)
Sources: http://bumn.go.id/halaman/241/Kinerja.BUMN and LKIP 2015
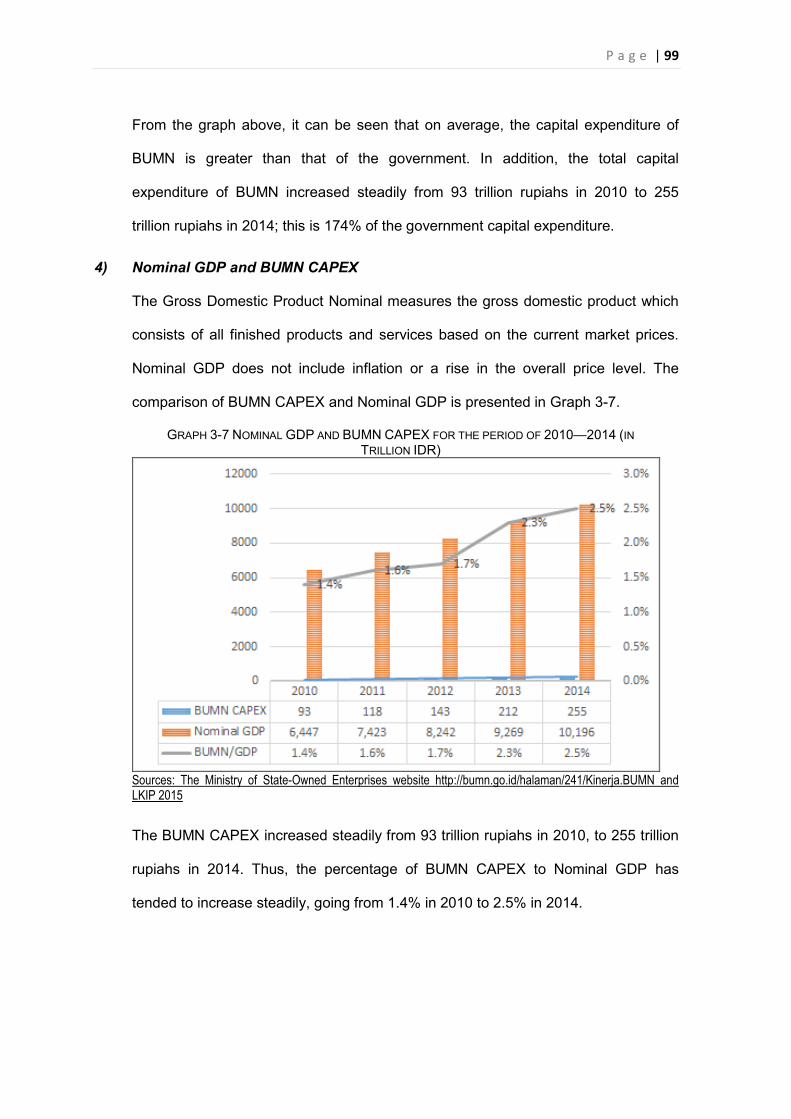
P a g e | 99
From the graph above, it can be seen that on average, the capital expenditure of
BUMN is greater than that of the government. In addition, the total capital
expenditure of BUMN increased steadily from 93 trillion rupiahs in 2010 to 255
trillion rupiahs in 2014; this is 174% of the government capital expenditure.
4) Nominal GDP and BUMN CAPEX
The Gross Domestic Product Nominal measures the gross domestic product which
consists of all finished products and services based on the current market prices.
Nominal GDP does not include inflation or a rise in the overall price level. The
comparison of BUMN CAPEX and Nominal GDP is presented in Graph 3-7.
GRAPH 3-7 NOMINAL GDP AND BUMN CAPEX FOR THE PERIOD OF 2010—2014 (IN TRILLION IDR)
Sources: The Ministry of State-Owned Enterprises website http://bumn.go.id/halaman/241/Kinerja.BUMN and LKIP 2015
The BUMN CAPEX increased steadily from 93 trillion rupiahs in 2010, to 255 trillion
rupiahs in 2014. Thus, the percentage of BUMN CAPEX to Nominal GDP has
tended to increase steadily, going from 1.4% in 2010 to 2.5% in 2014.
P a g e | 100
3.3. SCENARIO AND DIRECTION
3.3.1. Master Plan BUMN of 2005—2009 and 2010—2014
In the Master Plan BUMN of 2005—2009 and 2010—2014, there are three programs
intended to increase BUMN performance and shareholders’ value in managing BUMN
portfolios. These programs pertain to restructuring, revitalizing, and profit maximization.
The implementation of all three programs is expected to increase the direct contribution of
BUMN to the state revenues in the form of dividend payments and taxes, and indirectly in
the form of corporate social responsibility which they develop.
Since the establishment of the State-Owned Enterprises as a result of the nationalization
of the Dutch companies, a huge task for the government of the Republic of Indonesia has
been to empower the State-Owned Enterprises so they can contribute to the people’s
prosperity. The task was made more challenging when the majority of the State-Owned
Enterprises which were born from the nationalization process were not in a healthy
condition. The term ‘restructuring’ has become a buzzword among consultants, company
specialists, and organizational experts brought in to change and improve a company’s
situation. Restructuring is a multidimensional process and the form it takes will depend on
the company needs; hence, restructuring can have several forms. Nag and Pathak (2009)
gave examples of restructuring in the forms of mergers, acquisitions, or demergers; other
forms of restructuring are structural changes and undertaking resource optimization in the
organization. Furthermore, Gaughan (2011) provided more technical details, stating that
corporate restructuring covers issues such as divestitures, equity carve-outs, spin-offs,
split-offs, change-over, and split-ups. During the period of guided economy of the Old
Order era, after the nationalization of the Dutch companies, the government restructured
600s companies to form 223 (Nugroho and Wrihatnolo, 2008).
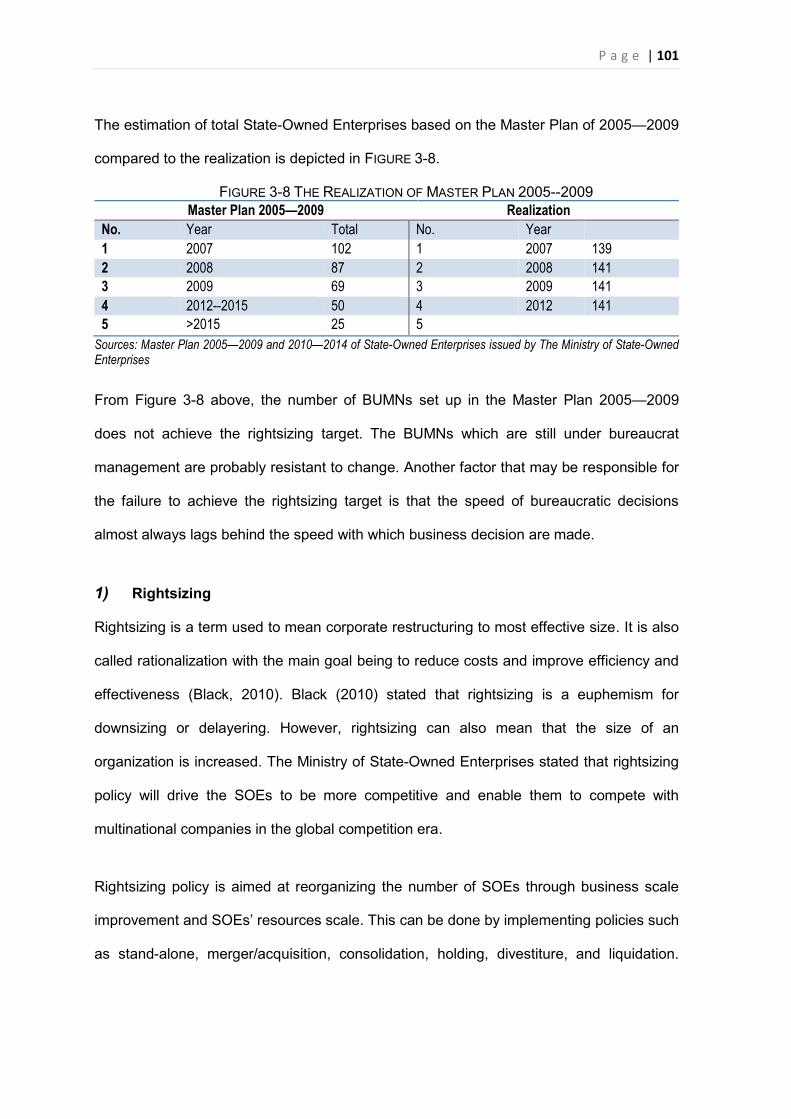
P a g e | 101
The estimation of total State-Owned Enterprises based on the Master Plan of 2005—2009
compared to the realization is depicted in FIGURE 3-8.
FIGURE 3-8 THE REALIZATION OF MASTER PLAN 2005--2009 Master Plan 2005—2009 Realization
No. Year Total No. Year 1 2007 102 1 2007 139 2 2008 87 2 2008 141 3 2009 69 3 2009 141 4 2012--2015 50 4 2012 141 5 >2015 25 5
Sources: Master Plan 2005—2009 and 2010—2014 of State-Owned Enterprises issued by The Ministry of State-Owned Enterprises
From Figure 3-8 above, the number of BUMNs set up in the Master Plan 2005—2009
does not achieve the rightsizing target. The BUMNs which are still under bureaucrat
management are probably resistant to change. Another factor that may be responsible for
the failure to achieve the rightsizing target is that the speed of bureaucratic decisions
almost always lags behind the speed with which business decision are made.
1) Rightsizing
Rightsizing is a term used to mean corporate restructuring to most effective size. It is also
called rationalization with the main goal being to reduce costs and improve efficiency and
effectiveness (Black, 2010). Black (2010) stated that rightsizing is a euphemism for
downsizing or delayering. However, rightsizing can also mean that the size of an
organization is increased. The Ministry of State-Owned Enterprises stated that rightsizing
policy will drive the SOEs to be more competitive and enable them to compete with
multinational companies in the global competition era.
Rightsizing policy is aimed at reorganizing the number of SOEs through business scale
improvement and SOEs’ resources scale. This can be done by implementing policies such
as stand-alone, merger/acquisition, consolidation, holding, divestiture, and liquidation.
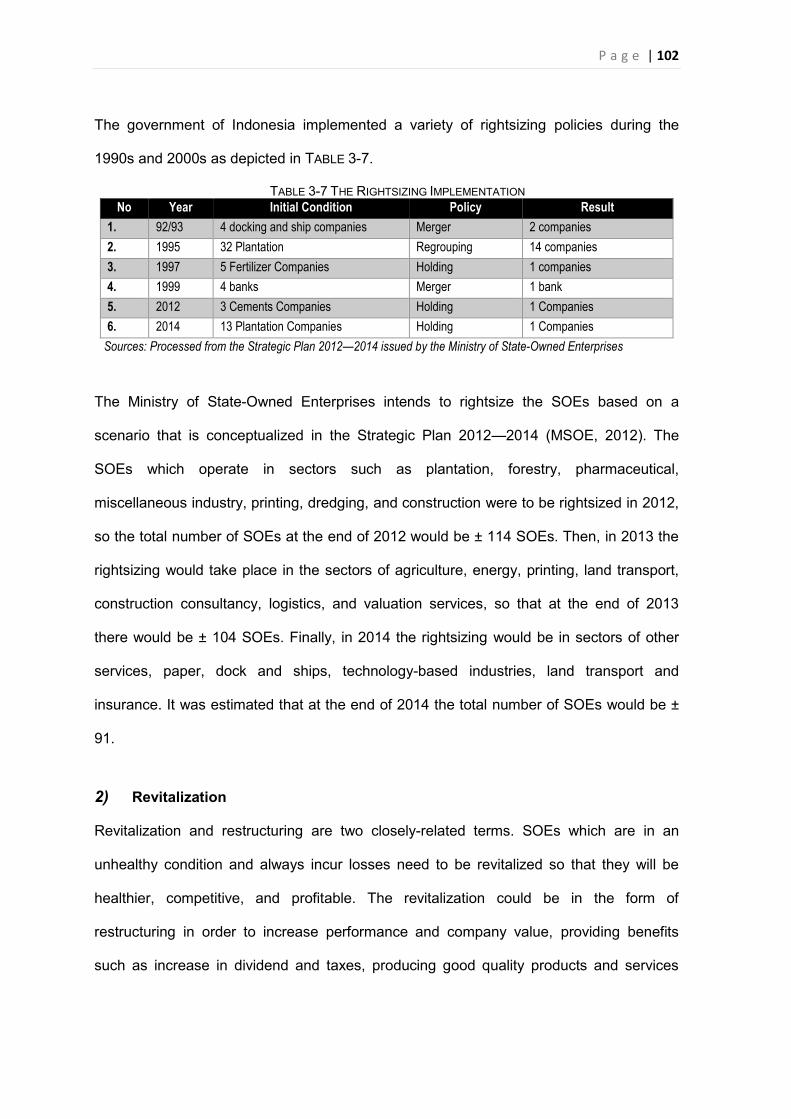
P a g e | 102
The government of Indonesia implemented a variety of rightsizing policies during the
1990s and 2000s as depicted in TABLE 3-7.
TABLE 3-7 THE RIGHTSIZING IMPLEMENTATION No Year Initial Condition Policy Result
1. 92/93 4 docking and ship companies Merger 2 companies 2. 1995 32 Plantation Regrouping 14 companies 3. 1997 5 Fertilizer Companies Holding 1 companies 4. 1999 4 banks Merger 1 bank 5. 2012 3 Cements Companies Holding 1 Companies 6. 2014 13 Plantation Companies Holding 1 Companies
Sources: Processed from the Strategic Plan 2012—2014 issued by the Ministry of State-Owned Enterprises
The Ministry of State-Owned Enterprises intends to rightsize the SOEs based on a
scenario that is conceptualized in the Strategic Plan 2012—2014 (MSOE, 2012). The
SOEs which operate in sectors such as plantation, forestry, pharmaceutical,
miscellaneous industry, printing, dredging, and construction were to be rightsized in 2012,
so the total number of SOEs at the end of 2012 would be ± 114 SOEs. Then, in 2013 the
rightsizing would take place in the sectors of agriculture, energy, printing, land transport,
construction consultancy, logistics, and valuation services, so that at the end of 2013
there would be ± 104 SOEs. Finally, in 2014 the rightsizing would be in sectors of other
services, paper, dock and ships, technology-based industries, land transport and
insurance. It was estimated that at the end of 2014 the total number of SOEs would be ±
91.
2) Revitalization
Revitalization and restructuring are two closely-related terms. SOEs which are in an
unhealthy condition and always incur losses need to be revitalized so that they will be
healthier, competitive, and profitable. The revitalization could be in the form of
restructuring in order to increase performance and company value, providing benefits
such as increase in dividend and taxes, producing good quality products and services
P a g e | 103
offered to consumers at competitive prices, and preparing adequately for privatization.43
According to a ministerial decree from the Minister of State-Owned Enterprise44, there are
several means of revitalizing and restructuring the SOEs, namely:
(1) Financial Restructuring: for example, restructuring the company debts and/or
adding equity which can be used by the SOEs for investment, working capital, or
buyback of promisaory notes or shares.
(2) Organization or management: for example, streamlining or merging the unit
business.
(3) Operational: for example, joint operation with a third party, acquisition, selling of
non-core or non-productive assets, or divestment.
(4) System and Procedures: for example, improving accounting procedures, internal
control and/or decision mechanisms.
3) Profit-maximization
The BUMN Master Plan 2010—2014 uses the term “profitization” to mean profit-
maximization. This profitization of the state-owned enterprise is an integral part of the
strategic plan of the Ministry of State Owned Enterprises2010-2014. This strategic plan
includes:
(1) Confirming that the selection processes of the state board are professional,
transparent, and objective;
(2) Determination of state laws and regulations implementing the legislation in
accordance with the Limited Liability Act and/or the Capital Market Protocol;
(3) Implementation of Good Governance and Good Corporate Governance;
43 Undang-Undang Nomor 19 Tahun 2003 Tentang Badan Usaha Milik Negara [Law No.19 of 2003 on State-Owned Enterprise] (Indonesia) art 72 (1) 44 Peraturan Menteri BUMN Nomor 1/MBU tahun 2009 dan 5/MBU tahun 2012 tentang restrukturisasi BUMN [The Ministerial Decree of The Minister of SOEs No.1/MBU of 2009 and 5/MBU of 2012] (Indonesia)
P a g e | 104
(4) Improved performance and competitiveness and sustainability of State-Owned
Enterprises;
(5) Improving the quality of public services;
(6) Enhancing the role of SOEs in promoting the implementation of national
development priorities;
(7) Privatization of state owned enterprises to improve competitiveness and
corporate value.
3.3.2. Road Map BUMN 2015-2019
This section summarizes the main points of the Road Map BUMN 2015—2019 and LKIP
2015 of The Ministry of BUMN which describes the scenario and direction of BUMN. In the
Performance Report of the Government Institution of the Ministry of BUMN 2015,
commonly known as the LKIP (Laporan Kinerja Instansi Pemerintah)45, the Roadmap
Framework of BUMN is based on the vision of BUMN as the agent of development and
value creation. This vision encompasses three main themes, namely The Strategic Pillars,
The Sectoral Roadmap, and The Organization Restructuring.
These three aspects of the vision will be achieved by applying strategic goals which are
formulated in the Key Performance Indicators enshrined in the LKIP of the Ministry of
BUMN. The LKIP 2015 of the Ministry of BUMN states that BUMN is directed to become
an optimal agent of development that is big, strong, and agile through 9 key performance
indicators, namely: (1) BUMN Asset, (2) BUMN Profit, (3) BUMN Equity, (4) BUMN
Capital Expenditure, (5) The Number of BUMN listed in the Global Fortune 500, (6) BUMN
Contribution to State Revenue (7) The Assessment of Performance Score of BUMN, (8)
45 The Government Institutions are obliged to provide a Performance Report called LKIP every year based on the Government Decree number 8 of year 2006 and the Presidential decree number 29 of year 2014, and technical guidance provided by the Ministerial Decree of the State Minister for the State Apparatus Reform
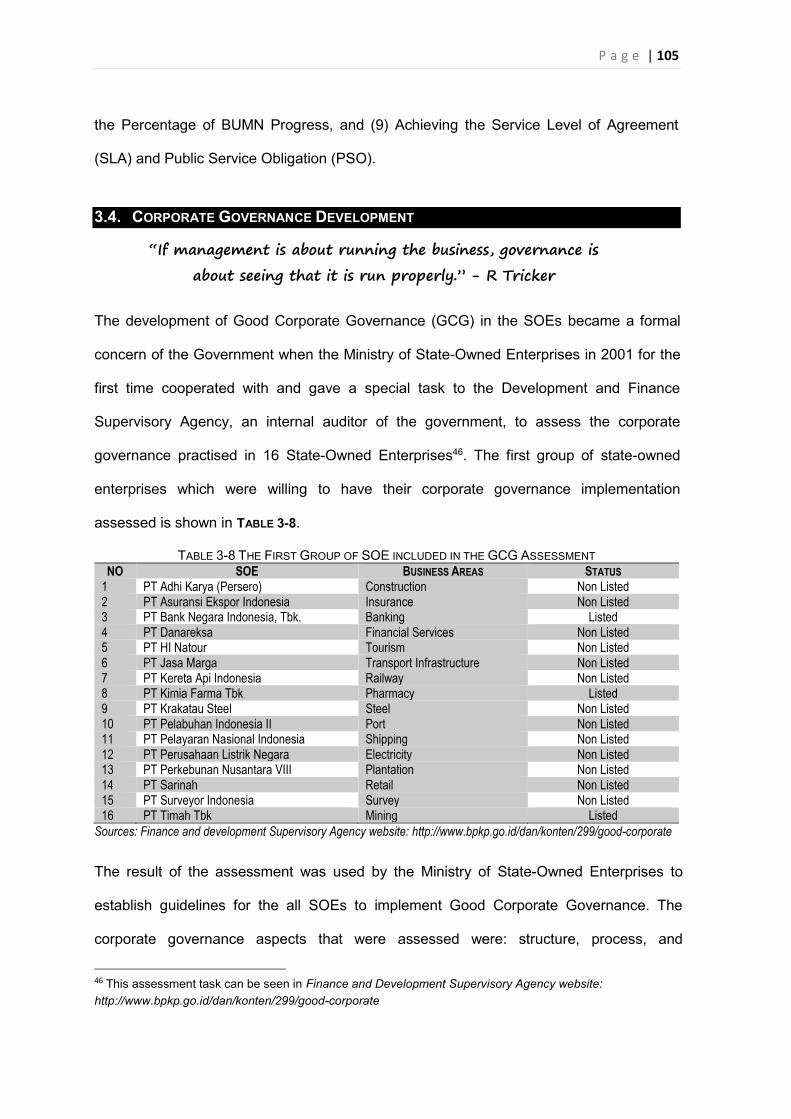
P a g e | 105
the Percentage of BUMN Progress, and (9) Achieving the Service Level of Agreement
(SLA) and Public Service Obligation (PSO).
3.4. CORPORATE GOVERNANCE DEVELOPMENT
“If management is about running the business, governance is about seeing that it is run properly.” - R Tricker
The development of Good Corporate Governance (GCG) in the SOEs became a formal
concern of the Government when the Ministry of State-Owned Enterprises in 2001 for the
first time cooperated with and gave a special task to the Development and Finance
Supervisory Agency, an internal auditor of the government, to assess the corporate
governance practised in 16 State-Owned Enterprises46. The first group of state-owned
enterprises which were willing to have their corporate governance implementation
assessed is shown in TABLE 3-8.
TABLE 3-8 THE FIRST GROUP OF SOE INCLUDED IN THE GCG ASSESSMENT NO SOE BUSINESS AREAS STATUS
1 PT Adhi Karya (Persero) Construction Non Listed 2 PT Asuransi Ekspor Indonesia Insurance Non Listed 3 PT Bank Negara Indonesia, Tbk. Banking Listed 4 PT Danareksa Financial Services Non Listed 5 PT HI Natour Tourism Non Listed 6 PT Jasa Marga Transport Infrastructure Non Listed 7 PT Kereta Api Indonesia Railway Non Listed 8 PT Kimia Farma Tbk Pharmacy Listed 9 PT Krakatau Steel Steel Non Listed 10 PT Pelabuhan Indonesia II Port Non Listed 11 PT Pelayaran Nasional Indonesia Shipping Non Listed 12 PT Perusahaan Listrik Negara Electricity Non Listed 13 PT Perkebunan Nusantara VIII Plantation Non Listed 14 PT Sarinah Retail Non Listed 15 PT Surveyor Indonesia Survey Non Listed 16 PT Timah Tbk Mining Listed
Sources: Finance and development Supervisory Agency website: http://www.bpkp.go.id/dan/konten/299/good-corporate
The result of the assessment was used by the Ministry of State-Owned Enterprises to
establish guidelines for the all SOEs to implement Good Corporate Governance. The
corporate governance aspects that were assessed were: structure, process, and
46 This assessment task can be seen in Finance and Development Supervisory Agency website: http://www.bpkp.go.id/dan/konten/299/good-corporate
P a g e | 106
commitment of the governing body of SOEs. Overall, the result showed that those
corporate governance aspects needed to be improved. The results of the assessment
gave inputs for the Ministry of State Owned Enterprise to prepare corporate governance
guidelines. The Ministerial Decree No. KEEP-117/M-MBU/2002 pertaining to the
implementation of Good Corporate Governance Practice in State-Owned Enterprises was
issued to ensure that the guidelines were followed.
3.4.1. The Separation of Powers, Legal System, and Board Model in Indonesia
1) The Separation of Powers
The separation of powers was conceptualized by Aristotle, the Greek philosopher (384—
322 B.C.). It became a model for the governance of a state that was used for the first time
by Ancient Greece and Rome, and has had worldwide influence (Brookes, 1951). This
concept was redeveloped by John Locke (1632—1704) in his book titled Two Treatises of
Government (Locke, 1947), and refined by Montesquieu (1689—1755) (Krause, 2000)
and popularly known in political science as Trias Politica, namely legislature, executive
and judiciary (Labuschagne, 2006). The legislature enacts laws; the executive implements
the legislation; and the judiciary interprets the law and metes out punishment to those who
disobey the law.
Indonesia enshrined this concept in the 1945 Constitution of the Republic of Indonesia in
Chapter VII on The People’s Representative Council (Dewan Perwakilan Rakyat or
DPR), article 20 paragraph (1) stated that “the DPR shall hold the authority to establish
the law”. Then, In Chapter III on The Executive Power, article 4 paragraph (1) states that
“The President of the Republic of Indonesia shall hold the power of government in
P a g e | 107
accordance with the Constitution”. The judiciary concept is enshrined in Chapter IX on
The Judicial Powers, article 24.47
2) Legal System
Essentially, the legal system in Indonesia is influenced by three legal systems, namely the
western laws, the Islamic law, and the customary laws. The Indonesian legal system is
akin to the European system of law commonly called the Civil Law System (Achmad
Santosa, 2009). This is because Indonesia was under the legal system introduced by the
colonial administration of the Dutch when the Dutch colonized Indonesia for almost 3.5
centuries. According to article 24 paragraph (2) of the 1945 Constitution, the judicial
power shall be carried out by a Supreme Court and its subordinate judicatory bodies,
namely general courts, religious courts, military courts, administrative courts, and
constitutional court.
The legislation order is regulated in accordance with Law No.12 of 2011 for the
establishment of legislation regulation, type and hierarchy of legislation. This law
established the sequence of legislation as follows:
(1) The Constitution 1945 of the Republic of Indonesia;
(2) Provision of the People’s Consultative Assembly;
(3) Law and Government Regulation in Lieu of Law;
(4) Government Regulation;
(5) Presidential Regulation;
(6) Provincial Regulation; and
(7) District Regulation. 47 Paragraph (1): “The judicial powers shall be independent with the authority to organize the judicature in order to uphold law and justice”; Paragraph (2): “The Judicial powers shall be carried out by a Supreme Court and by its subordinate judicatory bodies dealing with general, religious, military, state administrative judicial fields, and by a constitutional court”.
P a g e | 108
3) The Legal Basis of the State-Owned Enterprises for Operational Activities
The 1945 Constitution of the Republic of Indonesia is the legal basis for the SOE
establishment which is enshrined in article 33 paragraphs 1,2,3,4 and 5.48 Then, further
elaboration of the purposes and the goals of SOE establishment were enshrined in the
SOE Act No.19/2003 article 2 (see FIGURE 3-9). The purposes and the goals are (1) to
contribute to the development of the national economy in general and the state income
especially; (2) profit motive; (3) to organize the public need in the form of supplying a high
quality of goods and/or services and adequate for the fulfillment of the most people; (4) to
be a pioneer in business activity that cannot be done by the private sectors and
cooperatives; (5) to participate actively in providing a guidance and an assistance to weak
entrepreneurs, small enterprises, cooperatives and society.
To achieve these purposes and the goals, the SOE must follow several laws: (1) SOE Act
No.19/2003; (2) Limited Liability Act No.40/2007; (3) the packet of the Financial State
Laws; (4) Capital Market Law No.8/1995; (5) Sector regulation; (6) Government Degree
No.41/2003. The Corporate Act No.40/2007 and the SOE Act No.19/2003 define the
board model applied to SOEs.
48 Paragraph 1: “The economy shall be organized as a common endeavour based upon the principles of the family system”; paragraph 2: “Sector of production which are important for the country and affect the life of the people shall be under the power of the State”; paragraph 3: “The land, the waters and the natural resources within shall be under the powers of the State and shall be used to the greatest benefit of the people”; paragraph 4:“The organisation of the national economy shall be conducted on the basis of economic democracy upholding the principles of togetherness, efficiency with justice, continuity, environmental perspective, self-sufficiency, and keeping a balance in the progress and unity of the national economy”; paragraph 5: “Further provisions relating to the implementation of this article shall be regulated by law”.
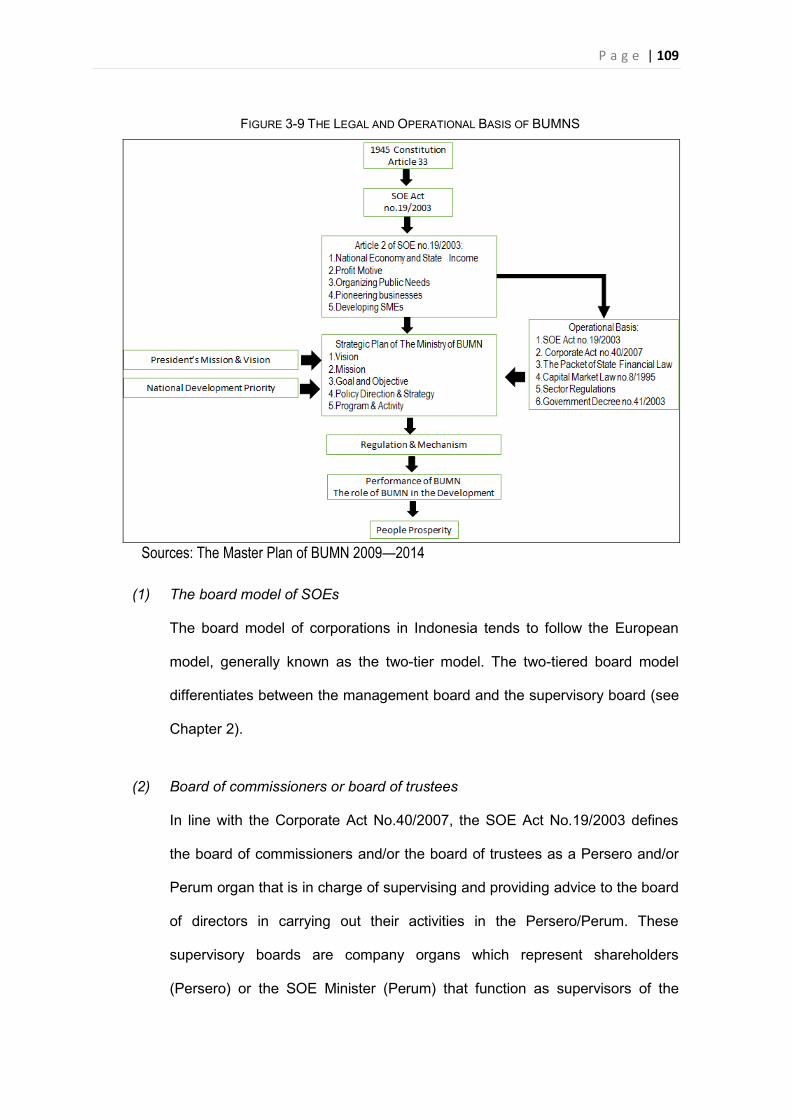
P a g e | 109
FIGURE 3-9 THE LEGAL AND OPERATIONAL BASIS OF BUMNS
Sources: The Master Plan of BUMN 2009—2014
(1) The board model of SOEs
The board model of corporations in Indonesia tends to follow the European
model, generally known as the two-tier model. The two-tiered board model
differentiates between the management board and the supervisory board (see
Chapter 2).
(2) Board of commissioners or board of trustees
In line with the Corporate Act No.40/2007, the SOE Act No.19/2003 defines
the board of commissioners and/or the board of trustees as a Persero and/or
Perum organ that is in charge of supervising and providing advice to the board
of directors in carrying out their activities in the Persero/Perum. These
supervisory boards are company organs which represent shareholders
(Persero) or the SOE Minister (Perum) that function as supervisors of the
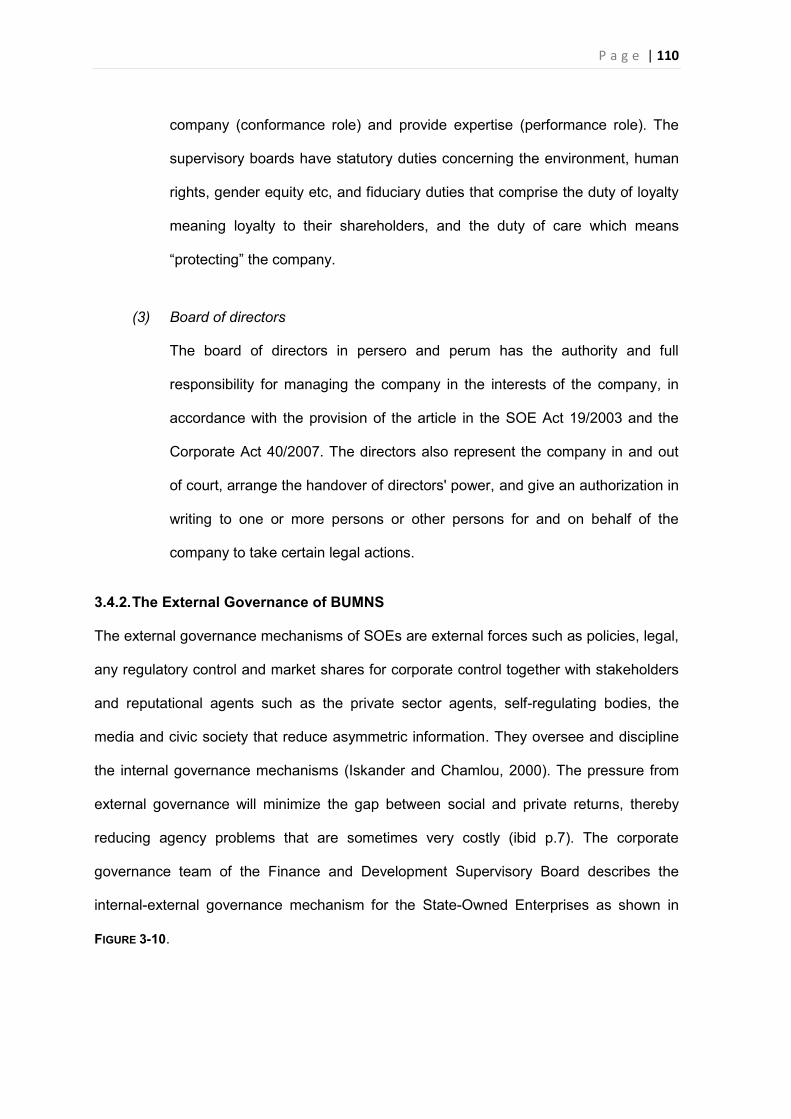
P a g e | 110
company (conformance role) and provide expertise (performance role). The
supervisory boards have statutory duties concerning the environment, human
rights, gender equity etc, and fiduciary duties that comprise the duty of loyalty
meaning loyalty to their shareholders, and the duty of care which means
“protecting” the company.
(3) Board of directors
The board of directors in persero and perum has the authority and full
responsibility for managing the company in the interests of the company, in
accordance with the provision of the article in the SOE Act 19/2003 and the
Corporate Act 40/2007. The directors also represent the company in and out
of court, arrange the handover of directors' power, and give an authorization in
writing to one or more persons or other persons for and on behalf of the
company to take certain legal actions.
3.4.2. The External Governance of BUMNS
The external governance mechanisms of SOEs are external forces such as policies, legal,
any regulatory control and market shares for corporate control together with stakeholders
and reputational agents such as the private sector agents, self-regulating bodies, the
media and civic society that reduce asymmetric information. They oversee and discipline
the internal governance mechanisms (Iskander and Chamlou, 2000). The pressure from
external governance will minimize the gap between social and private returns, thereby
reducing agency problems that are sometimes very costly (ibid p.7). The corporate
governance team of the Finance and Development Supervisory Board describes the
internal-external governance mechanism for the State-Owned Enterprises as shown in
FIGURE 3-10.
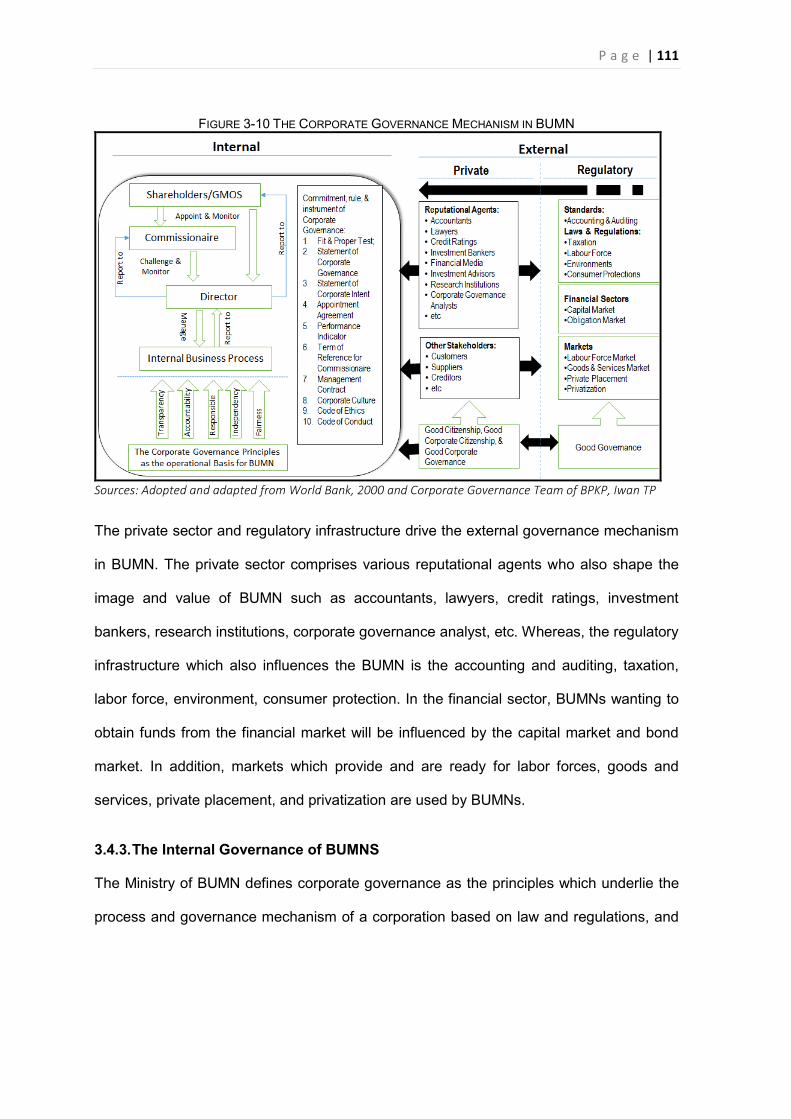
P a g e | 111
FIGURE 3-10 THE CORPORATE GOVERNANCE MECHANISM IN BUMN
Sources: Adopted and adapted from World Bank, 2000 and Corporate Governance Team of BPKP, Iwan TP
The private sector and regulatory infrastructure drive the external governance mechanism
in BUMN. The private sector comprises various reputational agents who also shape the
image and value of BUMN such as accountants, lawyers, credit ratings, investment
bankers, research institutions, corporate governance analyst, etc. Whereas, the regulatory
infrastructure which also influences the BUMN is the accounting and auditing, taxation,
labor force, environment, consumer protection. In the financial sector, BUMNs wanting to
obtain funds from the financial market will be influenced by the capital market and bond
market. In addition, markets which provide and are ready for labor forces, goods and
services, private placement, and privatization are used by BUMNs.
3.4.3. The Internal Governance of BUMNS
The Ministry of BUMN defines corporate governance as the principles which underlie the
process and governance mechanism of a corporation based on law and regulations, and
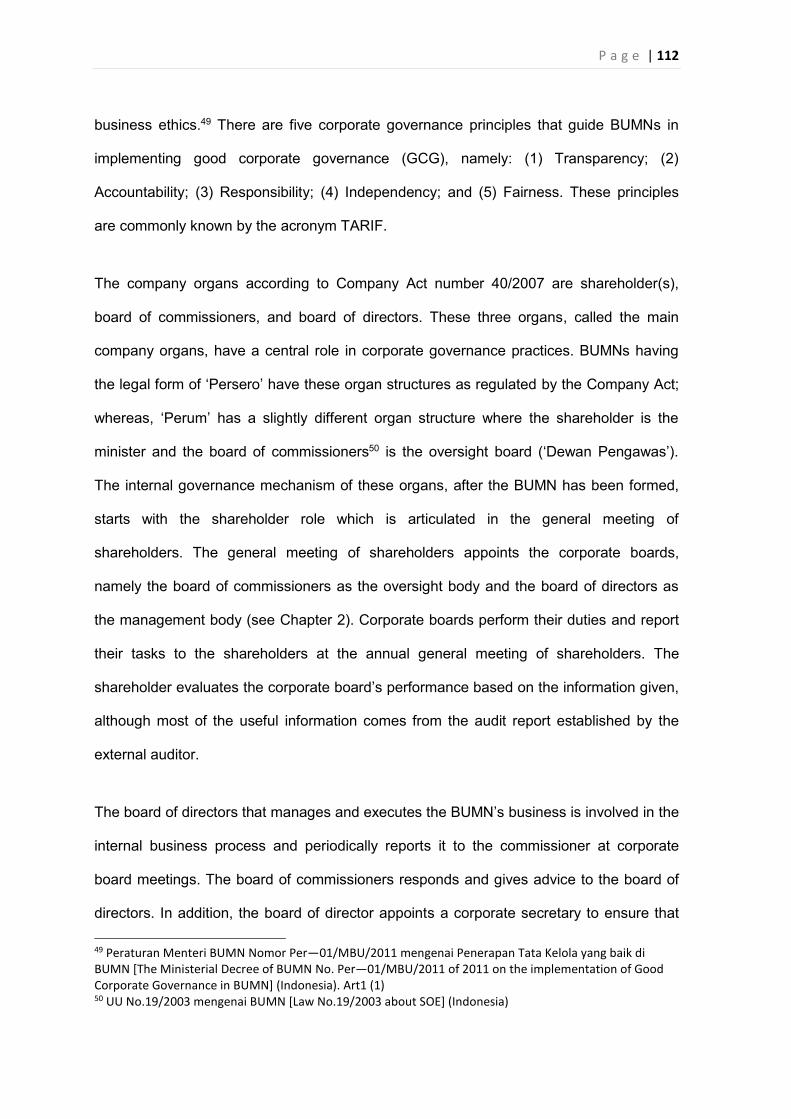
P a g e | 112
business ethics.49 There are five corporate governance principles that guide BUMNs in
implementing good corporate governance (GCG), namely: (1) Transparency; (2)
Accountability; (3) Responsibility; (4) Independency; and (5) Fairness. These principles
are commonly known by the acronym TARIF.
The company organs according to Company Act number 40/2007 are shareholder(s),
board of commissioners, and board of directors. These three organs, called the main
company organs, have a central role in corporate governance practices. BUMNs having
the legal form of ‘Persero’ have these organ structures as regulated by the Company Act;
whereas, ‘Perum’ has a slightly different organ structure where the shareholder is the
minister and the board of commissioners50 is the oversight board (‘Dewan Pengawas’).
The internal governance mechanism of these organs, after the BUMN has been formed,
starts with the shareholder role which is articulated in the general meeting of
shareholders. The general meeting of shareholders appoints the corporate boards,
namely the board of commissioners as the oversight body and the board of directors as
the management body (see Chapter 2). Corporate boards perform their duties and report
their tasks to the shareholders at the annual general meeting of shareholders. The
shareholder evaluates the corporate board’s performance based on the information given,
although most of the useful information comes from the audit report established by the
external auditor.
The board of directors that manages and executes the BUMN’s business is involved in the
internal business process and periodically reports it to the commissioner at corporate
board meetings. The board of commissioners responds and gives advice to the board of
directors. In addition, the board of director appoints a corporate secretary to ensure that 49 Peraturan Menteri BUMN Nomor Per—01/MBU/2011 mengenai Penerapan Tata Kelola yang baik di BUMN [The Ministerial Decree of BUMN No. Per—01/MBU/2011 of 2011 on the implementation of Good Corporate Governance in BUMN] (Indonesia). Art1 (1) 50 UU No.19/2003 mengenai BUMN [Law No.19/2003 about SOE] (Indonesia)
P a g e | 113
the BUMN obeys the law, to provide timely information to the corporate boards, to act as a
liaison officer and to administer the corporate documents51. The interaction among the
main organs of BUMN corporate governance, namely the shareholder, commissioners,
and directors is depicted in FIGURE 3-11.
FIGURE 3-11 THE INTERNAL MECHANISM OF CORPORATE GOVERNANCE IN BUMN
Sources: adapted from the Fundamental of Corporate Governance, Corporate Governance Team of BPKP
The internal mechanism of corporate governance of a BUMN involves commitment, rules
and instruments of corporate governance. There are several rules that govern the BUMN
including corporate policy, code of corporate governance, code of conduct, code of ethics,
board manual, management policy, standard operating procedures, and working
instructions (see also Armstrong (2004)).
3.4.4. Structure and Process
The ministerial decree of BUMN number 117/M-MBU/2002 regarding the implementation
of good corporate governance practice in BUMN which was refined by the ministerial
decree of BUMN number Per—01/MBU/2011, clearly states that coporate governance is
51 Ibid 29
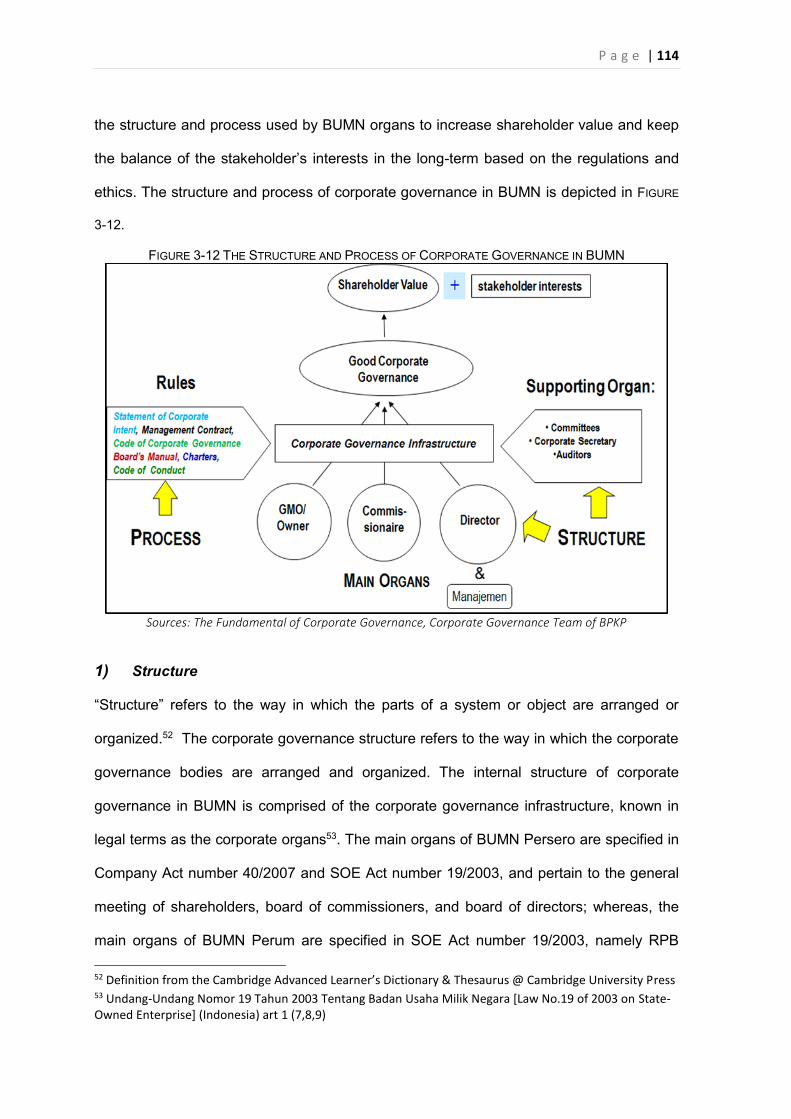
P a g e | 114
the structure and process used by BUMN organs to increase shareholder value and keep
the balance of the stakeholder’s interests in the long-term based on the regulations and
ethics. The structure and process of corporate governance in BUMN is depicted in FIGURE
3-12.
FIGURE 3-12 THE STRUCTURE AND PROCESS OF CORPORATE GOVERNANCE IN BUMN
Sources: The Fundamental of Corporate Governance, Corporate Governance Team of BPKP
1) Structure
“Structure” refers to the way in which the parts of a system or object are arranged or
organized.52 The corporate governance structure refers to the way in which the corporate
governance bodies are arranged and organized. The internal structure of corporate
governance in BUMN is comprised of the corporate governance infrastructure, known in
legal terms as the corporate organs53. The main organs of BUMN Persero are specified in
Company Act number 40/2007 and SOE Act number 19/2003, and pertain to the general
meeting of shareholders, board of commissioners, and board of directors; whereas, the
main organs of BUMN Perum are specified in SOE Act number 19/2003, namely RPB 52 Definition from the Cambridge Advanced Learner’s Dictionary & Thesaurus @ Cambridge University Press 53 Undang-Undang Nomor 19 Tahun 2003 Tentang Badan Usaha Milik Negara [Law No.19 of 2003 on State-Owned Enterprise] (Indonesia) art 1 (7,8,9)
P a g e | 115
(Rapat Pembahasan Bersama) or Joint Discussion Meeting similar to the general meeting
of shareholders in Persero, Dewan Pengawas or the oversight body similar to the board of
commissioners in persero, and board of directors. The main organs are supported by
supplementary organs which are appointed by the board of commissioners called
commissioner committees54, and by the board of directors called director committees,
corporate secretary, internal audit, and management. In addition, as a part of the external
governance mechanism, (see 3.4.2.) the external auditor is also included in the supporting
organs of corporate governance in BUMN. External auditor will be appointed by the board
of commissioners using a bidding process to perform the financial and operational audits
of the company activities which are managed by the board of directors.
2) Process
The process of corporate governance which involves the main organ of BUMN is required
to obey several rules which are usually enshrined in corporate policies such as Corporate
Charter, Code of Corporate Governance, Code of Ethics and Conduct, Management
Contract, and Board Manual. The supporting organs also have charters to guide their
tasks, such as a committee audit charter, internal audit charter, corporate secretary
charter, etc. The corporate governance process that is enshrined in the corporate policies
can include board meetings, coordination, planning and budget approval, and a feedback
system. The guidelines for board meetings can adopt Francis and Armstrong (2012).
3.4.5. Linking the Corporate Board with the Bureaucracy as “shareholding agent”
BUMNs emerged as a result of article 33 (2) of the Constitution 1945 which stated that
“Production sectors that are vital to the state and that affect the livelihood of a
considerable part of the population are to be controlled by the state”. The legal aspects of
BUMN derived from the Constitution 1945 are explained in section 3.4.1 point 3). Before
the Ministry of BUMN was established, all supervision and guidance of BUMN was 54 For example, the ministerial decree of BUMN No. Kep. 103/MBU/2002 perfected with PER-05/MBU/2006, guides the establishment of the audit committee.
P a g e | 116
performed by the Ministry of Finance. Then, in order to empower and optimize the
BUMNs’ contribution to national economic development, the Government of the Republic
of Indonesia formed the Ministry of BUMN to supervise and guide BUMNs (see sections
3.2.3. and 3.2.4.).55 The Minister of Finance gave to the Minister of BUMN, as a BUMN
shareholder, the position, authority and several duties 56. However, this delegation of
position, duties and authority was not included in the administration of any capital state
participation including any amendment to BUMNs; the proposal of capital state
participation in BUMNs originated from the state budget, and from already-established
BUMNs57.
The Ministry of BUMN has a unique position which is quite unlike those of any other
government ministries in Indonesia. On the one hand, the Ministry of BUMN follows the
bureaucratic system which applies the public governance principles and, on the other
hand, it also implements corporate governance principles in its role as a BUMN
shareholder. Therefore, the Ministry of BUMN could be considered as a “shareholding
agent”58. This position very often creates ambiguity when deciding the government
programs that may impact on profit and investment in BUMN. Said Didu59 argued that the
Ministry of BUMN caused the BUMN to become more bureaucratic and also prone to
intervention. Therefore, he proposed to form the super holding BUMN to replace the role
of the Ministry of BUMN (Agustinus, 2016). Vernon (1984) stated that the government
wants to reap benefits from state-owned enterprises. He believed that State-Owned
Enterprises should be an autonomous institution. However, at the same time, the
55 Peraturan Pemerintah Nomor 41 Tahun 2003 Tentang Pelimpahan kedudukan, tugas dan kewenangan menteri keuangan pada Perusahaan Perseroan (Persero), Perusahaan Umum (Perum) dan Perusahaan Jawatan (Perjan) [Government Regulation No.41 of 2003 on the delegation of the position, duties and authority the Minister of Finance on BUMN) (Indonesia) 56Ibid Art.1 57 Ibid Art.3 (1) 58 The new terminology proposed in this research as the position of agent who is delegated as shareholder with all rights and obligations enshrined in the company act No.40/2007. 59 The former Chief Secretary of the Ministry of BUMN of 2005-2010
P a g e | 117
government demands that State-Owned Enterprises run their business so as to achieve
certain government goals.
As a bureaucrat and at the same time as an operator and delegated shareholder of
BUMN, the Ministry of BUMN is responsible for creating a climate conducive to the growth
and development of BUMN in order to achieve the vision and mission of BUMN. The
Ministry of BUMN as the bureaucrat and operator of BUMN, issues the ministerial decrees
which are applied to all BUMNs. For example, ministerial decrees may pertain to the
procedure for appointing commissioners and directors who are fit and proper60, the
appointment agreement and management contract between the corporate board and its
shareholders, the assessment of BUMN’s performance and corporate governance
implementation61, the guidelines for financial accountability implementation for BUMN62,
etc. Whereas, as a BUMN shareholder, the Ministry of BUMN represents the government
at the annual general meeting of shareholders which usually approves the annual plan,
releases and discharges commissioners and directors for the financial statements related
to their services throughout the financial year, the remuneration and facilities given to
commissioners and directors, and other items on the agenda. Furthermore, the Ministry of
BUMN also represents the government in any extraordinary meeting of shareholders
which is usually related to a dismissal and the appointment of a new member of the
boards of commissioners and directors.
60 Peraturan menteri BUMN Nomor PER-03/MBU/02/2015 tentang persyaratan, tata cara pengangkatan, dan pemberhentian anggota direksi badan usaha milik negara [The Ministerial Decree of BUMN No.PER-03/MBU/02/2015 on the requirements, procedures for appointment and dismissal of director of the State-Owned Enterprise] 61 Peraturan menteri BUMN Nomor PER-01/MBU/2011 tentang penerapan tata kelola yang baik [The Ministerial Decree of BUMN No.PER-01/MBU/2011 on good corporate governance practice] 62 Peraturan menteri BUMN Nomor PER-21/MBU/2012 tentang pedoman penerapan akuntabilitas keuangan BUMN [The Ministerial Decree of BUMN No.PER-21/MBU/2012 on the Guidance of Financial accountability implementation of BUMN]
P a g e | 118
3.5. THE CONTEXT OF PARENT AND SUBSIDIARY RELATIONSHIP OF BUMN WITH THE GOVERNMENT
As regulated by company law, the parent company and any subsidiary company which are
limited liability companies operating in Indonesia, must follow the two-tiered board model.
However, the State-Owned Enterprise as a parent company has the power to decide
whether the composition of the board of commissioners in the subsidiary company
includes no-one from the parent company. The parent company may decide otherwise, in
which case it is possible to have several commissioners in the subsidiary company who
have been transferred from the parent company’s board of directors (the board member
duality structure).
3.5.1. The level of entity involvement and governance structure
There are three important entities that should be involved in the parent-subsidiary
relationship, namely the government as shareholder of SOEs, the State-Owned Enterprise,
and the subsidiary company. If contextualized broadly in terms of the principal-agency
theory which involves the public (society) as the real residual claimant, then this will create
three layers in the governance structure. The first layer in the governance structure is the
public as the principal and the government as the agent (Anwar and Sam, 2006). The
second layer comprises the government as the principal and the corporate board of BUMN
as the agent. The third layer in the governance structure is the BUMN as the principal and
corporate board of the subsidiary company is the agent.
1) Public Society
The public elect the president. Then, in turn the elected president will form the government
to run the country on the public’s behalf based on the Constitution. The public expects the
government to increase the public prosperity by means of all state instruments, including
the State-Owned Enterprises, as stated explicitly in article 33 of the Constitution 1945.
Hence, the government as an agent is expected to empower BUMN to operate based on
P a g e | 119
good corporate governance principles, and in turn this will contribute to society’s
prosperity.
2) The Government
The first entity is the government; based on the State Financial Law No.17/2003, the
central government is the owner of the SOEs63. The central government ownership of SOE
shares can be a minority, majority or 100% of shares, and these are categorized as
separate state wealth. Since 2003, the government of Indonesia has been enacting the
government decree number 41/2003 which enabled the Finance Minister to delegate
status, duties and authorities to the Minister of State-Owned Enterprises.64
3) The State-Owned Enterprises (BUMN)
The second level entity is the State-Owned Enterprise which is also the parent company.
The parent company as shareholder of its subsidiary companies appoints the board of
directors and the board of commissioners in its subsidiaries. The shareholder of the state-
owned companies or parent companies is the Ministry of State-Owned Enterprises which
is represented by the Minister of SOE. However, in practice, the minister of SOE delegates
his/her responsibilities as shareholder of SOE to several deputies who are assigned to
manage the portfolios of specific SOEs.
4) Subsidiary company
The third level entity is the subsidiary of the State-Owned Enterprises; this is where there
is a board member duality structure. Essentially, the processes which occur in the parent
company are the same as those which occur in the subsidiary company. This is because 63 Undang-Undang Nomor 17 Tahun 2003 Tentang Keuangan Negara [Law No.17 of 2003 on Financial State] (Indonesia) art 1 (5). 64 Peraturan Pemerintah Nomor 41 Tahun 2003 Tentang Pelimpahan Kedudukan, Tugas dan Kewenangan Menteri Keuangan pada Perusahaan Perseroan (Persero), Perusahaan Umum (Perum), dan Perusahaan Jawatan (Perjan) kepada Menteri Negara Badan Usaha MIlik Negara [Government Decree No.41 of 2003 on the Delegation Status, Duties and Authorities of the Finance Minister regarding the State-Owned Enterprises to the State-Owned Enterprise Minister] (Indonesia).
P a g e | 120
the legal form of the subsidiary company and parent company are the same, namely the
limited liability company.
However, even though both companies have similar processes, the Ministry of SOE as the
shareholder of the parent company cannot intervene directly in the subsidiary company.
Only the Ministry of SOEs can influence the subsidiary policy indirectly through an arms-
length mechanism in which the director of parent company is a shareholder ex-officio of
the subsidiary company. The total number of subsidiary companies and the ‘grandchild’
companies of the State-Owned Enterprise are so many, that even the control exercised
indirectly by the Ministry of SOEs probably cannot effectively reach all of them. For
example, PT Pertamina, the biggest SOE which operates in the oil and gas industry, has
about 128 subsidiary companies (Sutianto, 2015).
The complexity of the relationship is one of the reasons why it is very important to have a
control mechanism that will reduce the agency costs incurred as a result of principal-agent
problems. This is in line with the sentiments expressed by Rini Soewandi, the Minister of
State-Owned Enterprises of the Republic Indonesia from 2014 to 2019, who said that there
are numerous subsidiary companies which have business lines outside the core business
of the parent company (Sitepu, 2015).
3.5.2. Rule of the game
The different regulations are divided into five hierarchies. The highest hierarchy comprises
those regulations that regulate the three entities contained in the Constitution 1945. The
second hierarchy of rules regarding this entity involves the Financial State Law No.17/2003
and the Treasury Act No.1/2004, in which the regulation which specifically regulates the
SOEs has been enacted in SOE Law No.19/2003 and the Limited Liability Company Law
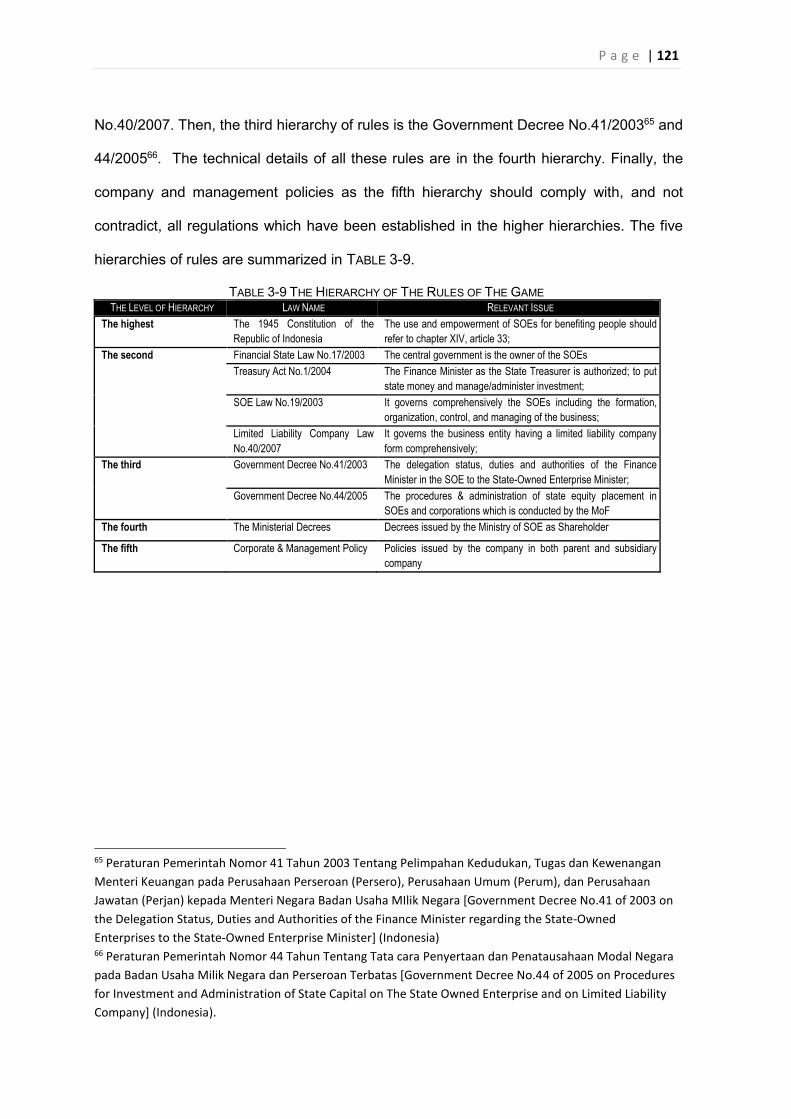
P a g e | 121
No.40/2007. Then, the third hierarchy of rules is the Government Decree No.41/200365 and
44/200566. The technical details of all these rules are in the fourth hierarchy. Finally, the
company and management policies as the fifth hierarchy should comply with, and not
contradict, all regulations which have been established in the higher hierarchies. The five
hierarchies of rules are summarized in TABLE 3-9.
TABLE 3-9 THE HIERARCHY OF THE RULES OF THE GAME THE LEVEL OF HIERARCHY LAW NAME RELEVANT ISSUE
The highest The 1945 Constitution of the Republic of Indonesia
The use and empowerment of SOEs for benefiting people should refer to chapter XIV, article 33;
The second Financial State Law No.17/2003 The central government is the owner of the SOEs Treasury Act No.1/2004 The Finance Minister as the State Treasurer is authorized; to put
state money and manage/administer investment; SOE Law No.19/2003 It governs comprehensively the SOEs including the formation,
organization, control, and managing of the business; Limited Liability Company Law No.40/2007
It governs the business entity having a limited liability company form comprehensively;
The third Government Decree No.41/2003 The delegation status, duties and authorities of the Finance Minister in the SOE to the State-Owned Enterprise Minister;
Government Decree No.44/2005 The procedures & administration of state equity placement in SOEs and corporations which is conducted by the MoF
The fourth The Ministerial Decrees Decrees issued by the Ministry of SOE as Shareholder
The fifth Corporate & Management Policy Policies issued by the company in both parent and subsidiary company
65 Peraturan Pemerintah Nomor 41 Tahun 2003 Tentang Pelimpahan Kedudukan, Tugas dan Kewenangan Menteri Keuangan pada Perusahaan Perseroan (Persero), Perusahaan Umum (Perum), dan Perusahaan Jawatan (Perjan) kepada Menteri Negara Badan Usaha MIlik Negara [Government Decree No.41 of 2003 on the Delegation Status, Duties and Authorities of the Finance Minister regarding the State-Owned Enterprises to the State-Owned Enterprise Minister] (Indonesia) 66 Peraturan Pemerintah Nomor 44 Tahun Tentang Tata cara Penyertaan dan Penatausahaan Modal Negara pada Badan Usaha Milik Negara dan Perseroan Terbatas [Government Decree No.44 of 2005 on Procedures for Investment and Administration of State Capital on The State Owned Enterprise and on Limited Liability Company] (Indonesia).
P a g e | 122
CHAPTER 4: RESEARCH FRAMEWORK “Above all we have to go beyond words and images and concepts. No imaginative vision or conceptual framework is adequate to the great
reality.” Bede Griffiths, 1906—1993
INTRODUCTION
This chapter comprises four sections which explain the development of the Research
Framework, beginning with the Research Questions presented in Section 4.1. The
research questions relate to issues arising from the phenomenon known as the “board
member duality” in a corporation which applies to the two-tier board model which usually
characterises the relationship between a parent and a subsidiary company.
Section 4.2 presents the conceptual framework of the research which illustrates the
relationship between a board member duality structure and agency costs. The board
member duality structure will be elaborated based on the two-tier board model which
typifies the State-Owned Enterprises in Indonesia. The agency costs will be measured
using an approach that examines firm efficiency and company performance. The
interrelationship of board member structure, agency costs, and several other variables will
be depicted in a schematic model which uses boxes, arrows and other symbols to
represent the propositions within the conceptual framework.
Section 4.3 explains the development of hypotheses which comprise null hypotheses and
alternative hypotheses to test the propositions which are derived from Agency Theory and
Stewardship Theory. The hypotheses will be tested by using the triangulation method,
which combines qualitative and quantitative methods and which will be explained more
comprehensively in Chapter 5.
P a g e | 123
Section 4.4 presents a summary of the research questions that were detailed in the
previous sections.
4.1. RESEARCH QUESTIONS
The duality position (board member duality) held by parent company directors of a State-
Owned Enterprise and who, at the same time, represent it as supervisory board members
(commissioner) in a subsidiary company, is allowed in Indonesia, especially when the
business entity of the parent company is a holding company (Kertiyasa, 2011). The limited
liability law which lays down provisions for the corporate boards, does not rule specifically
on the duality position.67
However, the Limited Liability Law 2007 allows the regulator or technical agencies to
establish additional requirements pursuant to legislative regulations, as stated in article 93
(2).68 In regard to that article, as described in Chapter 3, there are several laws which
regulate the duality of executive directors in Indonesia. Some of these laws are the State-
Owned Enterprise Law69, Indonesia’s Anti-Monopoly Law70, The Financial Services
Authority Regulations71, and the Ministerial Decrees of the Minister of State-Owned
Enterprises72. These laws have been put in place to regulate the duality positions73, as the
67 Undang-Undang Nomor 40 Tahun 2007 Tentang Perseroan Terbatas [Law No.40 of 2007 on Limited Liability Companies) (Indonesia) art 93 (1). 68 Undang-Undang Nomor 40 Tahun 2007 Tentang Perseroan Terbatas [Law No.40 of 2007 on Limited Liability Companies) (Indonesia) art 93 (1). 69 Undang-Undang Nomor 19 Tahun 2003 Tentang Badan Usaha Milik Negara [Law No.19 of 2003 on State-Owned Enterprise) (Indonesia) art 25. 70 Undang-Undang Nomor 5 Tahun 1999 Tentang Larangan Praktek Monopoli dan Persaingan Usaha Tidak Sehat [Law No.5 of 1999 on The Prohibition of Monopolistic Practices and Unfair Business Competition] (Indonesia) art 26. 71 Peraturan Otoritas Jasa Keuangan Nomor 33/POJK.04/2014 Tentang Direksi dan Komisaris Emiten atau Perusahaan Publik [Regulation of Financial Services Authority No.33/POJK.04/2014 Regarding Directors and Issuer Commissioner or Public Company. 72 Peraturan Menteri BUMN Nomor PER-01/MBU/2012 Tentang Persyaratan dan Tata Cara Pengangkatan dan Pemberhentian Anggota Direksi Badan Usaha Milik Negara [Ministerial Decree No. PER-01/MBU/2012 on Terms and Procedures for Appointment and Dismissal Director of the State owned Enterprises] (Indonesia) art 36. 73 See footnote no.69, 70, 71, 72.
P a g e | 124
duality positions of board members in parent and subsidiary companies is a common
occurrence. Board member duality in parent and subsidiary companies generally occurs
because of the appointment of a board member to a subsidiary company which is the
responsibility of the shareholder who, in practice, is the CEO of the parent company in an
ex officio position74.
As described in Chapter 2, this director duality falls into three categories, namely the CEO
duality, the interlocking directorship, and the multiple directorships. However, the findings
of previous research which investigated the impact of the duality on company performance
or agency cost are frequently not consistent and are often contradictory. Donaldson and
Davis (1991a), Boyd (1995) and Brickley et al. (1997) found that the director duality has a
positive impact on company performance. On the other hand, Rechner and Dalton (1989),
and Pi and Timme (1993) found a negative impact on the relationship, whereas Berg and
Smith (1978), Chaganti et al. (1985a), Baliga et al. (1996) found that there was no
systematic relationship between CEO duality and performance. Interestingly, the research
findings on interlocking directorships are consistent, and may indicate that the interlocking
directorship causes ineffective monitoring because the directors tend to look out for their
own interests rather than those of their shareholders (Chhaochharia and Grinstein, 2007,
Hallock, 1997). Institutional investors and shareholder activists expressed outrage at the
multiple directorships in multiple companies because these are not effective in monitoring
company management (Ferris et al., 2003). In contrast to the bulk of research on the CEO
duality which has been conducted in the one-tier board context, previous research on
director duality in the context of two-tier boards is rare or very limited. Bezemer et al.
(2012)’s argument that the CEO duality cannot occur in the two-tier board context may
74 Peraturan Menteri BUMN Nomor PER-03/MBU/2012 tentang Pedoman Pengangkatan Anggota Direksi dan Anggota Dewan Komisaris Anak Perusahaan [Ministerial Decree No. PER-03/MBU/2012 on Guidance for the Appointment of Director and Commissioner of Subsidiary Company] (Indonesia) art 2 (2).
P a g e | 125
explain why there has been little research on CEO duality. This is because, by design, the
execution and oversight functions rest with different boards. However, this researcher
argues that if this situation were extended to the parent-subsidiary company relationship,
the duality, similar to the CEO duality, could occur whereby the CEO of the parent
company has a dual position as a commissioner (usually a chairman) in a subsidiary
company. Given the fact that in the absence of previous research into board member
duality in a two-tier board system, this research raises questions about whether the values
and the factors that influence CEO duality also occur in board member duality.
With board member duality, which occurred in the State-Owned Enterprises in Indonesia
in fact, the duality holders hold three positions simultaneously as: the director of the
parent company, the shareholder of the subsidiary company, and the commissioner of the
subsidiary company. These positions enable them to establish strategic corporate policies
that influence how the parent company and its subsidiaries operate their businesses.
Based on the Agency theory (see Chapter 2), agency problems could arise when principal
and agent have divergent interests that lead to a conflict of interests. The conflict of
interests could be more severe if there is a wide gap in the information owned by both
parties, popularly called the asymmetric information gap. The agent usually has more
comprehensive information than does the principal regarding the company under his/her
management. Consequently, if the control of the principal over the agent is too weak, then
it could produce a moral dilemma for the agent. The costs that are incurred due to agency
problems are called the agency costs (see Jensen and Meckling (1976)).
Given that previous research on director duality and agency costs has produced
inconsistent results, this research will start with a very basic research question: “Does the
duality position of the board of directors in parent and subsidiary companies have an
impact on the agency costs?” The question will be addressed through the formulation of
important sub questions which are intended to explain more comprehensively board
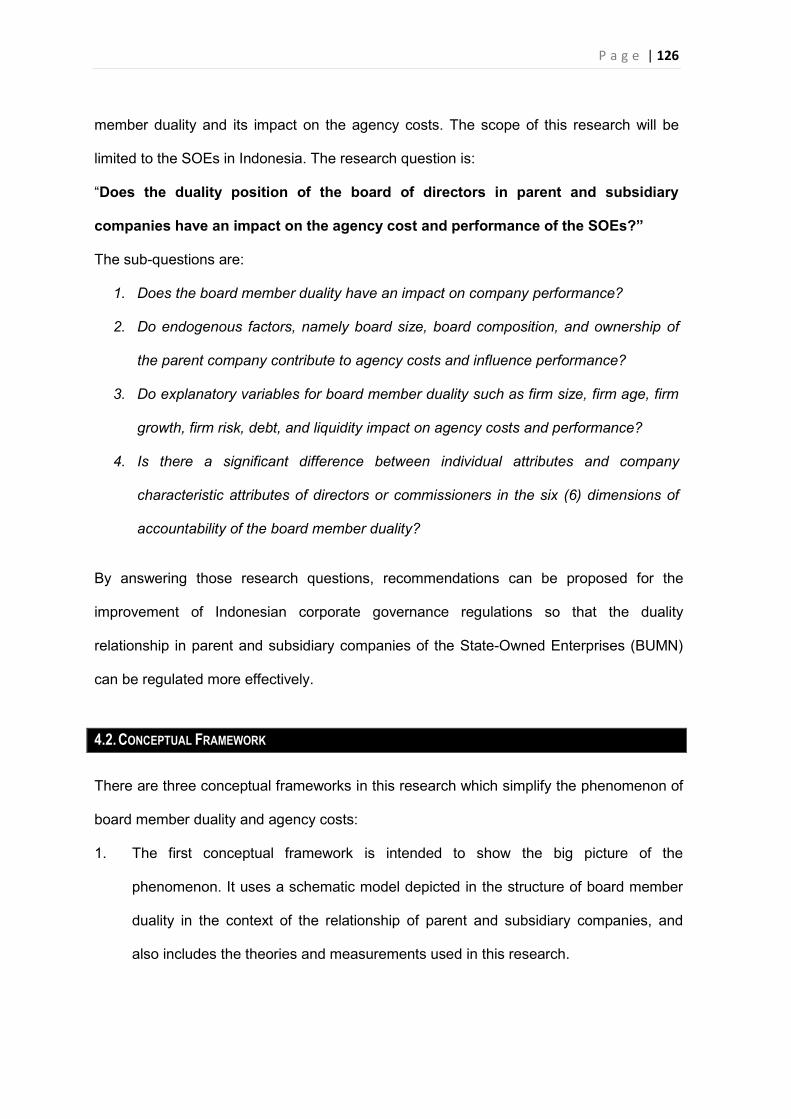
P a g e | 126
member duality and its impact on the agency costs. The scope of this research will be
limited to the SOEs in Indonesia. The research question is:
“Does the duality position of the board of directors in parent and subsidiary
companies have an impact on the agency cost and performance of the SOEs?”
The sub-questions are:
1. Does the board member duality have an impact on company performance?
2. Do endogenous factors, namely board size, board composition, and ownership of
the parent company contribute to agency costs and influence performance?
3. Do explanatory variables for board member duality such as firm size, firm age, firm
growth, firm risk, debt, and liquidity impact on agency costs and performance?
4. Is there a significant difference between individual attributes and company
characteristic attributes of directors or commissioners in the six (6) dimensions of
accountability of the board member duality?
By answering those research questions, recommendations can be proposed for the
improvement of Indonesian corporate governance regulations so that the duality
relationship in parent and subsidiary companies of the State-Owned Enterprises (BUMN)
can be regulated more effectively.
4.2. CONCEPTUAL FRAMEWORK
There are three conceptual frameworks in this research which simplify the phenomenon of
board member duality and agency costs:
1. The first conceptual framework is intended to show the big picture of the
phenomenon. It uses a schematic model depicted in the structure of board member
duality in the context of the relationship of parent and subsidiary companies, and
also includes the theories and measurements used in this research.
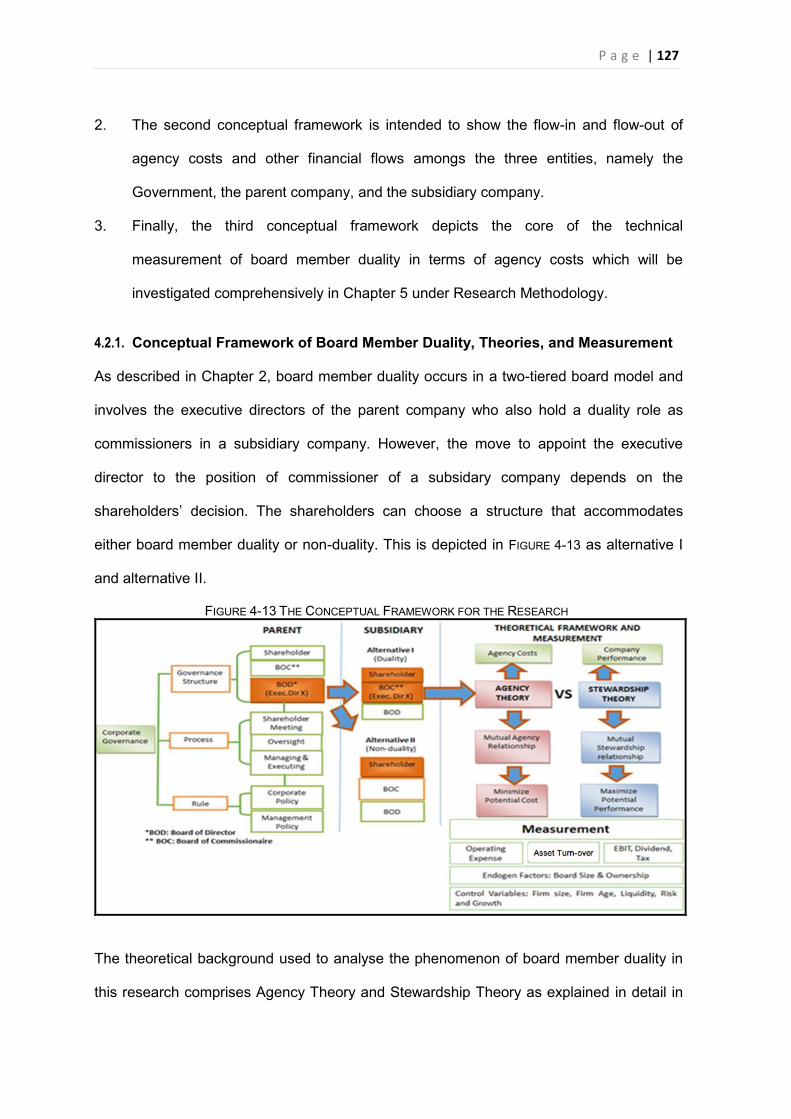
P a g e | 127
2. The second conceptual framework is intended to show the flow-in and flow-out of
agency costs and other financial flows amongs the three entities, namely the
Government, the parent company, and the subsidiary company.
3. Finally, the third conceptual framework depicts the core of the technical
measurement of board member duality in terms of agency costs which will be
investigated comprehensively in Chapter 5 under Research Methodology.
4.2.1. Conceptual Framework of Board Member Duality, Theories, and Measurement
As described in Chapter 2, board member duality occurs in a two-tiered board model and
involves the executive directors of the parent company who also hold a duality role as
commissioners in a subsidiary company. However, the move to appoint the executive
director to the position of commissioner of a subsidary company depends on the
shareholders’ decision. The shareholders can choose a structure that accommodates
either board member duality or non-duality. This is depicted in FIGURE 4-13 as alternative I
and alternative II.
FIGURE 4-13 THE CONCEPTUAL FRAMEWORK FOR THE RESEARCH
The theoretical background used to analyse the phenomenon of board member duality in
this research comprises Agency Theory and Stewardship Theory as explained in detail in
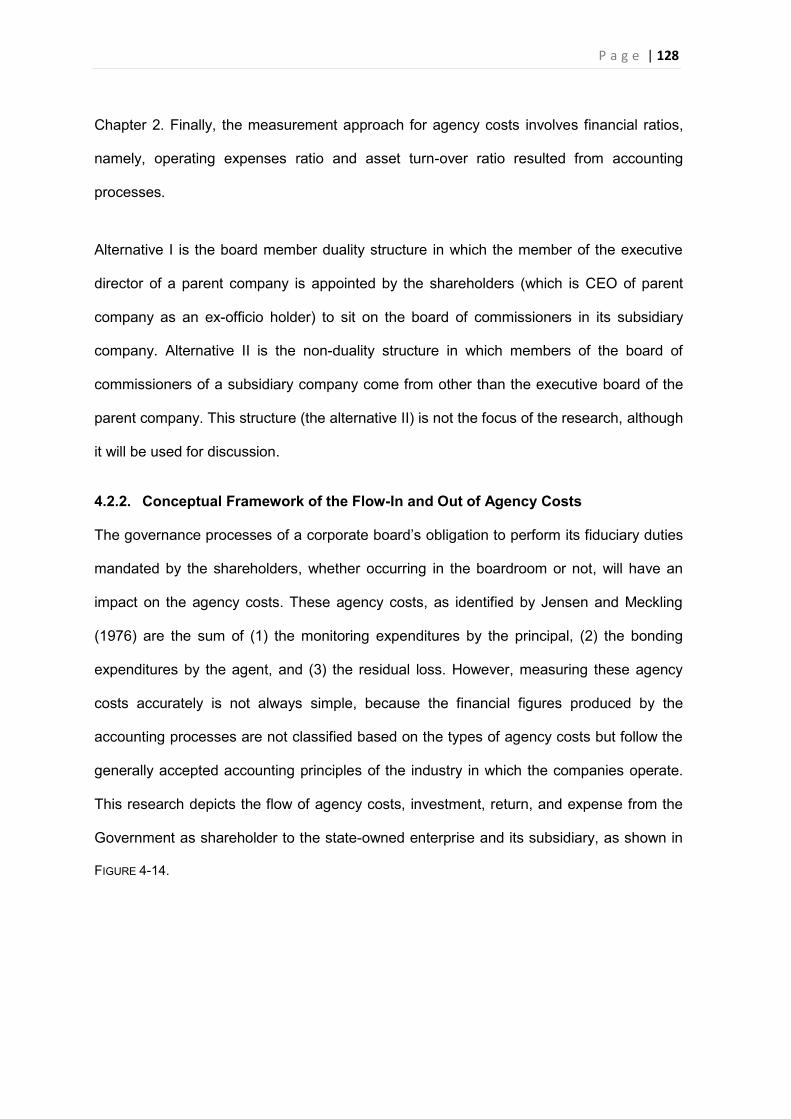
P a g e | 128
Chapter 2. Finally, the measurement approach for agency costs involves financial ratios,
namely, operating expenses ratio and asset turn-over ratio resulted from accounting
processes.
Alternative I is the board member duality structure in which the member of the executive
director of a parent company is appointed by the shareholders (which is CEO of parent
company as an ex-officio holder) to sit on the board of commissioners in its subsidiary
company. Alternative II is the non-duality structure in which members of the board of
commissioners of a subsidiary company come from other than the executive board of the
parent company. This structure (the alternative II) is not the focus of the research, although
it will be used for discussion.
4.2.2. Conceptual Framework of the Flow-In and Out of Agency Costs
The governance processes of a corporate board’s obligation to perform its fiduciary duties
mandated by the shareholders, whether occurring in the boardroom or not, will have an
impact on the agency costs. These agency costs, as identified by Jensen and Meckling
(1976) are the sum of (1) the monitoring expenditures by the principal, (2) the bonding
expenditures by the agent, and (3) the residual loss. However, measuring these agency
costs accurately is not always simple, because the financial figures produced by the
accounting processes are not classified based on the types of agency costs but follow the
generally accepted accounting principles of the industry in which the companies operate.
This research depicts the flow of agency costs, investment, return, and expense from the
Government as shareholder to the state-owned enterprise and its subsidiary, as shown in
FIGURE 4-14.
P a g e | 129
FIGURE 4-14 THE FLOWS OF AGENCY COSTS, INVESTMENT, RETURN, AND EXPENSE IN THE SOE AND SUBSIDIARY COMPANY
Shareholder (The Ministry of SOE)
The Ministry of Finance (As State Treasurer)
FIGURE 4-14 shows the critical role of the corporate boards, namely the board of directors
and the board of commissioners, in the parent and subsidiary companies (as agents) who
are delegated by the Government (as principal/shareholder) to manage the equity
placements and subsidies (investment) using the corporate mechanism. The Government
(principal) expects that the corporate boards of BUMNs will be able to utilize the equity
placement and subsidies to provide goods and services for people. In turn, the return on
the investment will be in the form of dividends, taxes, and perceived corporate social
responsibility. The structure and processes, by which the corporate board utilizes the
equity placement and subsidy by using the corporate mechanisms, may produce agency
problems which lead to agency costs (see also FIGURE 4-13). The conceptual framework
above depicts the flows of the agency costs which hypothetically occur when there is
board member duality. The conceptual framework for measuring the agency costs is
presented in section 4.2.3.
4.2.3. Conceptual Framework for Measuring the Agency Costs and Performance
Previous research on director duality tended to use operating expenses and the asset
utilization ratio as the efficiency measurement approach to measure agency costs (see
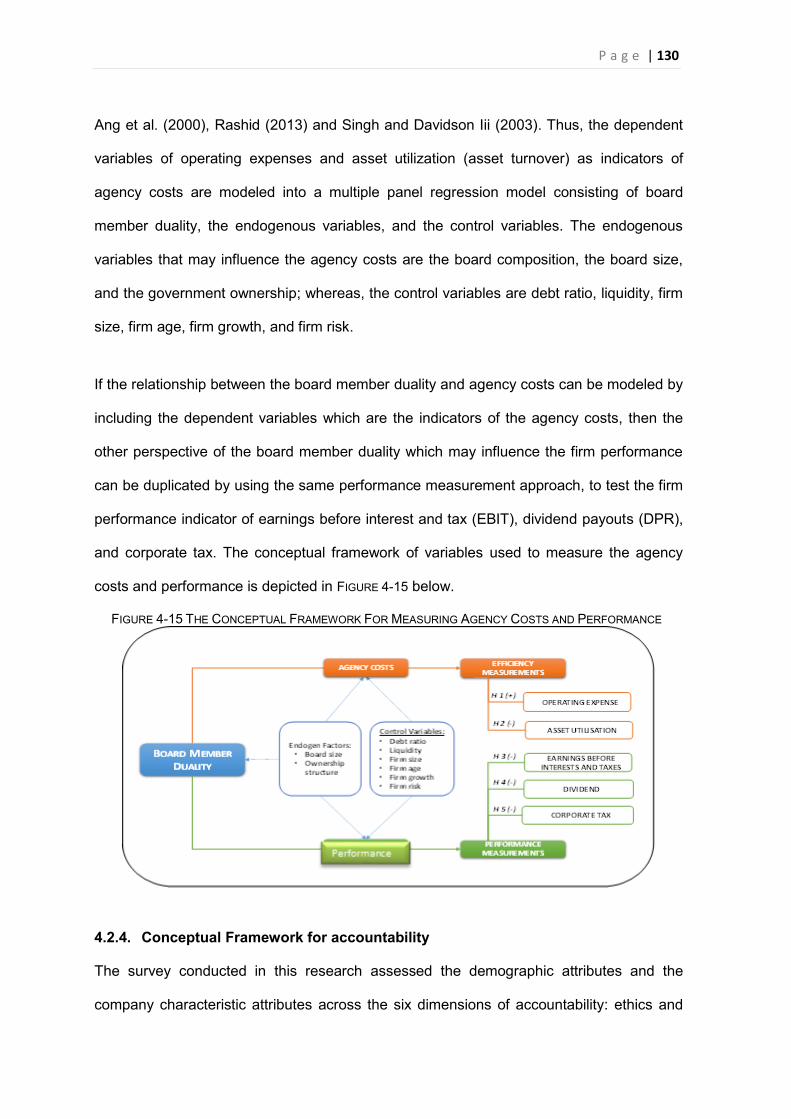
P a g e | 130
Ang et al. (2000), Rashid (2013) and Singh and Davidson Iii (2003). Thus, the dependent
variables of operating expenses and asset utilization (asset turnover) as indicators of
agency costs are modeled into a multiple panel regression model consisting of board
member duality, the endogenous variables, and the control variables. The endogenous
variables that may influence the agency costs are the board composition, the board size,
and the government ownership; whereas, the control variables are debt ratio, liquidity, firm
size, firm age, firm growth, and firm risk.
If the relationship between the board member duality and agency costs can be modeled by
including the dependent variables which are the indicators of the agency costs, then the
other perspective of the board member duality which may influence the firm performance
can be duplicated by using the same performance measurement approach, to test the firm
performance indicator of earnings before interest and tax (EBIT), dividend payouts (DPR),
and corporate tax. The conceptual framework of variables used to measure the agency
costs and performance is depicted in FIGURE 4-15 below.
FIGURE 4-15 THE CONCEPTUAL FRAMEWORK FOR MEASURING AGENCY COSTS AND PERFORMANCE
4.2.4. Conceptual Framework for accountability
The survey conducted in this research assessed the demographic attributes and the
company characteristic attributes across the six dimensions of accountability: ethics and
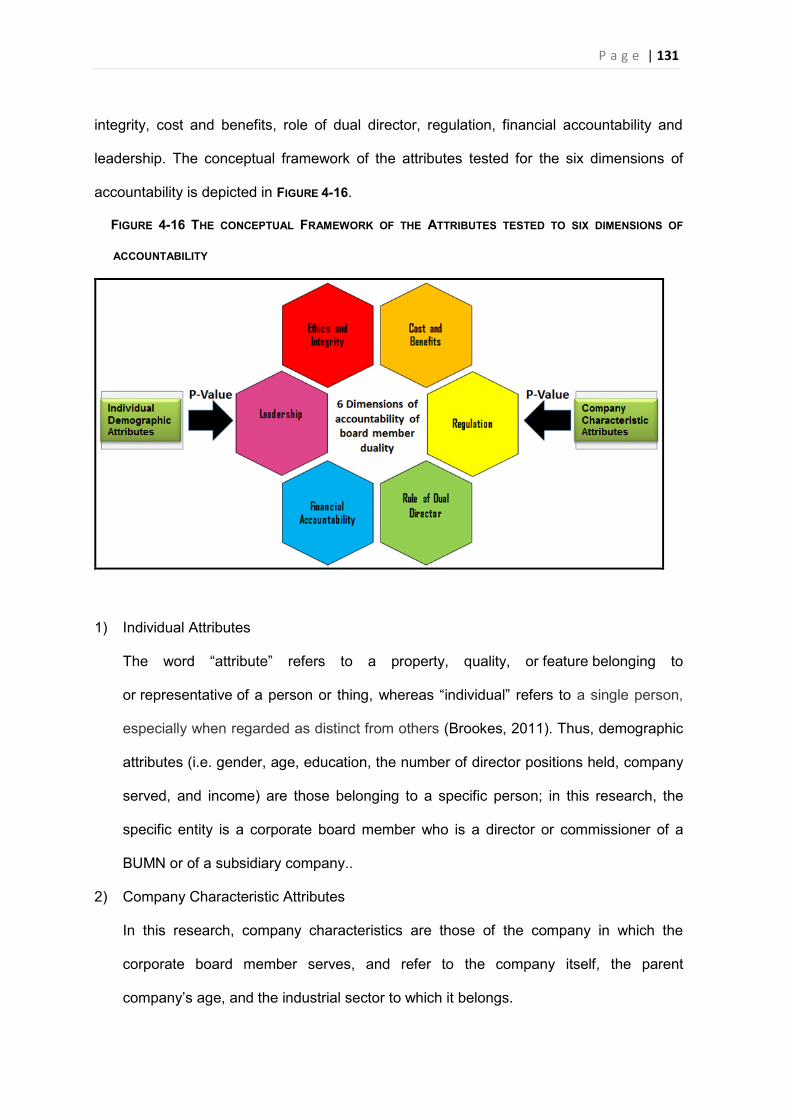
P a g e | 131
integrity, cost and benefits, role of dual director, regulation, financial accountability and
leadership. The conceptual framework of the attributes tested for the six dimensions of
accountability is depicted in FIGURE 4-16.
FIGURE 4-16 THE CONCEPTUAL FRAMEWORK OF THE ATTRIBUTES TESTED TO SIX DIMENSIONS OF
ACCOUNTABILITY
1) Individual Attributes
The word “attribute” refers to a property, quality, or feature belonging to
or representative of a person or thing, whereas “individual” refers to a single person,
especially when regarded as distinct from others (Brookes, 2011). Thus, demographic
attributes (i.e. gender, age, education, the number of director positions held, company
served, and income) are those belonging to a specific person; in this research, the
specific entity is a corporate board member who is a director or commissioner of a
BUMN or of a subsidiary company..
2) Company Characteristic Attributes
In this research, company characteristics are those of the company in which the
corporate board member serves, and refer to the company itself, the parent
company’s age, and the industrial sector to which it belongs.
P a g e | 132
4.3. HYPOTHESIS DEVELOPMENT
Agency theory argues that agency costs incurred as a result of agency problems can be
minimized if the principal applies an appropriate mechanism to monitor and control the
agent. This means that appropriate control, which inevitably incurs costs, cannot be
avoided by a shareholder who seeks to keep an agent's behavior on the right track and in
line with the interests of the shareholder. If both parties compromise their conflicts of
interests that theoretically could arise in such relationships, then the mutual agency
relationship as described by Davis et al. (1997) will occur. However, this mutual agency
relationship is not always the case, as every member of the corporate board has his/her
own characteristics, values, and integrity. Furthermore, Agency theory assumes that man
tends to be an economic creature who is self-serving, demographic, and more oriented to
being controlled (Davis et al. 1997).
On the other hand, as described in Chapter 2, Stewardship theory argues that the agency
theory which describes the principal-agent relationship does not hold true for all managers.
Occasionally, the principal and agent have goals which are convergent and aligned, so
they will create a mechanism and a structure which enable them to achieve effective
coordination. If both parties can coordinate effectively, then a mutual stewardship relation
will ensue. The mutual stewardship relationship will imorive the managers' performance
and will ultimately influence the overall company performance.
From the two theories above, as described by Davis et al. (1997), the ideal relationship
between principal and agent in both theories has a different focus. While agency theory
emphasizes how to minimize agency costs by applying a control mechanism and a
structure, stewardship theory focuses on optimizing performance by applying a mechanism
and structure which enables the parties in the relationship to achieve effective
coordination.
P a g e | 133
4.3.1. Board Member Duality and Agency Costs
The efficiency measurement approach used to measure the agency costs in this research
consists of the operating expense ratio and the asset utilization ratio, otherwise known as
the asset turnover ratio. The operating expense ratio is formulated as the total operating
expenses (excluding any non-recurring expense such as loss on sale of assets, and
financing expense) divided by annual sales. A low operating expense ratio means that the
corporate management is able to control the operating expenses efficiently. On the other
hand, a high operating expense ratio means that the corporate management cannot
efficiently control the operating expenses. This is in line with Singh and Davidson III (2003)
who argued that higher operating expenses indicate greater agency conflicts within a
company, and vice versa. Therefore, this argument results in the first hypothesis of this
research that: “there is a relationship between board member duality and operating
expenses”.
The second measurement of efficiency, namely the assets utilization ratio or asset
turnover ratio, measures how effectively the corporate management utilizes the company
assets. The higher the asset turnover ratio, the more efficiently the corporate management
can utilise the company assets. Singh and Davidson Iii (2003) stated that companies with
considerable agency conflict will have lower asset utilisation ratios relative to those
companies which have less agency conflict. This argument gives rise to the second
hypothesis of this research that “there is a relationshhip between board member
duality and asset turnover”.
4.3.2. Board Member Duality and Corporate Performance
As described in Chapter 2, previous research on director duality and its impact on
company performance produced inconsistent results. This research refers to the findings
from the studies conducted by Rechner and Dalton (1989), and Pi and Timme (1993) who
concluded that director duality has a negative impact on company performance. Referring
P a g e | 134
to the arguments which follow the same logic described for the previous variable, that is
the asset utilization ratio, then the performance measurement approach implies that
companies with considerable agency conflict would have lower performance compared
with those companies which have less agency conflict. Thus, this led to the three
hypothesis which have a statistically similar formulation regarding three company
performance measurements, namely earnings before interest and taxes, dividend payout
ratio, and corporate taxes.
1) Earning Before Interests and Taxes (EBIT)
EBIT is an indicator that shows a company’s profitability. This indicator is also
referred to as operating profit and is formulated as revenues minus expenses, but
excluding interest and taxes. This indicator is also useful for predicting the
company’s earnings potential and is used by investors to compare how effectively a
company generates profit from industries which operate in different tax environments
and have different financing strategies for capital structure. Referring to the findings
of Rechner and Dalton (1989), and Pi and Timme (1993), the companies with
considerable agency conflict would have a lower performance compared with those
companies which have less agency conflict, so that the third hypothesis will be that
“There is a relationship between board member duality and earnings before
interest and taxes (EBIT)”.
2) Dividend Payout Ratio
Dividend payout ratio is a ratio which is calculated as dividend divided by net income.
This ratio indicates several important financial aspects. Firstly, the dividend payout
ratio shows how much money a company is returning to shareholders or the rate of
return to shareholders. Secondly, this ratio shows how much money is being kept on
hand to be re-invested in the company's growth. Thirdly, this ratio shows the reserve
kept for paying off debt or adding to the cash reserve, technically called retained
P a g e | 135
earnings. Again, referring to the previous statement that “the companies with
considerable agency conflict would have lower performance compared with those
companies which have less agency conflict”, the fourth hypothesis will be that “There
is a relationship between board member duality and dividend payout ratio”.
3) Corporate Income Tax
Corporate income tax is defined as a levy placed on the profit of a firm, with different
rates applying to different levels of profit. The performance of state-owned enterprises
can be measured by how much money these enterprises pay in corporate income tax
and dividends compared with the income target from the state-owned enterprises
anticipated in the state budget. Using the same logic as the previous statement, then,
the fifth hypothesis is that “There is a relationship between board member duality
and corporate taxes”.
4.3.3. Endogenous variables
1) Board Size
Board size and composition affect the functioning of the board in terms of
effectiveness and efficiency. The resource dependence theory argues that the
increase in board size and diversity will increase the amount of networking with the
external environment and will secure a broader source of resources (Pearce and
Zahra, 1992, Pfeffer, 1972). On the other hand, several studies have concluded that
smaller boards are more effective than larger boards (see (Shaw, 1981); (Jewell and
Reitz, 1981); and (Lipton and Lorsch, 1992). This conclusion is also consistent with
the empirical research conducted by Yermack (1996) and Eisenberg et al. (1998)
who concluded that the smaller boards will enhance corporate performance. Thus,
the hypothesis regarding the board size and agency costs which will be measured
P a g e | 136
by operating expenses will be “there is a relationship between board size and
agency costs”.
2) Board Composition
Johnson et al. (2012) stated that the composition of a board critically affects the
performance of the firm. The board composition reflects the diversity of the board
members. Pearce and Zahra (1992) argued that the diversity of the board members
will increase the external networking and also secure a broader range of resources.
This is in line with the resource-dependent theory as explained in Chapter 2. Thus,
the hypothesis regarding the board composition and agency costs which is
measured by operating expenses is that “there is a relationship between board
composition and agency costs”.
3) Government Ownership
As described in Chapter 3, originally, the state as the owner of shares of the state
owned enterprises usually has 100% of shares or a majority. However, under a
privatization program or when going public, the public and the institutions could
acquire the shares of the state-owned enterprises by buying the shares in the capital
market where the state-owned enterprises are listed. The existence of the public
and block holders in the ownership of the state-owned enterprises could be of
benefit to the SOE and at the end, all shareholders (Lukviarman, 2004). Thus, the
hypothesis regarding the ownership and agency costs which is measured by
operating expenses is that “there is a relationship between government
ownership and agency costs”.
4.3.4. Control or Explanatory Variables
This research will use six explanatory variables, namely debt, liquidity, firm size,
firm age, firm growth, and firm risk as used by Rashid (2013) who investigated
P a g e | 137
CEO duality and agency costs. These explanatory variables are also analysed and
included in the formulation in order to find a comprehensive explanation of its
influence in the correlation of the board member duality against agency costs in
the state-owned enterprises in Indonesia.
1) Firm Size
Firm size may have an impact on the firm’s efficiency and performance. A large
company has pool of various capabilities, but at the same time also has a problem
with coordination. A smaller company is sometimes more agile than a bigger
company. The corporate board of a large company is sometimes trapped in the
managerial hubris which influences decisions and their impacts which produce
higher agency costs. This has been found in research which has investigated the
effect of size on acquisitions conducted by Moeller et al. (2004). The natural
logarithm of total assets will be used to represent firm size measurement. Thus,
the hypothesis regarding firm size and agency costs is that “there is a
relationship between firm size and agency costs”.
2) Firm Risk
Firm risk is potentially an important determinant of a firm efficiency. This risk
usually has to be taken into consideration in an investment decision. The principal-
agent problems in investment decisions could severely increase this risk. However,
the principal-agent problems inherent in delegated asset management can be
reduced by applying effective risk-control tools (Alankar et al., 2013). Hedging as a
mechanism to mitigate the risk is frequently of greater benefit when the agency
costs are low (Leland, 1998). Thus, the hypothesis regarding firm risk and agency
costs is that “there is a relationship between firm risk and agency costs”.
P a g e | 138
3) Liquidity
The accounting discipline refers to liquidity as the ease with which a firm can meet
its financial obligations with the liquid assets available to the firm. Liquidity may be
an impact of efficiency and performance, in the sense that the board of directors
will formulate the first-best investment policy for a given capital structure. The
formula that may achieve the optimal liquidity will eliminate the agency costs (Hirth
and Uhrig-Homburg, 2010). Liquidity is calculated as current assets scaled by
current liabilities. Thus, the hypothesis regarding liquidity and agency costs is that
“there is a relationship between liquidity and agency costs”.
4) Firm Age
The age of a firm may also influence its efficiency. There is a learning curve that
can explain why older firms may be more efficient than younger firms. However,
when companies have become more mature, they usually will be in a strong
position to generate money from their operation. As a result, they have enough
funds to expand their business and drive an increase in the company’s growth. At
this point, in line with the size effect on acquisition (see Moeller et al. (2004),
Agency theory predicts that management becomes more entrenched and pursues
growth at the expense of shareholders (see Arikan and Stulz (2011), Mueller
(1972) and Jensen (1986). The natural logarithm of the number of years since the
state owned enterprises was established until 2013 will be used to represent firm
age measurement. Thus, the hypothesis regarding firm age and agency costs is
that “there is a relationship between firm age and the agency costs”.
5) Firm Debt
Essentially, the value of debt can be viewed as a transfer value from creditor to
shareholder which has an impact that increases asset risk. The asset substitution
acquired from debt has the potential to impose agency costs. As a result, the
P a g e | 139
choice of capital structure has to be addressed (Leland, 1998). Choice of debt in
the capital structure plays a role in the control of the corporation (Jensen and
Meckling, 1976). Thus, the use of debt is expected to have an impact on the firm’s
efficiency. The debt ratio (DR) is calculated as total debt scaled by total assets.
Thus, the hypothesis regarding the debt and agency costs is that “there is a
relationship between firm debt and agency costs”.
6) Firm Growth
Firm growth also probably influences the firm’s efficiency. The financing of a firm’s
growth can originate from internal financing or external financing. If the growth is
driven by internal financing, then the company will use its retained earnings and
income from its operations to expand the business. If this mechanism is used, then
shareholders’ dividend payments will be constrained; if an external financing
mechanism is used, then the company should be exposed to scrutiny and
monitoring by market participants as they are the providers of external financing.
Ghosh and Sun (2014) concluded in REITs' case that externally financed growth
has a significantly positive correlation with dividend payments. A firm’s growth is
calculated as the percentage of annual change in sales. Thus, the hypothesis
regarding firm growth and agency costs is that “there is a relationship between
firm growth and agency costs”.
4.3.5. The Hypotheses of attribute variables
1) Demographic Attribute Variables
a. Gender
The gender issue in a corporate directorship has prompted researchers to
investigate whether there are performance differences if women are on the boards
of corporations. Farrell and Hersch (2005) and Daily et al. (1999) noted that the
P a g e | 140
number of women appointed as directors increased significantly during the decade
of the 1990s. This trend was also found by Bilimoria and Piderit (1994) who
investigated the specific issue of the “effects of sex-based bias”. The increase in the
number of women appointed to corporate boards is not merely because of gender
equality; recent research has shown that companies with an increased number of
women on corporate boards experienced higher corporate performance (see
Lückerath-Rovers (2013), Liu et al. (2014), and Post and Byron (2015). The
hypothesis related to gender is that “there is no difference accountability
between male and female directors”
b. Age of respondents
The diversity of ages of corporate board members may impact on corporate
performance. Waelchli and Zeller (2013) found “a robust negative relationship
between the age of chairmen of the board and firm performance which was mainly
influenced by the deterioration of cognitive ability and shifting in motivation” (see
also Taylor (1975)). The hypothesis regarding for the demographic attribute of
respondent age is that “There is no relationship between the age of a
respondent and his/her accountability ”.
c. Level of education
Level of education is very often used as a prerequisite for corporate board candidate
selection and as an indicator of formal knowledge. However, Ladegard et al. (2013)
concluded that the experience of the candidate was more important for performance
than was formal knowledge. The hypothesis regarding an individual’s education
level is that “There is no difference between the education level of a board
member and his/her accountability”.
P a g e | 141
d. Average monthly income
Remuneration is the financial reward given to directors and commissioners in order
to drive and improve the firm’s performance. In SOEs, the remuneration of directors
and commissioners is according to a scale established by the Ministry of State-
Owned Enterprises. The correlation between a director’s remuneration and
company performance has been investigated by several researchers. Krauter and
da Sousa (2013) found no support for the hypothesis that there is a positive and
significant relationship between executive compensation and company performance.
This finding is also similar to that of Gill (2014) who stated that the remuneration-
performance sensitivity and flexibility were weak. The progress of director’s
remuneration in selected ASEAN countries was highlighted by Talha et al. (2011)
which underlined the need for disclosure, the need for shareholders’ approval, the
separation of the chairman of the board of directors from the chief executive officers,
and the maximum tenure offered to directors. The hypothesis of demographic
attribute of income will be “There is no relationship between level of director’s
income and his/her accountability”
e. The number of director positions held
The multiple directorships of several companies may impact on the company
performance which is reflected in the company’s earnings. The debate among
academics on the issue of multiple directorships still continues (Jiraporn et al.,
2009). Carpenter and Westphal (2001) argued that the executive experience of the
multiple directorship holders can add value to the company. This argument was
bolstered by Mace (1986), Loderer and Peyer (2002) who argued that multiple
directorships can add value by increasing the network which also help to monitor the
business relations. On the other hand, some researchers argue that multiple
directorship may result in over-commitment, which in turn will lead to poor company
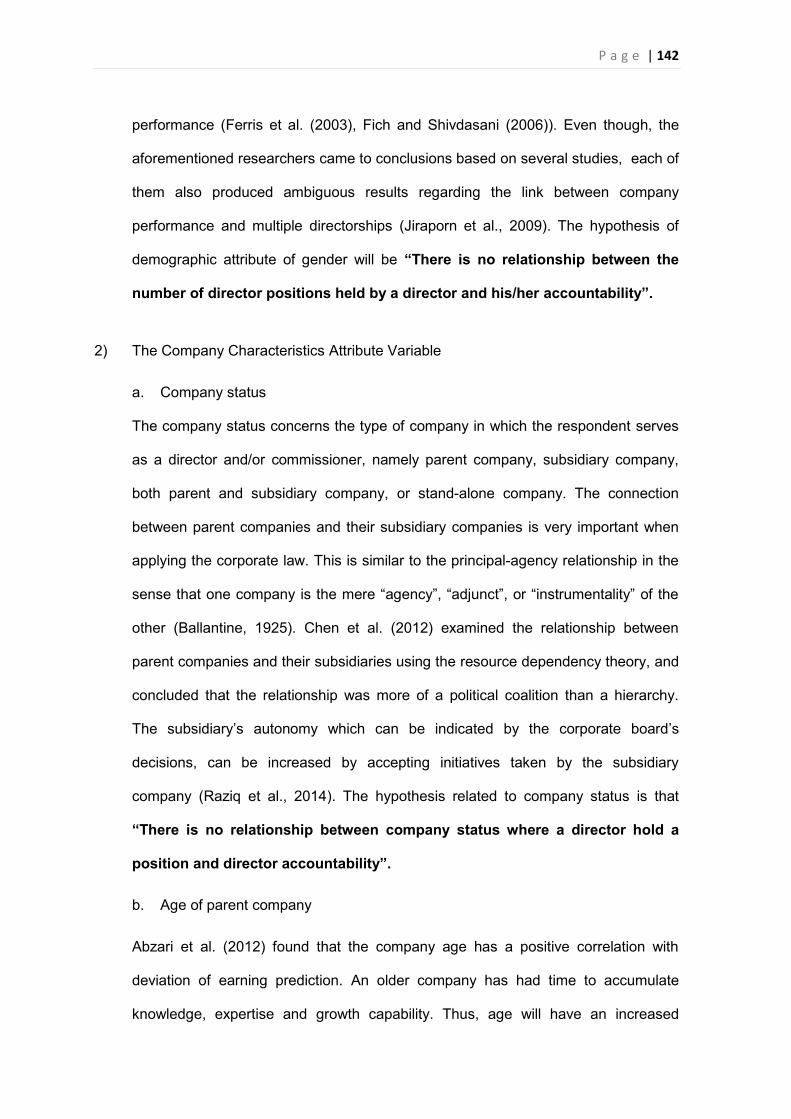
P a g e | 142
performance (Ferris et al. (2003), Fich and Shivdasani (2006)). Even though, the
aforementioned researchers came to conclusions based on several studies, each of
them also produced ambiguous results regarding the link between company
performance and multiple directorships (Jiraporn et al., 2009). The hypothesis of
demographic attribute of gender will be “There is no relationship between the
number of director positions held by a director and his/her accountability”.
2) The Company Characteristics Attribute Variable
a. Company status
The company status concerns the type of company in which the respondent serves
as a director and/or commissioner, namely parent company, subsidiary company,
both parent and subsidiary company, or stand-alone company. The connection
between parent companies and their subsidiary companies is very important when
applying the corporate law. This is similar to the principal-agency relationship in the
sense that one company is the mere “agency”, “adjunct”, or “instrumentality” of the
other (Ballantine, 1925). Chen et al. (2012) examined the relationship between
parent companies and their subsidiaries using the resource dependency theory, and
concluded that the relationship was more of a political coalition than a hierarchy.
The subsidiary’s autonomy which can be indicated by the corporate board’s
decisions, can be increased by accepting initiatives taken by the subsidiary
company (Raziq et al., 2014). The hypothesis related to company status is that
“There is no relationship between company status where a director hold a
position and director accountability”.
b. Age of parent company
Abzari et al. (2012) found that the company age has a positive correlation with
deviation of earning prediction. An older company has had time to accumulate
knowledge, expertise and growth capability. Thus, age will have an increased
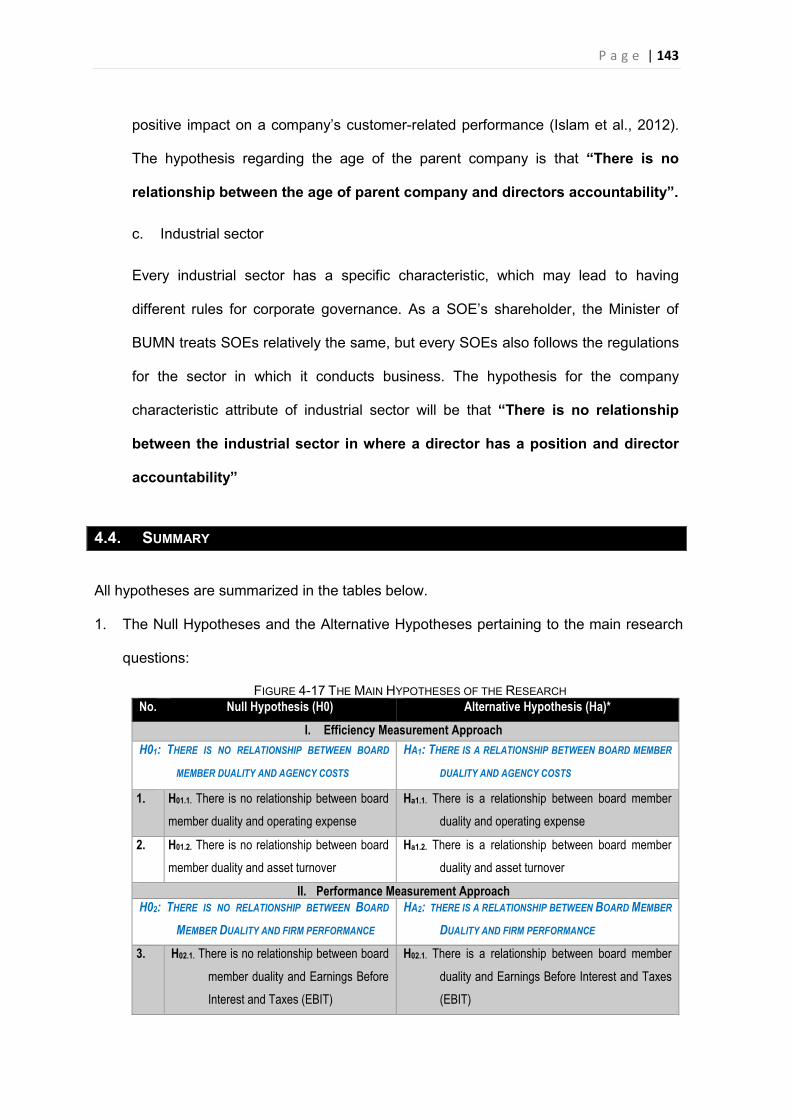
P a g e | 143
positive impact on a company’s customer-related performance (Islam et al., 2012).
The hypothesis regarding the age of the parent company is that “There is no
relationship between the age of parent company and directors accountability”.
c. Industrial sector
Every industrial sector has a specific characteristic, which may lead to having
different rules for corporate governance. As a SOE’s shareholder, the Minister of
BUMN treats SOEs relatively the same, but every SOEs also follows the regulations
for the sector in which it conducts business. The hypothesis for the company
characteristic attribute of industrial sector will be that “There is no relationship
between the industrial sector in where a director has a position and director
accountability”
4.4. SUMMARY
All hypotheses are summarized in the tables below.
1. The Null Hypotheses and the Alternative Hypotheses pertaining to the main research
questions:
FIGURE 4-17 THE MAIN HYPOTHESES OF THE RESEARCH No. Null Hypothesis (H0) Alternative Hypothesis (Ha)*
I. Efficiency Measurement Approach H01: THERE IS NO RELATIONSHIP BETWEEN BOARD
MEMBER DUALITY AND AGENCY COSTS
HA1: THERE IS A RELATIONSHIP BETWEEN BOARD MEMBER
DUALITY AND AGENCY COSTS
1. H01.1. There is no relationship between board member duality and operating expense
Ha1.1. There is a relationship between board member duality and operating expense
2. H01.2. There is no relationship between board member duality and asset turnover
Ha1.2. There is a relationship between board member duality and asset turnover
II. Performance Measurement Approach H02: THERE IS NO RELATIONSHIP BETWEEN BOARD
MEMBER DUALITY AND FIRM PERFORMANCE
HA2: THERE IS A RELATIONSHIP BETWEEN BOARD MEMBER
DUALITY AND FIRM PERFORMANCE
3. H02.1. There is no relationship between board member duality and Earnings Before Interest and Taxes (EBIT)
H02.1. There is a relationship between board member duality and Earnings Before Interest and Taxes (EBIT)
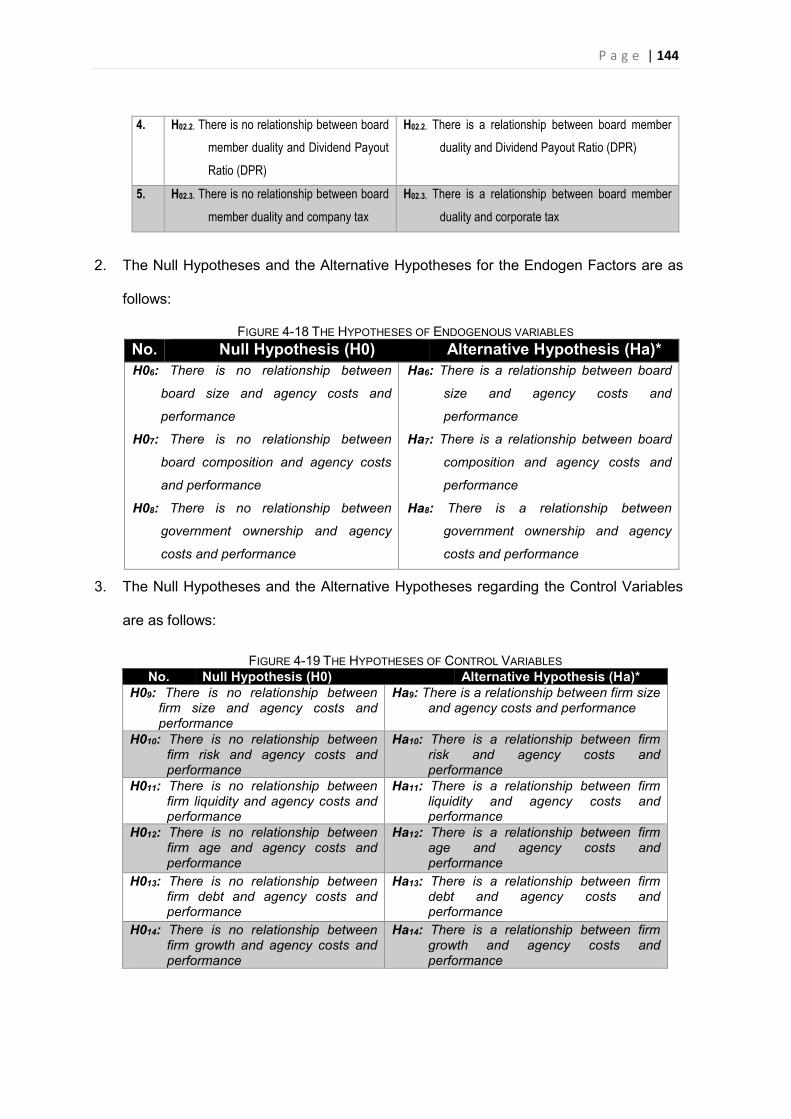
P a g e | 144
4. H02.2. There is no relationship between board member duality and Dividend Payout Ratio (DPR)
H02.2. There is a relationship between board member duality and Dividend Payout Ratio (DPR)
5. H02.3. There is no relationship between board member duality and company tax
H02.3. There is a relationship between board member duality and corporate tax
2. The Null Hypotheses and the Alternative Hypotheses for the Endogen Factors are as
follows:
FIGURE 4-18 THE HYPOTHESES OF ENDOGENOUS VARIABLES No. Null Hypothesis (H0) Alternative Hypothesis (Ha)* H06: There is no relationship between
board size and agency costs and
performance H07: There is no relationship between
board composition and agency costs
and performance H08: There is no relationship between
government ownership and agency
costs and performance
Ha6: There is a relationship between board
size and agency costs and
performance
Ha7: There is a relationship between board
composition and agency costs and
performance
Ha8: There is a relationship between
government ownership and agency
costs and performance
3. The Null Hypotheses and the Alternative Hypotheses regarding the Control Variables
are as follows:
FIGURE 4-19 THE HYPOTHESES OF CONTROL VARIABLES No. Null Hypothesis (H0) Alternative Hypothesis (Ha)*
H09: There is no relationship between firm size and agency costs and performance
Ha9: There is a relationship between firm size and agency costs and performance
H010: There is no relationship between firm risk and agency costs and performance
Ha10: There is a relationship between firm risk and agency costs and performance
H011: There is no relationship between firm liquidity and agency costs and performance
Ha11: There is a relationship between firm liquidity and agency costs and performance
H012: There is no relationship between firm age and agency costs and performance
Ha12: There is a relationship between firm age and agency costs and performance
H013: There is no relationship between firm debt and agency costs and performance
Ha13: There is a relationship between firm debt and agency costs and performance
H014: There is no relationship between firm growth and agency costs and performance
Ha14: There is a relationship between firm growth and agency costs and performance
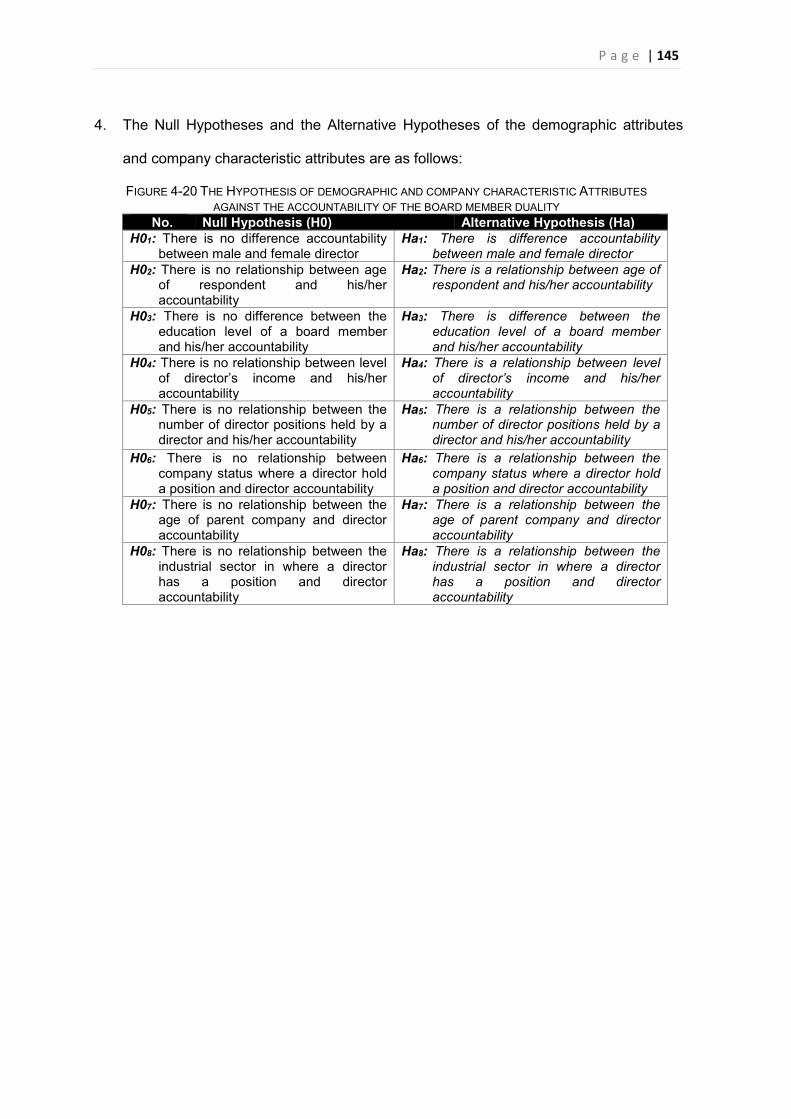
P a g e | 145
4. The Null Hypotheses and the Alternative Hypotheses of the demographic attributes
and company characteristic attributes are as follows:
FIGURE 4-20 THE HYPOTHESIS OF DEMOGRAPHIC AND COMPANY CHARACTERISTIC ATTRIBUTES AGAINST THE ACCOUNTABILITY OF THE BOARD MEMBER DUALITY
No. Null Hypothesis (H0) Alternative Hypothesis (Ha) H01: There is no difference accountability
between male and female director Ha1: There is difference accountability
between male and female director H02: There is no relationship between age
of respondent and his/her accountability
Ha2: There is a relationship between age of respondent and his/her accountability
H03: There is no difference between the education level of a board member and his/her accountability
Ha3: There is difference between the education level of a board member and his/her accountability
H04: There is no relationship between level of director’s income and his/her accountability
Ha4: There is a relationship between level of director’s income and his/her accountability
H05: There is no relationship between the number of director positions held by a director and his/her accountability
Ha5: There is a relationship between the number of director positions held by a director and his/her accountability
H06: There is no relationship between company status where a director hold a position and director accountability
Ha6: There is a relationship between the company status where a director hold a position and director accountability
H07: There is no relationship between the age of parent company and director accountability
Ha7: There is a relationship between the age of parent company and director accountability
H08: There is no relationship between the industrial sector in where a director has a position and director accountability
Ha8: There is a relationship between the industrial sector in where a director has a position and director accountability
P a g e | 146
CHAPTER 5: RESEARCH METHODOLOGY “Everything must be taken into account. If the fact will not fit the theory—let the theory go.” Agatha Christie, The Mysterious Affair at Styles.
INTRODUCTION
This chapter comprises eight (8) sections which will elaborate the research methodology
which begins with SECTION 5.1: RESEARCH PROCESS which describes step-by-step the
research process conducted for this study. The research began with a research proposal
and will conclude with data analysis and interpretation. A detailed and comprehensive
description of the research methodology begins in section 5.3: Research Design.
SECTION 5.2: RESEARCH QUALITY will examine four factors which are usually taken into
consideration when evaluating the quality of a research. These factors are: validity,
reliability, generalisability, and objectivity.
SECTION 5.3: RESEARCH DESIGN will describe the strategy used to integrate the various
components of the research in a logical and coherent way in order to address the research
questions effectively. The main aim of the research questions is to determine whether
there is a correlation between the board member duality and agency costs in parent and
subsidiary companies which follow the two-tier board system in the state-owned
enterprises in Indonesia. The two of the most important parts of the research design,
namely research method and research instrumentation, will be described in detail.
SECTION 5.4: RESEARCH PROCEDURES will describe about how to collect the data as
defined in the previous section. This includes the preparation for the survey questionnaires
and interview questionnaires which will result primary data, and database design to
acquire secondary data. All the preparation process and documents herewith have to be
P a g e | 147
informed and enclosed to the ethics application. Thus, the human research ethics approval
from the ethics committee of the Victoria University is a must before acquiring the data.
This process will be described in this section, as well.
SECTION 5.5: DATA COLLECTION will elaborate the process of collecting data from
respondents. The data comprises primary data, which is collected from respondents using
the research instrument of survey and interview, and secondary data, which is collected
from the annual reports of the state owned enterprises and their subsidiary companies for
the period of 2008 until 2013.
SECTION 5.6: DATA RECORDING AND MANAGEMENT will elaborate the process of recording
primary data and secondary data, and how to manage the data in order to be available as
required for analysis and interpretation. This section will include the transcript resulted
from interview and the coding of data.
SECTION 5.7: DATA ANALYSIS AND INTERPRETATION will present the analysis of the data
gathered through surveys, interviews, and panel data. These data will be processed by
using two research survey tools - Qualtrics software and E-views software.
SECTION 5.8: LIMITATION covers the situation and assumptions that the research analyses
are supposed to be occur, but several assumptions are not applicable, due to the data
acquired.
SECTION SUMMARY will summarise all main points of previous sections and will lead into
the next chapter.
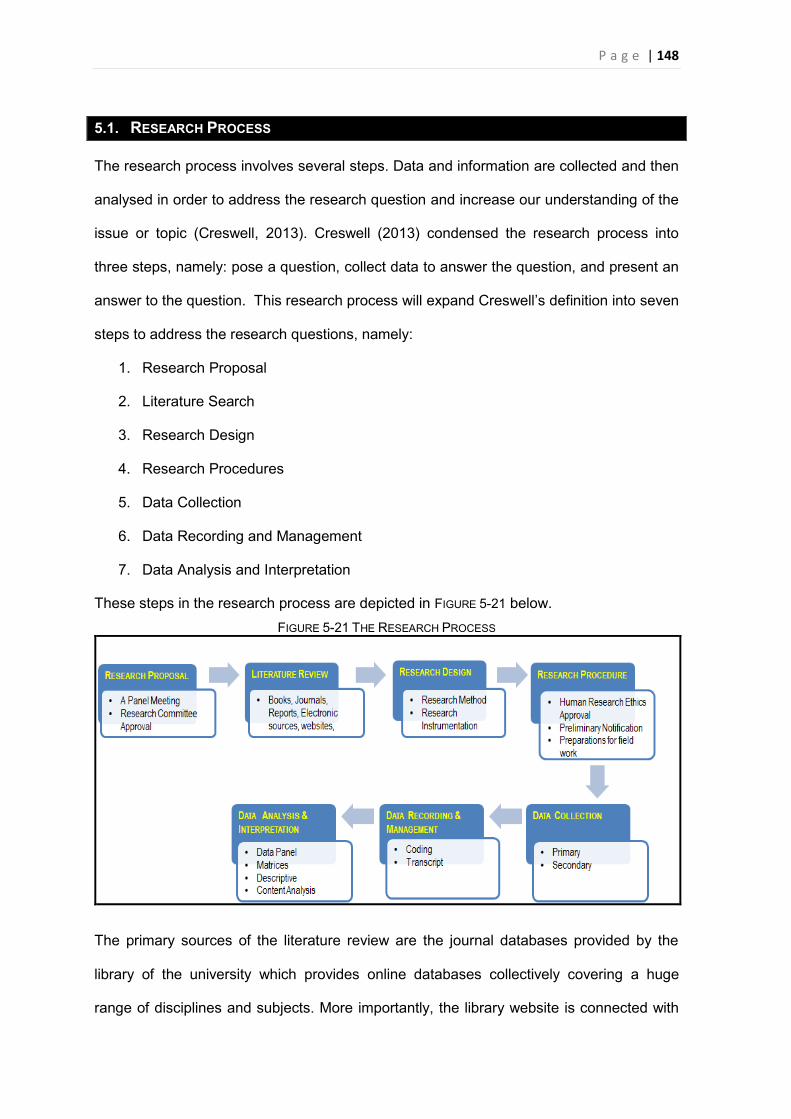
P a g e | 148
5.1. RESEARCH PROCESS
The research process involves several steps. Data and information are collected and then
analysed in order to address the research question and increase our understanding of the
issue or topic (Creswell, 2013). Creswell (2013) condensed the research process into
three steps, namely: pose a question, collect data to answer the question, and present an
answer to the question. This research process will expand Creswell’s definition into seven
steps to address the research questions, namely:
1. Research Proposal
2. Literature Search
3. Research Design
4. Research Procedures
5. Data Collection
6. Data Recording and Management
7. Data Analysis and Interpretation
These steps in the research process are depicted in FIGURE 5-21 below. FIGURE 5-21 THE RESEARCH PROCESS
The primary sources of the literature review are the journal databases provided by the
library of the university which provides online databases collectively covering a huge
range of disciplines and subjects. More importantly, the library website is connected with
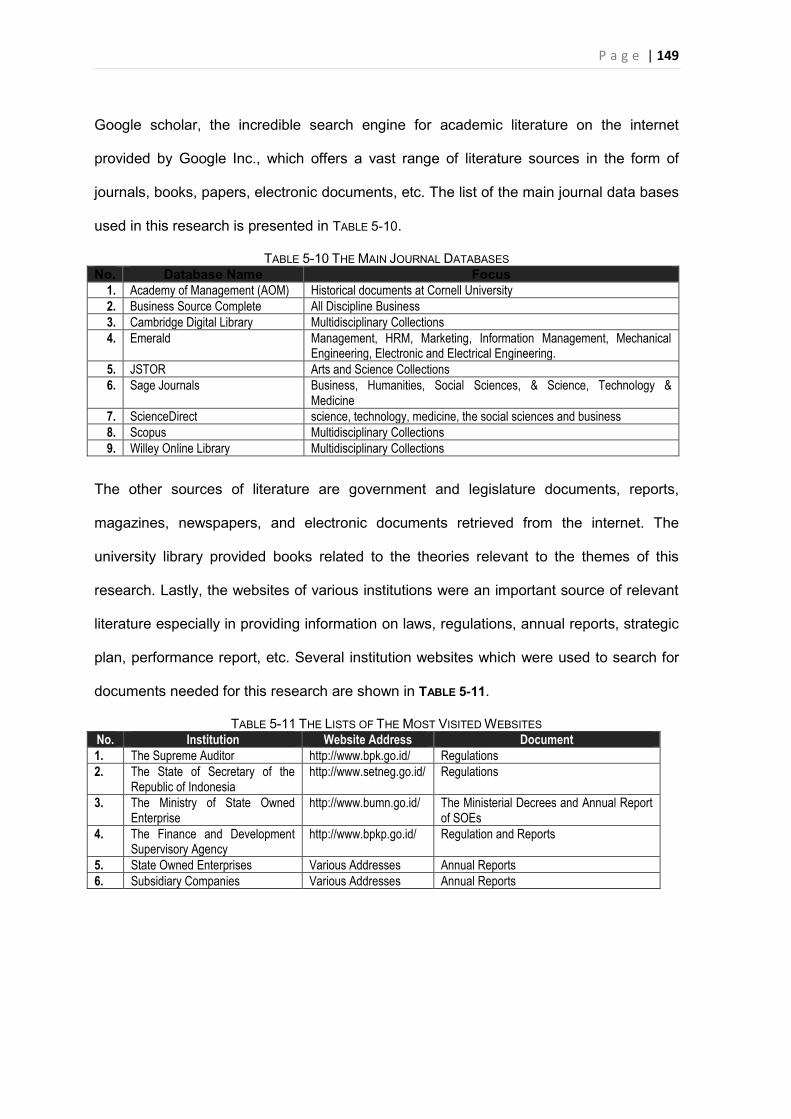
P a g e | 149
Google scholar, the incredible search engine for academic literature on the internet
provided by Google Inc., which offers a vast range of literature sources in the form of
journals, books, papers, electronic documents, etc. The list of the main journal data bases
used in this research is presented in TABLE 5-10.
TABLE 5-10 THE MAIN JOURNAL DATABASES No. Database Name Focus
1. Academy of Management (AOM) Historical documents at Cornell University 2. Business Source Complete All Discipline Business 3. Cambridge Digital Library Multidisciplinary Collections 4. Emerald Management, HRM, Marketing, Information Management, Mechanical
Engineering, Electronic and Electrical Engineering. 5. JSTOR Arts and Science Collections 6. Sage Journals Business, Humanities, Social Sciences, & Science, Technology &
Medicine 7. ScienceDirect science, technology, medicine, the social sciences and business 8. Scopus Multidisciplinary Collections 9. Willey Online Library Multidisciplinary Collections
The other sources of literature are government and legislature documents, reports,
magazines, newspapers, and electronic documents retrieved from the internet. The
university library provided books related to the theories relevant to the themes of this
research. Lastly, the websites of various institutions were an important source of relevant
literature especially in providing information on laws, regulations, annual reports, strategic
plan, performance report, etc. Several institution websites which were used to search for
documents needed for this research are shown in TABLE 5-11.
TABLE 5-11 THE LISTS OF THE MOST VISITED WEBSITES No. Institution Website Address Document 1. The Supreme Auditor http://www.bpk.go.id/ Regulations 2. The State of Secretary of the
Republic of Indonesia http://www.setneg.go.id/ Regulations
3. The Ministry of State Owned Enterprise
http://www.bumn.go.id/ The Ministerial Decrees and Annual Report of SOEs
4. The Finance and Development Supervisory Agency
http://www.bpkp.go.id/ Regulation and Reports
5. State Owned Enterprises Various Addresses Annual Reports 6. Subsidiary Companies Various Addresses Annual Reports
P a g e | 150
5.2. RESEARCH QUALITY
The research quality will be determined by four quality aspects, namely validity, reliability,
generalisability, and objectivity (Mishra, 2004). These quality factors should be involved in
the research process, so that the process is rigorous, can be repeated, will produce the
same results, and will be of some benefit as mentioned in Chapter 1 in the section
explaining the contribution of the research project .
5.2.1. Validity
Essentially, validity means that the conceptual framework of the research, the
measurements used, and the conclusions drawn from the research project will be an
accurate reflection of a real-world phenomenon or situation (Seliger et al., 1989). Validity
also applies to the contents of the research project (content validity), the measurement
approach or the instrument(s) used in the research project which is called the concurrent
validity, and the use of variables in the research project which can predict the result
accurately, known as the predictive validity. These three components of validity are
discussed in detail below.
1) Content Validity
Content validity is the extent to which all contents of the research are relevant to what is
being examined. Board member duality in the governance of parent and subsidiary
companies in the state-owned enterprises in Indonesia is very common. However, there is
no consensus on whether this duality structure will increase agency costs and company
performance or otherwise. Agency costs, the costs incurred as a result of an agency
problem, which have a greater chance of occurring in such a relationship, probably can
explain this phenomenon. Thus, the correlation between board member duality and
agency costs in parent and subsidiary governance are valid theorized issues to be
investigated.
P a g e | 151
Several other relevant issues that are covered in this research project include the cost and
benefit of the board member duality, regulation of the board member duality, ethics and
integrity, the roles of the dual director, and financial accountability. All of those issues will
be addressed in the formulation of survey and interview questions which will be the
research instruments used for acquiring primary data. However, the conclusions drawn
from primary data only, may not be accurate since all business activities will impact on
financial figures. Thus, the issues that emerge from the survey and questionnaires will be
compared to secondary data, i.e. the financial figures extracted from companies’ annual
reports.
2) Concurrent Validity
Concurrent validity can be assessed by by comparing primary data obtained from one
source with secondary panel data. These were modelled using multiple regression
analysis similar to previous research (see Chapter 4). This measurement approach was
used in previous research on corporate director duality which also measured agency costs
and performance. The primary data which will be acquired using surveys and interviews,
will be processed using the Qualtrics software and will include the descriptive statistics
embedded in the software. The result of the primary data processing will be used to
explain the results of regression analysis of panel data of the secondary data (as
explanatory variables).
3) Predictive Validity
The research project will use control variables and endogenous factors that were
generally used in previous research to investigate similar themes (see Chapter 4). The
use of variables and endogenous factors which are the same as those in previous
research is intended to give the predictive values which have been hypothesized, but in a
different context. Basically, the dependent variable is ‘agency costs’ measured by asset
turnover and operating expenses; and the independent variable is ‘board member duality’.
P a g e | 152
Then, several control variables which are usually used by researchers in this research
topic such as, firm age, firm size, firm risk, firm growth, liquidity, and debt, and two
endogenous variables, namely board size and ownership, will be formulated into
regression analysis as panel data. In addition, company performance measurements such
as earnings before interest and taxes, corporate tax, and dividends are also applied using
a similar formula as for dependent variables, to predict the impact of the board member
duality in parent and subsidiary companies of state-owned enterprises. This is intended to
measure the correlation between board member duality and agency costs.
5.2.2. Reliability
Primary data and secondary data collected from the field work of this research should
always be able to be tested. The data for this research was collected from reliable sources
including the respondents and the annual reports downloaded from formal websites.
Reliability is determined by testing whether the formula used to find the impact of the
board member duality on agency costs can produce consistent results when repeated by
other researchers. Reliability is also characterized by objectivity and precision (Mishra,
2004). Prior to distributing the questionnaires to respondents for the collection of primary
data, the questionnaire contents were discussed with academics and practitioners who
had expertise in the area of corporate governance and performance. The practitioners
included an expert on state-owned enterprises in Indonesia. In addition, some content of
the questionnaire was adopted from previous research conducted by Ismail (2013).
5.2.3. Generalisability
Board member duality, which is one of the relationship mechanisms between parent and
subsidiary companies, usually exists in companies whose corporate board structure
follows the two-tier model. Thus, essentially, the research results could apply to all
situations where there is board member duality in corporate boards which follow the two-
tier model. However, the specific focus of the research is the board member duality
P a g e | 153
occurring in the state-owned enterprises in Indonesia. Thus, the research findings might
be different in a different research context such as board member duality in private
sectors or board member duality in other countries which have a different legal
infrastructure, politics, culture, and best practices.
5.2.4. Objectivity
The phenomenon of board member duality which is proposed by the researcher is a
reality that exists in state-owned enterprises in Indonesia which have one or more
subsidiary companies. The research process adhered to objectivity principles, in the
sense that this research avoided personal prejudice, preference, and/or predilection of
researcher. Thus, the bias which is often associated with findings as identified by
Silverman (2000) is expected not to occur in this research. Leedy and Ormrod (2001)
stated that bias is “any influence, condition or sets of condition that singly or together
distort data”. Hence, every care should be taken to minimize bias throughout the research
process. Firstly, every step of the research process from the research proposal to the
interpretation of results has gone through a review process. Secondly, statistical methods
are used for calculating the number and categorizing the characteristics of respondent
sample prior to data collection. Thirdly, the data collection process was conducted
according to appropriate research and ethical procedure. Fourthly, secondary data was
extracted from annual reports that are published on formal sites, and from formal
documents made available by the Ministry of State Owned Enterprise. Lastly, data
processing and analysis was conducted using application software, namely Qualtrics web-
based software and E-views software. However, Silverman (2000) and Leedy and Ormrod
(2001) also acknowledge that it is really difficult to avoid contamination with some form of
bias when data are collected. Thus, the absolute objectivity of the researcher may also not
be possible. However, at least some degree of value neutrality is possible and some
aspects of objectivity should be maintained and defended (Mishra, 2004).
P a g e | 154
5.3. RESEARCH DESIGN
RESEARCH DESIGN is developed in order to address the research problems defined in the
research proposal. It includes the research method used for collecting and processing
data.
This research uses the Triangulation Method commonly known as the mixed-method
approach which combines quantitative and qualitative data to address the research
problem. The triangulation method is intended to produce more comprehensive
conclusions and more importantly, it strengthens the instruments used to acquire
qualitative and quantitative data.
For the purpose of analysis, this research uses the secondary data collected from the
financial data extracted from the annual reports of the state-owned enterprises and their
subsidiary companies. The financial figures published in the annual reports have already
been audited by public accountants; thus, it is expected that the financial figures will give
an accurate indication of the agency costs. Then, the result of the primary data derived
from surveys and interviews will be used as explanatory variables for the findings from the
secondary data. The analysis tool used for the secondary data is panel data analysis
which combines longitudinal data and cross-sectional data of parent companies and their
subsidiaries which are available for the 5-year period from 2008 until 2013.
5.3.1. Research Method
1) Triangulation Method
The triangulation method is a research method whereby more than one
approach is used to obtain richer and more comprehensive data, and is
intended to confirm the validity of the research results. This method enables
researchers to use both qualitative and quantitative data. Flick (2014) argued
that the triangulation method is just a mixed methods research, whereas
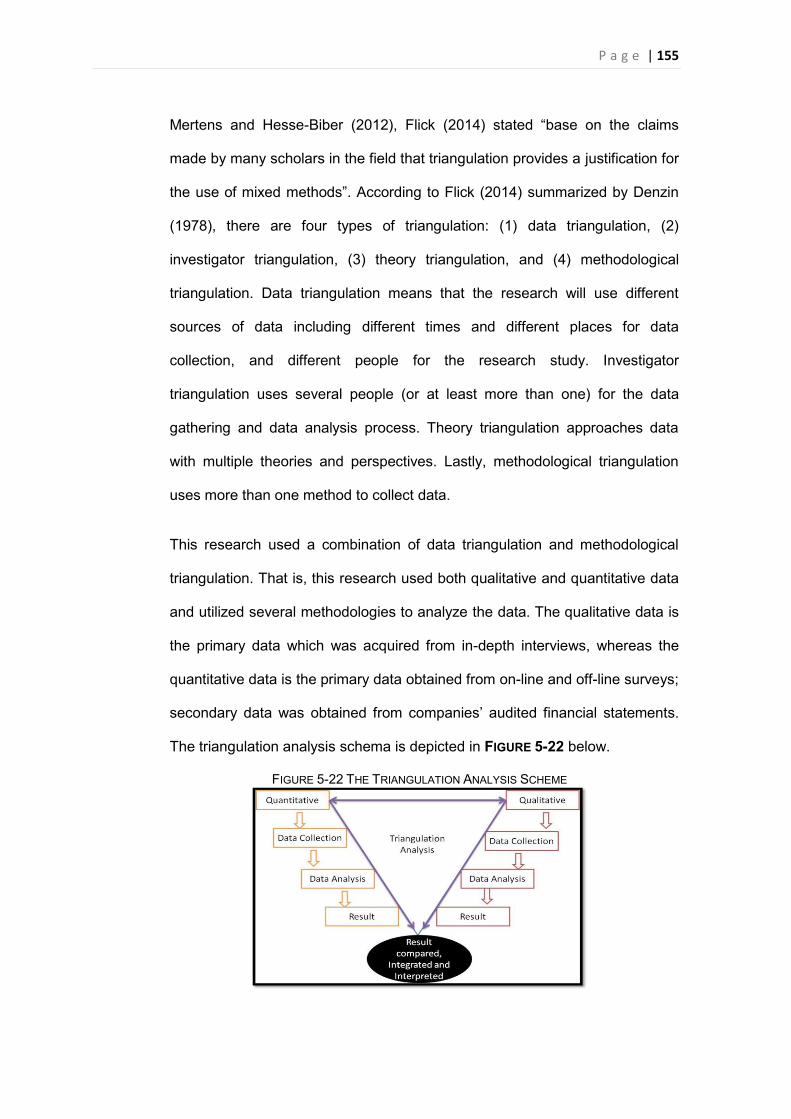
P a g e | 155
Mertens and Hesse-Biber (2012), Flick (2014) stated “base on the claims
made by many scholars in the field that triangulation provides a justification for
the use of mixed methods”. According to Flick (2014) summarized by Denzin
(1978), there are four types of triangulation: (1) data triangulation, (2)
investigator triangulation, (3) theory triangulation, and (4) methodological
triangulation. Data triangulation means that the research will use different
sources of data including different times and different places for data
collection, and different people for the research study. Investigator
triangulation uses several people (or at least more than one) for the data
gathering and data analysis process. Theory triangulation approaches data
with multiple theories and perspectives. Lastly, methodological triangulation
uses more than one method to collect data.
This research used a combination of data triangulation and methodological
triangulation. That is, this research used both qualitative and quantitative data
and utilized several methodologies to analyze the data. The qualitative data is
the primary data which was acquired from in-depth interviews, whereas the
quantitative data is the primary data obtained from on-line and off-line surveys;
secondary data was obtained from companies’ audited financial statements.
The triangulation analysis schema is depicted in FIGURE 5-22 below.
FIGURE 5-22 THE TRIANGULATION ANALYSIS SCHEME
P a g e | 156
Qualitative data was analyzed using Qualtrics web-based software which
provided descriptive and inferential statistics (Snow and Mann, 2013), which
were compared with the results of the in-depth interviews. Quantitative data was
structured as panel data which was analyzed using E-views software (Baltagi,
2008). Then, the results of both quantitative and qualitative analysis were
compared, integrated, and interpreted.
The primary data and secondary data were not collected sequentially but were
acquired at the same time, in the sense that survey, interview, and secondary
data are collected during same data collection period that is, from October to
December 2014. However, the primary and secondary data were used for
different purposes. The primary data was used to support and explain the
results of the secondary data. That is, the surveys and interviews were used to
explain, for example, the accountability of the board member duality, based on
the result of the secondary data.
2) Justification for the Method
The triangulation method, commonly known as the mixed methods approach,
combines qualitative and quantitative data and also combines the instruments
used in the research. In the real world, the needs of both qualitative and
quantitative data to explain a phenomenon comprehensively cannot be avoided.
This is consistent with Olsen (2004) who argued that triangulation is not aimed
merely at validation but at deepening and widening one’s understanding.
Thurmond (2001) extended that argument through her research that found that
“the intent of using triangulation is to decrease, negate, or counterbalance the
deficiency of a single strategy”. This research used a survey and in-depth
interviews to acquire primary data, whereas a data panel extracted from a
financial database was used to analyse the secondary data. The primary data
P a g e | 157
was analyzed using statistical methods which are integrated in the university’s
Qualtrics web-based software. Then, the secondary data was structured into
panel data and analyzed using E-view software.
5.3.2. Research Instrumentation
1) Panel Data
Panel data, otherwise known as longitudinal or cross-sectional time series data,
was used in this research. The secondary data was acquired from the annual
reports of the parent companies and their subsidiary companies published on the
internet. This secondary data was structured into panel data which captured the
financial data having the longitudinal data and the cross-sectional data
characteristics for the five-year period from 2009 until 2013 inclusive. The unit of
analysis of the panel data is a company, which is different from the unit of analysis
of the survey and interviews which involved corporate board members. Thus, the
results of the survey and interviews are expected to confirm the results obtained
from panel data analysis.
(1) Data structure and sample
The data is designed to be balanced, where the number of time observations
(T) is the same for each company. Then, the data was also designed as a
short panel, where the number of companies (N) is greater than the number of
time periods (T). The sample data comprised financial data obtained from
state-owned enterprises which have a parent-subsidiary relationship. The
sample consisted of state-owned enterprises that have a parent-subsidiary
relationship and that publish their annual reports on the internet. The data
structure is as follows:
1. Unit analysis: company
2. Object analysis: endogen factors and variables defined
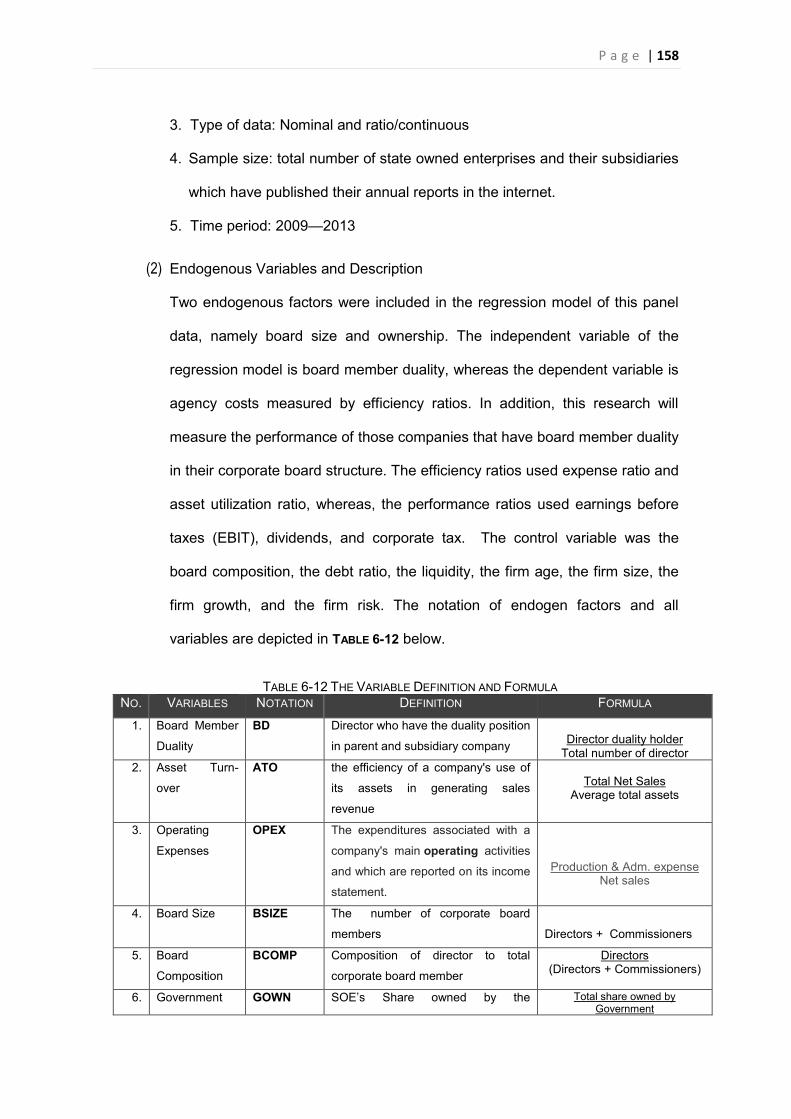
P a g e | 158
3. Type of data: Nominal and ratio/continuous
4. Sample size: total number of state owned enterprises and their subsidiaries
which have published their annual reports in the internet.
5. Time period: 2009—2013
(2) Endogenous Variables and Description
Two endogenous factors were included in the regression model of this panel
data, namely board size and ownership. The independent variable of the
regression model is board member duality, whereas the dependent variable is
agency costs measured by efficiency ratios. In addition, this research will
measure the performance of those companies that have board member duality
in their corporate board structure. The efficiency ratios used expense ratio and
asset utilization ratio, whereas, the performance ratios used earnings before
taxes (EBIT), dividends, and corporate tax. The control variable was the
board composition, the debt ratio, the liquidity, the firm age, the firm size, the
firm growth, and the firm risk. The notation of endogen factors and all
variables are depicted in TABLE 6-12 below.
TABLE 6-12 THE VARIABLE DEFINITION AND FORMULA
NO. VARIABLES NOTATION DEFINITION FORMULA
1. Board Member
Duality
BD Director who have the duality position
in parent and subsidiary company
Director duality holder
Total number of director 2. Asset Turn-
over
ATO the efficiency of a company's use of
its assets in generating sales
revenue
Total Net Sales
Average total assets
3. Operating
Expenses
OPEX The expenditures associated with a
company's main operating activities
and which are reported on its income
statement.
Production & Adm. expense Net sales
4. Board Size BSIZE The number of corporate board
members
Directors + Commissioners
5. Board
Composition
BCOMP Composition of director to total
corporate board member
Directors (Directors + Commissioners)
6. Government GOWN SOE’s Share owned by the Total share owned by Government
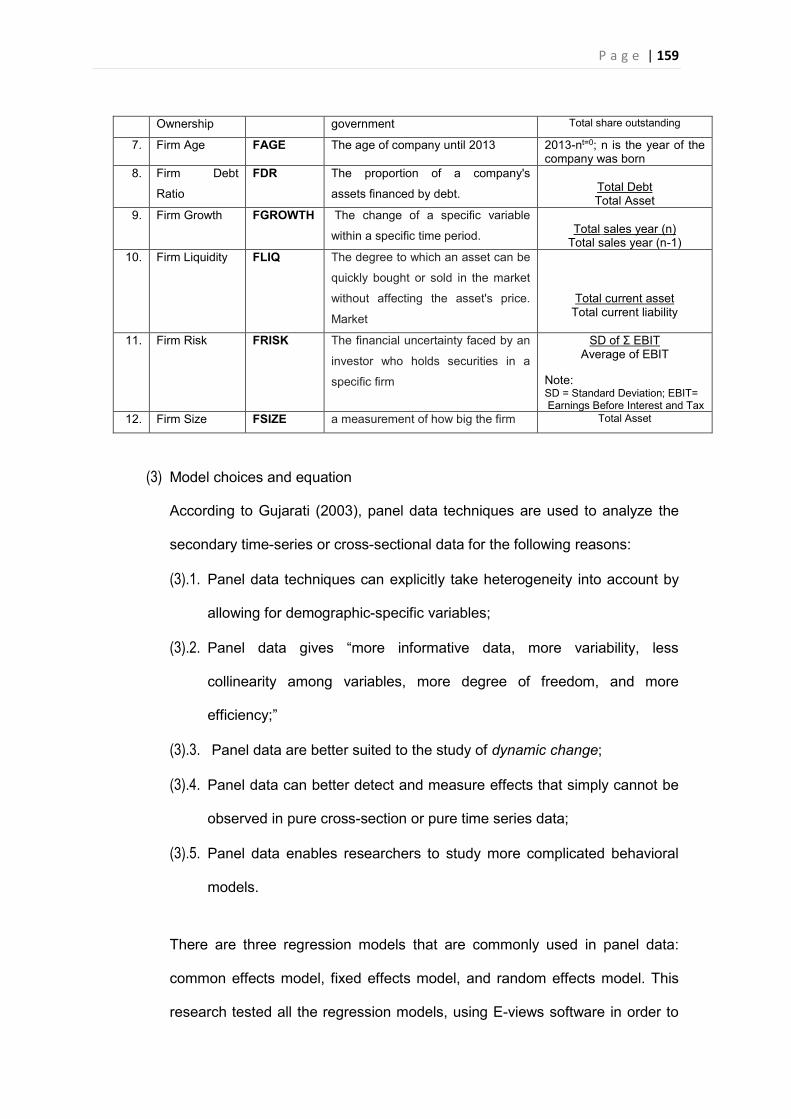
P a g e | 159
Ownership government Total share outstanding
7. Firm Age FAGE The age of company until 2013 2013-nt=0; n is the year of the company was born
8. Firm Debt
Ratio
FDR The proportion of a company's
assets financed by debt.
Total Debt Total Asset
9. Firm Growth FGROWTH The change of a specific variable
within a specific time period.
Total sales year (n)
Total sales year (n-1) 10. Firm Liquidity FLIQ The degree to which an asset can be
quickly bought or sold in the market
without affecting the asset's price.
Market
Total current asset Total current liability
11. Firm Risk FRISK The financial uncertainty faced by an
investor who holds securities in a
specific firm
SD of Ʃ EBIT Average of EBIT
Note: SD = Standard Deviation; EBIT= Earnings Before Interest and Tax
12. Firm Size FSIZE a measurement of how big the firm Total Asset
(3) Model choices and equation
According to Gujarati (2003), panel data techniques are used to analyze the
secondary time-series or cross-sectional data for the following reasons:
(3).1. Panel data techniques can explicitly take heterogeneity into account by
allowing for demographic-specific variables;
(3).2. Panel data gives “more informative data, more variability, less
collinearity among variables, more degree of freedom, and more
efficiency;”
(3).3. Panel data are better suited to the study of dynamic change;
(3).4. Panel data can better detect and measure effects that simply cannot be
observed in pure cross-section or pure time series data;
(3).5. Panel data enables researchers to study more complicated behavioral
models.
There are three regression models that are commonly used in panel data:
common effects model, fixed effects model, and random effects model. This
research tested all the regression models, using E-views software in order to
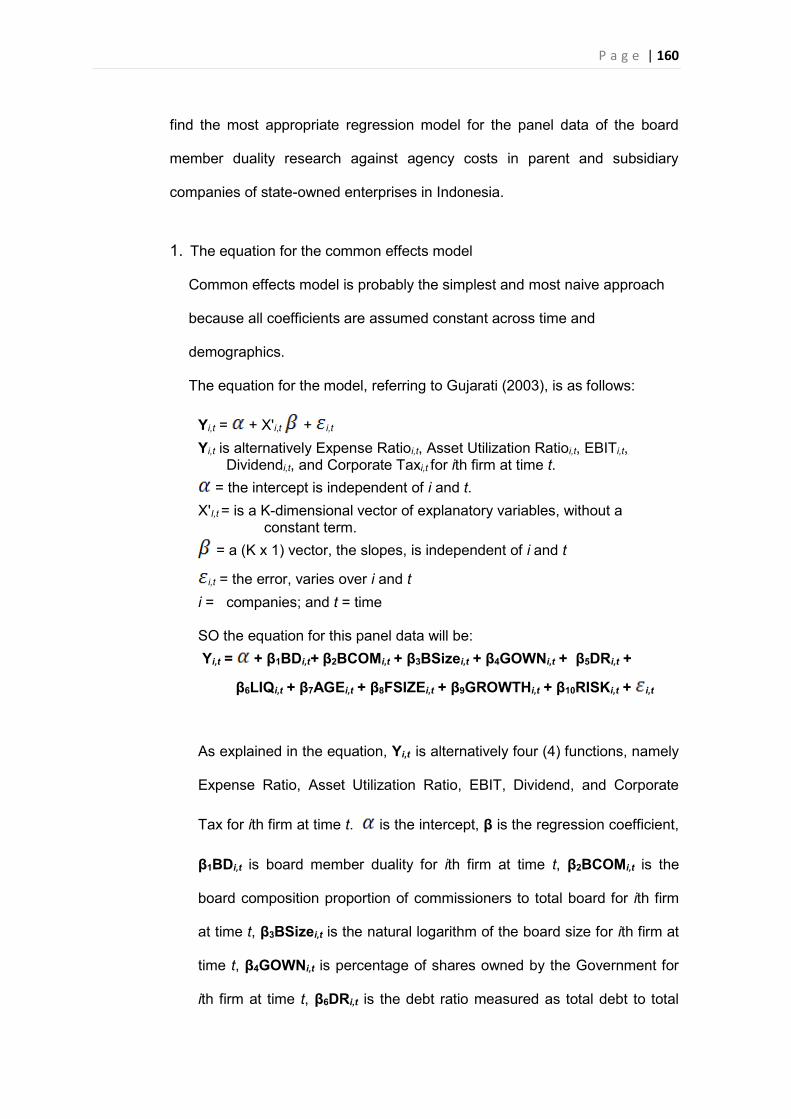
P a g e | 160
find the most appropriate regression model for the panel data of the board
member duality research against agency costs in parent and subsidiary
companies of state-owned enterprises in Indonesia.
1. The equation for the common effects model
Common effects model is probably the simplest and most naive approach
because all coefficients are assumed constant across time and
demographics.
The equation for the model, referring to Gujarati (2003), is as follows:
Yi,t = + X'i,t + i,t
Yi,t is alternatively Expense Ratioi,t, Asset Utilization Ratioi,t, EBITi,t, Dividendi,t, and Corporate Taxi,t for ith firm at time t.
= the intercept is independent of i and t. X'I,t = is a K-dimensional vector of explanatory variables, without a
constant term. = a (K x 1) vector, the slopes, is independent of i and t
i,t = the error, varies over i and t i = companies; and t = time SO the equation for this panel data will be: Yi,t = + β1BDi,t+ β2BCOMi,t + β3BSizei,t + β4GOWNi,t + β5DRi,t +
β6LIQi,t + β7AGEi,t + β8FSIZEi,t + β9GROWTHi,t + β10RISKi,t + i,t
As explained in the equation, Yi,t is alternatively four (4) functions, namely
Expense Ratio, Asset Utilization Ratio, EBIT, Dividend, and Corporate
Tax for ith firm at time t. is the intercept, β is the regression coefficient,
β1BDi,t is board member duality for ith firm at time t, β2BCOMi,t is the
board composition proportion of commissioners to total board for ith firm
at time t, β3BSizei,t is the natural logarithm of the board size for ith firm at
time t, β4GOWNi,t is percentage of shares owned by the Government for
ith firm at time t, β6DRi,t is the debt ratio measured as total debt to total
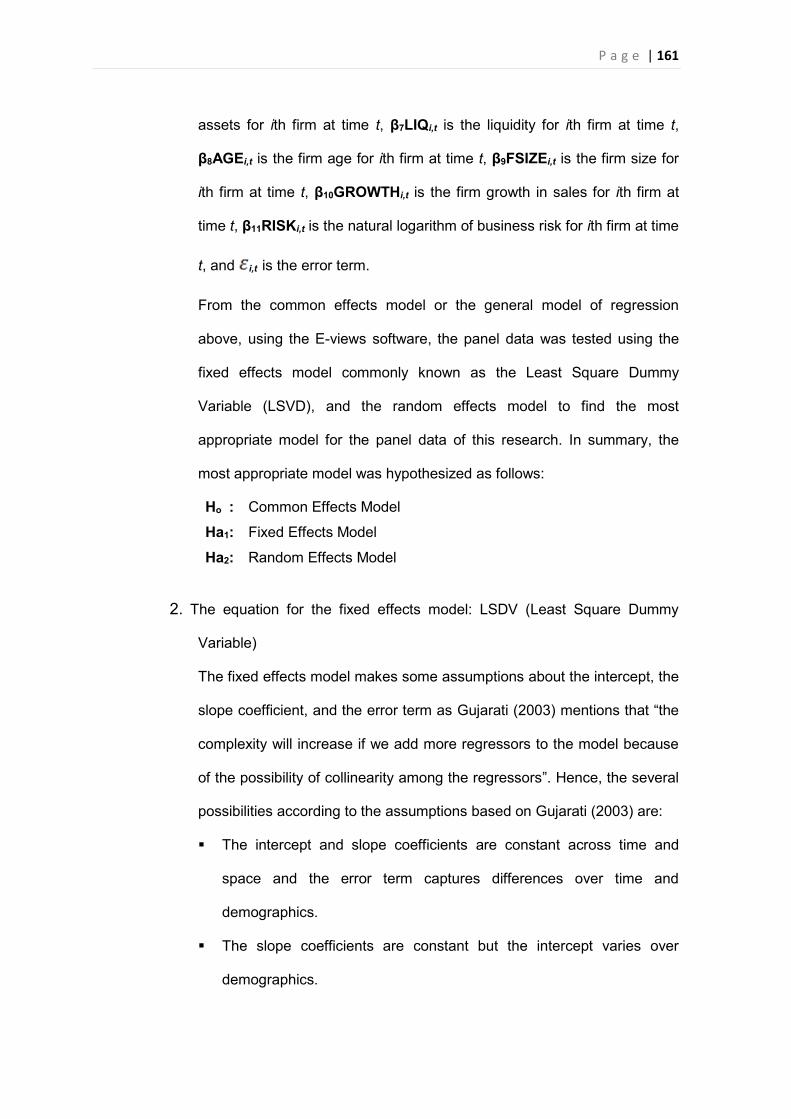
P a g e | 161
assets for ith firm at time t, β7LIQi,t is the liquidity for ith firm at time t,
β8AGEi,t is the firm age for ith firm at time t, β9FSIZEi,t is the firm size for
ith firm at time t, β10GROWTHi,t is the firm growth in sales for ith firm at
time t, β11RISKi,t is the natural logarithm of business risk for ith firm at time
t, and i,t is the error term.
From the common effects model or the general model of regression
above, using the E-views software, the panel data was tested using the
fixed effects model commonly known as the Least Square Dummy
Variable (LSVD), and the random effects model to find the most
appropriate model for the panel data of this research. In summary, the
most appropriate model was hypothesized as follows:
Ho : Common Effects Model
Ha1: Fixed Effects Model
Ha2: Random Effects Model
2. The equation for the fixed effects model: LSDV (Least Square Dummy
Variable)
The fixed effects model makes some assumptions about the intercept, the
slope coefficient, and the error term as Gujarati (2003) mentions that “the
complexity will increase if we add more regressors to the model because
of the possibility of collinearity among the regressors”. Hence, the several
possibilities according to the assumptions based on Gujarati (2003) are:
� The intercept and slope coefficients are constant across time and
space and the error term captures differences over time and
demographics.
� The slope coefficients are constant but the intercept varies over
demographics.
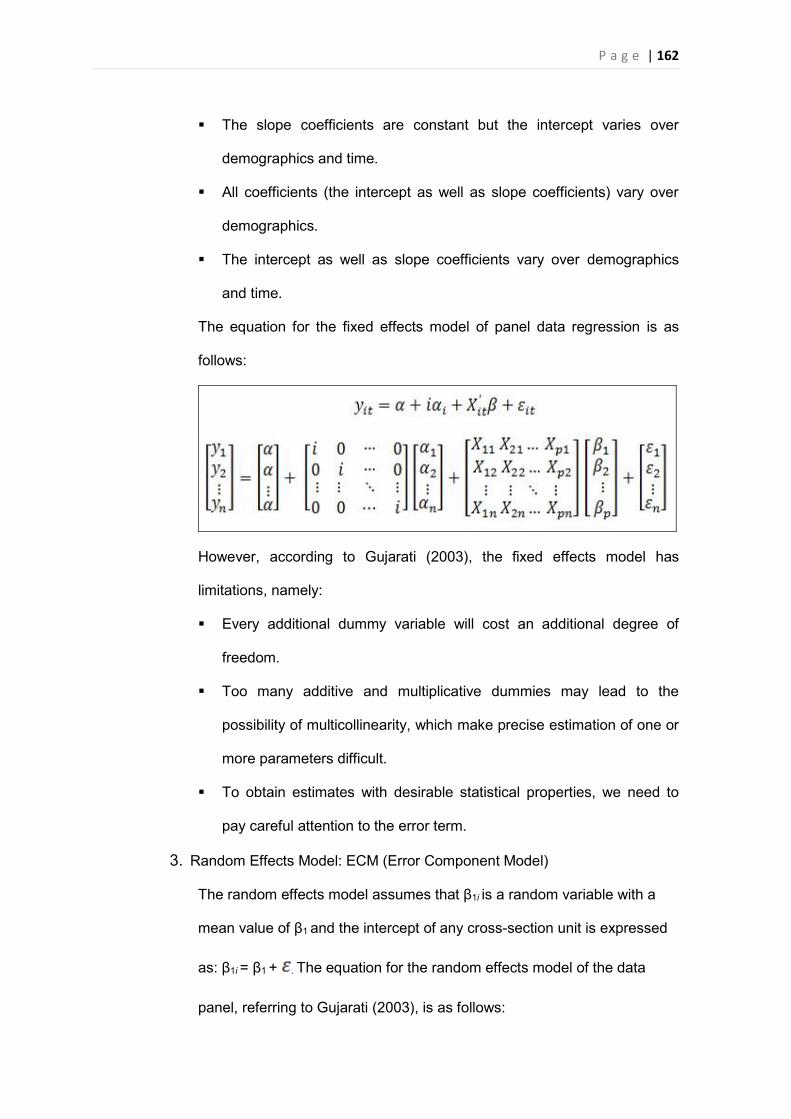
P a g e | 162
� The slope coefficients are constant but the intercept varies over
demographics and time.
� All coefficients (the intercept as well as slope coefficients) vary over
demographics.
� The intercept as well as slope coefficients vary over demographics
and time.
The equation for the fixed effects model of panel data regression is as
follows:
However, according to Gujarati (2003), the fixed effects model has
limitations, namely:
� Every additional dummy variable will cost an additional degree of
freedom.
� Too many additive and multiplicative dummies may lead to the
possibility of multicollinearity, which make precise estimation of one or
more parameters difficult.
� To obtain estimates with desirable statistical properties, we need to
pay careful attention to the error term.
3. Random Effects Model: ECM (Error Component Model)
The random effects model assumes that β1i is a random variable with a
mean value of β1 and the intercept of any cross-section unit is expressed
as: β1i = β1 + . The equation for the random effects model of the data
panel, referring to Gujarati (2003), is as follows:
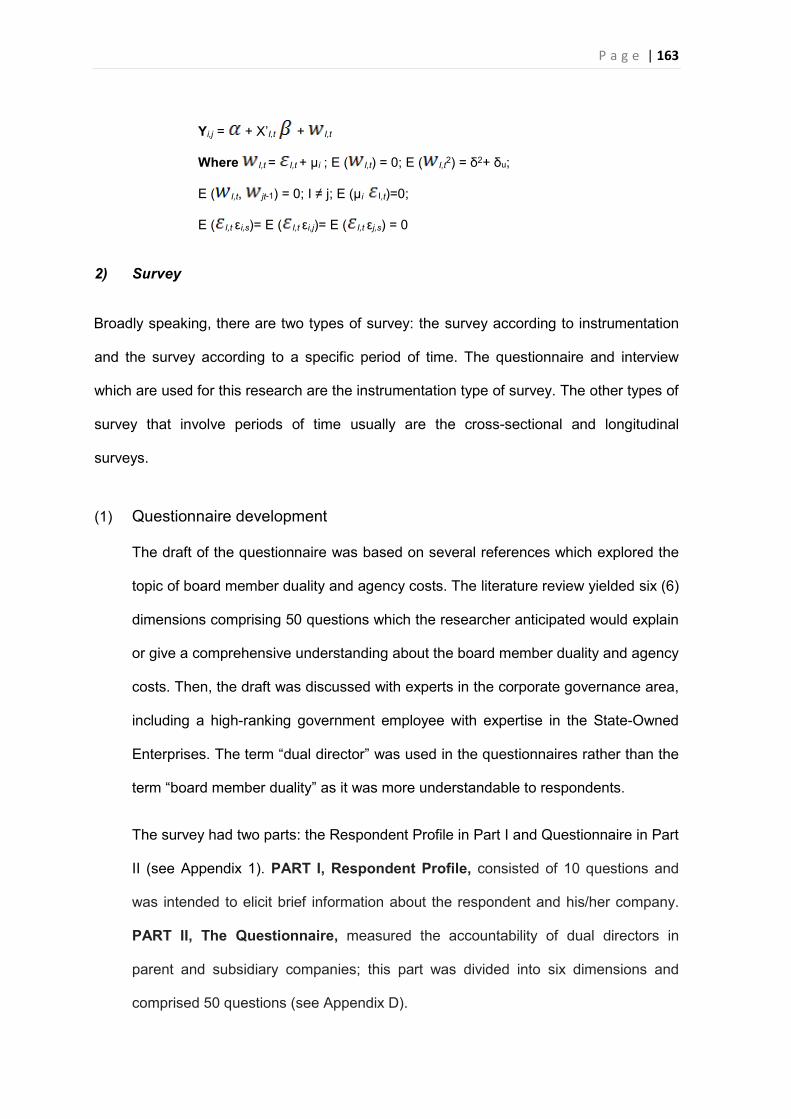
P a g e | 163
Yi,j = + X’I,t + I,t
Where I,t = I,t + µi ; E ( I,t) = 0; E ( I,t2) = δ2+ δu;
E ( I,t, jt-1) = 0; I ≠ j; E (µi I,t)=0;
E ( I,t εi,s)= E ( I,t εi,j)= E ( I,t εj,s) = 0
2) Survey
Broadly speaking, there are two types of survey: the survey according to instrumentation
and the survey according to a specific period of time. The questionnaire and interview
which are used for this research are the instrumentation type of survey. The other types of
survey that involve periods of time usually are the cross-sectional and longitudinal
surveys.
(1) Questionnaire development
The draft of the questionnaire was based on several references which explored the
topic of board member duality and agency costs. The literature review yielded six (6)
dimensions comprising 50 questions which the researcher anticipated would explain
or give a comprehensive understanding about the board member duality and agency
costs. Then, the draft was discussed with experts in the corporate governance area,
including a high-ranking government employee with expertise in the State-Owned
Enterprises. The term “dual director” was used in the questionnaires rather than the
term “board member duality” as it was more understandable to respondents.
The survey had two parts: the Respondent Profile in Part I and Questionnaire in Part
II (see Appendix 1). PART I, Respondent Profile, consisted of 10 questions and
was intended to elicit brief information about the respondent and his/her company.
PART II, The Questionnaire, measured the accountability of dual directors in
parent and subsidiary companies; this part was divided into six dimensions and
comprised 50 questions (see Appendix D).
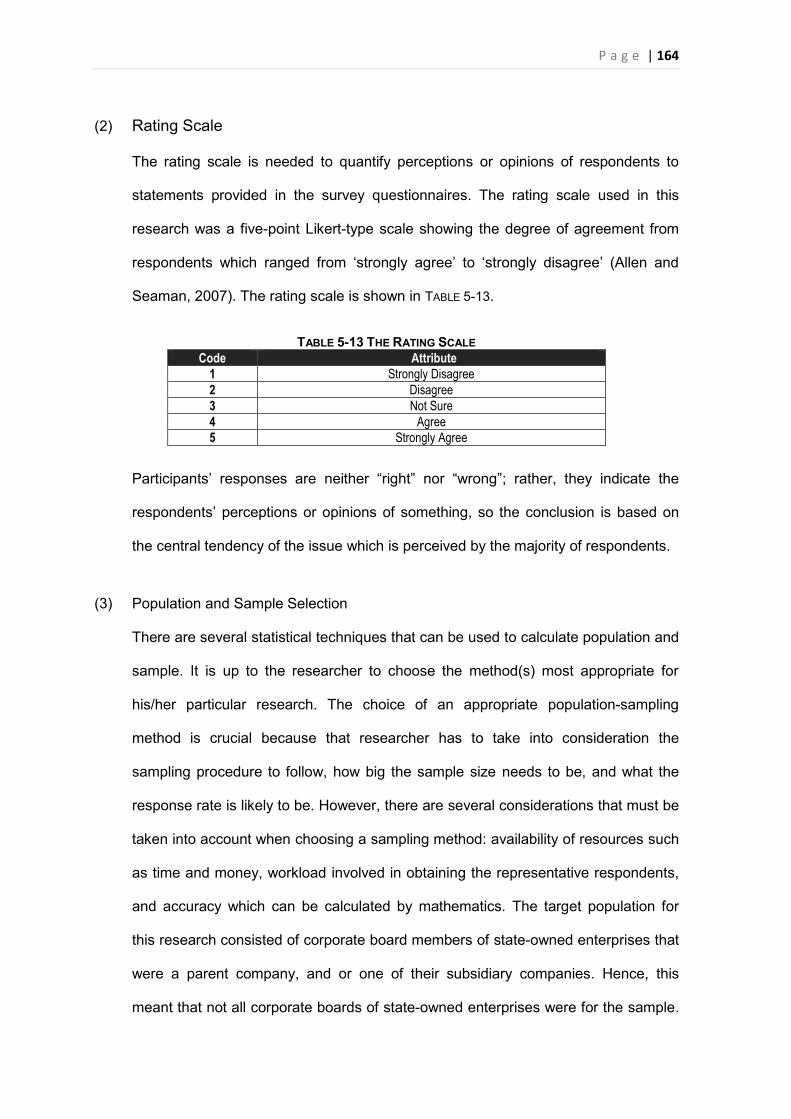
P a g e | 164
(2) Rating Scale
The rating scale is needed to quantify perceptions or opinions of respondents to
statements provided in the survey questionnaires. The rating scale used in this
research was a five-point Likert-type scale showing the degree of agreement from
respondents which ranged from ‘strongly agree’ to ‘strongly disagree’ (Allen and
Seaman, 2007). The rating scale is shown in TABLE 5-13.
TABLE 5-13 THE RATING SCALE Code Attribute
1 Strongly Disagree 2 Disagree 3 Not Sure 4 Agree 5 Strongly Agree
Participants’ responses are neither “right” nor “wrong”; rather, they indicate the
respondents’ perceptions or opinions of something, so the conclusion is based on
the central tendency of the issue which is perceived by the majority of respondents.
(3) Population and Sample Selection
There are several statistical techniques that can be used to calculate population and
sample. It is up to the researcher to choose the method(s) most appropriate for
his/her particular research. The choice of an appropriate population-sampling
method is crucial because that researcher has to take into consideration the
sampling procedure to follow, how big the sample size needs to be, and what the
response rate is likely to be. However, there are several considerations that must be
taken into account when choosing a sampling method: availability of resources such
as time and money, workload involved in obtaining the representative respondents,
and accuracy which can be calculated by mathematics. The target population for
this research consisted of corporate board members of state-owned enterprises that
were a parent company, and or one of their subsidiary companies. Hence, this
meant that not all corporate boards of state-owned enterprises were for the sample.
P a g e | 165
This research used convenience sampling which is a type of non-probability
sampling. This research used convenience sampling for several reasons:
(3).1. Not all companies publish the names of their corporate board members
especially for the subsidiary companies, so that it is difficult to know the
profiles of each corporate board member and whether board member duality
exists in the companies.
(3).2. Gaining access to corporate board members is extremely difficult, because
those in state-owned enterprises and their subsidiaries are very busy persons,
and may be reluctant or slow to respond to the invitation to participate in the
survey.
(3).3. Sometimes, bureaucratic processes are very complicated so it may take time
to just distribute the survey questionnaire by hand to the corporate board
members. Moreover, there may not be the technology available to distribute
the questionnaire electronically.
(3).4. Only hundreds of corporate board members in both parent and subsidiary
companies can readily be accessed using informal networking.
(3).5. A total sample of more than 30 respondents, commonly called N=30, is
considered as a big sample (Tanis and Hogg, 2001).
According to the data base of the state-owned enterprises and subsidiary
companies which was extracted from the website of the Ministry of State-Owned
Enterprises (http://www.bumn.go.id) per 31 December 2014, the total number of
state-owned enterprises is 119 companies, which comprises 59 parent companies
and 60 stand-alone companies. The total number of corporate board members in
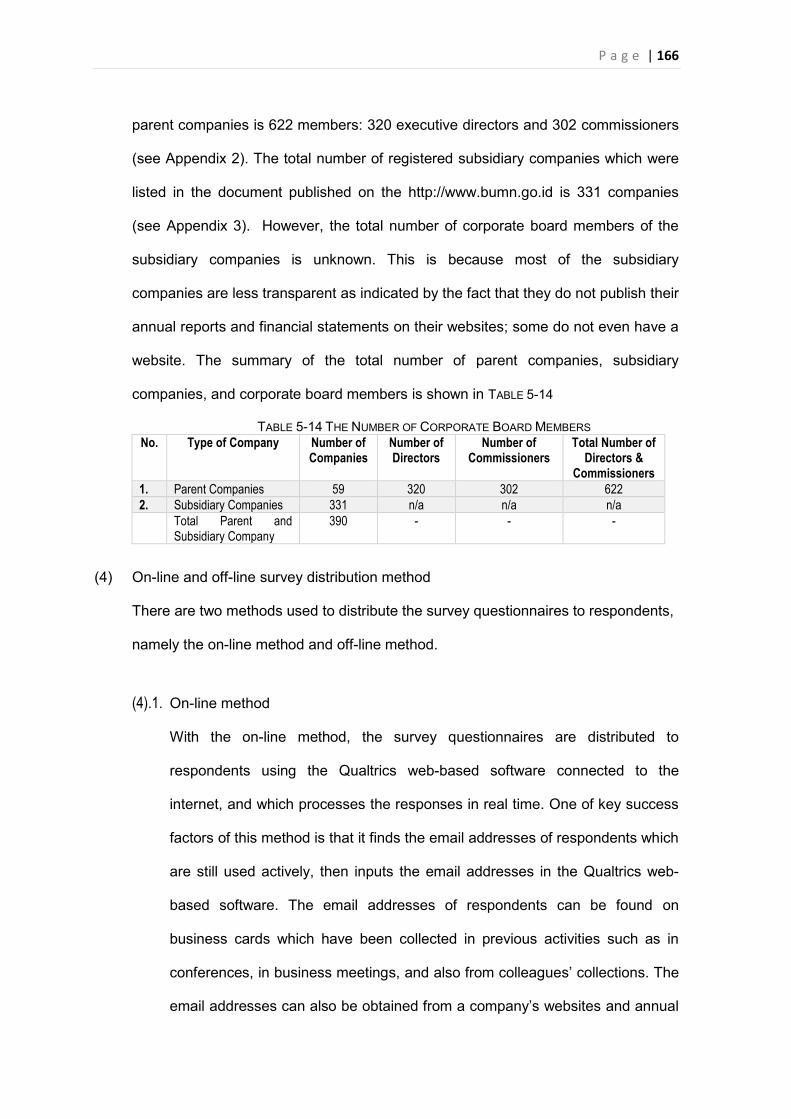
P a g e | 166
parent companies is 622 members: 320 executive directors and 302 commissioners
(see Appendix 2). The total number of registered subsidiary companies which were
listed in the document published on the http://www.bumn.go.id is 331 companies
(see Appendix 3). However, the total number of corporate board members of the
subsidiary companies is unknown. This is because most of the subsidiary
companies are less transparent as indicated by the fact that they do not publish their
annual reports and financial statements on their websites; some do not even have a
website. The summary of the total number of parent companies, subsidiary
companies, and corporate board members is shown in TABLE 5-14
TABLE 5-14 THE NUMBER OF CORPORATE BOARD MEMBERS No. Type of Company Number of
Companies Number of Directors
Number of Commissioners
Total Number of Directors &
Commissioners 1. Parent Companies 59 320 302 622 2. Subsidiary Companies 331 n/a n/a n/a Total Parent and
Subsidiary Company 390 - - -
(4) On-line and off-line survey distribution method
There are two methods used to distribute the survey questionnaires to respondents,
namely the on-line method and off-line method.
(4).1. On-line method
With the on-line method, the survey questionnaires are distributed to
respondents using the Qualtrics web-based software connected to the
internet, and which processes the responses in real time. One of key success
factors of this method is that it finds the email addresses of respondents which
are still used actively, then inputs the email addresses in the Qualtrics web-
based software. The email addresses of respondents can be found on
business cards which have been collected in previous activities such as in
conferences, in business meetings, and also from colleagues’ collections. The
email addresses can also be obtained from a company’s websites and annual
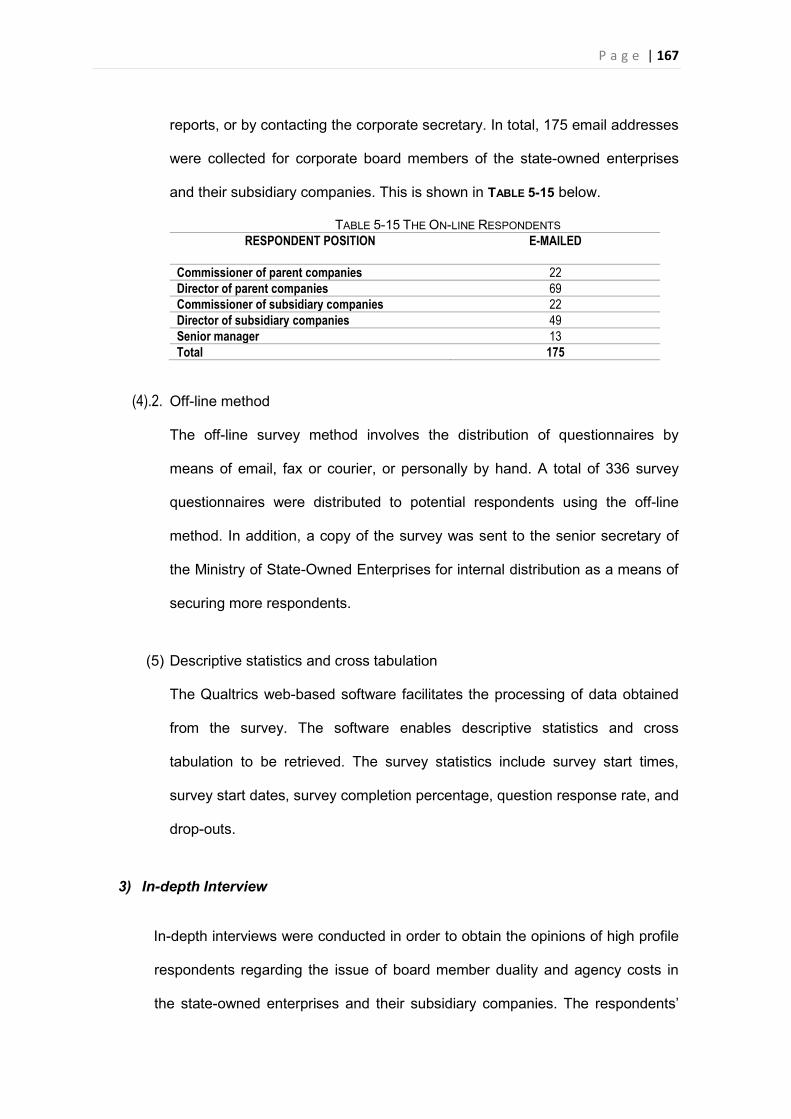
P a g e | 167
reports, or by contacting the corporate secretary. In total, 175 email addresses
were collected for corporate board members of the state-owned enterprises
and their subsidiary companies. This is shown in TABLE 5-15 below.
TABLE 5-15 THE ON-LINE RESPONDENTS RESPONDENT POSITION E-MAILED
Commissioner of parent companies 22 Director of parent companies 69 Commissioner of subsidiary companies 22 Director of subsidiary companies 49 Senior manager 13 Total 175
(4).2. Off-line method
The off-line survey method involves the distribution of questionnaires by
means of email, fax or courier, or personally by hand. A total of 336 survey
questionnaires were distributed to potential respondents using the off-line
method. In addition, a copy of the survey was sent to the senior secretary of
the Ministry of State-Owned Enterprises for internal distribution as a means of
securing more respondents.
(5) Descriptive statistics and cross tabulation
The Qualtrics web-based software facilitates the processing of data obtained
from the survey. The software enables descriptive statistics and cross
tabulation to be retrieved. The survey statistics include survey start times,
survey start dates, survey completion percentage, question response rate, and
drop-outs.
3) In-depth Interview
In-depth interviews were conducted in order to obtain the opinions of high profile
respondents regarding the issue of board member duality and agency costs in
the state-owned enterprises and their subsidiary companies. The respondents’
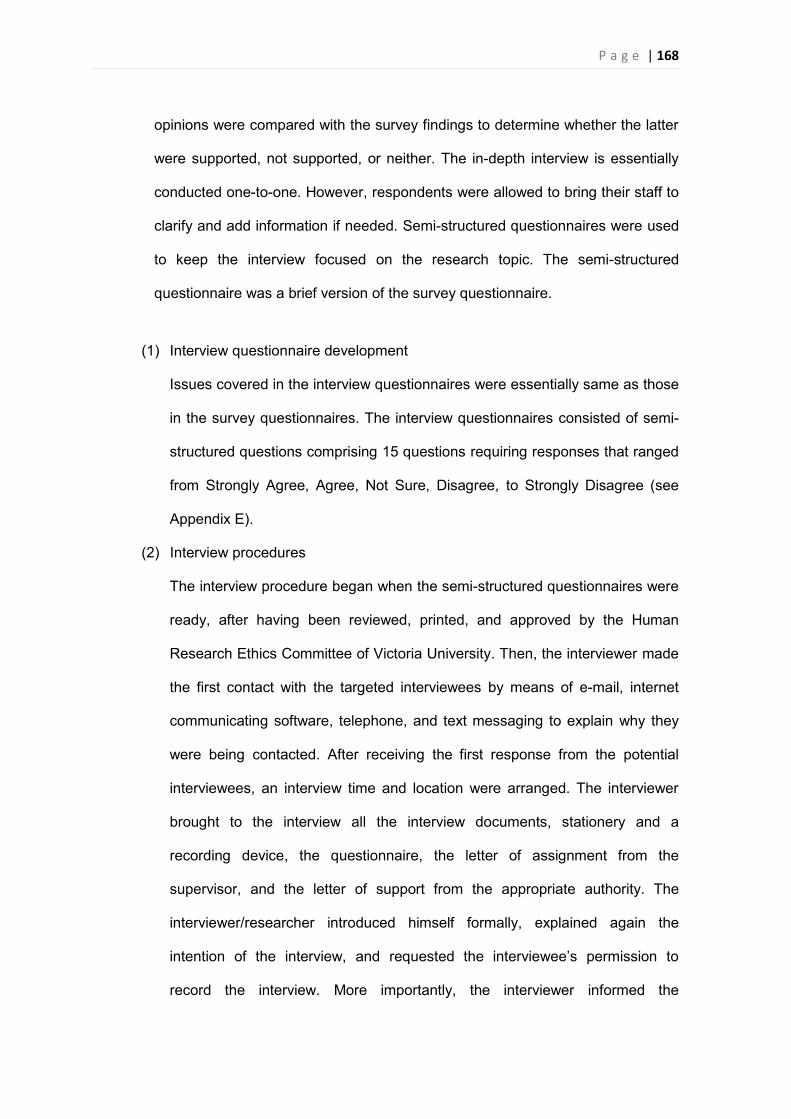
P a g e | 168
opinions were compared with the survey findings to determine whether the latter
were supported, not supported, or neither. The in-depth interview is essentially
conducted one-to-one. However, respondents were allowed to bring their staff to
clarify and add information if needed. Semi-structured questionnaires were used
to keep the interview focused on the research topic. The semi-structured
questionnaire was a brief version of the survey questionnaire.
(1) Interview questionnaire development
Issues covered in the interview questionnaires were essentially same as those
in the survey questionnaires. The interview questionnaires consisted of semi-
structured questions comprising 15 questions requiring responses that ranged
from Strongly Agree, Agree, Not Sure, Disagree, to Strongly Disagree (see
Appendix E).
(2) Interview procedures
The interview procedure began when the semi-structured questionnaires were
ready, after having been reviewed, printed, and approved by the Human
Research Ethics Committee of Victoria University. Then, the interviewer made
the first contact with the targeted interviewees by means of e-mail, internet
communicating software, telephone, and text messaging to explain why they
were being contacted. After receiving the first response from the potential
interviewees, an interview time and location were arranged. The interviewer
brought to the interview all the interview documents, stationery and a
recording device, the questionnaire, the letter of assignment from the
supervisor, and the letter of support from the appropriate authority. The
interviewer/researcher introduced himself formally, explained again the
intention of the interview, and requested the interviewee’s permission to
record the interview. More importantly, the interviewer informed the
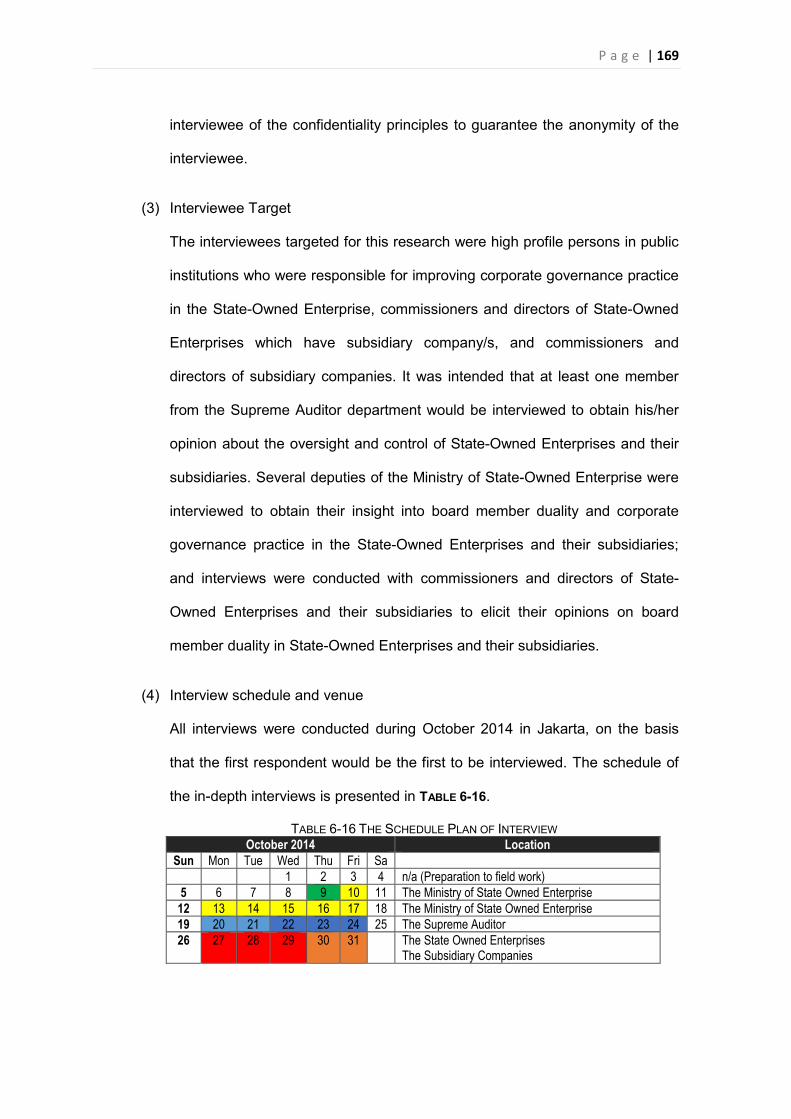
P a g e | 169
interviewee of the confidentiality principles to guarantee the anonymity of the
interviewee.
(3) Interviewee Target
The interviewees targeted for this research were high profile persons in public
institutions who were responsible for improving corporate governance practice
in the State-Owned Enterprise, commissioners and directors of State-Owned
Enterprises which have subsidiary company/s, and commissioners and
directors of subsidiary companies. It was intended that at least one member
from the Supreme Auditor department would be interviewed to obtain his/her
opinion about the oversight and control of State-Owned Enterprises and their
subsidiaries. Several deputies of the Ministry of State-Owned Enterprise were
interviewed to obtain their insight into board member duality and corporate
governance practice in the State-Owned Enterprises and their subsidiaries;
and interviews were conducted with commissioners and directors of State-
Owned Enterprises and their subsidiaries to elicit their opinions on board
member duality in State-Owned Enterprises and their subsidiaries.
(4) Interview schedule and venue
All interviews were conducted during October 2014 in Jakarta, on the basis
that the first respondent would be the first to be interviewed. The schedule of
the in-depth interviews is presented in TABLE 6-16.
TABLE 6-16 THE SCHEDULE PLAN OF INTERVIEW October 2014 Location
Sun Mon Tue Wed Thu Fri Sa 1 2 3 4 n/a (Preparation to field work)
5 6 7 8 9 10 11 The Ministry of State Owned Enterprise 12 13 14 15 16 17 18 The Ministry of State Owned Enterprise 19 20 21 22 23 24 25 The Supreme Auditor 26 27 28 29 30 31 The State Owned Enterprises
The Subsidiary Companies
P a g e | 170
(4).1. The week prior to the 7th of October was spent in preparation for the field
work, and on October 8th, the researcher departed for Jakarta.
(4).2. 9th of October 2014: the researcher met with the Secretary of the
Ministry of State Owned-Enterprise to explain the thesis project and the
plan for in-depth interviews, the survey, and data collection. The
researcher also elicited the secretary’s opinion of and attitude towards
the research topic.
(4).3. October 10th—17th: interviews with several deputies in the Ministry of
State-Owned Enterprise.
(4).4. October 20th—21st: interview with a member of the Supreme Auditor
department;
(4).5. October 22nd—24th:interviews with several deputies from the Finance
and Development Supervisory Agency;
(4).6. October 26th—29th: interviews with several directors and commissioners
on the boards of state-owned enterprises; finally
(4).7. October 30th—31st: interviews with several directors and commissioners
of subsidiary companies.
5.4. RESEARCH PROCEDURE
The research procedure is essentially a step-by-step sequence of research activity which
has a starting and ending points, so it will overlap with other research processes as
explained in the previous section (section 5.1.). However, this section will present only the
details of the human research ethics approval, preliminary notification, and preparation for
fieldwork. The next research procedure which involved data collection, data recording and
management, and data analysis and interpretation, will be elaborated in the next sections.
P a g e | 171
5.4.1. Human Research Ethics Approval
This research involved humans as participants, but only in a very low risk situation.
However, whatever the risk, when humans are involved in research as respondents, the
researcher has to obtain approval from the Human Research Ethics Committee which will
ensure that the researcher involves the participants in an ethical manner and complies
with all relevant legal requirements. All steps undertaken during the research fieldwork will
implement the Australian Government’s National Statement on Ethical Conduct in Human
Research (2007). The research project obtained a two-year approval from the Human
Research Ethics Committee on October 3, 2014 (see Appendix F).
Respondents were involved in the research as survey participants and interview
participants. Respondents who agreed to participate in the research were required to sign
a consent form and give this to the researcher. For the survey participants, their consent
is implied when they voluntarily complete the survey questionnaires. However, prior to
beginning the interview process, the researcher must obtain the consent of interviewees
(see Appendix G). The respondents' identities are kept confidential.
5.4.2. Preliminary Notification
Prior to the research fieldwork, the researcher contacted anyone whom he thought could
assist him to obtain respondents (contact person). The Prime Secretary of the Ministry of
State-Owned Enterprise was the most important person to be contacted because he can
influence the participation rate of respondents since the respondents are members of the
corporate boards of state-owned enterprises. In the meantime, the researcher also sent
informal e-mails to other contact persons prior to a visit in order to introduce himself and
to give a brief explanation of the research project (see Appendix I). The principal
supervisor of the research wrote a letter explaining the research assignment. The
researcher brought this letter to meetings with the respondents and the Prime Secretary of
the Ministry of State-Owned Enterprises as a research procedure (see Appendix J).
P a g e | 172
The researcher used a range of strategies to secure an adequate number of respondents,
since the respondents were important persons in the state-owned enterprises and were
likely to be very busy. Firstly, the researcher used the network of people that were already
known and relatively close to the respondents. Secondly, the researcher asked the Senior
Secretary of the Ministry of State-Owned Enterprises to issue a letter of recommendation
to all state-owned enterprises, encouraging people to participate. Thirdly, the researcher
used contact persons in the Finance and Development Supervisory Agency to distribute
the questionnaires to their clients who generally are members of corporate boards of
state-owned enterprises, and also could provide e-mail addresses of potential
respondents from business cards received at meetings or conferences. Fourthly, the
researcher contacted a friend at Ernst and Young who was able to provide business cards
of clients who were on corporate boards. Lastly, the researcher contacted the corporate
secretary of each state-owned enterprise requesting that s/he distribute the
questionnaires and make appointments for interviews with the corporate board members.
Using the Qualtrics survey instrument, the researcher sent questionnaires to several email
addresses of corporate board members, and these could be responded to immediately.
5.4.3. Preparation for Fieldwork
After receiving approval from the ethics committee, the itinerary for the fieldwork in
Jakarta was prepared, and travel documents were finalized. The soft copies and several
hard copies of the survey questionnaires and interview questionnaires were packed, and
the assignment letter for the research also had to be brought. The researcher had also
prepared a list of State-Owned Enterprises from which the respondent candidates were
sought, and also a list of corporate board members who would be contacted in Jakarta.
After arriving in Jakarta, the researcher made 500 copies of the survey questionnaire and
30 copies of the interview questionnaire.
P a g e | 173
5.5. DATA COLLECTION
Data collection for this research was conducted by three means, depending on the
instrument of research being used. The primary data was gathered from surveys and
interviews, whereas the secondary data was gathered from a collection of annual
company reports.
5.5.1. Primary data
The researcher coordinated with persons who had committed to helping, as mentioned in
the previous section. Five hundred copies of the questionnaire were distributed according
to regions and in agreement with the contact person. The contact person was free to
reproduce as many copies as required, which depended on the number of members of
boards in parent companies and subsidiary companies. When the respondents had
completed the questionnaires, the contact person, who was usually the corporate
secretary, informed the researcher who subsequently collected them.
1) Survey Distribution
The distribution of the survey questionnaires is done by any means that will secure an
appropriate number of respondents, as mentioned briefly in the previous section.
Firstly, the survey questionnaires were accompanied by the assignment letter and
request letter from the supervisor; these were given to the Senior Secretary of the
Ministry of State-Owned Enterprises for approval. Then, based on the promise of the
officer in the Ministry of State-Owned Enterprises to help with the survey distribution,
the letter of approval from the prime secretary of the Ministry of State-Owned
Enterprises together with the assignment letter and letter of support was faxed to
every State-Owned Enterprise. However, subsequently, three other activities had to
be performed: finding the respondent address, sending the survey questionnaires,
and collecting the survey questionnaires. These activities are explained below.
1) Finding the address
P a g e | 174
Finding the addresses of respondents is a challenging task. The addresses can
be found by several means: formally or informally through documents acquired
from the officer of the Ministry of State-Owned Enterprises who has the task of
maintaining the contact details of all corporate board members of state-owned
enterprises; from business cards obtained through networking; formally from
sources such as office files and informally from friends; through the internet which
could be used as a search engine, for social media, or for visits to the company
websites. All the respondents’ addresses were listed in Excel and categorized
based on the ways the survey questionnaires were sent to them.
2) Sending the Survey questionnaires
The address category mentioned in the previous step was used to decide
whether the survey questionnaires would be paper-based or sent digitally. Digital
distribution was by means of on-line Qualtrics web-based software, or not on-line
by sending the file electronically or scanning it. Paper-based questionnaires were
sent by fax through the Ministry of State-Owned Enterprises or by courier who
had already committed to help. Moreover, when employees of a company
undertake to distribute the questionnaires, this could be a very effective means of
securing responses.
3) Collecting the survey questionnaires
Basically, the way in which the responses are collected depends on the way the
survey questionnaires were sent. If on-line, then the responses are automatically
processed by the Qualtrics software, whereas, with the digital method, usually the
respondents will scan their responses and send them to the researcher’s email
address. If the survey questionnaires are in hard copy, then the collection of
responses depends on the people who were assigned to collect or the person
who was assigned to send the paper-based questionnaires to the respondents.
P a g e | 175
5.5.2. Secondary data
The secondary data was mainly financial data acquired from the annual reports published
by the companies and focused on the state-owned enterprises which have a subsidiary
company. However, if the subsidiary companies do not publish their annual reports, then
the parent company was excluded from the sample. The period of the financial data
retrieved from the annual report of both parent company and subsidiary company, if
available, was from 2008 until 2013 (five years). The data required consisted of financial
figures and financial notes from balance sheets, income statements, statements of cash
flow, and owners' equity and retained earnings statement of the state-owned enterprise for
the research period. From the annual reports, the secondary data collected was
categorized as dependent variables and independent variables including relevant control
variables, commonly known as explanatory variables. Essentially, the research
investigated the dependent variable which was the board member duality and the
independent variable which was the agency costs. However, since the research
conducted a further investigation of the indicators of agency costs, several independent
variables, namely Earnings Before Interest and Tax (EBIT), Corporate Tax, and Dividend
were included in the collection of secondary data. The collection of secondary data
comprised information about each company’s percentage of parent and the Government
ownership, the board composition, the debt ratio, the liquidity, the firm age, size, growth,
and risk, asset turnover, and operating expenses.
5.6. DATA RECORDING AND MANAGEMENT
5.6.1. Recording Devices
Usually, a recording device is used for interviews. The recent advanced technology
enabled the researcher to use a mobile phone device to record the interview. However, to
prevent the accidental loss of recorded data, the researcher also used a second,
traditional recording device which was a tape recorder with cassette tape. The data which
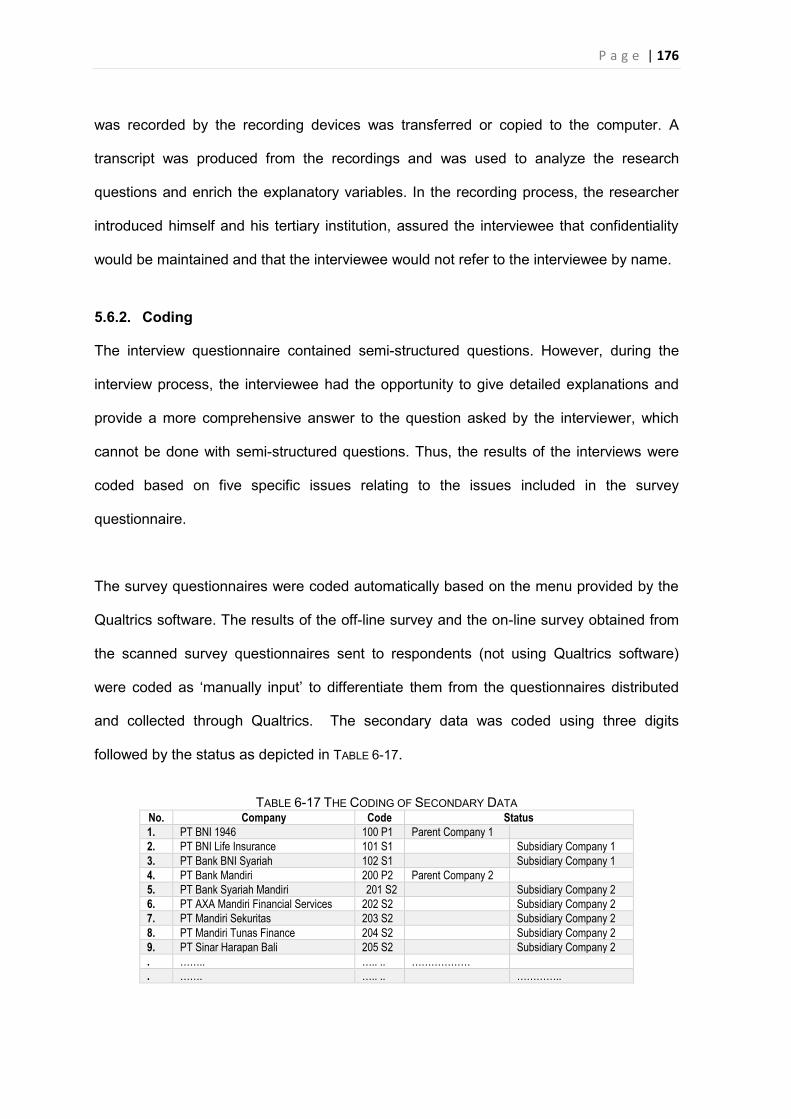
P a g e | 176
was recorded by the recording devices was transferred or copied to the computer. A
transcript was produced from the recordings and was used to analyze the research
questions and enrich the explanatory variables. In the recording process, the researcher
introduced himself and his tertiary institution, assured the interviewee that confidentiality
would be maintained and that the interviewee would not refer to the interviewee by name.
5.6.2. Coding
The interview questionnaire contained semi-structured questions. However, during the
interview process, the interviewee had the opportunity to give detailed explanations and
provide a more comprehensive answer to the question asked by the interviewer, which
cannot be done with semi-structured questions. Thus, the results of the interviews were
coded based on five specific issues relating to the issues included in the survey
questionnaire.
The survey questionnaires were coded automatically based on the menu provided by the
Qualtrics software. The results of the off-line survey and the on-line survey obtained from
the scanned survey questionnaires sent to respondents (not using Qualtrics software)
were coded as ‘manually input’ to differentiate them from the questionnaires distributed
and collected through Qualtrics. The secondary data was coded using three digits
followed by the status as depicted in TABLE 6-17.
TABLE 6-17 THE CODING OF SECONDARY DATA
No. Company Code Status 1. PT BNI 1946 100 P1 Parent Company 1 2. PT BNI Life Insurance 101 S1 Subsidiary Company 1 3. PT Bank BNI Syariah 102 S1 Subsidiary Company 1 4. PT Bank Mandiri 200 P2 Parent Company 2 5. PT Bank Syariah Mandiri 201 S2 Subsidiary Company 2 6. PT AXA Mandiri Financial Services 202 S2 Subsidiary Company 2 7. PT Mandiri Sekuritas 203 S2 Subsidiary Company 2 8. PT Mandiri Tunas Finance 204 S2 Subsidiary Company 2 9. PT Sinar Harapan Bali 205 S2 Subsidiary Company 2 . …….. ….. .. ……………… . ……. ….. .. …………..
P a g e | 177
5.6.3. Storage Devices
Data collected from primary sources and secondary sources was stored in different
media. Data which could be digitalized in the form of softcopy was stored in a USB and
CD with a specific name on it, whereas data collected in the form of hardcopy was stored
in specific folders.
5.7. Data Analysis and Interpretation
5.7.1. Quantitative Data
There are two types of quantitative data in this research which will be subjected to
different processes based on how the data was acquired: quantitative data was obtained
from the survey and quantitative data was obtained from a data panel. The quantitative
data from the survey was processed by the Qualtrics software which has several features
which facilitate and enable descriptive statistics analysis, cross-tabulation, and the Chi
Square (x2) test. The results obtained through Qualtrics provide frequency distribution and
percentages which are useful for summarizing and describing the observations. Facts and
figures will enable the interpretation of results in the context of the research and can be
formulated as statements that reflect the significance of the finding in terms of agency
costs and board member duality. The occurrence and significant relationship among
variables can be explained by cross-tabulation and Chi-Square (x2) test.
The quantitative data obtained from the financial database was structured into a data
panel and formulated into a regression model. Then the regression model was tested
using E-views software which facilitate and explore the three means of testing, namely, (1)
Testing with Common Effects Model; (2) Testing with Fixed Effects Model; and (3) Testing
With Random Effects Model. The E-views software presented the best regression model
of the three models mentioned above. Thus, the best regression model was used to
determine the strength of the relationship among variables.
P a g e | 178
5.7.2. Qualitative Data
The qualitative data obtained from the in-depth interviews were essentially in line with the
analysis of the survey questionnaires since the contents of both interview and survey
questionnaires were basically the same. However, the interviewees all have high-profile
roles in corporate governance and oversight, and therefore are different from the survey
respondents. Thus, every statement relating to the research issue, which is board
member duality and agency costs, is very important. All the interview responses were
compared and presented in comparison matrices which enabled the identification of
common themes that emerged during the in-depth interviews.
5.7.3. Mixed Data
The quantitative data and the qualitative data were integrated in order to draw a
conclusion. Quantitative and qualitative data are separate but complementary. Thus, it
needs a creative mechanism to process both types of data in order to arrive at
comprehensive and meaningful conclusions that will answer the research questions. The
creative mechanism is described below.
1. The quantitative and qualitative data will be processed separately
2. Quantitative data obtained from the financial database which was processed
with E-Views software was the firm basis for other findings. This is because
the accuracy and accountability of the financial database has been proven by
an independent auditor, and reflected in the financial audited statements
which are published in annual reports.
3. Quantitative data obtained from the survey was compared with the
quantitative data obtained from the financial database.
4. Qualitative data obtained from the in-depth interviews was used to confirm the
results of the quantitative data which were processed in previous stages.
P a g e | 179
5. All the findings resulting from this triangulation method were presented,
investigated, and discussed prior to drawing several conclusions.
5.8. SUMMARY
This chapter presents the step-by-step research process used in the study. All the
research steps should be followed in order to obtain the required quality of research that
was established prior to commencing the research. The quality of research depends on its
validity, reliability, generalisability, and objectivity in terms of both the research issue and
the data collected.
This research used the triangulation method which was designed to integrate all research
instruments, namely panel data, survey, and in-depth interview into an integrated data
analysis matrix. The research field was pre-determined before the data collection began.
This research was approved by VUT’s Ethics Committee which took all ethics issues into
consideration. The primary data was collected using the survey and in-depth interview
tools as research instruments. The secondary data was collected from the websites of the
targeted sample and from the Ministry of BUMN. Both primary and secondary data were
documented in several files and saved in the storage devices of a computer. The analysis
of the survey data was undertaken using the Qualtrics software. E-views software was
used for the analysis of panel data. The in-depth interviews were transcribed and the
responses were grouped according to the Likert scale used for the survey.
P a g e | 180
CHAPTER 6: ANALYSIS OF RESULTS “If I disagree with you sometimes, it's because I have a mind of my own.”
― Emma Paul —
INTRODUCTION
This chapter comprises five (5) sections, presenting the results of the research. Section
6.1: RESPONSE RATE presents the number of respondents who participated in the survey
either on-line or off-line, and the response rates for the in-depth interviews, and the panel
data of parent and subsidiary companies. The response rate for each research instruments
was calculated based on the number of respondents targeted divided by the total number
of respondents acquired.
SECTION 6.2: RESPONDENT DEMOGRAPHICS describes the profiles of respondents who
completed the survey and those who were chosen for the in-depth interviews. However,
the names and personal identities of the respondents remain confidential and are
protected according to the principles of ethics.
SECTION 6.3: DATA PANEL SAMPLE presents the financial statement profile from the annual
reports of state-owned enterprise companies and their subsidiaries from 2009 to 2013. The
financial statements presented in the annual reports have usually been audited by the
public accountant or the supreme auditor. Then, financial figures of the financial
statements originating from the balance sheets, income statement, statement of changes
in equity, and financial notes were extracted into the variables needed for this research.
SECTION 6.4: RESULTS OF THE RESEARCH summarises the results of the analyses of each
research instrument individually based on the research methods used. The survey used
Qualtrics software to process the data and summarize it in table format, the in-depth
interviews were summarized in the table summary, and E-views software was used to
P a g e | 181
process the panel data and build the panel data regression model which also presents the
results.
6.1. Response Rate
The response rate for this research was divided into three parts based on the research
instruments, namely panel data, survey, and interview. The response rate for all
instruments is detailed below.
6.1.1. Financial Panel Data of the Parent and Subsidiary Companies
Secondary data were collected from the financial statements extracted from the annual
reports of the State-Owned Enterprises and their subsidiaries from 2009 until 2013. There
were a total of 59 parent companies as of 31 December 2013, having 272 subsidiary
companies. However, only 10 parent companies and 37 subsidiary companies published
on their websites their completed financial statements in their annual reports for 2009—
2013 (see Appendix A). Thus, the total observations for the panel data were for 47
companies for the five-year period, which equals 235 observations.
6.1.2. The Parent and Subsidiary Governance Survey 2014
The parent and subsidiary companies survey was conducted in Jakarta, where the
majority of respondents reside. The survey started in mid October 2014 and was
concluded at the beginning of December 2014. The response rate for this survey which
used the on-line and the off-line survey methods is summarized below.
1) The Response Rate for the On-Line Survey
Of the 175 online questionnaires sent to the e-mail addresses of directors and
commissioners in both parent and subsidiary companies, 24 completed questionnaires
were returned, which represented a 13.71% rate as indicated in TABLE 6-18. The e-mail
addresses of the commissioners and directors of the SOEs and their subsidiaries were
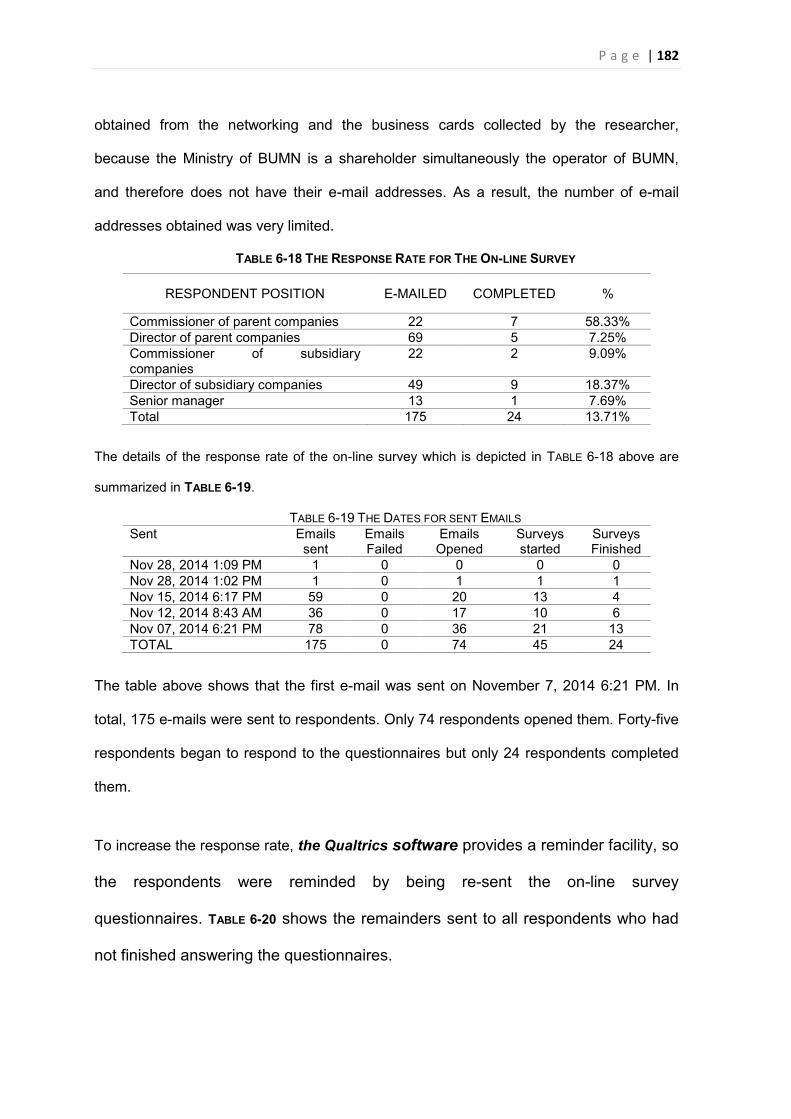
P a g e | 182
obtained from the networking and the business cards collected by the researcher,
because the Ministry of BUMN is a shareholder simultaneously the operator of BUMN,
and therefore does not have their e-mail addresses. As a result, the number of e-mail
addresses obtained was very limited.
TABLE 6-18 THE RESPONSE RATE FOR THE ON-LINE SURVEY
RESPONDENT POSITION E-MAILED COMPLETED %
Commissioner of parent companies 22 7 58.33% Director of parent companies 69 5 7.25% Commissioner of subsidiary companies
22 2 9.09%
Director of subsidiary companies 49 9 18.37% Senior manager 13 1 7.69% Total 175 24 13.71%
The details of the response rate of the on-line survey which is depicted in TABLE 6-18 above are
summarized in TABLE 6-19.
TABLE 6-19 THE DATES FOR SENT EMAILS Sent Emails
sent Emails Failed
Emails Opened
Surveys started
Surveys Finished
Nov 28, 2014 1:09 PM 1 0 0 0 0 Nov 28, 2014 1:02 PM 1 0 1 1 1 Nov 15, 2014 6:17 PM 59 0 20 13 4 Nov 12, 2014 8:43 AM 36 0 17 10 6 Nov 07, 2014 6:21 PM 78 0 36 21 13 TOTAL 175 0 74 45 24
The table above shows that the first e-mail was sent on November 7, 2014 6:21 PM. In
total, 175 e-mails were sent to respondents. Only 74 respondents opened them. Forty-five
respondents began to respond to the questionnaires but only 24 respondents completed
them.
To increase the response rate, the Qualtrics software provides a reminder facility, so
the respondents were reminded by being re-sent the on-line survey
questionnaires. TABLE 6-20 shows the remainders sent to all respondents who had
not finished answering the questionnaires.
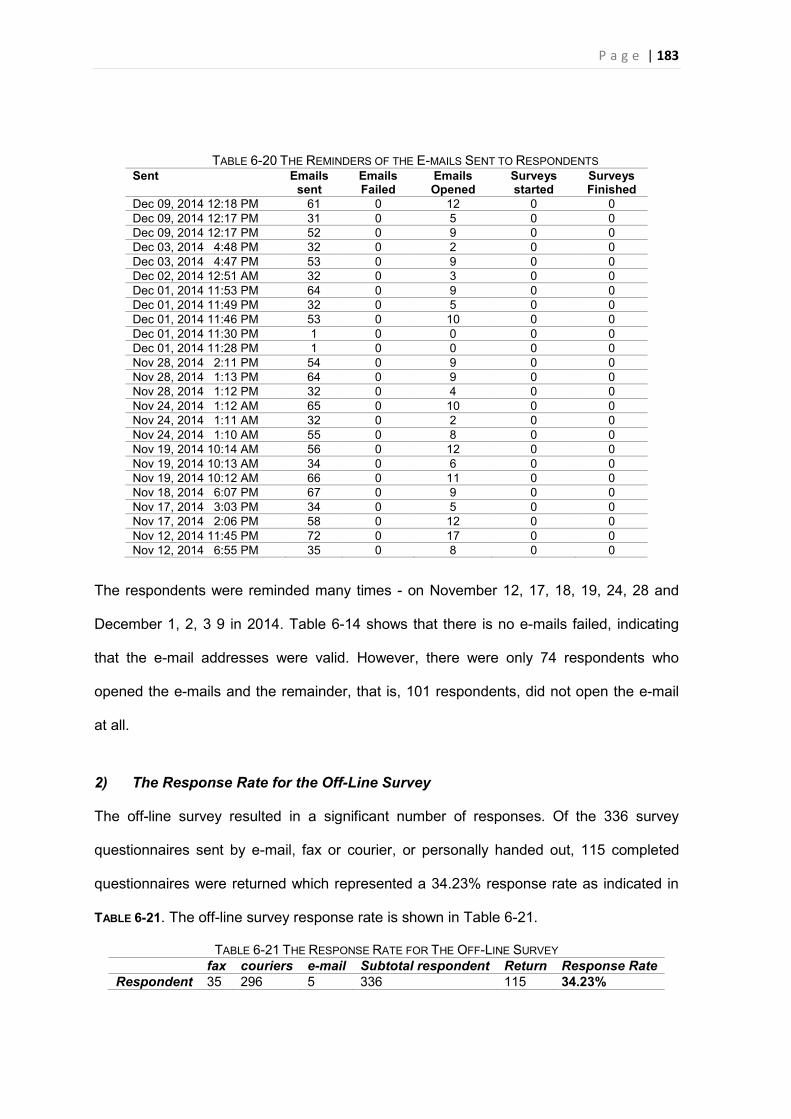
P a g e | 183
TABLE 6-20 THE REMINDERS OF THE E-MAILS SENT TO RESPONDENTS Sent Emails
sent Emails Failed
Emails Opened
Surveys started
Surveys Finished
Dec 09, 2014 12:18 PM 61 0 12 0 0 Dec 09, 2014 12:17 PM 31 0 5 0 0 Dec 09, 2014 12:17 PM 52 0 9 0 0 Dec 03, 2014 4:48 PM 32 0 2 0 0 Dec 03, 2014 4:47 PM 53 0 9 0 0 Dec 02, 2014 12:51 AM 32 0 3 0 0 Dec 01, 2014 11:53 PM 64 0 9 0 0 Dec 01, 2014 11:49 PM 32 0 5 0 0 Dec 01, 2014 11:46 PM 53 0 10 0 0 Dec 01, 2014 11:30 PM 1 0 0 0 0 Dec 01, 2014 11:28 PM 1 0 0 0 0 Nov 28, 2014 2:11 PM 54 0 9 0 0 Nov 28, 2014 1:13 PM 64 0 9 0 0 Nov 28, 2014 1:12 PM 32 0 4 0 0 Nov 24, 2014 1:12 AM 65 0 10 0 0 Nov 24, 2014 1:11 AM 32 0 2 0 0 Nov 24, 2014 1:10 AM 55 0 8 0 0 Nov 19, 2014 10:14 AM 56 0 12 0 0 Nov 19, 2014 10:13 AM 34 0 6 0 0 Nov 19, 2014 10:12 AM 66 0 11 0 0 Nov 18, 2014 6:07 PM 67 0 9 0 0 Nov 17, 2014 3:03 PM 34 0 5 0 0 Nov 17, 2014 2:06 PM 58 0 12 0 0 Nov 12, 2014 11:45 PM 72 0 17 0 0 Nov 12, 2014 6:55 PM 35 0 8 0 0
The respondents were reminded many times - on November 12, 17, 18, 19, 24, 28 and
December 1, 2, 3 9 in 2014. Table 6-14 shows that there is no e-mails failed, indicating
that the e-mail addresses were valid. However, there were only 74 respondents who
opened the e-mails and the remainder, that is, 101 respondents, did not open the e-mail
at all.
2) The Response Rate for the Off-Line Survey
The off-line survey resulted in a significant number of responses. Of the 336 survey
questionnaires sent by e-mail, fax or courier, or personally handed out, 115 completed
questionnaires were returned which represented a 34.23% response rate as indicated in
TABLE 6-21. The off-line survey response rate is shown in Table 6-21.
TABLE 6-21 THE RESPONSE RATE FOR THE OFF-LINE SURVEY fax couriers e-mail Subtotal respondent Return Response Rate Respondent 35 296 5 336 115 34.23%
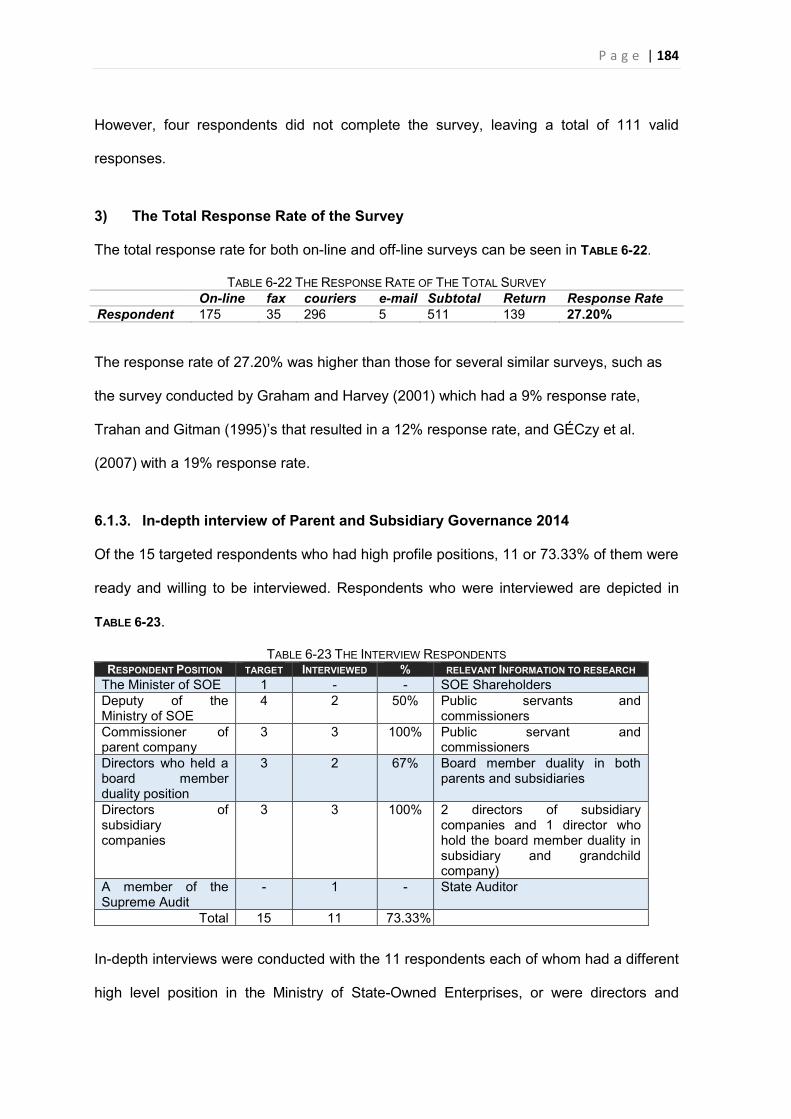
P a g e | 184
However, four respondents did not complete the survey, leaving a total of 111 valid
responses.
3) The Total Response Rate of the Survey
The total response rate for both on-line and off-line surveys can be seen in TABLE 6-22.
TABLE 6-22 THE RESPONSE RATE OF THE TOTAL SURVEY On-line fax couriers e-mail Subtotal Return Response Rate Respondent 175 35 296 5 511 139 27.20%
The response rate of 27.20% was higher than those for several similar surveys, such as
the survey conducted by Graham and Harvey (2001) which had a 9% response rate,
Trahan and Gitman (1995)’s that resulted in a 12% response rate, and GÉCzy et al.
(2007) with a 19% response rate.
6.1.3. In-depth interview of Parent and Subsidiary Governance 2014
Of the 15 targeted respondents who had high profile positions, 11 or 73.33% of them were
ready and willing to be interviewed. Respondents who were interviewed are depicted in
TABLE 6-23.
TABLE 6-23 THE INTERVIEW RESPONDENTS RESPONDENT POSITION TARGET INTERVIEWED % RELEVANT INFORMATION TO RESEARCH
The Minister of SOE 1 - - SOE Shareholders Deputy of the Ministry of SOE
4 2 50% Public servants and commissioners
Commissioner of parent company
3 3 100% Public servant and commissioners
Directors who held a board member duality position
3 2 67% Board member duality in both parents and subsidiaries
Directors of subsidiary companies
3 3 100% 2 directors of subsidiary companies and 1 director who hold the board member duality in subsidiary and grandchild company)
A member of the Supreme Audit
- 1 - State Auditor
Total 15 11 73.33%
In-depth interviews were conducted with the 11 respondents each of whom had a different
high level position in the Ministry of State-Owned Enterprises, or were directors and
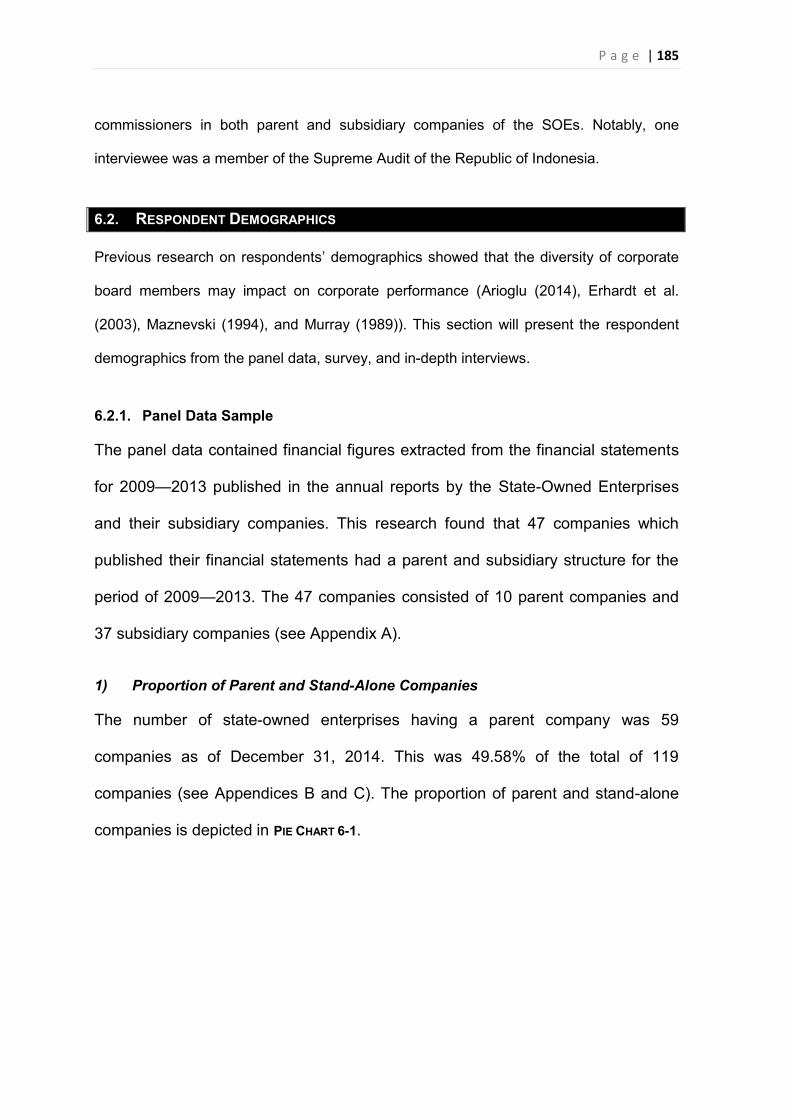
P a g e | 185
commissioners in both parent and subsidiary companies of the SOEs. Notably, one
interviewee was a member of the Supreme Audit of the Republic of Indonesia.
6.2. RESPONDENT DEMOGRAPHICS
Previous research on respondents’ demographics showed that the diversity of corporate
board members may impact on corporate performance (Arioglu (2014), Erhardt et al.
(2003), Maznevski (1994), and Murray (1989)). This section will present the respondent
demographics from the panel data, survey, and in-depth interviews.
6.2.1. Panel Data Sample
The panel data contained financial figures extracted from the financial statements
for 2009—2013 published in the annual reports by the State-Owned Enterprises
and their subsidiary companies. This research found that 47 companies which
published their financial statements had a parent and subsidiary structure for the
period of 2009—2013. The 47 companies consisted of 10 parent companies and
37 subsidiary companies (see Appendix A).
1) Proportion of Parent and Stand-Alone Companies
The number of state-owned enterprises having a parent company was 59
companies as of December 31, 2014. This was 49.58% of the total of 119
companies (see Appendices B and C). The proportion of parent and stand-alone
companies is depicted in PIE CHART 6-1.
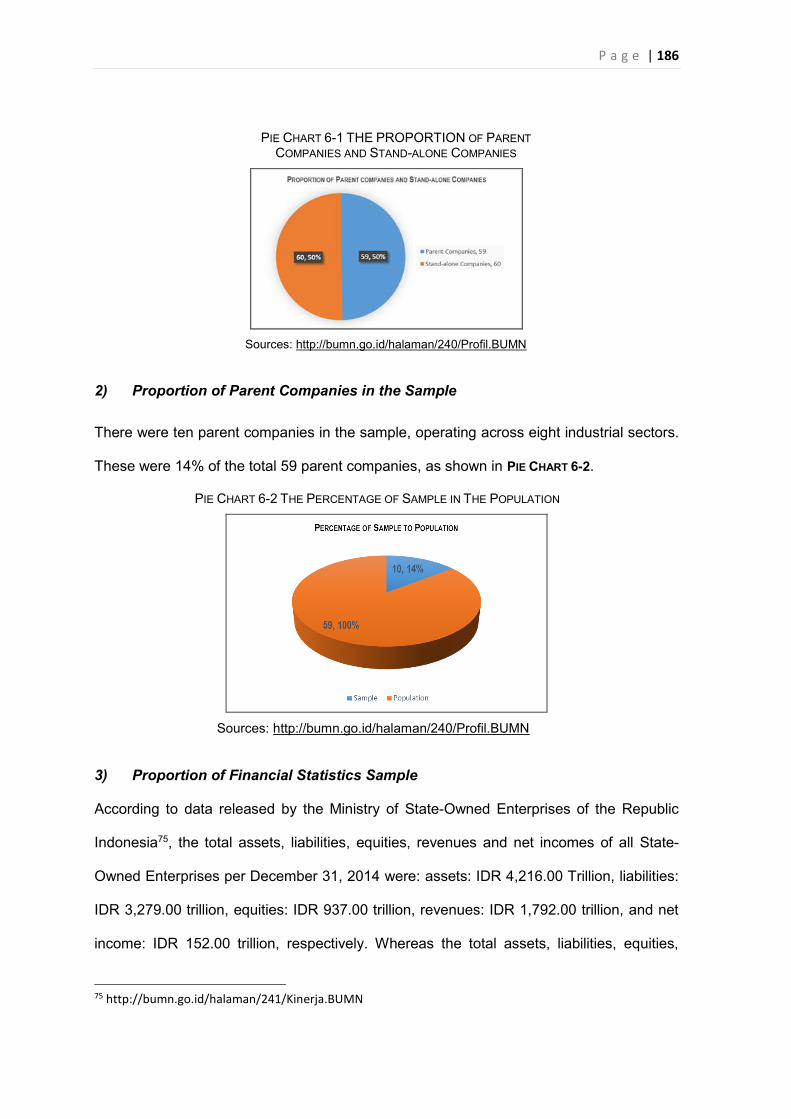
P a g e | 186
PIE CHART 6-1 THE PROPORTION OF PARENT
COMPANIES AND STAND-ALONE COMPANIES
Sources: http://bumn.go.id/halaman/240/Profil.BUMN
2) Proportion of Parent Companies in the Sample
There were ten parent companies in the sample, operating across eight industrial sectors.
These were 14% of the total 59 parent companies, as shown in PIE CHART 6-2.
PIE CHART 6-2 THE PERCENTAGE OF SAMPLE IN THE POPULATION
Sources: http://bumn.go.id/halaman/240/Profil.BUMN
3) Proportion of Financial Statistics Sample
According to data released by the Ministry of State-Owned Enterprises of the Republic
Indonesia75, the total assets, liabilities, equities, revenues and net incomes of all State-
Owned Enterprises per December 31, 2014 were: assets: IDR 4,216.00 Trillion, liabilities:
IDR 3,279.00 trillion, equities: IDR 937.00 trillion, revenues: IDR 1,792.00 trillion, and net
income: IDR 152.00 trillion, respectively. Whereas the total assets, liabilities, equities,
75 http://bumn.go.id/halaman/241/Kinerja.BUMN
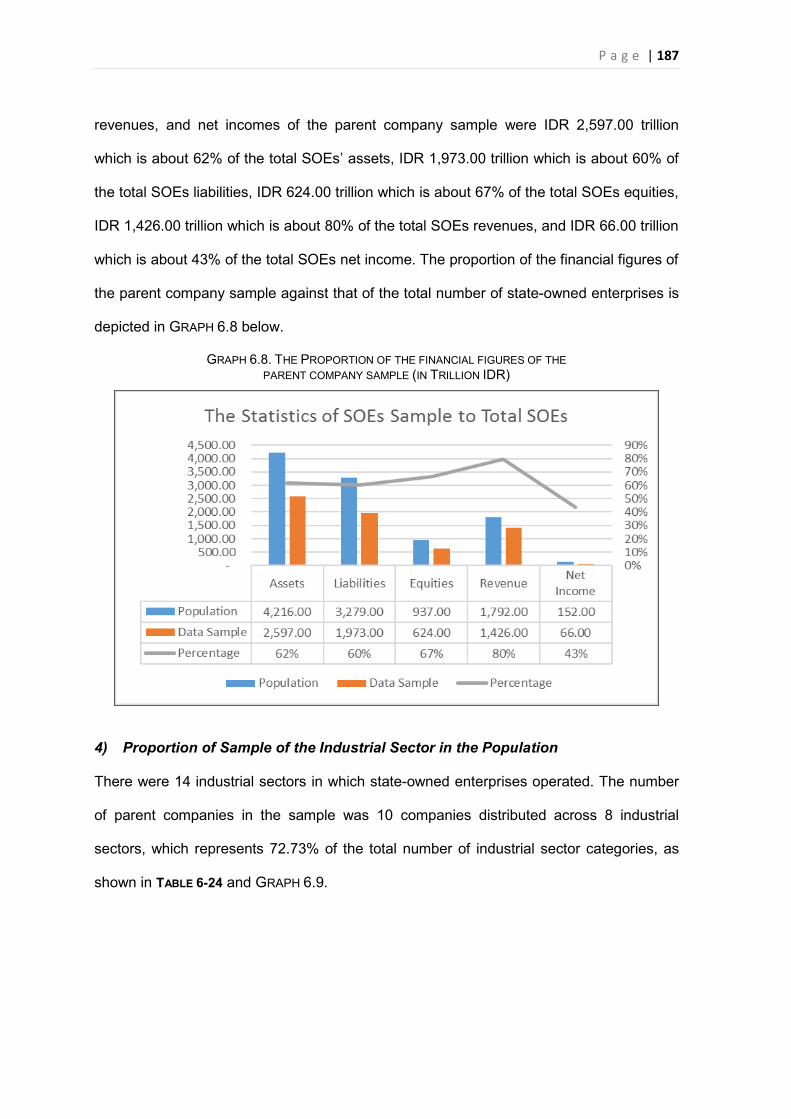
P a g e | 187
revenues, and net incomes of the parent company sample were IDR 2,597.00 trillion
which is about 62% of the total SOEs’ assets, IDR 1,973.00 trillion which is about 60% of
the total SOEs liabilities, IDR 624.00 trillion which is about 67% of the total SOEs equities,
IDR 1,426.00 trillion which is about 80% of the total SOEs revenues, and IDR 66.00 trillion
which is about 43% of the total SOEs net income. The proportion of the financial figures of
the parent company sample against that of the total number of state-owned enterprises is
depicted in GRAPH 6.8 below.
GRAPH 6.8. THE PROPORTION OF THE FINANCIAL FIGURES OF THE PARENT COMPANY SAMPLE (IN TRILLION IDR)
4) Proportion of Sample of the Industrial Sector in the Population
There were 14 industrial sectors in which state-owned enterprises operated. The number
of parent companies in the sample was 10 companies distributed across 8 industrial
sectors, which represents 72.73% of the total number of industrial sector categories, as
shown in TABLE 6-24 and GRAPH 6.9.
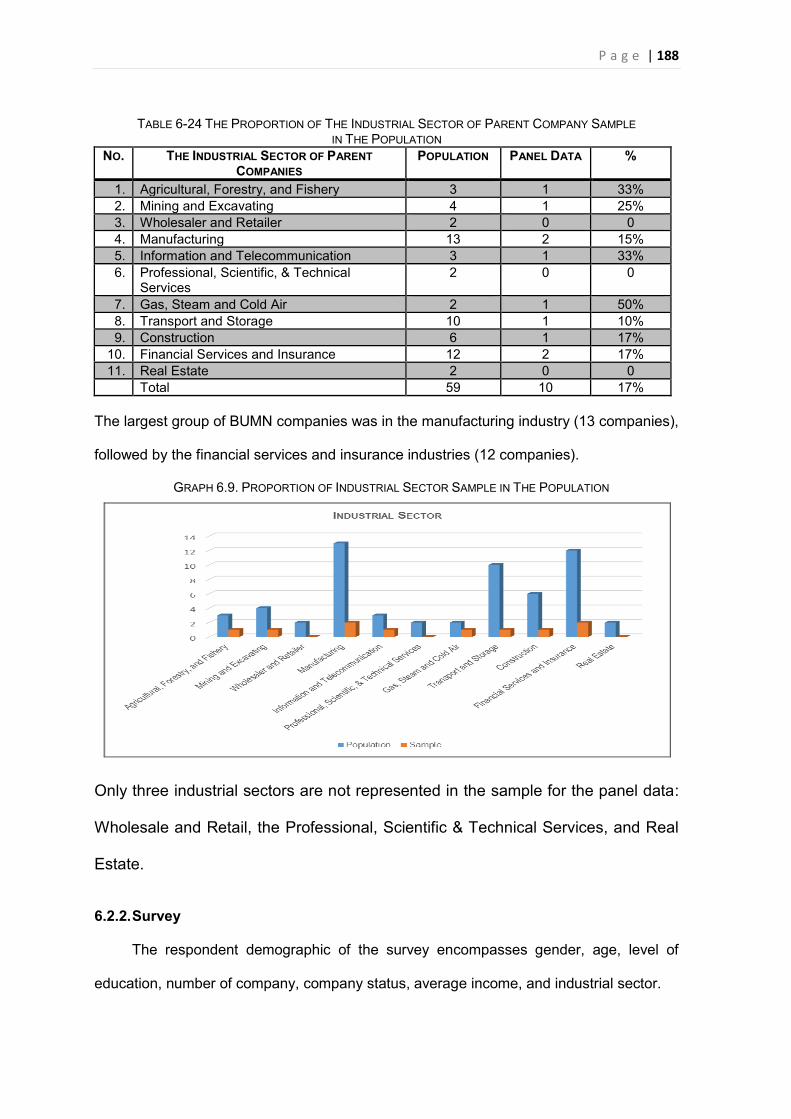
P a g e | 188
TABLE 6-24 THE PROPORTION OF THE INDUSTRIAL SECTOR OF PARENT COMPANY SAMPLE IN THE POPULATION
NO. THE INDUSTRIAL SECTOR OF PARENT COMPANIES
POPULATION PANEL DATA %
1. Agricultural, Forestry, and Fishery 3 1 33% 2. Mining and Excavating 4 1 25% 3. Wholesaler and Retailer 2 0 0 4. Manufacturing 13 2 15% 5. Information and Telecommunication 3 1 33% 6. Professional, Scientific, & Technical
Services 2 0 0
7. Gas, Steam and Cold Air 2 1 50% 8. Transport and Storage 10 1 10% 9. Construction 6 1 17%
10. Financial Services and Insurance 12 2 17% 11. Real Estate 2 0 0
Total 59 10 17%
The largest group of BUMN companies was in the manufacturing industry (13 companies),
followed by the financial services and insurance industries (12 companies).
GRAPH 6.9. PROPORTION OF INDUSTRIAL SECTOR SAMPLE IN THE POPULATION
Only three industrial sectors are not represented in the sample for the panel data:
Wholesale and Retail, the Professional, Scientific & Technical Services, and Real
Estate.
6.2.2. Survey
The respondent demographic of the survey encompasses gender, age, level of
education, number of company, company status, average income, and industrial sector.
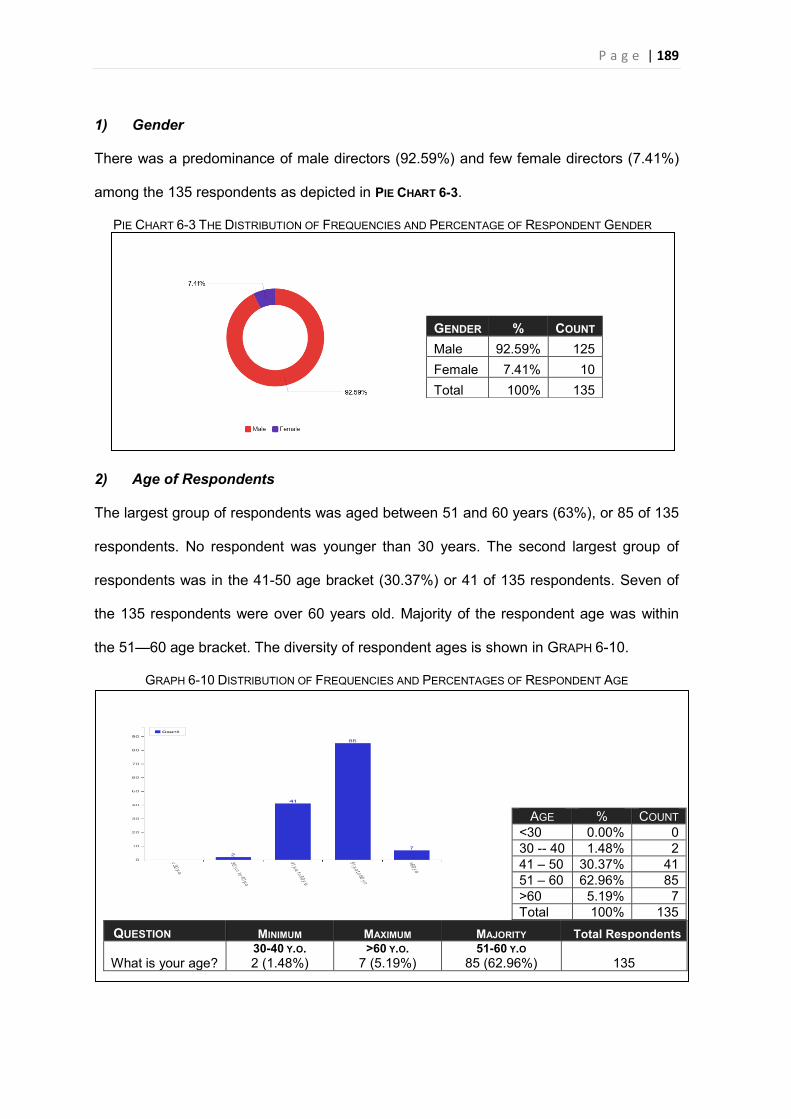
P a g e | 189
1) Gender
There was a predominance of male directors (92.59%) and few female directors (7.41%)
among the 135 respondents as depicted in PIE CHART 6-3.
PIE CHART 6-3 THE DISTRIBUTION OF FREQUENCIES AND PERCENTAGE OF RESPONDENT GENDER
2) Age of Respondents
The largest group of respondents was aged between 51 and 60 years (63%), or 85 of 135
respondents. No respondent was younger than 30 years. The second largest group of
respondents was in the 41-50 age bracket (30.37%) or 41 of 135 respondents. Seven of
the 135 respondents were over 60 years old. Majority of the respondent age was within
the 51—60 age bracket. The diversity of respondent ages is shown in GRAPH 6-10.
GRAPH 6-10 DISTRIBUTION OF FREQUENCIES AND PERCENTAGES OF RESPONDENT AGE
QUESTION MINIMUM MAXIMUM MAJORITY Total Respondents
What is your age? 30-40 Y.O. 2 (1.48%)
>60 Y.O. 7 (5.19%)
51-60 Y.O 85 (62.96%) 135
GENDER % COUNT Male 92.59% 125 Female 7.41% 10 Total 100% 135
AGE % COUNT <30 0.00% 0 30 -- 40 1.48% 2 41 – 50 30.37% 41 51 – 60 62.96% 85 >60 5.19% 7 Total 100% 135
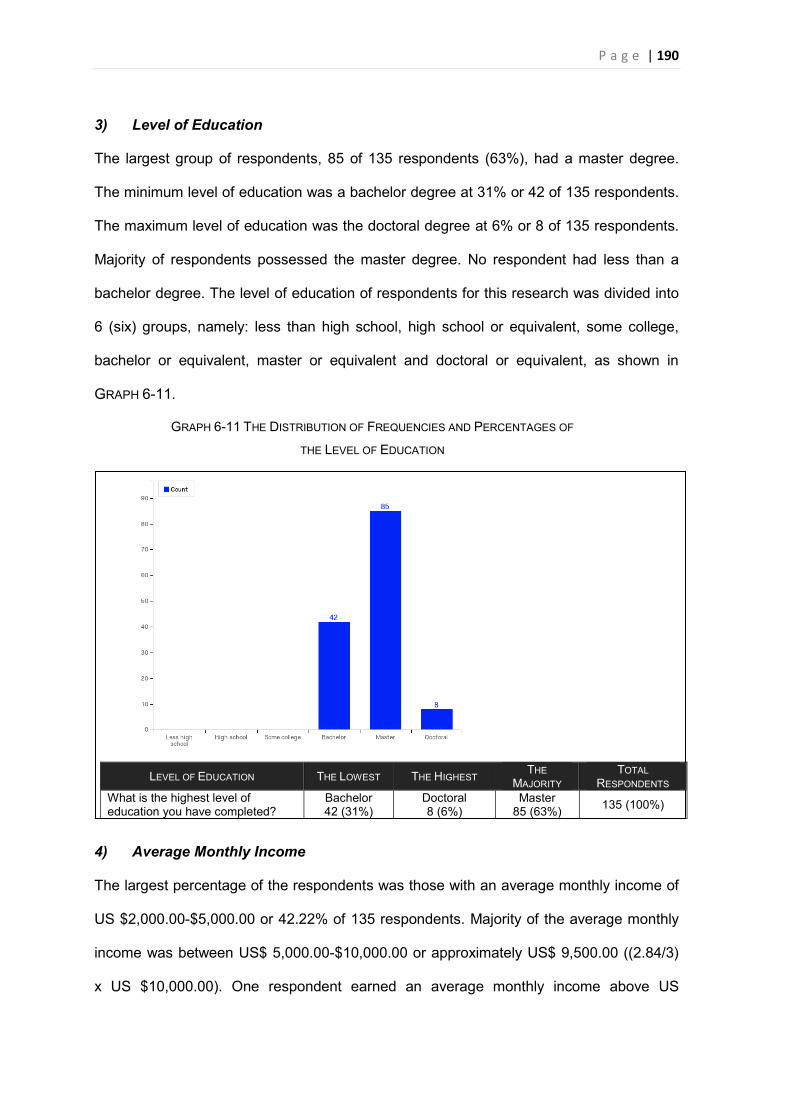
P a g e | 190
3) Level of Education
The largest group of respondents, 85 of 135 respondents (63%), had a master degree.
The minimum level of education was a bachelor degree at 31% or 42 of 135 respondents.
The maximum level of education was the doctoral degree at 6% or 8 of 135 respondents.
Majority of respondents possessed the master degree. No respondent had less than a
bachelor degree. The level of education of respondents for this research was divided into
6 (six) groups, namely: less than high school, high school or equivalent, some college,
bachelor or equivalent, master or equivalent and doctoral or equivalent, as shown in
GRAPH 6-11.
GRAPH 6-11 THE DISTRIBUTION OF FREQUENCIES AND PERCENTAGES OF
THE LEVEL OF EDUCATION
LEVEL OF EDUCATION THE LOWEST THE HIGHEST THE MAJORITY
TOTAL RESPONDENTS
What is the highest level of education you have completed?
Bachelor 42 (31%)
Doctoral 8 (6%)
Master 85 (63%) 135 (100%)
4) Average Monthly Income
The largest percentage of the respondents was those with an average monthly income of
US $2,000.00-$5,000.00 or 42.22% of 135 respondents. Majority of the average monthly
income was between US$ 5,000.00-$10,000.00 or approximately US$ 9,500.00 ((2.84/3)
x US $10,000.00). One respondent earned an average monthly income above US
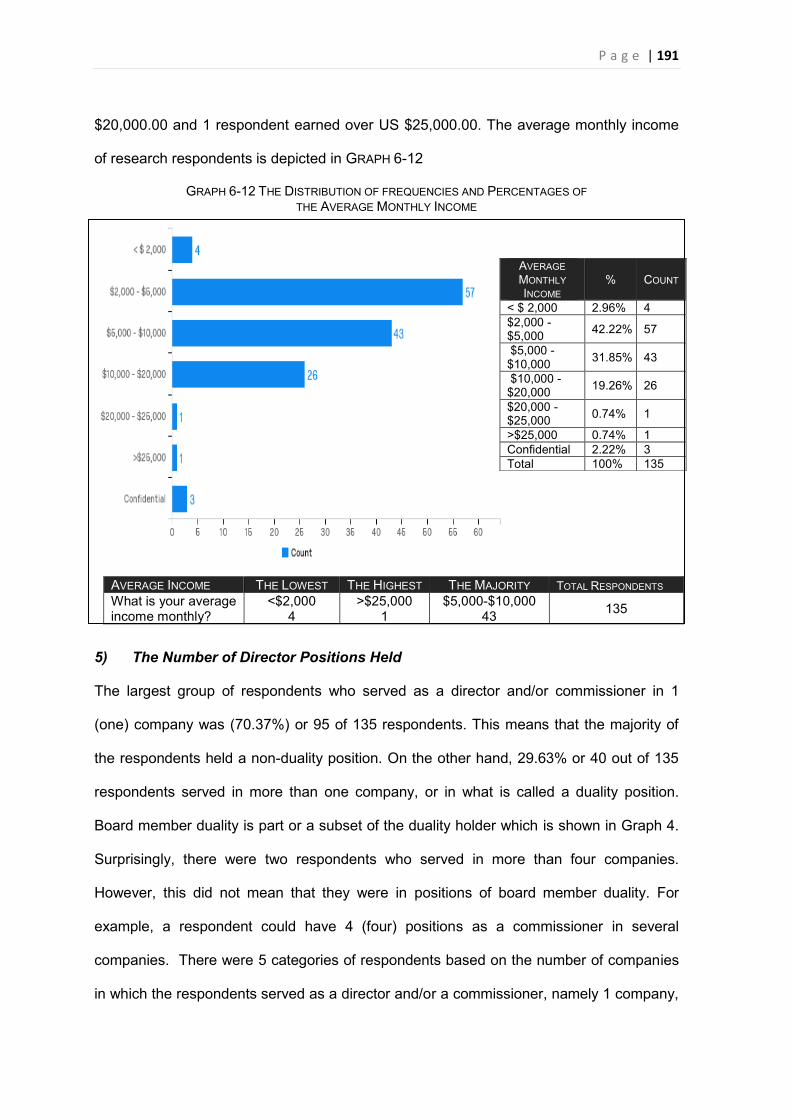
P a g e | 191
$20,000.00 and 1 respondent earned over US $25,000.00. The average monthly income
of research respondents is depicted in GRAPH 6-12
GRAPH 6-12 THE DISTRIBUTION OF FREQUENCIES AND PERCENTAGES OF THE AVERAGE MONTHLY INCOME
AVERAGE INCOME THE LOWEST THE HIGHEST THE MAJORITY TOTAL RESPONDENTS What is your average income monthly?
<$2,000 4
>$25,000 1
$5,000-$10,000 43 135
5) The Number of Director Positions Held
The largest group of respondents who served as a director and/or commissioner in 1
(one) company was (70.37%) or 95 of 135 respondents. This means that the majority of
the respondents held a non-duality position. On the other hand, 29.63% or 40 out of 135
respondents served in more than one company, or in what is called a duality position.
Board member duality is part or a subset of the duality holder which is shown in Graph 4.
Surprisingly, there were two respondents who served in more than four companies.
However, this did not mean that they were in positions of board member duality. For
example, a respondent could have 4 (four) positions as a commissioner in several
companies. There were 5 categories of respondents based on the number of companies
in which the respondents served as a director and/or a commissioner, namely 1 company,
AVERAGE MONTHLY INCOME
% COUNT
< $ 2,000 2.96% 4 $2,000 - $5,000 42.22% 57
$5,000 - $10,000 31.85% 43
$10,000 - $20,000 19.26% 26
$20,000 - $25,000 0.74% 1
>$25,000 0.74% 1 Confidential 2.22% 3 Total 100% 135
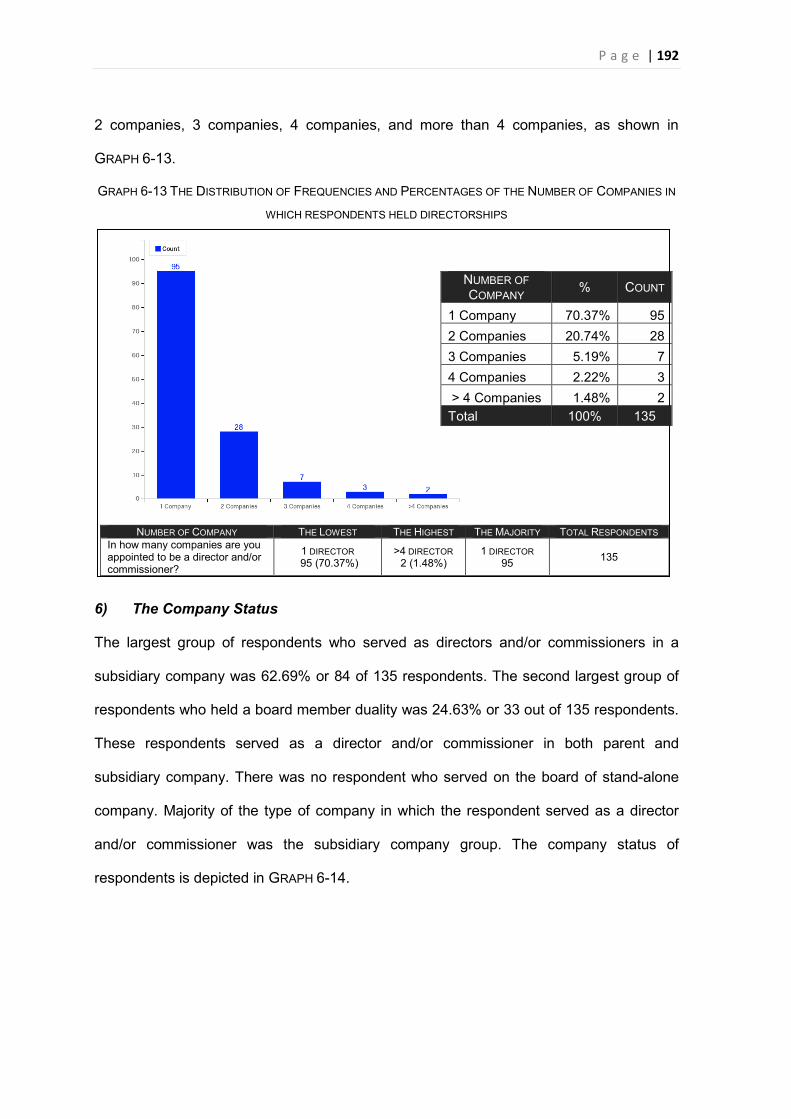
P a g e | 192
2 companies, 3 companies, 4 companies, and more than 4 companies, as shown in
GRAPH 6-13.
GRAPH 6-13 THE DISTRIBUTION OF FREQUENCIES AND PERCENTAGES OF THE NUMBER OF COMPANIES IN
WHICH RESPONDENTS HELD DIRECTORSHIPS
NUMBER OF COMPANY THE LOWEST THE HIGHEST THE MAJORITY TOTAL RESPONDENTS
In how many companies are you appointed to be a director and/or commissioner?
1 DIRECTOR 95 (70.37%)
>4 DIRECTOR 2 (1.48%)
1 DIRECTOR 95 135
6) The Company Status
The largest group of respondents who served as directors and/or commissioners in a
subsidiary company was 62.69% or 84 of 135 respondents. The second largest group of
respondents who held a board member duality was 24.63% or 33 out of 135 respondents.
These respondents served as a director and/or commissioner in both parent and
subsidiary company. There was no respondent who served on the board of stand-alone
company. Majority of the type of company in which the respondent served as a director
and/or commissioner was the subsidiary company group. The company status of
respondents is depicted in GRAPH 6-14.
NUMBER OF COMPANY % COUNT
1 Company 70.37% 95 2 Companies 20.74% 28 3 Companies 5.19% 7 4 Companies 2.22% 3 > 4 Companies 1.48% 2 Total 100% 135
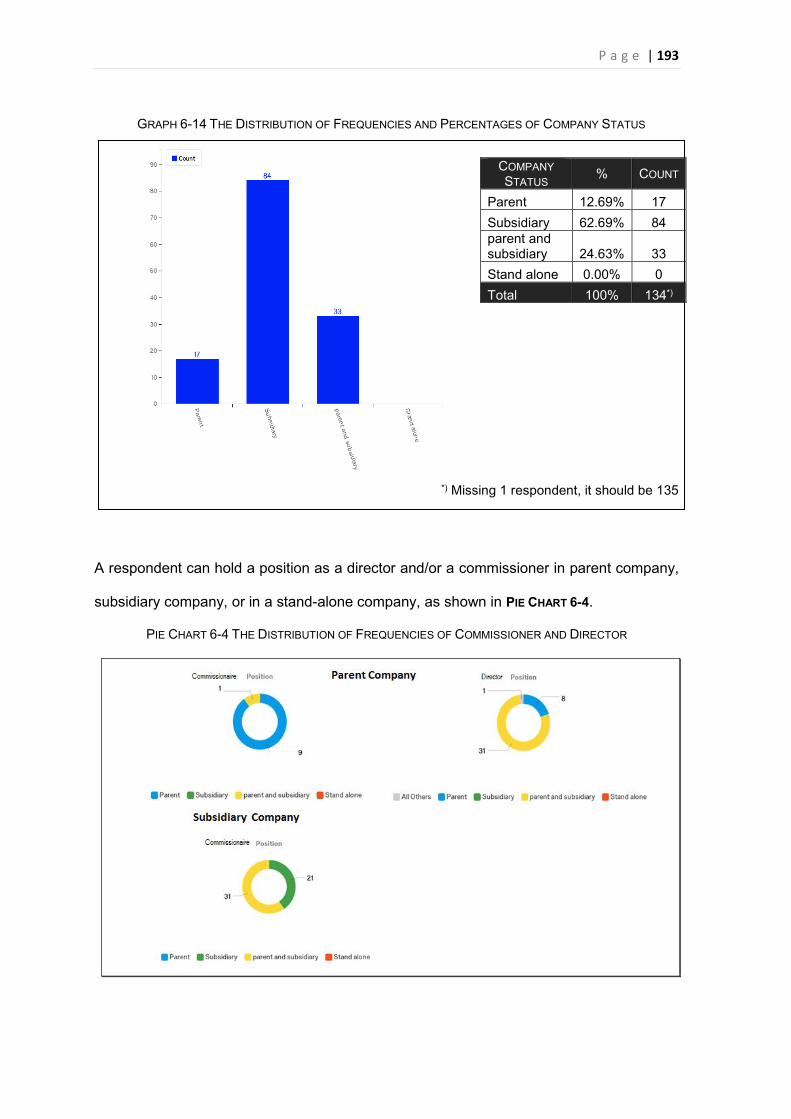
P a g e | 193
GRAPH 6-14 THE DISTRIBUTION OF FREQUENCIES AND PERCENTAGES OF COMPANY STATUS
*) Missing 1 respondent, it should be 135
A respondent can hold a position as a director and/or a commissioner in parent company,
subsidiary company, or in a stand-alone company, as shown in PIE CHART 6-4.
PIE CHART 6-4 THE DISTRIBUTION OF FREQUENCIES OF COMMISSIONER AND DIRECTOR
COMPANY STATUS % COUNT
Parent 12.69% 17 Subsidiary 62.69% 84 parent and subsidiary 24.63% 33 Stand alone 0.00% 0 Total 100% 134*)
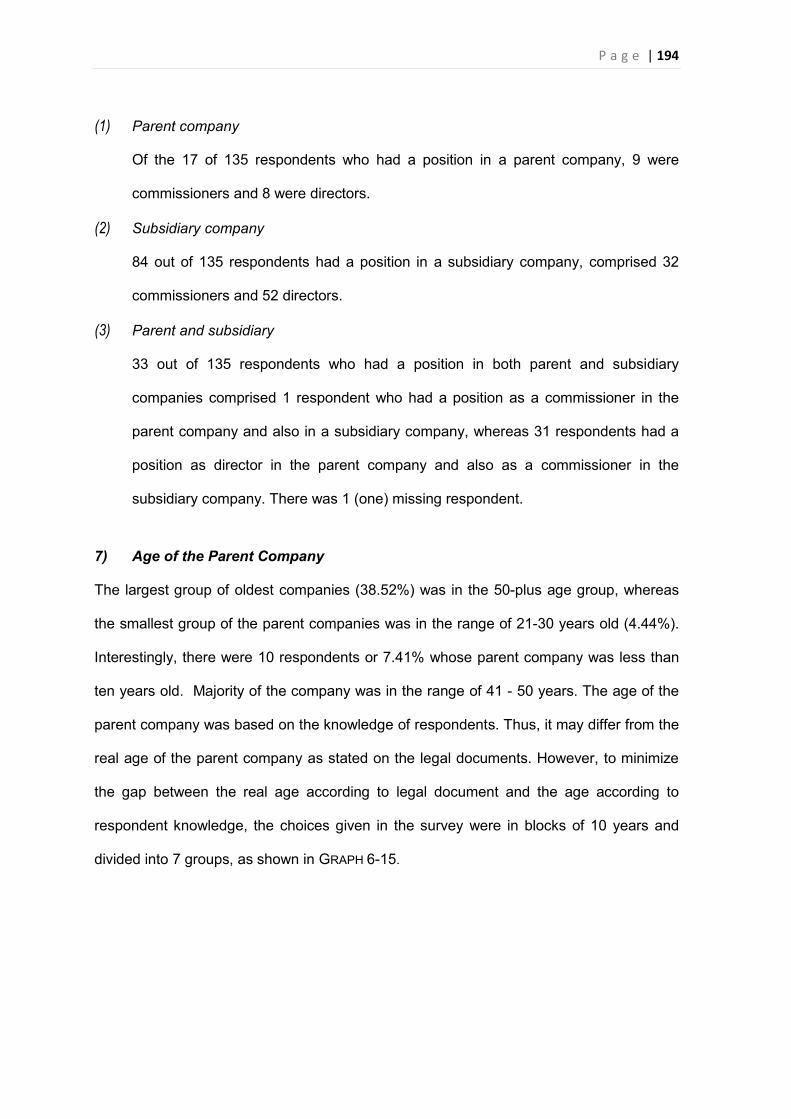
P a g e | 194
(1) Parent company
Of the 17 of 135 respondents who had a position in a parent company, 9 were
commissioners and 8 were directors.
(2) Subsidiary company
84 out of 135 respondents had a position in a subsidiary company, comprised 32
commissioners and 52 directors.
(3) Parent and subsidiary
33 out of 135 respondents who had a position in both parent and subsidiary
companies comprised 1 respondent who had a position as a commissioner in the
parent company and also in a subsidiary company, whereas 31 respondents had a
position as director in the parent company and also as a commissioner in the
subsidiary company. There was 1 (one) missing respondent.
7) Age of the Parent Company
The largest group of oldest companies (38.52%) was in the 50-plus age group, whereas
the smallest group of the parent companies was in the range of 21-30 years old (4.44%).
Interestingly, there were 10 respondents or 7.41% whose parent company was less than
ten years old. Majority of the company was in the range of 41 - 50 years. The age of the
parent company was based on the knowledge of respondents. Thus, it may differ from the
real age of the parent company as stated on the legal documents. However, to minimize
the gap between the real age according to legal document and the age according to
respondent knowledge, the choices given in the survey were in blocks of 10 years and
divided into 7 groups, as shown in GRAPH 6-15.
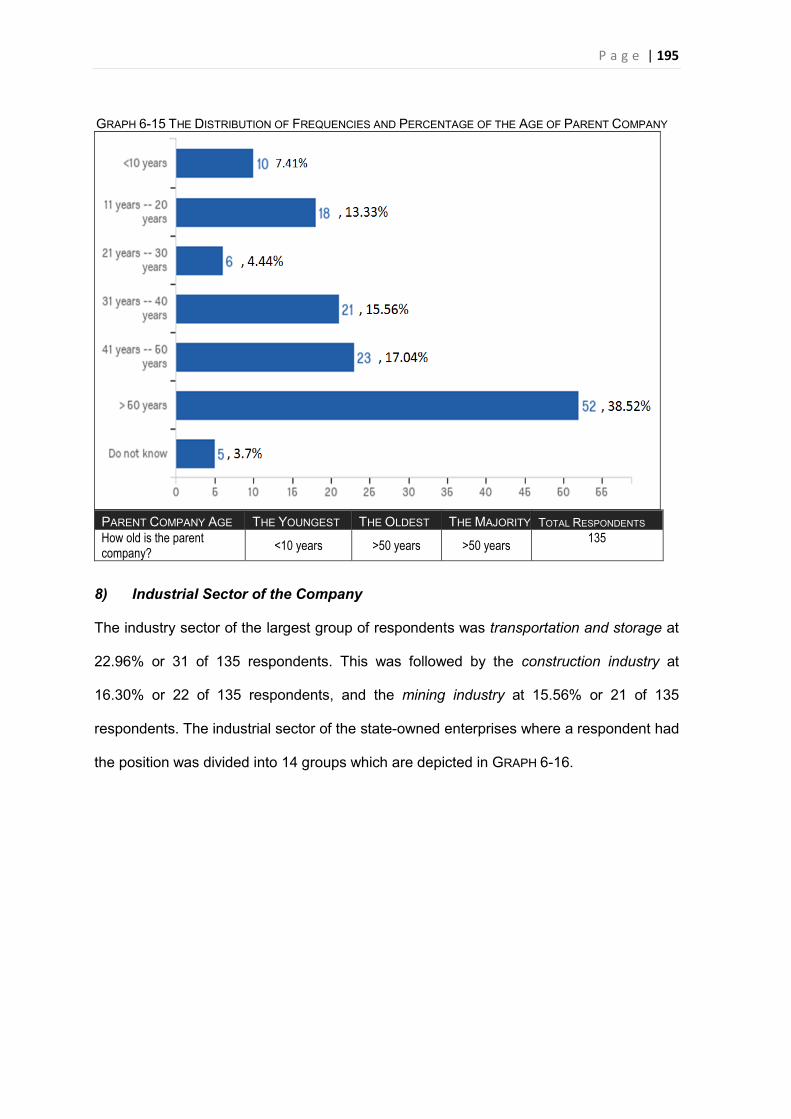
P a g e | 195
GRAPH 6-15 THE DISTRIBUTION OF FREQUENCIES AND PERCENTAGE OF THE AGE OF PARENT COMPANY
PARENT COMPANY AGE THE YOUNGEST THE OLDEST THE MAJORITY TOTAL RESPONDENTS How old is the parent company? <10 years >50 years >50 years 135
8) Industrial Sector of the Company
The industry sector of the largest group of respondents was transportation and storage at
22.96% or 31 of 135 respondents. This was followed by the construction industry at
16.30% or 22 of 135 respondents, and the mining industry at 15.56% or 21 of 135
respondents. The industrial sector of the state-owned enterprises where a respondent had
the position was divided into 14 groups which are depicted in GRAPH 6-16.
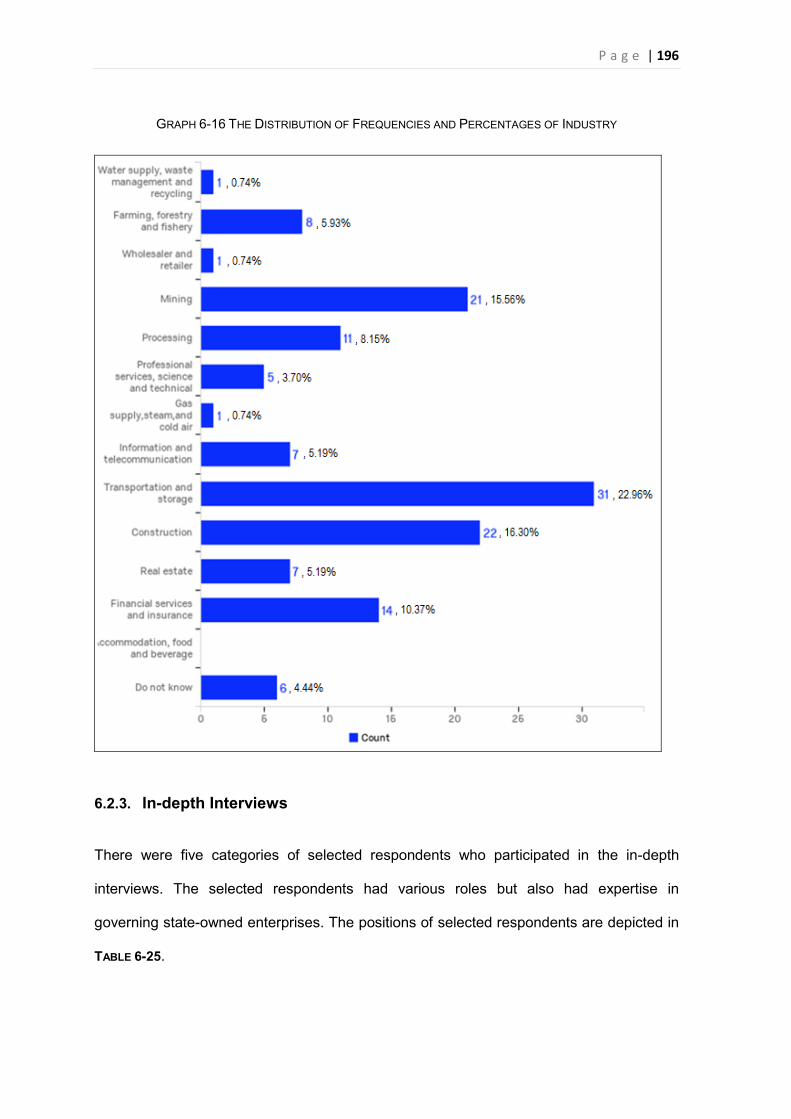
P a g e | 196
GRAPH 6-16 THE DISTRIBUTION OF FREQUENCIES AND PERCENTAGES OF INDUSTRY
6.2.3. In-depth Interviews
There were five categories of selected respondents who participated in the in-depth
interviews. The selected respondents had various roles but also had expertise in
governing state-owned enterprises. The positions of selected respondents are depicted in
TABLE 6-25.
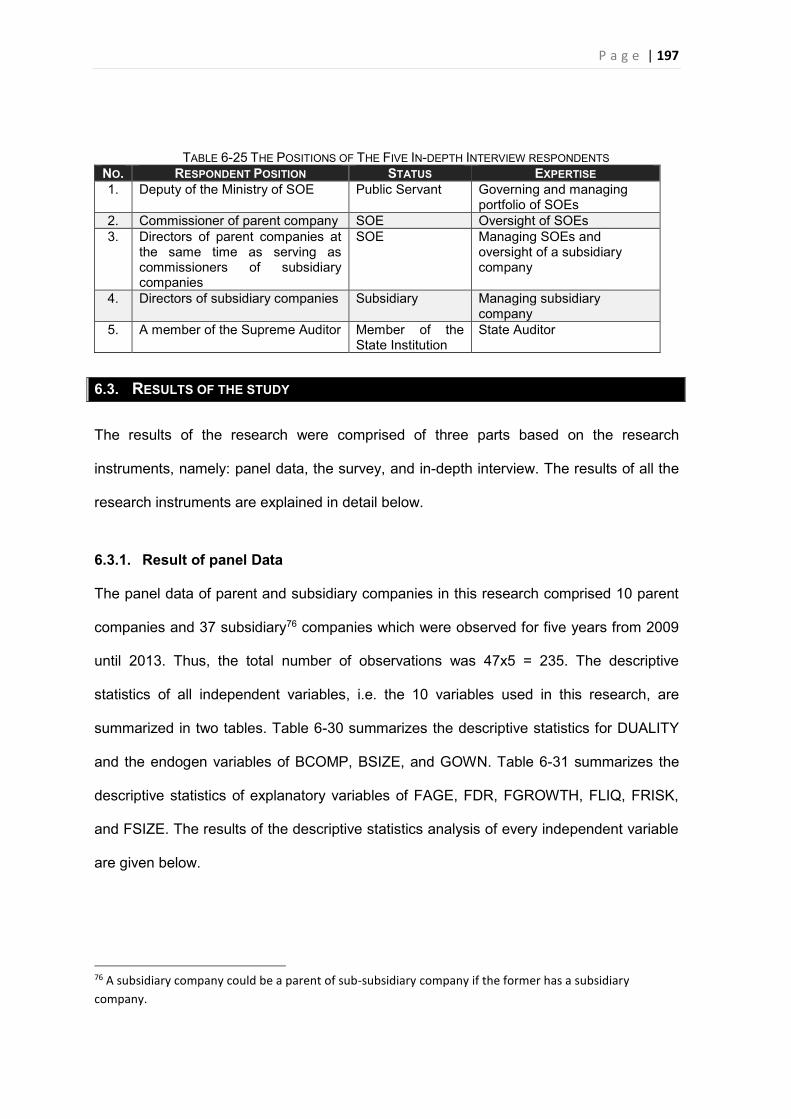
P a g e | 197
TABLE 6-25 THE POSITIONS OF THE FIVE IN-DEPTH INTERVIEW RESPONDENTS NO. RESPONDENT POSITION STATUS EXPERTISE 1. Deputy of the Ministry of SOE Public Servant Governing and managing
portfolio of SOEs 2. Commissioner of parent company SOE Oversight of SOEs 3. Directors of parent companies at
the same time as serving as commissioners of subsidiary companies
SOE Managing SOEs and oversight of a subsidiary company
4. Directors of subsidiary companies Subsidiary Managing subsidiary company
5. A member of the Supreme Auditor Member of the State Institution
State Auditor
6.3. RESULTS OF THE STUDY
The results of the research were comprised of three parts based on the research
instruments, namely: panel data, the survey, and in-depth interview. The results of all the
research instruments are explained in detail below.
6.3.1. Result of panel Data
The panel data of parent and subsidiary companies in this research comprised 10 parent
companies and 37 subsidiary76 companies which were observed for five years from 2009
until 2013. Thus, the total number of observations was 47x5 = 235. The descriptive
statistics of all independent variables, i.e. the 10 variables used in this research, are
summarized in two tables. Table 6-30 summarizes the descriptive statistics for DUALITY
and the endogen variables of BCOMP, BSIZE, and GOWN. Table 6-31 summarizes the
descriptive statistics of explanatory variables of FAGE, FDR, FGROWTH, FLIQ, FRISK,
and FSIZE. The results of the descriptive statistics analysis of every independent variable
are given below.
76 A subsidiary company could be a parent of sub-subsidiary company if the former has a subsidiary company.
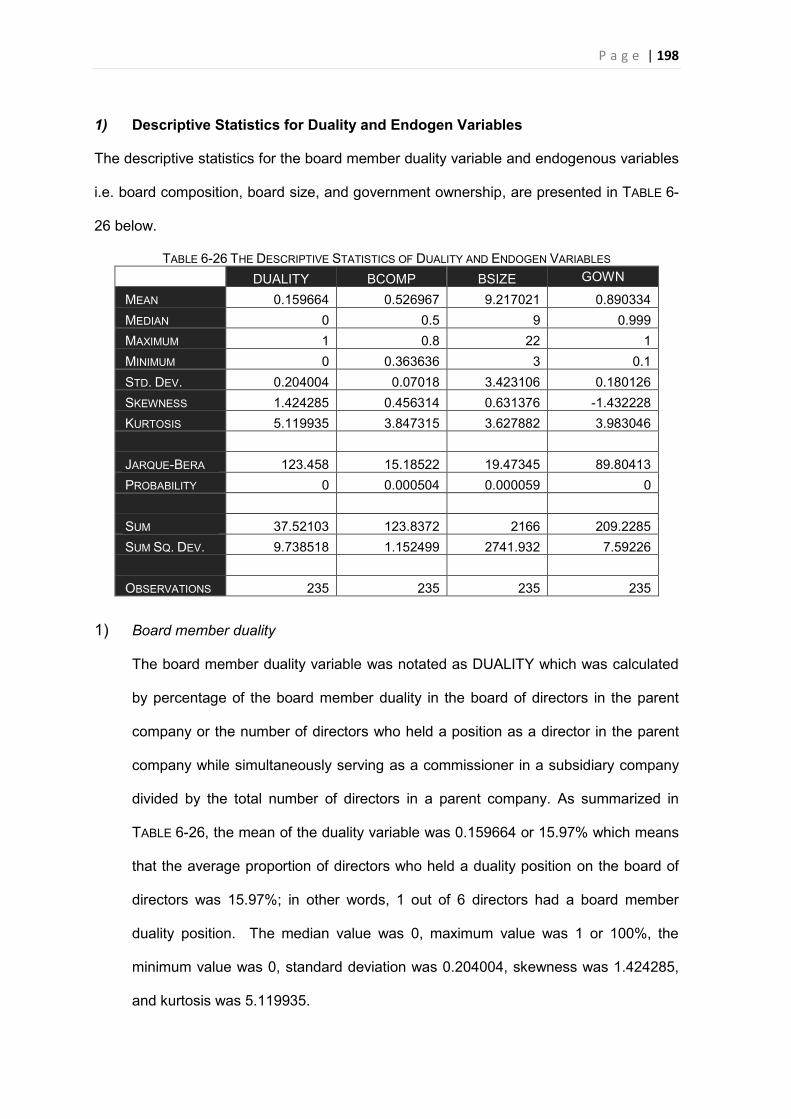
P a g e | 198
1) Descriptive Statistics for Duality and Endogen Variables
The descriptive statistics for the board member duality variable and endogenous variables
i.e. board composition, board size, and government ownership, are presented in TABLE 6-
26 below.
TABLE 6-26 THE DESCRIPTIVE STATISTICS OF DUALITY AND ENDOGEN VARIABLES
DUALITY BCOMP BSIZE GOWN
MEAN 0.159664 0.526967 9.217021 0.890334 MEDIAN 0 0.5 9 0.999 MAXIMUM 1 0.8 22 1 MINIMUM 0 0.363636 3 0.1 STD. DEV. 0.204004 0.07018 3.423106 0.180126 SKEWNESS 1.424285 0.456314 0.631376 -1.432228 KURTOSIS 5.119935 3.847315 3.627882 3.983046
JARQUE-BERA 123.458 15.18522 19.47345 89.80413 PROBABILITY 0 0.000504 0.000059 0
SUM 37.52103 123.8372 2166 209.2285 SUM SQ. DEV. 9.738518 1.152499 2741.932 7.59226
OBSERVATIONS 235 235 235 235
1) Board member duality
The board member duality variable was notated as DUALITY which was calculated
by percentage of the board member duality in the board of directors in the parent
company or the number of directors who held a position as a director in the parent
company while simultaneously serving as a commissioner in a subsidiary company
divided by the total number of directors in a parent company. As summarized in
TABLE 6-26, the mean of the duality variable was 0.159664 or 15.97% which means
that the average proportion of directors who held a duality position on the board of
directors was 15.97%; in other words, 1 out of 6 directors had a board member
duality position. The median value was 0, maximum value was 1 or 100%, the
minimum value was 0, standard deviation was 0.204004, skewness was 1.424285,
and kurtosis was 5.119935.
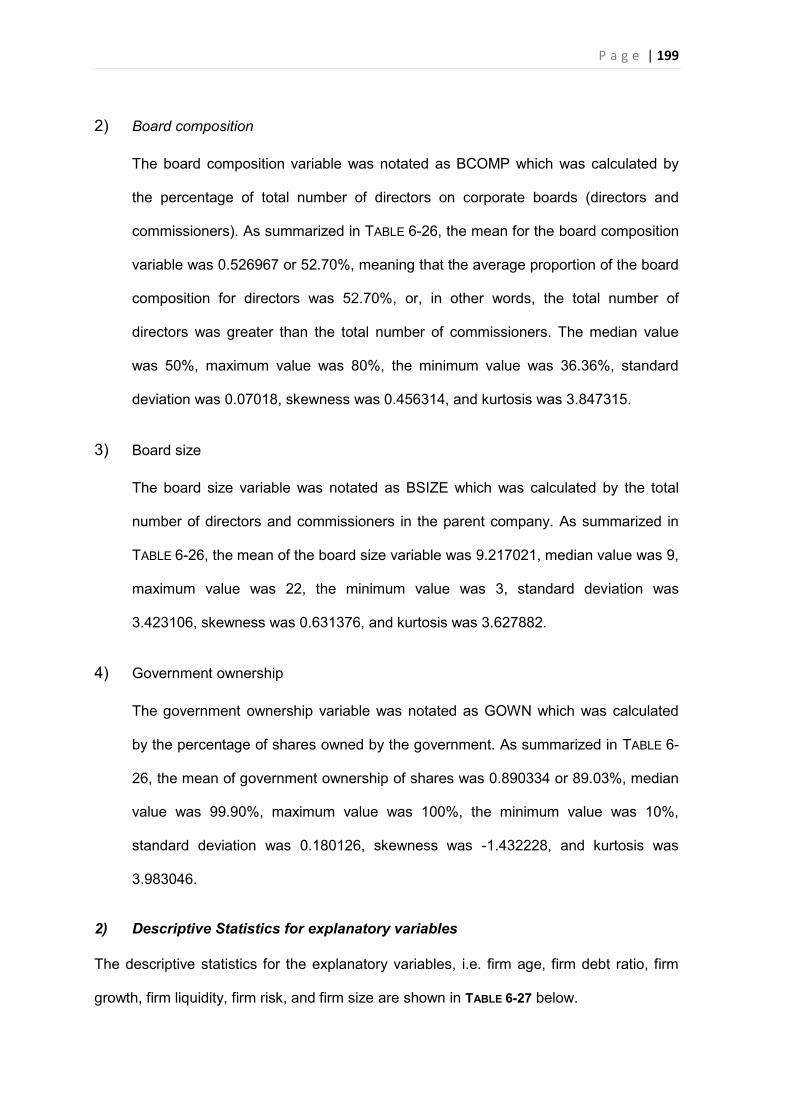
P a g e | 199
2) Board composition
The board composition variable was notated as BCOMP which was calculated by
the percentage of total number of directors on corporate boards (directors and
commissioners). As summarized in TABLE 6-26, the mean for the board composition
variable was 0.526967 or 52.70%, meaning that the average proportion of the board
composition for directors was 52.70%, or, in other words, the total number of
directors was greater than the total number of commissioners. The median value
was 50%, maximum value was 80%, the minimum value was 36.36%, standard
deviation was 0.07018, skewness was 0.456314, and kurtosis was 3.847315.
3) Board size
The board size variable was notated as BSIZE which was calculated by the total
number of directors and commissioners in the parent company. As summarized in
TABLE 6-26, the mean of the board size variable was 9.217021, median value was 9,
maximum value was 22, the minimum value was 3, standard deviation was
3.423106, skewness was 0.631376, and kurtosis was 3.627882.
4) Government ownership
The government ownership variable was notated as GOWN which was calculated
by the percentage of shares owned by the government. As summarized in TABLE 6-
26, the mean of government ownership of shares was 0.890334 or 89.03%, median
value was 99.90%, maximum value was 100%, the minimum value was 10%,
standard deviation was 0.180126, skewness was -1.432228, and kurtosis was
3.983046.
2) Descriptive Statistics for explanatory variables
The descriptive statistics for the explanatory variables, i.e. firm age, firm debt ratio, firm
growth, firm liquidity, firm risk, and firm size are shown in TABLE 6-27 below.
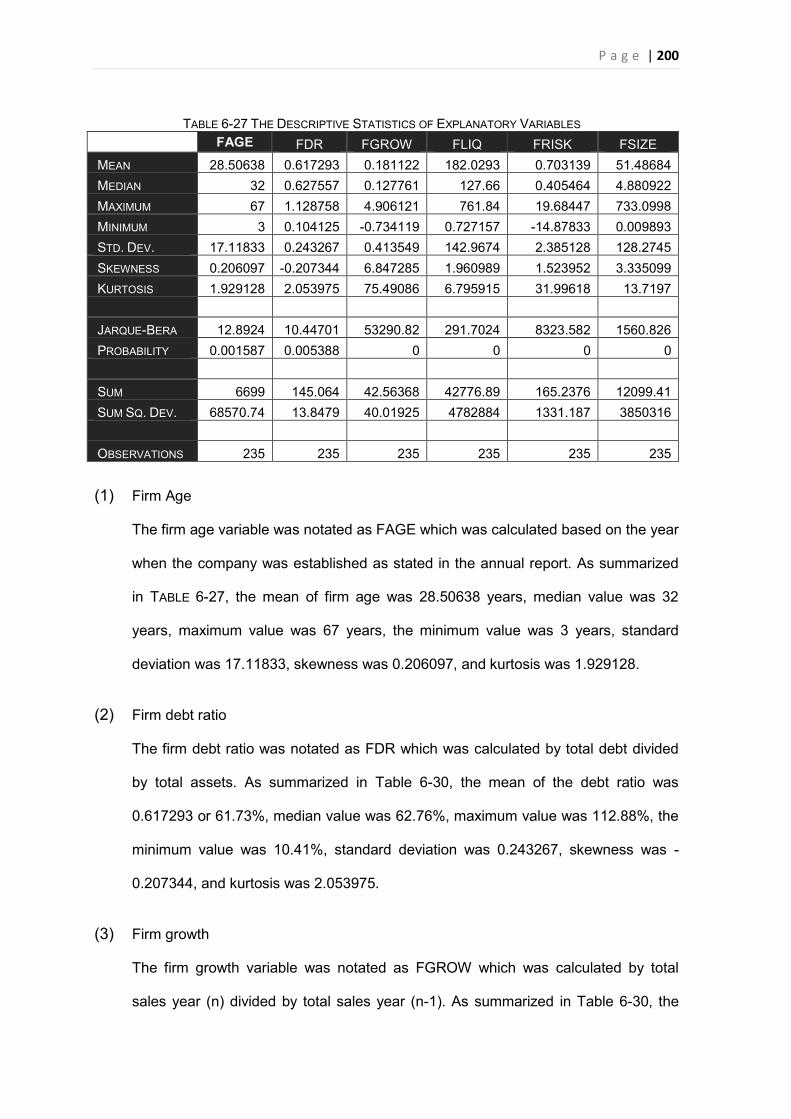
P a g e | 200
TABLE 6-27 THE DESCRIPTIVE STATISTICS OF EXPLANATORY VARIABLES
FAGE FDR FGROW FLIQ FRISK FSIZE
MEAN 28.50638 0.617293 0.181122 182.0293 0.703139 51.48684 MEDIAN 32 0.627557 0.127761 127.66 0.405464 4.880922 MAXIMUM 67 1.128758 4.906121 761.84 19.68447 733.0998 MINIMUM 3 0.104125 -0.734119 0.727157 -14.87833 0.009893 STD. DEV. 17.11833 0.243267 0.413549 142.9674 2.385128 128.2745 SKEWNESS 0.206097 -0.207344 6.847285 1.960989 1.523952 3.335099 KURTOSIS 1.929128 2.053975 75.49086 6.795915 31.99618 13.7197
JARQUE-BERA 12.8924 10.44701 53290.82 291.7024 8323.582 1560.826 PROBABILITY 0.001587 0.005388 0 0 0 0
SUM 6699 145.064 42.56368 42776.89 165.2376 12099.41 SUM SQ. DEV. 68570.74 13.8479 40.01925 4782884 1331.187 3850316
OBSERVATIONS 235 235 235 235 235 235
(1) Firm Age
The firm age variable was notated as FAGE which was calculated based on the year
when the company was established as stated in the annual report. As summarized
in TABLE 6-27, the mean of firm age was 28.50638 years, median value was 32
years, maximum value was 67 years, the minimum value was 3 years, standard
deviation was 17.11833, skewness was 0.206097, and kurtosis was 1.929128.
(2) Firm debt ratio
The firm debt ratio was notated as FDR which was calculated by total debt divided
by total assets. As summarized in Table 6-30, the mean of the debt ratio was
0.617293 or 61.73%, median value was 62.76%, maximum value was 112.88%, the
minimum value was 10.41%, standard deviation was 0.243267, skewness was -
0.207344, and kurtosis was 2.053975.
(3) Firm growth
The firm growth variable was notated as FGROW which was calculated by total
sales year (n) divided by total sales year (n-1). As summarized in Table 6-30, the
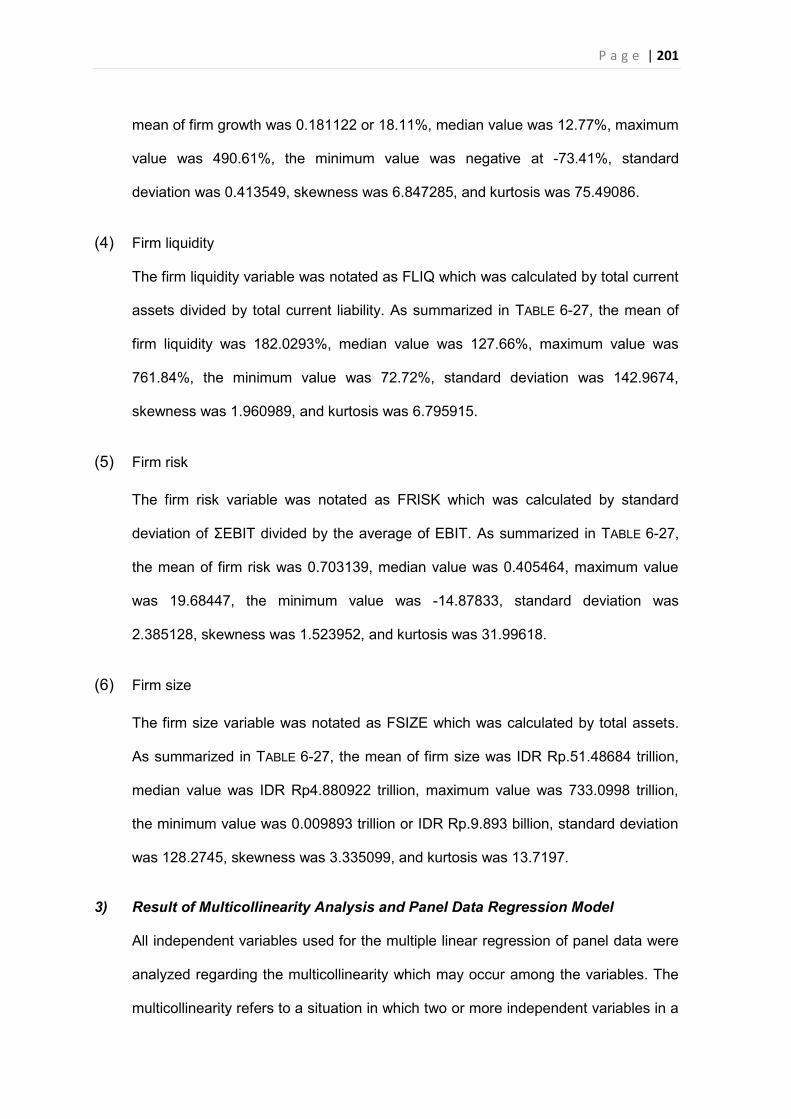
P a g e | 201
mean of firm growth was 0.181122 or 18.11%, median value was 12.77%, maximum
value was 490.61%, the minimum value was negative at -73.41%, standard
deviation was 0.413549, skewness was 6.847285, and kurtosis was 75.49086.
(4) Firm liquidity
The firm liquidity variable was notated as FLIQ which was calculated by total current
assets divided by total current liability. As summarized in TABLE 6-27, the mean of
firm liquidity was 182.0293%, median value was 127.66%, maximum value was
761.84%, the minimum value was 72.72%, standard deviation was 142.9674,
skewness was 1.960989, and kurtosis was 6.795915.
(5) Firm risk
The firm risk variable was notated as FRISK which was calculated by standard
deviation of ƩEBIT divided by the average of EBIT. As summarized in TABLE 6-27,
the mean of firm risk was 0.703139, median value was 0.405464, maximum value
was 19.68447, the minimum value was -14.87833, standard deviation was
2.385128, skewness was 1.523952, and kurtosis was 31.99618.
(6) Firm size
The firm size variable was notated as FSIZE which was calculated by total assets.
As summarized in TABLE 6-27, the mean of firm size was IDR Rp.51.48684 trillion,
median value was IDR Rp4.880922 trillion, maximum value was 733.0998 trillion,
the minimum value was 0.009893 trillion or IDR Rp.9.893 billion, standard deviation
was 128.2745, skewness was 3.335099, and kurtosis was 13.7197.
3) Result of Multicollinearity Analysis and Panel Data Regression Model
All independent variables used for the multiple linear regression of panel data were
analyzed regarding the multicollinearity which may occur among the variables. The
multicollinearity refers to a situation in which two or more independent variables in a
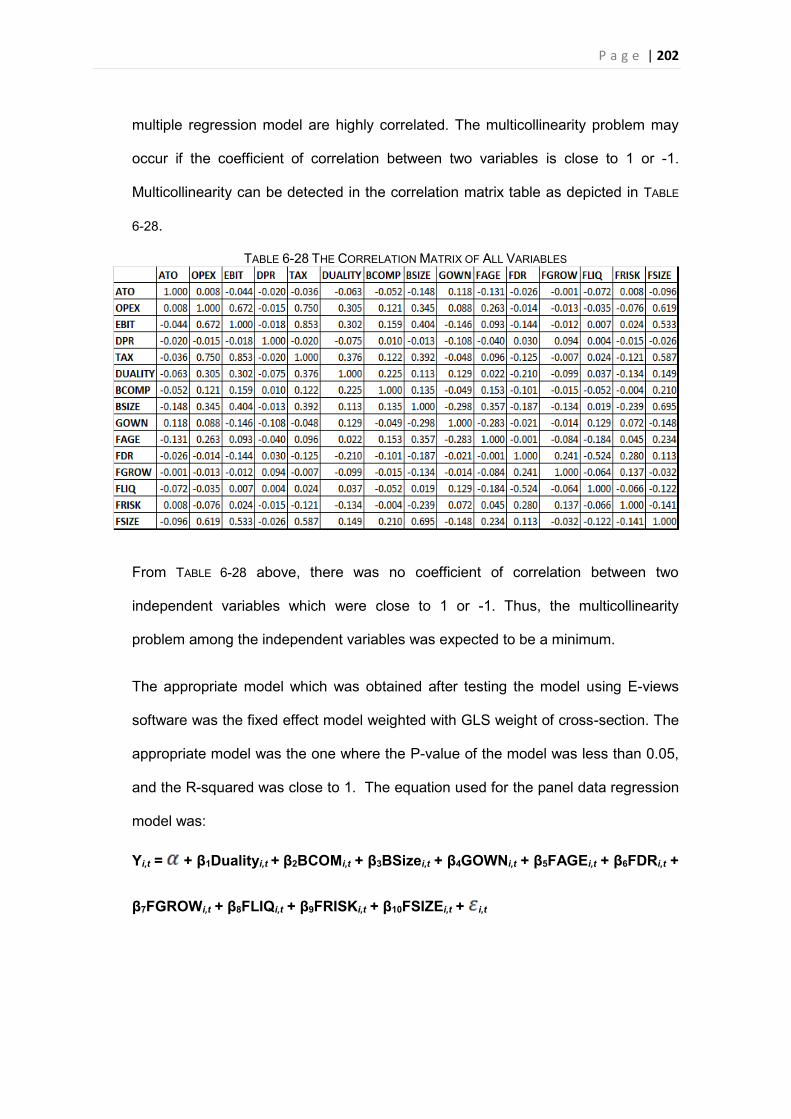
P a g e | 202
multiple regression model are highly correlated. The multicollinearity problem may
occur if the coefficient of correlation between two variables is close to 1 or -1.
Multicollinearity can be detected in the correlation matrix table as depicted in TABLE
6-28.
TABLE 6-28 THE CORRELATION MATRIX OF ALL VARIABLES
From TABLE 6-28 above, there was no coefficient of correlation between two
independent variables which were close to 1 or -1. Thus, the multicollinearity
problem among the independent variables was expected to be a minimum.
The appropriate model which was obtained after testing the model using E-views
software was the fixed effect model weighted with GLS weight of cross-section. The
appropriate model was the one where the P-value of the model was less than 0.05,
and the R-squared was close to 1. The equation used for the panel data regression
model was:
Yi,t = + β1Dualityi,t + β2BCOMi,t + β3BSizei,t + β4GOWNi,t + β5FAGEi,t + β6FDRi,t +
β7FGROWi,t + β8FLIQi,t + β9FRISKi,t + β10FSIZEi,t + i,t
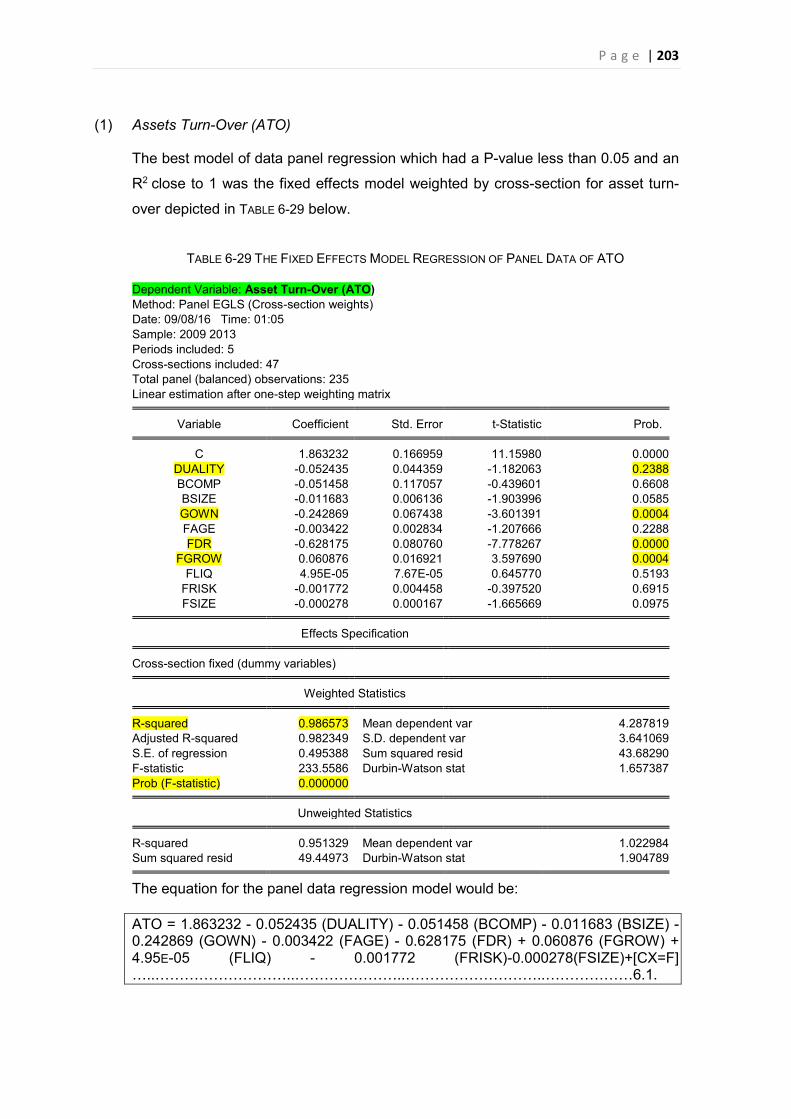
P a g e | 203
(1) Assets Turn-Over (ATO)
The best model of data panel regression which had a P-value less than 0.05 and an
R2 close to 1 was the fixed effects model weighted by cross-section for asset turn-
over depicted in TABLE 6-29 below.
TABLE 6-29 THE FIXED EFFECTS MODEL REGRESSION OF PANEL DATA OF ATO
Dependent Variable: Asset Turn-Over (ATO) Method: Panel EGLS (Cross-section weights) Date: 09/08/16 Time: 01:05 Sample: 2009 2013 Periods included: 5 Cross-sections included: 47 Total panel (balanced) observations: 235 Linear estimation after one-step weighting matrix
Variable Coefficient Std. Error t-Statistic Prob. C 1.863232 0.166959 11.15980 0.0000
DUALITY -0.052435 0.044359 -1.182063 0.2388 BCOMP -0.051458 0.117057 -0.439601 0.6608 BSIZE -0.011683 0.006136 -1.903996 0.0585 GOWN -0.242869 0.067438 -3.601391 0.0004 FAGE -0.003422 0.002834 -1.207666 0.2288 FDR -0.628175 0.080760 -7.778267 0.0000
FGROW 0.060876 0.016921 3.597690 0.0004 FLIQ 4.95E-05 7.67E-05 0.645770 0.5193
FRISK -0.001772 0.004458 -0.397520 0.6915 FSIZE -0.000278 0.000167 -1.665669 0.0975
Effects Specification Cross-section fixed (dummy variables) Weighted Statistics R-squared 0.986573 Mean dependent var 4.287819
Adjusted R-squared 0.982349 S.D. dependent var 3.641069 S.E. of regression 0.495388 Sum squared resid 43.68290 F-statistic 233.5586 Durbin-Watson stat 1.657387 Prob (F-statistic) 0.000000
Unweighted Statistics R-squared 0.951329 Mean dependent var 1.022984
Sum squared resid 49.44973 Durbin-Watson stat 1.904789 The equation for the panel data regression model would be:
ATO = 1.863232 - 0.052435 (DUALITY) - 0.051458 (BCOMP) - 0.011683 (BSIZE) - 0.242869 (GOWN) - 0.003422 (FAGE) - 0.628175 (FDR) + 0.060876 (FGROW) + 4.95E-05 (FLIQ) - 0.001772 (FRISK)-0.000278(FSIZE)+[CX=F] …..………………………..…………………..………………………..………………6.1.
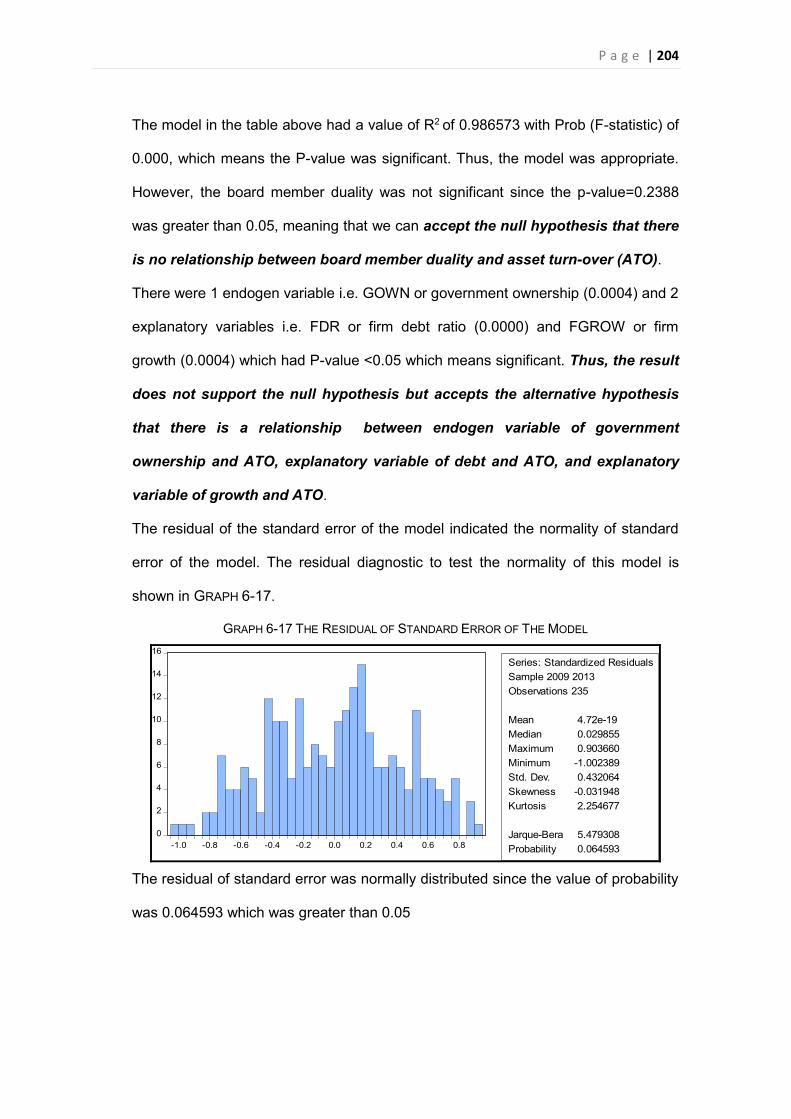
P a g e | 204
The model in the table above had a value of R2 of 0.986573 with Prob (F-statistic) of
0.000, which means the P-value was significant. Thus, the model was appropriate.
However, the board member duality was not significant since the p-value=0.2388
was greater than 0.05, meaning that we can accept the null hypothesis that there
is no relationship between board member duality and asset turn-over (ATO).
There were 1 endogen variable i.e. GOWN or government ownership (0.0004) and 2
explanatory variables i.e. FDR or firm debt ratio (0.0000) and FGROW or firm
growth (0.0004) which had P-value <0.05 which means significant. Thus, the result
does not support the null hypothesis but accepts the alternative hypothesis
that there is a relationship between endogen variable of government
ownership and ATO, explanatory variable of debt and ATO, and explanatory
variable of growth and ATO.
The residual of the standard error of the model indicated the normality of standard
error of the model. The residual diagnostic to test the normality of this model is
shown in GRAPH 6-17.
GRAPH 6-17 THE RESIDUAL OF STANDARD ERROR OF THE MODEL
0
2
4
6
8
10
12
14
16
-1.0 -0.8 -0.6 -0.4 -0.2 0.0 0.2 0.4 0.6 0.8
Series: Standardized ResidualsSample 2009 2013Observations 235
Mean 4.72e-19Median 0.029855Maximum 0.903660Minimum -1.002389Std. Dev. 0.432064Skewness -0.031948Kurtosis 2.254677
Jarque-Bera 5.479308Probability 0.064593
The residual of standard error was normally distributed since the value of probability
was 0.064593 which was greater than 0.05
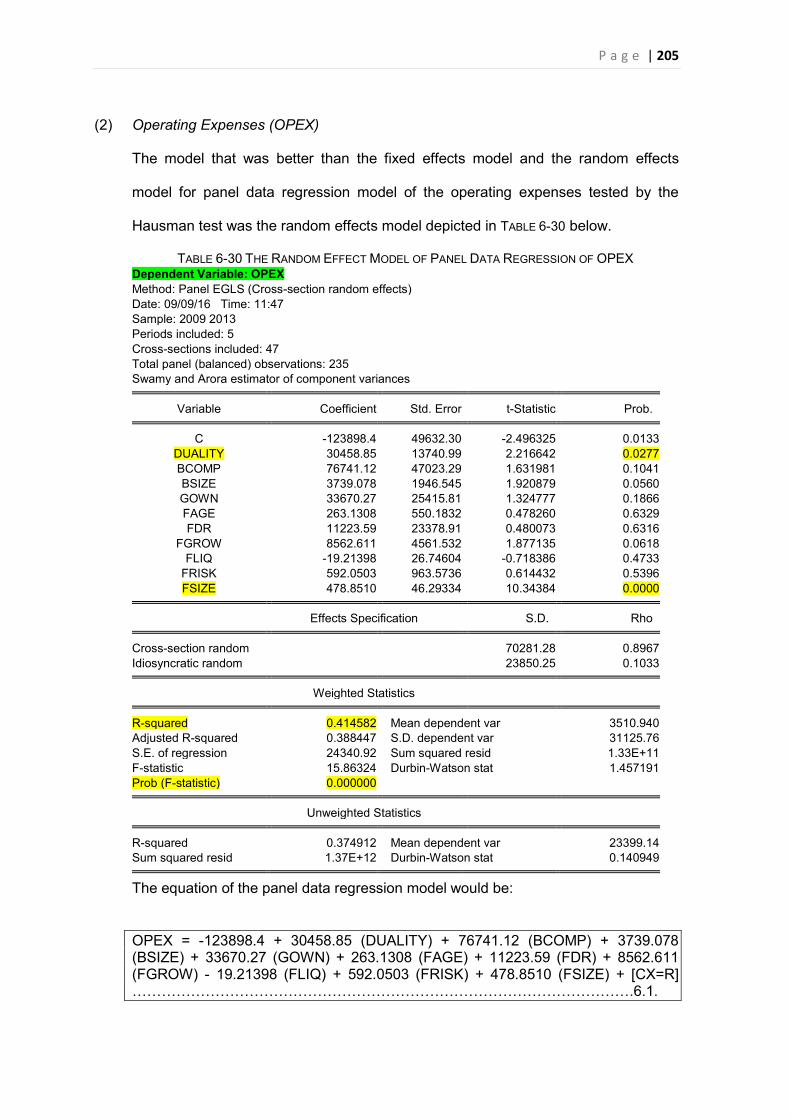
P a g e | 205
(2) Operating Expenses (OPEX)
The model that was better than the fixed effects model and the random effects
model for panel data regression model of the operating expenses tested by the
Hausman test was the random effects model depicted in TABLE 6-30 below.
TABLE 6-30 THE RANDOM EFFECT MODEL OF PANEL DATA REGRESSION OF OPEX Dependent Variable: OPEX Method: Panel EGLS (Cross-section random effects) Date: 09/09/16 Time: 11:47 Sample: 2009 2013 Periods included: 5 Cross-sections included: 47 Total panel (balanced) observations: 235 Swamy and Arora estimator of component variances
Variable Coefficient Std. Error t-Statistic Prob. C -123898.4 49632.30 -2.496325 0.0133
DUALITY 30458.85 13740.99 2.216642 0.0277 BCOMP 76741.12 47023.29 1.631981 0.1041 BSIZE 3739.078 1946.545 1.920879 0.0560 GOWN 33670.27 25415.81 1.324777 0.1866 FAGE 263.1308 550.1832 0.478260 0.6329 FDR 11223.59 23378.91 0.480073 0.6316
FGROW 8562.611 4561.532 1.877135 0.0618 FLIQ -19.21398 26.74604 -0.718386 0.4733
FRISK 592.0503 963.5736 0.614432 0.5396 FSIZE 478.8510 46.29334 10.34384 0.0000
Effects Specification S.D. Rho Cross-section random 70281.28 0.8967
Idiosyncratic random 23850.25 0.1033 Weighted Statistics R-squared 0.414582 Mean dependent var 3510.940
Adjusted R-squared 0.388447 S.D. dependent var 31125.76 S.E. of regression 24340.92 Sum squared resid 1.33E+11 F-statistic 15.86324 Durbin-Watson stat 1.457191 Prob (F-statistic) 0.000000
Unweighted Statistics R-squared 0.374912 Mean dependent var 23399.14
Sum squared resid 1.37E+12 Durbin-Watson stat 0.140949 The equation of the panel data regression model would be:
OPEX = -123898.4 + 30458.85 (DUALITY) + 76741.12 (BCOMP) + 3739.078 (BSIZE) + 33670.27 (GOWN) + 263.1308 (FAGE) + 11223.59 (FDR) + 8562.611 (FGROW) - 19.21398 (FLIQ) + 592.0503 (FRISK) + 478.8510 (FSIZE) + [CX=R] ………………………………………………………………………………………….6.1.
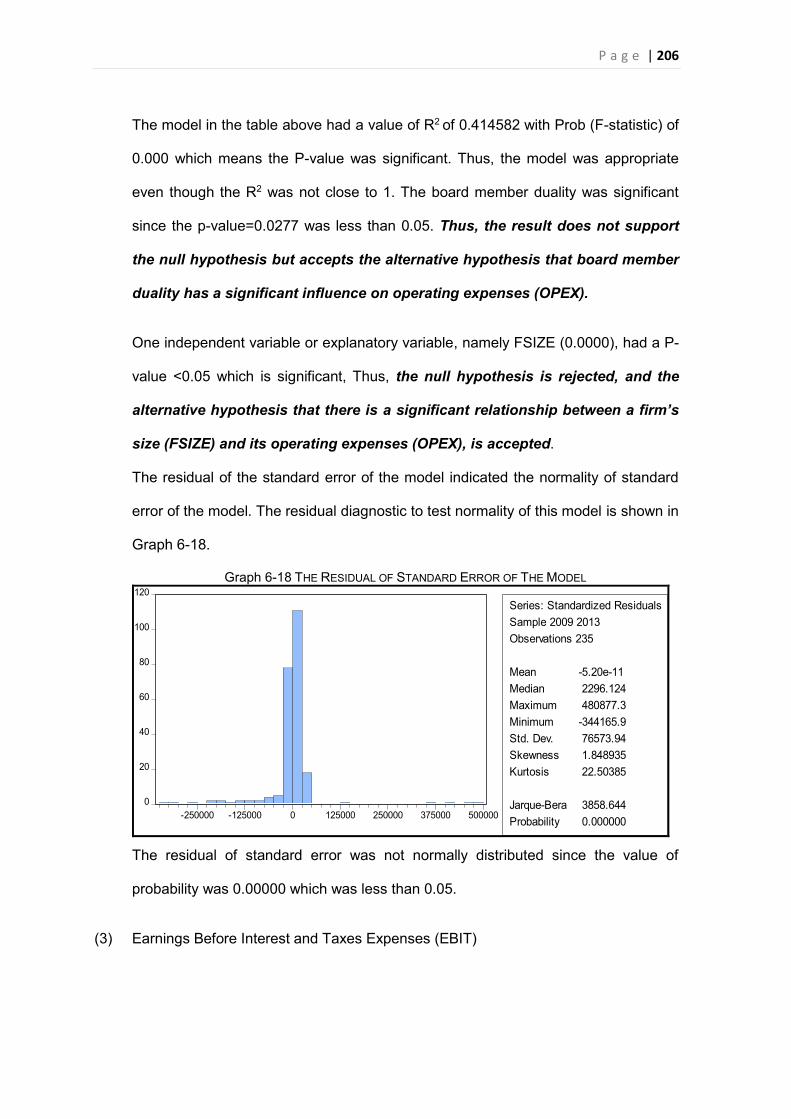
P a g e | 206
The model in the table above had a value of R2 of 0.414582 with Prob (F-statistic) of
0.000 which means the P-value was significant. Thus, the model was appropriate
even though the R2 was not close to 1. The board member duality was significant
since the p-value=0.0277 was less than 0.05. Thus, the result does not support
the null hypothesis but accepts the alternative hypothesis that board member
duality has a significant influence on operating expenses (OPEX).
One independent variable or explanatory variable, namely FSIZE (0.0000), had a P-
value <0.05 which is significant, Thus, the null hypothesis is rejected, and the
alternative hypothesis that there is a significant relationship between a firm’s
size (FSIZE) and its operating expenses (OPEX), is accepted.
The residual of the standard error of the model indicated the normality of standard
error of the model. The residual diagnostic to test normality of this model is shown in
Graph 6-18.
Graph 6-18 THE RESIDUAL OF STANDARD ERROR OF THE MODEL
0
20
40
60
80
100
120
-250000 -125000 0 125000 250000 375000 500000
Series: Standardized ResidualsSample 2009 2013Observations 235
Mean -5.20e-11Median 2296.124Maximum 480877.3Minimum -344165.9Std. Dev. 76573.94Skewness 1.848935Kurtosis 22.50385
Jarque-Bera 3858.644Probability 0.000000
The residual of standard error was not normally distributed since the value of
probability was 0.00000 which was less than 0.05.
(3) Earnings Before Interest and Taxes Expenses (EBIT)
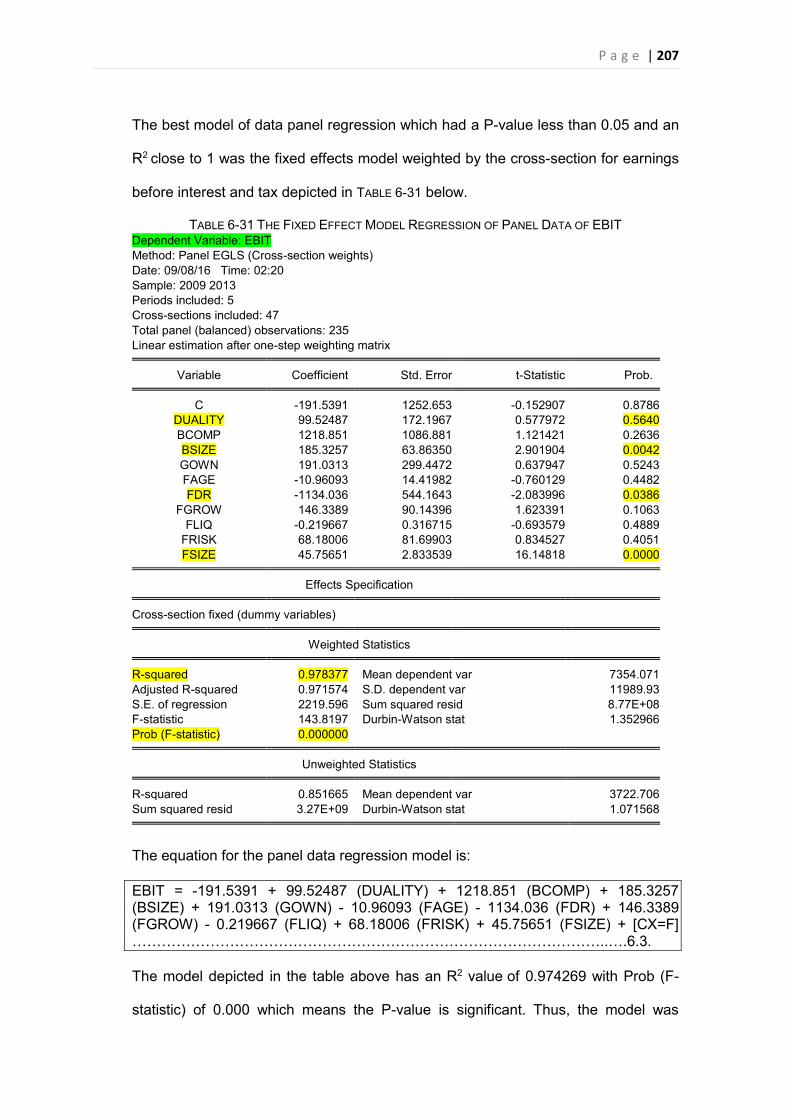
P a g e | 207
The best model of data panel regression which had a P-value less than 0.05 and an
R2 close to 1 was the fixed effects model weighted by the cross-section for earnings
before interest and tax depicted in TABLE 6-31 below.
TABLE 6-31 THE FIXED EFFECT MODEL REGRESSION OF PANEL DATA OF EBIT Dependent Variable: EBIT Method: Panel EGLS (Cross-section weights) Date: 09/08/16 Time: 02:20 Sample: 2009 2013 Periods included: 5 Cross-sections included: 47 Total panel (balanced) observations: 235 Linear estimation after one-step weighting matrix
Variable Coefficient Std. Error t-Statistic Prob. C -191.5391 1252.653 -0.152907 0.8786
DUALITY 99.52487 172.1967 0.577972 0.5640 BCOMP 1218.851 1086.881 1.121421 0.2636 BSIZE 185.3257 63.86350 2.901904 0.0042 GOWN 191.0313 299.4472 0.637947 0.5243 FAGE -10.96093 14.41982 -0.760129 0.4482 FDR -1134.036 544.1643 -2.083996 0.0386
FGROW 146.3389 90.14396 1.623391 0.1063 FLIQ -0.219667 0.316715 -0.693579 0.4889
FRISK 68.18006 81.69903 0.834527 0.4051 FSIZE 45.75651 2.833539 16.14818 0.0000
Effects Specification Cross-section fixed (dummy variables) Weighted Statistics R-squared 0.978377 Mean dependent var 7354.071
Adjusted R-squared 0.971574 S.D. dependent var 11989.93 S.E. of regression 2219.596 Sum squared resid 8.77E+08 F-statistic 143.8197 Durbin-Watson stat 1.352966 Prob (F-statistic) 0.000000
Unweighted Statistics R-squared 0.851665 Mean dependent var 3722.706
Sum squared resid 3.27E+09 Durbin-Watson stat 1.071568
The equation for the panel data regression model is:
EBIT = -191.5391 + 99.52487 (DUALITY) + 1218.851 (BCOMP) + 185.3257 (BSIZE) + 191.0313 (GOWN) - 10.96093 (FAGE) - 1134.036 (FDR) + 146.3389 (FGROW) - 0.219667 (FLIQ) + 68.18006 (FRISK) + 45.75651 (FSIZE) + [CX=F] ……………………………………………………………………………………..….6.3.
The model depicted in the table above has an R2 value of 0.974269 with Prob (F-
statistic) of 0.000 which means the P-value is significant. Thus, the model was
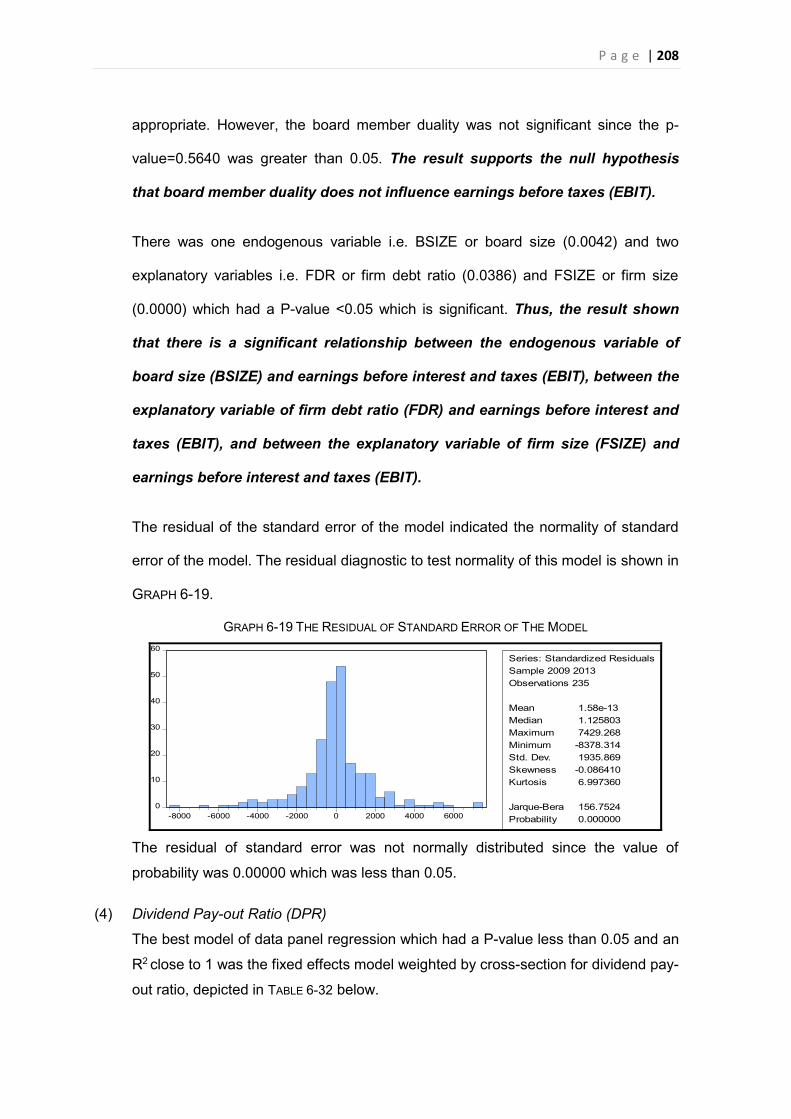
P a g e | 208
appropriate. However, the board member duality was not significant since the p-
value=0.5640 was greater than 0.05. The result supports the null hypothesis
that board member duality does not influence earnings before taxes (EBIT).
There was one endogenous variable i.e. BSIZE or board size (0.0042) and two
explanatory variables i.e. FDR or firm debt ratio (0.0386) and FSIZE or firm size
(0.0000) which had a P-value <0.05 which is significant. Thus, the result shown
that there is a significant relationship between the endogenous variable of
board size (BSIZE) and earnings before interest and taxes (EBIT), between the
explanatory variable of firm debt ratio (FDR) and earnings before interest and
taxes (EBIT), and between the explanatory variable of firm size (FSIZE) and
earnings before interest and taxes (EBIT).
The residual of the standard error of the model indicated the normality of standard
error of the model. The residual diagnostic to test normality of this model is shown in
GRAPH 6-19.
GRAPH 6-19 THE RESIDUAL OF STANDARD ERROR OF THE MODEL
0
10
20
30
40
50
60
-8000 -6000 -4000 -2000 0 2000 4000 6000
Series: Standardized ResidualsSample 2009 2013Observations 235
Mean 1.58e-13Median 1.125803Maximum 7429.268Minimum -8378.314Std. Dev. 1935.869Skewness -0.086410Kurtosis 6.997360
Jarque-Bera 156.7524Probability 0.000000
The residual of standard error was not normally distributed since the value of
probability was 0.00000 which was less than 0.05.
(4) Dividend Pay-out Ratio (DPR)
The best model of data panel regression which had a P-value less than 0.05 and an
R2 close to 1 was the fixed effects model weighted by cross-section for dividend pay-
out ratio, depicted in TABLE 6-32 below.
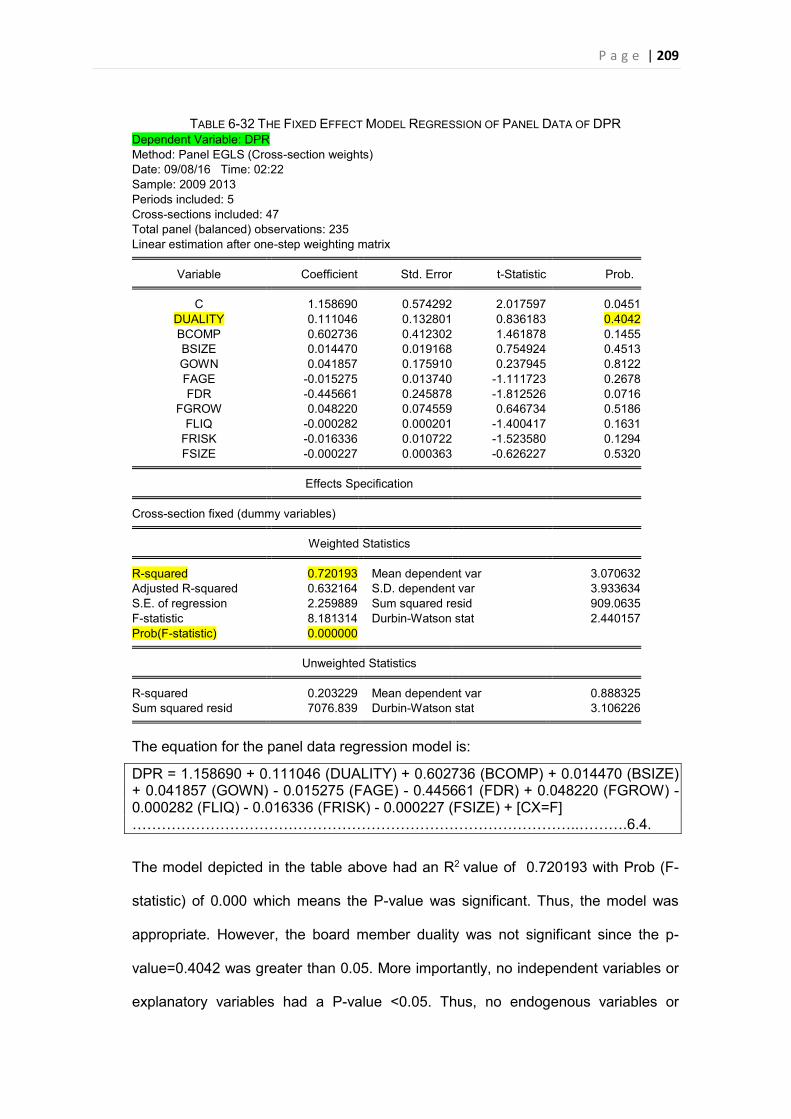
P a g e | 209
TABLE 6-32 THE FIXED EFFECT MODEL REGRESSION OF PANEL DATA OF DPR Dependent Variable: DPR Method: Panel EGLS (Cross-section weights) Date: 09/08/16 Time: 02:22 Sample: 2009 2013 Periods included: 5 Cross-sections included: 47 Total panel (balanced) observations: 235 Linear estimation after one-step weighting matrix
Variable Coefficient Std. Error t-Statistic Prob. C 1.158690 0.574292 2.017597 0.0451
DUALITY 0.111046 0.132801 0.836183 0.4042 BCOMP 0.602736 0.412302 1.461878 0.1455 BSIZE 0.014470 0.019168 0.754924 0.4513 GOWN 0.041857 0.175910 0.237945 0.8122 FAGE -0.015275 0.013740 -1.111723 0.2678 FDR -0.445661 0.245878 -1.812526 0.0716
FGROW 0.048220 0.074559 0.646734 0.5186 FLIQ -0.000282 0.000201 -1.400417 0.1631
FRISK -0.016336 0.010722 -1.523580 0.1294 FSIZE -0.000227 0.000363 -0.626227 0.5320
Effects Specification Cross-section fixed (dummy variables) Weighted Statistics R-squared 0.720193 Mean dependent var 3.070632
Adjusted R-squared 0.632164 S.D. dependent var 3.933634 S.E. of regression 2.259889 Sum squared resid 909.0635 F-statistic 8.181314 Durbin-Watson stat 2.440157 Prob(F-statistic) 0.000000
Unweighted Statistics R-squared 0.203229 Mean dependent var 0.888325
Sum squared resid 7076.839 Durbin-Watson stat 3.106226
The equation for the panel data regression model is:
DPR = 1.158690 + 0.111046 (DUALITY) + 0.602736 (BCOMP) + 0.014470 (BSIZE) + 0.041857 (GOWN) - 0.015275 (FAGE) - 0.445661 (FDR) + 0.048220 (FGROW) - 0.000282 (FLIQ) - 0.016336 (FRISK) - 0.000227 (FSIZE) + [CX=F] ………………………………………………………………………………..……….6.4.
The model depicted in the table above had an R2 value of 0.720193 with Prob (F-
statistic) of 0.000 which means the P-value was significant. Thus, the model was
appropriate. However, the board member duality was not significant since the p-
value=0.4042 was greater than 0.05. More importantly, no independent variables or
explanatory variables had a P-value <0.05. Thus, no endogenous variables or
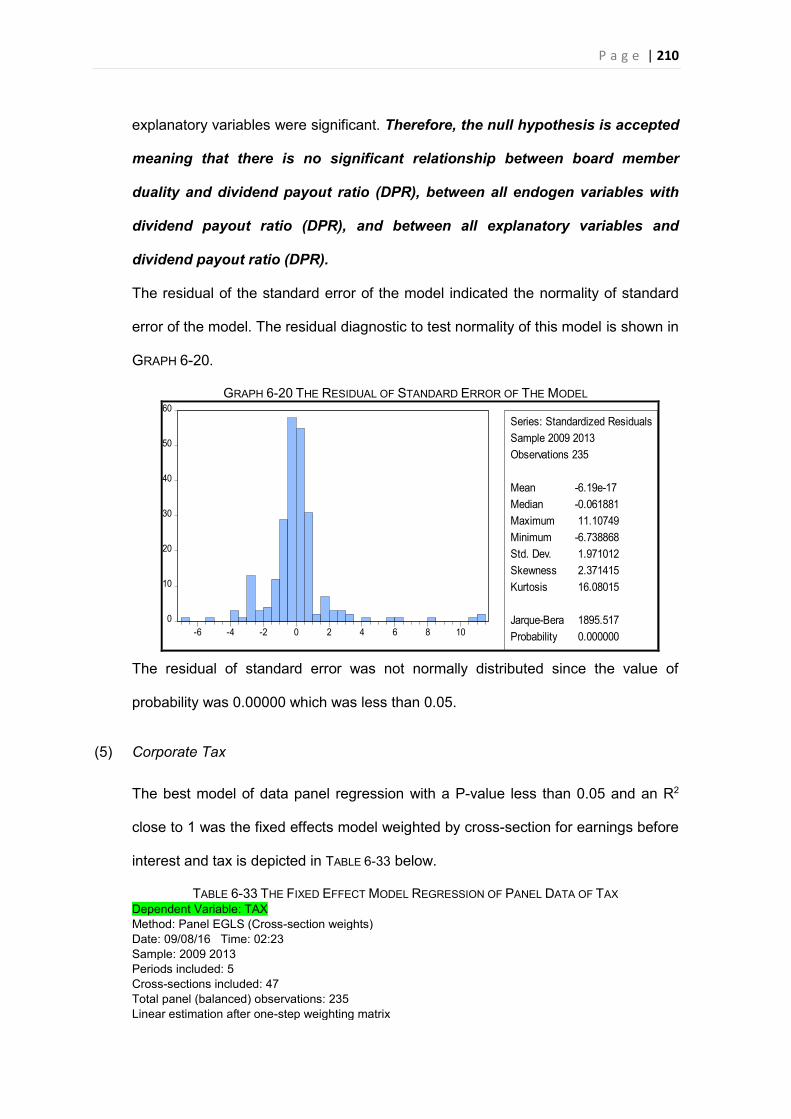
P a g e | 210
explanatory variables were significant. Therefore, the null hypothesis is accepted
meaning that there is no significant relationship between board member
duality and dividend payout ratio (DPR), between all endogen variables with
dividend payout ratio (DPR), and between all explanatory variables and
dividend payout ratio (DPR).
The residual of the standard error of the model indicated the normality of standard
error of the model. The residual diagnostic to test normality of this model is shown in
GRAPH 6-20.
GRAPH 6-20 THE RESIDUAL OF STANDARD ERROR OF THE MODEL
0
10
20
30
40
50
60
-6 -4 -2 0 2 4 6 8 10
Series: Standardized ResidualsSample 2009 2013Observations 235
Mean -6.19e-17Median -0.061881Maximum 11.10749Minimum -6.738868Std. Dev. 1.971012Skewness 2.371415Kurtosis 16.08015
Jarque-Bera 1895.517Probability 0.000000
The residual of standard error was not normally distributed since the value of
probability was 0.00000 which was less than 0.05.
(5) Corporate Tax
The best model of data panel regression with a P-value less than 0.05 and an R2
close to 1 was the fixed effects model weighted by cross-section for earnings before
interest and tax is depicted in TABLE 6-33 below.
TABLE 6-33 THE FIXED EFFECT MODEL REGRESSION OF PANEL DATA OF TAX Dependent Variable: TAX Method: Panel EGLS (Cross-section weights) Date: 09/08/16 Time: 02:23 Sample: 2009 2013 Periods included: 5 Cross-sections included: 47 Total panel (balanced) observations: 235 Linear estimation after one-step weighting matrix
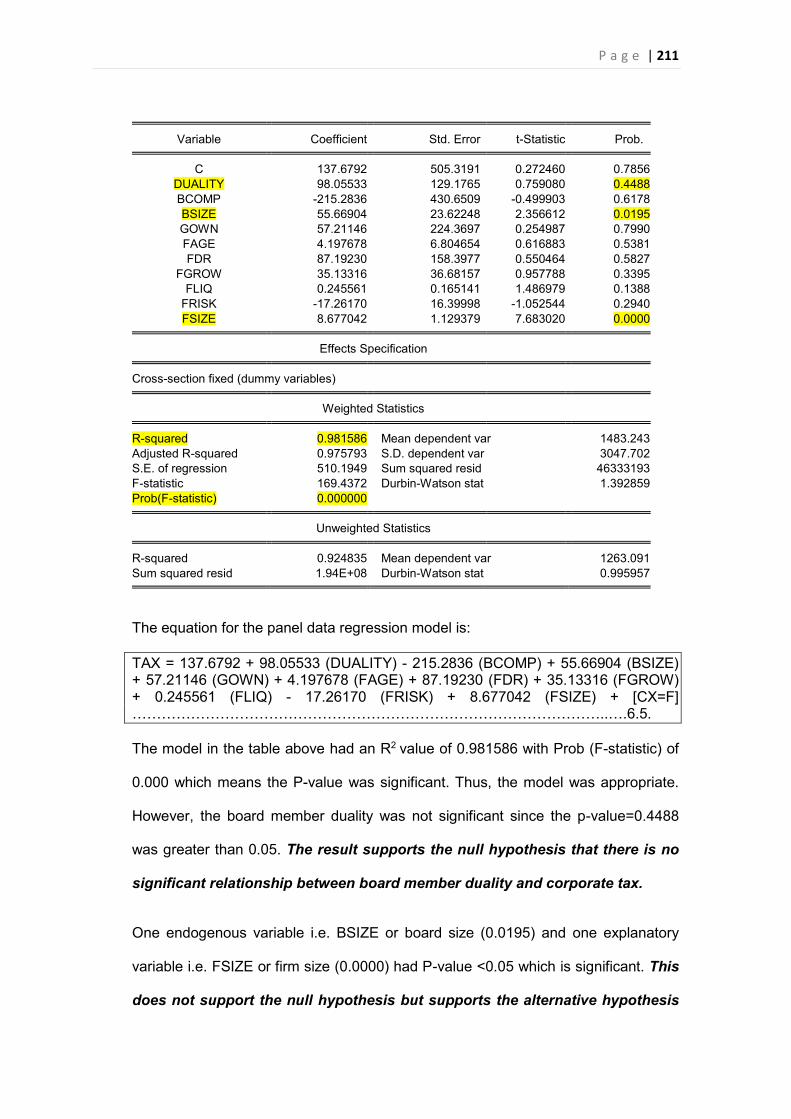
P a g e | 211
Variable Coefficient Std. Error t-Statistic Prob. C 137.6792 505.3191 0.272460 0.7856
DUALITY 98.05533 129.1765 0.759080 0.4488 BCOMP -215.2836 430.6509 -0.499903 0.6178 BSIZE 55.66904 23.62248 2.356612 0.0195 GOWN 57.21146 224.3697 0.254987 0.7990 FAGE 4.197678 6.804654 0.616883 0.5381 FDR 87.19230 158.3977 0.550464 0.5827
FGROW 35.13316 36.68157 0.957788 0.3395 FLIQ 0.245561 0.165141 1.486979 0.1388
FRISK -17.26170 16.39998 -1.052544 0.2940 FSIZE 8.677042 1.129379 7.683020 0.0000
Effects Specification Cross-section fixed (dummy variables) Weighted Statistics R-squared 0.981586 Mean dependent var 1483.243
Adjusted R-squared 0.975793 S.D. dependent var 3047.702 S.E. of regression 510.1949 Sum squared resid 46333193 F-statistic 169.4372 Durbin-Watson stat 1.392859 Prob(F-statistic) 0.000000
Unweighted Statistics R-squared 0.924835 Mean dependent var 1263.091
Sum squared resid 1.94E+08 Durbin-Watson stat 0.995957
The equation for the panel data regression model is:
TAX = 137.6792 + 98.05533 (DUALITY) - 215.2836 (BCOMP) + 55.66904 (BSIZE) + 57.21146 (GOWN) + 4.197678 (FAGE) + 87.19230 (FDR) + 35.13316 (FGROW) + 0.245561 (FLIQ) - 17.26170 (FRISK) + 8.677042 (FSIZE) + [CX=F] ……………………………………………………………………………………..….6.5.
The model in the table above had an R2 value of 0.981586 with Prob (F-statistic) of
0.000 which means the P-value was significant. Thus, the model was appropriate.
However, the board member duality was not significant since the p-value=0.4488
was greater than 0.05. The result supports the null hypothesis that there is no
significant relationship between board member duality and corporate tax.
One endogenous variable i.e. BSIZE or board size (0.0195) and one explanatory
variable i.e. FSIZE or firm size (0.0000) had P-value <0.05 which is significant. This
does not support the null hypothesis but supports the alternative hypothesis
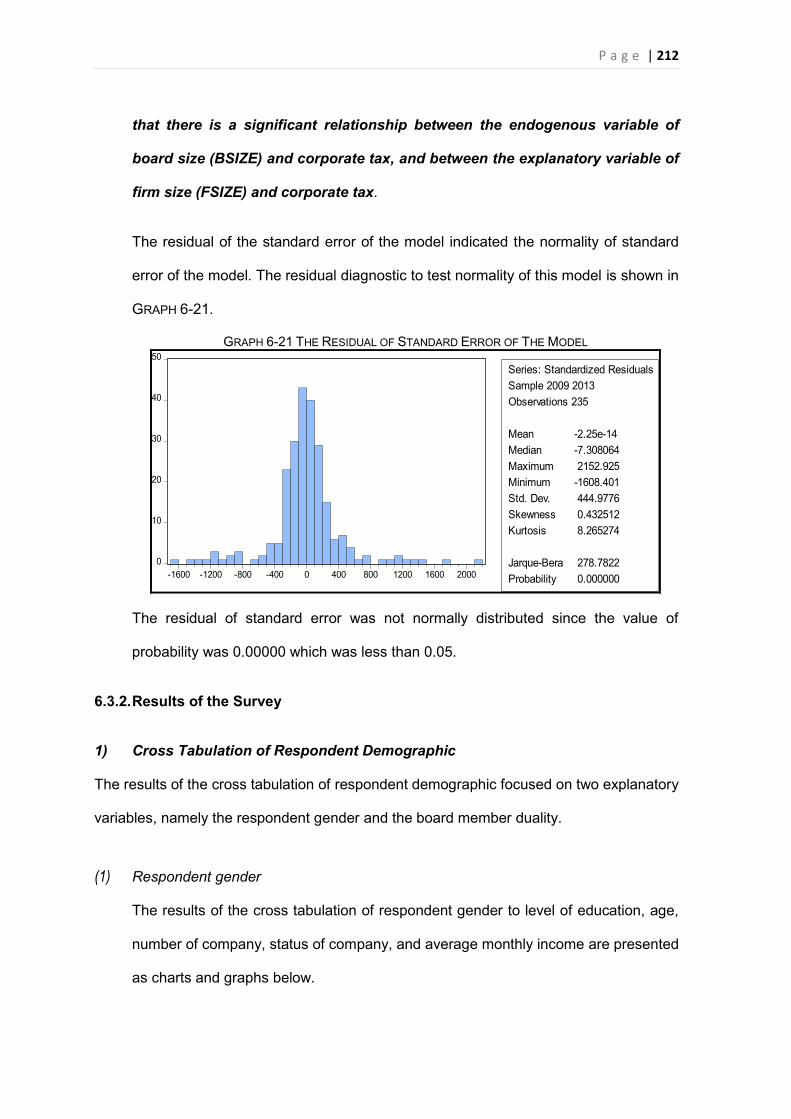
P a g e | 212
that there is a significant relationship between the endogenous variable of
board size (BSIZE) and corporate tax, and between the explanatory variable of
firm size (FSIZE) and corporate tax.
The residual of the standard error of the model indicated the normality of standard
error of the model. The residual diagnostic to test normality of this model is shown in
GRAPH 6-21.
GRAPH 6-21 THE RESIDUAL OF STANDARD ERROR OF THE MODEL
0
10
20
30
40
50
-1600 -1200 -800 -400 0 400 800 1200 1600 2000
Series: Standardized ResidualsSample 2009 2013Observations 235
Mean -2.25e-14Median -7.308064Maximum 2152.925Minimum -1608.401Std. Dev. 444.9776Skewness 0.432512Kurtosis 8.265274
Jarque-Bera 278.7822Probability 0.000000
The residual of standard error was not normally distributed since the value of
probability was 0.00000 which was less than 0.05.
6.3.2. Results of the Survey
1) Cross Tabulation of Respondent Demographic
The results of the cross tabulation of respondent demographic focused on two explanatory
variables, namely the respondent gender and the board member duality.
(1) Respondent gender
The results of the cross tabulation of respondent gender to level of education, age,
number of company, status of company, and average monthly income are presented
as charts and graphs below.
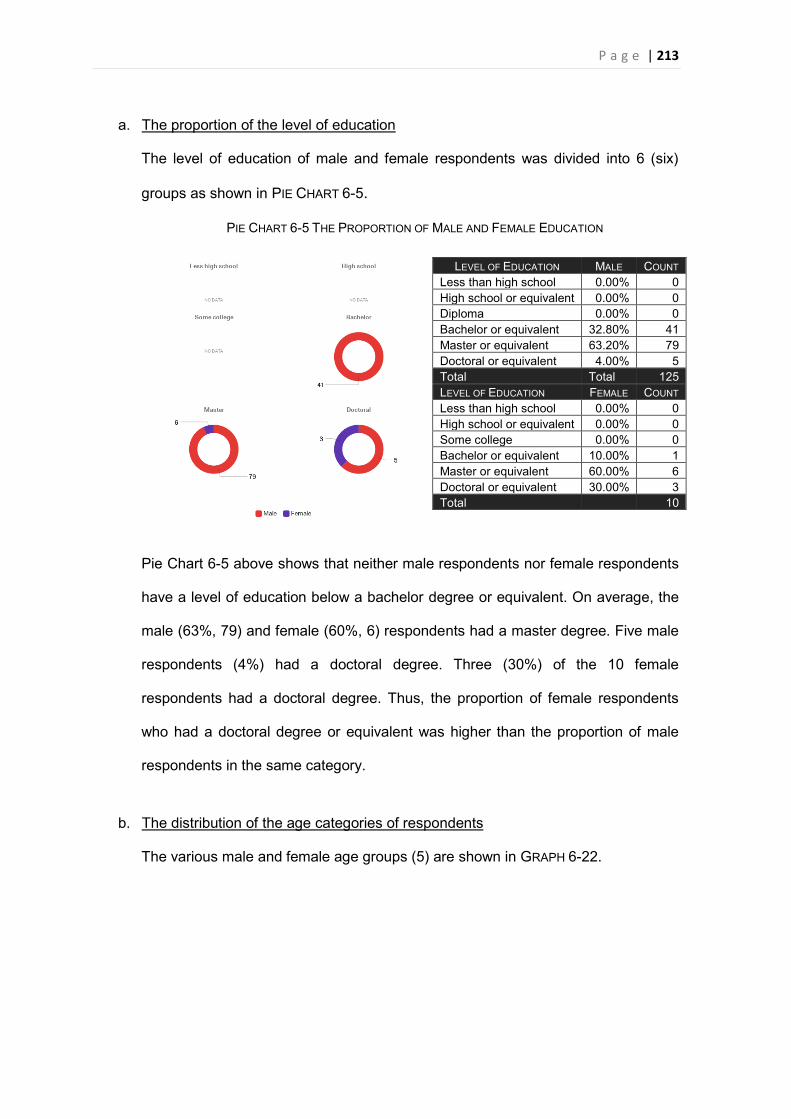
P a g e | 213
a. The proportion of the level of education
The level of education of male and female respondents was divided into 6 (six)
groups as shown in PIE CHART 6-5.
PIE CHART 6-5 THE PROPORTION OF MALE AND FEMALE EDUCATION
Pie Chart 6-5 above shows that neither male respondents nor female respondents
have a level of education below a bachelor degree or equivalent. On average, the
male (63%, 79) and female (60%, 6) respondents had a master degree. Five male
respondents (4%) had a doctoral degree. Three (30%) of the 10 female
respondents had a doctoral degree. Thus, the proportion of female respondents
who had a doctoral degree or equivalent was higher than the proportion of male
respondents in the same category.
b. The distribution of the age categories of respondents
The various male and female age groups (5) are shown in GRAPH 6-22.
LEVEL OF EDUCATION MALE COUNT Less than high school 0.00% 0 High school or equivalent 0.00% 0 Diploma 0.00% 0 Bachelor or equivalent 32.80% 41 Master or equivalent 63.20% 79 Doctoral or equivalent 4.00% 5 Total Total 125 LEVEL OF EDUCATION FEMALE COUNT Less than high school 0.00% 0 High school or equivalent 0.00% 0 Some college 0.00% 0 Bachelor or equivalent 10.00% 1 Master or equivalent 60.00% 6 Doctoral or equivalent 30.00% 3 Total 10
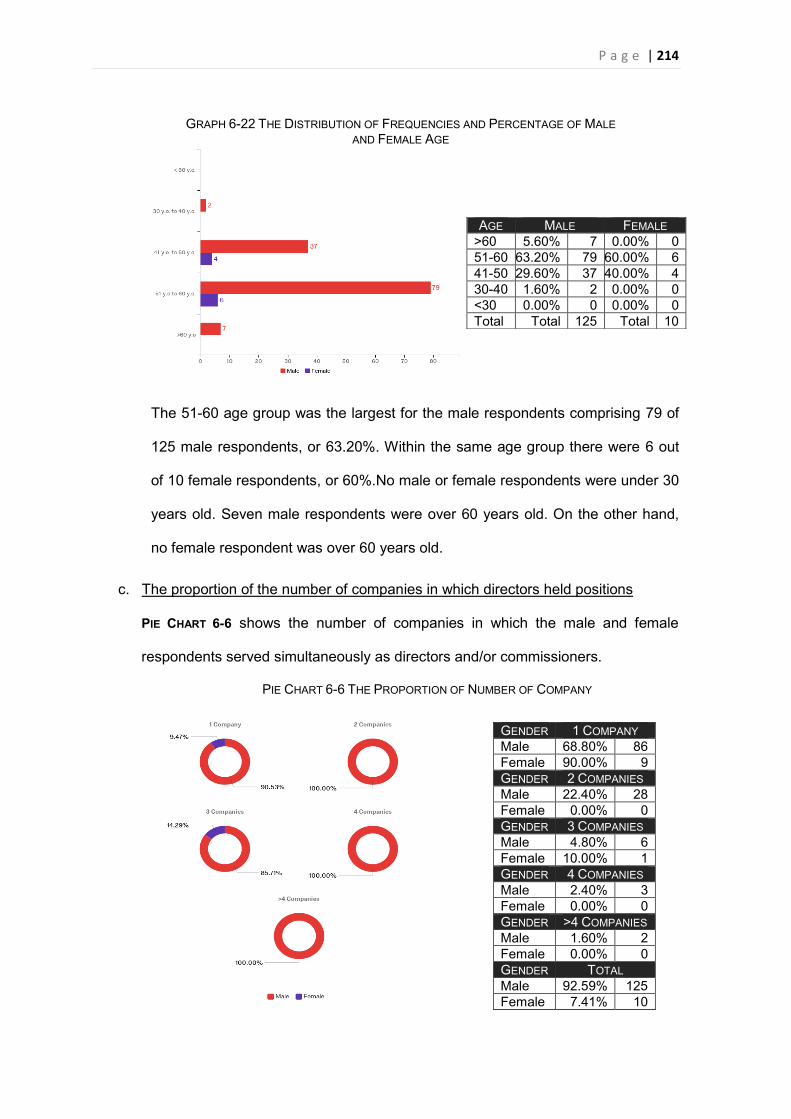
P a g e | 214
GRAPH 6-22 THE DISTRIBUTION OF FREQUENCIES AND PERCENTAGE OF MALE AND FEMALE AGE
The 51-60 age group was the largest for the male respondents comprising 79 of
125 male respondents, or 63.20%. Within the same age group there were 6 out
of 10 female respondents, or 60%.No male or female respondents were under 30
years old. Seven male respondents were over 60 years old. On the other hand,
no female respondent was over 60 years old.
c. The proportion of the number of companies in which directors held positions
PIE CHART 6-6 shows the number of companies in which the male and female
respondents served simultaneously as directors and/or commissioners.
PIE CHART 6-6 THE PROPORTION OF NUMBER OF COMPANY
AGE MALE FEMALE >60 5.60% 7 0.00% 0 51-60 63.20% 79 60.00% 6 41-50 29.60% 37 40.00% 4 30-40 1.60% 2 0.00% 0 <30 0.00% 0 0.00% 0 Total Total 125 Total 10
GENDER 1 COMPANY Male 68.80% 86 Female 90.00% 9 GENDER 2 COMPANIES Male 22.40% 28 Female 0.00% 0 GENDER 3 COMPANIES Male 4.80% 6 Female 10.00% 1 GENDER 4 COMPANIES Male 2.40% 3 Female 0.00% 0 GENDER >4 COMPANIES Male 1.60% 2 Female 0.00% 0 GENDER TOTAL Male 92.59% 125 Female 7.41% 10
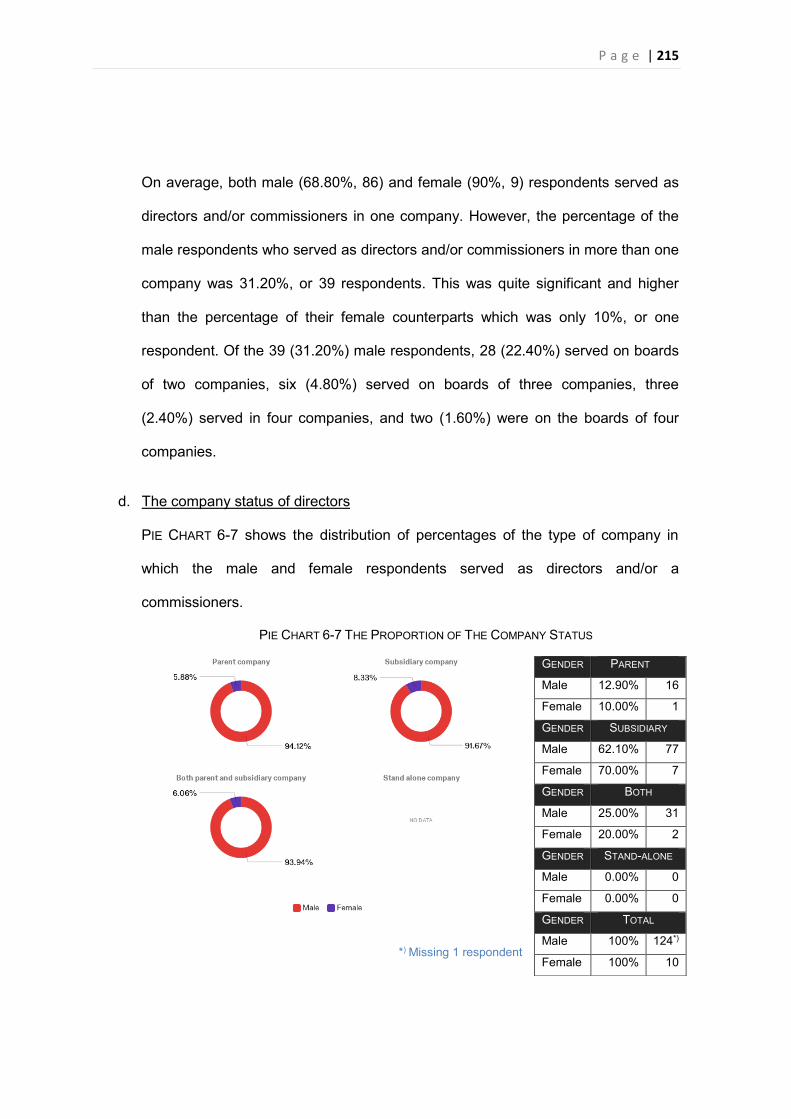
P a g e | 215
On average, both male (68.80%, 86) and female (90%, 9) respondents served as
directors and/or commissioners in one company. However, the percentage of the
male respondents who served as directors and/or commissioners in more than one
company was 31.20%, or 39 respondents. This was quite significant and higher
than the percentage of their female counterparts which was only 10%, or one
respondent. Of the 39 (31.20%) male respondents, 28 (22.40%) served on boards
of two companies, six (4.80%) served on boards of three companies, three
(2.40%) served in four companies, and two (1.60%) were on the boards of four
companies.
d. The company status of directors
PIE CHART 6-7 shows the distribution of percentages of the type of company in
which the male and female respondents served as directors and/or a
commissioners.
PIE CHART 6-7 THE PROPORTION OF THE COMPANY STATUS
*) Missing 1 respondent
GENDER PARENT
Male 12.90% 16
Female 10.00% 1
GENDER SUBSIDIARY
Male 62.10% 77
Female 70.00% 7
GENDER BOTH
Male 25.00% 31
Female 20.00% 2
GENDER STAND-ALONE
Male 0.00% 0
Female 0.00% 0
GENDER TOTAL
Male 100% 124*)
Female 100% 10
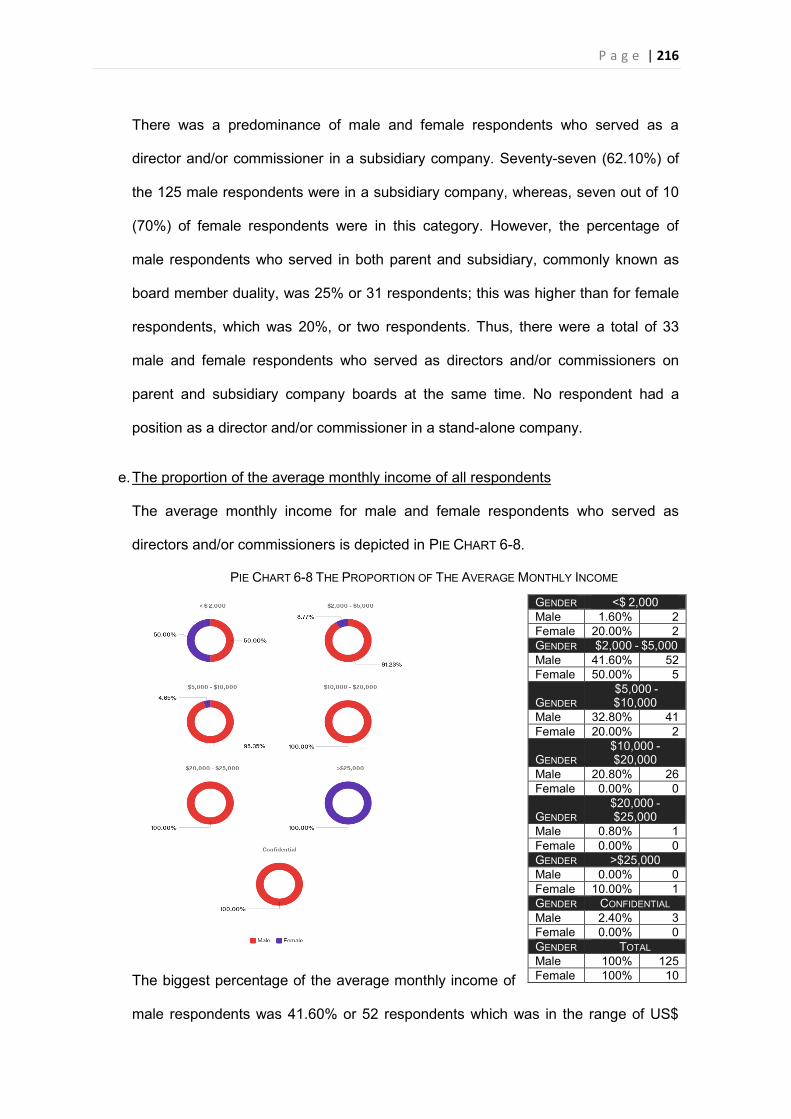
P a g e | 216
There was a predominance of male and female respondents who served as a
director and/or commissioner in a subsidiary company. Seventy-seven (62.10%) of
the 125 male respondents were in a subsidiary company, whereas, seven out of 10
(70%) of female respondents were in this category. However, the percentage of
male respondents who served in both parent and subsidiary, commonly known as
board member duality, was 25% or 31 respondents; this was higher than for female
respondents, which was 20%, or two respondents. Thus, there were a total of 33
male and female respondents who served as directors and/or commissioners on
parent and subsidiary company boards at the same time. No respondent had a
position as a director and/or commissioner in a stand-alone company.
e. The proportion of the average monthly income of all respondents
The average monthly income for male and female respondents who served as
directors and/or commissioners is depicted in PIE CHART 6-8.
PIE CHART 6-8 THE PROPORTION OF THE AVERAGE MONTHLY INCOME
The biggest percentage of the average monthly income of
male respondents was 41.60% or 52 respondents which was in the range of US$
GENDER <$ 2,000 Male 1.60% 2 Female 20.00% 2 GENDER $2,000 - $5,000 Male 41.60% 52 Female 50.00% 5
GENDER $5,000 - $10,000
Male 32.80% 41 Female 20.00% 2
GENDER $10,000 - $20,000
Male 20.80% 26 Female 0.00% 0
GENDER $20,000 - $25,000
Male 0.80% 1 Female 0.00% 0 GENDER >$25,000 Male 0.00% 0 Female 10.00% 1 GENDER CONFIDENTIAL Male 2.40% 3 Female 0.00% 0 GENDER TOTAL Male 100% 125 Female 100% 10
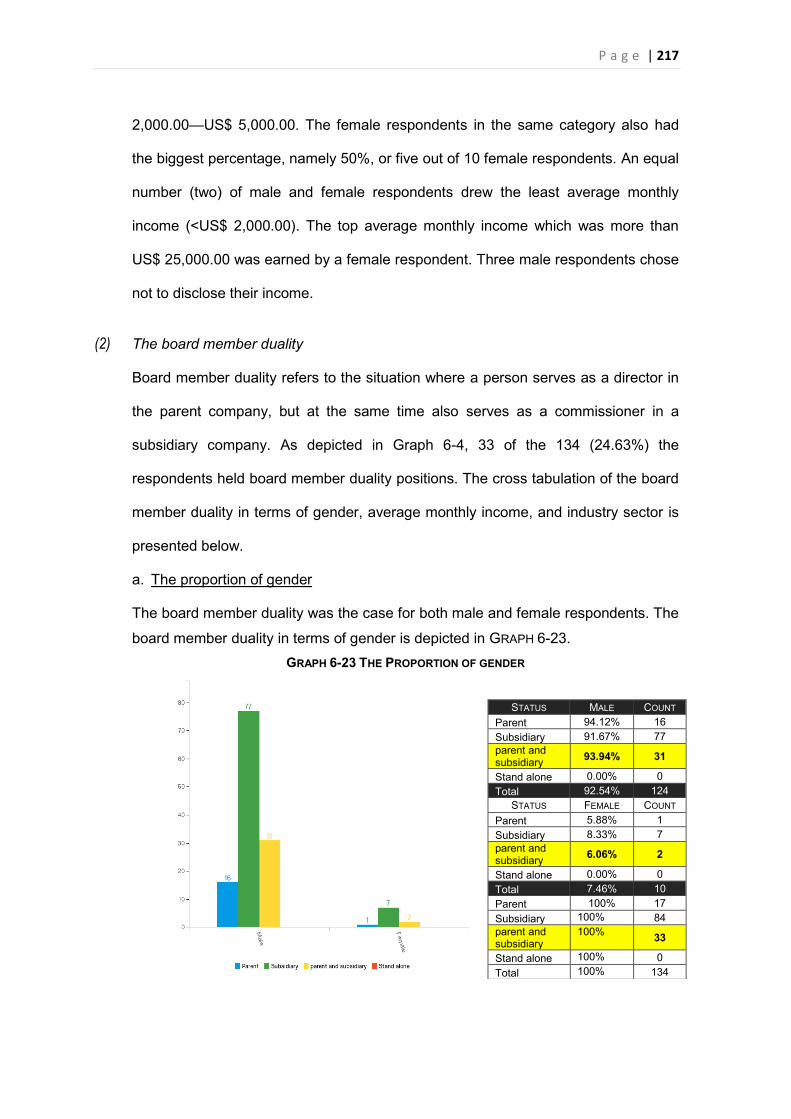
P a g e | 217
2,000.00—US$ 5,000.00. The female respondents in the same category also had
the biggest percentage, namely 50%, or five out of 10 female respondents. An equal
number (two) of male and female respondents drew the least average monthly
income (<US$ 2,000.00). The top average monthly income which was more than
US$ 25,000.00 was earned by a female respondent. Three male respondents chose
not to disclose their income.
(2) The board member duality
Board member duality refers to the situation where a person serves as a director in
the parent company, but at the same time also serves as a commissioner in a
subsidiary company. As depicted in Graph 6-4, 33 of the 134 (24.63%) the
respondents held board member duality positions. The cross tabulation of the board
member duality in terms of gender, average monthly income, and industry sector is
presented below.
a. The proportion of gender
The board member duality was the case for both male and female respondents. The
board member duality in terms of gender is depicted in GRAPH 6-23. GRAPH 6-23 THE PROPORTION OF GENDER
STATUS MALE COUNT Parent 94.12% 16 Subsidiary 91.67% 77 parent and subsidiary 93.94% 31
Stand alone 0.00% 0 Total 92.54% 124
STATUS FEMALE COUNT Parent 5.88% 1 Subsidiary 8.33% 7 parent and subsidiary 6.06% 2
Stand alone 0.00% 0 Total 7.46% 10 Parent 100% 17 Subsidiary 100% 84 parent and subsidiary
100% 33
Stand alone 100% 0 Total 100% 134
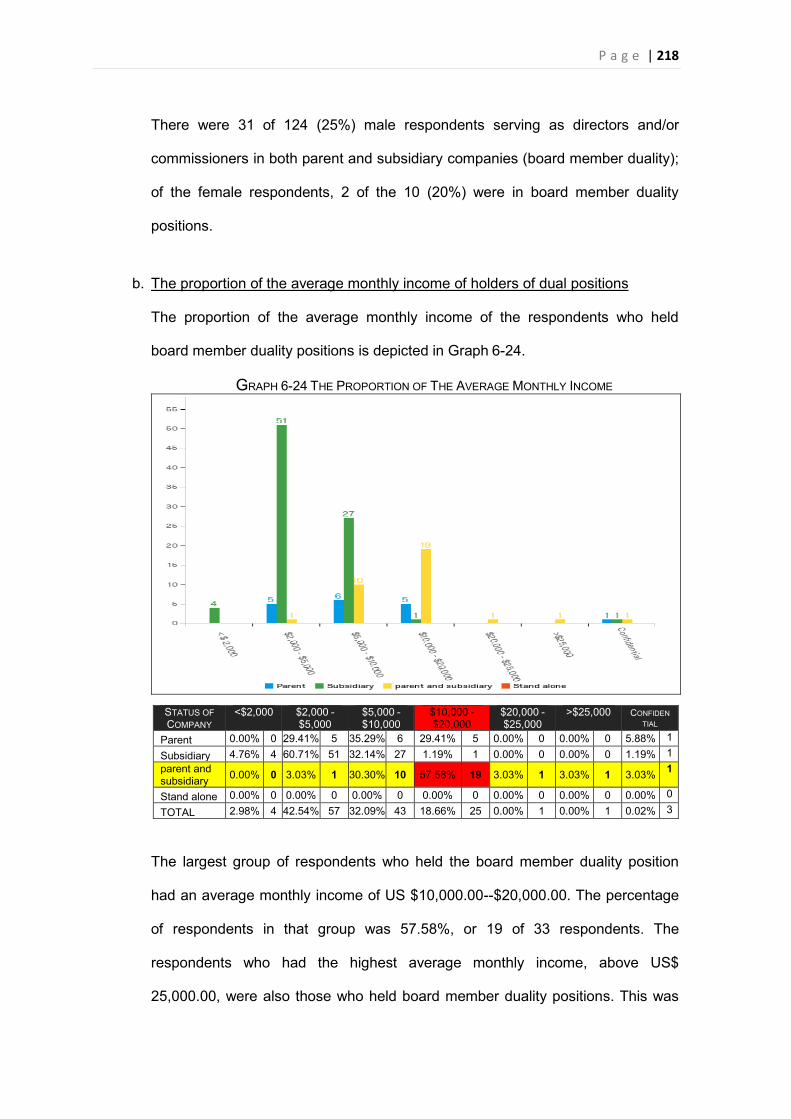
P a g e | 218
There were 31 of 124 (25%) male respondents serving as directors and/or
commissioners in both parent and subsidiary companies (board member duality);
of the female respondents, 2 of the 10 (20%) were in board member duality
positions.
b. The proportion of the average monthly income of holders of dual positions
The proportion of the average monthly income of the respondents who held
board member duality positions is depicted in Graph 6-24.
GRAPH 6-24 THE PROPORTION OF THE AVERAGE MONTHLY INCOME
The largest group of respondents who held the board member duality position
had an average monthly income of US $10,000.00--$20,000.00. The percentage
of respondents in that group was 57.58%, or 19 of 33 respondents. The
respondents who had the highest average monthly income, above US$
25,000.00, were also those who held board member duality positions. This was
STATUS OF COMPANY
<$2,000
$2,000 - $5,000
$5,000 - $10,000
$10,000 -$20,000
$20,000 - $25,000
>$25,000
CONFIDENTIAL
Parent 0.00% 0 29.41% 5 35.29% 6 29.41% 5 0.00% 0 0.00% 0 5.88% 1
Subsidiary 4.76% 4 60.71% 51 32.14% 27 1.19% 1 0.00% 0 0.00% 0 1.19% 1 parent and subsidiary 0.00% 0 3.03% 1 30.30% 10 57.58% 19 3.03% 1 3.03% 1 3.03% 1
Stand alone 0.00% 0 0.00% 0 0.00% 0 0.00% 0 0.00% 0 0.00% 0 0.00% 0
TOTAL 2.98% 4 42.54% 57 32.09% 43 18.66% 25 0.00% 1 0.00% 1 0.02% 3
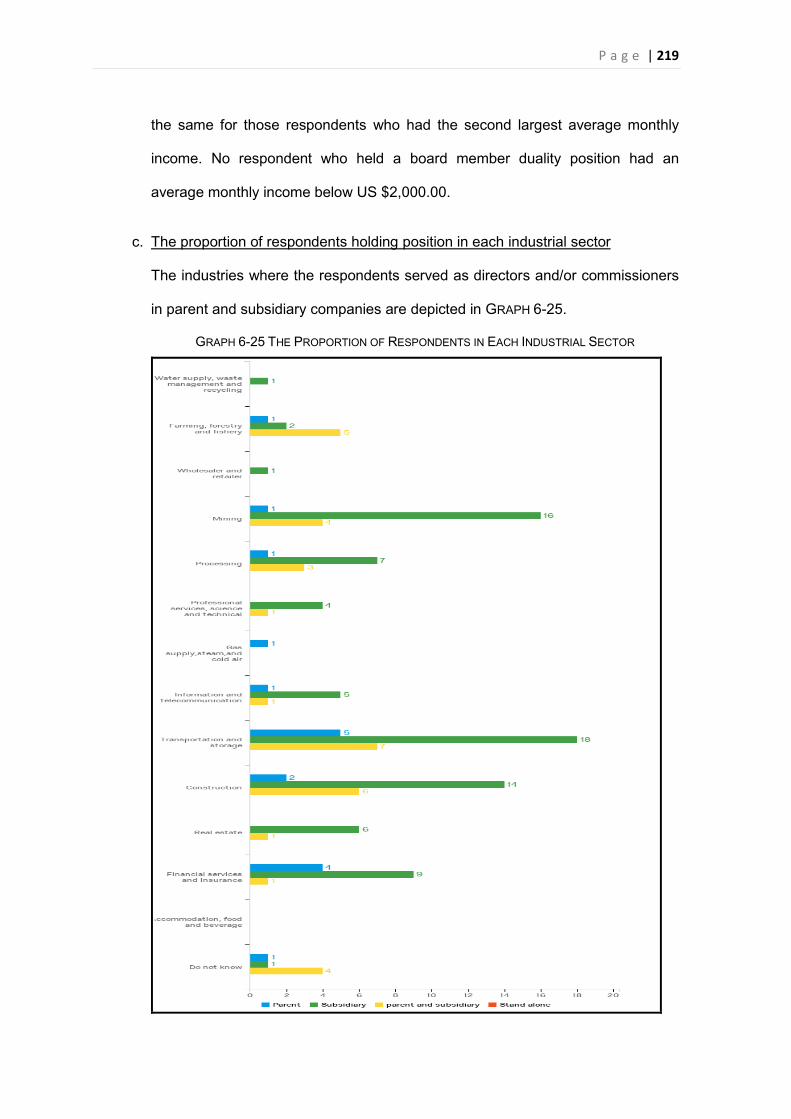
P a g e | 219
the same for those respondents who had the second largest average monthly
income. No respondent who held a board member duality position had an
average monthly income below US $2,000.00.
c. The proportion of respondents holding position in each industrial sector
The industries where the respondents served as directors and/or commissioners
in parent and subsidiary companies are depicted in GRAPH 6-25.
GRAPH 6-25 THE PROPORTION OF RESPONDENTS IN EACH INDUSTRIAL SECTOR
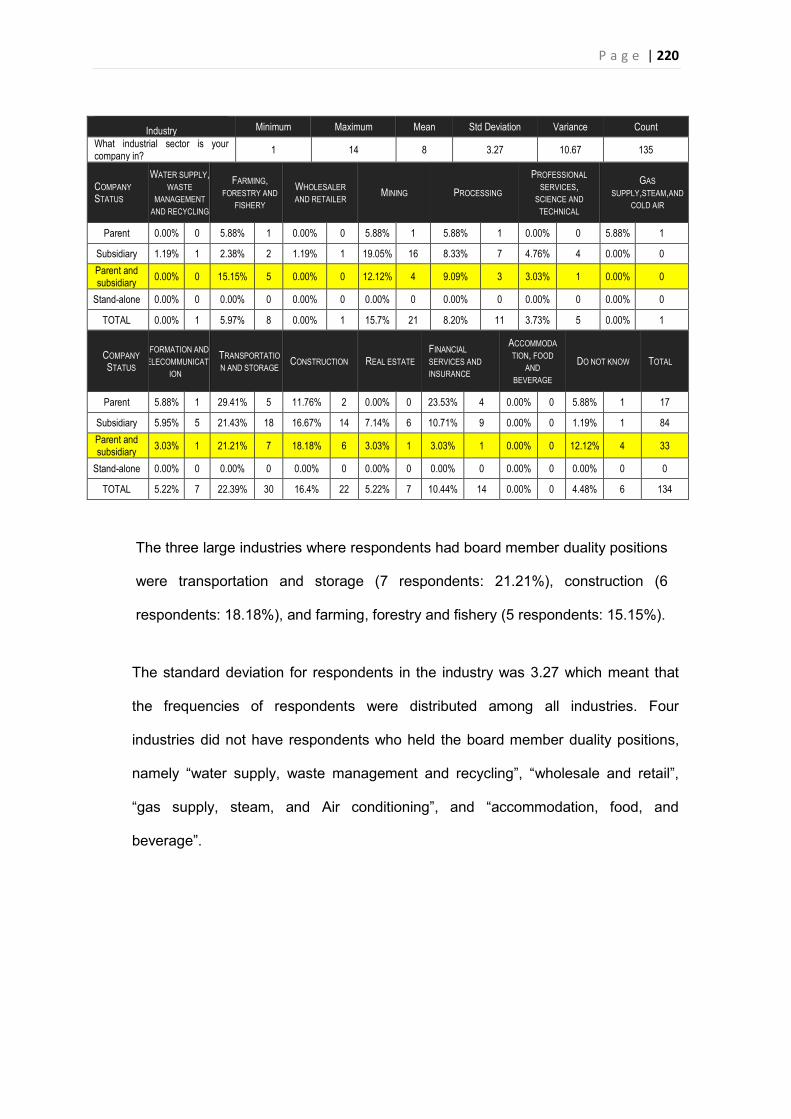
P a g e | 220
Industry Minimum Maximum Mean Std Deviation Variance Count What industrial sector is your company in? 1 14 8 3.27 10.67 135
COMPANY STATUS
WATER SUPPLY, WASTE
MANAGEMENT AND RECYCLING
FARMING, FORESTRY AND
FISHERY WHOLESALER AND RETAILER MINING PROCESSING
PROFESSIONAL SERVICES,
SCIENCE AND TECHNICAL
GAS SUPPLY,STEAM,AND
COLD AIR
Parent 0.00% 0 5.88% 1 0.00% 0 5.88% 1 5.88% 1 0.00% 0 5.88% 1
Subsidiary 1.19% 1 2.38% 2 1.19% 1 19.05% 16 8.33% 7 4.76% 4 0.00% 0 Parent and subsidiary 0.00% 0 15.15% 5 0.00% 0 12.12% 4 9.09% 3 3.03% 1 0.00% 0
Stand-alone 0.00% 0 0.00% 0 0.00% 0 0.00% 0 0.00% 0 0.00% 0 0.00% 0
TOTAL 0.00% 1 5.97% 8 0.00% 1 15.7% 21 8.20% 11 3.73% 5 0.00% 1
COMPANY STATUS
INFORMATION AND TELECOMMUNICAT
ION TRANSPORTATION AND STORAGE CONSTRUCTION REAL ESTATE
FINANCIAL SERVICES AND INSURANCE
ACCOMMODATION, FOOD
AND BEVERAGE
DO NOT KNOW TOTAL
Parent 5.88% 1 29.41% 5 11.76% 2 0.00% 0 23.53% 4 0.00% 0 5.88% 1 17
Subsidiary 5.95% 5 21.43% 18 16.67% 14 7.14% 6 10.71% 9 0.00% 0 1.19% 1 84 Parent and subsidiary 3.03% 1 21.21% 7 18.18% 6 3.03% 1 3.03% 1 0.00% 0 12.12% 4 33
Stand-alone 0.00% 0 0.00% 0 0.00% 0 0.00% 0 0.00% 0 0.00% 0 0.00% 0 0
TOTAL 5.22% 7 22.39% 30 16.4% 22 5.22% 7 10.44% 14 0.00% 0 4.48% 6 134
The three large industries where respondents had board member duality positions
were transportation and storage (7 respondents: 21.21%), construction (6
respondents: 18.18%), and farming, forestry and fishery (5 respondents: 15.15%).
The standard deviation for respondents in the industry was 3.27 which meant that
the frequencies of respondents were distributed among all industries. Four
industries did not have respondents who held the board member duality positions,
namely “water supply, waste management and recycling”, “wholesale and retail”,
“gas supply, steam, and Air conditioning”, and “accommodation, food, and
beverage”.
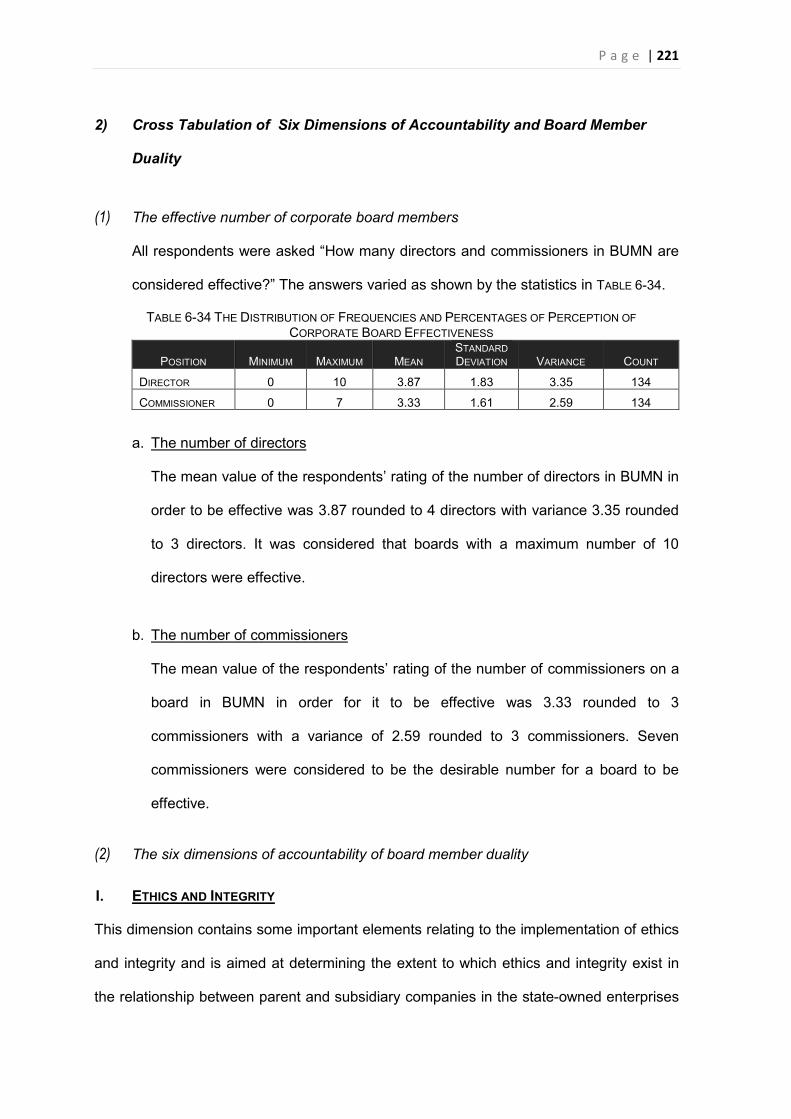
P a g e | 221
2) Cross Tabulation of Six Dimensions of Accountability and Board Member
Duality
(1) The effective number of corporate board members
All respondents were asked “How many directors and commissioners in BUMN are
considered effective?” The answers varied as shown by the statistics in TABLE 6-34.
TABLE 6-34 THE DISTRIBUTION OF FREQUENCIES AND PERCENTAGES OF PERCEPTION OF CORPORATE BOARD EFFECTIVENESS
POSITION MINIMUM MAXIMUM MEAN STANDARD DEVIATION VARIANCE COUNT
DIRECTOR 0 10 3.87 1.83 3.35 134
COMMISSIONER 0 7 3.33 1.61 2.59 134
a. The number of directors
The mean value of the respondents’ rating of the number of directors in BUMN in
order to be effective was 3.87 rounded to 4 directors with variance 3.35 rounded
to 3 directors. It was considered that boards with a maximum number of 10
directors were effective.
b. The number of commissioners
The mean value of the respondents’ rating of the number of commissioners on a
board in BUMN in order for it to be effective was 3.33 rounded to 3
commissioners with a variance of 2.59 rounded to 3 commissioners. Seven
commissioners were considered to be the desirable number for a board to be
effective.
(2) The six dimensions of accountability of board member duality
I. ETHICS AND INTEGRITY
This dimension contains some important elements relating to the implementation of ethics
and integrity and is aimed at determining the extent to which ethics and integrity exist in
the relationship between parent and subsidiary companies in the state-owned enterprises
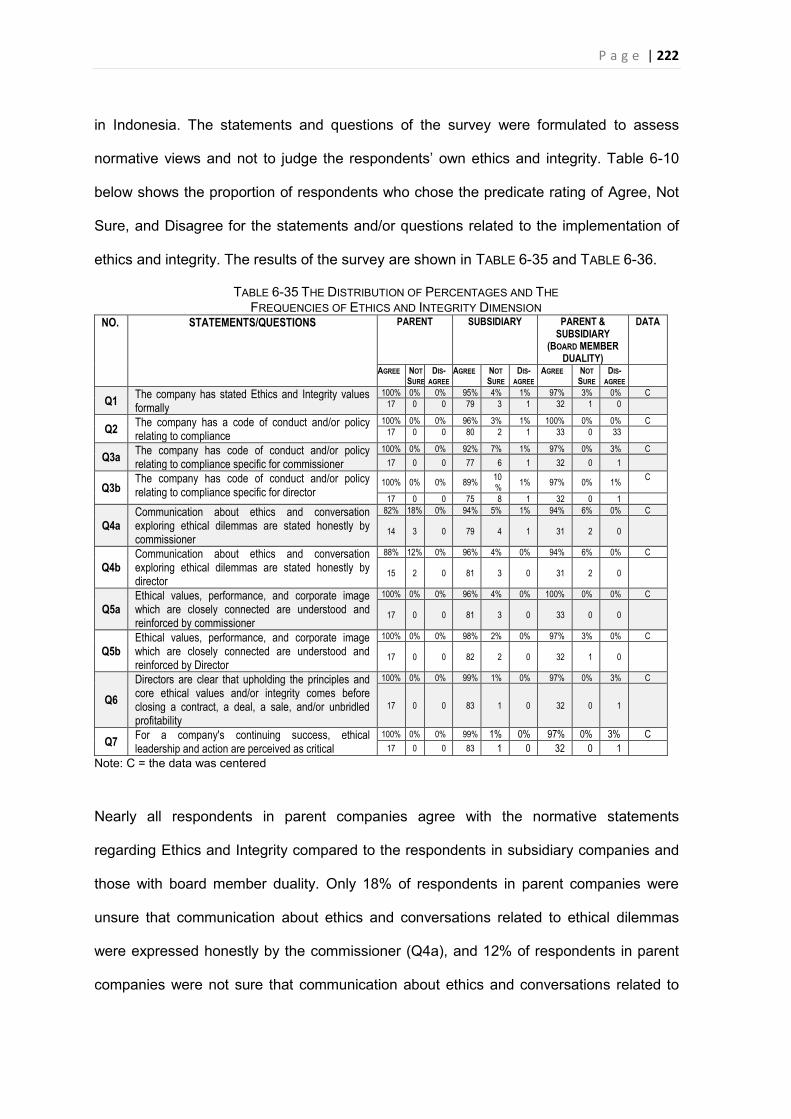
P a g e | 222
in Indonesia. The statements and questions of the survey were formulated to assess
normative views and not to judge the respondents’ own ethics and integrity. Table 6-10
below shows the proportion of respondents who chose the predicate rating of Agree, Not
Sure, and Disagree for the statements and/or questions related to the implementation of
ethics and integrity. The results of the survey are shown in TABLE 6-35 and TABLE 6-36.
TABLE 6-35 THE DISTRIBUTION OF PERCENTAGES AND THE FREQUENCIES OF ETHICS AND INTEGRITY DIMENSION
NO. STATEMENTS/QUESTIONS PARENT SUBSIDIARY PARENT & SUBSIDIARY
(BOARD MEMBER DUALITY)
DATA
AGREE NOT SURE
DIS-AGREE
AGREE NOT SURE
DIS-AGREE
AGREE NOT SURE
DIS-AGREE
Q1 The company has stated Ethics and Integrity values formally
100% 0% 0% 95% 4% 1% 97% 3% 0% C 17 0 0 79 3 1 32 1 0
Q2 The company has a code of conduct and/or policy relating to compliance
100% 0% 0% 96% 3% 1% 100% 0% 0% C 17 0 0 80 2 1 33 0 33
Q3a The company has code of conduct and/or policy relating to compliance specific for commissioner
100% 0% 0% 92% 7% 1% 97% 0% 3% C 17 0 0 77 6 1 32 0 1
Q3b The company has code of conduct and/or policy relating to compliance specific for director
100% 0% 0% 89% 10% 1% 97% 0% 1% C
17 0 0 75 8 1 32 0 1
Q4a Communication about ethics and conversation exploring ethical dilemmas are stated honestly by commissioner
82% 18% 0% 94% 5% 1% 94% 6% 0% C
14 3 0 79 4 1 31 2 0
Q4b Communication about ethics and conversation exploring ethical dilemmas are stated honestly by director
88% 12% 0% 96% 4% 0% 94% 6% 0% C
15 2 0 81 3 0 31 2 0
Q5a Ethical values, performance, and corporate image which are closely connected are understood and reinforced by commissioner
100% 0% 0% 96% 4% 0% 100% 0% 0% C
17 0 0 81 3 0 33 0 0
Q5b Ethical values, performance, and corporate image which are closely connected are understood and reinforced by Director
100% 0% 0% 98% 2% 0% 97% 3% 0% C
17 0 0 82 2 0 32 1 0
Q6 Directors are clear that upholding the principles and core ethical values and/or integrity comes before closing a contract, a deal, a sale, and/or unbridled profitability
100% 0% 0% 99% 1% 0% 97% 0% 3% C
17 0 0 83 1 0 32 0 1
Q7 For a company's continuing success, ethical leadership and action are perceived as critical
100% 0% 0% 99% 1% 0% 97% 0% 3% C 17 0 0 83 1 0 32 0 1
Note: C = the data was centered
Nearly all respondents in parent companies agree with the normative statements
regarding Ethics and Integrity compared to the respondents in subsidiary companies and
those with board member duality. Only 18% of respondents in parent companies were
unsure that communication about ethics and conversations related to ethical dilemmas
were expressed honestly by the commissioner (Q4a), and 12% of respondents in parent
companies were not sure that communication about ethics and conversations related to
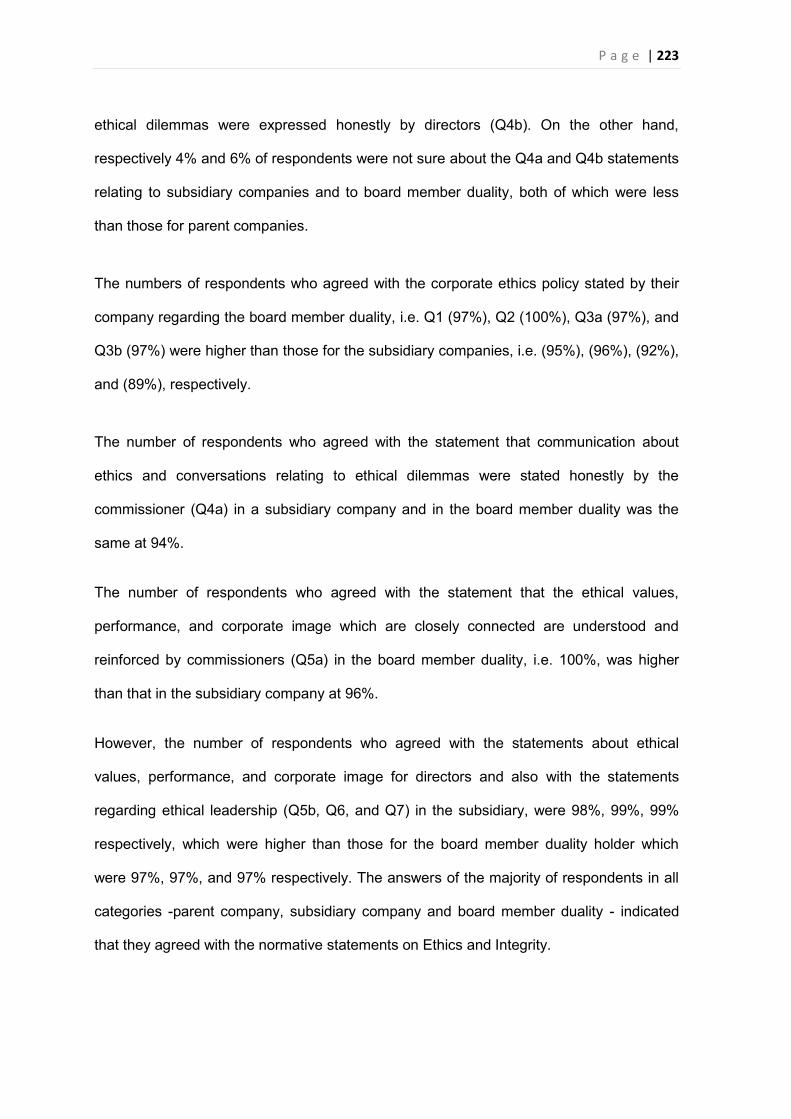
P a g e | 223
ethical dilemmas were expressed honestly by directors (Q4b). On the other hand,
respectively 4% and 6% of respondents were not sure about the Q4a and Q4b statements
relating to subsidiary companies and to board member duality, both of which were less
than those for parent companies.
The numbers of respondents who agreed with the corporate ethics policy stated by their
company regarding the board member duality, i.e. Q1 (97%), Q2 (100%), Q3a (97%), and
Q3b (97%) were higher than those for the subsidiary companies, i.e. (95%), (96%), (92%),
and (89%), respectively.
The number of respondents who agreed with the statement that communication about
ethics and conversations relating to ethical dilemmas were stated honestly by the
commissioner (Q4a) in a subsidiary company and in the board member duality was the
same at 94%.
The number of respondents who agreed with the statement that the ethical values,
performance, and corporate image which are closely connected are understood and
reinforced by commissioners (Q5a) in the board member duality, i.e. 100%, was higher
than that in the subsidiary company at 96%.
However, the number of respondents who agreed with the statements about ethical
values, performance, and corporate image for directors and also with the statements
regarding ethical leadership (Q5b, Q6, and Q7) in the subsidiary, were 98%, 99%, 99%
respectively, which were higher than those for the board member duality holder which
were 97%, 97%, and 97% respectively. The answers of the majority of respondents in all
categories -parent company, subsidiary company and board member duality - indicated
that they agreed with the normative statements on Ethics and Integrity.
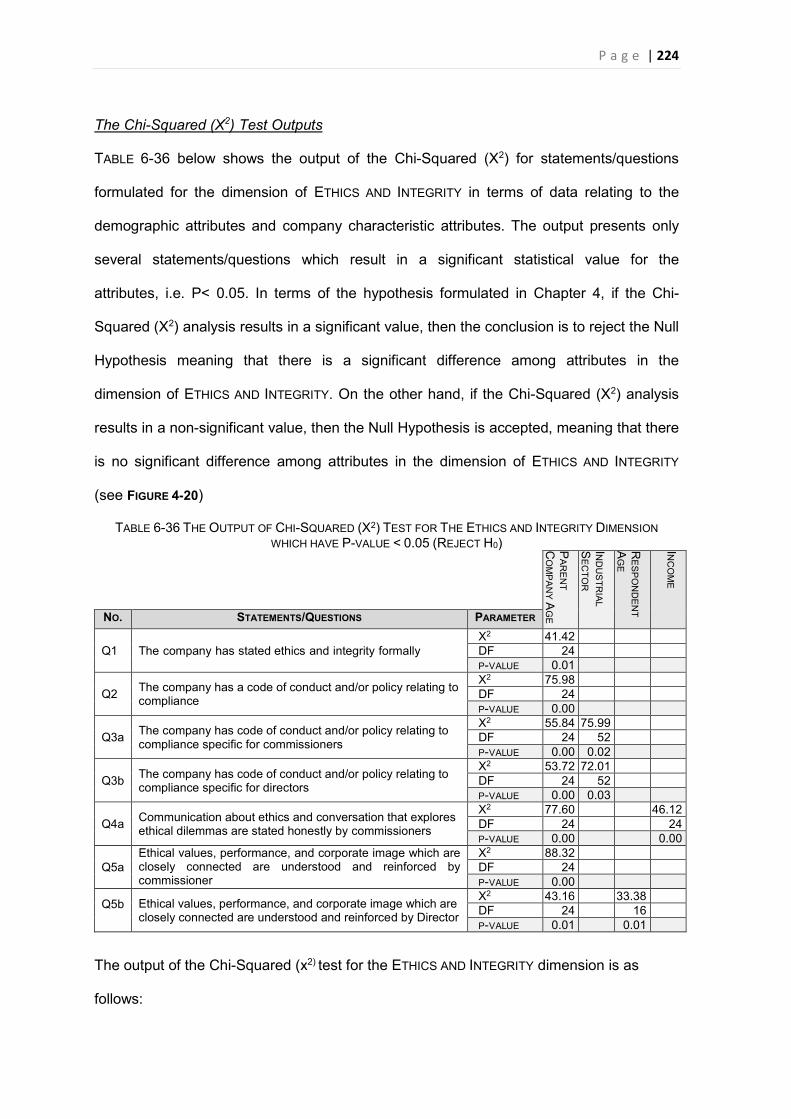
P a g e | 224
The Chi-Squared (X2) Test Outputs
TABLE 6-36 below shows the output of the Chi-Squared (X2) for statements/questions
formulated for the dimension of ETHICS AND INTEGRITY in terms of data relating to the
demographic attributes and company characteristic attributes. The output presents only
several statements/questions which result in a significant statistical value for the
attributes, i.e. P< 0.05. In terms of the hypothesis formulated in Chapter 4, if the Chi-
Squared (X2) analysis results in a significant value, then the conclusion is to reject the Null
Hypothesis meaning that there is a significant difference among attributes in the
dimension of ETHICS AND INTEGRITY. On the other hand, if the Chi-Squared (X2) analysis
results in a non-significant value, then the Null Hypothesis is accepted, meaning that there
is no significant difference among attributes in the dimension of ETHICS AND INTEGRITY
(see FIGURE 4-20)
TABLE 6-36 THE OUTPUT OF CHI-SQUARED (X2) TEST FOR THE ETHICS AND INTEGRITY DIMENSION WHICH HAVE P-VALUE < 0.05 (REJECT H0)
PA
RE
NT
CO
MP
AN
Y A
GE
IND
US
TRIA
L S
EC
TOR
RE
SP
ON
DE
NT
AG
E
INC
OM
E
NO. STATEMENTS/QUESTIONS PARAMETER
Q1 The company has stated ethics and integrity formally X2 41.42 DF 24 P-VALUE 0.01
Q2 The company has a code of conduct and/or policy relating to compliance
X2 75.98 DF 24 P-VALUE 0.00
Q3a The company has code of conduct and/or policy relating to compliance specific for commissioners
X2 55.84 75.99 DF 24 52 P-VALUE 0.00 0.02
Q3b The company has code of conduct and/or policy relating to compliance specific for directors
X2 53.72 72.01 DF 24 52 P-VALUE 0.00 0.03
Q4a Communication about ethics and conversation that explores ethical dilemmas are stated honestly by commissioners
X2 77.60 46.12 DF 24 24 P-VALUE 0.00 0.00
Q5a Ethical values, performance, and corporate image which are closely connected are understood and reinforced by commissioner
X2 88.32 DF 24 P-VALUE 0.00
Q5b Ethical values, performance, and corporate image which are closely connected are understood and reinforced by Director
X2 43.16 33.38 DF 24 16 P-VALUE 0.01 0.01
The output of the Chi-Squared (x2) test for the ETHICS AND INTEGRITY dimension is as
follows:
P a g e | 225
1. Participants’ responses to ETHICS AND INTEGRITY statements were not influenced by
the attributes of “gender, education, and number of companies to serve”. The
“company status” characteristic also produced the same result (TABLE 6-36)
2. There were P-values < 0.05 for the statements/questions in the ETHICS AND
INTEGRITY dimension which were tested in relation to the demographic attributes of
respondent age and income, and to the company characteristic attributes of parent
company age, and industrial sector. This means that the results did not support the
Null Hypothesis, or in other words, the results support the Alternative Hypothesis
that there is a significant difference between the demographic attributes of “age and
income” and “ETHICS AND INTEGRITY”. The same result regarding the company
characteristic attributes also occurred for “the parent company age and industrial
sector” in the dimension of ETHICS AND INTEGRITY. The details of the result of the
demographic attributes and company characteristic attributes are presented below.
a. Ages of Respondents
In the ETHICS AND INTEGRITY DIMENSION, Q5b had a P-value of 0.01 with a
degree of freedom of 16 when cross-tabulated with the ages of respondents,
as shown in TABLE 6-36 above.
b. Income
Q4a in the ETHICS AND INTEGRITY dimension had P-value = 0.00 with a degree
of freedom of 24 when cross-tabulated with the average monthly income of
respondents, as shown in TABLE 6-36 above.
c. Parent Company Age
Seven statements/questions in the ETHICS AND INTEGRITY DIMENSION, i.e. Q1,
Q2, Q3a, Q3b, Q4a, Q5a and Q5b, had P-value < 0.05, i.e. 0.01, 0.00, 0.00,
0.00, 0.00, 0.00, 0.01 respectively, when cross-tabulated with the parent
company age, as shown in TABLE 6-36 above. All statements/questions related
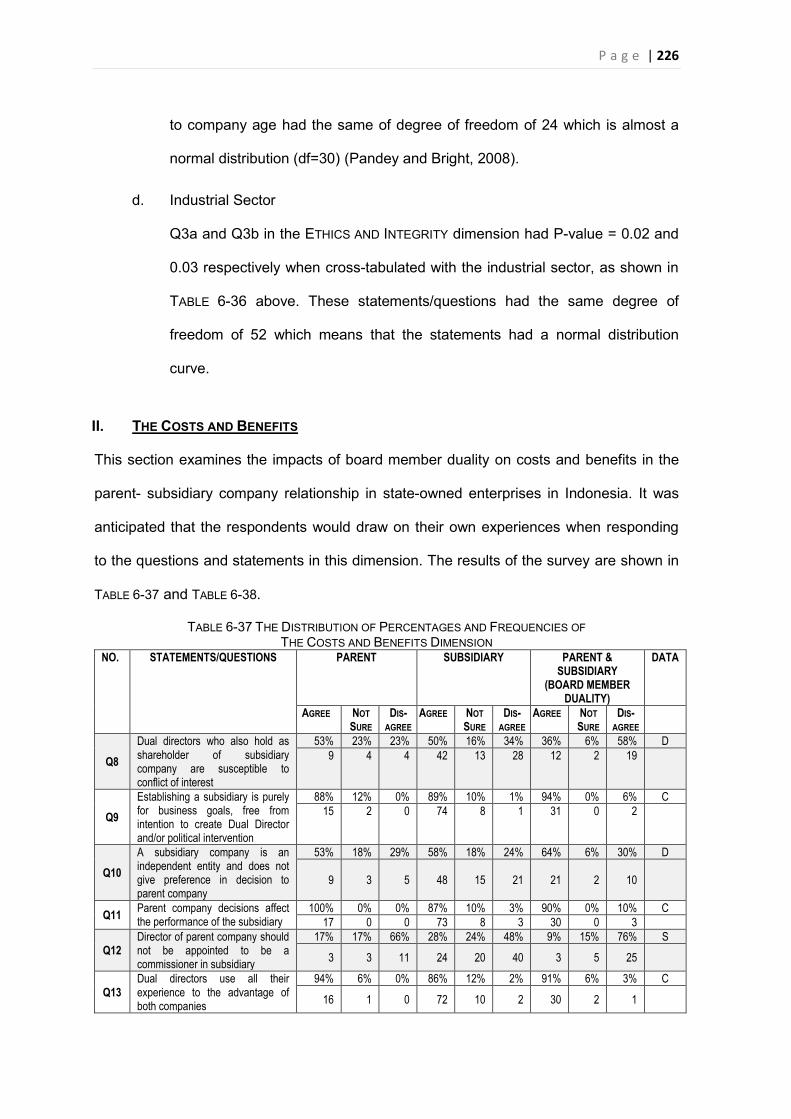
P a g e | 226
to company age had the same of degree of freedom of 24 which is almost a
normal distribution (df=30) (Pandey and Bright, 2008).
d. Industrial Sector
Q3a and Q3b in the ETHICS AND INTEGRITY dimension had P-value = 0.02 and
0.03 respectively when cross-tabulated with the industrial sector, as shown in
TABLE 6-36 above. These statements/questions had the same degree of
freedom of 52 which means that the statements had a normal distribution
curve.
II. THE COSTS AND BENEFITS
This section examines the impacts of board member duality on costs and benefits in the
parent- subsidiary company relationship in state-owned enterprises in Indonesia. It was
anticipated that the respondents would draw on their own experiences when responding
to the questions and statements in this dimension. The results of the survey are shown in
TABLE 6-37 and TABLE 6-38.
TABLE 6-37 THE DISTRIBUTION OF PERCENTAGES AND FREQUENCIES OF THE COSTS AND BENEFITS DIMENSION
NO. STATEMENTS/QUESTIONS PARENT SUBSIDIARY PARENT & SUBSIDIARY
(BOARD MEMBER DUALITY)
DATA
AGREE NOT SURE
DIS-AGREE
AGREE NOT SURE
DIS-AGREE
AGREE NOT SURE
DIS-AGREE
Q8 Dual directors who also hold as shareholder of subsidiary company are susceptible to conflict of interest
53% 23% 23% 50% 16% 34% 36% 6% 58% D 9 4 4 42 13 28 12 2 19
Q9 Establishing a subsidiary is purely for business goals, free from intention to create Dual Director and/or political intervention
88% 12% 0% 89% 10% 1% 94% 0% 6% C 15 2 0 74 8 1 31 0 2
Q10 A subsidiary company is an independent entity and does not give preference in decision to parent company
53% 18% 29% 58% 18% 24% 64% 6% 30% D
9 3 5 48 15 21 21 2 10
Q11 Parent company decisions affect the performance of the subsidiary
100% 0% 0% 87% 10% 3% 90% 0% 10% C 17 0 0 73 8 3 30 0 3
Q12 Director of parent company should not be appointed to be a commissioner in subsidiary
17% 17% 66% 28% 24% 48% 9% 15% 76% S
3 3 11 24 20 40 3 5 25
Q13 Dual directors use all their experience to the advantage of both companies
94% 6% 0% 86% 12% 2% 91% 6% 3% C
16 1 0 72 10 2 30 2 1
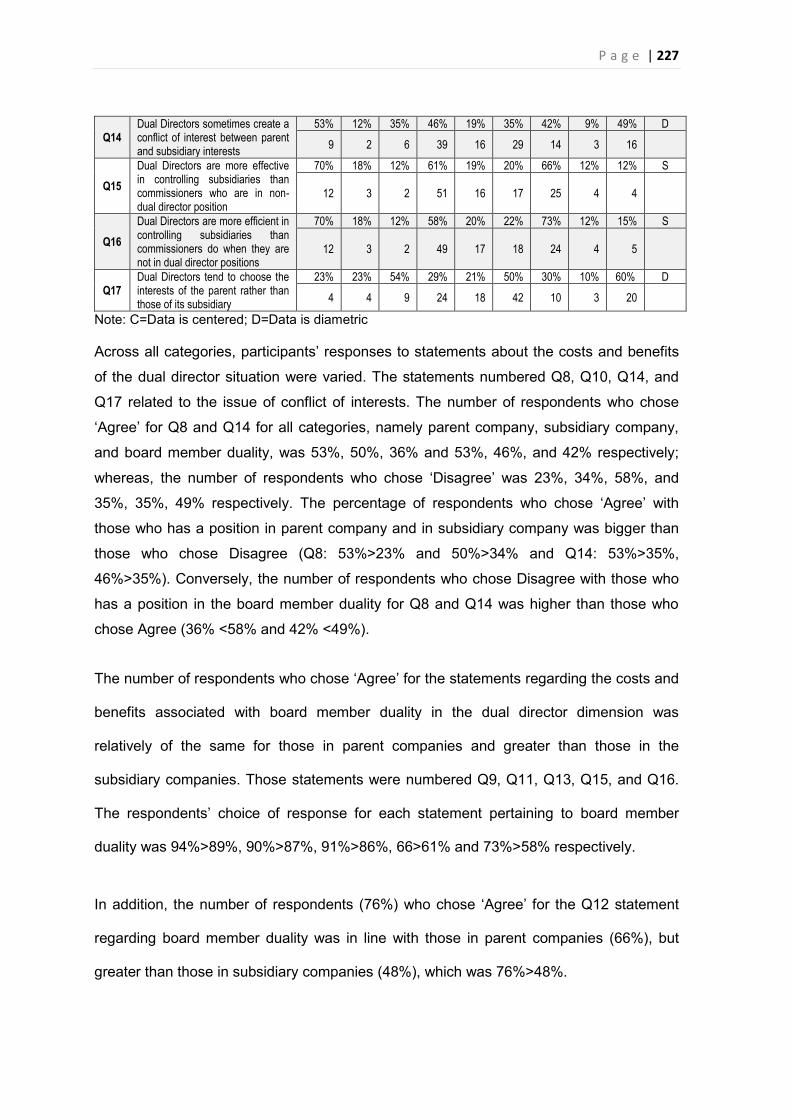
P a g e | 227
Q14 Dual Directors sometimes create a conflict of interest between parent and subsidiary interests
53% 12% 35% 46% 19% 35% 42% 9% 49% D
9 2 6 39 16 29 14 3 16
Q15 Dual Directors are more effective in controlling subsidiaries than commissioners who are in non-dual director position
70% 18% 12% 61% 19% 20% 66% 12% 12% S
12 3 2 51 16 17 25 4 4
Q16 Dual Directors are more efficient in controlling subsidiaries than commissioners do when they are not in dual director positions
70% 18% 12% 58% 20% 22% 73% 12% 15% S
12 3 2 49 17 18 24 4 5
Q17 Dual Directors tend to choose the interests of the parent rather than those of its subsidiary
23% 23% 54% 29% 21% 50% 30% 10% 60% D
4 4 9 24 18 42 10 3 20
Note: C=Data is centered; D=Data is diametric
Across all categories, participants’ responses to statements about the costs and benefits
of the dual director situation were varied. The statements numbered Q8, Q10, Q14, and
Q17 related to the issue of conflict of interests. The number of respondents who chose
‘Agree’ for Q8 and Q14 for all categories, namely parent company, subsidiary company,
and board member duality, was 53%, 50%, 36% and 53%, 46%, and 42% respectively;
whereas, the number of respondents who chose ‘Disagree’ was 23%, 34%, 58%, and
35%, 35%, 49% respectively. The percentage of respondents who chose ‘Agree’ with
those who has a position in parent company and in subsidiary company was bigger than
those who chose Disagree (Q8: 53%>23% and 50%>34% and Q14: 53%>35%,
46%>35%). Conversely, the number of respondents who chose Disagree with those who
has a position in the board member duality for Q8 and Q14 was higher than those who
chose Agree (36% <58% and 42% <49%).
The number of respondents who chose ‘Agree’ for the statements regarding the costs and
benefits associated with board member duality in the dual director dimension was
relatively of the same for those in parent companies and greater than those in the
subsidiary companies. Those statements were numbered Q9, Q11, Q13, Q15, and Q16.
The respondents’ choice of response for each statement pertaining to board member
duality was 94%>89%, 90%>87%, 91%>86%, 66>61% and 73%>58% respectively.
In addition, the number of respondents (76%) who chose ‘Agree’ for the Q12 statement
regarding board member duality was in line with those in parent companies (66%), but
greater than those in subsidiary companies (48%), which was 76%>48%.
P a g e | 228
A substantial number (15% or more) of respondents in parent companies answered ’ Not
Sure’ for the statements Q8, Q10, Q12, Q15, Q16, and Q17, in the subsidiary companies
for the statements Q8, Q10, Q12, Q14, Q15, Q16, Q17, and in board member duality
situations for the statement Q12. Thus, the statements Q8, Q10, Q12, Q15, Q16, and Q17
resulted in a considerable number of ‘Not Sure’ responses from those in parent
companies and in subsidiary companies. A significant number of respondents from all
categories answered ‘Not Sure’ in response to the Q12 statement.
If the percentages were converted into a trend defined as Centered (C), Scattered (S),
Diametric (D), and Scattered with Diametric (S/D), then the results would be as follows:
The answers of the majority of respondents in all categories, that is parent company,
subsidiary company and in board member duality, for Q9, Q11, Q13, were centered on
‘Agree’ to statements regarding the costs and benefits of having dual director situations.
However, for all categories, the answers to Q15 and Q16 were interspersed with a
number of ‘Disagree’ responses in the subsidiary company category, and this was higher
than those in parent company and board member duality categories.
The answer of respondent in subsidiary company and in board member duality categories
for Q8 and Q14 were equally distributed between ‘Agree’ and ‘Disagree’, whereas for the
parent company category, they were scattered.
The answers of respondent in parent company and in subsidiary company categories for
Q10 and Q17 were scattered with diametric opinions between ‘Agree’ and ‘Disagree’,
whereas in board member duality they were diametric.
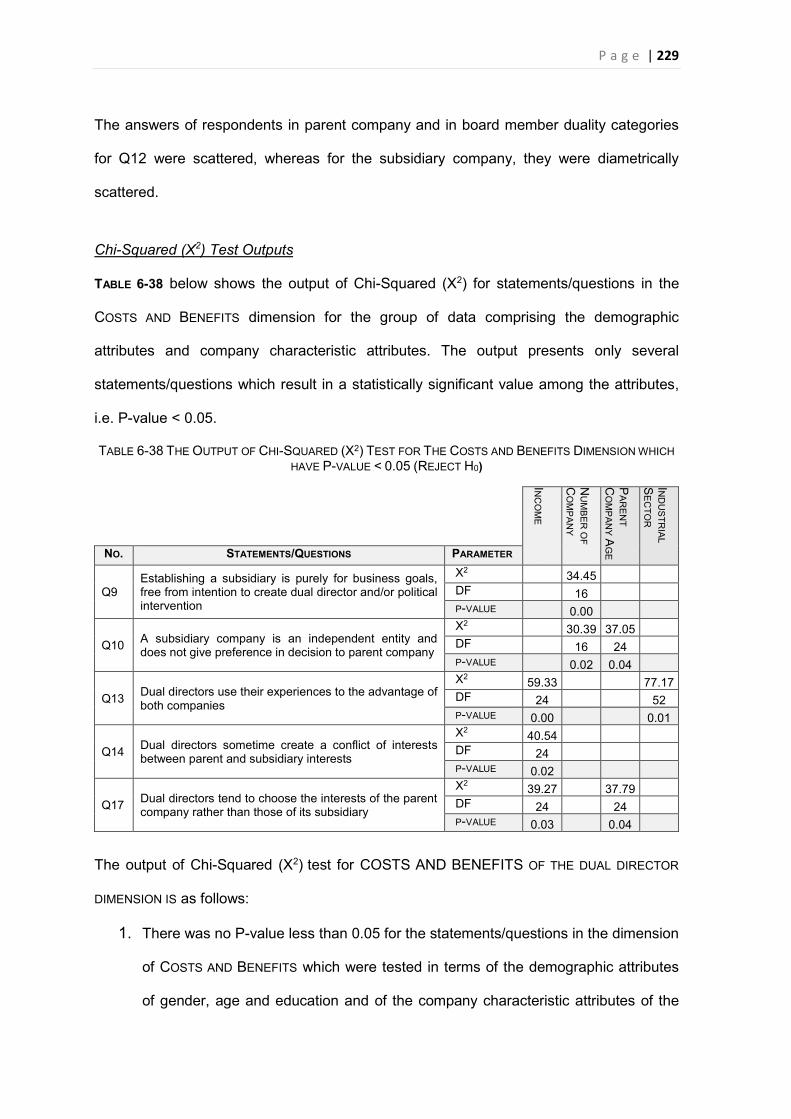
P a g e | 229
The answers of respondents in parent company and in board member duality categories
for Q12 were scattered, whereas for the subsidiary company, they were diametrically
scattered.
Chi-Squared (X2) Test Outputs
TABLE 6-38 below shows the output of Chi-Squared (X2) for statements/questions in the
COSTS AND BENEFITS dimension for the group of data comprising the demographic
attributes and company characteristic attributes. The output presents only several
statements/questions which result in a statistically significant value among the attributes,
i.e. P-value < 0.05.
TABLE 6-38 THE OUTPUT OF CHI-SQUARED (X2) TEST FOR THE COSTS AND BENEFITS DIMENSION WHICH HAVE P-VALUE < 0.05 (REJECT H0)
INC
OM
E
NU
MB
ER
OF
CO
MP
AN
Y
PA
RE
NT
CO
MP
AN
Y A
GE
IND
US
TRIA
L S
EC
TOR
NO. STATEMENTS/QUESTIONS PARAMETER
Q9 Establishing a subsidiary is purely for business goals, free from intention to create dual director and/or political intervention
X2 34.45 DF 16 P-VALUE 0.00
Q10 A subsidiary company is an independent entity and does not give preference in decision to parent company
X2 30.39 37.05 DF 16 24 P-VALUE 0.02 0.04
Q13 Dual directors use their experiences to the advantage of both companies
X2 59.33 77.17 DF 24 52 P-VALUE 0.00 0.01
Q14 Dual directors sometime create a conflict of interests between parent and subsidiary interests
X2 40.54 DF 24 P-VALUE 0.02
Q17 Dual directors tend to choose the interests of the parent company rather than those of its subsidiary
X2 39.27 37.79 DF 24 24 P-VALUE 0.03 0.04
The output of Chi-Squared (X2) test for COSTS AND BENEFITS OF THE DUAL DIRECTOR
DIMENSION IS as follows:
1. There was no P-value less than 0.05 for the statements/questions in the dimension
of COSTS AND BENEFITS which were tested in terms of the demographic attributes
of gender, age and education and of the company characteristic attributes of the
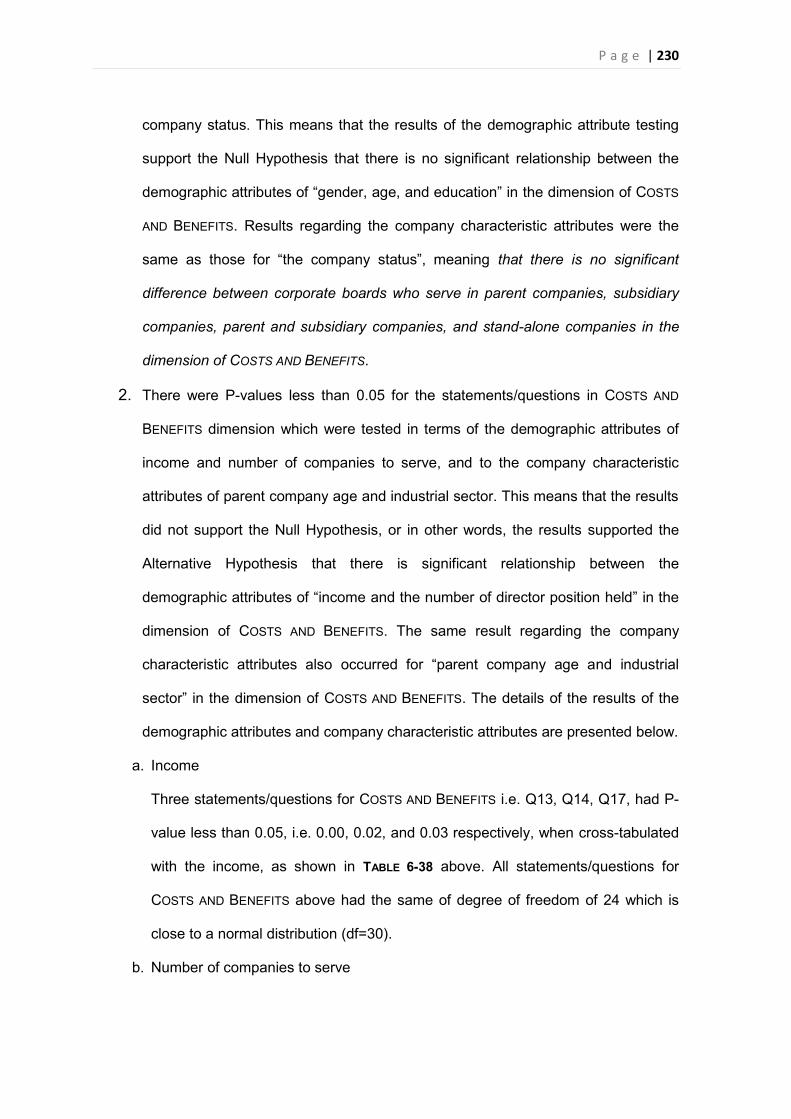
P a g e | 230
company status. This means that the results of the demographic attribute testing
support the Null Hypothesis that there is no significant relationship between the
demographic attributes of “gender, age, and education” in the dimension of COSTS
AND BENEFITS. Results regarding the company characteristic attributes were the
same as those for “the company status”, meaning that there is no significant
difference between corporate boards who serve in parent companies, subsidiary
companies, parent and subsidiary companies, and stand-alone companies in the
dimension of COSTS AND BENEFITS.
2. There were P-values less than 0.05 for the statements/questions in COSTS AND
BENEFITS dimension which were tested in terms of the demographic attributes of
income and number of companies to serve, and to the company characteristic
attributes of parent company age and industrial sector. This means that the results
did not support the Null Hypothesis, or in other words, the results supported the
Alternative Hypothesis that there is significant relationship between the
demographic attributes of “income and the number of director position held” in the
dimension of COSTS AND BENEFITS. The same result regarding the company
characteristic attributes also occurred for “parent company age and industrial
sector” in the dimension of COSTS AND BENEFITS. The details of the results of the
demographic attributes and company characteristic attributes are presented below.
a. Income
Three statements/questions for COSTS AND BENEFITS i.e. Q13, Q14, Q17, had P-
value less than 0.05, i.e. 0.00, 0.02, and 0.03 respectively, when cross-tabulated
with the income, as shown in TABLE 6-38 above. All statements/questions for
COSTS AND BENEFITS above had the same of degree of freedom of 24 which is
close to a normal distribution (df=30).
b. Number of companies to serve
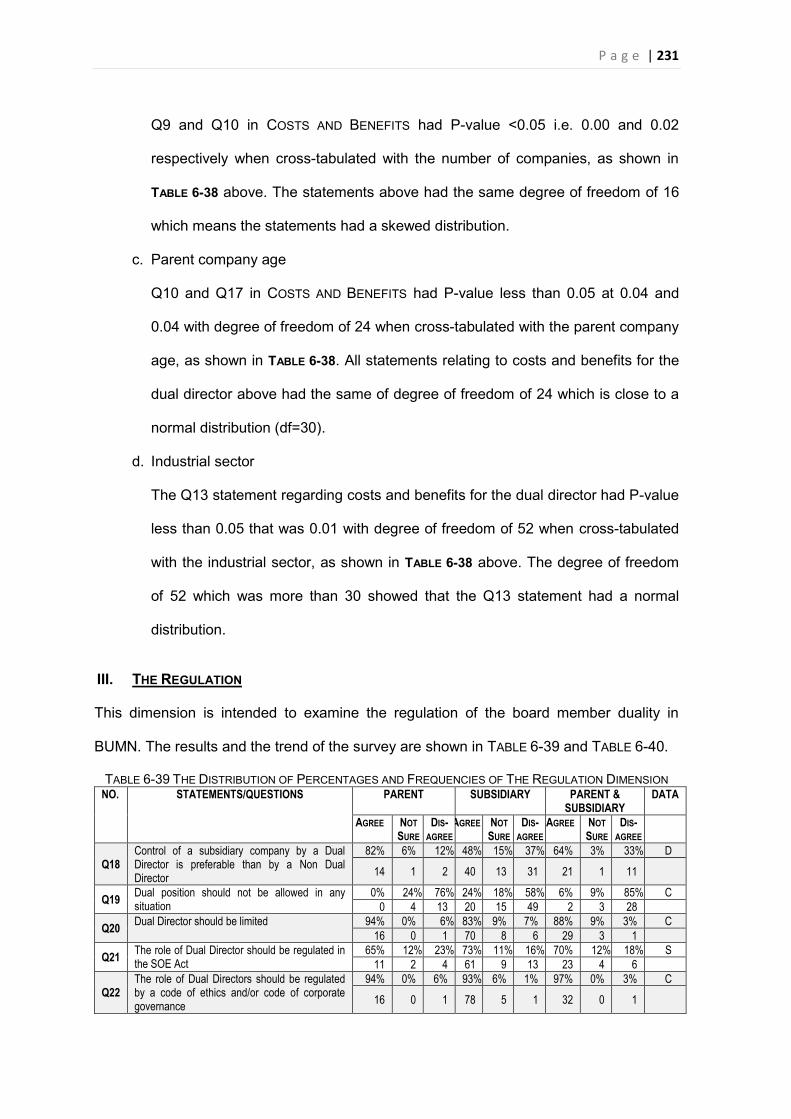
P a g e | 231
Q9 and Q10 in COSTS AND BENEFITS had P-value <0.05 i.e. 0.00 and 0.02
respectively when cross-tabulated with the number of companies, as shown in
TABLE 6-38 above. The statements above had the same degree of freedom of 16
which means the statements had a skewed distribution.
c. Parent company age
Q10 and Q17 in COSTS AND BENEFITS had P-value less than 0.05 at 0.04 and
0.04 with degree of freedom of 24 when cross-tabulated with the parent company
age, as shown in TABLE 6-38. All statements relating to costs and benefits for the
dual director above had the same of degree of freedom of 24 which is close to a
normal distribution (df=30).
d. Industrial sector
The Q13 statement regarding costs and benefits for the dual director had P-value
less than 0.05 that was 0.01 with degree of freedom of 52 when cross-tabulated
with the industrial sector, as shown in TABLE 6-38 above. The degree of freedom
of 52 which was more than 30 showed that the Q13 statement had a normal
distribution.
III. THE REGULATION
This dimension is intended to examine the regulation of the board member duality in
BUMN. The results and the trend of the survey are shown in TABLE 6-39 and TABLE 6-40.
TABLE 6-39 THE DISTRIBUTION OF PERCENTAGES AND FREQUENCIES OF THE REGULATION DIMENSION NO. STATEMENTS/QUESTIONS PARENT SUBSIDIARY PARENT &
SUBSIDIARY DATA
AGREE NOT SURE
DIS-AGREE
AGREE NOT SURE
DIS-AGREE
AGREE NOT SURE
DIS-AGREE
Q18 Control of a subsidiary company by a Dual Director is preferable than by a Non Dual Director
82% 6% 12% 48% 15% 37% 64% 3% 33% D
14 1 2 40 13 31 21 1 11
Q19 Dual position should not be allowed in any situation
0% 24% 76% 24% 18% 58% 6% 9% 85% C 0 4 13 20 15 49 2 3 28
Q20 Dual Director should be limited 94% 0% 6% 83% 9% 7% 88% 9% 3% C 16 0 1 70 8 6 29 3 1
Q21 The role of Dual Director should be regulated in the SOE Act
65% 12% 23% 73% 11% 16% 70% 12% 18% S 11 2 4 61 9 13 23 4 6
Q22 The role of Dual Directors should be regulated by a code of ethics and/or code of corporate governance
94% 0% 6% 93% 6% 1% 97% 0% 3% C
16 0 1 78 5 1 32 0 1
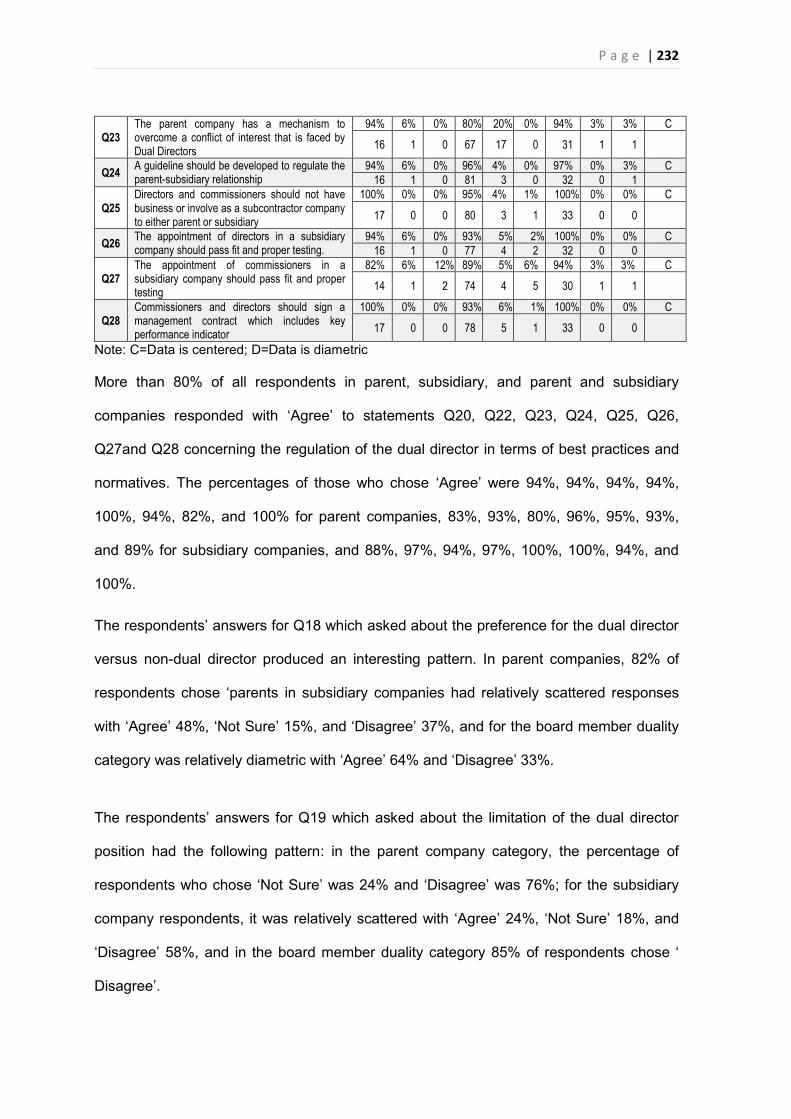
P a g e | 232
Q23 The parent company has a mechanism to overcome a conflict of interest that is faced by Dual Directors
94% 6% 0% 80% 20% 0% 94% 3% 3% C
16 1 0 67 17 0 31 1 1
Q24 A guideline should be developed to regulate the parent-subsidiary relationship
94% 6% 0% 96% 4% 0% 97% 0% 3% C 16 1 0 81 3 0 32 0 1
Q25 Directors and commissioners should not have business or involve as a subcontractor company to either parent or subsidiary
100% 0% 0% 95% 4% 1% 100% 0% 0% C
17 0 0 80 3 1 33 0 0
Q26 The appointment of directors in a subsidiary company should pass fit and proper testing.
94% 6% 0% 93% 5% 2% 100% 0% 0% C 16 1 0 77 4 2 32 0 0
Q27 The appointment of commissioners in a subsidiary company should pass fit and proper testing
82% 6% 12% 89% 5% 6% 94% 3% 3% C
14 1 2 74 4 5 30 1 1
Q28 Commissioners and directors should sign a management contract which includes key performance indicator
100% 0% 0% 93% 6% 1% 100% 0% 0% C
17 0 0 78 5 1 33 0 0
Note: C=Data is centered; D=Data is diametric
More than 80% of all respondents in parent, subsidiary, and parent and subsidiary
companies responded with ‘Agree’ to statements Q20, Q22, Q23, Q24, Q25, Q26,
Q27and Q28 concerning the regulation of the dual director in terms of best practices and
normatives. The percentages of those who chose ‘Agree’ were 94%, 94%, 94%, 94%,
100%, 94%, 82%, and 100% for parent companies, 83%, 93%, 80%, 96%, 95%, 93%,
and 89% for subsidiary companies, and 88%, 97%, 94%, 97%, 100%, 100%, 94%, and
100%.
The respondents’ answers for Q18 which asked about the preference for the dual director
versus non-dual director produced an interesting pattern. In parent companies, 82% of
respondents chose ‘parents in subsidiary companies had relatively scattered responses
with ‘Agree’ 48%, ‘Not Sure’ 15%, and ‘Disagree’ 37%, and for the board member duality
category was relatively diametric with ‘Agree’ 64% and ‘Disagree’ 33%.
The respondents’ answers for Q19 which asked about the limitation of the dual director
position had the following pattern: in the parent company category, the percentage of
respondents who chose ‘Not Sure’ was 24% and ‘Disagree’ was 76%; for the subsidiary
company respondents, it was relatively scattered with ‘Agree’ 24%, ‘Not Sure’ 18%, and
‘Disagree’ 58%, and in the board member duality category 85% of respondents chose ‘
Disagree’.
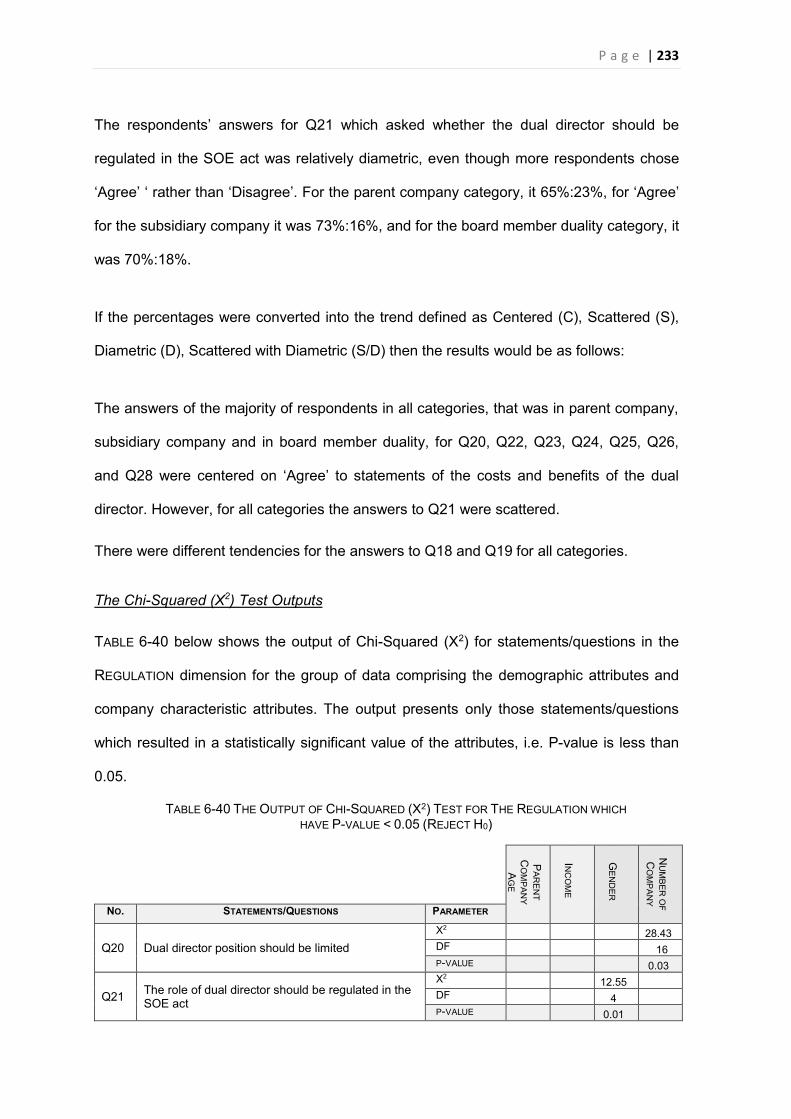
P a g e | 233
The respondents’ answers for Q21 which asked whether the dual director should be
regulated in the SOE act was relatively diametric, even though more respondents chose
‘Agree’ ‘ rather than ‘Disagree’. For the parent company category, it 65%:23%, for ‘Agree’
for the subsidiary company it was 73%:16%, and for the board member duality category, it
was 70%:18%.
If the percentages were converted into the trend defined as Centered (C), Scattered (S),
Diametric (D), Scattered with Diametric (S/D) then the results would be as follows:
The answers of the majority of respondents in all categories, that was in parent company,
subsidiary company and in board member duality, for Q20, Q22, Q23, Q24, Q25, Q26,
and Q28 were centered on ‘Agree’ to statements of the costs and benefits of the dual
director. However, for all categories the answers to Q21 were scattered.
There were different tendencies for the answers to Q18 and Q19 for all categories.
The Chi-Squared (X2) Test Outputs
TABLE 6-40 below shows the output of Chi-Squared (X2) for statements/questions in the
REGULATION dimension for the group of data comprising the demographic attributes and
company characteristic attributes. The output presents only those statements/questions
which resulted in a statistically significant value of the attributes, i.e. P-value is less than
0.05.
TABLE 6-40 THE OUTPUT OF CHI-SQUARED (X2) TEST FOR THE REGULATION WHICH HAVE P-VALUE < 0.05 (REJECT H0)
PA
RE
NT
CO
MP
AN
Y
AG
E
INC
OM
E
GE
ND
ER
NU
MB
ER
OF
CO
MP
AN
Y
NO. STATEMENTS/QUESTIONS PARAMETER
Q20 Dual director position should be limited X2 28.43 DF 16 P-VALUE 0.03
Q21 The role of dual director should be regulated in the SOE act
X2 12.55 DF 4 P-VALUE 0.01
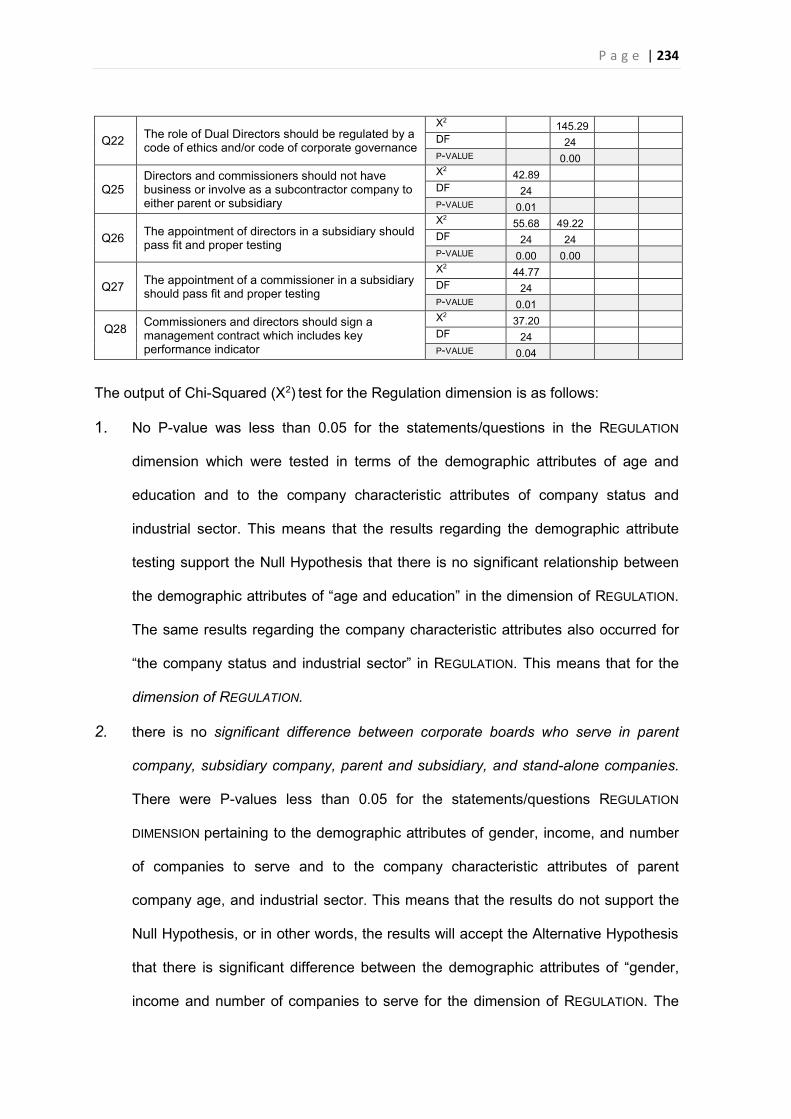
P a g e | 234
Q22 The role of Dual Directors should be regulated by a code of ethics and/or code of corporate governance
X2 145.29 DF 24 P-VALUE 0.00
Q25 Directors and commissioners should not have business or involve as a subcontractor company to either parent or subsidiary
X2 42.89 DF 24 P-VALUE 0.01
Q26 The appointment of directors in a subsidiary should pass fit and proper testing
X2 55.68 49.22 DF 24 24 P-VALUE 0.00 0.00
Q27 The appointment of a commissioner in a subsidiary should pass fit and proper testing
X2 44.77 DF 24 P-VALUE 0.01
Q28 Commissioners and directors should sign a management contract which includes key performance indicator
X2 37.20 DF 24 P-VALUE 0.04
The output of Chi-Squared (X2) test for the Regulation dimension is as follows:
1. No P-value was less than 0.05 for the statements/questions in the REGULATION
dimension which were tested in terms of the demographic attributes of age and
education and to the company characteristic attributes of company status and
industrial sector. This means that the results regarding the demographic attribute
testing support the Null Hypothesis that there is no significant relationship between
the demographic attributes of “age and education” in the dimension of REGULATION.
The same results regarding the company characteristic attributes also occurred for
“the company status and industrial sector” in REGULATION. This means that for the
dimension of REGULATION.
2. there is no significant difference between corporate boards who serve in parent
company, subsidiary company, parent and subsidiary, and stand-alone companies.
There were P-values less than 0.05 for the statements/questions REGULATION
DIMENSION pertaining to the demographic attributes of gender, income, and number
of companies to serve and to the company characteristic attributes of parent
company age, and industrial sector. This means that the results do not support the
Null Hypothesis, or in other words, the results will accept the Alternative Hypothesis
that there is significant difference between the demographic attributes of “gender,
income and number of companies to serve for the dimension of REGULATION. The
P a g e | 235
same result regarding the company characteristic attributes also occurred for
“parent company age” In REGULATION. The details of the results of the demographic
attributes and company characteristic attributes are presented as below.
a. Gender
Q21 in the REGULATION dimension had a P-value of 0.01 with degree of freedom
of 4 when cross-tabulated with the gender, as shown in TABLE 6-40 above. The
degree of freedom of 4 indicates that the statement of Q21 had no-normal
distribution.
b. Income
Two statements/questions stated in the REGULATION dimension, i.e. Q22 and
Q26, had a P-value less than 0.05, i.e. 0.00 and 0.00 respectively, when cross-
tabulated with the average monthly income, as shown TABLE 6-40 above. All
statements/questions in the REGULATION dimension above had the same of
degree of freedom of 24 which is nearly a normal distribution (df=30).
c. NUMBER of companies
Q20 in the REGULATION dimension had a P-value of 0.03 with degree of freedom
of 16 if cross tabulated with the number of company, as shown in TABLE 6-40
above. The degree of freedom of 16 showed that the statement/question of Q20
had no normal distribution.
d. Parent company age
Q25, Q26, Q27 and Q28 in the REGULATION dimension had P-values < 0.05, i.e.
0.01, 0.00, 0.01 and 0.04 respectively, when cross-tabulated with the parent
company age, as shown in TABLE 6-40 above. All statements of regulation for the
dual director dimension above had the same of degree of freedom of 24 which is
close to normal distribution (df=30).
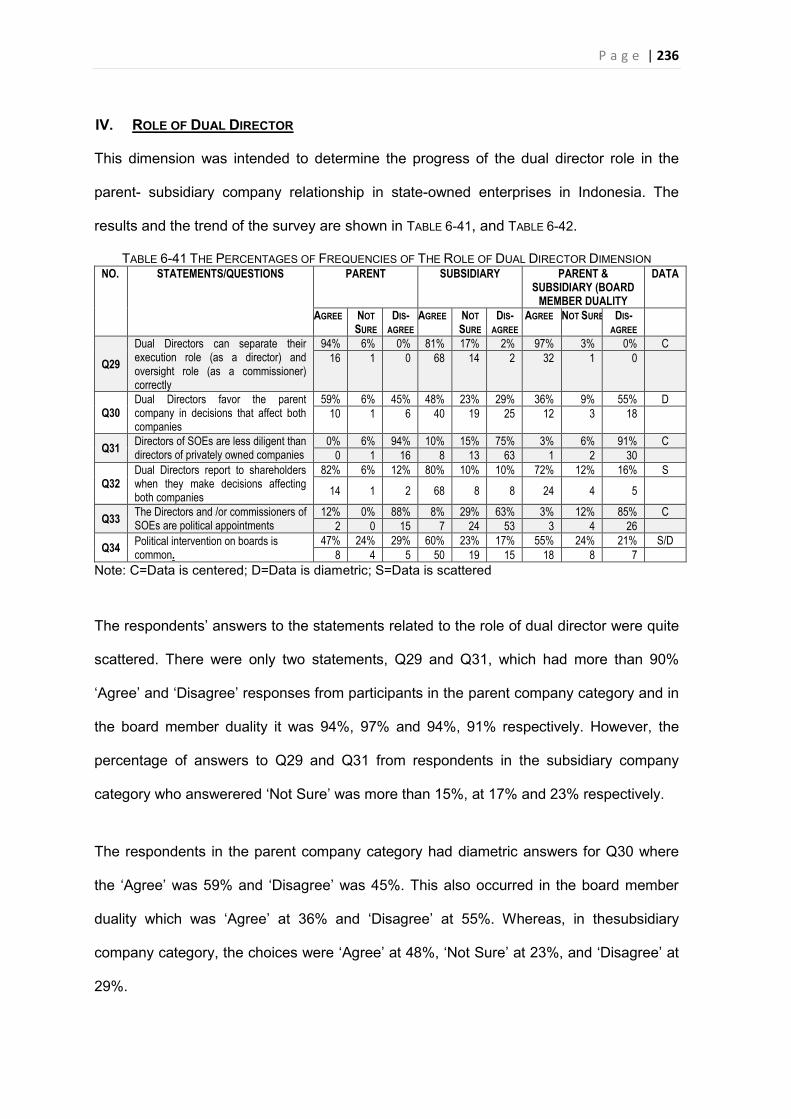
P a g e | 236
IV. ROLE OF DUAL DIRECTOR
This dimension was intended to determine the progress of the dual director role in the
parent- subsidiary company relationship in state-owned enterprises in Indonesia. The
results and the trend of the survey are shown in TABLE 6-41, and TABLE 6-42.
TABLE 6-41 THE PERCENTAGES OF FREQUENCIES OF THE ROLE OF DUAL DIRECTOR DIMENSION NO. STATEMENTS/QUESTIONS PARENT SUBSIDIARY PARENT &
SUBSIDIARY (BOARD MEMBER DUALITY
DATA
AGREE NOT SURE
DIS-AGREE
AGREE NOT SURE
DIS-AGREE
AGREE NOT SURE DIS-AGREE
Q29 Dual Directors can separate their execution role (as a director) and oversight role (as a commissioner) correctly
94% 6% 0% 81% 17% 2% 97% 3% 0% C 16 1 0 68 14 2 32 1 0
Q30 Dual Directors favor the parent company in decisions that affect both companies
59% 6% 45% 48% 23% 29% 36% 9% 55% D 10 1 6 40 19 25 12 3 18
Q31 Directors of SOEs are less diligent than directors of privately owned companies
0% 6% 94% 10% 15% 75% 3% 6% 91% C 0 1 16 8 13 63 1 2 30
Q32 Dual Directors report to shareholders when they make decisions affecting both companies
82% 6% 12% 80% 10% 10% 72% 12% 16% S
14 1 2 68 8 8 24 4 5
Q33 The Directors and /or commissioners of SOEs are political appointments
12% 0% 88% 8% 29% 63% 3% 12% 85% C 2 0 15 7 24 53 3 4 26
Q34 Political intervention on boards is common.
47% 24% 29% 60% 23% 17% 55% 24% 21% S/D 8 4 5 50 19 15 18 8 7
Note: C=Data is centered; D=Data is diametric; S=Data is scattered
The respondents’ answers to the statements related to the role of dual director were quite
scattered. There were only two statements, Q29 and Q31, which had more than 90%
‘Agree’ and ‘Disagree’ responses from participants in the parent company category and in
the board member duality it was 94%, 97% and 94%, 91% respectively. However, the
percentage of answers to Q29 and Q31 from respondents in the subsidiary company
category who answerered ‘Not Sure’ was more than 15%, at 17% and 23% respectively.
The respondents in the parent company category had diametric answers for Q30 where
the ‘Agree’ was 59% and ‘Disagree’ was 45%. This also occurred in the board member
duality which was ‘Agree’ at 36% and ‘Disagree’ at 55%. Whereas, in thesubsidiary
company category, the choices were ‘Agree’ at 48%, ‘Not Sure’ at 23%, and ‘Disagree’ at
29%.
P a g e | 237
The respondents in parent company and in subsidiary company were agree on Q32 that
was 82% and 80% respectively, whereas the board member duality answer on Q32 was
scattered in 72%, 12%, and 16%.
The respondents in parent company and in board member duality categories did not
agree on Q33, with results of 88% and 85% respectively, whereas in the subsidiary
company category, ‘Agree’ was 8%, ‘Not Sure’ was 29%, and ‘Disagree’ was 63%.
Respondent answers to Q34 were scattered among ‘Agree’, ‘Not Sure’ and ‘Disagree’ for
all categories of parent company, subsidiary company, and board member duality as
shown in TABLE 6-41.
If the percentages were converted into the trend defined as Centered (C), Scattered (S),
Diametric (D), Scattered with Diametric (S/D) then the results would be as follows:
Parent company and board member duality categories showed the same trend for Q29
(C), Q30 (D), Q31 (C), Q33 (C), and Q34 (S/D). However, for Q32, the parent company
response was centred and the board member duality was scattered.
In subsidiary company category, Q29 and Q32 had the same tendency as that of the
parent company category, and Q29 had the same tendency as that of board member
duality. The remaining responses were scattered for Q31, Q33, and Q34, and scattered
with diametric for Q30.
The Chi-Squared (X2) Test Outputs
TABLE 6-42 below shows the output of Chi-Squared (X2) for statements/questions in the
ROLE OF DUAL DIRECTOR dimension related to the group of data comprising the
demographic attributes and company characteristic attributes. The output presents only
several statements/questions which result in a statistically significant value of the
attributes, i.e. P-value < 0.05.
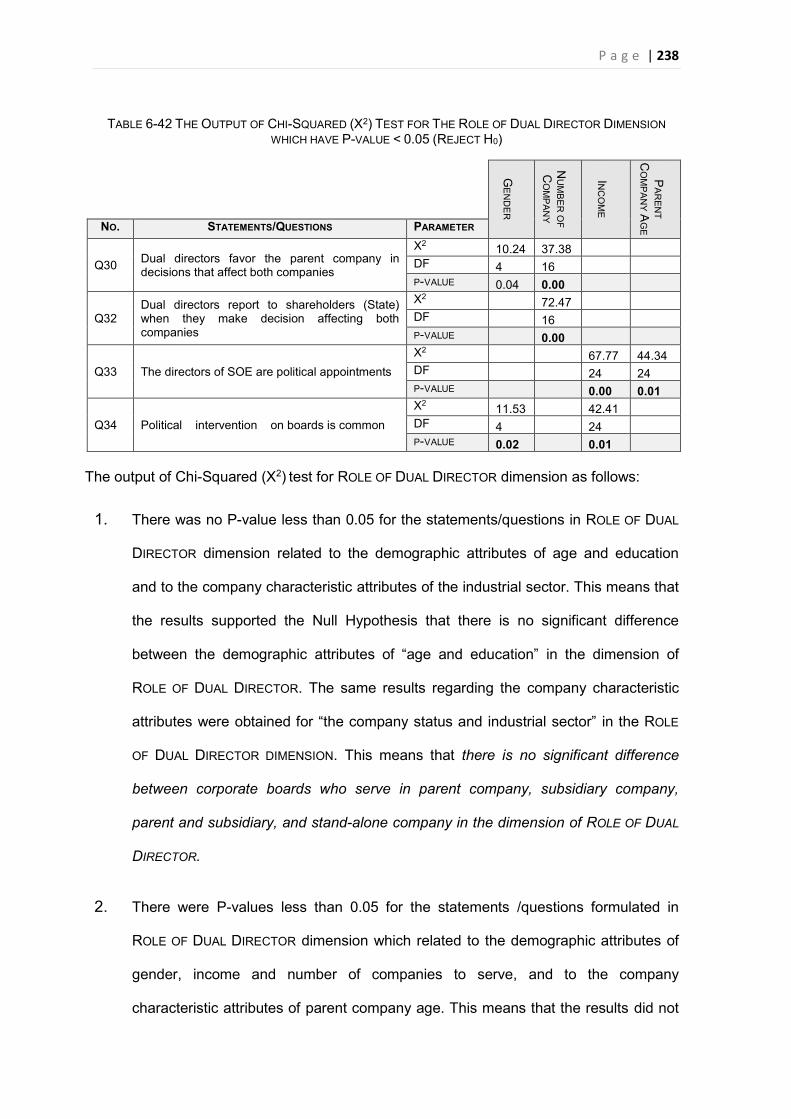
P a g e | 238
TABLE 6-42 THE OUTPUT OF CHI-SQUARED (X2) TEST FOR THE ROLE OF DUAL DIRECTOR DIMENSION WHICH HAVE P-VALUE < 0.05 (REJECT H0)
GE
ND
ER
NU
MB
ER
OF
CO
MP
AN
Y
INC
OM
E
PA
RE
NT
CO
MP
AN
Y A
GE NO. STATEMENTS/QUESTIONS PARAMETER
Q30 Dual directors favor the parent company in decisions that affect both companies
X2 10.24 37.38 DF 4 16 P-VALUE 0.04 0.00
Q32 Dual directors report to shareholders (State) when they make decision affecting both companies
X2 72.47 DF 16 P-VALUE 0.00
Q33 The directors of SOE are political appointments X2 67.77 44.34 DF 24 24 P-VALUE 0.00 0.01
Q34 Political intervention on boards is common X2 11.53 42.41 DF 4 24 P-VALUE 0.02 0.01
The output of Chi-Squared (X2) test for ROLE OF DUAL DIRECTOR dimension as follows:
1. There was no P-value less than 0.05 for the statements/questions in ROLE OF DUAL
DIRECTOR dimension related to the demographic attributes of age and education
and to the company characteristic attributes of the industrial sector. This means that
the results supported the Null Hypothesis that there is no significant difference
between the demographic attributes of “age and education” in the dimension of
ROLE OF DUAL DIRECTOR. The same results regarding the company characteristic
attributes were obtained for “the company status and industrial sector” in the ROLE
OF DUAL DIRECTOR DIMENSION. This means that there is no significant difference
between corporate boards who serve in parent company, subsidiary company,
parent and subsidiary, and stand-alone company in the dimension of ROLE OF DUAL
DIRECTOR.
2. There were P-values less than 0.05 for the statements /questions formulated in
ROLE OF DUAL DIRECTOR dimension which related to the demographic attributes of
gender, income and number of companies to serve, and to the company
characteristic attributes of parent company age. This means that the results did not
P a g e | 239
support the Null Hypothesis. In other words, the results supported the Alternative
Hypothesis that there is a relationship between the demographic attributes of
“gender, income, number of companies to serve” in the dimension of ROLE OF DUAL
DIRECTOR. The same result regarding the company characteristic attributes was
obtained for “parent company age” in ROLE OF DUAL DIRECTOR. The details of the
results of the demographic attributes and company characteristic attributes are
presented below.
a. Gender
Q30 and Q34 in the ROLE OF DUAL DIRECTOR dimension had a P-value < 0.05
(0.04 and 0.02 respectively) with a degree of freedom of 4 when cross-tabulated
with the gender, as shown in TABLE 6-42 above. The degree of freedom of 4
showed that Q30 and Q34 had no normal distribution.
b. Income
There were 2 statements/questions formulated in ROLE OF DUAL DIRECTOR
dimension that was Q33 and Q34 which had P-value < 0.05 that was 0.00 and
0.01 respectively with degree of freedom of 24 when cross tabulated with the
average monthly income, as shown in TABLE 6-42 above. The degree of freedom
24 means that Q33 and Q34 were nearly to be the normal distribution (df=30).
c. Number of Company to serve
There were 2 statements/questions formulated in ROLE OF DUAL DIRECTOR
dimension that was Q30 and Q32 which had P-value less than 0.05 that was 0.00
and 0.00 respectively with degree of freedom of 16 when cross tabulated with the
number of company, as shown in TABLE 6-42 above. The degree of freedom of 16
showed that Q30 and Q32 did not have a normal distribution.
d. Parent company age
Q33 in the ROLE OF DUAL DIRECTOR dimension had a P-value of 0.01 with a
degree of freedom of 24 when cross-tabulated with the average monthly income,
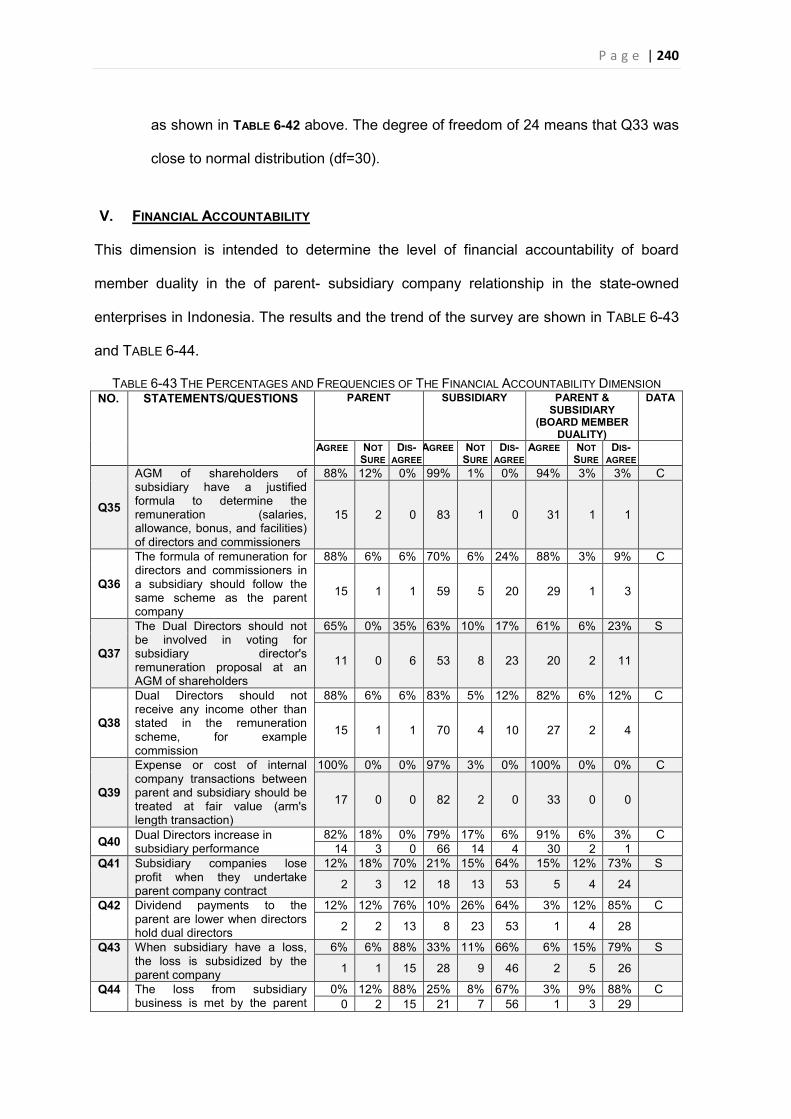
P a g e | 240
as shown in TABLE 6-42 above. The degree of freedom of 24 means that Q33 was
close to normal distribution (df=30).
V. FINANCIAL ACCOUNTABILITY
This dimension is intended to determine the level of financial accountability of board
member duality in the of parent- subsidiary company relationship in the state-owned
enterprises in Indonesia. The results and the trend of the survey are shown in TABLE 6-43
and TABLE 6-44.
TABLE 6-43 THE PERCENTAGES AND FREQUENCIES OF THE FINANCIAL ACCOUNTABILITY DIMENSION NO. STATEMENTS/QUESTIONS PARENT SUBSIDIARY PARENT &
SUBSIDIARY (BOARD MEMBER
DUALITY)
DATA
AGREE NOT SURE
DIS-AGREE
AGREE NOT SURE
DIS-AGREE
AGREE NOT SURE
DIS-AGREE
Q35
AGM of shareholders of subsidiary have a justified formula to determine the remuneration (salaries, allowance, bonus, and facilities) of directors and commissioners
88% 12% 0% 99% 1% 0% 94% 3% 3% C
15 2 0 83 1 0 31 1 1
Q36
The formula of remuneration for directors and commissioners in a subsidiary should follow the same scheme as the parent company
88% 6% 6% 70% 6% 24% 88% 3% 9% C
15 1 1 59 5 20 29 1 3
Q37
The Dual Directors should not be involved in voting for subsidiary director's remuneration proposal at an AGM of shareholders
65% 0% 35% 63% 10% 17% 61% 6% 23% S
11 0 6 53 8 23 20 2 11
Q38
Dual Directors should not receive any income other than stated in the remuneration scheme, for example commission
88% 6% 6% 83% 5% 12% 82% 6% 12% C
15 1 1 70 4 10 27 2 4
Q39
Expense or cost of internal company transactions between parent and subsidiary should be treated at fair value (arm's length transaction)
100% 0% 0% 97% 3% 0% 100% 0% 0% C
17 0 0 82 2 0 33 0 0
Q40 Dual Directors increase in subsidiary performance
82% 18% 0% 79% 17% 6% 91% 6% 3% C 14 3 0 66 14 4 30 2 1
Q41 Subsidiary companies lose profit when they undertake parent company contract
12% 18% 70% 21% 15% 64% 15% 12% 73% S
2 3 12 18 13 53 5 4 24
Q42 Dividend payments to the parent are lower when directors hold dual directors
12% 12% 76% 10% 26% 64% 3% 12% 85% C
2 2 13 8 23 53 1 4 28
Q43 When subsidiary have a loss, the loss is subsidized by the parent company
6% 6% 88% 33% 11% 66% 6% 15% 79% S
1 1 15 28 9 46 2 5 26
Q44 The loss from subsidiary business is met by the parent
0% 12% 88% 25% 8% 67% 3% 9% 88% C 0 2 15 21 7 56 1 3 29
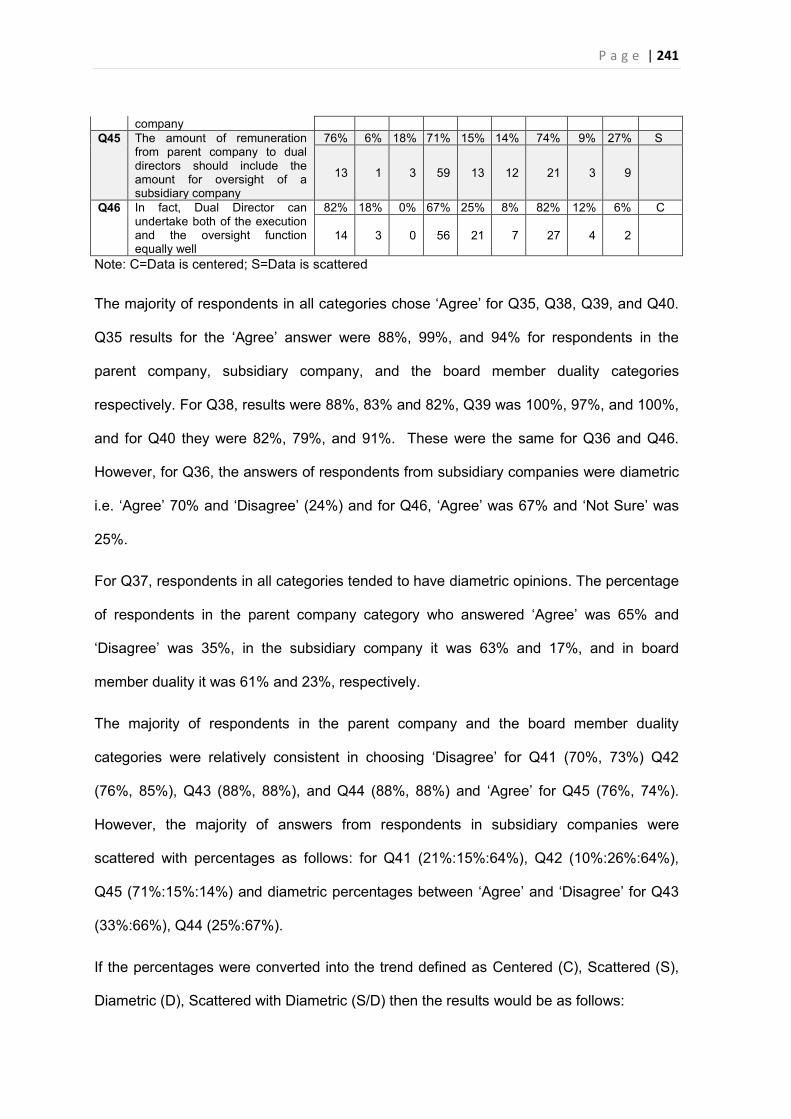
P a g e | 241
company Q45 The amount of remuneration
from parent company to dual directors should include the amount for oversight of a subsidiary company
76% 6% 18% 71% 15% 14% 74% 9% 27% S
13 1 3 59 13 12 21 3 9
Q46 In fact, Dual Director can undertake both of the execution and the oversight function equally well
82% 18% 0% 67% 25% 8% 82% 12% 6% C
14 3 0 56 21 7 27 4 2
Note: C=Data is centered; S=Data is scattered
The majority of respondents in all categories chose ‘Agree’ for Q35, Q38, Q39, and Q40.
Q35 results for the ‘Agree’ answer were 88%, 99%, and 94% for respondents in the
parent company, subsidiary company, and the board member duality categories
respectively. For Q38, results were 88%, 83% and 82%, Q39 was 100%, 97%, and 100%,
and for Q40 they were 82%, 79%, and 91%. These were the same for Q36 and Q46.
However, for Q36, the answers of respondents from subsidiary companies were diametric
i.e. ‘Agree’ 70% and ‘Disagree’ (24%) and for Q46, ‘Agree’ was 67% and ‘Not Sure’ was
25%.
For Q37, respondents in all categories tended to have diametric opinions. The percentage
of respondents in the parent company category who answered ‘Agree’ was 65% and
‘Disagree’ was 35%, in the subsidiary company it was 63% and 17%, and in board
member duality it was 61% and 23%, respectively.
The majority of respondents in the parent company and the board member duality
categories were relatively consistent in choosing ‘Disagree’ for Q41 (70%, 73%) Q42
(76%, 85%), Q43 (88%, 88%), and Q44 (88%, 88%) and ‘Agree’ for Q45 (76%, 74%).
However, the majority of answers from respondents in subsidiary companies were
scattered with percentages as follows: for Q41 (21%:15%:64%), Q42 (10%:26%:64%),
Q45 (71%:15%:14%) and diametric percentages between ‘Agree’ and ‘Disagree’ for Q43
(33%:66%), Q44 (25%:67%).
If the percentages were converted into the trend defined as Centered (C), Scattered (S),
Diametric (D), Scattered with Diametric (S/D) then the results would be as follows:
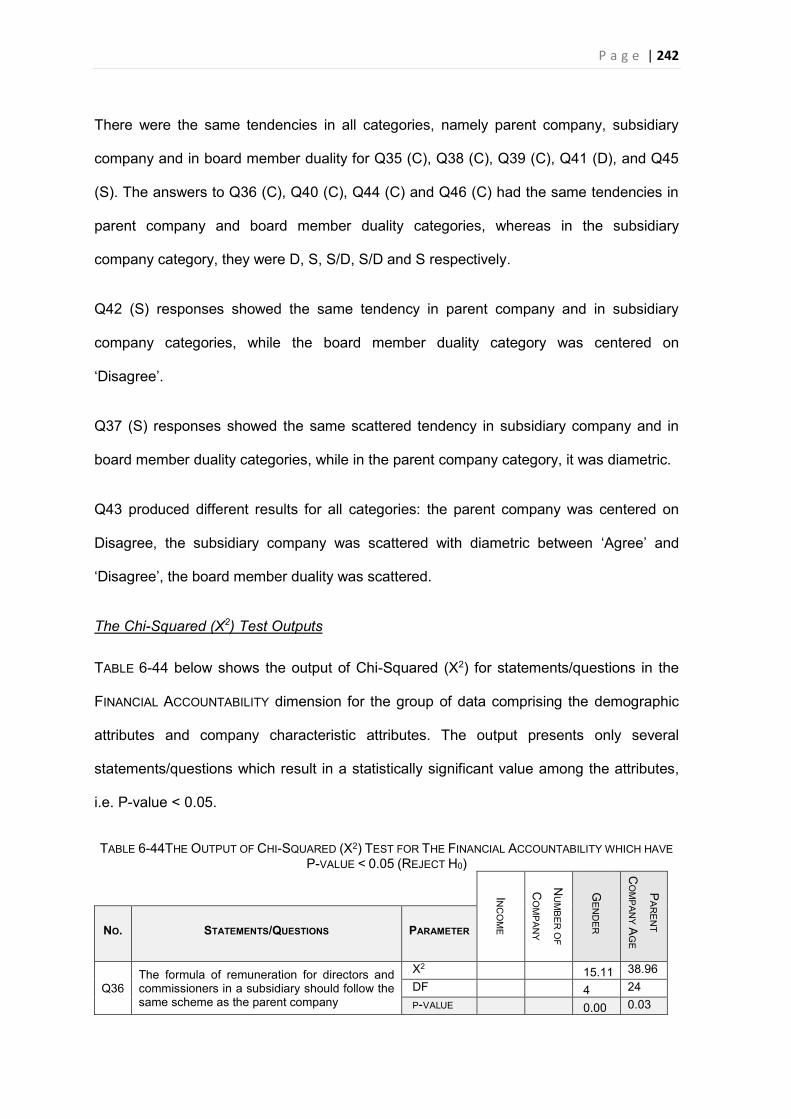
P a g e | 242
There were the same tendencies in all categories, namely parent company, subsidiary
company and in board member duality for Q35 (C), Q38 (C), Q39 (C), Q41 (D), and Q45
(S). The answers to Q36 (C), Q40 (C), Q44 (C) and Q46 (C) had the same tendencies in
parent company and board member duality categories, whereas in the subsidiary
company category, they were D, S, S/D, S/D and S respectively.
Q42 (S) responses showed the same tendency in parent company and in subsidiary
company categories, while the board member duality category was centered on
‘Disagree’.
Q37 (S) responses showed the same scattered tendency in subsidiary company and in
board member duality categories, while in the parent company category, it was diametric.
Q43 produced different results for all categories: the parent company was centered on
Disagree, the subsidiary company was scattered with diametric between ‘Agree’ and
‘Disagree’, the board member duality was scattered.
The Chi-Squared (X2) Test Outputs
TABLE 6-44 below shows the output of Chi-Squared (X2) for statements/questions in the
FINANCIAL ACCOUNTABILITY dimension for the group of data comprising the demographic
attributes and company characteristic attributes. The output presents only several
statements/questions which result in a statistically significant value among the attributes,
i.e. P-value < 0.05.
TABLE 6-44THE OUTPUT OF CHI-SQUARED (X2) TEST FOR THE FINANCIAL ACCOUNTABILITY WHICH HAVE P-VALUE < 0.05 (REJECT H0)
INC
OM
E
NU
MB
ER
OF
CO
MP
AN
Y
GE
ND
ER
PA
RE
NT
CO
MP
AN
Y A
GE
NO. STATEMENTS/QUESTIONS PARAMETER
Q36 The formula of remuneration for directors and commissioners in a subsidiary should follow the same scheme as the parent company
X2 15.11 38.96 DF 4 24 P-VALUE 0.00 0.03
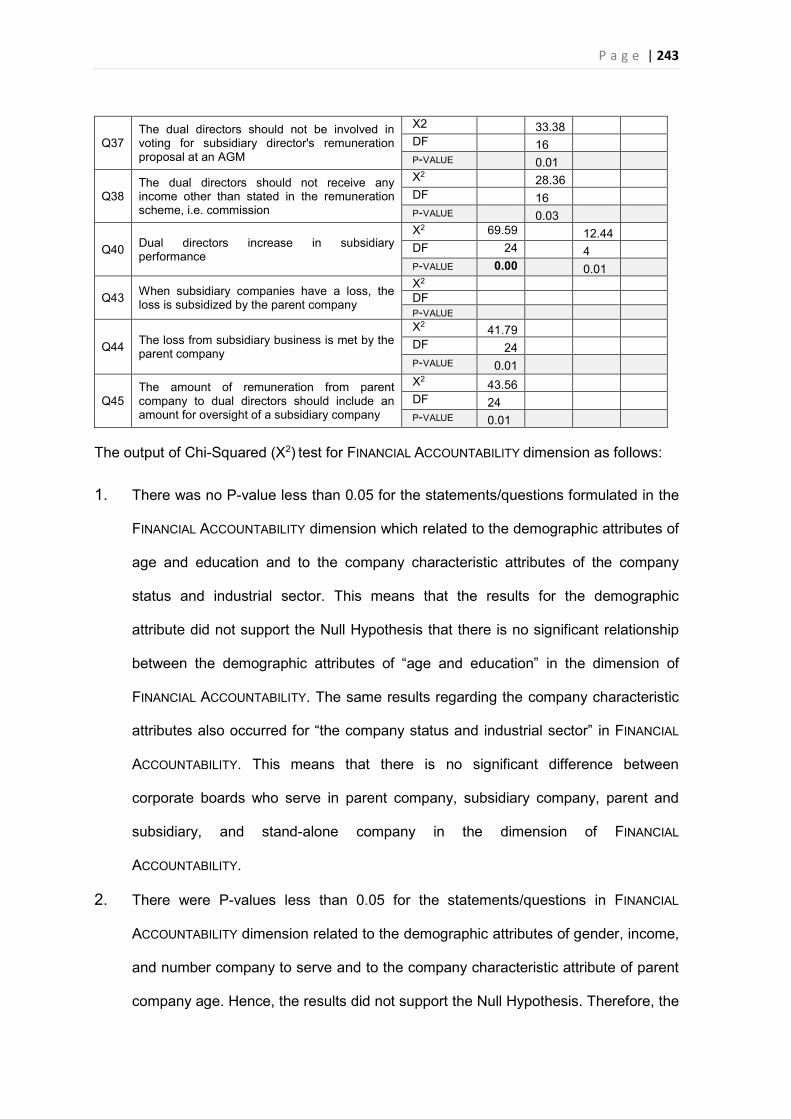
P a g e | 243
Q37 The dual directors should not be involved in voting for subsidiary director's remuneration proposal at an AGM
X2 33.38 DF 16 P-VALUE 0.01
Q38 The dual directors should not receive any income other than stated in the remuneration scheme, i.e. commission
X2 28.36 DF 16 P-VALUE 0.03
Q40 Dual directors increase in subsidiary performance
X2 69.59 12.44 DF 24 4 P-VALUE 0.00 0.01
Q43 When subsidiary companies have a loss, the loss is subsidized by the parent company
X2 DF P-VALUE
Q44 The loss from subsidiary business is met by the parent company
X2 41.79 DF 24 P-VALUE 0.01
Q45 The amount of remuneration from parent company to dual directors should include an amount for oversight of a subsidiary company
X2 43.56 DF 24 P-VALUE 0.01
The output of Chi-Squared (X2) test for FINANCIAL ACCOUNTABILITY dimension as follows:
1. There was no P-value less than 0.05 for the statements/questions formulated in the
FINANCIAL ACCOUNTABILITY dimension which related to the demographic attributes of
age and education and to the company characteristic attributes of the company
status and industrial sector. This means that the results for the demographic
attribute did not support the Null Hypothesis that there is no significant relationship
between the demographic attributes of “age and education” in the dimension of
FINANCIAL ACCOUNTABILITY. The same results regarding the company characteristic
attributes also occurred for “the company status and industrial sector” in FINANCIAL
ACCOUNTABILITY. This means that there is no significant difference between
corporate boards who serve in parent company, subsidiary company, parent and
subsidiary, and stand-alone company in the dimension of FINANCIAL
ACCOUNTABILITY.
2. There were P-values less than 0.05 for the statements/questions in FINANCIAL
ACCOUNTABILITY dimension related to the demographic attributes of gender, income,
and number company to serve and to the company characteristic attribute of parent
company age. Hence, the results did not support the Null Hypothesis. Therefore, the
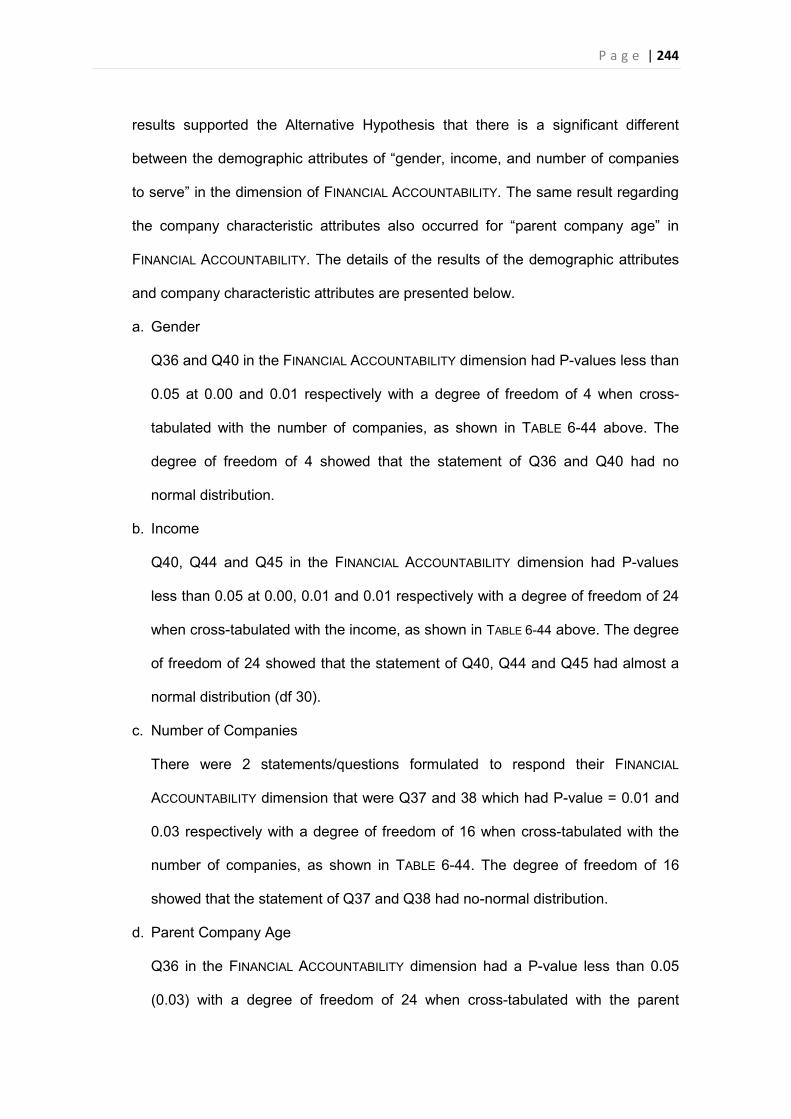
P a g e | 244
results supported the Alternative Hypothesis that there is a significant different
between the demographic attributes of “gender, income, and number of companies
to serve” in the dimension of FINANCIAL ACCOUNTABILITY. The same result regarding
the company characteristic attributes also occurred for “parent company age” in
FINANCIAL ACCOUNTABILITY. The details of the results of the demographic attributes
and company characteristic attributes are presented below.
a. Gender
Q36 and Q40 in the FINANCIAL ACCOUNTABILITY dimension had P-values less than
0.05 at 0.00 and 0.01 respectively with a degree of freedom of 4 when cross-
tabulated with the number of companies, as shown in TABLE 6-44 above. The
degree of freedom of 4 showed that the statement of Q36 and Q40 had no
normal distribution.
b. Income
Q40, Q44 and Q45 in the FINANCIAL ACCOUNTABILITY dimension had P-values
less than 0.05 at 0.00, 0.01 and 0.01 respectively with a degree of freedom of 24
when cross-tabulated with the income, as shown in TABLE 6-44 above. The degree
of freedom of 24 showed that the statement of Q40, Q44 and Q45 had almost a
normal distribution (df 30).
c. Number of Companies
There were 2 statements/questions formulated to respond their FINANCIAL
ACCOUNTABILITY dimension that were Q37 and 38 which had P-value = 0.01 and
0.03 respectively with a degree of freedom of 16 when cross-tabulated with the
number of companies, as shown in TABLE 6-44. The degree of freedom of 16
showed that the statement of Q37 and Q38 had no-normal distribution.
d. Parent Company Age
Q36 in the FINANCIAL ACCOUNTABILITY dimension had a P-value less than 0.05
(0.03) with a degree of freedom of 24 when cross-tabulated with the parent
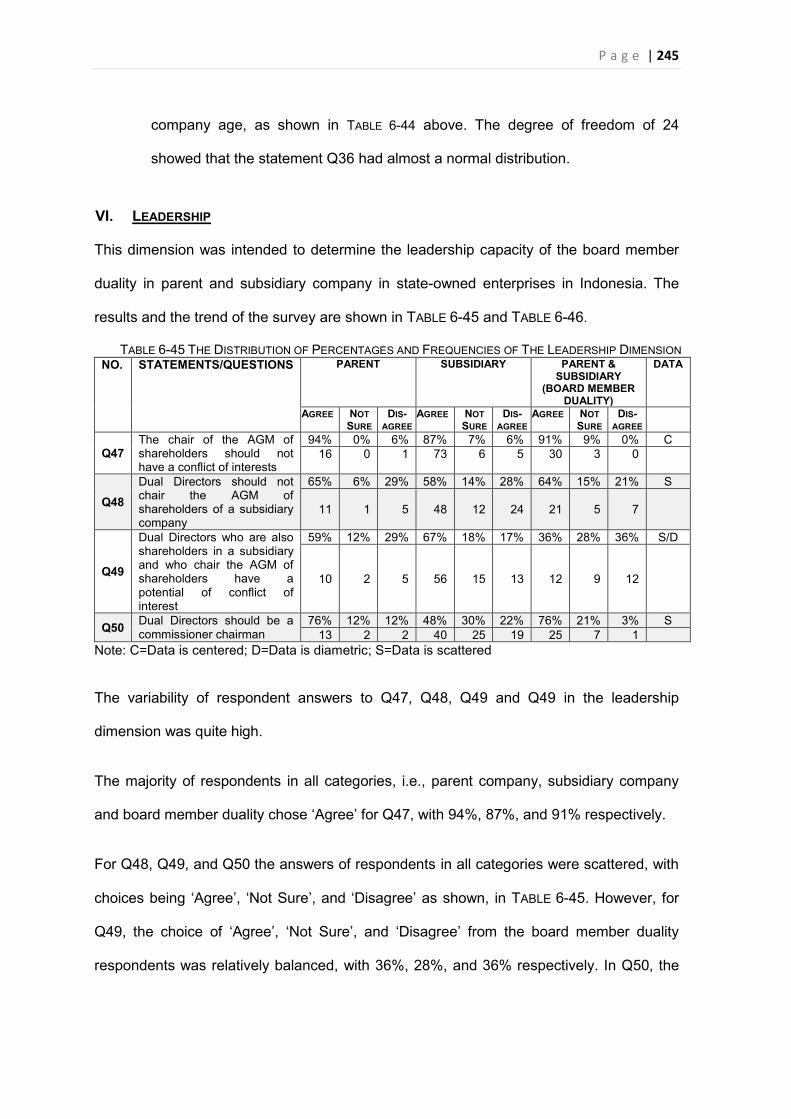
P a g e | 245
company age, as shown in TABLE 6-44 above. The degree of freedom of 24
showed that the statement Q36 had almost a normal distribution.
VI. LEADERSHIP
This dimension was intended to determine the leadership capacity of the board member
duality in parent and subsidiary company in state-owned enterprises in Indonesia. The
results and the trend of the survey are shown in TABLE 6-45 and TABLE 6-46.
TABLE 6-45 THE DISTRIBUTION OF PERCENTAGES AND FREQUENCIES OF THE LEADERSHIP DIMENSION NO. STATEMENTS/QUESTIONS PARENT SUBSIDIARY PARENT &
SUBSIDIARY (BOARD MEMBER
DUALITY)
DATA
AGREE NOT SURE
DIS-AGREE
AGREE NOT SURE
DIS-AGREE
AGREE NOT SURE
DIS-AGREE
Q47 The chair of the AGM of shareholders should not have a conflict of interests
94% 0% 6% 87% 7% 6% 91% 9% 0% C 16 0 1 73 6 5 30 3 0
Q48 Dual Directors should not chair the AGM of shareholders of a subsidiary company
65% 6% 29% 58% 14% 28% 64% 15% 21% S
11 1 5 48 12 24 21 5 7
Q49
Dual Directors who are also shareholders in a subsidiary and who chair the AGM of shareholders have a potential of conflict of interest
59% 12% 29% 67% 18% 17% 36% 28% 36% S/D
10 2 5 56 15 13 12 9 12
Q50 Dual Directors should be a commissioner chairman
76% 12% 12% 48% 30% 22% 76% 21% 3% S 13 2 2 40 25 19 25 7 1
Note: C=Data is centered; D=Data is diametric; S=Data is scattered
The variability of respondent answers to Q47, Q48, Q49 and Q49 in the leadership
dimension was quite high.
The majority of respondents in all categories, i.e., parent company, subsidiary company
and board member duality chose ‘Agree’ for Q47, with 94%, 87%, and 91% respectively.
For Q48, Q49, and Q50 the answers of respondents in all categories were scattered, with
choices being ‘Agree’, ‘Not Sure’, and ‘Disagree’ as shown, in TABLE 6-45. However, for
Q49, the choice of ‘Agree’, ‘Not Sure’, and ‘Disagree’ from the board member duality
respondents was relatively balanced, with 36%, 28%, and 36% respectively. In Q50, the
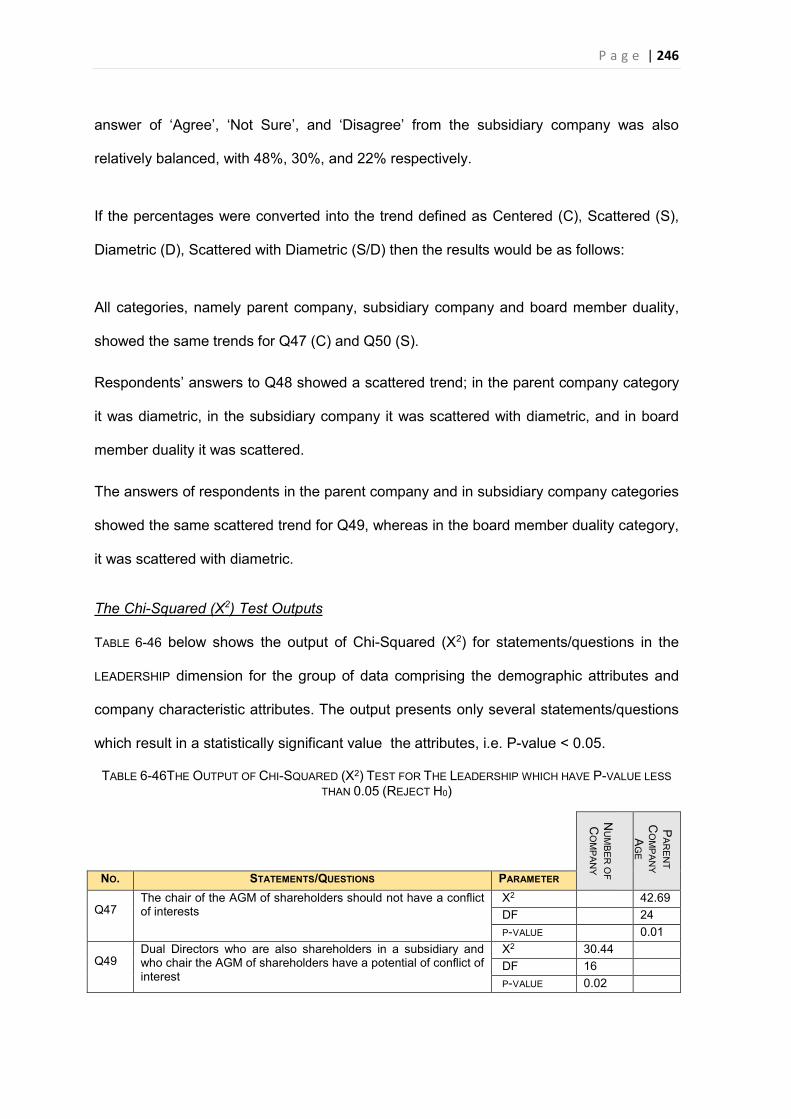
P a g e | 246
answer of ‘Agree’, ‘Not Sure’, and ‘Disagree’ from the subsidiary company was also
relatively balanced, with 48%, 30%, and 22% respectively.
If the percentages were converted into the trend defined as Centered (C), Scattered (S),
Diametric (D), Scattered with Diametric (S/D) then the results would be as follows:
All categories, namely parent company, subsidiary company and board member duality,
showed the same trends for Q47 (C) and Q50 (S).
Respondents’ answers to Q48 showed a scattered trend; in the parent company category
it was diametric, in the subsidiary company it was scattered with diametric, and in board
member duality it was scattered.
The answers of respondents in the parent company and in subsidiary company categories
showed the same scattered trend for Q49, whereas in the board member duality category,
it was scattered with diametric.
The Chi-Squared (X2) Test Outputs
TABLE 6-46 below shows the output of Chi-Squared (X2) for statements/questions in the
LEADERSHIP dimension for the group of data comprising the demographic attributes and
company characteristic attributes. The output presents only several statements/questions
which result in a statistically significant value the attributes, i.e. P-value < 0.05.
TABLE 6-46THE OUTPUT OF CHI-SQUARED (X2) TEST FOR THE LEADERSHIP WHICH HAVE P-VALUE LESS THAN 0.05 (REJECT H0)
NU
MB
ER
OF
CO
MP
AN
Y
PA
RE
NT
CO
MP
AN
Y
AG
E
NO. STATEMENTS/QUESTIONS PARAMETER
Q47 The chair of the AGM of shareholders should not have a conflict of interests
X2 42.69 DF 24 P-VALUE 0.01
Q49 Dual Directors who are also shareholders in a subsidiary and who chair the AGM of shareholders have a potential of conflict of interest
X2 30.44 DF 16 P-VALUE 0.02
P a g e | 247
The output of the Chi-Squared (X2) test for the LEADERSHIP dimension is as follows:
1. There was no P-value <0.05 for the statements/questions in the dimension of
LEADERSHIP which applied to the demographic attributes of gender, age, education
and income and to the company characteristic attributes of the company status and
industrial sector. This means that the results support the Null Hypothesis that there
is no significant difference between the demographic attributes of “gender, age,
education and income” in the dimension of LEADERSHIP. The same results were
obtained for the company characteristic attributes of “the company status and
industrial sector” in the LEADERSHIP DIMENSION. This means that there is no
significant difference between corporate boards who serve in parent company,
subsidiary company, parent and subsidiary, and stand-alone company in the
dimension of LEADERSHIP.
2. There were P-values < 0.05 for the statements/questions in the dimension of
LEADERSHIP which were tested for the demographic attribute of number companies
to serve and the company characteristic attribute of parent company age. This
means that the results did not support the Null Hypothesis. Therefore, the
Alternative Hypothesis was accepted: that there is significant relationship between
the demographic attribute of number of companies to serve and the company
characteristic attributes of age of the parent company in the LEADERSHIP DIMENSION.
The details of the result of company characteristic attributes are presented below.
a. Number of company to serve
Q49 in the LEADERSHIP dimension had a P-value of < 0.05 with degree of
freedom of 16 when cross-tabulated with the number of companies, as shown in
TABLE 6-46 above. The degree of freedom of 16 showed that Q49 had no normal
distribution.
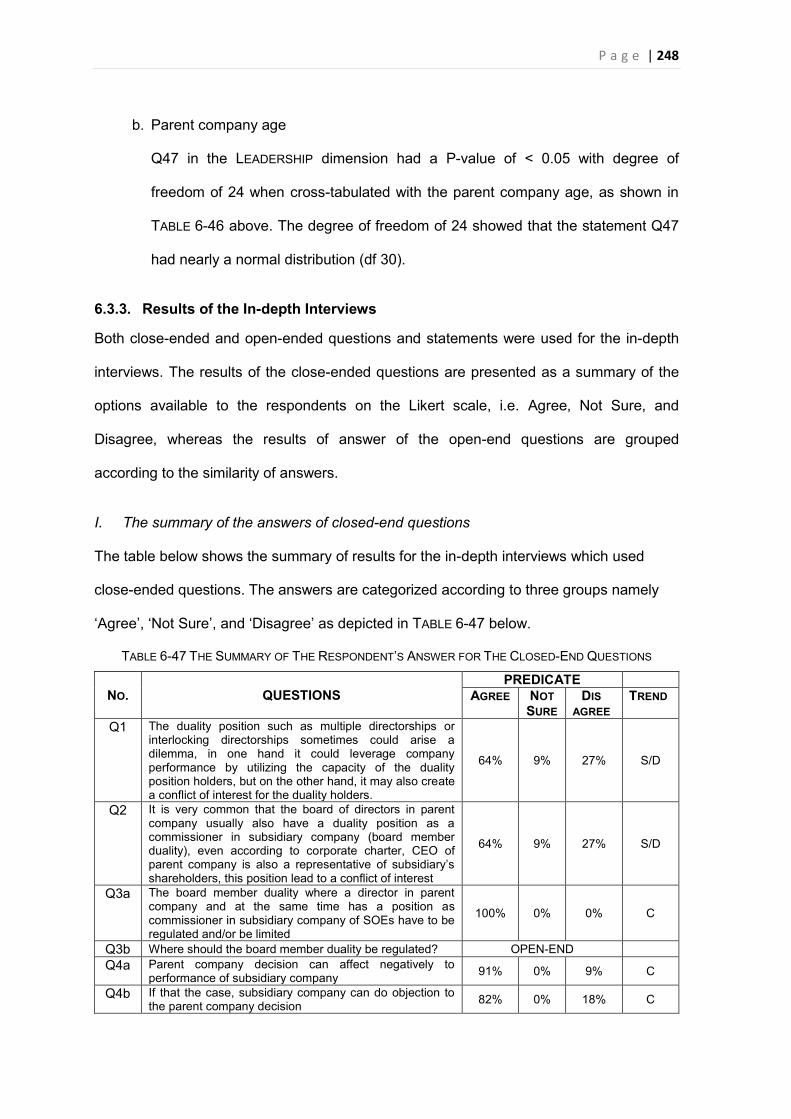
P a g e | 248
b. Parent company age
Q47 in the LEADERSHIP dimension had a P-value of < 0.05 with degree of
freedom of 24 when cross-tabulated with the parent company age, as shown in
TABLE 6-46 above. The degree of freedom of 24 showed that the statement Q47
had nearly a normal distribution (df 30).
6.3.3. Results of the In-depth Interviews
Both close-ended and open-ended questions and statements were used for the in-depth
interviews. The results of the close-ended questions are presented as a summary of the
options available to the respondents on the Likert scale, i.e. Agree, Not Sure, and
Disagree, whereas the results of answer of the open-end questions are grouped
according to the similarity of answers.
I. The summary of the answers of closed-end questions
The table below shows the summary of results for the in-depth interviews which used
close-ended questions. The answers are categorized according to three groups namely
‘Agree’, ‘Not Sure’, and ‘Disagree’ as depicted in TABLE 6-47 below.
TABLE 6-47 THE SUMMARY OF THE RESPONDENT’S ANSWER FOR THE CLOSED-END QUESTIONS
NO. QUESTIONS PREDICATE
AGREE NOT SURE
DIS AGREE
TREND
Q1 The duality position such as multiple directorships or interlocking directorships sometimes could arise a dilemma, in one hand it could leverage company performance by utilizing the capacity of the duality position holders, but on the other hand, it may also create a conflict of interest for the duality holders.
64% 9% 27% S/D
Q2 It is very common that the board of directors in parent company usually also have a duality position as a commissioner in subsidiary company (board member duality), even according to corporate charter, CEO of parent company is also a representative of subsidiary’s shareholders, this position lead to a conflict of interest
64% 9% 27% S/D
Q3a The board member duality where a director in parent company and at the same time has a position as commissioner in subsidiary company of SOEs have to be regulated and/or be limited
100% 0% 0% C
Q3b Where should the board member duality be regulated? OPEN-END Q4a Parent company decision can affect negatively to
performance of subsidiary company 91% 0% 9% C
Q4b If that the case, subsidiary company can do objection to the parent company decision 82% 0% 18% C
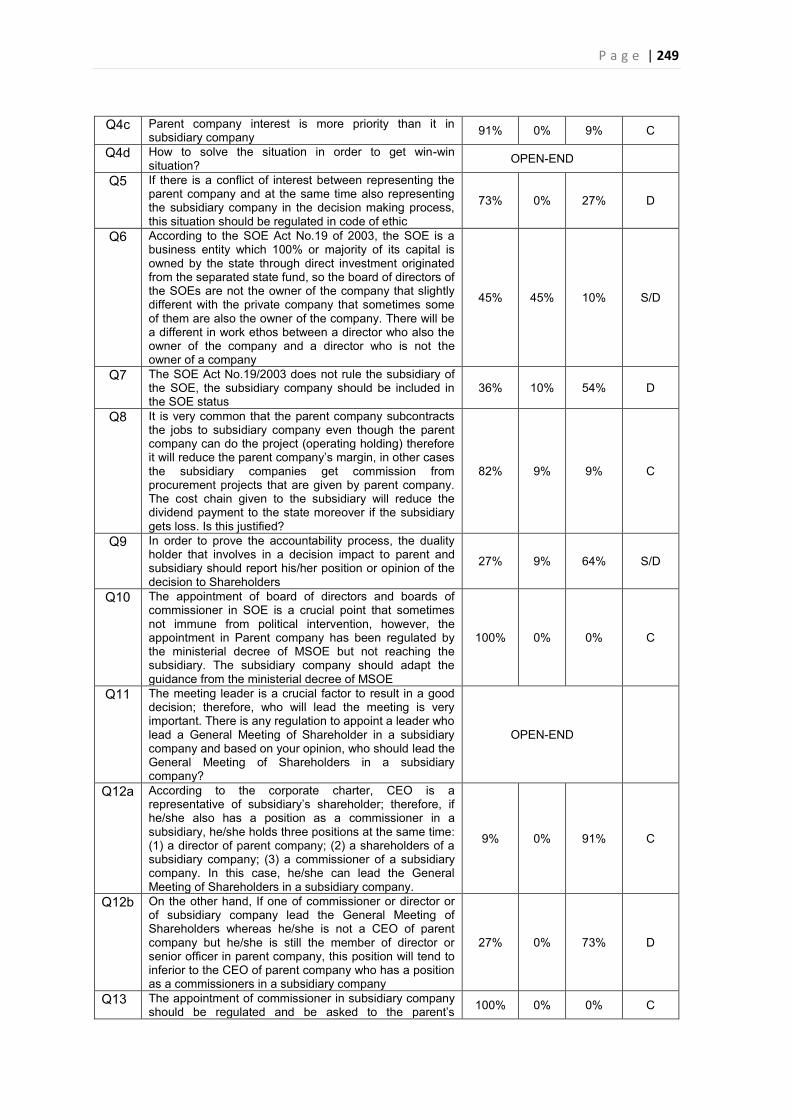
P a g e | 249
Q4c Parent company interest is more priority than it in subsidiary company 91% 0% 9% C
Q4d How to solve the situation in order to get win-win situation? OPEN-END
Q5 If there is a conflict of interest between representing the parent company and at the same time also representing the subsidiary company in the decision making process, this situation should be regulated in code of ethic
73% 0% 27% D
Q6 According to the SOE Act No.19 of 2003, the SOE is a business entity which 100% or majority of its capital is owned by the state through direct investment originated from the separated state fund, so the board of directors of the SOEs are not the owner of the company that slightly different with the private company that sometimes some of them are also the owner of the company. There will be a different in work ethos between a director who also the owner of the company and a director who is not the owner of a company
45% 45% 10% S/D
Q7 The SOE Act No.19/2003 does not rule the subsidiary of the SOE, the subsidiary company should be included in the SOE status
36% 10% 54% D
Q8 It is very common that the parent company subcontracts the jobs to subsidiary company even though the parent company can do the project (operating holding) therefore it will reduce the parent company’s margin, in other cases the subsidiary companies get commission from procurement projects that are given by parent company. The cost chain given to the subsidiary will reduce the dividend payment to the state moreover if the subsidiary gets loss. Is this justified?
82% 9% 9% C
Q9 In order to prove the accountability process, the duality holder that involves in a decision impact to parent and subsidiary should report his/her position or opinion of the decision to Shareholders
27% 9% 64% S/D
Q10 The appointment of board of directors and boards of commissioner in SOE is a crucial point that sometimes not immune from political intervention, however, the appointment in Parent company has been regulated by the ministerial decree of MSOE but not reaching the subsidiary. The subsidiary company should adapt the guidance from the ministerial decree of MSOE
100% 0% 0% C
Q11 The meeting leader is a crucial factor to result in a good decision; therefore, who will lead the meeting is very important. There is any regulation to appoint a leader who lead a General Meeting of Shareholder in a subsidiary company and based on your opinion, who should lead the General Meeting of Shareholders in a subsidiary company?
OPEN-END
Q12a According to the corporate charter, CEO is a representative of subsidiary’s shareholder; therefore, if he/she also has a position as a commissioner in a subsidiary, he/she holds three positions at the same time: (1) a director of parent company; (2) a shareholders of a subsidiary company; (3) a commissioner of a subsidiary company. In this case, he/she can lead the General Meeting of Shareholders in a subsidiary company.
9% 0% 91% C
Q12b On the other hand, If one of commissioner or director or of subsidiary company lead the General Meeting of Shareholders whereas he/she is not a CEO of parent company but he/she is still the member of director or senior officer in parent company, this position will tend to inferior to the CEO of parent company who has a position as a commissioners in a subsidiary company
27% 0% 73% D
Q13 The appointment of commissioner in subsidiary company should be regulated and be asked to the parent’s 100% 0% 0% C
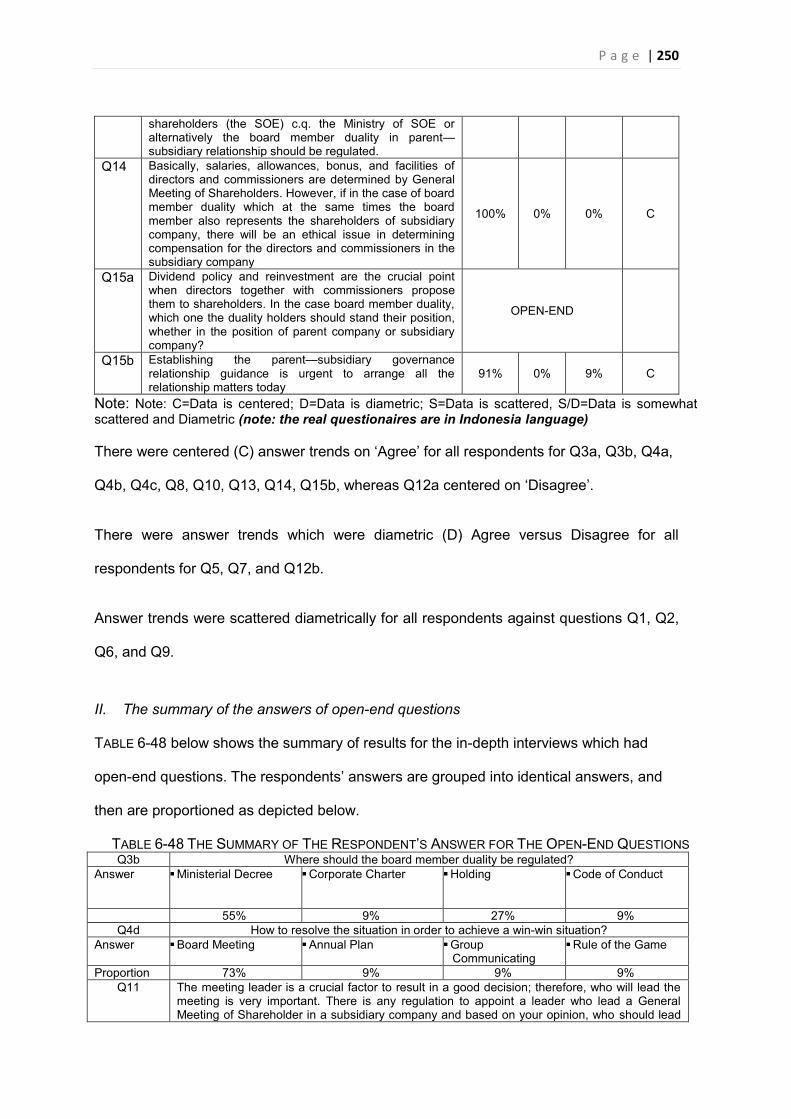
P a g e | 250
shareholders (the SOE) c.q. the Ministry of SOE or alternatively the board member duality in parent—subsidiary relationship should be regulated.
Q14 Basically, salaries, allowances, bonus, and facilities of directors and commissioners are determined by General Meeting of Shareholders. However, if in the case of board member duality which at the same times the board member also represents the shareholders of subsidiary company, there will be an ethical issue in determining compensation for the directors and commissioners in the subsidiary company
100% 0% 0% C
Q15a Dividend policy and reinvestment are the crucial point when directors together with commissioners propose them to shareholders. In the case board member duality, which one the duality holders should stand their position, whether in the position of parent company or subsidiary company?
OPEN-END
Q15b Establishing the parent—subsidiary governance relationship guidance is urgent to arrange all the relationship matters today
91% 0% 9% C
Note: Note: C=Data is centered; D=Data is diametric; S=Data is scattered, S/D=Data is somewhat scattered and Diametric (note: the real questionaires are in Indonesia language)
There were centered (C) answer trends on ‘Agree’ for all respondents for Q3a, Q3b, Q4a,
Q4b, Q4c, Q8, Q10, Q13, Q14, Q15b, whereas Q12a centered on ‘Disagree’.
There were answer trends which were diametric (D) Agree versus Disagree for all
respondents for Q5, Q7, and Q12b.
Answer trends were scattered diametrically for all respondents against questions Q1, Q2,
Q6, and Q9.
II. The summary of the answers of open-end questions
TABLE 6-48 below shows the summary of results for the in-depth interviews which had
open-end questions. The respondents’ answers are grouped into identical answers, and
then are proportioned as depicted below.
TABLE 6-48 THE SUMMARY OF THE RESPONDENT’S ANSWER FOR THE OPEN-END QUESTIONS Q3b Where should the board member duality be regulated?
Answer � Ministerial Decree � Corporate Charter � Holding � Code of Conduct
55% 9% 27% 9% Q4d How to resolve the situation in order to achieve a win-win situation?
Answer � Board Meeting � Annual Plan � Group Communicating
� Rule of the Game
Proportion 73% 9% 9% 9% Q11 The meeting leader is a crucial factor to result in a good decision; therefore, who will lead the
meeting is very important. There is any regulation to appoint a leader who lead a General Meeting of Shareholder in a subsidiary company and based on your opinion, who should lead
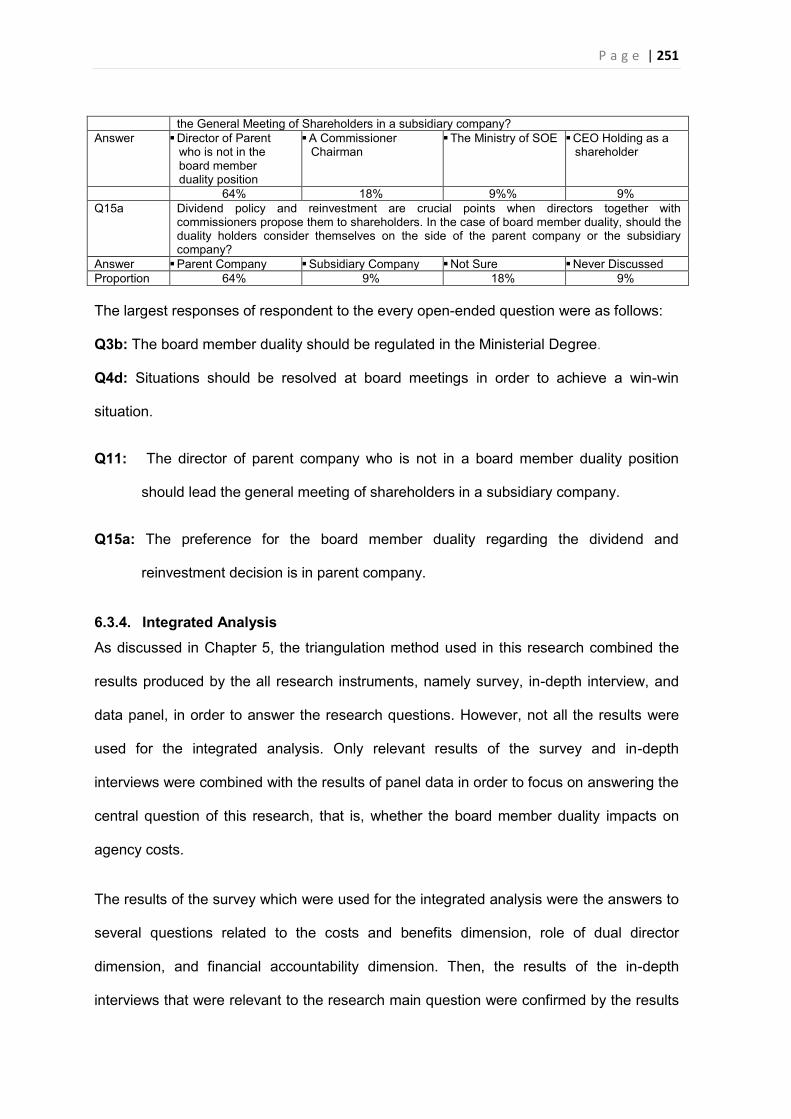
P a g e | 251
the General Meeting of Shareholders in a subsidiary company? Answer � Director of Parent
who is not in the board member duality position
� A Commissioner Chairman
� The Ministry of SOE � CEO Holding as a shareholder
64% 18% 9%% 9% Q15a Dividend policy and reinvestment are crucial points when directors together with
commissioners propose them to shareholders. In the case of board member duality, should the duality holders consider themselves on the side of the parent company or the subsidiary company?
Answer � Parent Company � Subsidiary Company � Not Sure � Never Discussed Proportion 64% 9% 18% 9%
The largest responses of respondent to the every open-ended question were as follows:
Q3b: The board member duality should be regulated in the Ministerial Degree.
Q4d: Situations should be resolved at board meetings in order to achieve a win-win
situation.
Q11: The director of parent company who is not in a board member duality position
should lead the general meeting of shareholders in a subsidiary company.
Q15a: The preference for the board member duality regarding the dividend and
reinvestment decision is in parent company.
6.3.4. Integrated Analysis As discussed in Chapter 5, the triangulation method used in this research combined the
results produced by the all research instruments, namely survey, in-depth interview, and
data panel, in order to answer the research questions. However, not all the results were
used for the integrated analysis. Only relevant results of the survey and in-depth
interviews were combined with the results of panel data in order to focus on answering the
central question of this research, that is, whether the board member duality impacts on
agency costs.
The results of the survey which were used for the integrated analysis were the answers to
several questions related to the costs and benefits dimension, role of dual director
dimension, and financial accountability dimension. Then, the results of the in-depth
interviews that were relevant to the research main question were confirmed by the results
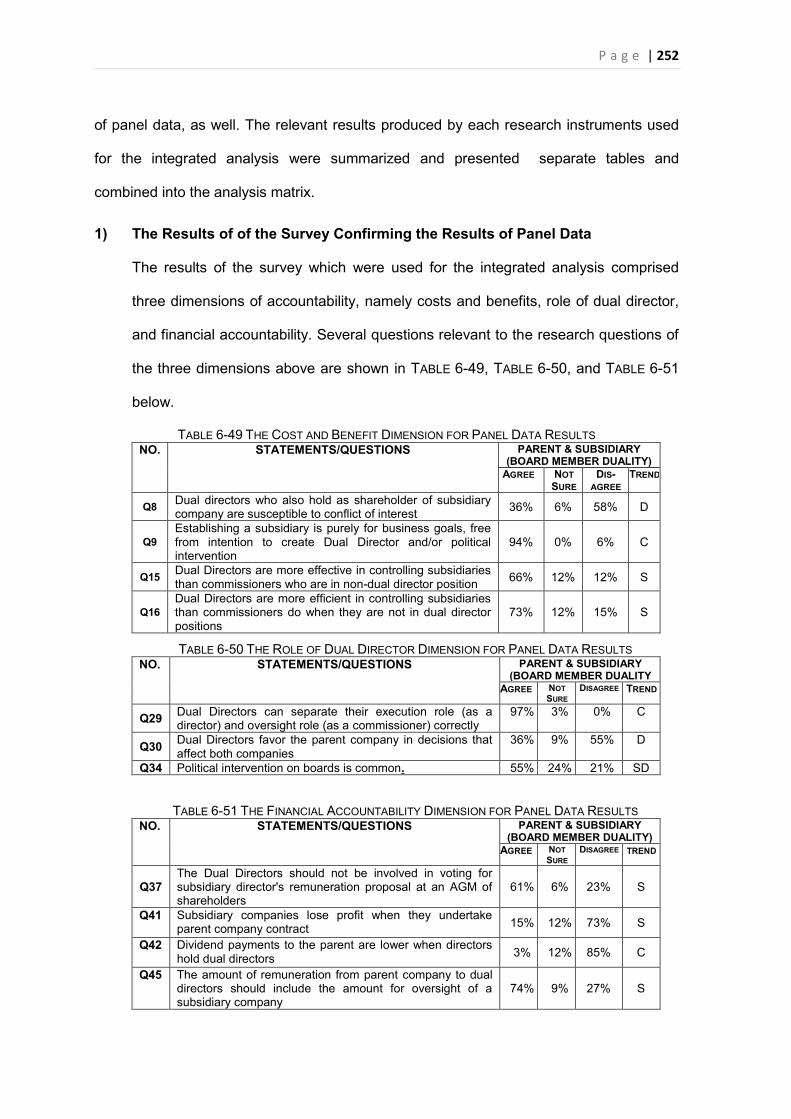
P a g e | 252
of panel data, as well. The relevant results produced by each research instruments used
for the integrated analysis were summarized and presented separate tables and
combined into the analysis matrix.
1) The Results of of the Survey Confirming the Results of Panel Data
The results of the survey which were used for the integrated analysis comprised
three dimensions of accountability, namely costs and benefits, role of dual director,
and financial accountability. Several questions relevant to the research questions of
the three dimensions above are shown in TABLE 6-49, TABLE 6-50, and TABLE 6-51
below.
TABLE 6-49 THE COST AND BENEFIT DIMENSION FOR PANEL DATA RESULTS NO. STATEMENTS/QUESTIONS PARENT & SUBSIDIARY
(BOARD MEMBER DUALITY) AGREE NOT
SURE DIS-
AGREE TREND
Q8 Dual directors who also hold as shareholder of subsidiary company are susceptible to conflict of interest 36% 6% 58% D
Q9 Establishing a subsidiary is purely for business goals, free from intention to create Dual Director and/or political intervention
94% 0% 6% C
Q15 Dual Directors are more effective in controlling subsidiaries than commissioners who are in non-dual director position 66% 12% 12% S
Q16 Dual Directors are more efficient in controlling subsidiaries than commissioners do when they are not in dual director positions
73% 12% 15% S
TABLE 6-50 THE ROLE OF DUAL DIRECTOR DIMENSION FOR PANEL DATA RESULTS NO. STATEMENTS/QUESTIONS PARENT & SUBSIDIARY
(BOARD MEMBER DUALITY AGREE NOT
SURE DISAGREE TREND
Q29 Dual Directors can separate their execution role (as a director) and oversight role (as a commissioner) correctly
97% 3% 0% C
Q30 Dual Directors favor the parent company in decisions that affect both companies
36% 9% 55% D
Q34 Political intervention on boards is common. 55% 24% 21% SD
TABLE 6-51 THE FINANCIAL ACCOUNTABILITY DIMENSION FOR PANEL DATA RESULTS NO. STATEMENTS/QUESTIONS PARENT & SUBSIDIARY
(BOARD MEMBER DUALITY) AGREE NOT
SURE DISAGREE TREND
Q37 The Dual Directors should not be involved in voting for subsidiary director's remuneration proposal at an AGM of shareholders
61% 6% 23% S
Q41 Subsidiary companies lose profit when they undertake parent company contract 15% 12% 73% S
Q42 Dividend payments to the parent are lower when directors hold dual directors 3% 12% 85% C
Q45 The amount of remuneration from parent company to dual directors should include the amount for oversight of a subsidiary company
74% 9% 27% S
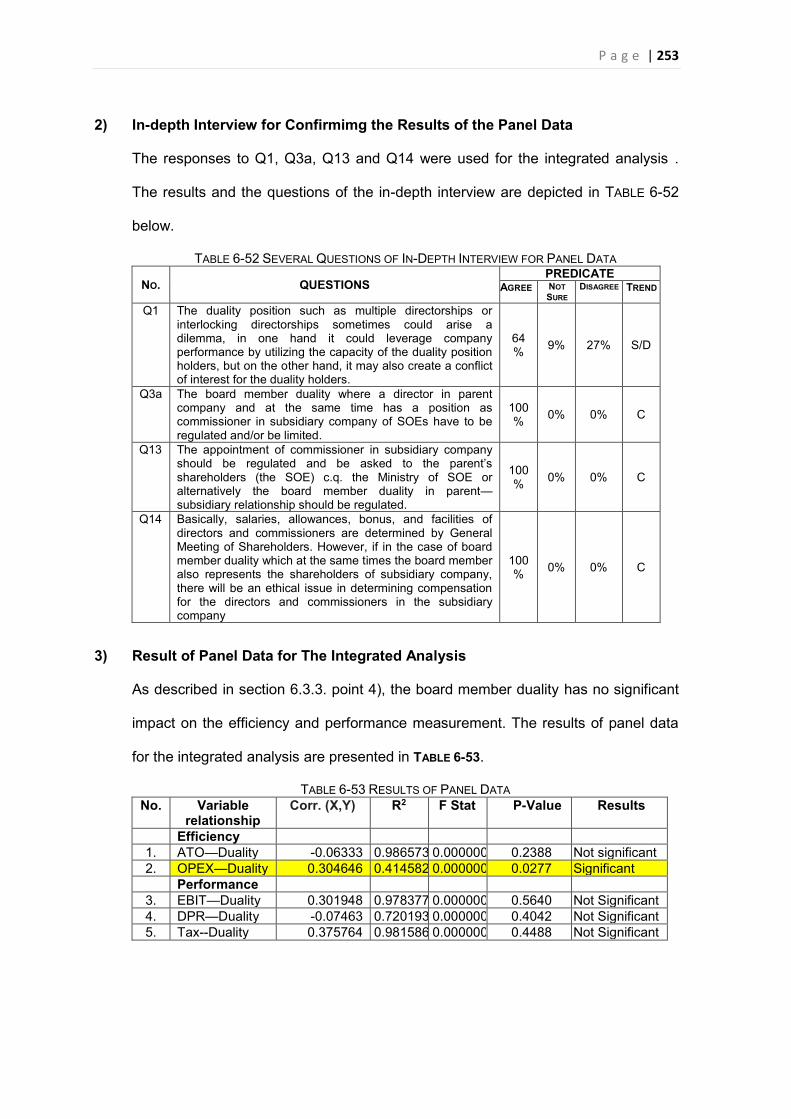
P a g e | 253
2) In-depth Interview for Confirmimg the Results of the Panel Data
The responses to Q1, Q3a, Q13 and Q14 were used for the integrated analysis .
The results and the questions of the in-depth interview are depicted in TABLE 6-52
below.
TABLE 6-52 SEVERAL QUESTIONS OF IN-DEPTH INTERVIEW FOR PANEL DATA
NO. QUESTIONS PREDICATE
AGREE NOT SURE
DISAGREE TREND
Q1 The duality position such as multiple directorships or interlocking directorships sometimes could arise a dilemma, in one hand it could leverage company performance by utilizing the capacity of the duality position holders, but on the other hand, it may also create a conflict of interest for the duality holders.
64% 9% 27% S/D
Q3a The board member duality where a director in parent company and at the same time has a position as commissioner in subsidiary company of SOEs have to be regulated and/or be limited.
100% 0% 0% C
Q13 The appointment of commissioner in subsidiary company should be regulated and be asked to the parent’s shareholders (the SOE) c.q. the Ministry of SOE or alternatively the board member duality in parent—subsidiary relationship should be regulated.
100% 0% 0% C
Q14 Basically, salaries, allowances, bonus, and facilities of directors and commissioners are determined by General Meeting of Shareholders. However, if in the case of board member duality which at the same times the board member also represents the shareholders of subsidiary company, there will be an ethical issue in determining compensation for the directors and commissioners in the subsidiary company
100% 0% 0% C
3) Result of Panel Data for The Integrated Analysis
As described in section 6.3.3. point 4), the board member duality has no significant
impact on the efficiency and performance measurement. The results of panel data
for the integrated analysis are presented in TABLE 6-53.
TABLE 6-53 RESULTS OF PANEL DATA No. Variable
relationship Corr. (X,Y) R2 F Stat P-Value Results
Efficiency 1. ATO—Duality -0.06333 0.986573 0.000000 0.2388 Not significant 2. OPEX—Duality 0.304646 0.414582 0.000000 0.0277 Significant Performance
3. EBIT—Duality 0.301948 0.978377 0.000000 0.5640 Not Significant 4. DPR—Duality -0.07463 0.720193 0.000000 0.4042 Not Significant 5. Tax--Duality 0.375764 0.981586 0.000000 0.4488 Not Significant
P a g e | 254
4) Matrix of Integrated Analysis
The matrix of integrated analysis was a matrix that combined the relevant
information produced by the research instruments of survey, in-depth interviews,
and panel data. This method was part of the triangulation method discussed in
Chapter 5. The results of the panel data were used for designing the integrated
matrix analysis. The results from the survey and in-depth interviews were then used
to confirm the results of the panel data inputed in the integrated matrix analysis.
The results of the panel data which present the correlation between the board
member duality and dependent variables, p-value of the board member duality from
the panel data regression model, and the level of significance of the board member
duality in the panel regression model aresummarized in Table 6-49.
The survey results for the dimension of the costs and benefits associated with board
member duality were taken from responses to questions. The questions were Q8,
Q9, Q15, and Q16. These procedures also were applied for the dimension of the
role of dual director, i.e. questions Q29, Q30, and Q34, and the dimension of
financial accountability, i.e. questions Q37, Q41, Q42, and Q45.
All the results of the survey were denoted by C, I, or S. The C stands for Consistent,
meaning that the results of the survey were consistent with the results of the panel
data regression model. The 'I' stands for Inconsistent, meaning that the results of
the survey were consistent with the results of the panel data regression model. The
S stands for Scattered, meaning that the results of the survey were neither
consistent nor inconsistent with the results of the panel data regression model.
These procedures were also applied to the results of the in-depth interviews. The
results of the survey and in-depth interviews chosen for the matrix of integrated
analysis are summarized in Table 6-49.
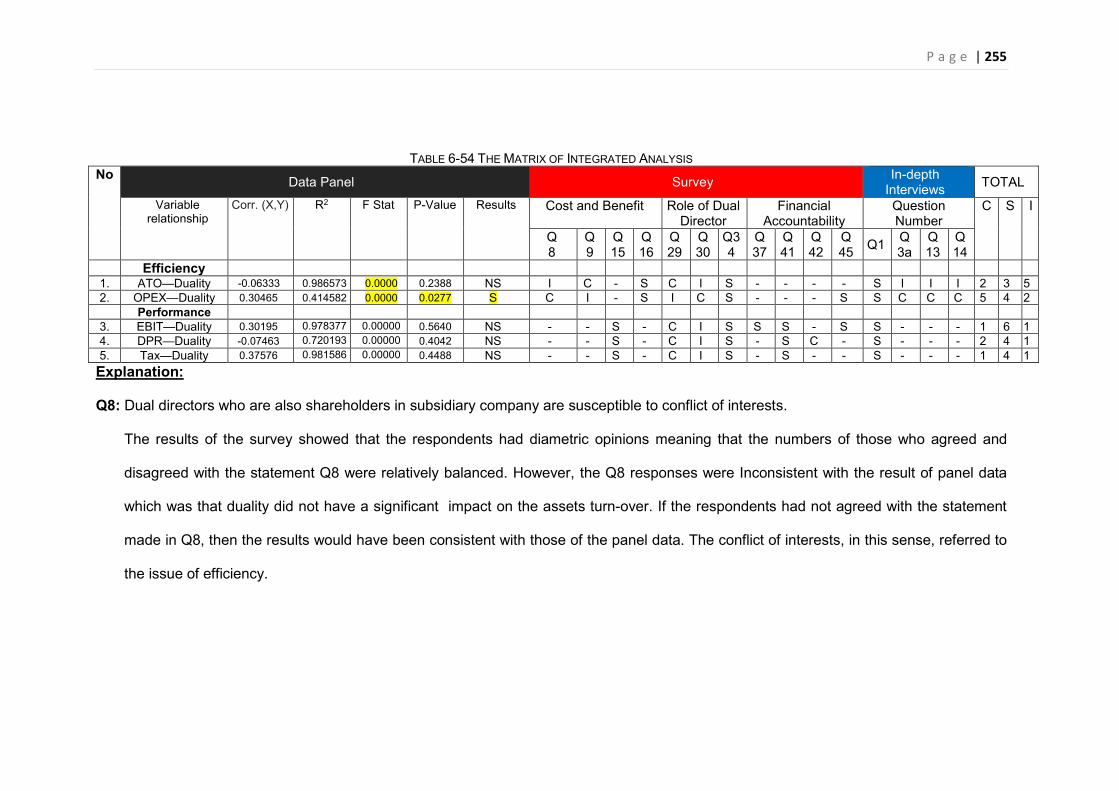
P a g e | 255
TABLE 6-54 THE MATRIX OF INTEGRATED ANALYSIS No Data Panel Survey In-depth
Interviews TOTAL
Variable relationship
Corr. (X,Y) R2 F Stat P-Value Results Cost and Benefit Role of Dual Director
Financial Accountability
Question Number
C S I
Q 8
Q9
Q15
Q16
Q29
Q30
Q34
Q37
Q41
Q42
Q 45 Q1 Q
3a Q 13
Q 14
Efficiency 1. ATO—Duality -0.06333 0.986573 0.0000 0.2388 NS I C - S C I S - - - - S I I I 2 3 5 2. OPEX—Duality 0.30465 0.414582 0.0000 0.0277 S C I - S I C S - - - S S C C C 5 4 2 Performance
3. EBIT—Duality 0.30195 0.978377 0.00000 0.5640 NS - - S - C I S S S - S S - - - 1 6 1 4. DPR—Duality -0.07463 0.720193 0.00000 0.4042 NS - - S - C I S - S C - S - - - 2 4 1 5. Tax—Duality 0.37576 0.981586 0.00000 0.4488 NS - - S - C I S - S - - S - - - 1 4 1 Explanation:
Q8: Dual directors who are also shareholders in subsidiary company are susceptible to conflict of interests.
The results of the survey showed that the respondents had diametric opinions meaning that the numbers of those who agreed and
disagreed with the statement Q8 were relatively balanced. However, the Q8 responses were Inconsistent with the result of panel data
which was that duality did not have a significant impact on the assets turn-over. If the respondents had not agreed with the statement
made in Q8, then the results would have been consistent with those of the panel data. The conflict of interests, in this sense, referred to
the issue of efficiency.
P a g e | 256
Q9: Establishing a subsidiary is purely for business goals, not intended to create dual
director positions and/or to enable political intervention.
The results of the survey showed that the participants’ responses to Q9 centered on “Agree”
which means that it was consistent with the result of panel data: that the duality was not
significant to asset turn-over, but it was inconsistent with that of operating expenses. Here,
political intervention is related to the efficiency issue.
Q15: Dual Directors are more effective in controlling subsidiaries than commissioners who
are in non-dual director positions.
The results of the survey showed that the respondents’ responses to Q15 were scattered,
which means that it could not be decided whether they were consistent or not consistent with
the results of the panel data. Here, ‘effective’ is related to performance.
Q16: Dual Directors are more efficient in controlling subsidiaries than commissioners are
when they are not in dual director positions.
The results of the survey showed that the respondents’ answers to Q16 were scattered
which means that there was neither consistency nor inconsistency with the panel data
results. ‘Efficient’, in this sense, referred to the issue of efficiency.
Q29: Dual Directors can effectively separate their execution role (as a director) from their
oversight role (as a commissioner).
The results of the survey showed that the respondents’ opinions regarding Q29 centered on
“Agree”, which was consistent with the results of panel data which were not significant to the
efficiency and performance variable, and inconsistent with those of operating expenses. The
execution role and oversight role were related to all efficiency and performance variables.
Q30: Dual Directors favor the parent company in decisions that affect both companies.
The results of the survey showed that the respondents had diametric opinions regarding
Q30, meaning that the numbers of those who agreed and disagreed with the statement were
P a g e | 257
relatively balanced. In this sense, the Q30 responses were Inconsistent with the results of
the panel data which indicated that duality had no significant impact on efficiency and
performance, but it was consistent in that the duality had a significant impact on the
operating expenses. In this statement, ‘affect’ referred to the issue of efficiency and
performance.
Q34: Political intervention on boards is common.
The results of the survey showed that the respondents’ opinions regarding Q34 were
scattered which means that it was indecisive whether the results were consistent or not with
the results of the panel data. Political intervention, in this sense was related to the issue of
efficiency and performance.
Q37: The Dual Directors should not be involved in voting for subsidiary directors’
remuneration proposal at an AGM of shareholders.
The results of the survey showed that the respondents’ opinions regarding Q37 were
scattered, which means that they were neither consistent nor inconsistent with the results of
the panel data. Here, involvement in voting is related to the performance issue.
Q41: Subsidiary companies lose profit when they undertake parent company contracts.
The results of the survey showed that the respondents’ opinions regarding Q41 were
scattered, which means that there was no decisive consistency or otherwise with the results
of the panel data. Remuneration, in this sense is in reference to performance.
Q42: Dividend payments to the parent are lower when directors hold dual directorships.
The result of the survey shown that the respondents’ opinion on Q42 centered on “Disagree”
which means that it was consistent with the results of the panel data which were not
significant in terms of the dividend pay-out ratio. Dividend pay-out ratio, in this sense is
related to the performance variable.
Q45: The amount of remuneration given by the parent company to dual directors should
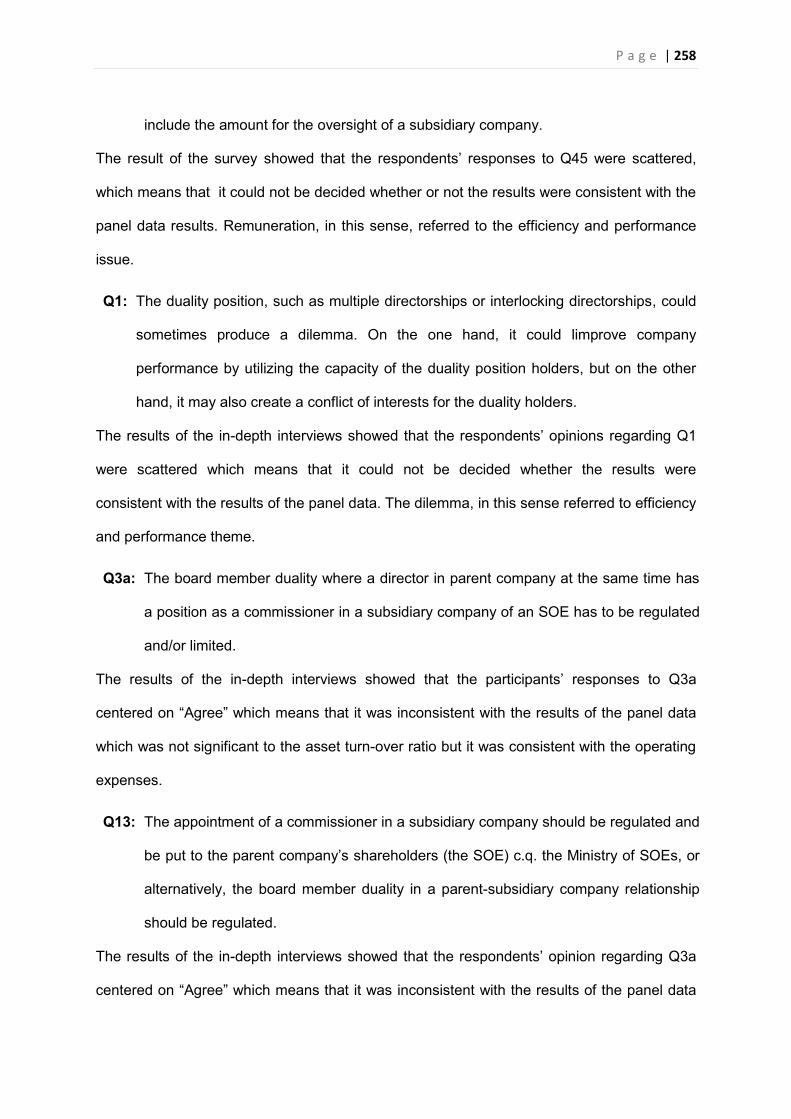
P a g e | 258
include the amount for the oversight of a subsidiary company.
The result of the survey showed that the respondents’ responses to Q45 were scattered,
which means that it could not be decided whether or not the results were consistent with the
panel data results. Remuneration, in this sense, referred to the efficiency and performance
issue.
Q1: The duality position, such as multiple directorships or interlocking directorships, could
sometimes produce a dilemma. On the one hand, it could limprove company
performance by utilizing the capacity of the duality position holders, but on the other
hand, it may also create a conflict of interests for the duality holders.
The results of the in-depth interviews showed that the respondents’ opinions regarding Q1
were scattered which means that it could not be decided whether the results were
consistent with the results of the panel data. The dilemma, in this sense referred to efficiency
and performance theme.
Q3a: The board member duality where a director in parent company at the same time has
a position as a commissioner in a subsidiary company of an SOE has to be regulated
and/or limited.
The results of the in-depth interviews showed that the participants’ responses to Q3a
centered on “Agree” which means that it was inconsistent with the results of the panel data
which was not significant to the asset turn-over ratio but it was consistent with the operating
expenses.
Q13: The appointment of a commissioner in a subsidiary company should be regulated and
be put to the parent company’s shareholders (the SOE) c.q. the Ministry of SOEs, or
alternatively, the board member duality in a parent-subsidiary company relationship
should be regulated.
The results of the in-depth interviews showed that the respondents’ opinion regarding Q3a
centered on “Agree” which means that it was inconsistent with the results of the panel data
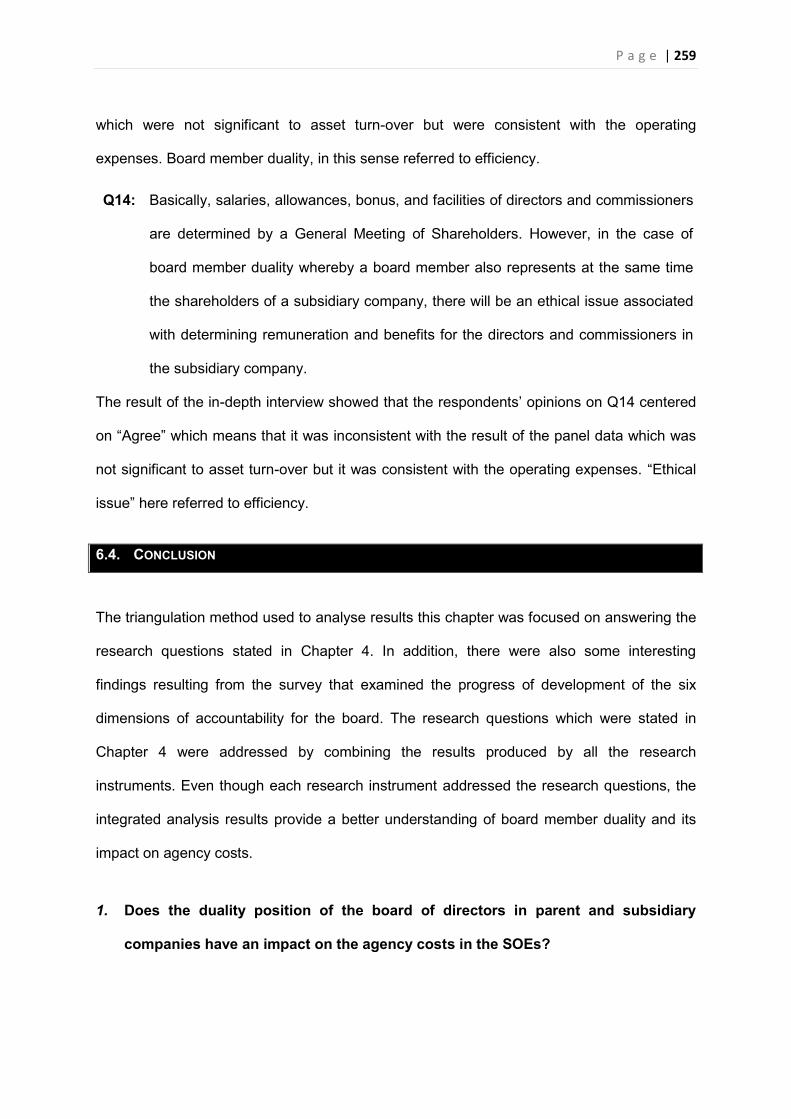
P a g e | 259
which were not significant to asset turn-over but were consistent with the operating
expenses. Board member duality, in this sense referred to efficiency.
Q14: Basically, salaries, allowances, bonus, and facilities of directors and commissioners
are determined by a General Meeting of Shareholders. However, in the case of
board member duality whereby a board member also represents at the same time
the shareholders of a subsidiary company, there will be an ethical issue associated
with determining remuneration and benefits for the directors and commissioners in
the subsidiary company.
The result of the in-depth interview showed that the respondents’ opinions on Q14 centered
on “Agree” which means that it was inconsistent with the result of the panel data which was
not significant to asset turn-over but it was consistent with the operating expenses. “Ethical
issue” here referred to efficiency.
6.4. CONCLUSION
The triangulation method used to analyse results this chapter was focused on answering the
research questions stated in Chapter 4. In addition, there were also some interesting
findings resulting from the survey that examined the progress of development of the six
dimensions of accountability for the board. The research questions which were stated in
Chapter 4 were addressed by combining the results produced by all the research
instruments. Even though each research instrument addressed the research questions, the
integrated analysis results provide a better understanding of board member duality and its
impact on agency costs.
1. Does the duality position of the board of directors in parent and subsidiary
companies have an impact on the agency costs in the SOEs?
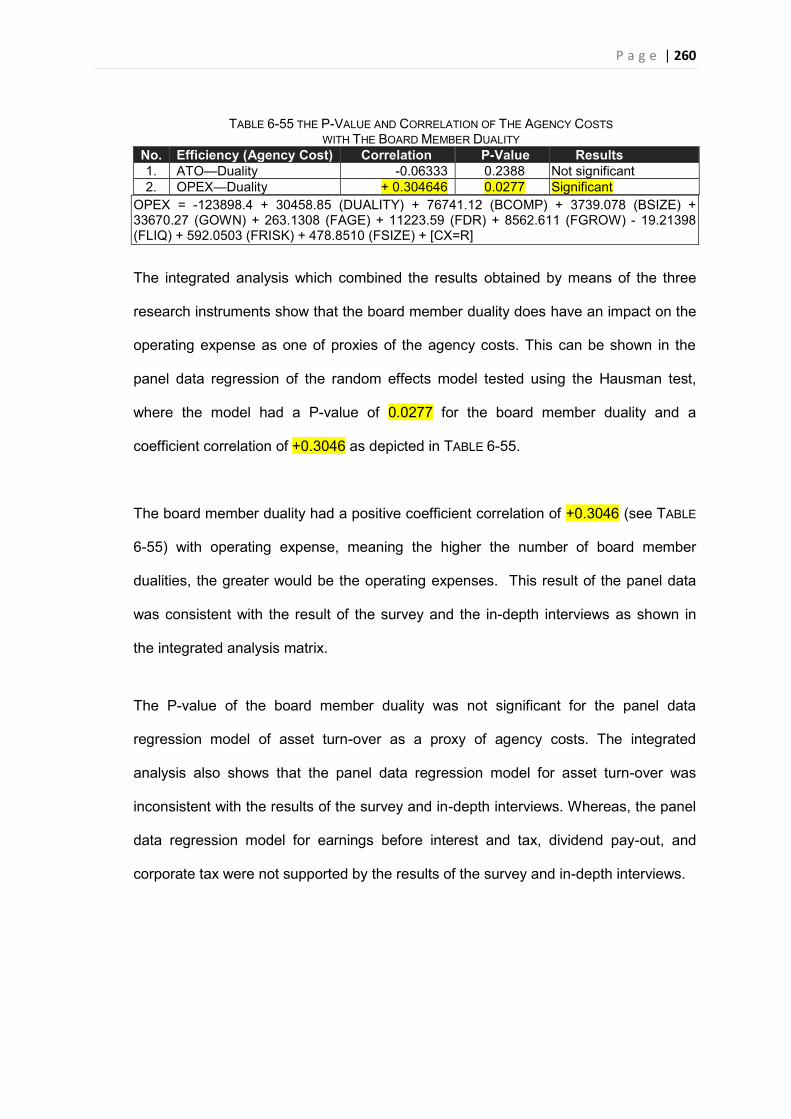
P a g e | 260
TABLE 6-55 THE P-VALUE AND CORRELATION OF THE AGENCY COSTS WITH THE BOARD MEMBER DUALITY
No. Efficiency (Agency Cost) Correlation P-Value Results 1. ATO—Duality -0.06333 0.2388 Not significant 2. OPEX—Duality + 0.304646 0.0277 Significant
OPEX = -123898.4 + 30458.85 (DUALITY) + 76741.12 (BCOMP) + 3739.078 (BSIZE) + 33670.27 (GOWN) + 263.1308 (FAGE) + 11223.59 (FDR) + 8562.611 (FGROW) - 19.21398 (FLIQ) + 592.0503 (FRISK) + 478.8510 (FSIZE) + [CX=R]
The integrated analysis which combined the results obtained by means of the three
research instruments show that the board member duality does have an impact on the
operating expense as one of proxies of the agency costs. This can be shown in the
panel data regression of the random effects model tested using the Hausman test,
where the model had a P-value of 0.0277 for the board member duality and a
coefficient correlation of +0.3046 as depicted in TABLE 6-55.
The board member duality had a positive coefficient correlation of +0.3046 (see TABLE
6-55) with operating expense, meaning the higher the number of board member
dualities, the greater would be the operating expenses. This result of the panel data
was consistent with the result of the survey and the in-depth interviews as shown in
the integrated analysis matrix.
The P-value of the board member duality was not significant for the panel data
regression model of asset turn-over as a proxy of agency costs. The integrated
analysis also shows that the panel data regression model for asset turn-over was
inconsistent with the results of the survey and in-depth interviews. Whereas, the panel
data regression model for earnings before interest and tax, dividend pay-out, and
corporate tax were not supported by the results of the survey and in-depth interviews.
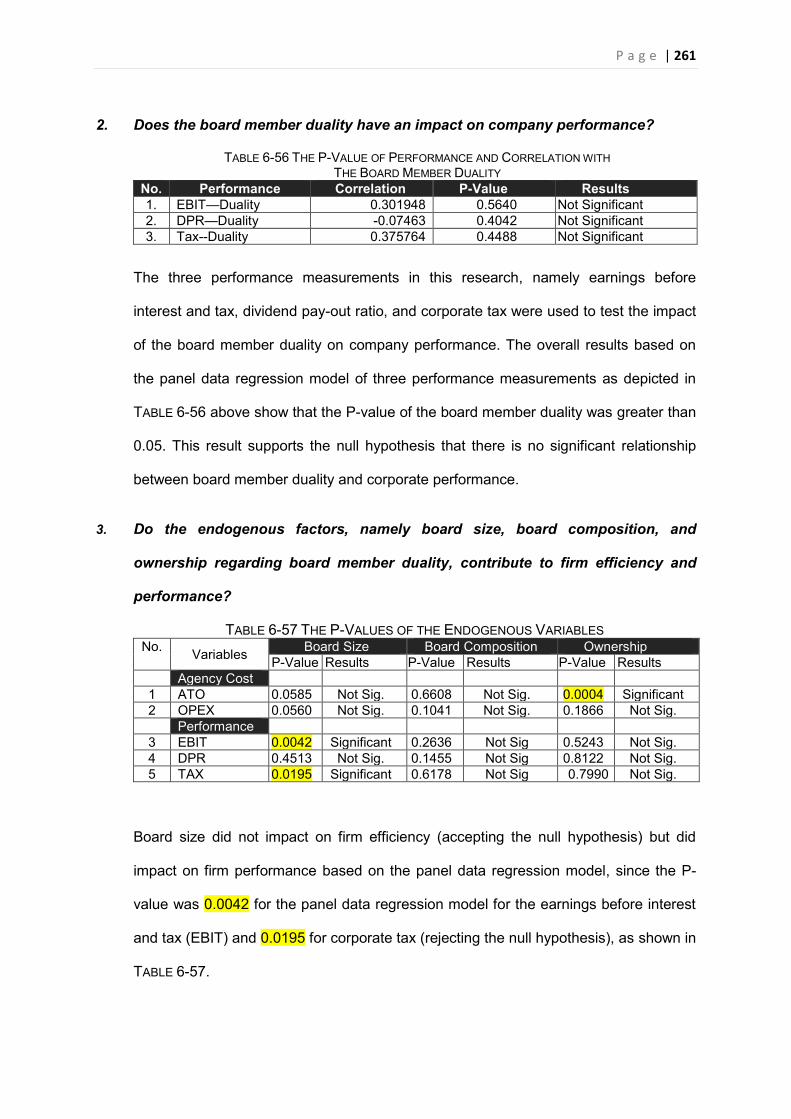
P a g e | 261
2. Does the board member duality have an impact on company performance?
TABLE 6-56 THE P-VALUE OF PERFORMANCE AND CORRELATION WITH THE BOARD MEMBER DUALITY
No. Performance Correlation P-Value Results 1. EBIT—Duality 0.301948 0.5640 Not Significant 2. DPR—Duality -0.07463 0.4042 Not Significant 3. Tax--Duality 0.375764 0.4488 Not Significant
The three performance measurements in this research, namely earnings before
interest and tax, dividend pay-out ratio, and corporate tax were used to test the impact
of the board member duality on company performance. The overall results based on
the panel data regression model of three performance measurements as depicted in
TABLE 6-56 above show that the P-value of the board member duality was greater than
0.05. This result supports the null hypothesis that there is no significant relationship
between board member duality and corporate performance.
3. Do the endogenous factors, namely board size, board composition, and
ownership regarding board member duality, contribute to firm efficiency and
performance?
TABLE 6-57 THE P-VALUES OF THE ENDOGENOUS VARIABLES No. Variables Board Size Board Composition Ownership
P-Value Results P-Value Results P-Value Results Agency Cost 1 ATO 0.0585 Not Sig. 0.6608 Not Sig. 0.0004 Significant 2 OPEX 0.0560 Not Sig. 0.1041 Not Sig. 0.1866 Not Sig. Performance 3 EBIT 0.0042 Significant 0.2636 Not Sig 0.5243 Not Sig. 4 DPR 0.4513 Not Sig. 0.1455 Not Sig 0.8122 Not Sig. 5 TAX 0.0195 Significant 0.6178 Not Sig 0.7990 Not Sig.
Board size did not impact on firm efficiency (accepting the null hypothesis) but did
impact on firm performance based on the panel data regression model, since the P-
value was 0.0042 for the panel data regression model for the earnings before interest
and tax (EBIT) and 0.0195 for corporate tax (rejecting the null hypothesis), as shown in
TABLE 6-57.
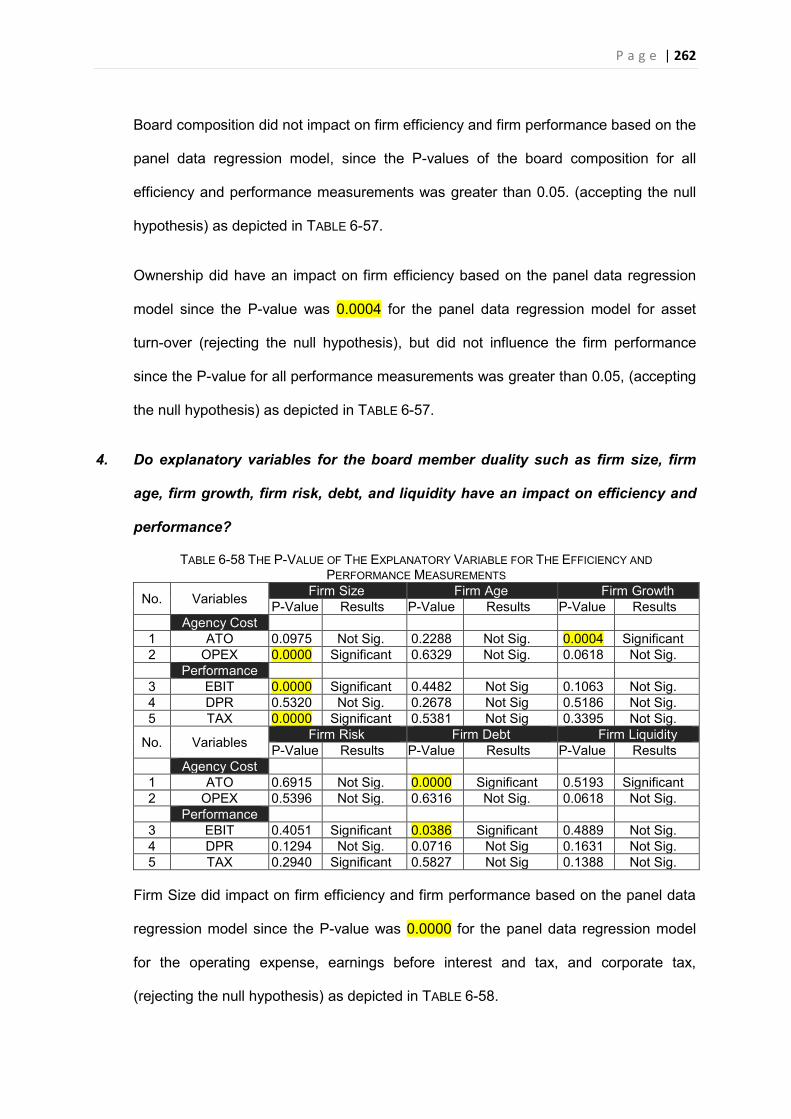
P a g e | 262
Board composition did not impact on firm efficiency and firm performance based on the
panel data regression model, since the P-values of the board composition for all
efficiency and performance measurements was greater than 0.05. (accepting the null
hypothesis) as depicted in TABLE 6-57.
Ownership did have an impact on firm efficiency based on the panel data regression
model since the P-value was 0.0004 for the panel data regression model for asset
turn-over (rejecting the null hypothesis), but did not influence the firm performance
since the P-value for all performance measurements was greater than 0.05, (accepting
the null hypothesis) as depicted in TABLE 6-57.
4. Do explanatory variables for the board member duality such as firm size, firm
age, firm growth, firm risk, debt, and liquidity have an impact on efficiency and
performance?
TABLE 6-58 THE P-VALUE OF THE EXPLANATORY VARIABLE FOR THE EFFICIENCY AND PERFORMANCE MEASUREMENTS
No. Variables Firm Size Firm Age Firm Growth P-Value Results P-Value Results P-Value Results
Agency Cost 1 ATO 0.0975 Not Sig. 0.2288 Not Sig. 0.0004 Significant 2 OPEX 0.0000 Significant 0.6329 Not Sig. 0.0618 Not Sig. Performance 3 EBIT 0.0000 Significant 0.4482 Not Sig 0.1063 Not Sig. 4 DPR 0.5320 Not Sig. 0.2678 Not Sig 0.5186 Not Sig. 5 TAX 0.0000 Significant 0.5381 Not Sig 0.3395 Not Sig.
No. Variables Firm Risk Firm Debt Firm Liquidity P-Value Results P-Value Results P-Value Results
Agency Cost 1 ATO 0.6915 Not Sig. 0.0000 Significant 0.5193 Significant 2 OPEX 0.5396 Not Sig. 0.6316 Not Sig. 0.0618 Not Sig. Performance 3 EBIT 0.4051 Significant 0.0386 Significant 0.4889 Not Sig. 4 DPR 0.1294 Not Sig. 0.0716 Not Sig 0.1631 Not Sig. 5 TAX 0.2940 Significant 0.5827 Not Sig 0.1388 Not Sig.
Firm Size did impact on firm efficiency and firm performance based on the panel data
regression model since the P-value was 0.0000 for the panel data regression model
for the operating expense, earnings before interest and tax, and corporate tax,
(rejecting the null hypothesis) as depicted in TABLE 6-58.
P a g e | 263
Firm Age did not affect the efficiency and firm performance based on the panel data
regression model, since the P-value was greater than 0.05 for panel data regression
models for all efficiency and performance measurements (accepting the null
hypothesis), as depicted in TABLE 6-58.
Firm Growth did impact on efficiency based on the panel data regression model, since
the P-value was 0.0004 for the panel data regression model for asset turn-over
(rejecting the null hypothesis), but did not impact on firm performance since the P-
value was greater than 0.05 for the panel data regression model for all performance
measurements (accepting the null hypothesis), as depicted in TABLE 6-58.
Firm Risk did not influence efficiency and performance based on the panel data
regression model, since the P-values were greater than 0.05, (accepting the null
hypothesis) as depicted in TABLE 6-58.
Firm Debt did impact on firm efficiency and performance based on the panel data
regression model, since the P-values were 0.0000 and 0.0386 for panel data
regression model of asset turn-over ratio and earnings before interest and tax,
respectively (rejecting the null hypothesis), as depicted in TABLE 6-58.
Liquidity did not influence firm efficiency and performance, since P-values >0.05 for all
panel data regression models for efficiency and performance measurements
(accepting the null hypothesis), as depicted in TABLE 6-58.
5. Is there a significant difference between demographic attributes and company
characteristic attributes of directors or commissioners in the six (6) dimensions
of accountability of the board member duality?
P a g e | 264
In terms of the current development of accountability of the board member duality in
the State-Owned Enterprises in Indonesia measured by the six dimensions of
accountability, the survey and in-depth interviews found that:
I. ETHICS AND INTEGRITY
� The Null Hypothesis is accepted for several demographic and company
characteristic attributes namely gender, education, the number of director
position held, and the company status, against the several statements in ETHICS
AND INTEGRITY. This means that there is no significant difference between
gender, education, the number of director positions held, the company status
attributes and several statements in ETHICS AND INTEGRITY.
� On the other hand, the Null Hypothesis is rejected for several demographic and
company characteristic attributes namely respondent age, income, parent
company age, and industrial sector against the several statements in ETHICS AND
INTEGRITY. This means that there is a significant difference between respondent
age, income, parent company age, industrial sector attributes and several
statements in ETHICS AND INTEGRITY.
� The Company characteristic attributes of the parent company age and the
industrial sector are stronger in rejecting the Null Hypothesis than are the
demographic attributes against statements/questions formulated in ETHICS AND
INTEGRITY.
II. COSTS AND BENEFITS
� The Null Hypothesis is accepted for several demographic and company
characteristic attributes, namely gender, respondent age, education, and the
company status, against the several statements in COSTS AND BENEFITS. This
means that there is no significant difference between gender, respondent age,
P a g e | 265
education, company status attributes and several statements in COSTS AND
BENEFITS.
� On the other hand, the Null Hypothesis is rejected for several demographic and
company characteristic attributes, namely income, the number of director
position held, parent company age, and industrial sector against the several
statements in COSTS AND BENEFITS. This means that there is a significant
difference between income, the number of director positions held, parent
company age, industrial sector attributes and several statements in COSTS AND
BENEFITS.
� The Demographic attribute of income is stronger in rejecting the Null Hypothesis
than the other attributes against statements/questions formulated in COSTS AND
BENEFITS.
III. REGULATION
� The Null Hypothesis is accepted for several demographic and company
characteristic attributes namely respondent age, education, company status, and
industrial sector against the several statements in REGULATION. This means that
there is no significant difference between those attributes and the several
statements in REGULATION.
� On the other hand, the Null Hypothesis is rejected for several demographic and
company characteristic attributes, namely gender, income, the number of
company to serve, parent company age, and industrial sector against the several
statements in REGULATION. This means that there is a significant difference
between those attributes and the several statements in REGULATION.
� The Company characteristic attributes of parent company age is more
dominating the results of Rejecting the Null Hypothesis than the other attributes
against statements/questions formulated in REGULATION.
P a g e | 266
IV. ROLE OF DUAL DIRECTOR
� The Null Hypothesis is accepted for several demographic and company
characteristic attributes namely respondent age, education, and industrial sector
against the several statements in ROLE OF DUAL DIRECTOR. This means that
there is no significant difference between respondent age, education, industrial
sector attributes and several statements in ROLE OF DUAL DIRECTOR.
� On the other hand, the Null Hypothesis is rejected for several demographic and
company characteristic attributes, namely gender, income, the number of
director position held, and parent company age against the several statements in
ROLE OF DUAL DIRECTOR. This means that there is significant difference between
gender, income, the number of director position held, parent company age
attributes and several statements in ROLE OF DUAL DIRECTOR.
� The demographic attributes results are predominant for the rejection of the Null
Hypothesis than are the company characteristic attributes formulated in ROLE OF
DUAL DIRECTOR.
V. FINANCIAL ACCOUNTABILITY
� The Null Hypothesis is accepted for several demographic and company
characteristic attributes namely respondent age, education, the company status,
and industrial sector against the several statements in FINANCIAL
ACCOUNTABILITY. This means that there is no relationship between those
attributes and the several statements in FINANCIAL ACCOUNTABILITY.
� On the other hand, the Null Hypothesis is rejected for several demographic and
company characteristic attributes, namely gender, income, the number of
company to serve, and parent company age pertaining to statements in
FINANCIAL ACCOUNTABILITY. This means that there is significant difference
between attributes of gender, income, the number of directorship held in
P a g e | 267
companies to serve, and parent company age and the several statements in
FINANCIAL ACCOUNTABILITY.
� The demographic attribute of income has a significant relationship with t in
FINANCIAL ACCOUNTABILITY.
VI. LEADERSHIP
� The Null Hypothesis is accepted for several demographic and company
characteristic attributes, namely gender, respondent age, education, income,
company status, and industrial sector in the dimension of LEADERSHIP. This
means that there is no significant relationship between those attributes and
several statements in the dimension of FINANCIAL ACCOUNTABILITY.
� On the other hand, the Null Hypothesis was rejected for several company
characteristic attributes, namely number of companies to serve, and parent
company age for the dimension of LEADERSHIP. This means that there is a
significant relationship between those attributes and several statements in
LEADERSHIP.
� The results for both the demographic attribute of the number of companies to
serve and the company characteristic attribute of parent company age did not
support the Null Hypothesis regarding LEADERSHIP.
P a g e | 268
CHAPTER 7: DISCUSSION OF RESULTS The aim of an argument or discussion should not be victory, but progress -
Joseph Joubert 1824-
INTRODUCTION
It was difficult to find comparable references of the new term. This researcher was unable to
find the term ‘board member duality’ in any of the references that had a similar research
focus’This might be due to the different board systems adopted by companies, the limited
secondary data published by the subsidiary companies of SOEs, and the different research
focuses. As a result, this research used several dual director references to compare
specifically the issue of duality mentioned previously, namely CEO duality, interlocking
directorship, and multiple directorship which usually have the similar themes of ethics,
performance, efficiency, and effectiveness.
7.1. THE PRIMARY RESEARCH QUESTION AND HYPOTHESIS 1, 2
The research question 1 and hypotheses 1 and 2 are dealt with simultaneously for the
purposes of the discussion. They are: Does the duality position of the board of directors
in parent and subsidiary have an impact on the agency costs of the SOEs? The null
hypothesis 1 is: Board member duality has no significant influence on operating expenses’,
and the null hypothesis 2 is: There is no relationship between board member duality and
asset turnover.
The findings of this research, presented in Chapter 6, reveal that based on the integrated
matrix analysis which combines the results of panel data, survey, and interview, the board
member duality significantly influences the agency costs of BUMNs. This finding coincidently
may give some support to the Supreme Auditor of the Republic of Indonesia’s finding that
agency problems have moved from the BUMN to the subsidiary company (Qosasi, 2016).
The member of the Supreme Auditor commented that the establishment of the subsidiary
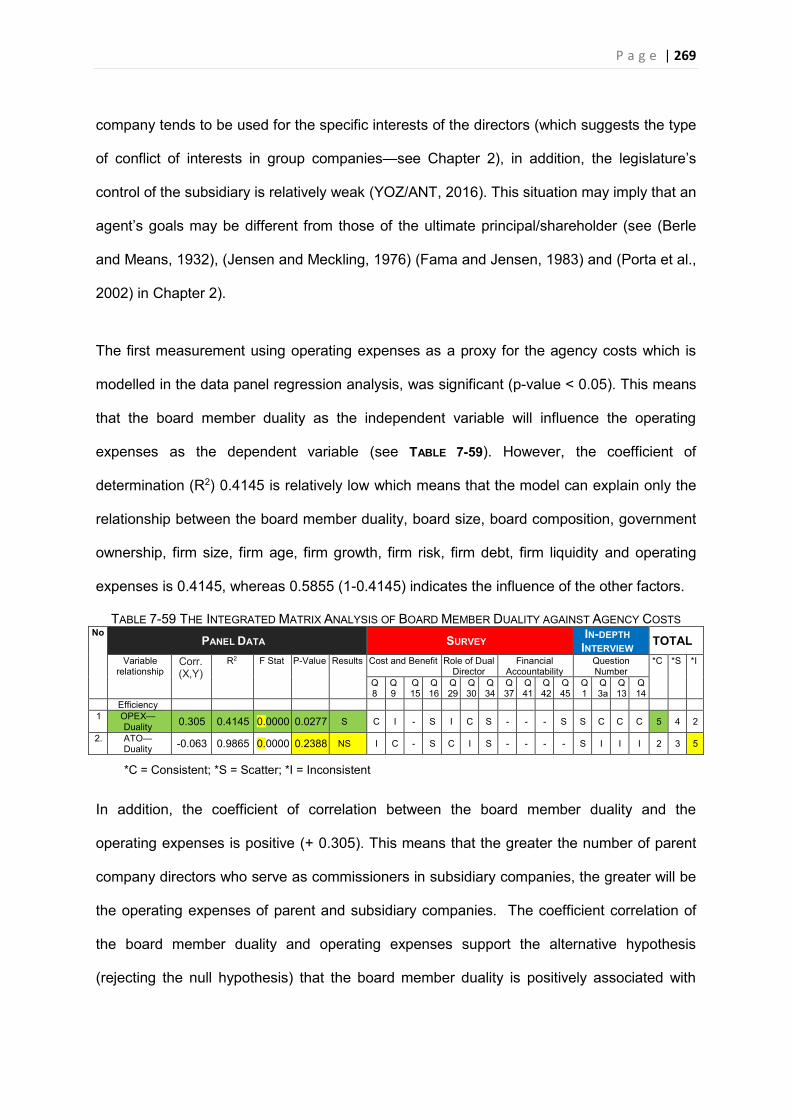
P a g e | 269
company tends to be used for the specific interests of the directors (which suggests the type
of conflict of interests in group companies—see Chapter 2), in addition, the legislature’s
control of the subsidiary is relatively weak (YOZ/ANT, 2016). This situation may imply that an
agent’s goals may be different from those of the ultimate principal/shareholder (see (Berle
and Means, 1932), (Jensen and Meckling, 1976) (Fama and Jensen, 1983) and (Porta et al.,
2002) in Chapter 2).
The first measurement using operating expenses as a proxy for the agency costs which is
modelled in the data panel regression analysis, was significant (p-value < 0.05). This means
that the board member duality as the independent variable will influence the operating
expenses as the dependent variable (see TABLE 7-59). However, the coefficient of
determination (R2) 0.4145 is relatively low which means that the model can explain only the
relationship between the board member duality, board size, board composition, government
ownership, firm size, firm age, firm growth, firm risk, firm debt, firm liquidity and operating
expenses is 0.4145, whereas 0.5855 (1-0.4145) indicates the influence of the other factors.
TABLE 7-59 THE INTEGRATED MATRIX ANALYSIS OF BOARD MEMBER DUALITY AGAINST AGENCY COSTS No
PANEL DATA SURVEY IN-DEPTH
INTERVIEW TOTAL
Variable relationship
Corr. (X,Y)
R2 F Stat P-Value Results Cost and Benefit Role of Dual Director
Financial Accountability
Question Number
*C *S *I
Q8
Q9
Q 15
Q 16
Q 29
Q 30
Q 34
Q 37
Q 41
Q 42
Q 45
Q 1
Q 3a
Q 13
Q 14
Efficiency 1 OPEX—
Duality 0.305 0.4145 0.0000 0.0277 S C I - S I C S - - - S S C C C 5 4 2
2. ATO—Duality -0.063 0.9865 0.0000 0.2388 NS I C - S C I S - - - - S I I I 2 3 5
*C = Consistent; *S = Scatter; *I = Inconsistent
In addition, the coefficient of correlation between the board member duality and the
operating expenses is positive (+ 0.305). This means that the greater the number of parent
company directors who serve as commissioners in subsidiary companies, the greater will be
the operating expenses of parent and subsidiary companies. The coefficient correlation of
the board member duality and operating expenses support the alternative hypothesis
(rejecting the null hypothesis) that the board member duality is positively associated with
P a g e | 270
operating expenses. The total value of OPEX—Duality in the integrated matrix analysis
results in 5 Consistencies which means that the result supports the model of panel data
regression analysis; in other words, the board member duality has an impact on the
operating expenses.
The second measurement using the asset turn-over ratio as the proxy of the agency costs
which is modelled into the data panel regression analysis, was not significant (p-value>0.05).
As discussed in Chapter 3, the board member duality in the context of the parent and
subsidiary companies of BUMNs in Indonesia is governed by the three layers of corporate
governance structure namely, the public with the government (c.q. the Ministry of BUMN),
the government with BUMN and the BUMN with the subsidiary company (see chapter 3).
The owner and manager of each layer is different, and therefore there will be a separation of
ownership and control as argued by Berle and Means (1932). This discussion applies a new
term - “shareholding agent” - to the second layer and the third layer mentioned above,
meaning the agent delegated as a shareholder by the principal. The government, as
mandated by the public as the shareholder of a BUMN (Anwar and Sam, 2006), through the
general meeting of shareholders decides the remuneration for corporate board which
includes salary, honorarium, allowance, facilities, and bonus or performance incentive.77 This
remuneration is categorized as operating expenditure which is different from capital
expenditure. Operating expenditure includes ongoing costs and consumables for running the
business; whereas, the capital expenditure is the cost of developing or providing non-
consumable items for the business which will be depreciated or amortised (see Maguire et
al. (2008), and Donaldson (2007)). The remuneration of the board members is considered as
an operating expenditure, and is one of the agency costs according to Jensen and Meckling 77 Surat Keputusan Menteri BUMN No. Per-04/MBU/2014 Tentang Pedoman Penetapan Penghasilan Direksi, Dewan Komisaris, dan Dewan Pengawas Badan Usaha Milik Negara [Ministerial Decree of BUMN No.PER-04/MBU/2014 on The Guidance of Remuneration for Directors, Commissioner, Oversight Board of State-Owned Enterprise]; Article 5 (3)
P a g e | 271
(1976) (see Chapter 2). In addition, the corporate expenses incurred by the corporate board
for things such as travel/transport, accommodation, and communication are included in the
operating expenditure. The acceptable limit for those expenses may be different for the
parent and the subsidiary company. The board member duality holders in BUMNs are
allowed to choose the facilities provided by the parent or subsidiary company as long as
there is no ‘double dipping’.78
The finding that the board member duality will impact on agency costs in the parent and
subsidiary company relationship of BUMNs is the opposite of Rashid (2012)’s finding. He
argues that there is no significant relationship between CEO duality and the agency costs.
The duality only gives an enormous power to the CEO but at the same time will lessen the
checks and balances in the monitoring system. As argued in Chapter 2 regarding the new
term proposed in this research, namely the board member duality, (which is different from
the CEO duality, interlocking directorship, and multiple directorship) this research cannot be
compared with previous research which addressed the three types of duality mentioned
simply because the research on the similar duality construction of the research in BUMN and
subsidiary is very limited. At the time of writing, this researcher was unaware of any similar
research.
THE FINDING VERSUS THE REALITY
The research finding based on the panel data regression model for the period 2009—2013
that the board member duality has a significant impact on operating expense as the proxy of
the agency costs, gives some support to the Ministerial Decree of BUMN number PER-
78 Surat Keputusan Menteri BUMN No. Per-04/MBU/2014 Tentang Pedoman Penetapan Penghasilan Direksi, Dewan Komisaris, dan Dewan Pengawas Badan Usaha Milik Negara [Ministerial Decree of BUMN No.PER-04/MBU/2014 on The Guidance of Remuneration for Directors, Commissioner, Oversight Board of State-Owned Enterprise]; Article 5 (3)
P a g e | 272
03/MBU/02/201579 which was issued in February 17, of 2015. Chapter 4 Article A (6), stated
that “In addition to any of the positions referred to in paragraph 5 (the director duality), a
member of the Board of Directors may not hold another position as a member of the Board
of Commissioners in other companies, except: a. Board members in subsidiaries/joint
venture State-Owned Enterprises, but entitled only to the accumulation of income, as a
Commissioner on one or more subsidiaries/joint ventures of a maximum of 30% (thirty
percent) of the salary of members of the Board of Directors in the SOEs where he/she is
appointed, while other income/the rest is deposited into the State-Owned Enterprises. b.
Board members in other companies to represent / promote the interests of state-owned
enterprises as long as permitted by the Minister. The Ministerial Decree of BUMN number
No.PER-04/MBU/2014 on The Guidance of Remuneration for Directors, Commissioner,
Oversight Board of State-Owned Enterprise]; Article 5 (3) previously mentioned also
regulates the operating expense for the director duality in BUMNs.80
Even though there are several ministerial decrees applying to BUMNs which influence the
policies in subsidiary companies, in fact there are no provisions for subsidiary companies in
the SOE Act 19/2003. The only provision regarding a subsidiary company in the SOE Act
19/203 is stated in Chapter 4 “the General Meeting of Shareholders” article 14 (3.g)
regarding the establishment of subsidiaries or investments. Hence, the provisions intended
to ensure that BUMNs implement good corporate governance principles, to some extent, are
not binding to the subsidiary companies. On the other hand, the Master Plan of BUMNs,
intended to reduce the number of BUMNs, actually increased the number of subsidiary
companies. More importantly, the assets of BUMNs are then concentrated in the subsidiary
companies. The SOE Act 19/2003 does not regulate a subsidiary company of a BUMN
79 The ministerial decree on the Requirements, Appointment and Termination Procedures of the Directors of State-Owned Enterprises
80 See footnote 88.
P a g e | 273
because the subsidiary company is not a BUMN. This is because the subsidiary company’s
capital is not owned by the state but by the BUMN. Thus, the corporate governance
principles enshrined in the SOE Act are only voluntarily practised in the subsidiary
companies; they are not mandatory. Their practices depend on the policy established by
each BUMN policy as the parent company (shareholder) which may or may not formally
oblige their subsidiary company to practise good corporate governance principles. In fact,
there is a possibility that the subsidiary company is used for tunneling assets out from the
parent company which is similar to what Li (2010) found in China’s public companies, that
tunneling by controlling shareholders, often with the aid of executives of companies, is
pervasive and severe.
In the context of BUMN, the tunneling of the state’s funds or assets from the parent company
to subsidiary company might have at least four justified reasons. Firstly, it is intended to
develop the subsidiary company and increase its benefits to the parent company; secondly,
to increase its business decision flexibility which is not as rigid as it in BUMN; thirdly, to
some extent, it may benefit the BUMN if the parent company is a holding company for
investment which flows from the fund for investing in its profitable subsidiary companies; and
fourthly, as a consequence of the Ministry of BUMN’s policy regarding regrouping or holding
structures of BUMN whereby some BUMNs are merged into a holding company having
several BUMNs as their subsidiary companies (see Chapter 3 section 3 for the scenario and
direction of BUMNs).
However, the formation and expansion of a subsidiary company is not a risk-free
undertaking for several reasons. Firstly, the doctrine of piercing the corporate veil is adopted
in company law no.40/2007. This means that the burden of debt or loss, as a result of a
contractual agreement by a subsidiary company with other parties, can be imposed on the
parent company, as the subsidiary’s shareholder, as long as several criteria are applied.
P a g e | 274
According to Fuady (2002), the criteria which can lead to piercing the corporate veil are: (1)
fraud; (2) inequity; (3) oppression; (4) illegality; (5) excessive domination by shareholder(s);
and (6) the subsidiary company has become the alter ego of its shareholder(s). Secondly,
there are moral risks, in the sense that the four justified reasons above are ridden by
individuals’ self-interests (alter ego) who act as the controlling shareholder (“shareholding
agent”81) of a subsidiary company which derived from the ultimate shareholder of BUMN. For
example, self-interest is evident in decisions regarding remuneration and facilities given to
corporate board members at the annual general meeting of shareholders, especially for
board member duality holders who hold two positions, one in a parent and another in a
subsidiary company, and who are involved in the decision making. Thirdly, flexibility could be
interpreted as meaning that the subsidiary companies need not follow all regulations
applying to BUMNs. In fact, the SOE Act regulates only the corporate governance and
accountability of BUMNs and it does not explicitly or implicitly include the subsidiary
companies. Fourthly, the consequence of the holding structure policy causes the majority of
a holding company’s assets to be held in the subsidiary companies which are not subject to
the SOE Act, unlike the BUMNs. As a result, government control of the subsidiary company
is weak, and the Ministry of BUMNs pays less attention to the subsidiary company.
Thus, the underlying activities of subsidiary companies are not as effectively and
comprehensively controlled. For example, the Ministry of BUMN maintains no accurate
database of the subsidiary companies. The publication of the annual reports of the
subsidiary companies of BUMNs is very limited. Interestingly, in the Limited Liability Act
40/2007, there are no provisions regulating subsidiary companies that can be used as the
reference for governing the subsidiary of BUMN. If the government wants to increase the
accountability and corporate governance of the subsidiary companies of BUMNs, then it 81 The new terminology proposed in this research as the position of agent who is delegated as shareholder with all right and obligation enshrined in the company act No.40/2007.
P a g e | 275
should include provisions for subsidiary companies in the SOE Act 19/2003 and Limited
Liability Act 40/2007.
Comparing the SOE Act in Indonesia to the ones in the developed country such as Australia
and New Zealand, the subsidiary company is clearly defined in the State-Owned Enterprise
Act and the definition is usually also linked to the Company Act. For example, the State
Owned Enterprise Act 1992 of the State of Victoria in Australia includes definitions82 and
provisions83 regarding the subsidiary company. The Government Owned Company Act 1993
(GOC) of the state of Queensland in Australia also includes the definition of84 and many
provisions85 for a subsidiary company. The State Owned Enterprise Act 1986 of New
Zealand, which also regulates the subsidiary company, is similar to the ones in Australia.
If the SOE Act 19/2003 does not regulate subsidiary companies, then these could be
perceived as not being included within the scope of the state’s finance. The Legal Forum of
BUMN presented to the Constitution Court a petition for a judicial review to examine the
82 State Owned Enterprise Act 1992 Part I, Prov. 4: (1) For the purposes of this Act, the question whether a body corporate is a subsidiary (other than a declared subsidiary) of a State business corporation or a reorganising body shall be determined in the same manner as the question would be determined under the Corporations Act if the State business corporation or a reorganising body and the body corporate were corporations within the meaning of that Act. (2) The question whether a body corporate is a subsidiary of a State owned company shall be determined in accordance with the Corporations Act 83 Part VII, Prov. 87: (1)“The Treasurer may, by Order published in the Government Gazette declare that a provision of this Act applies to a subsidiary of a State business corporation or of a State owned company with such modifications as the circumstances require” (2) A State business corporation and a State owned company must take such action in relation to the constituent documents and management of each of its declared subsidiaries as are necessary to ensure that the businesses, activities and other affairs of the subsidiary are carried out in accordance with the provisions of this Act that apply to it by reason of sub-section (1). 84 Section 2 Definitions: “subsidiary has the meaning given by the Corporations Act, and includes— (a) for a GOC or candidate GOC—a government entity declared by regulation to be a subsidiary of the GOC or candidate GOC; and (b) for a candidate GOC associate—a GOC Act entity declared by regulation to be a subsidiary of the associate 85 For example Chapter 2 “Mechanisms for creating GOCs, in Section 26 ” Declaration of GOC Act entity to be subsidiary of candidate GOC associate”; Part 5 “Corporation facilitative mechanism” in provisions 50—67, Part 7 “Corporate Plan” Part 8 “Statement of Corporate Intent”, Part 12 “duties and liabilities of directors and other officers”; Part 15 “acquisition and disposal of assets and subsidiaries”, and many more provisions.
P a g e | 276
constitutionality of articles 2 (g)86 and (i)87 of the Financial State Act No.17/2003 regarding
the BUMNs’ wealth that is included in the finances of the state, and articles 6 (1)88, 9 article
(1.b.)89, 10 (1)90 and 10 (3)91, and article 11 (a)92 of the Supreme Auditor Act No.15/2006
regarding the BUMN being subject to audit by the Supreme Auditor (Court, 2013). The Legal
Forum of BUMN wanted to have BUMNs excluded from the state’s financial scope in order
to decrease government control of BUMNs, and this would apply to subsidiary companies as
well. The Constitution Court judges refused all requests from applicants (Court, 2013).
7.2. THE RESEARCH SUB-QUESTION 2 AND HYPOTHESES 3, 4 ,5
The research sub-question 2 and hypotheses 3, 4, and 5 are dealt with simultaneously for
the purposes of discussion. They are: Does the board member duality have an impact on
company Performance?; Hypothesis 3 is: There is no relationship between the Board
member duality and Earnings Before Interests and Taxes (EBIT); Hypothesis 4 is: There
is no relationship between the Board Member Duality and Dividend Pay-Out Ratio
86 The state financial wealth includes the wealth of the state and regions which are managed by themselves or by others in the form of cash, securities, receivables, goods, as well as other rights, which can be valued in money, including wealth state separated in the BUMN and/the regional companies 87 the wealth of others obtained by using the facilities provided by the government 88 The Supreme Auditor is in charge of examining the management and financial responsibilities state conducted by the Central Government, Local Government, other state institutions, Bank Indonesia, State-Owned Enterprises, Public Service Board, Regional-Owned Enterprises and institutions or other entities that manage state finances 89 in performing their duties, the supreme auditor is authorized to request information and / or documents that must be provided by each person, an organizational unit of the Central Government, Local Government, Other State institutions, Bank Indonesia, State-Owned Enterprises, Public Service Board, Regional-Owned Enterprises, and agencies or other entities that manage state finances; 90 The Supreme Auditor assess and / or set the amount of state losses caused by an unlawful act, either intentionally or negligent conducted by the treasurer, manager of BUMN/regional enterprises, and institutions or other entities operating in the management of state finances 91 To ensure the implementation of the payment of compensation, The Supreme Auditor has the authorities to monitor: a. settlement of the state damages / areas defined by the Government to the civil servants who are not the treasurer and other officials; b. the implementation of imposition of the state restitution/regional to the treasurer, manager of BUMN/regional enterprises, and institutions or other entities that manage state finances that have been set by the supreme auditor; and c. the implementation of imposition of the state restitution/regional specified by a court decision that has had permanent legal force. 92 The Supreme Auditor can provide: a. opinion to the House of Representatives, Parliament, the Central Government / Local Government, Other Institution Countries, Bank Indonesia, State-Owned Enterprises, Public Service Board, Regional-Owned Enterprises, foundations, and institutions or other entities, which is necessary because of the nature of their work
P a g e | 277
(DPR); and Hypothesis 5 is: There is no relationship between the Board Member Duality
and Corporate Taxes.
The findings of this research, presented in Chapter 6, reveal that there is no significant
relationship between the board member duality and company performance, thereby
supporting the null hypothesis. All of the three performance measurement proxies had P-
values > 0.05 meaning that they are not significant as summarised in TABLE 6-56. This finding
supports what Berg and Smith (1978), Chaganti et al. (1985b), and Baliga et al. (1996)
found: that there is no systematic relationship between CEO duality and company
performance.
7.3. RESEARCH SUB-QUESTIONS 3 AND HYPOTHESES 6, 7, 8
The research sub-question 3 and hypotheses 6,7, and 8 are dealt with simultaneously for
discussion purposes. They are: Do the endogen factors, namely board size, board
composition, and ownership regarding to the board member duality contribute to
agency costs and performance? The null hypothesis 6 is: There is no relationship
between board size and agency costs; the null hypothesis 7 is: There is no relationship
between board composition and agency costs, and the null hypothesis 8 is: There is no
relationship between government ownership and agency costs.
The findings of this research, presented in Chapter 6, reveal that of the three endogenous
variables,, only the ownership type influenced asset turn-over as the proxy of the agency
costs (rejecting the null hypothesis, P-value < 0.05); whereas, on the corporate performance
side, only the board size influenced EBIT and Corporate Tax as the proxies of corporate
performance (rejecting the null hypothesis, P-Value < 0.05). The board composition appears
to have no significant influence on either agency costs or performance (supporting the null
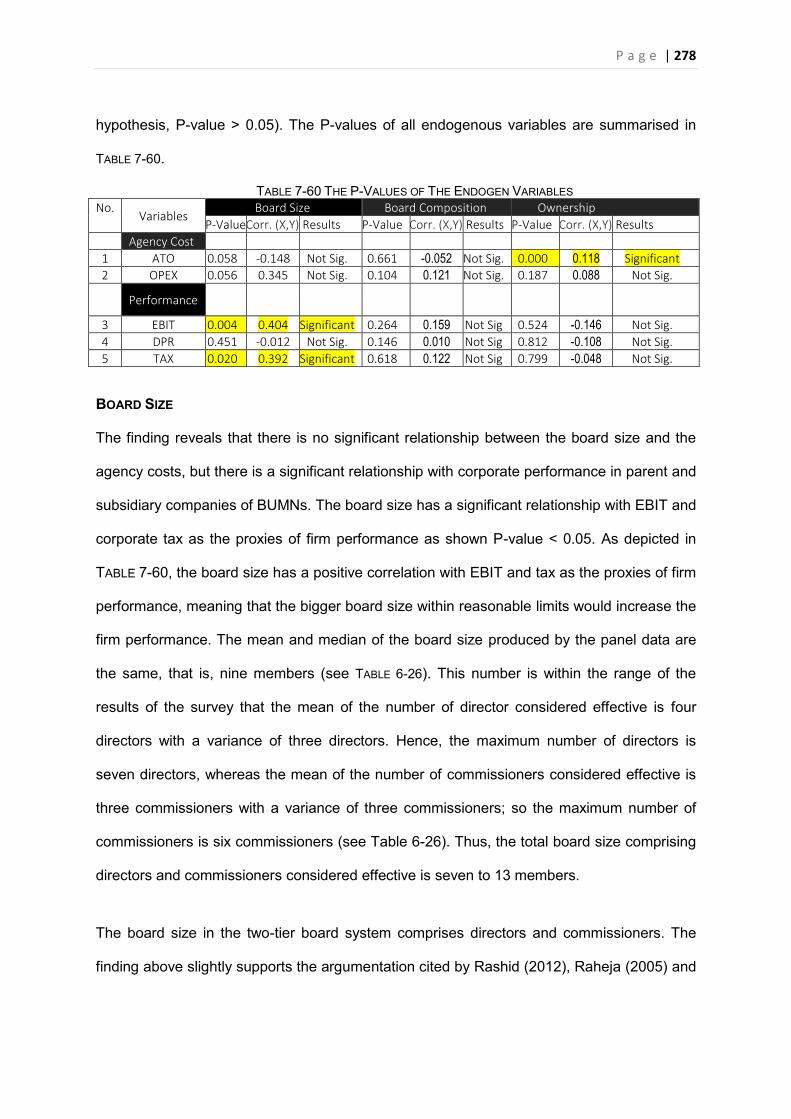
P a g e | 278
hypothesis, P-value > 0.05). The P-values of all endogenous variables are summarised in
TABLE 7-60.
TABLE 7-60 THE P-VALUES OF THE ENDOGEN VARIABLES No.
Variables Board Size Board Composition Ownership
P-Value Corr. (X,Y) Results P-Value Corr. (X,Y) Results P-Value Corr. (X,Y) Results Agency Cost
1 ATO 0.058 -0.148 Not Sig. 0.661 -0.052 Not Sig. 0.000 0.118 Significant 2 OPEX 0.056 0.345 Not Sig. 0.104 0.121 Not Sig. 0.187 0.088 Not Sig. Performance
3 EBIT 0.004 0.404 Significant 0.264 0.159 Not Sig 0.524 -0.146 Not Sig. 4 DPR 0.451 -0.012 Not Sig. 0.146 0.010 Not Sig 0.812 -0.108 Not Sig. 5 TAX 0.020 0.392 Significant 0.618 0.122 Not Sig 0.799 -0.048 Not Sig.
BOARD SIZE
The finding reveals that there is no significant relationship between the board size and the
agency costs, but there is a significant relationship with corporate performance in parent and
subsidiary companies of BUMNs. The board size has a significant relationship with EBIT and
corporate tax as the proxies of firm performance as shown P-value < 0.05. As depicted in
TABLE 7-60, the board size has a positive correlation with EBIT and tax as the proxies of firm
performance, meaning that the bigger board size within reasonable limits would increase the
firm performance. The mean and median of the board size produced by the panel data are
the same, that is, nine members (see TABLE 6-26). This number is within the range of the
results of the survey that the mean of the number of director considered effective is four
directors with a variance of three directors. Hence, the maximum number of directors is
seven directors, whereas the mean of the number of commissioners considered effective is
three commissioners with a variance of three commissioners; so the maximum number of
commissioners is six commissioners (see Table 6-26). Thus, the total board size comprising
directors and commissioners considered effective is seven to 13 members.
The board size in the two-tier board system comprises directors and commissioners. The
finding above slightly supports the argumentation cited by Rashid (2012), Raheja (2005) and
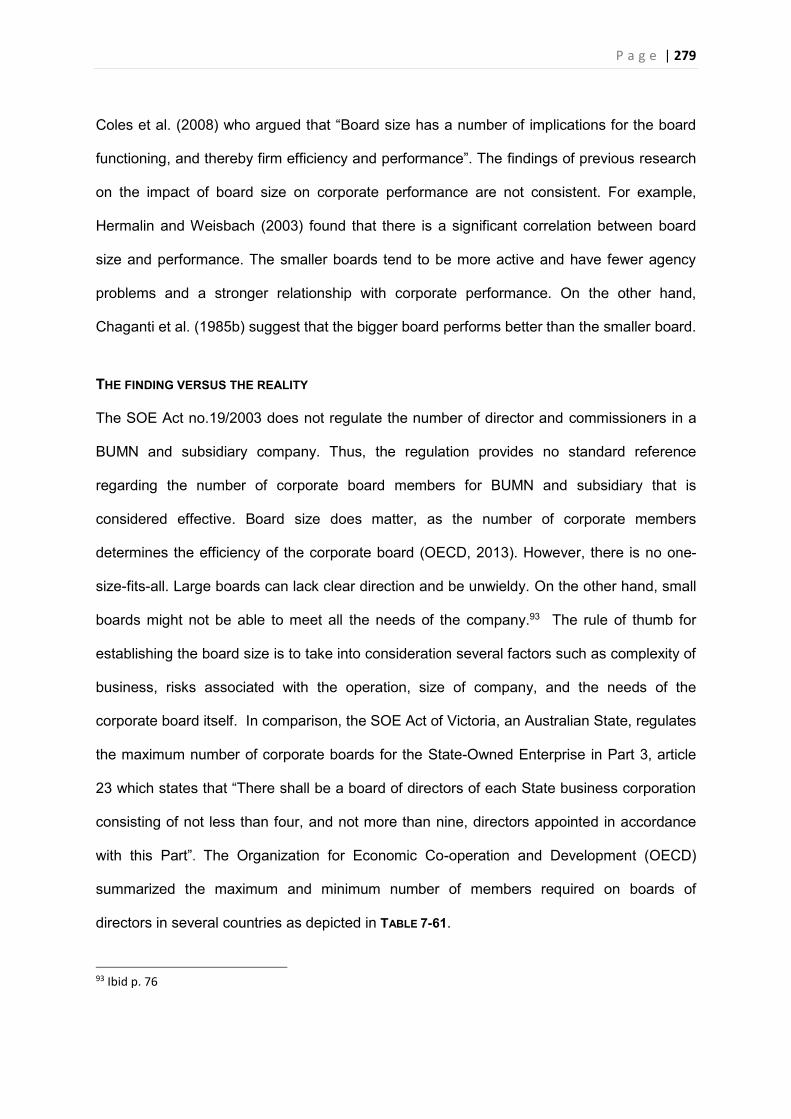
P a g e | 279
Coles et al. (2008) who argued that “Board size has a number of implications for the board
functioning, and thereby firm efficiency and performance”. The findings of previous research
on the impact of board size on corporate performance are not consistent. For example,
Hermalin and Weisbach (2003) found that there is a significant correlation between board
size and performance. The smaller boards tend to be more active and have fewer agency
problems and a stronger relationship with corporate performance. On the other hand,
Chaganti et al. (1985b) suggest that the bigger board performs better than the smaller board.
THE FINDING VERSUS THE REALITY
The SOE Act no.19/2003 does not regulate the number of director and commissioners in a
BUMN and subsidiary company. Thus, the regulation provides no standard reference
regarding the number of corporate board members for BUMN and subsidiary that is
considered effective. Board size does matter, as the number of corporate members
determines the efficiency of the corporate board (OECD, 2013). However, there is no one-
size-fits-all. Large boards can lack clear direction and be unwieldy. On the other hand, small
boards might not be able to meet all the needs of the company.93 The rule of thumb for
establishing the board size is to take into consideration several factors such as complexity of
business, risks associated with the operation, size of company, and the needs of the
corporate board itself. In comparison, the SOE Act of Victoria, an Australian State, regulates
the maximum number of corporate boards for the State-Owned Enterprise in Part 3, article
23 which states that “There shall be a board of directors of each State business corporation
consisting of not less than four, and not more than nine, directors appointed in accordance
with this Part”. The Organization for Economic Co-operation and Development (OECD)
summarized the maximum and minimum number of members required on boards of
directors in several countries as depicted in TABLE 7-61.
93 Ibid p. 76
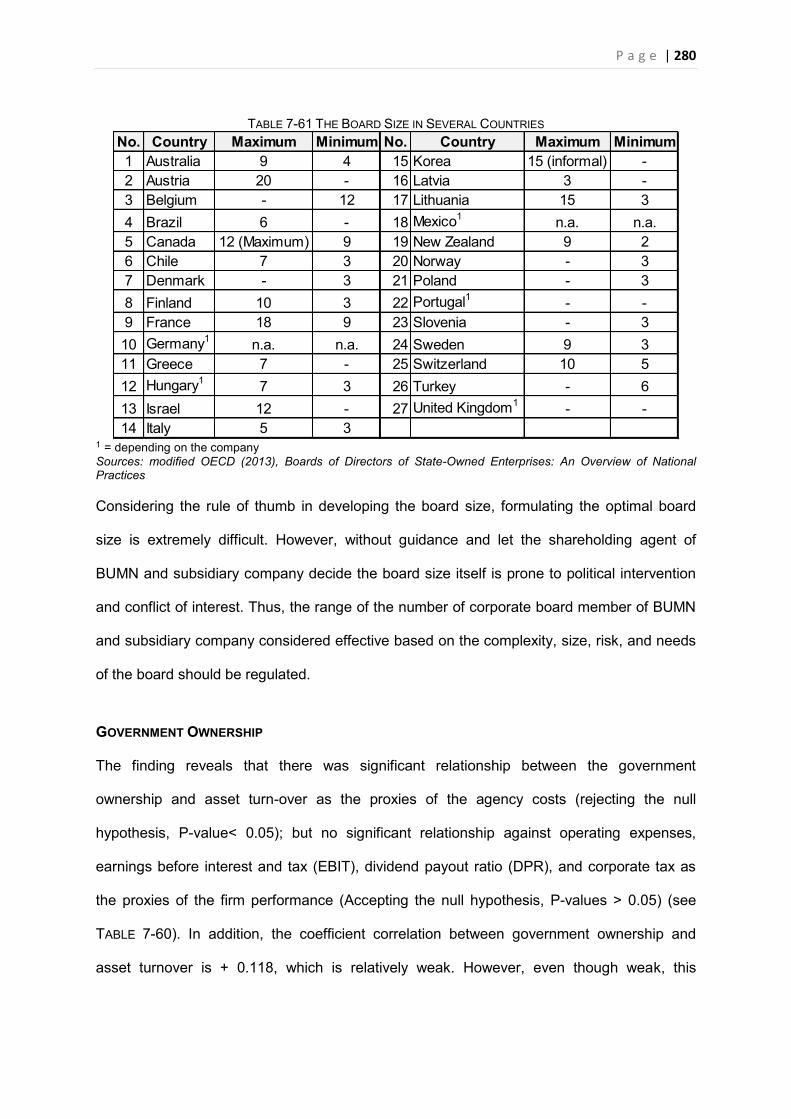
P a g e | 280
TABLE 7-61 THE BOARD SIZE IN SEVERAL COUNTRIES No. Country Maximum Minimum No. Country Maximum Minimum1 Australia 9 4 15 Korea 15 (informal) -2 Austria 20 - 16 Latvia 3 -3 Belgium - 12 17 Lithuania 15 34 Brazil 6 - 18 Mexico1 n.a. n.a.5 Canada 12 (Maximum) 9 19 New Zealand 9 26 Chile 7 3 20 Norway - 37 Denmark - 3 21 Poland - 38 Finland 10 3 22 Portugal1 - -9 France 18 9 23 Slovenia - 310 Germany1 n.a. n.a. 24 Sweden 9 311 Greece 7 - 25 Switzerland 10 512 Hungary1 7 3 26 Turkey - 613 Israel 12 - 27 United Kingdom1 - -14 Italy 5 3
1 = depending on the company Sources: modified OECD (2013), Boards of Directors of State-Owned Enterprises: An Overview of National Practices Considering the rule of thumb in developing the board size, formulating the optimal board
size is extremely difficult. However, without guidance and let the shareholding agent of
BUMN and subsidiary company decide the board size itself is prone to political intervention
and conflict of interest. Thus, the range of the number of corporate board member of BUMN
and subsidiary company considered effective based on the complexity, size, risk, and needs
of the board should be regulated.
GOVERNMENT OWNERSHIP
The finding reveals that there was significant relationship between the government
ownership and asset turn-over as the proxies of the agency costs (rejecting the null
hypothesis, P-value< 0.05); but no significant relationship against operating expenses,
earnings before interest and tax (EBIT), dividend payout ratio (DPR), and corporate tax as
the proxies of the firm performance (Accepting the null hypothesis, P-values > 0.05) (see
TABLE 7-60). In addition, the coefficient correlation between government ownership and
asset turnover is + 0.118, which is relatively weak. However, even though weak, this
P a g e | 281
coefficient correlation gives the sign that government ownership has some support to
increase the asset turn-over of BUMN.
The government ownership of BUMNs can vary from 10% to 100%. As shown in the
research sample summarized in TABLE 6-26, the mean of government ownership shares was
0.890334 or 89.03%, whereas the median value was 99.90%. The mean (89.03%) of the
government ownership of shares shows that the government as shareholder still holds the
majority of votes. This means that the government as the shareholder could directly control
or significantly influence BUMN policies via general meetings of shareholders or indirectly
through directors or commissioners appointed by the government. Sun et al. (2002) argued
that “too much government control is indeed bad for enterprises, but too little government
ownership may not be good either”. Bortolotti and Faccio (2009) noted that in OECD
countries, after the largest wave of privatizations in history at the end of the millennium year
2000 (Y2K), on average, governments still held 62.4% of shares in privatized firms. They
concluded that governments in civil law countries tended to retain the majority of shares,
whereas the ones in common law countries typically use the “golden share”94.
THE FINDING VERSUS THE REALITY
The wave of privatization at the end of Y2K (year 2000) also influenced Indonesia. As
regulated in the SOE Act 19/2003, the privatization of BUMNs has the following purposes
and objectives: (1) to increase the people’s ownership of BUMNs; (2) to increase the
efficiency and productivity of BUMNs; (3) to strengthen financial structure and financial
management; (4) to strengthen the industrial structure and competitiveness; (5) to
strengthen the competitiveness and global orientation of BUMNs; (6) to develop a business
94 See chapter 3 section 3.2.2.
P a g e | 282
climate, macro economy, and market capitalization.95 The results of privatization in
Indonesia are summarised in Figure 3-5 and Figure 3-6. The data shows that in general, the
government still retains a strong ownership position, at least 51%, of firms such as PT PGN
Tbk, PT BNI Tbk, PT Jasa Marga Tbk, PT Wijaya Karya Tbk, PT Pembangunan Perumahan
Tbk, PT Krakatau Steel Tbk, PT Garuda Indonesia Tbk, and PT Bank Mandiri Tbk. This
proportion of government shares in privatized BUMNs seemingly follows Bortolotti and
Faccio (2009)’s argument that, on average, governments in civil law countries (including
Indonesia) still hold the majority of shares in BUMNs that have been privatized, whereas the
common law countries usually have a “golden share”. Interestingly, the government of
Indonesia applies both, retaining the majority of shares, or if not, then the government will
apply the Golden Share96 called a “Red-White Share” (the colours of the national flag) as the
common law does.
7.4. SUB RESEARCH QUESTIONS 4 AND HYPOTHESIS 9,10, 11,12,13,14
The research sub-question 4 and hypotheses 9, 10, 11, 12, 13 and 14 are discussed
simultaneously. They are: Do explanatory variables for the board member duality such
as firm size, firm age, firm growth, firm risk, debt, and liquidity impact on agency
costs and performance? The null hypothesis for all control variables is: There is no
relationship between firm size, firm age, firm growth, firm debt, firm liquidity and
agency costs and firm performance.
The findings of this research as presented in Chapter 6 reveal that of the six explanatory
variables, only firm size and the firm debt had an impact on both agency costs and company
performance. However, only one of the explanatory variables, namely the firm growth, had
an impact on agency costs (P-values < 0.05, rejecting the null hypothesis). On the other
95 Undang-Undang Nomor 19 Tahun 2003 Tentang Badan Usaha Milik Negara [Law No.19 of 2003 on State-Owned Enterprise] (Indonesia) art 74 96 See Chapter 3, section 3.2.2. a “Red—White share” (the colours of the national flag)
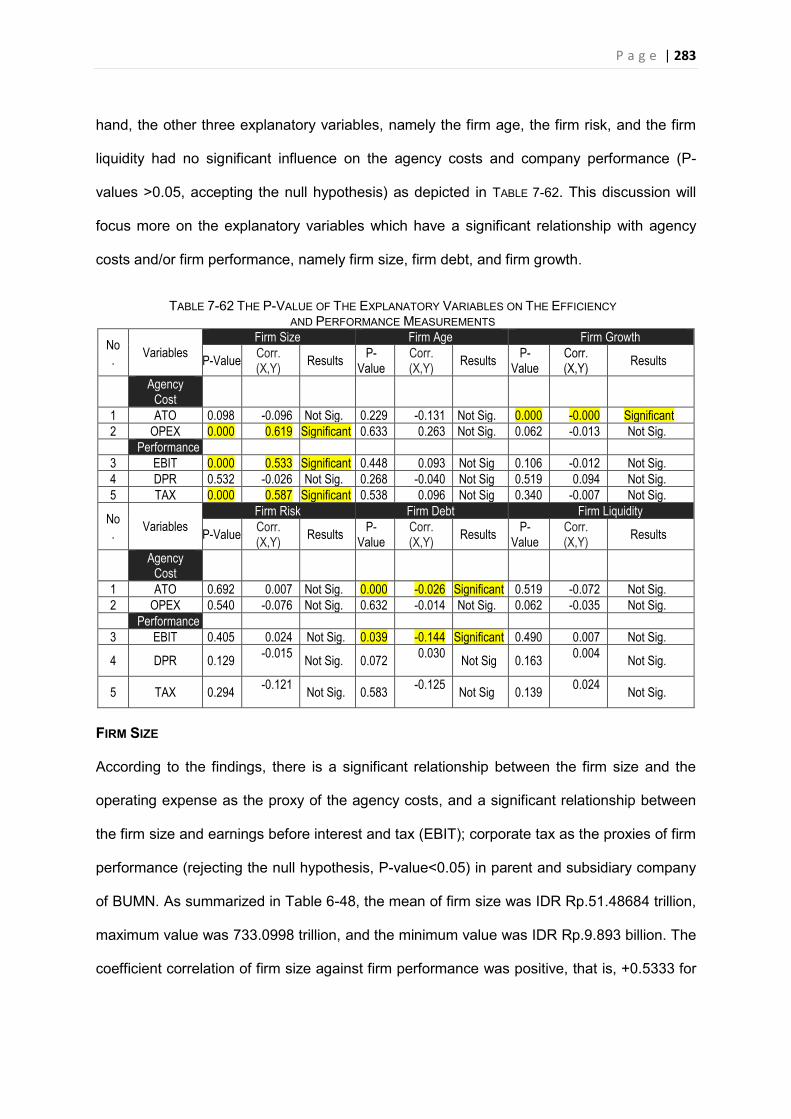
P a g e | 283
hand, the other three explanatory variables, namely the firm age, the firm risk, and the firm
liquidity had no significant influence on the agency costs and company performance (P-
values >0.05, accepting the null hypothesis) as depicted in TABLE 7-62. This discussion will
focus more on the explanatory variables which have a significant relationship with agency
costs and/or firm performance, namely firm size, firm debt, and firm growth.
TABLE 7-62 THE P-VALUE OF THE EXPLANATORY VARIABLES ON THE EFFICIENCY
AND PERFORMANCE MEASUREMENTS
No. Variables
Firm Size Firm Age Firm Growth
P-Value Corr. (X,Y) Results P-
Value Corr. (X,Y) Results P-
Value Corr. (X,Y) Results
Agency Cost
1 ATO 0.098 -0.096 Not Sig. 0.229 -0.131 Not Sig. 0.000 -0.000 Significant 2 OPEX 0.000 0.619 Significant 0.633 0.263 Not Sig. 0.062 -0.013 Not Sig. Performance
3 EBIT 0.000 0.533 Significant 0.448 0.093 Not Sig 0.106 -0.012 Not Sig. 4 DPR 0.532 -0.026 Not Sig. 0.268 -0.040 Not Sig 0.519 0.094 Not Sig. 5 TAX 0.000 0.587 Significant 0.538 0.096 Not Sig 0.340 -0.007 Not Sig.
No. Variables
Firm Risk Firm Debt Firm Liquidity
P-Value Corr. (X,Y) Results P-
Value Corr. (X,Y) Results P-
Value Corr. (X,Y) Results
Agency Cost
1 ATO 0.692 0.007 Not Sig. 0.000 -0.026 Significant 0.519 -0.072 Not Sig. 2 OPEX 0.540 -0.076 Not Sig. 0.632 -0.014 Not Sig. 0.062 -0.035 Not Sig. Performance
3 EBIT 0.405 0.024 Not Sig. 0.039 -0.144 Significant 0.490 0.007 Not Sig.
4 DPR 0.129 -0.015 Not Sig. 0.072 0.030 Not Sig 0.163 0.004 Not Sig.
5 TAX 0.294 -0.121 Not Sig. 0.583 -0.125 Not Sig 0.139 0.024 Not Sig.
FIRM SIZE
According to the findings, there is a significant relationship between the firm size and the
operating expense as the proxy of the agency costs, and a significant relationship between
the firm size and earnings before interest and tax (EBIT); corporate tax as the proxies of firm
performance (rejecting the null hypothesis, P-value<0.05) in parent and subsidiary company
of BUMN. As summarized in Table 6-48, the mean of firm size was IDR Rp.51.48684 trillion,
maximum value was 733.0998 trillion, and the minimum value was IDR Rp.9.893 billion. The
coefficient correlation of firm size against firm performance was positive, that is, +0.5333 for
P a g e | 284
EBIT and +0.587 for Tax. This positive correlation means that an increase in firm size would
increase a firm’s performance. This coefficient correlation of the firm size and firm
performance is consistent with the findings of Lee (2009) who concluded that firm size has a
positive correlation with profit. In addition, firm size may influence the economies of scale
attainment; if a firm achieves the economic scale, this will influence the agency cost (Rashid,
2012) which is an important factor in determining the firm’s behaviour (Boeri, 1989). Firm
size usually provides a measure of diversification and often affects competitive issues
(Standard and Services, 2003).
THE FINDING VERSUS THE REALITY
Besides the profitability, the firm size is one of the key performance indicators formulated by
the Ministry of BUMN in LKIP 201597 (see Chapter 3). The need to increase the firm’s size is
also included in the master plan of the Ministry BUMN 2015—2019 which is intended to
reduce the number of BUMNs from hundreds to approximately 25 BUMNs (see Chapter 3,
section 3.3.1). In the context of BUMN, the firm size could be increased by a natural
business mechanism or by political consensus which is proposed by the shareholding agent
(The Ministry of BUMN). The natural business mechanism includes adding the firm’s profit to
the retained earnings and attracting investors/companies to invest their money to increase
the capital; the political consensus includes policies of merger, regrouping and holding
program policies coming from the government (shareholding agent). A firm cannot increase
its size in the short term by applying the business mechanism, unless it unexpectedly has a
profit windfall. Thus, in order to accelerate the increase in firm size, political consensus is
preferred , as mentioned in Chapter 3. The realization of the holding BUMN policy which
influenced firm size as of 31 December 2014 occurred in the industrial sectors of banking,
docking and shipping, fertilizer, cement, and plantation (see TABLE 3-7). The primary goals of
97 Laporan Kinerja Instansi Pemerintah 2015 [The Government Institution Performance Report 2015]
P a g e | 285
the holding BUMN policy are to increase competitiveness, value creation, and increase the
professionalism of BUMN. In addition, the holding program is intended to consolidate all
resource potential, strengthen the financing capability, and improve efficiency and
effectiveness. These measures will increase performance and improve employee welfare,
and in turn, this will increase profits and therefore the state’s income will increase due to
dividends and taxes (Dharmawan, 2015). However, sometimes these ambitious goals do not
align with the facts as shown in the following example:
“PTPN III98, a BUMN in plantation industrial sector becomes a holding company
comprises 13 subsidiary companies namely PTPN I,II,IV until PTPN XIV which
before the holding program they are each BUMN in plantation industrial sector.
Those BUMN gave their 90% of share to PTPN III as the holding/parent
company using transfer of state share mechanism99. This mechanism was
chosen because it was relatively not influence directly to the business operation
of each companies as the subsidiary companies (Dharmawan, 2015). The firm
size of PTPN III initially before holding as of December 31, 2013 is ± IDR 11
trillion, after holding as of 31 December 2014 increase 6 folds that is IDR 65,68
trillion100. The holding program of BUMN will be expected to increase in financial
performance significantly, such as profit, asset, and capital. The net income of
the BUMN plantation holding would exceed IDR 21 trillion and firms size would
be IDR 121 trillion in 2019 (feb/dnl, 2014).”
The holding's expectations of increasing performance and firm size will not be met if the
shareholding agent is not concerned about controlling agency costs. In this case, the holding
98 PTPN stands for Perseroan Terbatas Perkebunan Nusantara, [Nusantara Plantation Limited Liability Company] 99 Peraturan Pemerintah Nomor 72 Tahun 2014 dan Keputusan Menteri Keuangan Nomor: 468/KMK.06/2014 tanggal 01 Oktober 2014 Tentang Penambahan Penyertaan Modal Negara Republic Indonesia ke dalam Modal Saham Perusahaan Perseroan (Persero) PT Perkebunan Nusantara III [Governmental Decree No.72 of 2014 and The Ministerial of Finance Decree dated 1st October 2014 on the addition of state capital to the shares capital of PTPN III ] (Indonesia) 100 Annual Reports for PTPN III 2013 and 2014
P a g e | 286
would not create a synergy but a synergistic failure, the problems of the subsidiary company
would be transferred to the holding company. Referring to the PTPN example, at the end of
2015, the holding company of PTPN experienced a loss of ± IDR 615 billion instead of a
profit. Compared with the average costs in private companies, PTPN’s costs were 20-35
percent higher than the average costs incurred by private companies (Widianto, 2016). To
address the problem, the Ministry of BUMN implemented a comprehensive transformation
program.(Prasetyo, 2016). The transformation of PTPN included a reduction in the number
of directors, increased control of processes, and a focus on the upstream business.
The six new holding BUMNs proposed by the shareholding agent (the Ministry of BUMNs)
have been approved by the government, namely PT Pertamina (persero) as a holding
company for BUMN in the oil and gas sector, PT Indonesia Asahan Aluminium (Persero) as
a holding company for BUMN in the mining sector, PT Dana Reksa (Persero) as a holding
company for BUMN in the financial services, including the banking sector, PT Hutama Karya
(Persero) as a holding company for BUMN in the construction sector, Perum Bulog as a
holding company for BUMN in the food sector, and Perum Perumnas as a holding company
for BUMN in housing (Fitra, 2016). However, this holding policy which was proposed by the
Minister of BUMN as the shareholding agent needs more investigation according to Sri
Mulyani, the Finance Minister of the Republic of Indonesia101. Sri Mulyani argues that the
holding BUMN should also consider the political process, financial process, corporate culture
process, and socio-economic process (Sawitri, 2016). The holding process still needs to be
aligned with law and legal consideration and hence requires further study (Fitra, 2016).
The holding policy intended to reduce the number of BUMNs from hundreds to 25 BUMNs,
and conversely to increase the firm size of holding BUMNs formulated by shareholding
agents basically is converting some BUMNs into subsidiary companies. This means that by 101 ibid
P a g e | 287
definition, according to SOE Act No.19/2003, the subsidiary company is no longer part of the
BUMN. In fact, the total assets of the holding BUMN will be concentrated in the subsidiary
company, which is not subject to the SOE Act No.19/2003. Thus, to minimize the agency
problem and increase the control of subsidiary companies as a consequence of the holding
program policy, then the research finding versus reality presented in section 7.1 should be
considered: that is, the provisions for subsidiary companies of BUMNs should be included in
the SOE Act No.19/2003 and (in general) in the Limited Liability Act 40/2007.
FIRM DEBT
The findings reveal that there is a significant relationship between the firm debt and the
asset turn-over as the proxy of the agency costs, and that there is significant relationship
between the firm debt and earnings before interest and tax (EBIT) as the proxies of firm
performance (rejecting the null hypothesis) in parent and subsidiary company of BUMN. In
other words, the firm debt has a significant relationship with both the agency costs and the
firm’s performance. As summarized in TABLE 6-58, Firm Debt has a P-Value <0.05 for asset
turn-over ratio and earnings before interest and tax. The mean of the debt ratio was 62%
with 24% standard deviation. The coefficient correlation of firm debt with asset turn-over as
the proxy of agency costs is relatively weak at -0.026, whereas with EBIT it is slightly higher
at -0.144. The weak negative correlation of firm debt with asset turn-over indicates that, to
some extent, the debt instrument has not been used to improve the firm’s efficiency and
reduce the agency costs (Jensen, 1986). Other than increasing the agency costs, the high
debt ratio also increases the risk of losing control of the firm (Yazdanfar and Öhman, 2015).
In this research, the negative coefficient correlation of firm debt with EBIT shows that the use
of debt as the financial motivator to increase performance needs better debt management.
Yazdanfar and Öhman (2015) confirmed in their study that debt ratios negatively affect
profitability as a proxy of firm performance.
P a g e | 288
THE FINDING VERSUS THE REALITY
The mean of the debt ratio of BUMN and their subsidiaries in this research was 62%,
meaning that the proportion of the firms’ assets that are financed by debt is about 62%. The
debt ratio of more than 60% is considered quite high, implying greater financial risk. As of 30
of June 2015, the total debt of five BUMNs was US$31,59 million equal to IDR448,57 trillion
(Sukirno, 2015). This did not include the debt agreement between BUMNs in the banking
sector with China Development Bank i.e. US$3 million equal to IDR43,3 trillion (Safitri,
2015). The debt financing instruments need to be managed extra prudentially and on target,
because if mismanaged, then assets of the BUMNs as the guarantee will be seized by
creditors, causing the state to lose an enormous amount of economic resources. If there is
massive mismanagement of debts in BUMNs, then the effect can be contagious and will
impact on the country’s debt risk and, combined with the increase in public debt, the worst
case scenario would be similar to that of Greece (Kouretas and Vlamis, 2010).
FIRM GROWTH
The finding reveals that there is a significant relationship between the firm growth and asset
turn-over as the proxy of the agency costs (rejecting the null hypothesis) in parent and
subsidiary companies of BUMNs. As summarized in TABLE 6-58, the P-value for Firm Growth
was 0.0004 for panel data regression model for asset turn-over, but had no impact on firm
performance since the P-value was greater than 0.05 for all panel data regression model for
all performance measurements. However, the coefficient correlation of firm growth compared
with the asset turn-over ratio is - 0.001 which is very small, so it can be ignored.
THE FINDING VERSUS THE REALITY
The growth rate of BUMNs’ profit calculated by the Compound Annual Growth Rate (CAGR)
method for the years 2010—2014 was 10.58% (BUMN, 2016). This growth rate during that
P a g e | 289
period was usually due to organic growth as a result of the increase in output or sales; in
other words, growth was boosted by the customer base. In the coming years, when the
holding program of BUMNs becomes the priority, inorganic growth resulting from mergers
and acquisitions may influence the profit growth of BUMNs.
7.5. THE SUB RESEARCH QUESTION 5
Is there any significant difference between demographic attributes and company
characteristic attributes of directors or commissioners in the six (6) dimensions of
accountability of the board member duality?
I. ETHICS AND INTEGRITY DIMENSION
The finding reveals that Company characteristic attributes are more dominating in shaping
the ethics and integrity as formulated in the six (6) dimensions of accountability than the
demographic attributes. The age of the parent company and the industrial sector to which it
belongs, as Company characteristic attributes, are related to the majority of statements in
the dimension of ETHICS AND INTEGRITY. The age of the parent company may reflect the
level of the BUMN's maturity which contributes to shaping the ethics and integrity of their
corporate board members’ activities. Formally, the more mature BUMNs will have policies
regarding ethics and integrity included in a code of conduct/or ethics which contains
company values, performance philosophy, and corporate image. The policies are
understood and reinforced by directors and commissioners. They also have policies
regarding compliance requirements for directors and commissioners, which are usually
codified in the board’s manual. The communication about ethics and discussions about
ethical dilemmas are stated honestly by the commissioner. This may relate to the task of the
commissioner who provides oversight and protects the company as well as giving advice to
directors (see Chapter 2).
P a g e | 290
In addition, the industrial sector also has the responsibility to enforce the standards of ethics
and integrity for the corporate members by implementing sector regulations. As described in
Chapter 3, the BUMN in which the Minister of BUMN has a role as shareholder, also has to
follow the regulations of the industrial sector.
II. COSTS AND BENEFITS
The finding reveals that the demographic attribute of income is more dominating in COSTS
AND BENEFITS as formulated in the six (6) dimension of accountability than are the other
attributes. This means that the demographic attribute of income is the best indicator of how
the board member duality performs of his/her tasks.
All respondents in the middle average income bracket of between US$10,000—20,000
monthly state that they use their experiences to benefit both companies. This was also
supported by respondents in the upper average income bracket of between US$20,000—
25,000 monthly. Interestingly, the respondents with the highest average monthly income
above US$25,000 disagree that board member duality holders will use their experiences to
the advantage of both companies.
It seems that this finding supports Brick et al. (2006)’s argument that an excessive salary for
directors does not improve a company’s performance; neither does it contribute to its under-
performance. The conflict of interests of the board member duality holder that may arise as a
result of the parent-subsidiary company relationship is still a grey area since respondents in
all income brackets expressed diametrically opposed views, and were divided almost “fifty-
fifty” on the issue. As Wymeersch (2003) stated that the typology of the various groups in a
company will influence the level of conflicts of interest (see Chapter 2). “The fifty-fifty”
findings may be caused by respondents who came from various typologies of group
companies. The respondents in the middle and upper average monthly income bracket
P a g e | 291
between US$20,000—25,000 prefer to choose the interests of the parent company than
those of the subsidiary company.
III. REGULATION
The finding reveals that the age of a company is more dominating in REGULATION as
formulated in the six (6) dimensions of accountability than are the other attributes. The age
of the parent company has a significant correlation with director accountability formulated in
REGULATION. The age of the parent company may indicate that a regulation regarding
conflicts of interest has been included in corporate policies. Such a regulation may mean
that directors and commissioners of the parent company will not be permitted to be involved
in a business as a subcontractor to either the parent and/or subsidiary company. The more
mature parent company may have also established rigorous criteria for the appointment of
the subsidiary’s directors and commissioners, followed by appointees signing a management
contract which includes key performance indicators.
Even though the demographic attributes are not dominant, gender and income influence the
director accountability formulated in REGULATION. The demographic attribute of gender has
significant difference with the statement that the role of dual director should be regulated in
the SOE act, whereas the demographic attribute of income has significant difference with the
director accountability that the role of Dual Directors should be regulated by a code of ethics
and/or code of corporate governance.
The majority of respondents in all categories agreed that the board member duality should
be regulated. The regulation could be included in the SOE act, the code of conduct and
ethics, or in the code of corporate governance which governed the parent and subsidiary
companies. Among these measures, regulation by means of the SOE act was the least
preferred. A ministerial decree to regulate the board member duality was preferred by most
respondents (see the in-depth interviews in TABLE 6-48).
P a g e | 292
The majority of respondents in all categories agreed that there was a need to develop
guidelines for regulating the parent-subsidiary company relationship, including a mechanism
to overcome any conflict of interests. The in-depth interviews revealed the respondents’
belief that making disclosures at board meetings was one means of preventing the conflict of
interests (see the in-depth interviews in TABLE 6-48).
IV. ROLE OF DUAL DIRECTOR
The finding reveals that demographic attributes are more predominant in the ROLE OF DUAL
DIRECTOR as formulated in the six (6) dimensions of accountability than the company
characteristic attributes. The demographic attributes show that the board member duality
holders tended to favour the parent company or the subsidiary company in decisions that
affected both companies. However, the majority of the board member duality holders
preferred to report to shareholders when they made decisions affecting both companies.
The majority of respondents in all categories agreed that the board member duality holder
can bring the same quality of performance to the execution function as a director in the
parent company and to the oversight function as a commissioner in a subsidiary company.
Gender attribute has a relationship with the decision preferences to parent company rather
than subsidiary company and disagree that the political intervention on boards is common .
The gender issue in a corporate directorship attracts researchers to investigate whether
there are differences in company performance if women are given more opportunity to be
corporate board members. Farrell and Hersch (2005) and Daily et al. (1999) noted that the
number of women who are appointed as directors increased significantly during the decade
of the 1990s. This trend was also found by Bilimoria and Piderit (1994) who investigated, in
particular, the “Effects of sex-based bias”. The increase in the number of women serving as
corporate board members is not merely because of gender equality; recent research has
shown that companies who have more women on corporate boards produced better
P a g e | 293
corporate performance (see Lückerath-Rovers (2013), Liu et al. (2014), and Post and Byron
(2015).
In contrast to previous research on the gender issue, the number of female
directors/commissioners in BUMN and subsidiary companies is very limited (see Pie Chart
6-3) and neither is this regulated in the SOE Act 19/2003 or the technical regulations derived
from it. Meanwhile, a number of countries in European jurisdiction have applied a fixed quota
for female representation on corporate boards. Austria has a minimum quota of 25%;
Belgium requires a quota of 1/3; Finland requires a minimum of 40% for both genders;
Sweden and Norway expressed formal targets for both genders, although not as quotas. In
Sweden’s case it is 40% representation of both genders, and in Norway there is equal
gender representation (OECD, 2013).
The majority of respondents in all categories also agreed that the appointment of the
directors and commissioners in the state-owned enterprises should not be a political
appointment. However, they were not sure whether the appointment was immune from
political intervention.
V. FINANCIAL ACCOUNTABILITY
The finding reveals that the demographic attribute of income is more dominating in
FINANCIAL ACCOUNTABILITY as formulated in the six (6) dimensions of accountability than are
the other attributes. This means that the demographic attribute of income is the best
predictor of how the person with board member duality performs his/her tasks regarding
financial accountability. The result is consistent with the finding for the dimension of COSTS
AND BENEFITS where all respondents who had a middle-range average monthly income
between US$ 10,000—25,000 agreed that the board member duality will increase a
subsidiary company’s performance. This was supported by all corporate board members in
parent companies. However, the opposite view was expressed by respondents in the highest
P a g e | 294
average monthly income bracket, who believed that the board member duality will increase a
subsidiary company’s performance (see Brick et al. (2006) in Costs and Benefits). This view
was supported by several corporate board members in subsidiary companies and the
holders of board member duality. Interestingly, several respondents in the low average
monthly income bracket (US$ 2,000—10,000) also supported the view of the respondents
with the highest average monthly income.
The majority of respondents in all categories agreed that the shareholders of a subsidiary
company were responsible for formulating the remuneration scheme for commissioner and
directors, and the board member duality holder should not receive any income, such as a
commission, other than that stated in the remuneration scheme. However, respondents were
divided on the issue of whether the board member duality holder should be involved in
establishing the salary schedule. Slightly more than half of the respondents believed that
they should not be involved in deciding the salary schedule.
They also agreed that the remuneration scheme of the corporate board should be the same
as that of the parent company, and that the board member duality could improve the
subsidiary company’s performance. However, they did not agree that the dividends paid to
the parent company will be less when the board member duality structure exists in the
parent and subsidiary company relationship. However, the in-depth interview responses
indicated that if the respondents had to make a choice regarding the dividend policy, then
the board member duality holder had to follow the parent company’s direction.
VI. LEADERSHIP
The finding reveals that both the demographic attributes of the number of director positions
held and company characteristic attributes of the parent company age were balanced in
LEADERSHIP as formulated in the six (6) dimensions of accountability, unlike the other
attributes. This means that corporate board members who were leaders and who held
P a g e | 295
several positions in more than one company are aware on the conflict of interests that may
arise. On the other hand, when considering the age of the parent company, it was apparent
that the level of maturity of the BUMN may contribute to the leadership style of a corporate
member, especially if the BUMN has a policy in place to prevent any conflict of interests.
The findings reveal that all corporate board members who serve in more than one company,
including the board member duality holder, agree that the board member duality holder, who
is also a shareholder of a subsidiary company and chairs the annual general meeting of
shareholders, could possibly experience a conflict of interests. Interestingly, the corporate
board members of those BUMNs which are relatively mature (41—50 years old) and
relatively young (<20 years old) in terms of putting the corporate policy into practice, argue
that the chair of the annual general meeting of shareholders should not have a conflict of
interests. Thus, there should be a mechanism in place to prevent any conflict of interests
that may arise in that situation. The results of the in-depth interview show that the
respondents preferred to choose a director of the parent company as the chairman of the
general meeting of shareholder of a subsidiary company, who did not hold a position as a
duality board member.
P a g e | 296
CHAPTER 8: CONCLUSIONS, RECOMMENDATIONS, AND IMPLICATIONS “It is essential that the activities of corporate executives are under constant,
vigorous and public scrutiny, because those activities are crucial to the economic well-being of society. If anything, developments both locally and internationally during 2001 have emphasized the need to continuously update and upgrade
corporate governance standards. “ - Ann Crotty (Business Day)-
INTRODUCTION
This chapter comprises five sections. SECTION 8.1: SUMMARY OF CHAPTERS which presents
summaries of essential content of each chapter from this thesis. SECTION 8.2:
RECOMMENDATIONS will present recommendations for the legislature, executives, and
BUMNs regarding the parent and subsidiary company governance, especially regarding the
structure of board member duality in BUMN. SECTION 8.3: IMPLICATION FOR THEORY presents
the implications of the research findings for the Agency Theory which becomes the
fundamental theory of the research propositions. SECTION 8.4: IMPLICATION FOR POLICY AND
PRACTICE presents several implications for policy makers and business practitioners
regarding the board member duality structure in BUMN. SECTION 8.5: LIMITATIONS AND
IMPLICATION FOR FURTHER RESEARCH presents the limitations of this research related to the
methodology and data, so further research to address those limitations is suggested.
SECTION 8.6, CONCLUSION, presents the conclusions drawn from the research findings.
8.1. SUMMARY OF CHAPTER
8.1.1 The Research Context, Aims, and Significance of the Research
In the two-tier board system which divides the corporate board into two boards, namely the
oversight board commonly known as the board of commissioners, and the management
board usually called the board of directors. The two-tier board system enables the directors
P a g e | 297
of a parent company to also serve as commissioners in subsidiary companies (director
duality). This research proposes a new term to refer to this duality situation: “board member
duality”. The board member duality is a specific duality situation as described above, and is
different from the director dualities which have been the subject of extensive research,
namely CEO duality, interlocking directorship, and multiple directorship. The specific
characteristics of the board member duality compared to other director dualities are the
integration of the executive function and the oversight function, albeit in different entities, but
in parent and subsidiary companies. The parent and subsidiary relationship is significant
because, even though each company is an independent entity from the legal perspective, in
fact the parent company can influence in the subsidiary company’s policies. This situation
may also differentiate this study from previous research which was not focused on the
corporate governance of parent and subsidiary company.
The board member duality in state-owned enterprises is more complicated when the duality
holders, the parent company's directors, also are given the role of “ shareholding agent” of
subsidiary companies by the Ministry of State-Owned Enterprises. In practice, this means
that a board member duality possibly have three positions simultaneously, namely as
director of the parent company, the commissioner of a subsidiary company, and the
shareholder of a subsidiary company, which may produce a conflict of interests. Previous
research related to this issue usually focused on the impact of the director duality on agency
costs and firm performance. The gap in this field of research was addressed through the
formulation of the new term “board member duality” in the context of the two-tier board
system in parent and subsidiary companies of BUMNs in Indonesia.
Thus, this research was an attempt to address the broad question: does the board member
duality in the State-Owned Enterprises (BUMN) have a significant impact on a firm’s
performance and its agency costs? How is the accountability of board member duality
P a g e | 298
monitored And more importantly, how should “the shareholding agent”, the parent
company and the Ministry of BUMN, respond to the impact of the board member
duality in parent and subsidiary governance in order to control the agency costs and
to increase in the BUMN’s performance. Based on the findings of this research,
recommendations have been made which may assist relevant parties with their decisions
and policy making. The objectives of this research were formulated after a literature review
as the basis of academic conjecture, and by investigating the provisions contained in the
constitution, several laws, government decrees, ministerial decrees, the verdicts of the
Constitution Court, Supreme Auditor releases, and relevant information from the national
media.
The literature review was focused on works related to director duality in both one-tier and
two-tier systems, which also describe the accountability of a dual director in each corporate
board system as part of corporate governance mechanism. Therefore, the corporate board
model, design, duties and activities that provide a more comprehensive review of the dual
director issue of this research were included in the literature review. Then, the various
theories relevant to this issue were used to analyze the corporate board and its impact on a
firm’s costs and performance. The firm’s costs are those arising from the agency problem
which is described by Agency theory and is the basis of the theory used in this research.
However, the antithesis of the Agency theory, namely Stewardship theory, is also included in
the literature review to give a balanced and broader perspective. Several opposing theories
are presented: social contract theory versus institutional theory, managerial hegemony
theory versus class hegemony theory, and stakeholder theory versus resource-dependency
theory. The literature review revealed that there was inconsistent evidence regarding the
impact of director duality on performance and agency costs. Some researchers found a
positive association, others found a negative association, and some researchers found no
systematic relationship.
P a g e | 299
To achieve the intended objectives specified in this research, its scope and limitations were
identified and highlighted. This research was confined to parent companies’ directors who
also serve as commissioners in one or more subsidiary companies - a situation that is known
as board member duality in the parent and subsidiary companies of state-owned enterprises.
As a basis for the theoretical framework, a panel data sample from 2009—2013 was
triangulated with surveys and interviews conducted at the end of 2014. The research
question and sub-research questions guided the research process.
8.1.2 Summary of the Theoretical Framework
This research designed and developed a conceptual model for the theoretical framework
after a detailed analysis of the literature relating to this field of research. The aim was to
establish a thematic linkage between the board member duality in parent and subsidiary
companies in State-Owned Enterprises (BUMN) and agency costs which would support
policy makers in addressing issue of corporate governance practice in State-Owned
Enterprises.
According to the literature, the governance structure of the governing body in parent and
subsidiary companies is based on the two-tier board system which differentiates the
oversight board from the management board. Then, the director duality structure that exists
in parent and subsidiary companies, i.e. the board member duality was compared with the
board member non-duality structure in order to analyze flows of agency costs, as well as the
flows of return, investment, and expense. The theoretical framework also presents the theory
used in this research and financial measurements to analyze several variables. These are
the dependent variables and independent variables which indicate agency costs and firm’s
performance variables explained together with control or explanatory and endogenous
variables. In addition, the demographic attributes and company characteristic attributes are
also identified in the additional framework to assess and determine the progress of the board
P a g e | 300
member duality holder regarding the 6 (six) dimensions of accountability of the board
member duality in the State-Owned Enterprises in Indonesia.
The analysis and explanation of the theoretical framework were aimed at addressing the
research question and the research sub-questions. There are 1 (one) research question
which flourished into 4 (four) research sub-questions. The 1 (one) research question which,
using the analysis, tried to measure the impact of the board member duality against agency
costs represented by asset turnover ratio and operating expense. The 4 (four) research sub-
questions which, using the analysis, to measure the impact of the board member duality on
the firm’s performance represented by earnings before interests and tax (EBIT), dividend
payout ratio (DPR), and corporate tax, and to measure the influence of the control variables
and endogen factors on the model designed for the board member duality against the
agency costs and firm’s performance, and determine the progress of the accountability of the
board member duality in the State-Owned Enterprise in Indonesia.
8.1.3 Summary of the Methodology
The research used both qualitative and quantitative methodologies which were brought
together in the triangulation method which combines data triangulation (primary and
secondary) and methodology triangulation (survey, interview, and panel data). The primary
data were collected using surveys and in-depth interviews, whereas the secondary data was
collected from each company to create the panel data. The questions and statements for
both the surveys and in-depth interviews were essentially the same, grouped according to 6
(six) dimensions of accountability of the board member duality in State-Owned Enterprises,
whereas the panel data was extracted from the financial reports and financial notes
published in the annual reports of each State-Owned Enterprise and subsidiaries.
P a g e | 301
Qualtrics software was used for the survey, giving both descriptive and chi-squared (X2)
statistics which presented the demography of respondents and the level of significance of
the individuals’ attributes and company characteristic attributes in terms of each
statement/question in the survey. In-depth interviews with respondents who have high
profiles and expertise in corporate governance in the State-Owned Enterprises were used to
confirm the results of the survey. The E-Views software was used to test the panel data
regression model which involved a common effects model, random effects model and fixed
effects model. The cross-section weight in the generalized least square (GLS) method was
used in the panel data regression model to address the big data differences in financial
figures between parent company and subsidiary companies. All the results of each research
instruments were integrated, compared and analyzed into the integrated matrix analysis
which determined the level of consistency regarding the impact of the board member duality
against agency costs and performance.
The survey respondents were commissioners and directors of the state-owned
enterprises and subsidiaries companies who received the questionnaire survey by on-line
and off-line methods including faxes, couriers, and e-mails. In total, 511 survey forms were
distributed and 139 were returned, giving a response rate of 27.20%. Four responses were
rejected as the surveys were not completed, leaving a total of 135 responses for the
analysis. Fifteen respondents targeted for the in-depth interviews and comprised Members
of the Supreme Auditor, Deputies of the Ministry of BUMN, Directors and Commissioners of
Parent Companies and Subsidiary Companies of BUMNs. Eleven out of 15 respondents
were willing to be interviewed, obtaining a response rate of 73.33%. The panel data,
comprised of 235 observations comprised the statistical data set, originating from 10 parent
companies and 37 subsidiary companies for the period of 2009—2013.
P a g e | 302
8.1.4 Summary of the Research Results and Discussion
Several findings were obtained from various stages of this research. The research findings
are essentially divided into two parts: the findings regarding the impact of the board member
duality against the agency costs and performance; the findings regarding the six dimensions
of accountability comprising ethics and integrity, costs and benefits, regulation, role of dual
director, financial accountability and leadership. Those findings were compared with
previous research addressing the similar issues of director duality, and were analysed in the
context of the current reality in corporate governance practices of the State-Owned
Enterprises in Indonesia.
The findings revealed that there is a significant relationship between agency costs and the
board member duality in parent and subsidiary companies of BUMNs, but no significant
relationship with firm’s performance in the period 2009-2013. The asset turn-over ratio and
operating expenses were used as proxies for the agency costs, whereas earnings before
interests and taxes (EBIT), dividend payout ratio (DPR), and corporate tax were used to
indicate the firm’s performance. The endogenous variables i.e. the board size, the board
composition, and the government ownership and explanatory variables i.e. the age of firm,
debt ratio, growth, liquidity, risk and firm size, were also included in the model to explain the
comprehensive context of the variables that might influence the agency costs and
performance. The previous research on director duality revealed three types of relationships
regarding agency costs and performance, namely positive relationship, negative relationship,
and no systematic relationship. This research found that there was no relationship between
CEO duality and agency costs; the duality only gives enormous power to the CEO but at the
same time will decrease the checks and balances in the monitoring system.
The research findings that there was positively significant relationship between the board
member duality and the agency costs based on panel data acquired from the parent and
P a g e | 303
subsidiary company for the period 2009—2013 (Rejecting Null Hypothesis), have gained
some relevant support when the Minister of BUMN issued the Ministerial Decrees No. PER-
03/MBU/02/2015 and PER-04/MBU/2014. These decrees have been able to exert some sort
of control on the board member duality and the operating expenses incurred as a
consequence of the directors’ appointment in BUMN and their role in the subsidiary
company. However, it appears that board member duality does not produce a significant
improvement in the subsidiary company’s performance. As shown in the panel data
regression model, there was no significant relationship between the board member duality
and firm's performance (accepting the Null Hypothesis). This may be due to the fact that no
key performance indicators have been specified by the shareholding agents as a means of
evaluating the role of the board member duality holder regarding the subsidiary’s
performance. More importantly, the target of dividend payout and corporate tax, as the two
out of three proxies of firm’s performance, have been decided more by political consensus
between the government (executive) and House of Representatives (legislative) when
preparing the state income budget than do the internal targets of BUMNs.
The finding versus reality reveals that the SOE Act 19/2003 does not have provisions for
subsidiary companies, which is crucial for situations of board member duality in the parent
and subsidiary companies. However, in other countries, the subsidiary company is also
subject to regulations stipulated by, for example, State-Owned Enterprise Act 90/1992 of
Victoria State Australia, Government-Owned Company Act 1993 of Queensland State, and
The State-Owned Enterprise Act 1986 of New Zealand. In fact, the parent companies could
use their subsidiary companies for tunneling out their assets, but at the same time, the
parent company also takes the risk embedded in the doctrine of piercing the corporate veil
that may threaten parent company operations. In addition, the Limited Liability Act
No.40/2007, as the company law in Indonesia, does not include provisions for the subsidiary
company. The Ministry of BUMN as the shareholding agent has issued several decrees to
P a g e | 304
cover the regulation of subsidiary companies, although the legal basis of the ministerial
decrees is not as strong as the statute/act. The successor of the Minister of BUMN could
always issue new ministerial decrees to replace the ones issued by his/her predecessor.
Meanwhile, the Master Plan of BUMN is intended to reduce the number of BUMNs by means
of the holding programs; this means that the majority of assets will reside in the subsidiary
companies.
The endogenous variables, i.e. the board size, the board composition, and the government
ownership, are included in the panel data regression model to obtain a comprehensive
understanding of their relationship with the agency costs and firm's performance. The board
size was significantly related to the firm’s performance in terms of earnings before interest
and tax (EBIT) and corporate tax, but had no relationship with the dividend payout ratio. The
mean and median of the board size is for 9 corporate members, whereas the board size
considered effective was between 7 to 13 members. There was no significant relationship
between the board composition (the data focuses only on the proportion of directors who
have board member duality, not the proportion based on expertise) and the agency costs
and firm’s performance, whereas the government ownership gave a slightly positive
relationship with the assets turn-over.
The explanatory variables of firm size and firm debt have a significant relationship in terms of
the agency costs and the firm’s performance. The increase in the firm size indicates an
increase in firm’s the performance. However, at the same time, the increase in firm size will
also influence the agency costs. The finding versus reality showed that the increase in firm
size using political consensus such as executing the holding program in the plantation sector
rather than a natural mechanism very often does produce the expected results. The mean of
the firm debt ratio in the data sample was relatively high at 62% and the use of debt for
financial leverage and to optimize the capital structure has not succeeded in maximizing the
P a g e | 305
profit. The research finding shows that there is a negative association between debt ratio
and firm’s performance for the parent and subsidiary company sample for the period 2009—
2013. BUMNs need to have a better way of managing debt. The firm growth had a slight
impact on the agency costs, indicated by their negative association in the model. The
increase in revenue also produced an increase in operating expenses as the proxy of the
agency costs.
Dimension six of accountability reveals that company characteristic attributes are more
influential than individuals’ attributes in shaping company ethics and integrity. The age of a
firm may reflect the BUMN’s maturity, indicating that the policies regarding ethics and
integrity have been established and practised. This finding was consistent with the finding for
the Regulation dimension that company characteristic attributes were more influential than
individuals’ attributes. There was also a significant difference between individual and
company characteristic attributes in terms of gender. Females were poorly represented on
corporate boards of BUMNs, although several previous studies have shown that those
companies with more women on corporate boards experienced better corporate
performance. In several countries, a fixed quota for female representation on corporate
boards has been applied. Austria has a minimum quota of 25%; Belgium requires a one-third
quota; Finland requires a minimum of 40% for both genders; Sweden and Norway
established formal targets for both genders, although not as quotas; in Sweden’s case, it is
40% representation of both genders, and in Norway, it is equal gender representation
(OECD, 2013). The financial accountability dimension also showed that the income attribute
is the best predictor of the duality holder response. Too high or too low an income causes
the board member duality holders to be less committed to boosting a subsidiary's
performance. Finally, the leadership dimension reveals that in order to prevent the conflict of
interests that may arise, the position of chairman of the shareholder meeting should not be
held by a duality holder.
P a g e | 306
8.2. RECOMMENDATIONS
The research findings which were discussed in Chapter 7 and several sections in Chapter 8
reveal that board member duality was associated positively with operating expenses as the
proxy of agency costs, but ironically the board member duality did not have a significant
impact on the firm performance in BUMNs in Indonesia. In addition, individual and company
characteristic attributes were analysed in the sixth dimension of accountability of the board
member duality. It was found that company characteristic attributes were stronger than the
individual’s attributes in the dimension of ‘Ethics and Integrity’ and ‘Regulation’, whereas the
individual’s attributes were stronger than in the dimension of ‘Costs and Benefits’, ‘Role of
Dual Director’, and ‘Financial Accountability’. Individuals’ and company characteristic
attributes were relatively balanced in the dimension of ‘Leadership’. Based on those findings
and discussion which are presented in Chapter 7, this research offers several
recommendations to the Legislature, the Government, and the Shareholding Agent, as
follows:
8.2.1 At Legislative Level
At the macro level, Indonesia needs a comprehensive corporation law which enables and
accommodates any types of legal business to grow healthily, fairly, accountably,
responsibly, and benefiting the public. The current corporation law in Indonesia is the
Limited Liability Company Law no.40/2007 which essentially only regulates the companies
having the legal form of limited liability. The other types of legal business forms are regulated
by the Mandatory Company Registration Law No.3/1982 which is inadequate for the rapidly
growing business types that are emerging in the digital era. A comprehensive corporation
law could become the umbrella law for any types of legal business forms. A comprehensive
corporation law could be proposed to the legislature for inclusion in the National Legislation
Program list.
P a g e | 307
At the micro level, several findings of this research reveal the need to add provisions to or
amendments of the Limited Liability Law no.40/2007 and the State-Owned Enterprise Act
no.19/2003 regarding the control of the agency costs incurred in parent and subsidiary
governance. The following recommendations attempt to address this need:
1) The subsidiary company should be defined in the Limited Liability Law No. 40/2007 as
a reference source for other legislations including the provisions (see the finding
versus the reality of research question 1; sections 7.1.);
2) The subsidiary company should be defined in the State-Owned Enterprise Act
No.19/2003 and could refer to the Limited Liability Law amendment (see the finding
versus the reality of research question 1; sections 7.1.);
3) The subsidiary company of a BUMN should be defined in the State-Owned Enterprise
Act and include the provisions which cover the parent and subsidiary companies’
governance (see the finding versus the reality of research question 1; sections 7.1.);
4) The State-Owned Enterprise Act may decide the number of female representatives on
the corporate board of a BUMN. It should specify a definite quota, a minimum number,
a formal target, or an equal number (see the section 7.5. IV.The role of Dual Director);
and
5) The State-Owned Enterprise Act should specify the board size that is considered
effective for BUMNs. As a reference, the research suggests that the number of
members required for an effective corporate board (commissioner and director) of a
BUMN is 7—13 members (see the finding versus the reality; Section 7.3.).
P a g e | 308
8.2.2 At Government Level
The government as a regulator will apply the same rules to all BUMNs regardless of the
industrial sector in which the BUMNs operate. The findings and discussion reveal that the
Ministry of BUMN as the regulator has been aware of the need to control the agency costs
by issuing the Ministerial Decree of BUMN No.PER-04/MBU/2014 on The Guidance of
Remuneration for Directors, Commissioner, Oversight Board of State-Owned Enterprise.
However, in order to succeed in the implementation of the ministerial decree and ensure the
compliance of all the board member duality holders:
1) The remuneration should be supported by the internal control system, in order to monitor
the compliance of all corporate boards with the ministerial decree issued by the Ministry
of BUMN (see the finding versus the reality of research question 1; sections 7.1.);
2) The internal auditor conducts the financial auditing with the specific target of periodically
auditing expenses and compliance (see the finding versus the reality of research question
1; sections 7.1.).
Then, the government should strengthen the institution of BUMN, since the findings reveal
that a company’s characteristic attributes were stronger in shaping the ethics and integrity
dimension than were the individual attributes (see section 7.5.); therefore:
3) Corporate governance assessment which ensures that BUMNs and their subsidiary
companies have been implementing good corporate governance should be conducted
periodically.
8.2.3 At shareholding Agent Level
The shareholding agent is the agent who acts as a shareholder. The Ministry of BUMN,
when acting as a shareholder of BUMN, could also be considered as the shareholding
P a g e | 309
agent. Thus, the Ministry of BUMN has dual roles, namely as regulator and shareholding
agent. The director of a parent company who is simultaneously a shareholder of the
subsidiary company is also called the shareholding agent. Therefore, the following
recommendations are addressed to shareholding agents.
1) The Ministry of BUMN as the Shareholding Agent
(1) In line with the role of the Ministry of BUMN as the regulator, strengthening the
institution of BUMN, which has an impact on ethics and integrity, could be performed
via the decisions of the general meeting of shareholders by the Ministry of BUMN as
the shareholding agent. For example, this could include the establishment of a
corporate policy, corporate charter, board manual, code of corporate governance,
code of ethics, the appointment of a corporate governance assessor etc. (see
section 7.5.)
(2) Appointing the number of corporate board member as considered effective and the
number of female directors proportionately.
(3) A policy regarding the conflict of interests occurring in the board member duality and
resolution should be established (see section 7.5). In addition, the chairman of the
general meeting of the subsidiary company shareholders should not be the
shareholding agent who is the holder of board member duality.
(4) Evaluating the remuneration formula for the corporate board member periodically,
because either too low remuneration or too high remuneration is going to have
relatively same impact that the board member duality holder would not give the best
response to increase the subsidiary performance ( see section 7.5.); and
(5) Establishing the Key Performance Indicators for the parent company which covers
the performance of the subsidiary company, tax compliance, and increasing in firm
size (7.2.)
P a g e | 310
2) The Parent Company Director as the Shareholding Agent.
(1) Strengthening the ethics and integrity of institutions by implementing good corporate
governance practices in both parent company and subsidiary company (section 7.5.).
(2) Applying points (2), (3), (4), and (5) for subsidiary companies; and
(3) Implementing better debt management as the financial leverage to increase firm
performance.
8.3. IMPLICATIONS FOR THEORY
This research has substantial implications for the Agency theory. Our research results
confirm the Agency theory according to which the principal-agent relationship may create
agency problems which give rise to the agency costs. The board member duality structure
occurs when the principal or shareholder appoints the parent company's director to serve
simultaneously as the commissioner in a subsidiary company. In the context of Agency
theory, the duality holder is the agent of the shareholder. Uniquely, the shareholder of a
BUMN or of a subsidiary company actually is the shareholding agent of the state which is
delegated by the ultimate shareholder, i.e. the Public of the Republic of Indonesia. The
board member duality impact negatively upon the agency costs which were defined as the
costs incurred as a result of agency problems. The agency costs could be controlled if the
principal establishes policies whereby the agent is given authority by the principal and
monitors the implementation of policy by analysing the management report and the audit
process to ensure the responsibilities of the board member duality in parent and subsidiary
companies have been fulfilled.
The extensive literature review and evidence from this research indicate that the absence of
provisions for a subsidiary company in the regulatory framework will decrease the
accountability and transparency of the relationship between parent and subsidiary
P a g e | 311
companies and in turn, will degrade the quality of corporate governance of BUMN in
Indonesia. Further, it highlights the linkage between the board member duality and the
agency costs, and the firm’s performance. Therefore, the board member duality structure in
parent and subsidiary companies of BUMNs needs to be accompanied by a strong
regulatory framework that will control the agency costs, and simultaneously improve the
firm’s performance. This research also addressed the gap in knowledge regarding director
duality that exists in State-Owned Enterprises, and emphasized the importance of improving
the quality of corporate governance in parent and subsidiary companies in the State-Owned
Enterprises. Moreover, this research also provides practical recommendations to strengthen
the quality of corporate governance practised in parent and subsidiary companies that have
the board member duality structure.
8.4. IMPLICATIONS FOR POLICY AND PRACTICE
This research has many implications for policy makers, business practitioners, shareholders,
and BUMNs in Indonesia. It is critical that the legislature be able to provide a strong legal
framework that is comprehensive enough to apply to business activities in both private and
public sectors. The legal framework should clearly define the type of relationship between
one company and another company, and the legal aspects which include the subsidiary
company relation, joint venture, shell company, merger, etc. which grow dynamically and
fast. The legal framework should also provide equal protection for the shareholder,
especially for the minority interests which may be negatively affected by the unhealthy
practices of corporate governance (bad corporate governance). The legislature’s good
intentions to improve the legal framework of business activities in both the private sector and
State-Owned Enterprises will encourage other parties to participate in the improvements.
The improvement is positive, but the intervention is not. The inclusion in the laws of business
judgment rules for the corporate actions of BUMN will increase the effectiveness of law. In
P a g e | 312
turn, certain laws may give the corporate BUMN administrators the courage to take a
calculated risk to improve the performance of their respective BUMN. Moreover, a strong
and comprehensive legal framework will prevent or minimize bad corporate governance
practices in terms of the relationship among corporations, including the relationship between
the parent company and its subsidiary.
Since the government is the regulator, the implications of the research results will enable it
to improve its efficiency and corporate governance of BUMNs, especially regarding director
duality. The government will maintain a level playing field for all BUMN business activities.
The rules of the game for BUMNs which are issued by the government and are usually
established by the Ministry of Finance, The Ministry of BUMN, and other Technical
Ministries, will shape the corporate governance in Indonesia. Therefore, the corporate
governance of the parent and subsidiary company which include the board structure,
process, and rule shall be underlined and subject to good corporate governance rule. The
subsidiary governance is expected to be more adept in implementing the corporate
governance principles so that it is transparent, accountable, responsible, independent, and
fair (TARIF).
The shareholding agents who are given authority to govern the BUMN and subsidiary will be
more accountable and transparent in appointing the corporate board of BUMN. Inefficiency
regarding the board member duality which raises the agency costs will be minimized. On the
other hand, a set of key performance indicators for directors and commissioners of BUMN to
achieve the targeted performance will be developed comprehensively and logically. The
conflict of interests associated with the chairman of the general meeting of shareholders that
may arise could be prevented or resolved by the mechanism explained in the procedure of
the general meeting of shareholders. The issue of remuneration is a common but sensitive
one when predicting the corporate board response, so the shareholding agents would
P a g e | 313
periodically review the remuneration formula, especially when deciding the bonus for the
holders of board member duality.
8.5. LIMITATIONS AND IMPLICATIONS FOR FURTHER RESEARCH
The major limitation of this research is that the references for board member duality in the
State-Owned Enterprise which follows a two-tiered board system, especially for Indonesia
were very sparse, as was the availability of data for the subsidiary companies of State-
Owned Enterprises. As a result, a concerted effort to collect panel data for duality modelling
generated only a relatively small amount of panel data spanning only five years (2009—
2013).
Secondly, not all classical assumptions of statistical data were applied in this research,
because the panel data acquired in this research was relatively limited spanning only five
years. However, the limitation of the panel data modelling was minimized by comparing the
panel data results with the results of the surveys and in-depth interviews summarized in the
integrated matrix analysis for confirmation of the results.
Thirdly, there were many endogenous and explanatory variables in the model; therefore,
only those endogenous and explanatory variables that have significant values in the model
were subjected to in-depth analysis.
The triangulation method applied in this research was expected to produce comprehensive
quantitative and qualitative results for all research instruments. However, an overemphasis
on the methodology may produce several unwanted consequences and limitations as
follows:
1) The objectivity of the research is frequently questionable, and raises concerns for
sociologists and other social scientists who have long debated the objectivity issue.
This poses a challenge to the simplistic understanding of the objective scientific
P a g e | 314
methods (Letherby et al., 2012). Are the issues raised in the research question truly
objective or will they lead to bureaucratic dehumanization? (Brieschke, 1992). The
researcher has used his previous experiences in corporate governance and explored
the issue by discussing it with the relevant experts, and has attempted to understand
the respondents' perceptions of the research issues.
2) The triangulation or mixed-methods approach was very time consuming since this
research method requires that each of the quantitative and qualitative processes be
finalized before moving to the integrative analysis stage process (see Terrell (2012)).
Integrating quantitative and qualitative methods mean that two different paradigms are
being integrated, which may destroy the epistemological foundation of each
(Rosenberg, 2015). The researcher spent considerable time on the data analyses and
used the panel data results as the basis, and then integrated them with the results of
the survey and in-depth interviews to support (or otherwise) the panel data results.
3) The quantitative method is an adequate means of presenting the data, although the
researcher may sometimes encounter difficulties in interpreting the results. In addition,
quantifying a social behavior by means of statistics is very often a simplistic way of
representing a more complex reality (Rossman and Wilson, 1985). The over reliance
on the P-values and sample size will occur in the statistical tests. Thus, the
manipulating of P-values using the sample size could occur in the statistical testing
(Ioannidis, 2005).
4) The qualitative method was appropriate for describing a quality or the characteristics of
a research object, but had less statistical power to verify the trend than did the
quantitative approach. However, the researcher took the risk of collecting too much
information some of which was not relevant to the research issue and could not be
P a g e | 315
used in the analysis. The complexity of the data obtained from the in-depth interviews
might not have been summarised adequately, and fine details were omitted. In
addition, the selection of words and data during the data analysis and discussion
phase may be prone to subjective judgement. As a result, the analysis of qualitative
data is difficult (Dixon-Woods et al., 2004). This research has attempted to reconcile
the shortcomings of the various research methods by integrating all the research
instruments into the integrated matrix analysis.
5) The panel data regression model might not represent the phenomena, might be biased
and not efficient since several classical assumptions tests might not have been
applied. When all classical assumptions have to be tested in order to hold true, then
the problem regarding the sample size occurs, (see the normality test section 6.3.3).
However, the number of annual reports of BUMNs and their subsidiaries published in
the public media, as a sample for the research, were relatively limited. The
researchers compared the panel data regression model using a common effects
model, a fixed effects model, and a random effects model, and also applied a
Hausman-test to find the better model. Since there was a considerable discrepancy
between the statistics of the parent company and subsidiary company, the GLS
weighted of cross-section was applied to the model. When the model results had P-
values less than 0.05 and the R2 was close to 1, then that model was chosen.
6) There is always that risk that respondents will misunderstand survey questions and/or
statements. Regarding errors in human judgement, Schwarz (2014) states that “minor
variations in the research procedures used or the question asked, can result in major
differences in the obtained results, sometimes suggesting opposite conclusions about
the issue under investigation.” The researcher has attempted to minimize the risk by
reviewing the questionnaire with the assistance of a linguistic expert, and also the
P a g e | 316
expert on the research area including the supervisor. Moreover, the researcher
ensured that relevant explanations and clarifications were provided in the survey form.
7) The ethical consideration requires the promise of confidentiality to respondents. This
means that findings and discussions should be made more general. Occasionally, the
general view will result in lack of clarity or ambiguity since too much data can reveal
the identity of a respondent.
Some respondents did not respond or only partly responded to the survey. This might not
have significantly influenced the results, as Czaja and Blair (1996) suggest that if the number
of non-responses is small, then they will not have a significant effect on the results. The non-
response participants might not have had time to complete the rather extensive
questionnaire, or considered themselves less competent to respond to the questionnaires, or
felt that the questions were too narrowly focused. There is a saying that “no one size fits all”
in corporate governance. The data sample used for this research consisted of parent and
subsidiary companies of BUMN from various industrial sectors each of which has its own
specific industry regulations. Some industries, such as the financial services and banking
sector, have stringent regulations, whereas others do not. The panel data regression model
of this research did not consider the specific characteristic of firms in their particular sector.
As previously mentioned, board member duality usually exists in companies which have a
two-tier board system; hence, board member duality can exist in private companies as well
as in State-Owned Enterprises. Moreover, private companies can have the board member
duality structure, but with a less stringent legal framework. Hence, there is a need for further
research to investigate the board member duality and agency costs in private companies.
P a g e | 317
8.6. CONCLUSION
The corporate governance of parent and subsidiary companies in the State-Owned
Enterprises (BUMN) in Indonesia has received little attention from the public. However, the
fact is that the subsidiary companies also contribute to the profit and loss of parent
companies presented in the consolidated financial statement. In several BUMNs, the
subsidiary company(s) has a bigger market share than does the parent company, and
boosts the latter’s profits. The board member duality which commonly occurs in parent and
subsidiary companies, especially in countries that follow the two-tiered board system, is very
often expected to perform many roles involving loss prevention, oversight, and performance.
At the same time, the analysis of the board member duality structure shows that it has an
impact on agency costs. This research has recommended additional provisions for
subsidiary companies that include changes to the Limited Liability Act no. 40/2007 and the
State-Owned Enterprise Act no.19/2003, and several practical recommendations for
shareholding agents to strengthen the quality of corporate governance in parent and
subsidiary companies. The most of the evidence gathered from this research shows that the
board member duality practised in parent and subsidiary companies in State-Owned
Enterprises are prone to conflict of interests which may impact on agency costs. However,
the policies to BUMN and subsidiary companies will usually adapt to the ruling regime, so
the results of the research may be relevant to a specific context since “there is no one size
that fits all”. Therefore, this research can be used as a reference point for corporate
governance in BUMN, and further research should be undertaken based on the panel data
collected over longer periods and across various regimes.
P a g e | 318
REFERENCES
ABZARI, M., FATHI, S., MOATAMEDI, S. & ZAREI, F. 2012. Trading volume, company age, company size and their affect on deviation of Earning Prediction. Interdisciplinary Journal of Research in Business, Vol.2, pp.16-22.
ACHMAD SANTOSA, M. 2009. Indonesia. The ANNALS of the American Academy of Political and Social Science, 622, pp.310-317.
ADAM, A. W. 2010. Menguak misteri sejarah, Jakarta, Penerbit Buku Kompas, 292, pp.124-128.
AGUNG, W. 2008. Indonesian State-Owned Enterprises: The Challenge of Reform. Southeast Asian Affairs, 2008, pp.146-167.
AGUSTINUS, M. 2016. Ini PR Pemerintah Sebelum Bentuk Holding BUMN Pangan. DetikFinance [Online]. Available: http://finance.detik.com/berita-ekonomi-bisnis/d-3300256/ini-pr-pemerintah-sebelum-bentuk-holding-bumn-pangan [Accessed 18/9/2016].
AHN, S., JIRAPORN, P. & KIM, Y. S. 2010. Multiple directorships and acquirer returns. Journal of Banking and Finance, Vol. 34, 2011-2026.
AIRLANGGA, Z. C. 2015. HIMMPAS UNIVERSITAS INDONESIA [Online]. Available from: https://himmpasui.wordpress.com/2015/03/26/membongkar-mitos-indonesia-dijajah-350-tahun/comment-page-1/ [Accessed August 2, 2016 2016].
ALCHIAN, A. A. & DEMSETZ, H. 1972. Production, information costs, and economic organization. The American Economic Review, Vol. 62, pp.777-795.
ALLEN, I. E. & SEAMAN, C. A. 2007. Likert scales and data analyses. Quality progress, Vol. 40, pp.64-65.
AM. 2012. The Gait of SOEs in realizing the MP3EI Available: http://setkab.go.id/artikel-6333-kiprah-bumn-merealisasikan-mp3ei.html [Accessed 2/28/2014].
ANDERSON, B. R. O. G. 1988. Revoloesi pemoeda: pendudukan Jepang dan perlawanan di Jawa 1944-1946, Pustaka Sinar Harapan, pp.554.
ANG, J. S., COLE, R. A. & LIN, J. W. 2000. Agency costs and ownership structure. the Journal of Finance, Vol. 55, pp.81-106.
ANWAR, S. & SAM, C. Y. 2006. Private Sector Corporate Governance and Singaporean Government Linked Corporations. International Public Management Review, Vol.7, pp.66-82.
ARIOGLU, E. 2014. Demographic Diversity in the Boardroom: Evidence from Borsa Istanbul. Available at https://papers.ssrn.com/sol3/papers.cfm?abstract_id=2473591.[Acessed 20 Dec.2015]
ARMSTRONG, A. 2004. Commentary on codes of corporate governance. In: Introduction to Corporate Governance : Handbook. Armstrong, Anona and Francis, Ronald, eds.
P a g e | 319
Standards Australia Handbook (400). Standards Australia International, Sydney, Australia, pp. 1-10. ISBN 9780733756689
ARROW, K. J. 1963. Uncertainty and the Welfare Economics of Medical Care. The American Economic Review, Vol. 53, pp.941-973.
BAINBRIDGE, S. M. 2002. The board of directors as nexus of contracts. Iowa, The Iowa Law Review, 88, 1.
BAKER, H. K., ANDERSON, R. & EBOOKS CORPORATION, L. 2010. Corporate governance: a synthesis of theory, research, and practice, Hoboken, N.J, Wiley.
BALIGA, B. R., MOYER, R. C. & RAO, R. S. 1996. CEO duality and firm performance: What's the fuss? Strategic Management Journal, Vol. 17, pp.41-43.
BALLANTINE, H. W. 1925. Separate Entity of Parent and Subsidiary Corporations. California Law Review, pp.12-21.
BALTAGI, B. 2008. Econometric analysis of panel data, Chichester, Australia, John Wiley & Sons.
BEASLEY, W. G. 1987. Japanese Imperialism, 1894-1945, Oxford, Oxford University Press.
BELOT, F., GINGLINGER, E., SLOVIN, M. B. & SUSHKA, M. E. 2014. Freedom of choice between unitary and two-tier boards: an empirical analysis. Journal of Financial Economics, Vol. 112, pp.364-385.
BENEDICTE, M.-R. & RONALD, Z. 2010. A Comparison Between One-Tier and Two-Tier Board Structures in France. Journal of International Financial Management & Accounting, Vol. 21, pp 279-312.
BERG, S. V. & SMITH, S. 1978. CEO and board chairman: A quantitative study of dual vs. unitary board leadership. Directors and Boards, Vol.3, pp.34-39.
BERLE, A. A. & MEANS, G. G. C. 1932. New Jersey, The modern corporation and private property, Transaction Publishers.
BEZEMER, P.-J., PEIJ, S. C., MAASSEN, G. F. & VAN HALDER, H. 2012. The changing role of the supervisory board chairman: the case of the Netherlands (1997–2007). Journal of Management & Governance, Vol.16, pp.37-55.
BIAO, L., JIE-JIE, Y. & HONG-MEI, J. 2012. Empirical Analysis of Interactive Control’s Effectiveness: A Parent-Subsidiary Company’s Interdependence Perspective. iBusiness, Vo.4, pp.198-207.
BILIMORIA, D. & PIDERIT, S. K. 1994. Board committee membership: Effects of sex-based bias. Academy of Management Journal, Vol.37, pp1453-1477.
BLACK, A. C. 2010. QFINANCE: The Ultimate Resources. London, GBR: A & C Black Publishers.
BLAIR, M. M. & STOUT, L. A. 2001. Director accountability and the mediating role of the corporate board. Wash. ULQ, Vol.79, pp.403-447.
P a g e | 320
BLISS, M. A. 2011. Does CEO duality constrain board independence? Some evidence from audit pricing. Accounting and Finance, Vol.51, pp.361-380.
BOERI, T. 1989. Does firm size matter? Giornale degli Economisti e Annali di Economia, pp.477-495.
BORTOLOTTI, B. & FACCIO, M. 2009. Government control of privatized firms. Review of Financial Studies, Vol.22, pp.2907-2939.
BOWEN, R. W. 1984. Rebellion and democracy in Meiji Japan: A study of commoners in the popular rights movement, California, Univ of California Press.
BOYD, B. K. 1995. CEO Duality and Firm Performance: A Contingency Model. Strategic Management Journal, Vol.16, pp.301-312.
BOYD, G. & COHEN, S. S. 2000. Corporate governance and globalization: long range planning issues, Cheltenham, UK, Edward Elgar.
BRAGA-ALVES, M. V. & MOREY, M. 2012. Predicting corporate governance in emerging markets. Journal of International Money and Finance, Vol.31, pp.1414-1439.
BRAGG, S. M. 2012. Business ratios and formulas. a comprehensive guide, Hoboken, N.J. : Wiley 3rd ed.
BRICK, I. E., PALMON, O. & WALD, J. K. 2006. CEO compensation, director compensation, and firm performance: Evidence of cronyism? Journal of Corporate Finance, Vol.12, pp.403-423.
BRICKLEY, J. A., COLES, J. L. & JARRELL, G. 1997. Leadership Structure: Separating the CEO and Chairman of the Board. Journal of Corporate Finance, Vol.3, pp.189-220.
BRIESCHKE, P. A. 1992. Reparative Praxis: Rethinking the Catastrophe That is Social Science. Theory into Practice, 31(2), pp.173-180.
BROOKES, I. 2011. Collins Student's Dictionary, London : Collins New edition.
BROOKES, R. H. 1951. The Separation of Powers: Political Theory. Political Science, Vol.3(2), pp.53-70.
BULKOWSKI, T. N. 2012. Fundamental Analysis and Position Trading. Evolution of a Trader, Hoboken : Wiley.
BUMN, K. 2015. Kinerja BUMN, Available: www.bumn.go.id [Accessed August 17, 2015].
CADBURY, A. 1992. Report of the committee on the financial aspects of corporate governance, Gee. ISBN 0852589158, 9780852589151 Vol.1
CADBURY, A. 2002. Corporate governance and chairmanship: A personal view, Oxford, Oxford University Press.
CALDER, A. 2008. Corporate governance: a practical guide to the legal frameworks and international codes of practice. London: Kogan Page.
P a g e | 321
CALDER, A. & EBOOKS CORPORATION, L. 2008. Corporate governance: a practical guide to the legal frameworks and international codes of practice, London, Kogan Page.
CAMERER, C. & VEPSALAINEN, A. 1988. The economic efficiency of corporate culture. Strategic Management Journal, Vol.9, pp.115-126.
CARAMANOLIS-CÖTELLI, B., CARAMANOLIS-ÇÖTELLI, B. & CARAMANOLIS-ÇÖTELLI, B. 1996. External and internal corporate control mechanisms and the role of the board of directors: a review of literature, Laussane, , Universiite de Lausanne Ecole des etudes commercialesIGBF.
CARPENTER, M. A. & WESTPHAL, J. D. 2001. The strategic context of external network ties: Examining the impact of director appointments on board involvement in strategic decision making. Academy of Management Journal, Vol.44, pp.639-660.
CARTER, C. B. & LORSCH, J. W. 2004. Back to the drawing board: designing corporate boards for a complex world, Boston, Mass, Harvard Business School Press.
CASHEN, L. H. 2011. Board leadership structure under fire: CEO duality in the post-restructuring period. Academy of Strategic Management Journal, Vol.10, pp.1-20.
CHAGANTI, R. S., MAHAJAN, V. & SHARMA, S. 1985a. Corporate board size, composition and corporate failures in retailing industry [1]. Journal of Management Studies, Vol.22, pp.400-417.
CHAGANTI, R. S., MAHAJAN, V. & SHARMA, S. 1985b. Corporate Board Size, Composition and Corporate Failures in Retailing Industry[1]. Journal of Management Studies, Vol.22, pp.400-417.
CHEN, T.-J., CHEN, H. & KU, Y.-H. 2012. Resource dependency and parent–subsidiary capability transfers. Journal of World Business, Vol.47, pp.259-266.
CHHAOCHHARIA, V. & GRINSTEIN, Y. 2007. The Changing Structure of US Corporate Boards: 1997–2003. Corporate Governance: An International Review, Vol.15, pp.1215-1223.
CLARKE, T. 2007. International corporate governance : a comparative approach / Thomas Clarke, London ; New York, Routledge.
COLES, J. L., DANIEL, N. D. & NAVEEN, L. 2008. Boards: Does one size fit all? Journal of Financial Economics, Vol.87, pp.329-356.
COOPER, W. W. 1949. Theory of the Firm: Some Suggestions for Revision. The American Economic Review, Vol.39, pp.1204-1222.
COPLEY, F. B. 1923. Frederick W, Taylor. New York, Harper and Bros, Vol.1
CORREIA DA SILVA, L., GOERGEN, M. & RENNEBOOG, L. 2004. Dividend policy and corporate governance, Oxford, Oxford University Press.
CRESWELL, J. W. 2013. Research design: Qualitative, quantitative, and mixed methods approaches, Sage publications.
P a g e | 322
CZAJA, R. & BLAIR, J. 1996. Designing surveys. A guide to decision and evaluation. London.
DAILY, C. M., CERTO, S. T. & DALTON, D. R. 1999. Research notes and communications a decade of corporate women: Some progress in the boardroom, none in the executive suite. Strategic Management Journal, Vol.20, pp.93-99.
DAILY, C. M. & DALTON, D. R. 1992. The relationship between governance structure and corporate performance in entrepreneurial firms. Journal of Business Venturing, Vol.7, pp.375-386.
DAILY, C. M. & DALTON, D. R. 1994. Bankruptcy and Corporate Governance: The Impact of Board Composition and Structure. The Academy of Management Journal, Vol.37, pp.1603-1617.
DAILY, C. M., DALTON, D. R. & CANNELLA, A. A. 2003a. Corporate governance: Decades of dialogue and data. Academy of Management Review, Vol.28, pp.371-382.
DAILY, C. M., DALTON, D. R. & CANNELLA, A. A. 2003b. Corporate Governance: Decades of Dialogue and Data. The Academy of Management Review, Vol.28, pp.371-382.
DALTON, C. M. & DALTON, D. R. 2005. Boards of directors: Utilizing empirical evidence in developing practical prescriptions. British Journal of Management, Vol.16, pp.S91-S97.
DALTON, D. R., DAILY, C. M., ELLSTRAND, A. E. & JOHNSON, J. L. 1998. Meta-analytic reviews of board composition, leadership structure, and financial performance. Strategic Management Journal, Vol.19, pp.269-290.
DALTON, D. R. & DALTON, C. M. 2011. Integration of micro and macro studies in governance research: CEO duality, board composition, and financial performance. Journal of Management, Vol.37, pp.404-411.
DAVIS, G. F. & COBB, J. A. 2010. Resource Dependence Theory: Past and Future. Research in the Sociology of Organization Vol.28, pp.21-42. doi:10.1108/S0733-558X(2010) 0000028006
DAVIS, J. H., SCHOORMAN, F. D. & DONALDSON, L. 1997. Toward a Stewardship Theory of Management. The Academy of Management Review, Vol.22, pp.20-47.
DEMSKI, J. S. 2003. Corporate Conflicts of Interest. The Journal of Economic Perspectives, Vol.17, pp.51-51.
DENZIN, N. K. 1978. The research act: A theoretical orientation to sociological methods. New York: McGraw-Hill.
DEY, A., ENGEL, E. & LIU, X. 2011. CEO and board chair roles: To split or not to split? Journal of Corporate Finance, Vol.17, pp.1595-1618.
DHARMAWAN. 2015. Potensi Super Besar Holding Perkebunan. Available: http://www.bumninsight.co.id/perspektif/kolom/potensi-super-besar-holding-perkebunan [Accessed 07/11/2016].
P a g e | 323
DICK, H. W. 2002. The emergence of a national economy: an economic history of Indonesia, 1800-2000, Hawaii, University of Hawaii Press.
DICTIONARY.COM. 2015. Available: http<//www.dictionary.reference.com> [Accessed January 2015 ].
DIGNAM, A. J., GALANIS, M. & EBOOKS CORPORATION, L. 2009. The globalization of corporate governance, Farnham, Ashgate.
DIXON-WOODS, M., SHAW, R. L., AGARWAL, S. & SMITH, J. A. 2004. The problem of appraising qualitative research. Quality and Safety in Health Care, Vol.13, pp.223-225.
DONALDSON, L. 2008. Ethics problems and problems with ethics: Toward a pro-management theory. Journal of Business Ethics, Vol.78, 299-pp.311.
DONALDSON, L. & DAVIS, J. H. 1990. CEO governance and shareholder returns: Agency theory or stewardship theory, Sydney, Australian Graduate School of Management, University of New South Wales.
DONALDSON, L. & DAVIS, J. H. 1991a. Stewardship Theory or Agency Theory: CEO governance and shareholder returns. Australian Journal of Management, Vol.16, pp.49-65.
DONALDSON, L. & DAVIS, J. H. 1991b. Stewardship Theory or Agency Theory: CEO Governance and Shareholder Returns. Australian Journal of Management, Vol.16, pp.49-64.
DONALDSON, L. & DAVIS, J. H. 1991c. Stewardship Theory or Agency Theory: CEO Governance and Shareholder Returns. Australian Journal of Management (University of New South Wales), Vol.16, pp.49-65.
DONALDSON, S. A. 2007. Federal Income Taxation of Individuals: Cases, Problems & Materials.Thomson/West, USA, 834 Ed.2, revised,
DOWNS, A. 1957. An Economic Theory of Political Action in a Democracy. The Journal of Political Economy, Vol.65, pp.135-150.
DRAKELEY, S. 2005. The History of Indonesia, Westport, Conn, Greenwood Press.
DU PLESSIS, J. J. & SAENGER, I. 2012. The Supervisory Board as Company Organ. Berlin, Heidelberg: Springer Berlin Heidelberg.
EDWARDS, W. 2003. Forging Tradition for a Holy War: The" Hakkō Ichiu" Tower in Miyazaki and Japanese Wartime Ideology. The Journal of Japanese Studies, pp.289-324.
EISENBERG, T., SUNDGREN, S. & WELLS, M. T. 1998. Larger board size and decreasing firm value in small firms. Journal of Financial Economics, Vol.48, pp.35-54.
EISENHARDT, K. M. 1989. Agency theory: An assessment and review. Academy of Management Review, Vol.14, pp.57-74.
P a g e | 324
ERHARDT, N. L., WERBEL, J. D. & SHRADER, C. B. 2003. Board of director diversity and firm financial performance. Corporate governance: An international review, Vol.11, pp.102-111.
FAMA, E. F. & JENSEN, M. C. 1983. Separation of Ownership and Control. The Journal of Law and Economics, Vol.26, pp.301-325.
FARINHA, J. 2003. Corporate governance: a survey of the literature. Universidade do Porto Economia Discussion Paper.(2003-06)
FARRELL, K. A. & HERSCH, P. L. 2005. Additions to corporate boards: the effect of gender. Journal of Corporate Finance, Vol.11, pp.85-106.
FCGI, F. F. C. G. I. I. 2011. FCGI Profile [Online]. Available: http://www.fcgi.or.id/about-fcgi/fcgi-profile.html [Accessed 23/1/2014 2014].
FEB/DNL. 2014. Jadi Holding, Untung BUMN Perkebunan Bisa Tembus Rp 21 T di 2019. Available: http://finance.detik.com/berita-ekonomi-bisnis/d-2695688/jadi-holding-untung-bumn-perkebunan-bisa-tembus-rp-21-t-di-2019 [Accessed 7/11/2016].
FERRIS, S. P., JAGANNATHAN, M. & PRITCHARD, A. C. 2003. Too Busy to Mind the Business? Monitoring by Directors with Multiple Board Appointments. The Journal of Finance, Vol.58, pp.1087-1111.
FICH, E. M. & SHIVDASANI, A. 2006. Are busy boards effective monitors? The Journal of Finance, Vol.61, pp.689-724.
FITRA, S. A., MIFTAH. 2016. Pemerintah Sepakat Bentuk Enam Holding BUMN. Available: http://katadata.co.id/berita/2016/08/13/pemerintah-sepakat-bentuk-enam-holding-bumn [Accessed 08/11/2016].
FITRININGRUM, A. 2015. Are State Owned Enterprises successful vehicles for attaining their governments stated objectives?, PhD Thesis, Research School of Accounting College of Business and Economics Australian National University.
FLICK, U. 2014. An introduction to qualitative research, Berlin, Sage, 5th edition .
FRANCIS, R. & ARMSTRONG, A. 2012. The Meetings Handbook: Formal Rules and Informal processes., Melbourne, Anthem Press.
FREDERICK, W. R. 2011. Enhancing the role of the boards of directors of state-owned enterprises. OECD Corporate Governance Working Papers, (2) p.1.
FREEMAN, R. E. 1984. Strategic Management: A strategic approach. Pitman, Boston, MA.
FREEMAN, R. E. 2010. Stakeholder theory: the state of the art, Cambridge, UK, Cambridge University Press.
FRIEND, T. 1988. The Blue-Eyed Enemy: Japan Against the West in Java and Luzon, 1942-1945, Cambridge, Cambridge Univ Press.
FUADY, M. 2002. Doktrin-doktrin modern dalam corporate law dan eksistensinya dalam hukum Indonesia, Jakarta, Citra Aditya Bakti.
P a g e | 325
GABRIELSEN, T. S., HJELMENG, E. & SORGARD, L. 2011. Rethinking Minority Share Ownership and Interlocking Directorships: The Scope for Competition Law Intervention. European Law Review, Vol.36, pp.837-860.
GANTT, H. L. 1961. Gantt on management: guidelines for today's executive, USA, American Management Association.
GARVEY, G. T. & SWAN, P. L. 1994. The economics of corporate governance: Beyond the Marshallian firm. Journal of Corporate Finance, Vol.1, pp.139-174.
GAUGHAN, P. A. 2011. Mergers, acquisitions, and corporate restructurings, Hoboken, N.J, Wiley.
GÉCZY, C. C., MINTON, B. A. & SCHRAND, C. M. 2007. Taking a View: Corporate Speculation, Governance, and Compensation. Journal of Finance, Vol.62, pp.2405-2443.
GEORGE, C. S. 1972. The History of Management Thought, Englewood Cliffs, N.J, Prentice-Hall.
GERALD, Z. 2002. Enron, board governance and moral failings. Corporate Governance, Vol.2, pp.16-19.
GESSER, R., HALMAN, R. & SARIG, O. 2010. Measuring the Agency Costs of Dispersed Ownership: The Case of Repurchase Initiations. Available at https://papers.ssrn.com/sol3/papers.cfm?abstract_id=736623 SSRN 736623, [Acessed 10 March 2013)
GEVURTZ, F. A. 2004. The historical and political origins of the corporate board of directors. Bepress Legal Series, Vol.33, pp89.
GIDDENS, A. 1984. The constitution of society: Outline of the theory of structuration, California, Univ. of California Press.
GILBERT, M. 2004. The Second World War: A Complete History, North Carolina, Univ of North Carolina Press.
GILBRETH, F. B. & GILBRETH, L. M. 1919. Applied motion study: A collection of papers on the efficient method to industrial preparedness, Macmillan.
GILL, S. 2014. Rewards for failure: an explanation for anomalous executive remuneration. Journal of Indian Business Research, Vol.6, pp.90-127.
GLASSBURNER, B. 1962. Economic Policy-Making in Indonesia, 1950-57. Economic Development and Cultural Change, Vol.10, pp.113-133.
GOMEZ-MEJIA, L. R., BALKIN, D. B. & CARDY, R. L. 2005. Management: people, performance, change, Boston, McGraw-Hill/Irwin.
GRAHAM, J. R. & HARVEY, C. R. 2001. The theory and practice of corporate finance: Evidence from the field. Journal of Financial Economics, Vol.60, pp.187-243.
GUJARATI, D. N. 2003. Basic Econometrics. 4th. New York: McGraw-Hill.
P a g e | 326
HALLOCK, K. F. 1997. Reciprocally Interlocking Boards of Directors and Executive Compensation. Journal of Financial and Quantitative Analysis, Vol.32, pp.331-344.
HARPER, C. 2003. Collins English Dictionary: complete and unabridged, Bishopbriggs, Glasgow, Great Britain, HarperCollins.
HERMALIN, B. E. & WEISBACH, M. S. 2003. Boards of directors as an endogenously.Determined Institution: A Survey of the Economic Literature (Digest Summary). Economic Policy Review Vol.9, pp.17-26
HERZBERG, F. 1959. The motivation to work [by] Frederick Herzberg, Bernard Mausner [and] Barbara Bloch Snyderman, New York Wiley.
HIGGS, D. & BRITAIN, G. 2003. Review of the role and effectiveness of non-executive directors, Department of Trade and Industry London.
HILMER, F. & TRICKER, R. 1990. An effective board. From the company director manual. Sidney: Prentice Hall.
HIRTH, S. & UHRIG-HOMBURG, M. 2010. Investment timing, liquidity, and agency costs of debt. Journal of Corporate Finance, Vol.16, pp.243-258.
HOPT, K. J. 2012. Corporate Governance. Dordrecht: Springer Netherlands.
HOPT, K. J. & WYMEERSCH, E. 2003. Capital Markets and Company Law, Oxford, Oxford University Press.
HORNER, S. V. 2010. Board power, CEO appointments and CEO duality. Academy of Strategic Management Journal,Vol. 9, pp.43-58.
HUBERT, O. & TINE DE, L. 2002. The Anglo-American versus the Continental European corporate governance model: empirical evidence of board composition in Belgium. European Business Review, Vol.14, pp.437-449.
HUGHES, M., SCOTT, J. & MACKENZIE, J. 1977. Trends in Interlocking Directorships: An International Comparison. Acta Sociologica, Vol.20, pp.287-292.
HUSE, M. 2005. Accountability and creating accountability: A framework for exploring behavioural perspectives of corporate governance. British Journal of Management, 16, S65-S79.
HUSTON, J. & EDWARD, J. 2013. Relationships Between Parent and Subsidiary Corporations: Implications for Litigation Available: http://www.acc.com/chapters/sandiego/upload/Relationships-Between-Parent-and-Subsidiary-Corporations-Implications-for-Litigation.pdf [Accessed 9/14/2015].
HYATT, J. & CHARNEY, B. 2005. The legal and fiduciary duties of directors. Board Leadership, Wiley online library journal, 2005, pp.1-8.
ILYAS, U. 2011. The meaning of "under powers of state" in article 33 of 1945 Constitution [Online]. Jakarta. Available: http://www.berdikarionline.com/lipsus/20110715/makna-%E2%80%9Cdikuasai-oleh-negara%E2%80%9D-dalam-pasal-33-uud-1945.html#ixzz2kJ214YwV [Accessed 23 February 2014 2014].
P a g e | 327
IOANNIDIS, J. P. 2005. Why most published research findings are false. PLoS Med, 2, e124,doi:10.137/journal.pmed.0020124
ISKANDER, M. R. & CHAMLOU, N. 2000. Corporate governance: A framework for implementation, World Bank Publications.
ISLAM, M., YANG, Y.-F. & MIA, L. 2012. The impact of company learning and growth capabilities on the customer-related performance. Benchmarking: An International Journal, Vol.19, pp.137-158.
ISMAIL, A. M. 2013. Development of A Corporate Integrity Assessment Instrument Using Corporate Governanec Indicators in Malaysia Doctor of Philosophy, Victoria University.
JENSEN, M. C. 1986. Agency cost of free cash flow, corporate finance, and takeovers. Corporate Finance, and Takeovers. American Economic Review, Vol.76 (2).
JENSEN, M. C. & MECKLING, W. H. 1976. Theory of the firm: Managerial behavior, agency costs and ownership structure. Journal of Financial Economics, Vol.3, pp.305-360.
JEWELL, L. N. & REITZ, H. J. 1981. Group Effectiveness in Organizations, Good Year Books.
JIRAPORN, P., KIM, Y. S. & DAVIDSON, W. N. 2008. Multiple directorships and corporate diversification. Journal of Empirical Finance, Vol.15, pp.418-435.
JIRAPORN, P., SINGH, M. & LEE, C. I. 2009. Ineffective corporate governance: Director busyness and board committee memberships. Journal of Banking & Finance, Vol.33, pp.819-828.
JOHN, K. & SENBET, L. W. 1998. Corporate governance and board effectiveness. Journal of Banking & Finance, Vol.22, pp.371-403.
JOHN, O. O. & PAMELA, W. 2011. Corporate Governance in Emerging Markets: Barriers to Effective Reform. S.A.M. Advanced Management Journal, 76, 24.
JOHNSON, J. L., DAILY, C. M. & ELLSTRAND, A. E. 1996. Boards of directors: A review and research agenda. Journal of Management, Vol.22, pp.409-438.
JOHNSON, S. G., SCHNATTERLY, K. & HILL, A. D. 2012. Board composition beyond independence social capital, human capital, and demographics. Journal of Management, 0149206312463938.
JOHNSTON, L. D. 2002. Lectures on Economic Growth. By Robert E. Lucas Jr. Cambridge, MA: Harvard University Press, 2002. Pp. xi, 204. $49.95. The Journal of Economic History, Vol.62, pp.915-916.
JONGE, J. H. M. D. 2013. Corporate Governance: One-Tier versus Two-tier Boards [Online]. The Netherlands: 12maqnage B.V. Available: http://www.12manage.com/forum.asp?TB=corporate_governance&S=12 [Accessed 10/9/2013 2013].
P a g e | 328
JUNGMANN, C. 2006. The Effectiveness of Corporate Governance in One-Tier and Two-Tier Board Systems – Evidence from the UK and Germany. European Company and Financial Law Review, Vol.3, pp.426-474.
KAEN, F. R. 2005. Risk Management, Corporate Governance and the Public Corporation. Berlin, Heidelberg: Springer Berlin Heidelberg.
KERTIYASA, M. B. 2011. The Holding Company Director of State-owned Enterprise Can Have A Duality As Commissioner. Available: http://economy.okezone.com/read/2011/01/20/320/415897/direksi-holding-bumn-bisa-rangkap-jadi-komisaris [Accessed Nopember 21st, 2015].
KESNER, I. F. 1987. Directors' stock ownership and organizational performance: An investigation of Fortune 500 companies. Journal of Management, Vol.13, pp.499-508.
KIEL, G. C. & NICHOLSON, G. J. 2006. Multiple Directorships and Corporate Performance in Australian Listed Companies. Corporate Governance: An International Review, Vol.14, pp.530-546.
KIM, K. H. & BUCHANAN, R. 2008. CEO duality leadership and firm risk-taking propensity. Journal of Applied Business Research, Vol.24, pp.27-41.
KIRK, R. J. 2009. IFRS. a quick reference guide, Amsterdam ; Boston ; London : CIMA.
KOTZ, D. M. 2009. The financial and economic crisis of 2008: A systemic crisis of neoliberal capitalism. USA, Review of Radical Political Economics.
KOURETAS, G. P. & VLAMIS, P. 2010. The Greek crisis: causes and implications. Panoeconomicus,Vol. 57, pp.391-404.
KRAUSE, S. 2000. The Spirit of Separate Powers in Montesquieu. The Review of Politics, Vol.62, pp.231-265.
KRAUTER, E. & DA SOUSA, A. F. 2013. Executive compensation and corporate financial performance: Empirical evidences on Brazilian industrial companies. Journal of Modern Accounting and Auditing,Vol.9, pp.650.
KREPS, D. M. 1990. Game Theory and Economic Modelling, Clarendon Press Oxford.
LABUSCHAGNE, P. 2006. Trias politica as guiding constitutional principle in the modern state : obsolet relic or constitutional necessity? / Polieia, Journal for the Political Sciences Vol.25(1), pp.18-29.
LADEGARD, G., HANSEN, K., BUEHRMANN, A., MUELLER, J. & WELLS, P. 2013. Exploring director recruitment: what characteristics constitute an appointable candidate? Governance in Action Globally. Strategy, Process and Reality, pp.177-200.
LEE, J. 2009. Does Size Matter in Firm Performance? Evidence from US Public Firms. International Journal of the Economics of Business, Vol.16, pp.189-203.
P a g e | 329
LEEDY, P. & ORMROD, J. 2001. Practical research: Planning and design New Jersey: Merril Prentice Hall.
LELAND, H. E. 1998. Agency Costs, Risk Management, and Capital Structure (Digest Summary). Journal of Finance, Vol.53, pp.1213-43.
LETHERBY, G., SCOTT, J. & WILLIAMS, M. 2012. Objectivity and Subjectivity in Social Research, Sage.
LI, G. 2010. The pervasiveness and severity of tunneling by controlling shareholders in China. China Economic Review, Vol.21, pp.310-323.
LINDBLAD, J. T. 2012. The Economic Decolonisation of Indonesia: a Bird’s-eye View. Journal of Indonesian Social Sciences and Humanities, Vol.4, pp.1-20.
LIPTON, M. & LORSCH, J. W. 1992. A modest proposal for improved corporate governance. The Business Lawyer, pp.59-77.
LIU, Y., WEI, Z. & XIE, F. 2014. Do women directors improve firm performance in China? Journal of Corporate Finance, Vol.28, pp.169-184.
LOCKE, J. 1947. Two Treatises of Government, United States, Hafner Press, ISBN 0-02-848500-9
LODERER, C. & PEYER, U. 2002. Board overlap, seat accumulation and share prices. European Financial Management, Vol.8, pp.165-192.
LORTON, J. W. 2012. Wisdom Writers Around the World: Aphorisms Explained, Inspiring Voices.
LOWY, M. E. 2003. Corporate governance for public company directors, New York, N.Y, Aspen.
LÜCKERATH-ROVERS, M. 2013. Women on boards and firm performance. Journal of Management & Governance, Vol.17, pp.491-509.
LUKVIARMAN, N. 2004. Ownership structure and firm performance: the case of Indonesia, DBA Thesis, Curtin University of Technology, Graduate School of Business.
MACE, M. 1986. Directors: Myth and Reality (Harvard Business School Press, Boston, MA).
MACKENZIE, C. R. & CRONSTEIN, B. N. 2006. Conflict of interest. HSS Journal®, Vol.2, pp.198-201.
MAGNAR, K., JUNAENAH, I. & TAUFK, G. A. Tafsir MK Atas Pasal 33 UUd 1945:(Studi Atas Putusan MK Mengenai Judicial Review UU No. 7/2004, UU No. 22/2001, dan UU No. 20/2002). Jurnal Konstitusi, 7.
MAGUIRE, D. J., SMITH, R. & KOUYOUMJIAN, V. 2008. The business benefits of GIS: an ROI approach, ESRI, Inc.
MAHONEY, J. T., HUFF, A. S. & HUFF, J. O. 1994. Toward a new social contract theory in organization science. Journal of Management Inquiry, Vol.3, pp.153-168.
P a g e | 330
MAHONEY, P. G. 2000. Contract or concession? An essay on the history of corporate law. Georgia Law Review, Vol.34, pp.873.
MAJOR, C., HOFMANN, H. & VERUSIO, A. G. 1986. Directors' Liabilities in Group Companies. International Financial Law Review, Vol.5, pp.30.
MAKSIMOVIC, V. & PHILLIPS, G. M. 2013. Conglomerate firms, internal capital markets and the theory of the firm. Robert H. Smith School Research Paper.
MALLIN, C. A. 2006. Handbook on international corporate governance: country analyses, Northampton, Mass, Edward Elgar Publishing.
MAZNEVSKI, M. L. 1994. Understanding our differences: Performance in decision-making groups with diverse members. Human Relations, Vol.47, pp.531-552.
MCCAHERY, J. & VERMEULEN, E. M. 2008. Corporate governance of non-listed companies, Oxford, Oxford University Press.
MCCARTHY, D. J. & PUFFER, S. M. 2008. Interpreting the ethicality of corporate governance decisions in Russia: Utilizing integrative social contracts theory to evaluate the relevance of agency theory norms. Academy of Management Review, Vol.33, pp.11-31.
MCCLELLAND, D. C. 1961. The Achieving Society, Princeton, N.J. : Van Nostrand.
MCNULTY, T., FLORACKIS, C. & ORMROD, P. 2012. Managing Risk: Board Process Matters. The European Financial Review, May, pp.1-4.
MERTENS, D. M. & HESSE-BIBER, S. 2012. Triangulation and Mixed Methods Research Provocative Positions. Journal of Mixed Methods Research,Vol. 6, pp.75-79.
MILLET-REYES, B. & ZHAO, R. 2010. A Comparison Between One-Tier and Two-Tier Board Structures in France. JOURNAL OF INTERNATIONAL FINANCIAL MANAGEMENT & ACCOUNTING, Vol.21, pp279-310.
MINH, T. L. & WALKER, G. 2008. Corporate governance of listed companies in Vietnam. Bond Law Review, Vol.20, pp.118-120.
MINNA, Y. 2011. Analyst recommendations and corporate governance in emerging markets. International Journal of Accounting and Information Management, Vol.19, pp.34-52.
MISHRA, M. 2004. Public SectorReforms Fiscal and Governance Reforms A case Study of Orrisa State, India. Doctor of Philosophy, Victoria University of Technology.
MITNICK, B. M. 2006. Origin of the Theory of Agency. University of Pittsburg, Rev. January.
MIZRUCHI, M. S. 1996. What Do Interlocks Do? An Analysis, Critique, and Assessment of Research on Interlocking Directorates. Annual Review of Sociology, Vol.22, pp.271-298.
MOELLER, S. B., SCHLINGEMANN, F. P. & STULZ, R. M. 2004. Firm size and the gains from acquisitions. Journal of Financial Economics, Vol.73, pp.201-228.
P a g e | 331
MORE, C. 2000. Understanding the Industrial Revolution, New York, Routledge.
MSOE 2012. Strategic Plan 2012-2014. The Ministry of State-Owned Enterprises. Jakarta.
MURRAY, A. I. 1989. Top management group heterogeneity and firm performance. Strategic Management Journal, Vol.10, pp.125-141.
MUTH, M. & DONALDSON, L. 2002. Stewardship theory and board structure: a contingency approach. Corporate Governance: An International Review, Vol.6, pp.5-28.
NJOYA, W. 2009. Corporate Governance of Non-Listed Companies. by Joseph A. McCahery and Erik PM Vermeulen, The Modern Law Review Vol.72 (3), pp.507-610
NUGROHO, R. & WRIHATNOLO, R. R. 2008. Manajemen privatisasi BUMN, Jakarta, Elex Media Komputindo.
OECD 2007. Enforcement of Corporate Governance in Asia, OECD Publishing.
OECD 2013. Boards of Directors of State-Owned Enterprises: An Overview of National Practices,, OECD Publishing.
ORGANISATION FOR ECONOMIC, C.-O., DEVELOPMENT, ORGANISATION FOR ECONOMIC, C.-O. & DEVELOPMENT, S. 2004. OECD Principles of Corporate Governance - 2004 Edition, Washington, Organization for Economic Cooperation & Development.
PANDEY, S. & BRIGHT, C. L. 2008. What are degrees of freedom? Social Work Research, Vol.32, pp.119.
PANGESTU, M. & HABIR, A. D. 1989. Trends and Prospects in Privatization and Deregulation in Indonesia. ASEAN Economic Bulletin, Vol.5, pp.224-241.
PARTNER, E. Z. U. 2001. Board of Directors - Global Study, Egon Zehnder International.
PATTERSON, J. L. 1983. The Development of the Concept of Corporation From Earliest Roman Times to AD 476. The Accounting Historians Journal, pp.87-98.
PEARCE, J. A. & ZAHRA, S. A. 1992. Board composition from a strategic contingency perspective. Journal of Management Studies, Vol.29, pp.411-438.
PEGADAIAN. 2014. Tentang Perusahaan [Online]. Available: http://bumn.go.id/pegadaian/halaman/41/tentang-perusahaan.html [Accessed August 5 2016].
PFEFFER, J. 1972. Size and composition of corporate boards of directors: The organization and its environment. Administrative Science Quarterly, pp.218-228.
PFEFFER, J. & SALANCIK, G. R. 2003. The external control of organizations: a resource dependence perspective, Stanford, Calif, Stanford Business Books.
PI, L. & TIMME, S. G. 1993. Corporate-Control and Bank Efficiency. Journal of Banking & Finance, Vol.17, pp.515-530.
P a g e | 332
PINDAD, P. 2015. Masa Kolonial Belanda dan Pendudukan Jepang [Online]. Bandung. Available: https://www.pindad.com/masa-kolonial-belanda-dan-pendudukan-jepang [Accessed August 5 2016].
PITKIN, H. F. 1967. The Concept of Representation, California, the University of California Press.
PORTA, R., LOPEZ-DE-SILANES, F., SHLEIFER, A. & VISHNY, R. 2002. Investor protection and corporate valuation. The Journal of Finance, Vol.57, pp.1147-1170.
POST, C. & BYRON, K. 2015. Women on boards and firm financial performance: A meta-analysis. Academy of Management Journal, Vol.58, pp.1546-1571.
PRASETYO, A. 2016. Holding PTPN Benahi Hulu dan Produktivitas. Available: http://www.mediaindonesia.com/news/read/56888/holding-ptpn-benahi-hulu-dan-produktivitas/2016-07-19 [Accessed 07/11/2016].
PUBLISHING, O., ORGANISATION FOR ECONOMIC, C.-O. & DEVELOPMENT 2006. Corporate governance of non-listed companies in emerging markets, Paris, Organisation for Economic Cooperation and Development (OECD).
PUTRA, I. R. 2013. 5 Conditional Differences of SOEs Between Soeharto and SBY Era Available: http://www.merdeka.com/uang/5-perbedaan-kondisi-bumn-di-era-soeharto-dan-sby/dikuasai-jenderal-dan-birokrat.html [Accessed 30/11/2013].
QOSASI, A. 2016. BPK: Permasalahan BUMN beralih ke anak perusahaan. Jakarta, available at: http://www.bpk.go.id/news/bpk-permasalahan-bumn-beralih-ke-anak-perusahaan, [Accessed January, 23, 2016]
RACHAGAN, S. 2010. Enhancing corporate governance in listed companies with concentrated shareholdings: A Malaysian perspective. Journal of Financial Crime, Vol.17, pp.430-440.
RAHEJA, C. G. 2005. Determinants of board size and composition: A theory of corporate boards. Journal of Financial and Quantitative Analysis, Vol.40, pp.283-306.
RAMDANI, D. & WITTELOOSTUIJN, A. V. 2010. The impact of board independence and CEO duality on firm performance: A quantile regression analysis for Indonesia, Malaysia, South Korea and Thailand. British Journal of Management, Vol.21, pp.607-627.
RASHID, A. 2012. CEO duality and agency cost: evidence from Bangladesh. Journal of Management and Governance, pp.1-20.
RASHID, A. 2013. CEO duality and agency cost: Evidence from Bangladesh. Journal of Management and Governance, Vol.17, pp.989-1008.
RAZIQ, M. M., BORINI, F. M. & PERRY, M. 2014. Subsidiary initiatives and subsidiary autonomy: Evidence from New Zealand and Brazil. International Entrepreneurship and Management Journal, Vol.10, pp.589-605.
P a g e | 333
RECHNER, P. L. & DALTON, D. R. 1989. The Impact of CEO as Board Chairperson on Corporate Performance: Evidence vs. Rhetoric. The Academy of Management Executive (1987-1989), Vol.3, pp.141-143.
RECHNER, P. L. & DALTON, D. R. 1991. CEO duality and organizational performance: A longitudinal analysis. Strategic Management Journal, Vol.12, pp.155-160.
RICKLEFS, M. C. 2001. A History of Modern Indonesia since c. 1200, Stanford, Stanford University Press.
ROBERTS, J., MCNULTY, T. & STILES, P. 2005. Beyond agency conceptions of the work of the non-executive director: Creating accountability in the boardroom. British Journal of Management, Vol.16, pp.S5-S26.
ROBISON, R. 1986. Indonesia, the rise of capital. Sydney, Allen & Unwin.
ROBISON, R. 2009. Indonesia, the rise of capital. Singapore, Equinox Publishing.
ROMERO, S. & ATLAS, R. D. 2002. Worldcom’s collapse: the overview; worldcom files for bankruptcy largest US case. The New York Times, Vol.22, pp.157-177.
ROSENBERG, A. 2015. Philosophy of Social Science, Boulder, Westview Press.
ROSSMAN, G. B. & WILSON, B. L. 1985. Numbers and words combining quantitative and qualitative methods in a single large-scale evaluation study. Evaluation Review, Vol.9, pp.627-643.
SAFITRI, I. K. 2015. Kerja Sama RI-Cina, Rini Soemarno Dituding Tak Transparan. Available: https://bisnis.tempo.co/read/news/2015/09/25/090703806/kerja-sama-ri-cina-rini-soemarno-dituding-tak-transparan [Accessed 21/11/2016].
SAKULRAT, M. & INSTITUTE OF SOUTHEAST ASIAN, S. 2006. Corporate governance of listed companies in Thailand, Singapore, Institute of Southeast Asian Studies.
SATŌ, S. 1994. War, nationalism, and peasants: Java under the Japanese occupation, 1942-1945, Armonk, New York, ME Sharpe.
SAWITRI, A. A. 2016. Holding BUMN, Sri Mulyani: Bukan Penting atau Tidak Penting. Available: https://m.tempo.co/read/news/2016/08/24/087798540/holding-bumn-sri-mulyani-bukan-penting-atau-tidak-penting [Accessed 09/11/2016].
SCHWARZ, N. 2014. Cognition and communication: Judgmental biases, research methods, and the logic of conversation, London, Psychology Press.
SCOTT, J. 1997. Corporate Business and Capitalist classes, Oxford, Oxford University Press.
SCOTT, W. R. 2004. Institutional Theory. Encyclopedia of Social Theory, Vol.11, pp.408-14.
SELIGER, H. W., SHOHAMY, E. & SHOHAMY, E. G. 1989. Second Language Research Methods, Oxford, Oxford University Press.
P a g e | 334
SHANTHY, R. 2010. Enhancing corporate governance in listed companies with concentrated shareholdings. Journal of Financial Crime, Vol.17, pp.430-440.
SHAW, M. 1981. Group dynamics: The psychology ofsmall group behavior {3rd ed.). New York. McGraw-Hill.
SHLEIFER, A. & VISHNY, R. W. 1997. A Survey of Corporate Governance. The Journal of Finance, Vol.52, pp.737-783.
SHROPSHIRE, C. 2010. The Role of The Interlocking Director and Board Receptivity in the Diffusion of Practices. Academy of Management Review, Vol.35, pp.246-264.
SIAHAAN, R. 2005. BUMN Indonesia: isu, kebijakan, dan strategi, Jakarta, Elex Media Komputindo.
SILVERMAN, D. 2000. Doing qualitative research. A practical guide. Thousand Oaks, CA: Sage Publications.
SINAGA, R. 2013. Dahlan Kuliahi mahasiswa UI soal peran BUMN. available at: http://www.antaranews.com/berita/376235/dahlan-kuliahi-mahasiswa-ui-soal-peran-bumn, [Accessed 15 April 2014]
SINGH, M. & DAVIDSON III, W. N. 2003. Agency costs, ownership structure and corporate governance mechanisms. Journal of Banking and Finance, Vol.27, pp.793-816.
SITEPU, A. D. 2015. The Minister Rini warns the hundreds of subsidiary companies of the State-owned Enterprise. Available: http://ekbis.sindonews.com/read/964158/34/menteri-rini-ingatkan-ratusan-anak-usaha-bumn-1423829278 [Accessed 1/14/2016].
SMITH, A. 1776. An inquiry into the nature and causes of the wealth of nations / by Adam Smith, USA, Wildside Press
SMITH, C. & JENSEN, M. 2000. Stockholder, manager, and creditor interests: applications of agency theory, USA, SSRN, Vol1. No.1.
SNOW, J. & MANN, M. 2013. Qualtrics survey software: handbook for research professionals. Obtenido de http://www. qualtrics. com.
SOPHIAAN, M. 2008. Kehormatan bagi yang berhak: Bung Karno tidak terlibat G30S/PKI, Jakarta, VisiMedia.
STANDARD & SERVICES, P. S. R. 2003. Standard & Poor's Corporate Ratings Criteria, Standard & Poor's, USA
STIGLER, G. J. & FRIEDLAND, C. 1983. The Literature of Economics: The Case of Berle and Means. Journal of Law and Economics, Vol.26, pp.237-268.
STILES, P. & TAYLOR, B. 2001. Boards at Work: How Directors View their Roles and Responsibilities: How Directors View their Roles and Responsibilities, Oxford, Oxford University Press.
P a g e | 335
STRIKWERDA, J. 2003. An entrepreneurial model of corporate governance: devolving powers to subsidiary boards. Corporate Governance, Vol. 3 Iss: 2, pp. 38 - 57.
STUART, S. 2006. Board diversity report. Toronto: Spencer Stuart Limited.
SUKIRNO 2015. Wow! Utang 5 BUMN Ini Tembus Rp448 Trilliun. available at: http://finansial.bisnis.com/read/20150907/309/469740/wow-utang-5-bumn-ini-tembus-rp448-triliun, [Accessed on 15 February 2016]
SUN, Q., TONG, W. H. & TONG, J. 2002. How does government ownership affect firm performance? Evidence from China’s privatization experience. Journal of Business Finance & Accounting, Vol.29, pp.1-27.
SVEHLA, J. 2006. Director's fiduciary duties. Australian Bar Review, Vol.27, pp.192.
SWANSON, G. E. 1971. An Organizational Analysis of Collectivities. American Sociological Review, Vol.36, pp.607-624.
TALHA, D. M., SALLEHHUDDIN, A. & MASUOD, M. S. 2011. Corporate Governance And Directors’ Remuneration In Selected ASEAN Countries. Journal of Applied Business Research (JABR), Vol.25(2)
TAN, T. K. 1966. INDONESIA'S GUIDED ECONOMY AND ITS IMPLEMENTATION: 1959-1965. The Australian Quarterly, Vol.38, pp.9-28.
TANIS, E. A. & HOGG, R. V. 2001. Probability and Statistical Inference. Prentice Hall Upper Saddle River, NJ.
TAYLOR, R. N. 1975. Age and experience as determinants of managerial information processing and decision making performance. Academy of Management Journal, Vol.18, pp.74-81.
TERRELL, S. R. 2012. Mixed-methods research methodologies. The Qualitative Report, Vol.17, pp.254-280.
TIVEDI, P. 2008. Designing and implementing mechanisms to enhance accountability for state owned enterprises. United Nations (Ed) Public Enterprises: Unresolved Challenges and New Opportunities. United Nations. New York.
TRAHAN, E. A. & GITMAN, L. J. 1995. Bridging the theory-practice gap in corporate finance: a survey of chief financial officers. The Quarterly Review of Economics and Finance, Vol.35, pp.73-87.
TSUTSUI, W. M. 2001. The Way of Efficiency: Ueno Yoichi and Scientific Management in Twentieth-Century Japan. Modern Asian Studies, 35, 441-467.
TUGGLE, C. S., REUTZEL, C. R. & BIERMAN, L. CEO duality and board attention to monitoring and control. 2008 Anaheim, CA.
TUGIYONO, WIDIARTO, T., KOESWANTI, H. D., SUNARDI, TRIMANTO, J., FANSYURI, M. & KRISTINA, R. E. 2004. Pengetahuan Sosial Sejarah 2, Jakarta, PT Grasindo.
TUSSMAN, J. 1960. Obligation and the body politic, Oxford, Oxford University Press
P a g e | 336
VALLAS, S. P. 2003. The Adventures of Managerial Hegemony: Teamwork, Ideology, and Worker Resistance. Social Problems, Vol.50, pp.204-225.
VAN DE RYT, A. M. 2002. Japanese Occupation of Indonesia. Perspectives in History, Vol.56, Northern kentucky.
VAN KLINKEN, G. 2001. The battle for history after Suharto: beyond sacred dates, great men, and legal milestones. Critical Asian Studies, Vol.33, pp.323-350.
VANCE, S. C. 1978. Corporate governance: Assessing corporate performance by boardroom attributes. Journal of Business Research, Vol.6, pp.203-220.
VATIKIOTIS, M. R. 2004. Indonesian Politics Under Suharto: The Rise and Fall of the New Order, Routledge, Standford University Press.
VERNON, R. 1984. Linking Managers with Ministers: DILEMMAS OF THE STATE-OWNED ENTERPRISE. Journal of Policy Analysis & Management, Vol.4, pp.39-55.
VICKERS, A. & MCGREGOR, K. E. 2011. Public debates about history: Comparative notes from Indonesia. History Australia, Vol.2, pp.44.1-44.13.
WAELCHLI, U. & ZELLER, J. 2013. Old captains at the helm: Chairman age and firm performance. Journal of Banking & Finance, Vol.37, pp.1612-1628.
WANJIRU, N. 2009. Corporate Governance of Non-listed Companies by Joseph A. McCahery and Erik P. M. Vermeulen. The Modern Law Review, Vol.72, pp.507.
WARMBRUNN, W. 1963. The Dutch under German Occupation, 1940-1945, Stanford, Stanford University Press.
WATERLOW, S. 1907. Historical Studies and Essays, by Lord Acton (Book Review).
WELLS, J. K. 2000. Multiple directorships: the fiduciary duties and conflicts of interest that arise when one individual serves more than one corporation. John Marshall Law Review, Vol.33, pp.561.
WESTFIELD, M. 2003. HIH: the inside story of Australia's biggest corporate collapse, Milton, Qld, John Wiley & Sons Australia.
WHINCOP, M. J. 2005. Corporate governance in government corporations, Burlington, VT, Ashgate.
WIDIANTO, S. 2016. Jumlah Direksi dan Anak USa PTPN akan dipangkas, Available at: http://www.pikiran-rakyat.com/ekonomi/2016/07/19/jumlah-direksi-dan-anak-usaha-ptpn-akan-dipangkas-375124, [Accessed on 17 Nopember 2016]
WILLIAMSON, O. E. 1975. Markets and hierarchies. American Economic Review, New York, pp.26-30.
WILLIAMSON, O. E. 1985. The economic Intstitutions of Capitalism, USA, Simon and Schuster.
P a g e | 337
WWW.BUMN.GO.ID. 2014. Kementerian Badan Usaha Milik Negara [Online]. Jakarta. Available: http://www.bumn.go.id/ [Accessed January 18, 2014 2014].
WYMEERSCH, E. 2003. Do we need a law on groups of companies? Capital Markets and Company Law, pp.573-600.
YANG, T. & ZHAO, S. 2012. CEO Duality, Competition, and Firm Performance. Available at https://papers.ssrn.com/sol3/papers.cfm?abstract_id=2177403, [Accessed on 16 January 2015].
YAZDANFAR, D. & ÖHMAN, P. 2015. Debt financing and firm performance: an empirical study based on Swedish data. The Journal of Risk Finance, Vol.16, pp.102-118.
YERMACK, D. 1996. Higher market valuation of companies with a small board of directors. Journal of Financial Economics, Vol.40, pp.185-211.
YOZ/ANT. 2016. BPK: 45 Anak Usaha BUMN Berpotensi Rugikan Negara. Available: http://www.hukumonline.com/berita/baca/lt54b9d3585d9e7/bpk--45-anak-usaha-bumn-berpotensi-rugikan-negara, [Accessed on 12 Nopember 2016]
ZAHRA, S. A. & PEARCE, J. A. 1989. Boards of directors and corporate financial performance: A review and integrative model. Journal of Management, Vol.15, pp.291-334.
ZIMMERMANN, R. 1997. The civil law in European codes. The Civilian Tradition and Scots Law: Aberdeen Quincentenary Essays. Duncker & Humblot.
ZINGALES, L. 1997. Corporate Governance. National Bureau of Economic Research, Cambridge, MA.
LEGISLATION
Indonesia Legislation
Undang-Undang Dasar 1945 (The 1945 Constitution of the Republic of Indonesia)
Undang-Undang Republik Indonesia Nomor 30 tahun 2009 tentang Ketenagalistrikan [Law
No.30 of 2009 on Electricity Power] (Indonesia)
Undang-Undang Republik Indonesia Nomor 40 tahun 2007 tentang Perseroan Terbatas
[Law No.40 of 2007 on Limited Liability Company] (Indonesia)
Undang-Undang Republik Indonesia Nomor 15 tahun 2006 tentang Badan Pemeriksaan
Keuangan [Law No.15 of 2006 on the Supreme Auditor] (Indonesia)
P a g e | 338
Undang-Undang Republik Indonesia Nomor 37 tahun 2004 tentang Kepailitan dan
Penundaan Kewajiban Pembayaran Utang [Law No.37 of 2004 on Bamkruptcy and
Moratorium to Debt Obligation] (Indonesia)
Undang-Undang Republik Indonesia Nomor 1 tahun 2004 tentang Perbendaharaan Negara
[Law No.1 of 2004 on Treasury State] (Indonesia)
Undang-Undang Republik Indonesia Nomor 19 tahun 2003 tentang Badan Usaha Milik
Negara [Law No.19 of 2003 on State-Owned Enterprise] (Indonesia)
Undang-Undang Republik Indonesia Nomor 17 tahun 2003 tentang Keuangan Negara [Law
No.17 of 2003 on State Finance] (Indonesia)
Undang-Undang Republik Indonesia Nomor 5 tahun 1999 tentang Larangan Praktek
Monopoli dan Persaingan Usaha Tidak Sehat [Law No.5 of 1999 on Law Concerning
Prohibition of Monopolistic Practices and Unfair Business Competition] (Indonesia)
Undang-Undang Republik Indonesia Nomor 4 tahun 1998 tentang Penetapan Peraturan
pemerintah Pengganti Undang-undang Nomor 1 Tahun 1998 Tentang Perubahan Atas
Udang-Undang Tentang Kepailitan Menjadi Undang-undang [Law No.4 of 1998 on The
Establishment of Regulation Government in Lieu of Law number 1 year 1998 on
Amendment to the Law about Bankruptcy Law Being General Law.] (Indonesia)
Undang-Undang Republik Indonesia Nomor 8 tahun 1995 tentang Peraturan Pasar Modal
[Law No.8 of 1995 on Capital Market] (Indonesia)
Undang-Undang Republik Indonesia Nomor 1 tahun 1995 tentang Perseroan Terbatas [Law
No.1 of 1995 on Limited Liability Company] (Indonesia)
Undang-Undang Republik Indonesia Nomor 3 tahun 1982 tentang Wajib Daftar Perusahaan
[Law No.3 of 1982 on Company Registration] (Indonesia)
Undang-Undang Republik Indonesia Nomor 9 tahun 1969 tentang Penetapan Peraturan
Pemerintah Pengganti Undang-Undang Nomor 1 Tahun 1969 tentang bentuk-Bentuk
Usaha Negara Menjadi Undang-Undang [Law No.9 of 1969 on the Determination of
Government Regulation in Lieu of Law No.1 of 1969 on forms of State Enterprise
Becomes Law] (Indonesia)
P a g e | 339
Undang-Undang Republik Indonesia Nomor 6 tahun 1968 tentang Penanaman Modal Dalam
Negeri [Law No.6 of 1968 on Domestic Investment] (Indonesia)
Undang-Undang Republik Indonesia Nomor 1 tahun 1967 tentang Penanaman Modal Asing
[Law No.1 of 1967 on Foreign Investment] (Indonesia)
Undang-Undang Republik Indonesia Nomor 86 tahun 1958 tentang Nasionalisasi
Perusahaan-Perusahaan Belanda [Law No.86 of 1958 on Nationalization of the Dutch
Companies] (Indonesia)
Undang-Undang Republik Indonesia Nomor 15 tahun 1952 tentang Penetapan Undang-
Undang Darurat Tentang Bursa [Law No.15 of 1952 on Emergency Law on Bourse]
(Indonesia)
Undang-Undang Hindia Belanda, Indische Bedrijvenwet (IBW), tahun staatsblad 1927
No.419 tentang Peraturan Keuangan Perusahaan Negara Indonesia [Indische
Bedrijvenwet, gazetted 1927 No. 419 on the regulation of the finance of the State-
Owned Enterprise Indonesia] (Hindia Belanda)
Undang-Undang Hindia Belanda, Indische Comptabiliteitswet (ICW), Staatsblad 1864 No.
106 tahun 1864 tentang Perbendaharaan Indonesia [Indische Comptabiliteitswet,
gazetted 1864 No.106 of year 1864 on the Treasury State of Indonesia] (Hindia
Belanda)
FOREIGN LEGISLATIONS:
The Government Owned Company Act 1993 (GOC) of Queensland State, Australia.
The Company Act 1993 of New Zealand.
State Owned Enterprise Act 1992 of the State of Victoria, Australia
REGULATIONS, INSTRUCTIONS AND DECREES (INDONESIA):
Peraturan Pemerintah Republik Indonesia Nomor 59 tahun 2009 tentang Perubahan Atas
Peraturan Pemerintah No.33 Tahun 2005 tentang Tata Cara Privatisasi Perusahaan
Perseroan (Persero) [Government Regulation No.59 of 2009 on Amendment to
P a g e | 340
Government Regulation No.33 of 2005 on the Privatization of the State-Owned
Enterprise (Persero)] (Indonesia)
Peraturan Pemerintah Republik Indonesia Nomor 8 tahun 2006 tentang Pelaporan
Keuangan dan Kinerja Instansi Pemerintah [Government Regulation No.8 of 2006 on
Financial Reporting amd the Performance of the Governmental Institution] (Indonesia)
Peraturan Pemerintah Republik Indonesia Nomor 45 tahun 2005 tentang Pendirian,
Pengurusan, Pengawasan, dan Pembubaran BUMN [Government Regulation No.45
of 2005 on Establishment, Management, Control, and Liquidation of SOE] (Indonesia)
Peraturan Pemerintah Republik Indonesia Nomor 44 tahun 2005 tentang Tata Cara
Penyertaan dan Penatausahaan Modal Negara pada BUMN [Government Regulation
No.44 of 2005 on Procedures for Investment and Adminstration of State Capital on
SOE and Limited Liability Company] (Indonesia)
Peraturan Pemerintah Republik Indonesia Nomor 33 tahun 2005 tentang Tata Cara
Privatisasi BUMN [Government Regulation No.33 of 2005 on The Procedure of SOE
Privatization] (Indonesia)
Peraturan Pemerintah Republik Indonesia Nomor 10 tahun 2004 tentang Pendirian BUMN
PT Perusahaan Pengelola Aset (PPA) [Government Regulation No.10 of 2004 on the
Establishment of SOE Management Asset Company (PT PPA)] (Indonesia)
Peraturan Pemerintah Republik Indonesia Nomor 41 tahun 2003 tentang Pelimpahan
Kedudukan, Tugas, dan Kewenangan Menteri Keuangan pada Perusahaan Perseroan
(persero), Perusahaan Umum (Perum), dan Perusahaan Jawatan (Perjan) Kepada
Menteri Negara BUMN) [Government Regulation No.41 of 2003 on the delegation of
the position, duties, and authority of the Minister of Finance on SOE to the Minister of
State-Owned Enterprise] (Indonesia)
Peraturan Pemerintah Republik Indonesia Nomor 64 tahun 2001 tentang Pengalihan
Kedudukan, Tugas, dan Kewenangan Menteri Keuangan pada BUMN kepada Menteri
BUMN [Government Regulation No.64 of 2001 on Transfer of the position, duties, and
authority of the Miniter of Finance to the Minister of SOE] (Indonesia)
Peraturan Pemerintah Republik Indonesia Nomor 28 tahun 1997 tentang Penambahan
Penyertaan Modal Negara Republik Indonesia ke Dalam Modal Saham Perusahaan
P a g e | 341
Perseroan (Persero) PT Pupuk Sriwijaya [Government Regulation No.28 of 1997 on
Additional State Capital of the Republic of Indonesia to the Capital of SOE PT Pupuk
Sriwijaya ] (Indonesia)
Peraturan Pemerintah Republik Indonesia Pengganti Undang-Undang Nomor 1 tahun 1969
tentang Bentuk-Bentuk Usaha Negara [Government Regulation in Lieu of Law No.1 of
1969 on the Forms of SOE] (Indonesia)
Peraturan Pemerintah Republik Indonesia Pengganti Undang-Undang Nomor 19 tahun 1960
tentang Perusahaan Negara [Government Regulation in Lieu of Law No.19 of 1960 on
State-Owned Enterprise] (Indonesia)
Peraturan Pemerintah Republik Indonesia Nomor 9 tahun 1959 tentang Tugas Kewajiban
Panitia Penetapan Ganti kerugian Perusahaan-Perusahaan MIlik Belanda yang
Dikenakan Nasionalisasi dan Cara Mengajukan Permintaan Ganti kerugian
[Government Regulation No.9 of 1959 on the Obligation Duties of the Compensation
Committee to the Dutch Companies imposed to the nationalization and Procedures of
the compensation requirements ] (Indonesia)
Peraturan Pemerintah Republik Indonesia Nomor 23 tahun 1958 tentang Penempatan
semua Perusahaan Belanda Di Bawah Penguasaan Pemerintah Indonesia
[Government Regulation No.23 of 1958 on the Placement All Dutch Companies Under
the Control of the Government of Indonesia] (Indonesia)
Keputusan Presiden Republik Indonesia Nomor 60 tahun 2015 tentang Rencana Kerja
Pemerintah Tahun 2016 [Presidential Decree No.60 of 2015 on the Annual of the
Government Plan 2016] (Indonesia)
Keputusan Presiden Republik Indonesia Nomor 72 tahun 2014 tentang Penambahan
Penyertaan Modal Negara Republik Indonesia ke Dalam Modal Saham BUMN PT
Perkebunan Nusantara III (PT PN III) [Presidential Decree No.72 of 2014 on the
Additional Capital of the Republic of Indonesia into the Capital Stock of SOE PT
Perkebunan Nusantara III (PT PN III)] (Indonesia)
Keputusan Presiden Republik Indonesia Nomor 29 tahun 2014 tentang Sistem Akuntabilitas
Kinerja Instansi Pemerintah [Presidential Decree No.29 of 2014 on Accountability
System of Governmental Institution] (Indonesia)
P a g e | 342
Keputusan Presiden Republik Indonesia Nomor 27 tahun 1998 tentang Pembentukan Badan
Penyehatan Perbankan Nasional [Presidential Decree No.27 of 1998 on the
Establishment of National Banking Restructuring Agency ] (Indonesia)
Instruksi President Republik Indonesia Nomor 18 tahun 2006 tentang Pembentukan Komite
Privatisasi BUMN [Presidential Instruction No.18 of 2006 on the Establishment of
Privatization Committee of SOE] (Indonesia)
Instruksi President Republik Indonesia Nomor 17 tahun 1967 tentang Pengarahan dan
Penyederhanaan Perusahaan Negara ke dalam Tiga Bentuk Usaha Negara
[Presidential Instruction No.17 of 1967 on Direction and Simplification of State-Owned
Enterprise into Three Forms of State Enterprise] (Indonesia)
Instruksi President Republik Indonesia Nomor 17 tahun 1967 tentang Pengarahan dan
Penyederhanaan Perusahaan Negara ke dalam Tiga Bentuk Usaha Negara
[Presidential Instruction No.17 of 1967 on Direction and Simplification of State-Owned
Enterprise into Three Forms of State Enterprise] (Indonesia)
Keputusan Mahkamah Konstitusi Republik Indonesia No. 36/PUU-X/2012 tahun 2012
tentang Pembatalan Beberapa Ketentuan Undang-Undang no.22 Tahun 2001 tentang
Minyak dan Gas [Constitution Court No.36/PUU-X/2012 of 2012 on Annulling Some of
the Provisions of Law No 22 Year 2001 on Oil and Gas] (Indonesia)
Keputusan Menteri Koordinator Ekonomi, Keuangan, dan Industry No. KEP-
49/M.EKON/11/2004 tahun 2004 tentang Pembentukan Komite Nasional Kebijakan
Corporate Governance [Ministerial Decree of Economic, Finance, and Industry
Coordinator No.KEP-49/M.EKON/11/2004 of 2004 on the Establishment of the
National Committee on Corporate Governance Policy ] (Indonesia)
Keputusan Menteri Koordinator Ekonomi, Keuangan, dan Industry No.
KEP/31/M.EKUIN/08/1999 tahun 1999 tentang Pembentukan Komite Nasional
Kebijakan Corporate Governance [Ministerial Decree of Economic, Finance, and
Industry Coordinator No.KEP/31/M.EKUIN/08/1999 of 1999 on the Establishment of
the National Committee on Corporate Governance Policy ] (Indonesia)
Keputusan Menteri BUMN No. PER-03/MBU/02/2015 tahun 2015 tentang Persyaratan, Tata
Cara, Pengangkatan, dan Pemberhentian Anggota Direksi Badan Usaha Milik Negara
[Ministerial Decree of SOE No.PER-03/MBU/02/2015 of 2015 on the Requirements,
P a g e | 343
Procedures for Appointment and Dismissal of Director of the State-Owned Enterprise]
(Indonesia)
Keputusan Menteri BUMN No. PER-04/MBU/2014 tahun 2014 tentang Pedoman Penetapan
Penghasilan Direksi, Dewan Komisaris, dan Dewan Pengawas Badan Usaha Milik
Negara [Ministerial Decree of SOE No.PER-04/MBU/2014 of 2014 on The Guidance
of Remuneration for Directors, Commissioner, Oversight Board of State-Owned
Enterprise] (Indonesia)
Keputusan Menteri BUMN No. PER-21/MBU/2012 tahun 2012 tentang Pedoman Penerapan
Akuntabilitas Keuangan badan Usaha Milik Negara [Ministerial Decree of SOE
No.PER-21/MBU/2012 of 2012 on the Guidance of Financial accountability
implementation of BUMN] (Indonesia)
Keputusan Menteri BUMN No. PER-05/MBU/2012 tahun 2012 tentang Perubahan Atas
Peraturan Menteri negara Badan Usaha Milik Negara Nomor PER-01/MBU/2009
Tentang Pedoman Restrukturisasi dan Revitalisasi Badan Usaha Milik Negara oleh
Perusahaan Perseroan (Persero) PT Perusahaan Pengelola Aset [Ministerial Decree
of SOE No.PER-05/MBU/2012 of 2012 on the Restructuring and Revitalization
Guidance of SOE by SOE PT Asset Management Company] (Indonesia)
Keputusan Menteri BUMN No. PER-03/MBU/2012 tahun 2012 tentang Pedoman
Pengangkatan Anggota Direksi dan Anggota Dewan Komisaris Anak Perusahaan
Badan Usaha Milik Negara [Ministerial Decree of SOE No.PER-03/MBU/2012 of 2012
on the Guidance for the Appointment of Director and Commissioner of Subsidiary
Company] (Indonesia)
Keputusan Menteri BUMN No. PER-01/MBU/2012 tahun 2012 tentang Persyaratan dan Tata
Cara Pengangkatan dan Pemberhentian Anggota Direksi Badan Usaha Milik Negara
[Ministerial Decree of SOE No.PER-01/MBU/2012 of 2012 on the Terms and
Procedures for Appointment and Dismissal Director of the State owned Enterprises]
(Indonesia)
Keputusan Menteri BUMN No. PER-01/MBU/2011 tahun 2011 tentang Penerapan Tata
Kelola Perusahaan Yang Baik (Good Corporate Governance) Pada Badan Usaha Milik
Negara [Ministerial Decree of SOE No.PER-01/MBU/2011 of 2011 on the
Implementation of Good Corporate Governance in BUMN] (Indonesia)
P a g e | 344
Keputusan Menteri BUMN No. PER-01/MBU/2010 tahun 2010 tentang Cara Privatisasi,
Penyusunan Program Tahunan Privatisasi, Dan Penunjukan Lembaga Dan/Atau
Profesi Penunjang Serta Profesi Lainnya [Ministerial Decree of SOE No.PER-
01/MBU/2010 of 2010 on Privatization method, making annual program of
privatization, and appointing an institution of association and/or prefession or other
profession] (Indonesia)
Keputusan Menteri BUMN No. 01/MBU/2009 tahun 2009 tentang Pedoman Restrukturisasi
Dan Revitalisasi Badan Usaha Milik Negara Oleh Perusahaan Perseroan (Persero) PT
Perusahaan Pengelola Aset [Ministerial Decree of SOE No.PER-01/MBU/2009 of
2009 on the Restructuring and Revitalization Guidance of SOE by SOE PT Asset
Management Company] (Indonesia)
Keputusan Menteri BUMN No. 117/M-MBU/2002 tahun 2002 tentang Penerapan Praktek
Good Corporate Governance pada Badan Usaha Milik Negara (BUMN) [Ministerial
Decree of SOE No.117/M-MBU/2002 of 2002 on Good Corporate Governance
Implementation in the State-Owned Enterprise (SOE)] (Indonesia)
Keputusan Menteri BUMN No. KEP-103/MBU/2002 tahun 2002 tentang Pembentukan
Komite Audit Badan Usaha Milik Negara (BUMN) [Ministerial Decree of SOE No.KEP-
103/MBU/2002 of 2002 on Establisment of Audit Committee in State-Owned
Enterprise] (Indonesia)
Keputusan Menteri Pendayagunaan Aparatur Negara dan Reformasi Birokrasi No. 53 tahun
2014 tentang Petunjuk Teknis Perjanjian Kinerja, Pelaporan Kinerja, dan Tata Cara
Reviu Atas Laporan Kinerja Instansi Pemerintah [Ministerial Decree of State
Apparatus Reform No.53 of year 2014 on Technical Guidance of Performance
Contract, Performance Reporting, and the Procedure of Review on the Perfomance
Report of the Government Institution] (Indonesia)
Keputusan Menteri Hukum dan Hak Asasi Manusia No. AHU-17695.AH.01.02 tahun 2012
tentang Penetapan Nama PT Pupuk Sriwijaya [Ministerial Decree of Justice and
Human Rights No.AHU-17695.AH.01.02 of 2012 on the Establishment of the Name of
PT Pupuk Sriwijaya] (Indonesia)
Peraturan Bank Indonesia No. 8/14/PBI/2006 tahun 2006 tentang Perubahan Peraturan
Bank Indonesia No.8/4/PBI/2006 of 2006 tentang Tata Kelola Perusahaan Yang Baik
P a g e | 345
untuk bank komersiil [Regulation of Bank Indonesia No. 8/14/PBI/2006 on amendment
to Regulation of Bank Indonesia Number 8/4/PBI/2006 Regarding Implementation of
Good Corporate Governance for Commercial Banks] (Indonesia)
Peraturan Otoritas Jasa Keuangan No. 33/POJK.04/2014 tahun 2014 tentang Direksi dan
Dewan Komisaris Emiten Atau Perusahaan Publik [Regulation of the Financial
Services Authority No.33/POJK.04/2014 of 2014 on Director and Board of
Commissioner of Issuer or Listed Company] (Indonesia)
Peraturan Otoritas Jasa Keuangan No. 33/POJK.04/2014 tahun 2014 tentang Direksi dan
Dewan Komisaris Emiten Atau Perusahaan Publik [Regulation of the Financial
Services Authority No.33/POJK.04/2014 of 2014 on Director and Board of
Commissioner of Issuer or Listed Company] (Indonesia)
Surat Sekretaris Utama Kementerian BUMN No. SK-16/S.MBU/2012 tahun 2012 tentang
Indikator/parameter untuk evaluasi implementasi corporate governance di BUMN [The
Letter from Primary Secretary of the Ministry of State-Owned Enterprises No. SK-
16/S.MBU/2012 of 2012 on indicator/parameter for the evaluation of implementation of
corporate governance in State-Owned Enterprise ] (Indonesia)
Surat Deputi Infrastruktur Bisnis Kementerian BUMN No. S-08/D7.MBU/08/2015 tahun 2015
tentang Pelaksanaan Asesmen Implementasi Kriteria Penilaian Kinerja Unggul tahun
2015 [The Letter from the Deputy of Business Infrastructure of the Ministry of State-
Owned Enterprises No. S-08/D7.MBU/08/2015 of 2015 on the Assessment of the
Implementation of Excellent Performance of the year 2015] (Indonesia)
.
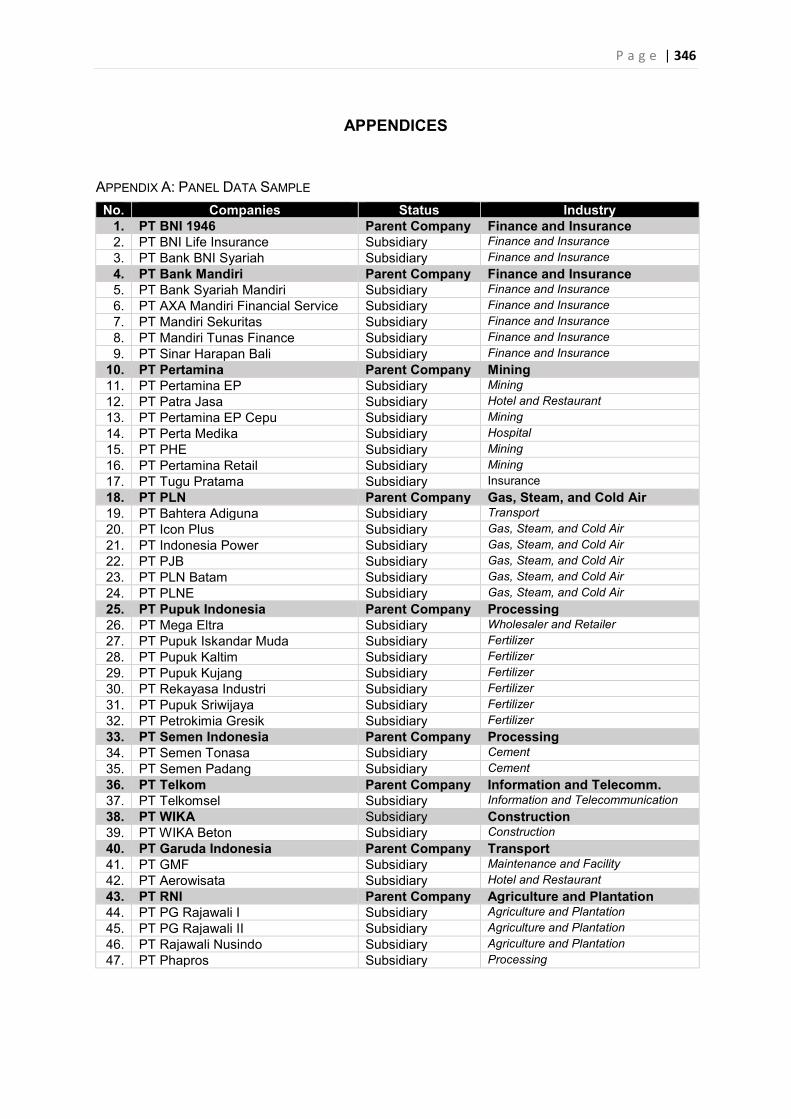
P a g e | 346
APPENDICES
APPENDIX A: PANEL DATA SAMPLE No. Companies Status Industry
1. PT BNI 1946 Parent Company Finance and Insurance 2. PT BNI Life Insurance Subsidiary Finance and Insurance 3. PT Bank BNI Syariah Subsidiary Finance and Insurance 4. PT Bank Mandiri Parent Company Finance and Insurance 5. PT Bank Syariah Mandiri Subsidiary Finance and Insurance 6. PT AXA Mandiri Financial Service Subsidiary Finance and Insurance 7. PT Mandiri Sekuritas Subsidiary Finance and Insurance 8. PT Mandiri Tunas Finance Subsidiary Finance and Insurance 9. PT Sinar Harapan Bali Subsidiary Finance and Insurance
10. PT Pertamina Parent Company Mining 11. PT Pertamina EP Subsidiary Mining 12. PT Patra Jasa Subsidiary Hotel and Restaurant 13. PT Pertamina EP Cepu Subsidiary Mining 14. PT Perta Medika Subsidiary Hospital 15. PT PHE Subsidiary Mining 16. PT Pertamina Retail Subsidiary Mining 17. PT Tugu Pratama Subsidiary Insurance 18. PT PLN Parent Company Gas, Steam, and Cold Air 19. PT Bahtera Adiguna Subsidiary Transport 20. PT Icon Plus Subsidiary Gas, Steam, and Cold Air 21. PT Indonesia Power Subsidiary Gas, Steam, and Cold Air 22. PT PJB Subsidiary Gas, Steam, and Cold Air 23. PT PLN Batam Subsidiary Gas, Steam, and Cold Air 24. PT PLNE Subsidiary Gas, Steam, and Cold Air 25. PT Pupuk Indonesia Parent Company Processing 26. PT Mega Eltra Subsidiary Wholesaler and Retailer 27. PT Pupuk Iskandar Muda Subsidiary Fertilizer 28. PT Pupuk Kaltim Subsidiary Fertilizer 29. PT Pupuk Kujang Subsidiary Fertilizer 30. PT Rekayasa Industri Subsidiary Fertilizer 31. PT Pupuk Sriwijaya Subsidiary Fertilizer 32. PT Petrokimia Gresik Subsidiary Fertilizer 33. PT Semen Indonesia Parent Company Processing 34. PT Semen Tonasa Subsidiary Cement 35. PT Semen Padang Subsidiary Cement 36. PT Telkom Parent Company Information and Telecomm. 37. PT Telkomsel Subsidiary Information and Telecommunication 38. PT WIKA Subsidiary Construction 39. PT WIKA Beton Subsidiary Construction 40. PT Garuda Indonesia Parent Company Transport 41. PT GMF Subsidiary Maintenance and Facility 42. PT Aerowisata Subsidiary Hotel and Restaurant 43. PT RNI Parent Company Agriculture and Plantation 44. PT PG Rajawali I Subsidiary Agriculture and Plantation 45. PT PG Rajawali II Subsidiary Agriculture and Plantation 46. PT Rajawali Nusindo Subsidiary Agriculture and Plantation 47. PT Phapros Subsidiary Processing
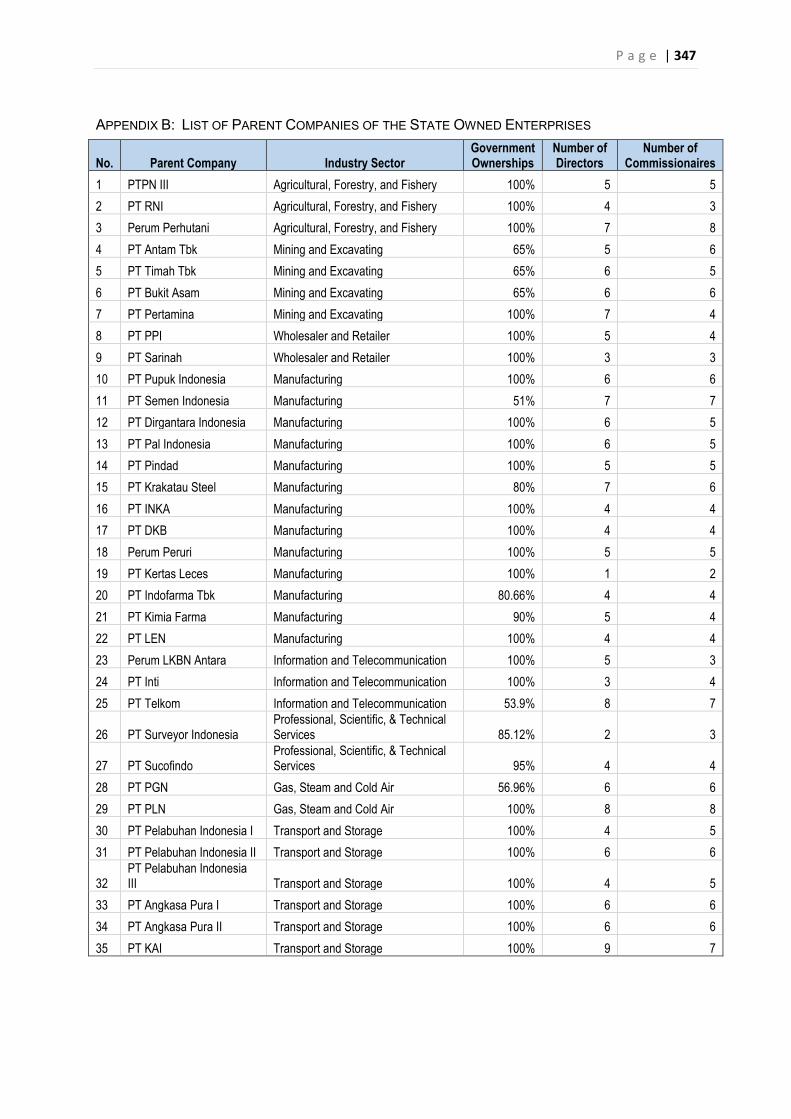
P a g e | 347
APPENDIX B: LIST OF PARENT COMPANIES OF THE STATE OWNED ENTERPRISES
No. Parent Company Industry Sector Government Ownerships
Number of Directors
Number of Commissionaires
1 PTPN III Agricultural, Forestry, and Fishery 100% 5 5 2 PT RNI Agricultural, Forestry, and Fishery 100% 4 3 3 Perum Perhutani Agricultural, Forestry, and Fishery 100% 7 8 4 PT Antam Tbk Mining and Excavating 65% 5 6 5 PT Timah Tbk Mining and Excavating 65% 6 5 6 PT Bukit Asam Mining and Excavating 65% 6 6 7 PT Pertamina Mining and Excavating 100% 7 4 8 PT PPI Wholesaler and Retailer 100% 5 4 9 PT Sarinah Wholesaler and Retailer 100% 3 3 10 PT Pupuk Indonesia Manufacturing 100% 6 6 11 PT Semen Indonesia Manufacturing 51% 7 7 12 PT Dirgantara Indonesia Manufacturing 100% 6 5 13 PT Pal Indonesia Manufacturing 100% 6 5 14 PT Pindad Manufacturing 100% 5 5 15 PT Krakatau Steel Manufacturing 80% 7 6 16 PT INKA Manufacturing 100% 4 4 17 PT DKB Manufacturing 100% 4 4 18 Perum Peruri Manufacturing 100% 5 5 19 PT Kertas Leces Manufacturing 100% 1 2 20 PT Indofarma Tbk Manufacturing 80.66% 4 4 21 PT Kimia Farma Manufacturing 90% 5 4 22 PT LEN Manufacturing 100% 4 4 23 Perum LKBN Antara Information and Telecommunication 100% 5 3 24 PT Inti Information and Telecommunication 100% 3 4 25 PT Telkom Information and Telecommunication 53.9% 8 7
26 PT Surveyor Indonesia Professional, Scientific, & Technical Services 85.12% 2 3
27 PT Sucofindo Professional, Scientific, & Technical Services 95% 4 4
28 PT PGN Gas, Steam and Cold Air 56.96% 6 6 29 PT PLN Gas, Steam and Cold Air 100% 8 8 30 PT Pelabuhan Indonesia I Transport and Storage 100% 4 5 31 PT Pelabuhan Indonesia II Transport and Storage 100% 6 6
32 PT Pelabuhan Indonesia III Transport and Storage 100% 4 5
33 PT Angkasa Pura I Transport and Storage 100% 6 6 34 PT Angkasa Pura II Transport and Storage 100% 6 6 35 PT KAI Transport and Storage 100% 9 7
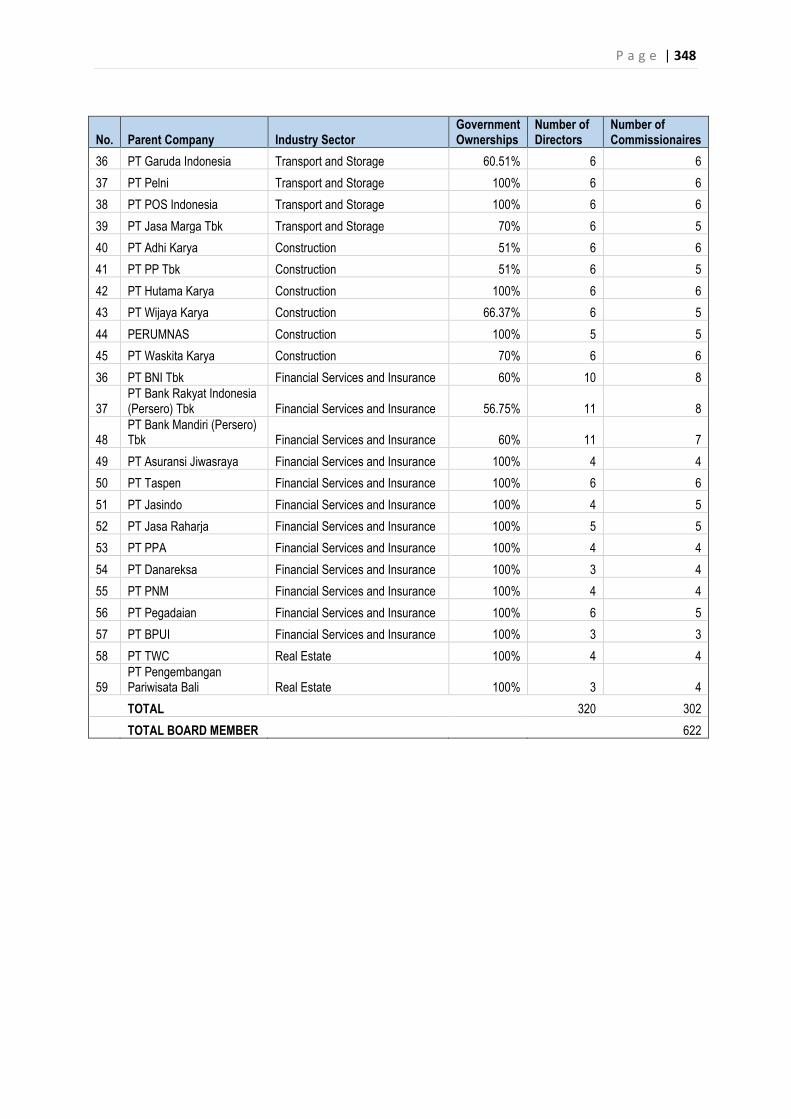
P a g e | 348
No. Parent Company Industry Sector Government Ownerships
Number of Directors
Number of Commissionaires
36 PT Garuda Indonesia Transport and Storage 60.51% 6 6 37 PT Pelni Transport and Storage 100% 6 6 38 PT POS Indonesia Transport and Storage 100% 6 6 39 PT Jasa Marga Tbk Transport and Storage 70% 6 5 40 PT Adhi Karya Construction 51% 6 6 41 PT PP Tbk Construction 51% 6 5 42 PT Hutama Karya Construction 100% 6 6 43 PT Wijaya Karya Construction 66.37% 6 5 44 PERUMNAS Construction 100% 5 5 45 PT Waskita Karya Construction 70% 6 6 36 PT BNI Tbk Financial Services and Insurance 60% 10 8
37 PT Bank Rakyat Indonesia (Persero) Tbk Financial Services and Insurance 56.75% 11 8
48 PT Bank Mandiri (Persero) Tbk Financial Services and Insurance 60% 11 7
49 PT Asuransi Jiwasraya Financial Services and Insurance 100% 4 4 50 PT Taspen Financial Services and Insurance 100% 6 6 51 PT Jasindo Financial Services and Insurance 100% 4 5 52 PT Jasa Raharja Financial Services and Insurance 100% 5 5 53 PT PPA Financial Services and Insurance 100% 4 4 54 PT Danareksa Financial Services and Insurance 100% 3 4 55 PT PNM Financial Services and Insurance 100% 4 4 56 PT Pegadaian Financial Services and Insurance 100% 6 5 57 PT BPUI Financial Services and Insurance 100% 3 3 58 PT TWC Real Estate 100% 4 4
59 PT Pengembangan Pariwisata Bali Real Estate 100% 3 4
TOTAL
320 302
TOTAL BOARD MEMBER 622
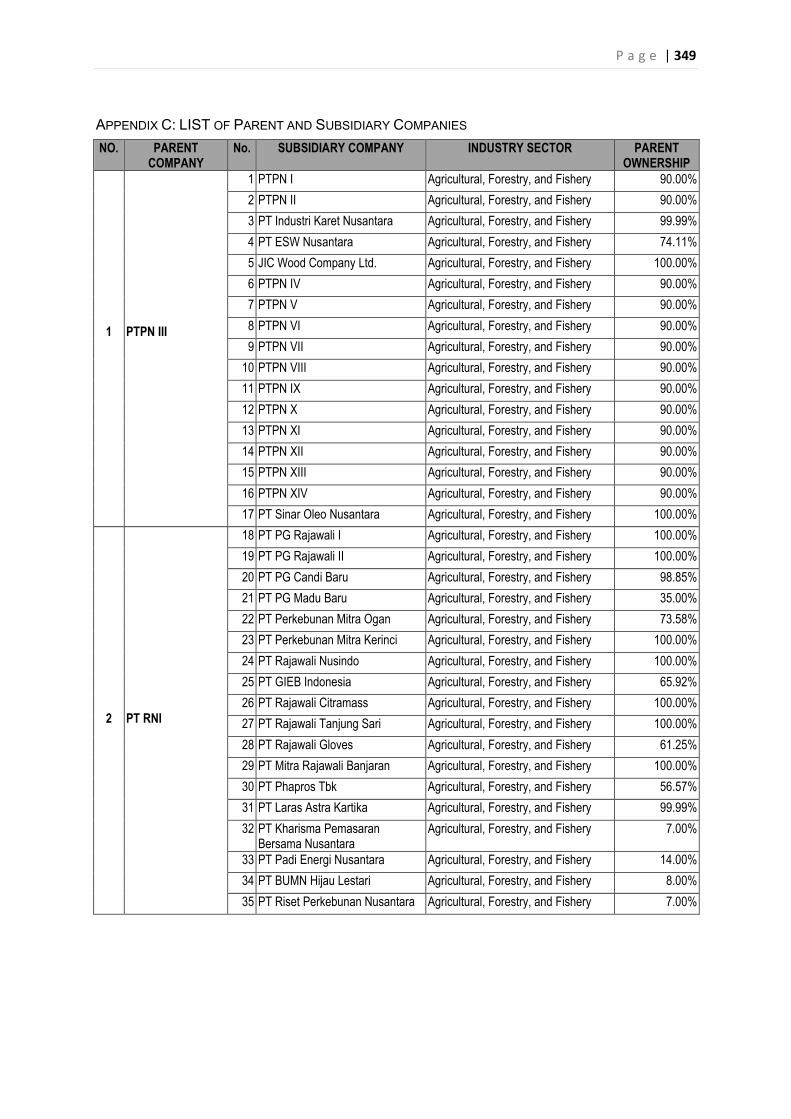
P a g e | 349
APPENDIX C: LIST OF PARENT AND SUBSIDIARY COMPANIES NO. PARENT
COMPANY No. SUBSIDIARY COMPANY INDUSTRY SECTOR PARENT
OWNERSHIP
1
PTPN III
1 PTPN I Agricultural, Forestry, and Fishery 90.00% 2 PTPN II Agricultural, Forestry, and Fishery 90.00% 3 PT Industri Karet Nusantara Agricultural, Forestry, and Fishery 99.99% 4 PT ESW Nusantara Agricultural, Forestry, and Fishery 74.11% 5 JIC Wood Company Ltd. Agricultural, Forestry, and Fishery 100.00% 6 PTPN IV Agricultural, Forestry, and Fishery 90.00% 7 PTPN V Agricultural, Forestry, and Fishery 90.00% 8 PTPN VI Agricultural, Forestry, and Fishery 90.00% 9 PTPN VII Agricultural, Forestry, and Fishery 90.00%
10 PTPN VIII Agricultural, Forestry, and Fishery 90.00% 11 PTPN IX Agricultural, Forestry, and Fishery 90.00% 12 PTPN X Agricultural, Forestry, and Fishery 90.00% 13 PTPN XI Agricultural, Forestry, and Fishery 90.00% 14 PTPN XII Agricultural, Forestry, and Fishery 90.00% 15 PTPN XIII Agricultural, Forestry, and Fishery 90.00% 16 PTPN XIV Agricultural, Forestry, and Fishery 90.00% 17 PT Sinar Oleo Nusantara Agricultural, Forestry, and Fishery 100.00%
2
PT RNI
18 PT PG Rajawali I Agricultural, Forestry, and Fishery 100.00% 19 PT PG Rajawali II Agricultural, Forestry, and Fishery 100.00% 20 PT PG Candi Baru Agricultural, Forestry, and Fishery 98.85% 21 PT PG Madu Baru Agricultural, Forestry, and Fishery 35.00% 22 PT Perkebunan Mitra Ogan Agricultural, Forestry, and Fishery 73.58% 23 PT Perkebunan Mitra Kerinci Agricultural, Forestry, and Fishery 100.00% 24 PT Rajawali Nusindo Agricultural, Forestry, and Fishery 100.00% 25 PT GIEB Indonesia Agricultural, Forestry, and Fishery 65.92% 26 PT Rajawali Citramass Agricultural, Forestry, and Fishery 100.00% 27 PT Rajawali Tanjung Sari Agricultural, Forestry, and Fishery 100.00% 28 PT Rajawali Gloves Agricultural, Forestry, and Fishery 61.25% 29 PT Mitra Rajawali Banjaran Agricultural, Forestry, and Fishery 100.00% 30 PT Phapros Tbk Agricultural, Forestry, and Fishery 56.57% 31 PT Laras Astra Kartika Agricultural, Forestry, and Fishery 99.99% 32 PT Kharisma Pemasaran
Bersama Nusantara Agricultural, Forestry, and Fishery 7.00%
33 PT Padi Energi Nusantara Agricultural, Forestry, and Fishery 14.00% 34 PT BUMN Hijau Lestari Agricultural, Forestry, and Fishery 8.00% 35 PT Riset Perkebunan Nusantara Agricultural, Forestry, and Fishery 7.00%
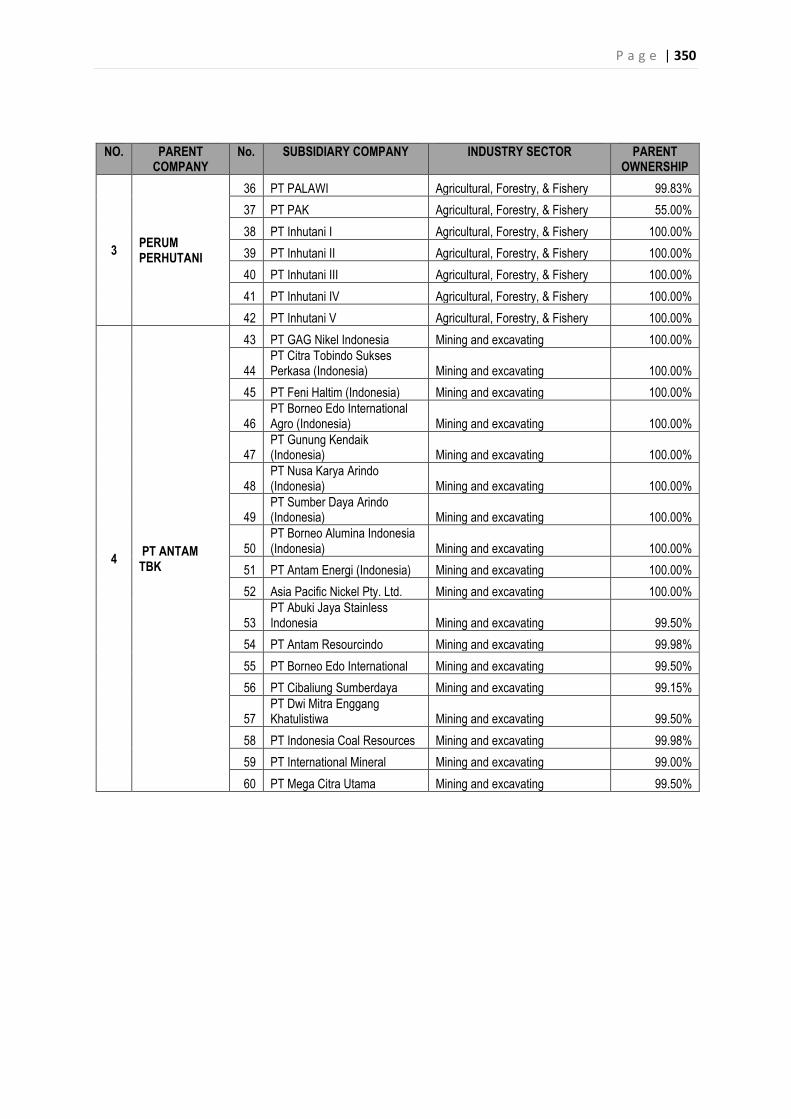
P a g e | 350
NO. PARENT COMPANY
No. SUBSIDIARY COMPANY INDUSTRY SECTOR PARENT OWNERSHIP
3 PERUM PERHUTANI
36 PT PALAWI Agricultural, Forestry, & Fishery 99.83% 37 PT PAK Agricultural, Forestry, & Fishery 55.00% 38 PT Inhutani I Agricultural, Forestry, & Fishery 100.00% 39 PT Inhutani II Agricultural, Forestry, & Fishery 100.00% 40 PT Inhutani III Agricultural, Forestry, & Fishery 100.00% 41 PT Inhutani IV Agricultural, Forestry, & Fishery 100.00% 42 PT Inhutani V Agricultural, Forestry, & Fishery 100.00%
4 PT ANTAM TBK
43 PT GAG Nikel Indonesia Mining and excavating 100.00%
44 PT Citra Tobindo Sukses Perkasa (Indonesia) Mining and excavating 100.00%
45 PT Feni Haltim (Indonesia) Mining and excavating 100.00%
46 PT Borneo Edo International Agro (Indonesia) Mining and excavating 100.00%
47 PT Gunung Kendaik (Indonesia) Mining and excavating 100.00%
48 PT Nusa Karya Arindo (Indonesia) Mining and excavating 100.00%
49 PT Sumber Daya Arindo (Indonesia) Mining and excavating 100.00%
50 PT Borneo Alumina Indonesia (Indonesia) Mining and excavating 100.00%
51 PT Antam Energi (Indonesia) Mining and excavating 100.00% 52 Asia Pacific Nickel Pty. Ltd. Mining and excavating 100.00%
53 PT Abuki Jaya Stainless Indonesia Mining and excavating 99.50%
54 PT Antam Resourcindo Mining and excavating 99.98% 55 PT Borneo Edo International Mining and excavating 99.50% 56 PT Cibaliung Sumberdaya Mining and excavating 99.15%
57 PT Dwi Mitra Enggang Khatulistiwa Mining and excavating 99.50%
58 PT Indonesia Coal Resources Mining and excavating 99.98% 59 PT International Mineral Mining and excavating 99.00% 60 PT Mega Citra Utama Mining and excavating 99.50%
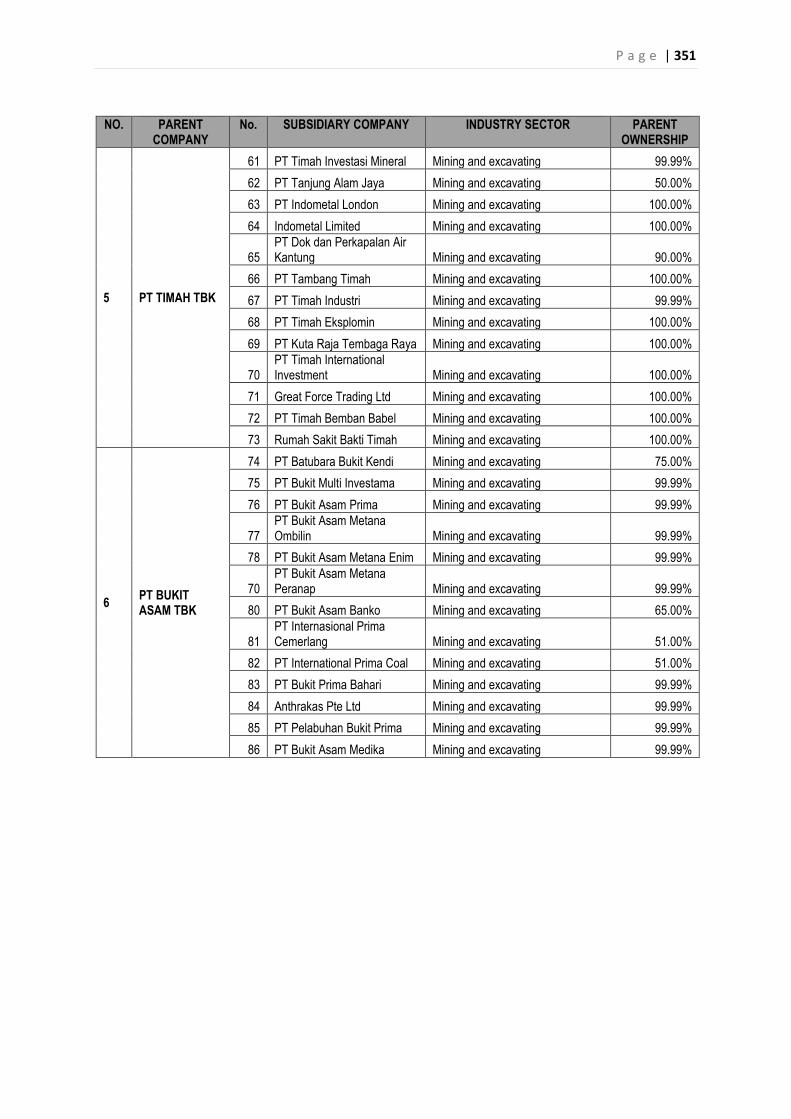
P a g e | 351
NO. PARENT COMPANY
No. SUBSIDIARY COMPANY INDUSTRY SECTOR PARENT OWNERSHIP
5 PT TIMAH TBK
61 PT Timah Investasi Mineral Mining and excavating 99.99% 62 PT Tanjung Alam Jaya Mining and excavating 50.00% 63 PT Indometal London Mining and excavating 100.00% 64 Indometal Limited Mining and excavating 100.00%
65 PT Dok dan Perkapalan Air Kantung Mining and excavating 90.00%
66 PT Tambang Timah Mining and excavating 100.00% 67 PT Timah Industri Mining and excavating 99.99% 68 PT Timah Eksplomin Mining and excavating 100.00% 69 PT Kuta Raja Tembaga Raya Mining and excavating 100.00%
70 PT Timah International Investment Mining and excavating 100.00%
71 Great Force Trading Ltd Mining and excavating 100.00% 72 PT Timah Bemban Babel Mining and excavating 100.00% 73 Rumah Sakit Bakti Timah Mining and excavating 100.00%
6 PT BUKIT ASAM TBK
74 PT Batubara Bukit Kendi Mining and excavating 75.00% 75 PT Bukit Multi Investama Mining and excavating 99.99% 76 PT Bukit Asam Prima Mining and excavating 99.99%
77 PT Bukit Asam Metana Ombilin Mining and excavating 99.99%
78 PT Bukit Asam Metana Enim Mining and excavating 99.99%
70 PT Bukit Asam Metana Peranap Mining and excavating 99.99%
80 PT Bukit Asam Banko Mining and excavating 65.00%
81 PT Internasional Prima Cemerlang Mining and excavating 51.00%
82 PT International Prima Coal Mining and excavating 51.00% 83 PT Bukit Prima Bahari Mining and excavating 99.99% 84 Anthrakas Pte Ltd Mining and excavating 99.99% 85 PT Pelabuhan Bukit Prima Mining and excavating 99.99% 86 PT Bukit Asam Medika Mining and excavating 99.99%
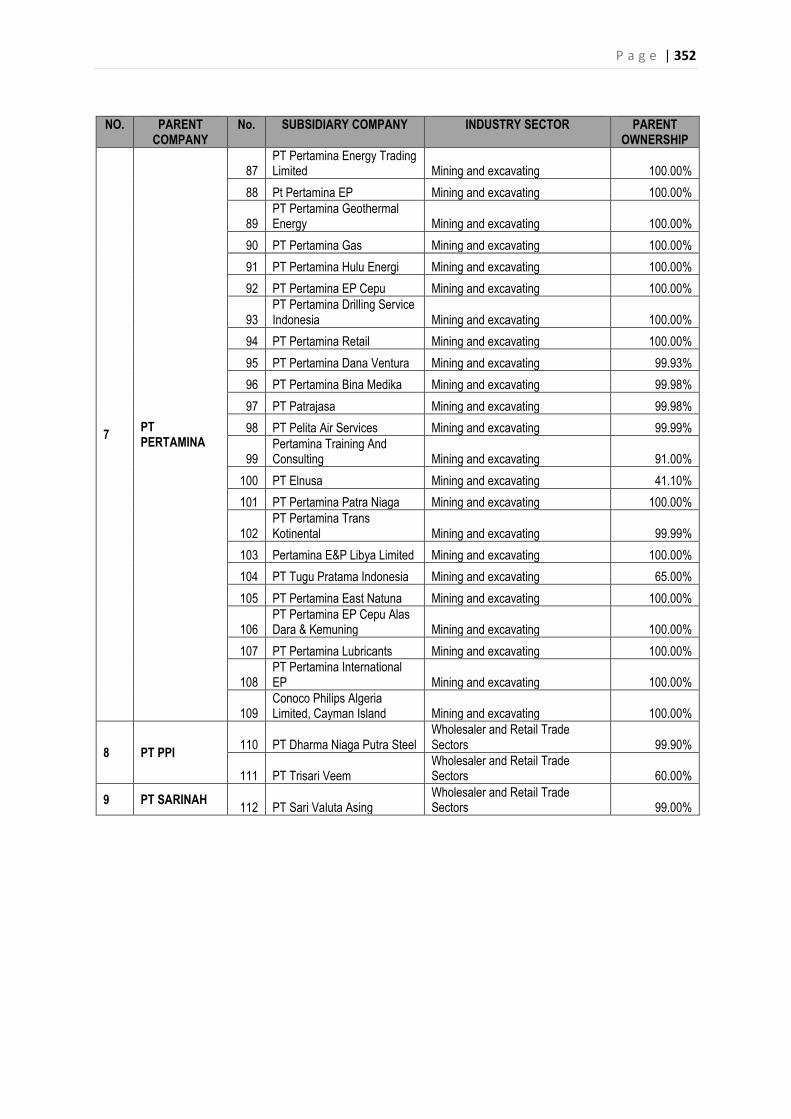
P a g e | 352
NO. PARENT COMPANY
No. SUBSIDIARY COMPANY INDUSTRY SECTOR PARENT OWNERSHIP
7 PT PERTAMINA
87 PT Pertamina Energy Trading Limited Mining and excavating 100.00%
88 Pt Pertamina EP Mining and excavating 100.00%
89 PT Pertamina Geothermal Energy Mining and excavating 100.00%
90 PT Pertamina Gas Mining and excavating 100.00% 91 PT Pertamina Hulu Energi Mining and excavating 100.00% 92 PT Pertamina EP Cepu Mining and excavating 100.00%
93 PT Pertamina Drilling Service Indonesia Mining and excavating 100.00%
94 PT Pertamina Retail Mining and excavating 100.00% 95 PT Pertamina Dana Ventura Mining and excavating 99.93% 96 PT Pertamina Bina Medika Mining and excavating 99.98% 97 PT Patrajasa Mining and excavating 99.98% 98 PT Pelita Air Services Mining and excavating 99.99%
99 Pertamina Training And Consulting Mining and excavating 91.00%
100 PT Elnusa Mining and excavating 41.10% 101 PT Pertamina Patra Niaga Mining and excavating 100.00%
102 PT Pertamina Trans Kotinental Mining and excavating 99.99%
103 Pertamina E&P Libya Limited Mining and excavating 100.00% 104 PT Tugu Pratama Indonesia Mining and excavating 65.00% 105 PT Pertamina East Natuna Mining and excavating 100.00%
106 PT Pertamina EP Cepu Alas Dara & Kemuning Mining and excavating 100.00%
107 PT Pertamina Lubricants Mining and excavating 100.00%
108 PT Pertamina International EP Mining and excavating 100.00%
109 Conoco Philips Algeria Limited, Cayman Island Mining and excavating 100.00%
8 PT PPI 110 PT Dharma Niaga Putra Steel Wholesaler and Retail Trade Sectors 99.90%
111 PT Trisari Veem Wholesaler and Retail Trade Sectors 60.00%
9 PT SARINAH 112 PT Sari Valuta Asing Wholesaler and Retail Trade Sectors 99.00%
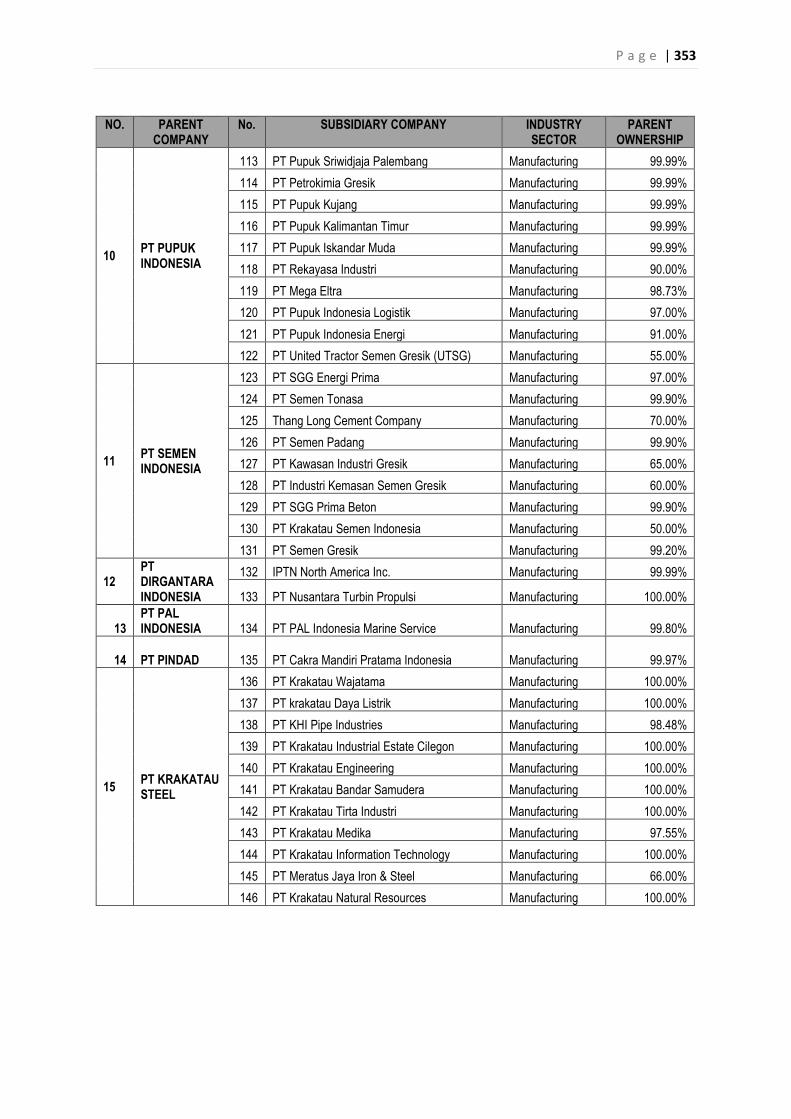
P a g e | 353
NO. PARENT COMPANY
No. SUBSIDIARY COMPANY INDUSTRY SECTOR
PARENT OWNERSHIP
10 PT PUPUK INDONESIA
113 PT Pupuk Sriwidjaja Palembang Manufacturing 99.99% 114 PT Petrokimia Gresik Manufacturing 99.99% 115 PT Pupuk Kujang Manufacturing 99.99% 116 PT Pupuk Kalimantan Timur Manufacturing 99.99% 117 PT Pupuk Iskandar Muda Manufacturing 99.99% 118 PT Rekayasa Industri Manufacturing 90.00% 119 PT Mega Eltra Manufacturing 98.73% 120 PT Pupuk Indonesia Logistik Manufacturing 97.00% 121 PT Pupuk Indonesia Energi Manufacturing 91.00% 122 PT United Tractor Semen Gresik (UTSG) Manufacturing 55.00%
11 PT SEMEN INDONESIA
123 PT SGG Energi Prima Manufacturing 97.00% 124 PT Semen Tonasa Manufacturing 99.90% 125 Thang Long Cement Company Manufacturing 70.00% 126 PT Semen Padang Manufacturing 99.90% 127 PT Kawasan Industri Gresik Manufacturing 65.00% 128 PT Industri Kemasan Semen Gresik Manufacturing 60.00% 129 PT SGG Prima Beton Manufacturing 99.90% 130 PT Krakatau Semen Indonesia Manufacturing 50.00% 131 PT Semen Gresik Manufacturing 99.20%
12 PT DIRGANTARA INDONESIA
132 IPTN North America Inc. Manufacturing 99.99%
133 PT Nusantara Turbin Propulsi Manufacturing 100.00%
13 PT PAL INDONESIA 134 PT PAL Indonesia Marine Service Manufacturing 99.80%
14 PT PINDAD 135 PT Cakra Mandiri Pratama Indonesia Manufacturing 99.97%
15 PT KRAKATAU STEEL
136 PT Krakatau Wajatama Manufacturing 100.00% 137 PT krakatau Daya Listrik Manufacturing 100.00% 138 PT KHI Pipe Industries Manufacturing 98.48% 139 PT Krakatau Industrial Estate Cilegon Manufacturing 100.00% 140 PT Krakatau Engineering Manufacturing 100.00% 141 PT Krakatau Bandar Samudera Manufacturing 100.00% 142 PT Krakatau Tirta Industri Manufacturing 100.00% 143 PT Krakatau Medika Manufacturing 97.55% 144 PT Krakatau Information Technology Manufacturing 100.00% 145 PT Meratus Jaya Iron & Steel Manufacturing 66.00% 146 PT Krakatau Natural Resources Manufacturing 100.00%
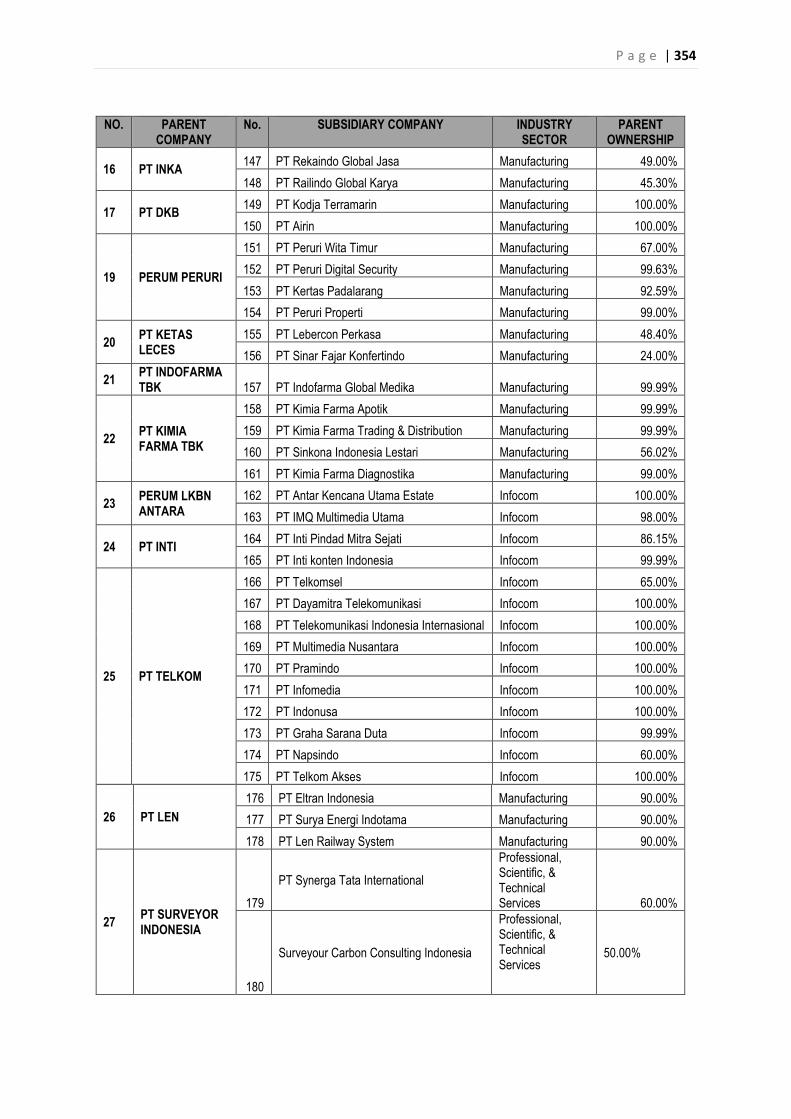
P a g e | 354
NO. PARENT COMPANY
No. SUBSIDIARY COMPANY INDUSTRY SECTOR
PARENT OWNERSHIP
16 PT INKA 147 PT Rekaindo Global Jasa Manufacturing 49.00% 148 PT Railindo Global Karya Manufacturing 45.30%
17 PT DKB 149 PT Kodja Terramarin Manufacturing 100.00% 150 PT Airin Manufacturing 100.00%
19 PERUM PERURI
151 PT Peruri Wita Timur Manufacturing 67.00% 152 PT Peruri Digital Security Manufacturing 99.63% 153 PT Kertas Padalarang Manufacturing 92.59% 154 PT Peruri Properti Manufacturing 99.00%
20 PT KETAS LECES
155 PT Lebercon Perkasa Manufacturing 48.40% 156 PT Sinar Fajar Konfertindo Manufacturing 24.00%
21 PT INDOFARMA TBK 157 PT Indofarma Global Medika Manufacturing 99.99%
22 PT KIMIA FARMA TBK
158 PT Kimia Farma Apotik Manufacturing 99.99% 159 PT Kimia Farma Trading & Distribution Manufacturing 99.99% 160 PT Sinkona Indonesia Lestari Manufacturing 56.02% 161 PT Kimia Farma Diagnostika Manufacturing 99.00%
23 PERUM LKBN ANTARA
162 PT Antar Kencana Utama Estate Infocom 100.00% 163 PT IMQ Multimedia Utama Infocom 98.00%
24 PT INTI 164 PT Inti Pindad Mitra Sejati Infocom 86.15% 165 PT Inti konten Indonesia Infocom 99.99%
25 PT TELKOM
166 PT Telkomsel Infocom 65.00% 167 PT Dayamitra Telekomunikasi Infocom 100.00% 168 PT Telekomunikasi Indonesia Internasional Infocom 100.00% 169 PT Multimedia Nusantara Infocom 100.00% 170 PT Pramindo Infocom 100.00% 171 PT Infomedia Infocom 100.00% 172 PT Indonusa Infocom 100.00% 173 PT Graha Sarana Duta Infocom 99.99% 174 PT Napsindo Infocom 60.00% 175 PT Telkom Akses Infocom 100.00%
26 PT LEN 176 PT Eltran Indonesia Manufacturing 90.00% 177 PT Surya Energi Indotama Manufacturing 90.00% 178 PT Len Railway System Manufacturing 90.00%
27 PT SURVEYOR INDONESIA
179 PT Synerga Tata International
Professional, Scientific, & Technical Services 60.00%
180
Surveyour Carbon Consulting Indonesia
Professional, Scientific, & Technical Services
50.00%
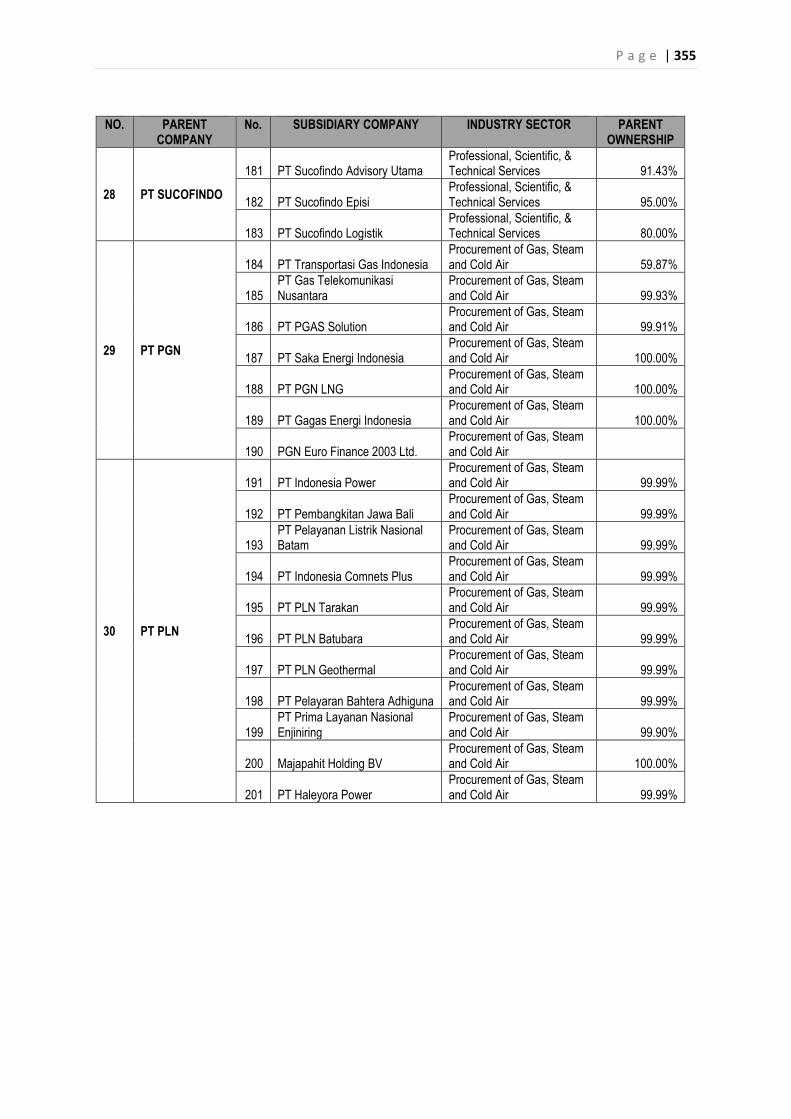
P a g e | 355
NO. PARENT COMPANY
No. SUBSIDIARY COMPANY INDUSTRY SECTOR PARENT OWNERSHIP
28 PT SUCOFINDO
181 PT Sucofindo Advisory Utama Professional, Scientific, & Technical Services 91.43%
182 PT Sucofindo Episi Professional, Scientific, & Technical Services 95.00%
183 PT Sucofindo Logistik Professional, Scientific, & Technical Services 80.00%
29 PT PGN
184 PT Transportasi Gas Indonesia Procurement of Gas, Steam and Cold Air 59.87%
185 PT Gas Telekomunikasi Nusantara
Procurement of Gas, Steam and Cold Air 99.93%
186 PT PGAS Solution Procurement of Gas, Steam and Cold Air 99.91%
187 PT Saka Energi Indonesia Procurement of Gas, Steam and Cold Air 100.00%
188 PT PGN LNG Procurement of Gas, Steam and Cold Air 100.00%
189 PT Gagas Energi Indonesia Procurement of Gas, Steam and Cold Air 100.00%
190 PGN Euro Finance 2003 Ltd. Procurement of Gas, Steam and Cold Air
30 PT PLN
191 PT Indonesia Power Procurement of Gas, Steam and Cold Air 99.99%
192 PT Pembangkitan Jawa Bali Procurement of Gas, Steam and Cold Air 99.99%
193 PT Pelayanan Listrik Nasional Batam
Procurement of Gas, Steam and Cold Air 99.99%
194 PT Indonesia Comnets Plus Procurement of Gas, Steam and Cold Air 99.99%
195 PT PLN Tarakan Procurement of Gas, Steam and Cold Air 99.99%
196 PT PLN Batubara Procurement of Gas, Steam and Cold Air 99.99%
197 PT PLN Geothermal Procurement of Gas, Steam and Cold Air 99.99%
198 PT Pelayaran Bahtera Adhiguna Procurement of Gas, Steam and Cold Air 99.99%
199 PT Prima Layanan Nasional Enjiniring
Procurement of Gas, Steam and Cold Air 99.90%
200 Majapahit Holding BV Procurement of Gas, Steam and Cold Air 100.00%
201 PT Haleyora Power Procurement of Gas, Steam and Cold Air 99.99%
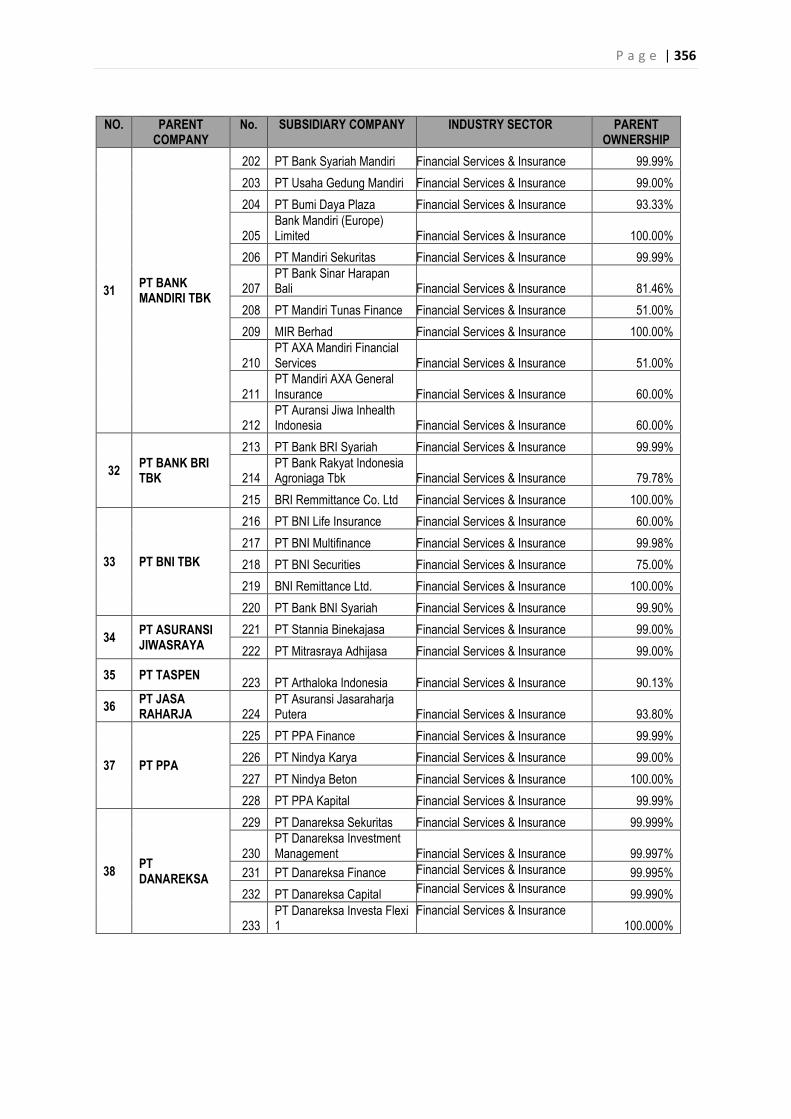
P a g e | 356
NO. PARENT COMPANY
No. SUBSIDIARY COMPANY INDUSTRY SECTOR PARENT OWNERSHIP
31 PT BANK MANDIRI TBK
202 PT Bank Syariah Mandiri Financial Services & Insurance 99.99% 203 PT Usaha Gedung Mandiri Financial Services & Insurance 99.00% 204 PT Bumi Daya Plaza Financial Services & Insurance 93.33%
205 Bank Mandiri (Europe) Limited Financial Services & Insurance 100.00%
206 PT Mandiri Sekuritas Financial Services & Insurance 99.99%
207 PT Bank Sinar Harapan Bali Financial Services & Insurance 81.46%
208 PT Mandiri Tunas Finance Financial Services & Insurance 51.00% 209 MIR Berhad Financial Services & Insurance 100.00%
210 PT AXA Mandiri Financial Services Financial Services & Insurance 51.00%
211 PT Mandiri AXA General Insurance Financial Services & Insurance 60.00%
212 PT Auransi Jiwa Inhealth Indonesia Financial Services & Insurance 60.00%
32 PT BANK BRI TBK
213 PT Bank BRI Syariah Financial Services & Insurance 99.99%
214 PT Bank Rakyat Indonesia Agroniaga Tbk Financial Services & Insurance 79.78%
215 BRI Remmittance Co. Ltd Financial Services & Insurance 100.00%
33 PT BNI TBK
216 PT BNI Life Insurance Financial Services & Insurance 60.00% 217 PT BNI Multifinance Financial Services & Insurance 99.98% 218 PT BNI Securities Financial Services & Insurance 75.00% 219 BNI Remittance Ltd. Financial Services & Insurance 100.00% 220 PT Bank BNI Syariah Financial Services & Insurance 99.90%
34 PT ASURANSI JIWASRAYA
221 PT Stannia Binekajasa Financial Services & Insurance 99.00% 222 PT Mitrasraya Adhijasa Financial Services & Insurance 99.00%
35 PT TASPEN 223 PT Arthaloka Indonesia Financial Services & Insurance 90.13%
36 PT JASA RAHARJA 224
PT Asuransi Jasaraharja Putera Financial Services & Insurance 93.80%
37 PT PPA
225 PT PPA Finance Financial Services & Insurance 99.99% 226 PT Nindya Karya Financial Services & Insurance 99.00% 227 PT Nindya Beton Financial Services & Insurance 100.00% 228 PT PPA Kapital Financial Services & Insurance 99.99%
38 PT DANAREKSA
229 PT Danareksa Sekuritas Financial Services & Insurance 99.999%
230 PT Danareksa Investment Management Financial Services & Insurance 99.997%
231 PT Danareksa Finance Financial Services & Insurance 99.995% 232 PT Danareksa Capital Financial Services & Insurance 99.990%
233 PT Danareksa Investa Flexi 1
Financial Services & Insurance 100.000%
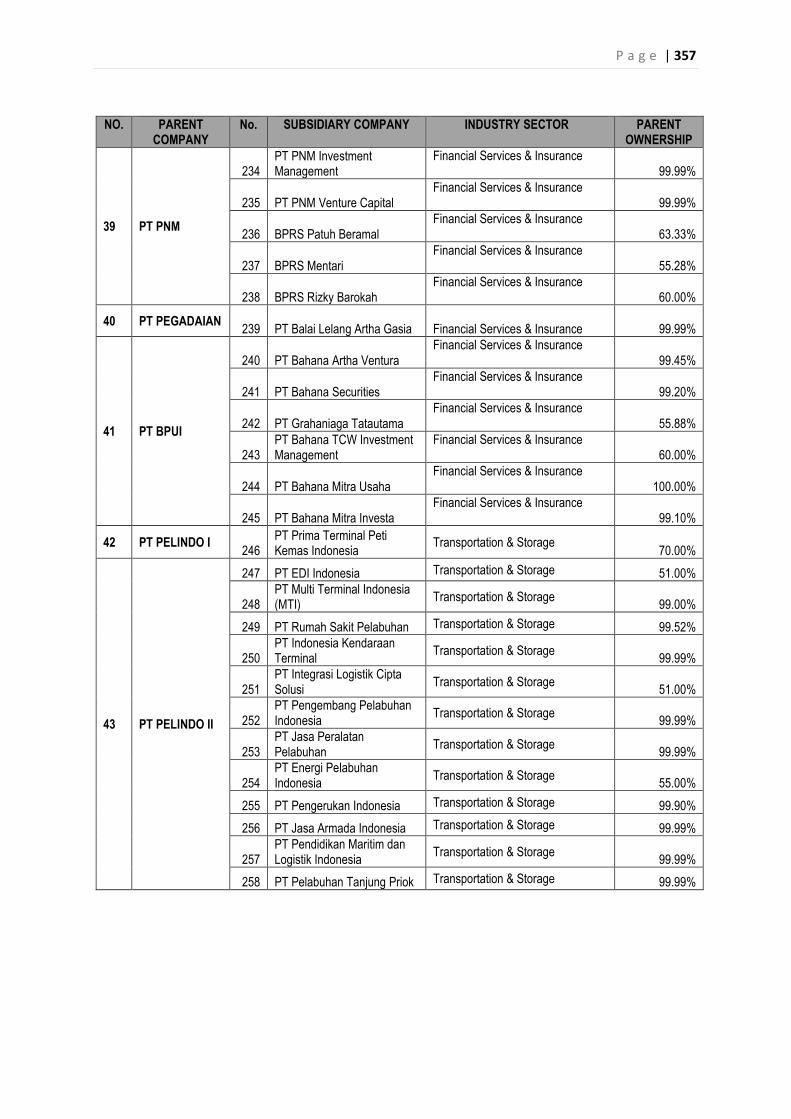
P a g e | 357
NO. PARENT COMPANY
No. SUBSIDIARY COMPANY INDUSTRY SECTOR PARENT OWNERSHIP
39 PT PNM
234 PT PNM Investment Management
Financial Services & Insurance 99.99%
235 PT PNM Venture Capital Financial Services & Insurance
99.99%
236 BPRS Patuh Beramal Financial Services & Insurance
63.33%
237 BPRS Mentari Financial Services & Insurance
55.28%
238 BPRS Rizky Barokah Financial Services & Insurance
60.00%
40 PT PEGADAIAN 239 PT Balai Lelang Artha Gasia Financial Services & Insurance 99.99%
41 PT BPUI
240 PT Bahana Artha Ventura Financial Services & Insurance
99.45%
241 PT Bahana Securities Financial Services & Insurance
99.20%
242 PT Grahaniaga Tatautama Financial Services & Insurance
55.88%
243 PT Bahana TCW Investment Management
Financial Services & Insurance 60.00%
244 PT Bahana Mitra Usaha Financial Services & Insurance
100.00%
245 PT Bahana Mitra Investa Financial Services & Insurance
99.10%
42 PT PELINDO I 246 PT Prima Terminal Peti Kemas Indonesia Transportation & Storage 70.00%
43 PT PELINDO II
247 PT EDI Indonesia Transportation & Storage 51.00%
248 PT Multi Terminal Indonesia (MTI) Transportation & Storage 99.00%
249 PT Rumah Sakit Pelabuhan Transportation & Storage 99.52%
250 PT Indonesia Kendaraan Terminal Transportation & Storage 99.99%
251 PT Integrasi Logistik Cipta Solusi Transportation & Storage 51.00%
252 PT Pengembang Pelabuhan Indonesia Transportation & Storage 99.99%
253 PT Jasa Peralatan Pelabuhan Transportation & Storage 99.99%
254 PT Energi Pelabuhan Indonesia Transportation & Storage 55.00%
255 PT Pengerukan Indonesia Transportation & Storage 99.90% 256 PT Jasa Armada Indonesia Transportation & Storage 99.99%
257 PT Pendidikan Maritim dan Logistik Indonesia Transportation & Storage 99.99%
258 PT Pelabuhan Tanjung Priok Transportation & Storage 99.99%
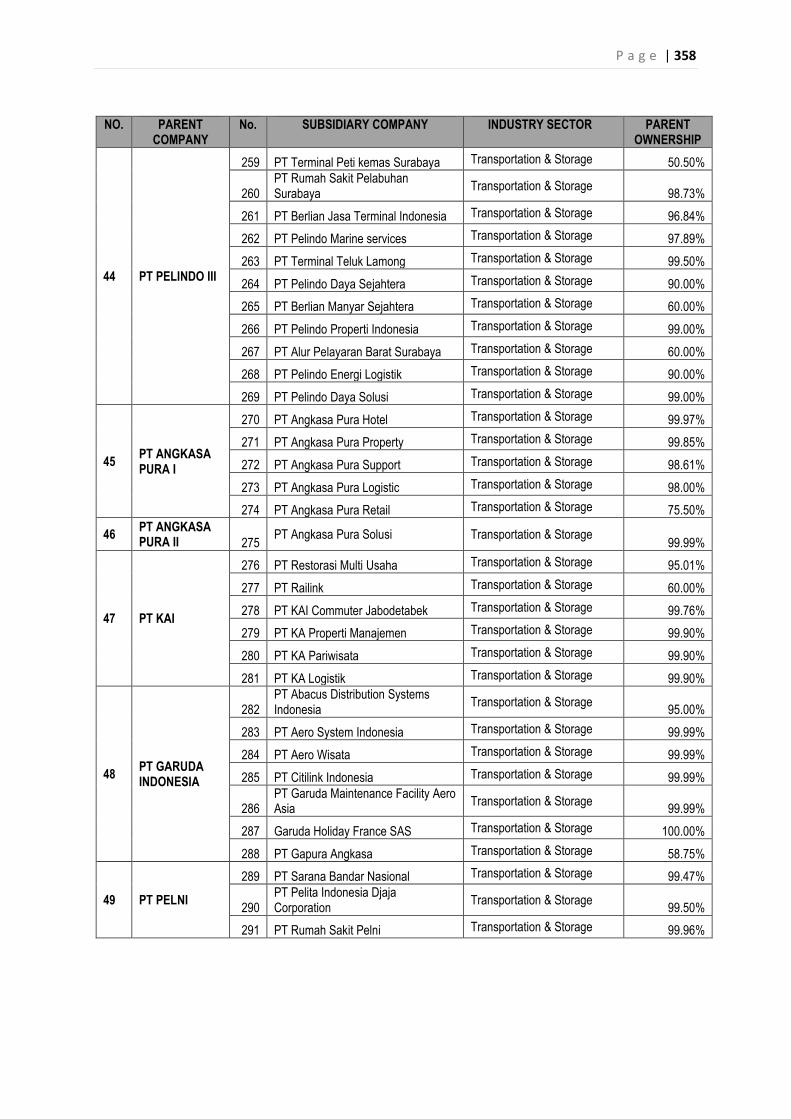
P a g e | 358
NO. PARENT COMPANY
No. SUBSIDIARY COMPANY INDUSTRY SECTOR PARENT OWNERSHIP
44 PT PELINDO III
259 PT Terminal Peti kemas Surabaya Transportation & Storage 50.50%
260 PT Rumah Sakit Pelabuhan Surabaya Transportation & Storage 98.73%
261 PT Berlian Jasa Terminal Indonesia Transportation & Storage 96.84% 262 PT Pelindo Marine services Transportation & Storage 97.89% 263 PT Terminal Teluk Lamong Transportation & Storage 99.50% 264 PT Pelindo Daya Sejahtera Transportation & Storage 90.00% 265 PT Berlian Manyar Sejahtera Transportation & Storage 60.00% 266 PT Pelindo Properti Indonesia Transportation & Storage 99.00% 267 PT Alur Pelayaran Barat Surabaya Transportation & Storage 60.00% 268 PT Pelindo Energi Logistik Transportation & Storage 90.00% 269 PT Pelindo Daya Solusi Transportation & Storage 99.00%
45 PT ANGKASA PURA I
270 PT Angkasa Pura Hotel Transportation & Storage 99.97% 271 PT Angkasa Pura Property Transportation & Storage 99.85% 272 PT Angkasa Pura Support Transportation & Storage 98.61% 273 PT Angkasa Pura Logistic Transportation & Storage 98.00% 274 PT Angkasa Pura Retail Transportation & Storage 75.50%
46 PT ANGKASA PURA II 275 PT Angkasa Pura Solusi Transportation & Storage 99.99%
47 PT KAI
276 PT Restorasi Multi Usaha Transportation & Storage 95.01% 277 PT Railink Transportation & Storage 60.00% 278 PT KAI Commuter Jabodetabek Transportation & Storage 99.76% 279 PT KA Properti Manajemen Transportation & Storage 99.90% 280 PT KA Pariwisata Transportation & Storage 99.90% 281 PT KA Logistik Transportation & Storage 99.90%
48 PT GARUDA INDONESIA
282 PT Abacus Distribution Systems Indonesia Transportation & Storage 95.00%
283 PT Aero System Indonesia Transportation & Storage 99.99% 284 PT Aero Wisata Transportation & Storage 99.99% 285 PT Citilink Indonesia Transportation & Storage 99.99%
286 PT Garuda Maintenance Facility Aero Asia Transportation & Storage 99.99%
287 Garuda Holiday France SAS Transportation & Storage 100.00% 288 PT Gapura Angkasa Transportation & Storage 58.75%
49 PT PELNI
289 PT Sarana Bandar Nasional Transportation & Storage 99.47%
290 PT Pelita Indonesia Djaja Corporation Transportation & Storage 99.50%
291 PT Rumah Sakit Pelni Transportation & Storage 99.96%
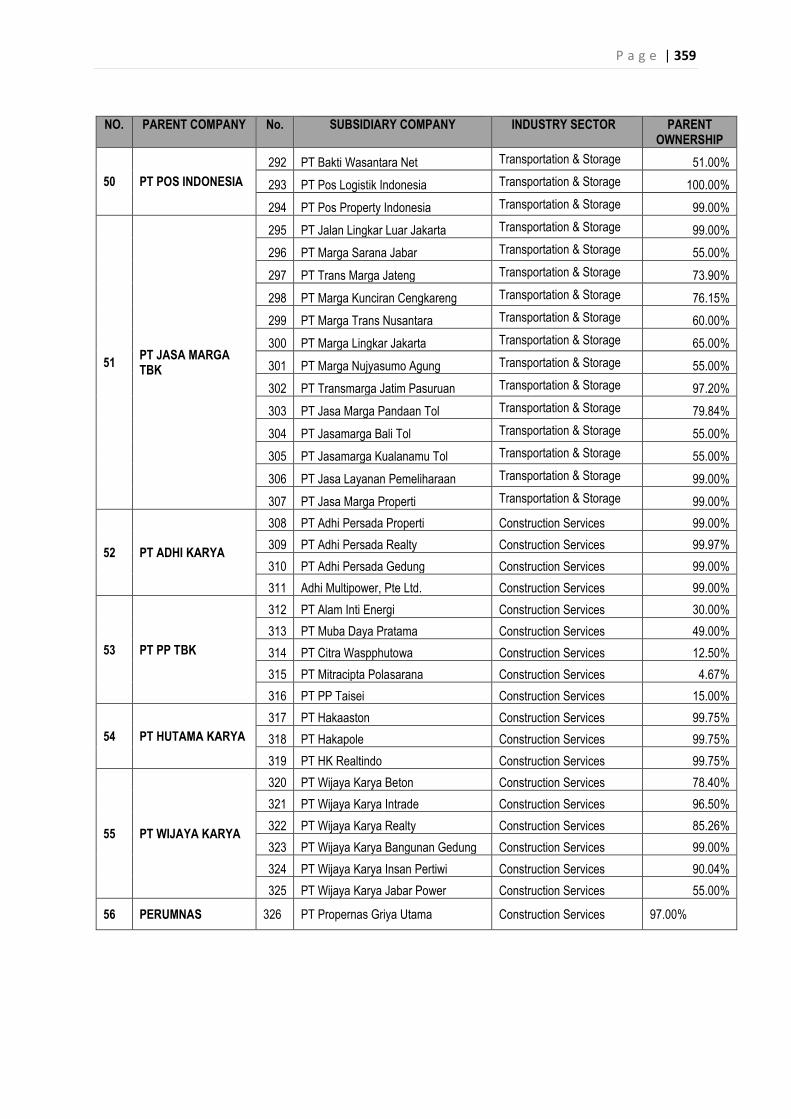
P a g e | 359
NO. PARENT COMPANY No. SUBSIDIARY COMPANY INDUSTRY SECTOR PARENT OWNERSHIP
50 PT POS INDONESIA 292 PT Bakti Wasantara Net Transportation & Storage 51.00% 293 PT Pos Logistik Indonesia Transportation & Storage 100.00% 294 PT Pos Property Indonesia Transportation & Storage 99.00%
51 PT JASA MARGA TBK
295 PT Jalan Lingkar Luar Jakarta Transportation & Storage 99.00% 296 PT Marga Sarana Jabar Transportation & Storage 55.00% 297 PT Trans Marga Jateng Transportation & Storage 73.90% 298 PT Marga Kunciran Cengkareng Transportation & Storage 76.15% 299 PT Marga Trans Nusantara Transportation & Storage 60.00% 300 PT Marga Lingkar Jakarta Transportation & Storage 65.00% 301 PT Marga Nujyasumo Agung Transportation & Storage 55.00% 302 PT Transmarga Jatim Pasuruan Transportation & Storage 97.20% 303 PT Jasa Marga Pandaan Tol Transportation & Storage 79.84% 304 PT Jasamarga Bali Tol Transportation & Storage 55.00% 305 PT Jasamarga Kualanamu Tol Transportation & Storage 55.00% 306 PT Jasa Layanan Pemeliharaan Transportation & Storage 99.00% 307 PT Jasa Marga Properti Transportation & Storage 99.00%
52 PT ADHI KARYA
308 PT Adhi Persada Properti Construction Services 99.00% 309 PT Adhi Persada Realty Construction Services 99.97% 310 PT Adhi Persada Gedung Construction Services 99.00% 311 Adhi Multipower, Pte Ltd. Construction Services 99.00%
53 PT PP TBK
312 PT Alam Inti Energi Construction Services 30.00% 313 PT Muba Daya Pratama Construction Services 49.00% 314 PT Citra Waspphutowa Construction Services 12.50% 315 PT Mitracipta Polasarana Construction Services 4.67% 316 PT PP Taisei Construction Services 15.00%
54 PT HUTAMA KARYA 317 PT Hakaaston Construction Services 99.75% 318 PT Hakapole Construction Services 99.75% 319 PT HK Realtindo Construction Services 99.75%
55 PT WIJAYA KARYA
320 PT Wijaya Karya Beton Construction Services 78.40% 321 PT Wijaya Karya Intrade Construction Services 96.50% 322 PT Wijaya Karya Realty Construction Services 85.26% 323 PT Wijaya Karya Bangunan Gedung Construction Services 99.00% 324 PT Wijaya Karya Insan Pertiwi Construction Services 90.04% 325 PT Wijaya Karya Jabar Power Construction Services 55.00%
56 PERUMNAS 326 PT Propernas Griya Utama Construction Services 97.00%
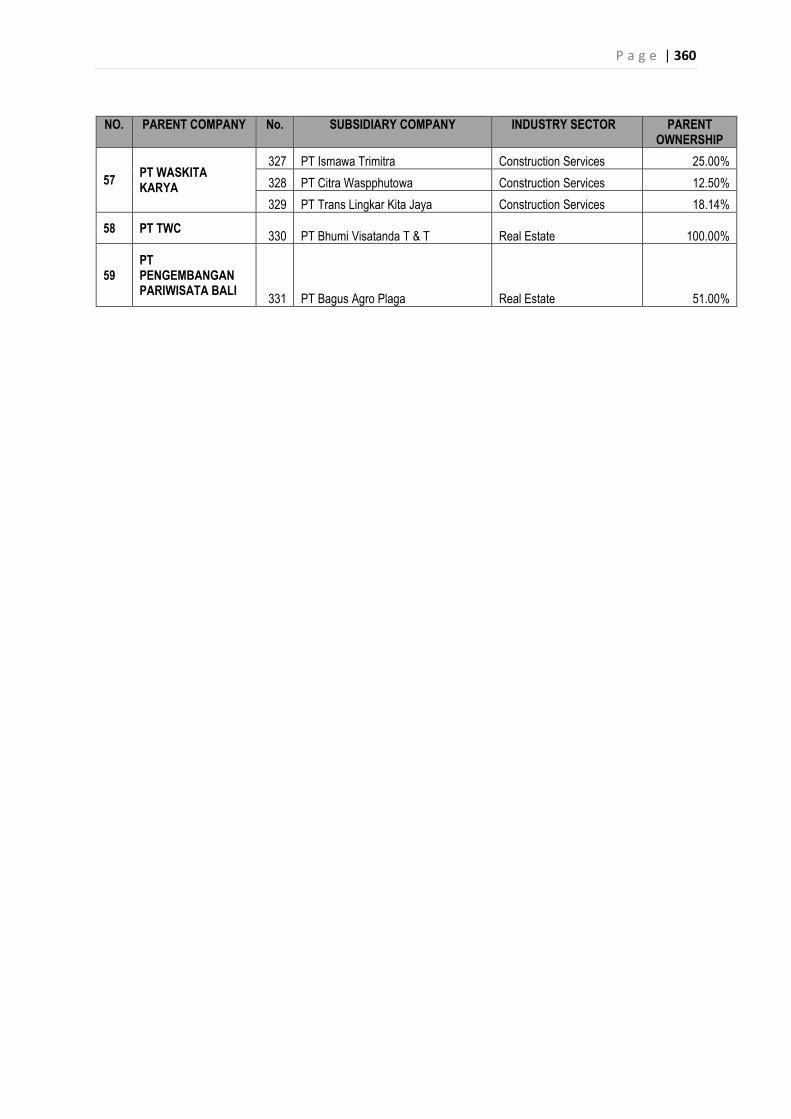
P a g e | 360
NO. PARENT COMPANY No. SUBSIDIARY COMPANY INDUSTRY SECTOR PARENT OWNERSHIP
57 PT WASKITA KARYA
327 PT Ismawa Trimitra Construction Services 25.00% 328 PT Citra Waspphutowa Construction Services 12.50% 329 PT Trans Lingkar Kita Jaya Construction Services 18.14%
58 PT TWC 330 PT Bhumi Visatanda T & T Real Estate 100.00%
59 PT PENGEMBANGAN PARIWISATA BALI 331 PT Bagus Agro Plaga Real Estate 51.00%
P a g e | 361
APPENDIX D: SURVEY QUESTIONAIRES
PARENT--SUBSIDIARY GOVERNANCE RELATIONSHIP SURVEY 2014 THE COLLEGE OF LAW AND JUSTICE
Prepared by: Agus Widodo PhD Candidate Student ID 3906938
Supervisor: Prof. Anona Armstrong Co Supervisor: Dr. James Mcconvill
Thank you for taking part in the survey. We are simply looking to understand the relationship between board member duality and agency cost in parent and subsidiary relationship. The output of this survey will be contributed to understanding of accountability model for parent-subsidiary governance and to improve a better corporate governance practice for the state-owned enterprises in Indonesia. No results will be reported at an demographic level, with respondent confidentiality assured. Disclaimer: By participating in this survey, you consent to the transfer of the information you submit to the researcher. The information collected is for research purposes only and will not be publicly associated with any demographic respondent. However, we may share the result of this survey with the public in anonymized or aggregated forms and in academic ways.
The Structure of Survey
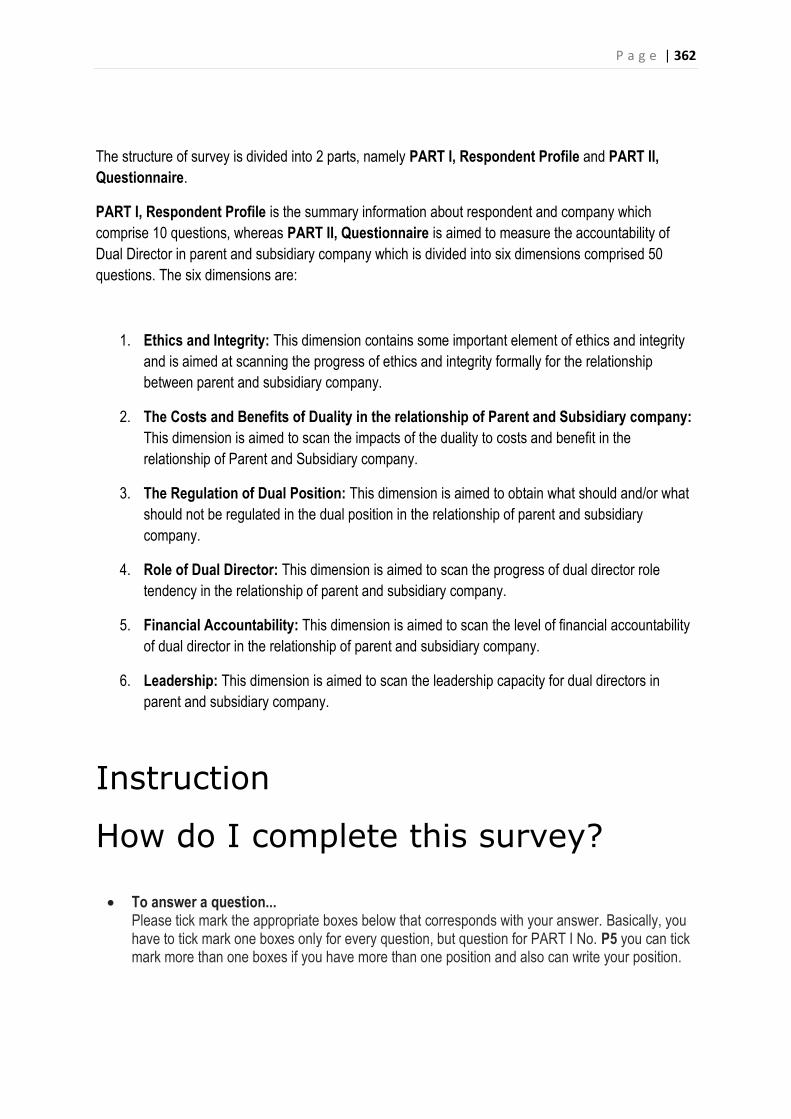
P a g e | 362
The structure of survey is divided into 2 parts, namely PART I, Respondent Profile and PART II, Questionnaire.
PART I, Respondent Profile is the summary information about respondent and company which comprise 10 questions, whereas PART II, Questionnaire is aimed to measure the accountability of Dual Director in parent and subsidiary company which is divided into six dimensions comprised 50 questions. The six dimensions are:
1. Ethics and Integrity: This dimension contains some important element of ethics and integrity and is aimed at scanning the progress of ethics and integrity formally for the relationship between parent and subsidiary company.
2. The Costs and Benefits of Duality in the relationship of Parent and Subsidiary company: This dimension is aimed to scan the impacts of the duality to costs and benefit in the relationship of Parent and Subsidiary company.
3. The Regulation of Dual Position: This dimension is aimed to obtain what should and/or what should not be regulated in the dual position in the relationship of parent and subsidiary company.
4. Role of Dual Director: This dimension is aimed to scan the progress of dual director role tendency in the relationship of parent and subsidiary company.
5. Financial Accountability: This dimension is aimed to scan the level of financial accountability of dual director in the relationship of parent and subsidiary company.
6. Leadership: This dimension is aimed to scan the leadership capacity for dual directors in parent and subsidiary company.
Instruction
How do I complete this survey? x To answer a question...
Please tick mark the appropriate boxes below that corresponds with your answer. Basically, you have to tick mark one boxes only for every question, but question for PART I No. P5 you can tick mark more than one boxes if you have more than one position and also can write your position.
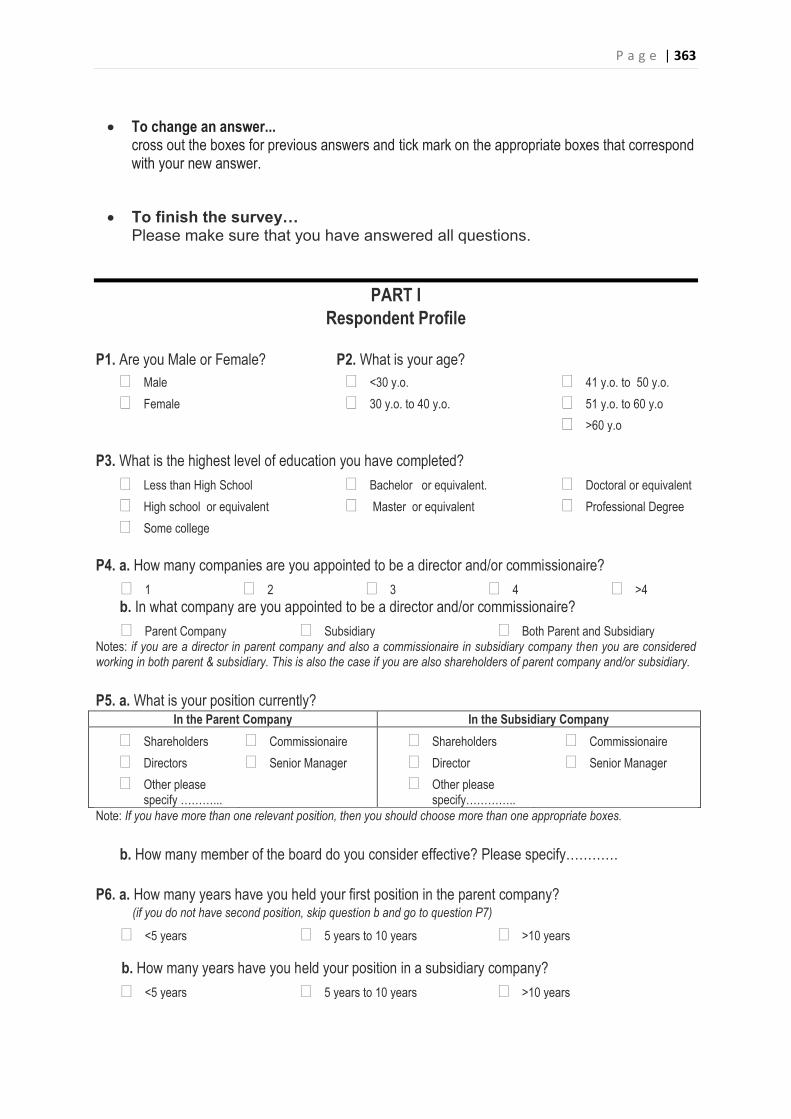
P a g e | 363
x To change an answer... cross out the boxes for previous answers and tick mark on the appropriate boxes that correspond with your new answer.
x To finish the survey… Please make sure that you have answered all questions.
PART I Respondent Profile
P1. Are you Male or Female?
� Male � Female
P2. What is your age? � <30 y.o. � 30 y.o. to 40 y.o.
� 41 y.o. to 50 y.o. � 51 y.o. to 60 y.o � >60 y.o
P3. What is the highest level of education you have completed?
� Less than High School � High school or equivalent � Some college
� Bachelor or equivalent. � Master or equivalent
� Doctoral or equivalent � Professional Degree
P4. a. How many companies are you appointed to be a director and/or commissionaire?
� 1 � 2 � 3 � 4 � >4 b. In what company are you appointed to be a director and/or commissionaire? � Parent Company � Subsidiary � Both Parent and Subsidiary
Notes: if you are a director in parent company and also a commissionaire in subsidiary company then you are considered working in both parent & subsidiary. This is also the case if you are also shareholders of parent company and/or subsidiary. P5. a. What is your position currently?
In the Parent Company In the Subsidiary Company � Shareholders � Directors � Other please
specify ………...
� Commissionaire � Senior Manager
� Shareholders � Director � Other please
specify…………..
� Commissionaire � Senior Manager
Note: If you have more than one relevant position, then you should choose more than one appropriate boxes. b. How many member of the board do you consider effective? Please specify…………
P6. a. How many years have you held your first position in the parent company? (if you do not have second position, skip question b and go to question P7)
� <5 years
� 5 years to 10 years
� >10 years
b. How many years have you held your position in a subsidiary company? � <5 years � 5 years to 10 years � >10 years
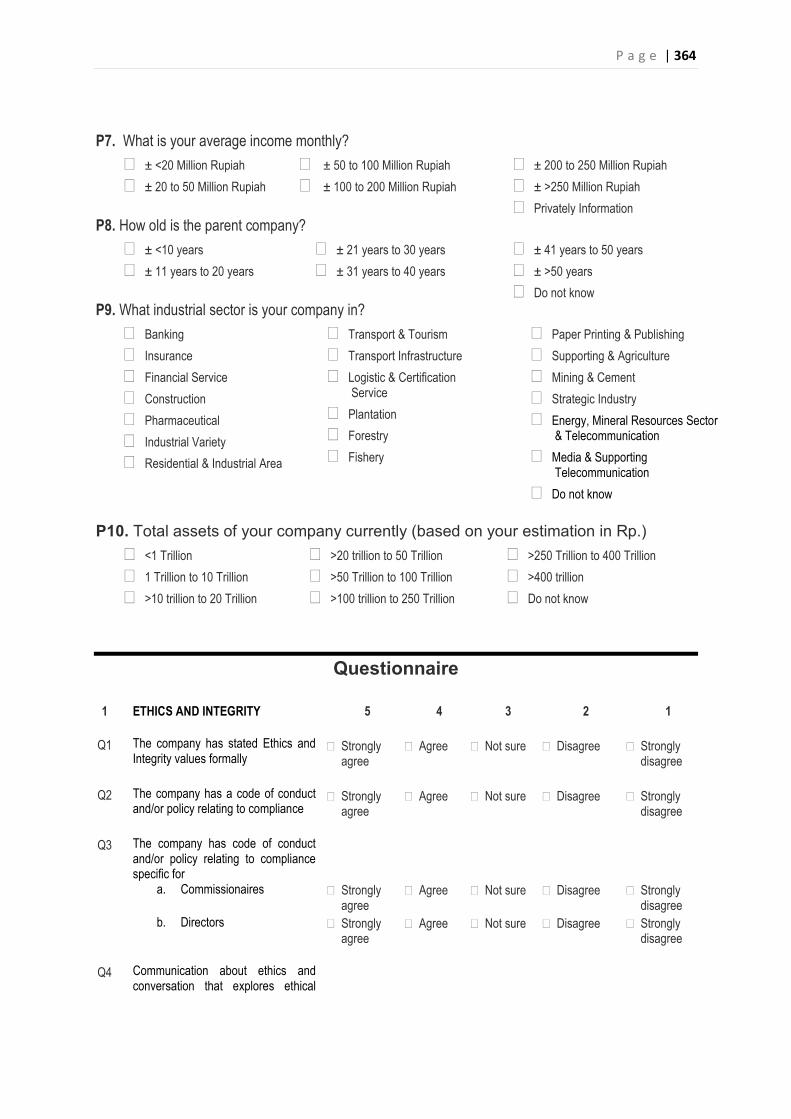
P a g e | 364
P7. What is your average income monthly?
� ± <20 Million Rupiah � ± 20 to 50 Million Rupiah
� ± 50 to 100 Million Rupiah � ± 100 to 200 Million Rupiah
� ± 200 to 250 Million Rupiah � ± >250 Million Rupiah � Privately Information
P8. How old is the parent company? � ± <10 years � ± 11 years to 20 years
� ± 21 years to 30 years � ± 31 years to 40 years
� ± 41 years to 50 years � ± >50 years � Do not know
P9. What industrial sector is your company in? � Banking � Insurance � Financial Service � Construction � Pharmaceutical � Industrial Variety � Residential & Industrial Area
� Transport & Tourism � Transport Infrastructure � Logistic & Certification
Service � Plantation � Forestry � Fishery
� Paper Printing & Publishing � Supporting & Agriculture � Mining & Cement � Strategic Industry � Energy, Mineral Resources Sector
& Telecommunication � Media & Supporting
Telecommunication � Do not know
P10. Total assets of your company currently (based on your estimation in Rp.)
� <1 Trillion � 1 Trillion to 10 Trillion � >10 trillion to 20 Trillion
� >20 trillion to 50 Trillion � >50 Trillion to 100 Trillion � >100 trillion to 250 Trillion
� >250 Trillion to 400 Trillion � >400 trillion � Do not know
Questionnaire 1 ETHICS AND INTEGRITY 5 4 3 2 1
Q1 The company has stated Ethics and Integrity values formally
� Strongly
agree
� Agree
� Not sure
� Disagree
� Strongly
disagree
Q2 The company has a code of conduct and/or policy relating to compliance
� Strongly
agree
� Agree
� Not sure
� Disagree
� Strongly
disagree
Q3 The company has code of conduct and/or policy relating to compliance specific for
a. Commissionaires � Strongly agree
� Agree � Not sure � Disagree � Strongly disagree
b. Directors � Strongly agree
� Agree � Not sure � Disagree � Strongly disagree
Q4
Communication about ethics and conversation that explores ethical
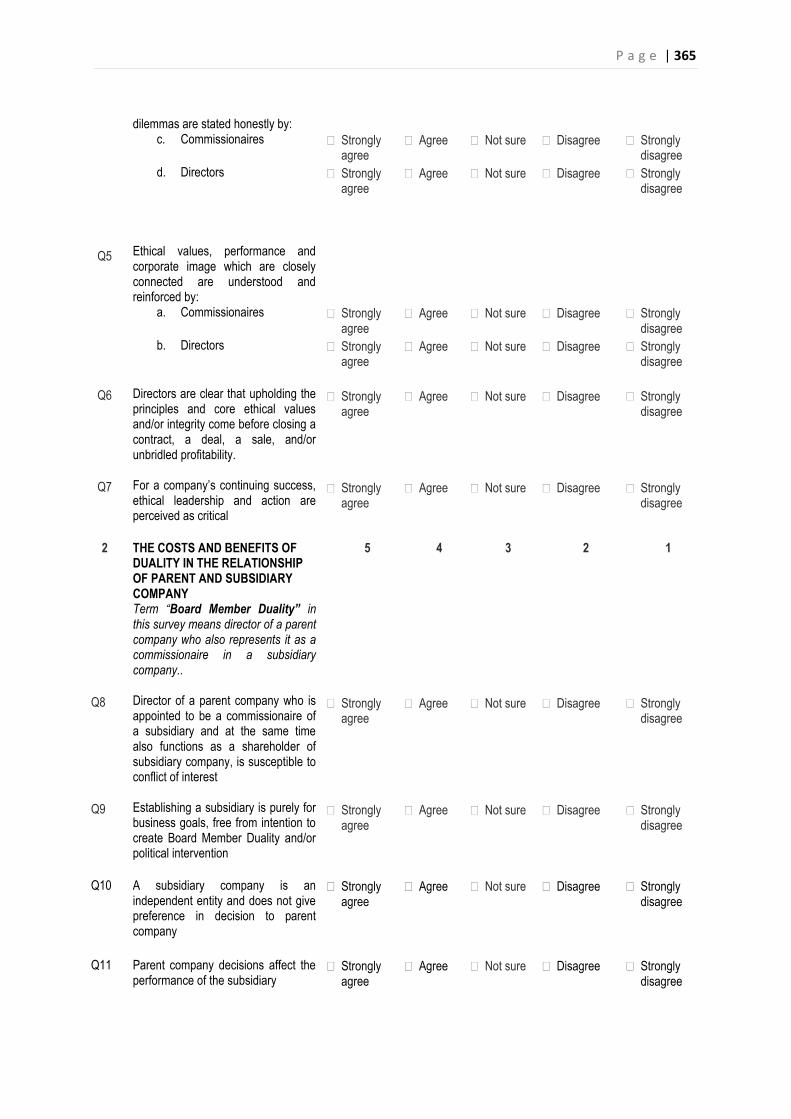
P a g e | 365
dilemmas are stated honestly by: c. Commissionaires � Strongly
agree � Agree � Not sure � Disagree � Strongly
disagree d. Directors � Strongly
agree � Agree � Not sure � Disagree � Strongly
disagree
Q5
Ethical values, performance and corporate image which are closely connected are understood and reinforced by:
a. Commissionaires � Strongly agree
� Agree � Not sure � Disagree � Strongly disagree
b. Directors � Strongly agree
� Agree � Not sure � Disagree � Strongly disagree
Q6
Directors are clear that upholding the principles and core ethical values and/or integrity come before closing a contract, a deal, a sale, and/or unbridled profitability.
� Strongly
agree
� Agree
� Not sure
� Disagree
� Strongly
disagree
Q7
For a company’s continuing success, ethical leadership and action are perceived as critical
� Strongly
agree
� Agree
� Not sure
� Disagree
� Strongly
disagree
2 THE COSTS AND BENEFITS OF
DUALITY IN THE RELATIONSHIP OF PARENT AND SUBSIDIARY COMPANY
5 4 3 2 1
Term “Board Member Duality” in this survey means director of a parent company who also represents it as a commissionaire in a subsidiary company..
Q8
Director of a parent company who is appointed to be a commissionaire of a subsidiary and at the same time also functions as a shareholder of subsidiary company, is susceptible to conflict of interest
� Strongly
agree
� Agree
� Not sure
� Disagree
� Strongly
disagree
Q9
Establishing a subsidiary is purely for business goals, free from intention to create Board Member Duality and/or political intervention
� Strongly
agree
� Agree
� Not sure
� Disagree
� Strongly
disagree
Q10
A subsidiary company is an independent entity and does not give preference in decision to parent company
� Strongly
agree
� Agree
� Not sure
� Disagree
� Strongly
disagree
Q11
Parent company decisions affect the performance of the subsidiary
� Strongly
agree
� Agree
� Not sure
� Disagree
� Strongly
disagree
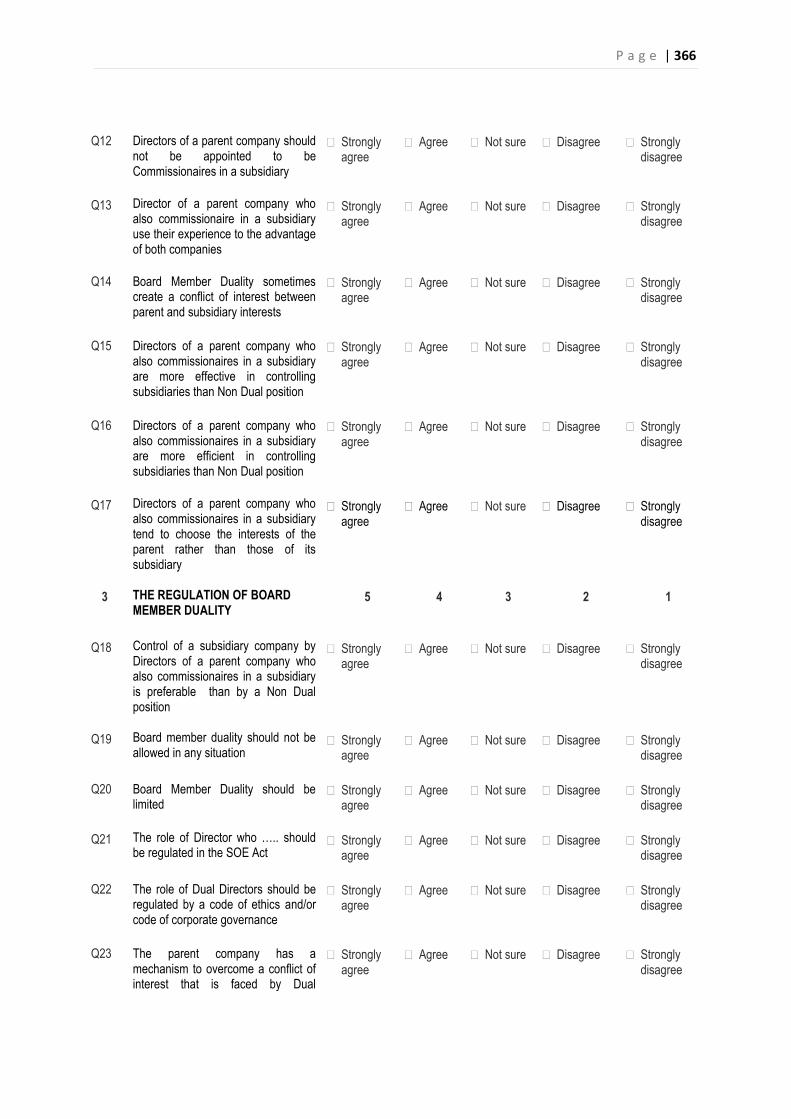
P a g e | 366
Q12
Directors of a parent company should not be appointed to be Commissionaires in a subsidiary
� Strongly
agree
� Agree
� Not sure
� Disagree
� Strongly
disagree
Q13
Director of a parent company who also commissionaire in a subsidiary use their experience to the advantage of both companies
� Strongly
agree
� Agree
� Not sure
� Disagree
� Strongly
disagree
Q14
Board Member Duality sometimes create a conflict of interest between parent and subsidiary interests
� Strongly
agree
� Agree
� Not sure
� Disagree
� Strongly
disagree
Q15
Directors of a parent company who also commissionaires in a subsidiary are more effective in controlling subsidiaries than Non Dual position
� Strongly
agree
� Agree
� Not sure
� Disagree
� Strongly
disagree
Q16
Directors of a parent company who also commissionaires in a subsidiary are more efficient in controlling subsidiaries than Non Dual position
� Strongly
agree
� Agree
� Not sure
� Disagree
� Strongly
disagree
Q17
Directors of a parent company who also commissionaires in a subsidiary tend to choose the interests of the parent rather than those of its subsidiary
� Strongly
agree
� Agree
� Not sure
� Disagree
� Strongly
disagree
3
THE REGULATION OF BOARD MEMBER DUALITY
5
4
3
2
1
Q18
Control of a subsidiary company by Directors of a parent company who also commissionaires in a subsidiary is preferable than by a Non Dual position
� Strongly
agree
� Agree
� Not sure
� Disagree
� Strongly
disagree
Q19
Board member duality should not be allowed in any situation
� Strongly
agree
� Agree
� Not sure
� Disagree
� Strongly
disagree Q20 Board Member Duality should be
limited � Strongly
agree � Agree � Not sure � Disagree � Strongly
disagree Q21
The role of Director who ….. should be regulated in the SOE Act
� Strongly
agree
� Agree
� Not sure
� Disagree
� Strongly
disagree Q22
The role of Dual Directors should be regulated by a code of ethics and/or code of corporate governance
� Strongly
agree
� Agree
� Not sure
� Disagree
� Strongly
disagree
Q23
The parent company has a mechanism to overcome a conflict of interest that is faced by Dual
� Strongly
agree
� Agree
� Not sure
� Disagree
� Strongly
disagree
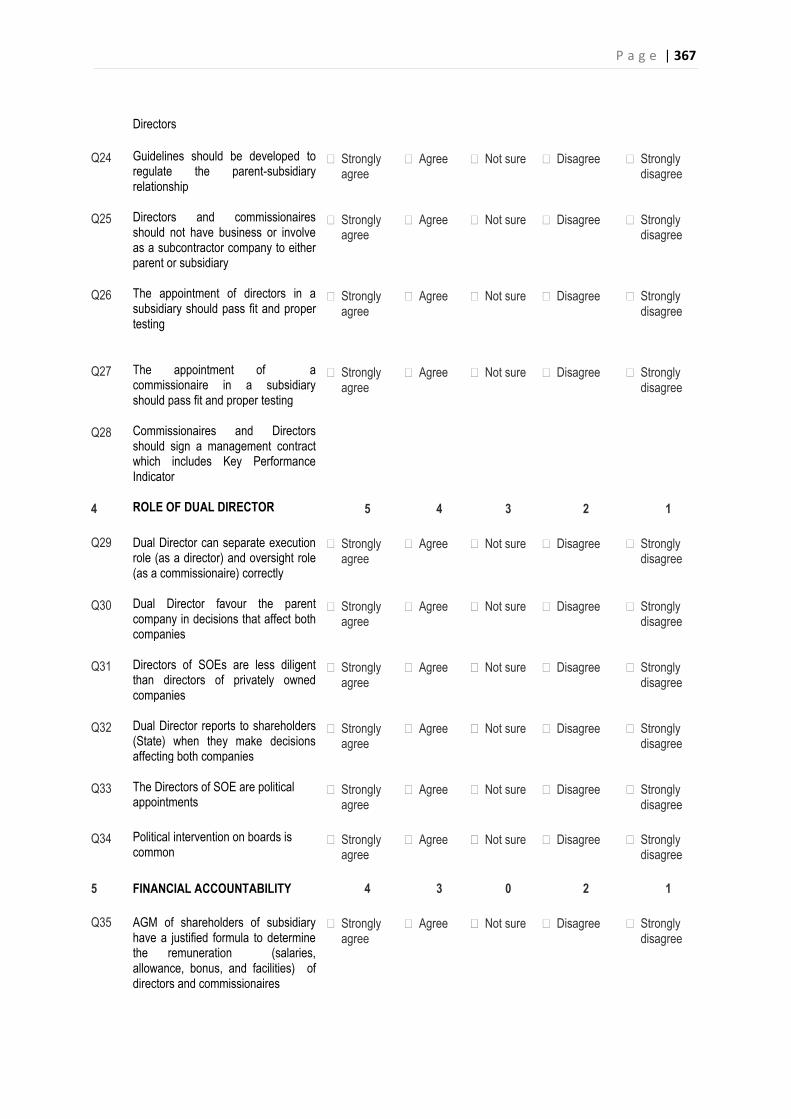
P a g e | 367
Directors Q24
Guidelines should be developed to regulate the parent-subsidiary relationship
� Strongly
agree
� Agree
� Not sure
� Disagree
� Strongly
disagree
Q25
Directors and commissionaires should not have business or involve as a subcontractor company to either parent or subsidiary
� Strongly
agree
� Agree
� Not sure
� Disagree
� Strongly
disagree
Q26
The appointment of directors in a subsidiary should pass fit and proper testing
� Strongly
agree
� Agree
� Not sure
� Disagree
� Strongly
disagree
Q27
The appointment of a commissionaire in a subsidiary should pass fit and proper testing
� Strongly
agree
� Agree
� Not sure
� Disagree
� Strongly
disagree
Q28
Commissionaires and Directors should sign a management contract which includes Key Performance Indicator
4
ROLE OF DUAL DIRECTOR
5
4
3
2
1
Q29 Dual Director can separate execution
role (as a director) and oversight role (as a commissionaire) correctly
� Strongly agree
� Agree � Not sure � Disagree � Strongly disagree
Q30
Dual Director favour the parent company in decisions that affect both companies
� Strongly
agree
� Agree
� Not sure
� Disagree
� Strongly
disagree
Q31
Directors of SOEs are less diligent than directors of privately owned companies
� Strongly
agree
� Agree
� Not sure
� Disagree
� Strongly
disagree
Q32
Dual Director reports to shareholders (State) when they make decisions affecting both companies
� Strongly
agree
� Agree
� Not sure
� Disagree
� Strongly
disagree
Q33
The Directors of SOE are political appointments
� Strongly
agree
� Agree
� Not sure
� Disagree
� Strongly
disagree Q34
Political intervention on boards is common
� Strongly
agree
� Agree
� Not sure
� Disagree
� Strongly
disagree 5 FINANCIAL ACCOUNTABILITY 4 3 0 2 1 Q35 AGM of shareholders of subsidiary
have a justified formula to determine the remuneration (salaries, allowance, bonus, and facilities) of directors and commissionaires
� Strongly agree
� Agree � Not sure � Disagree � Strongly disagree
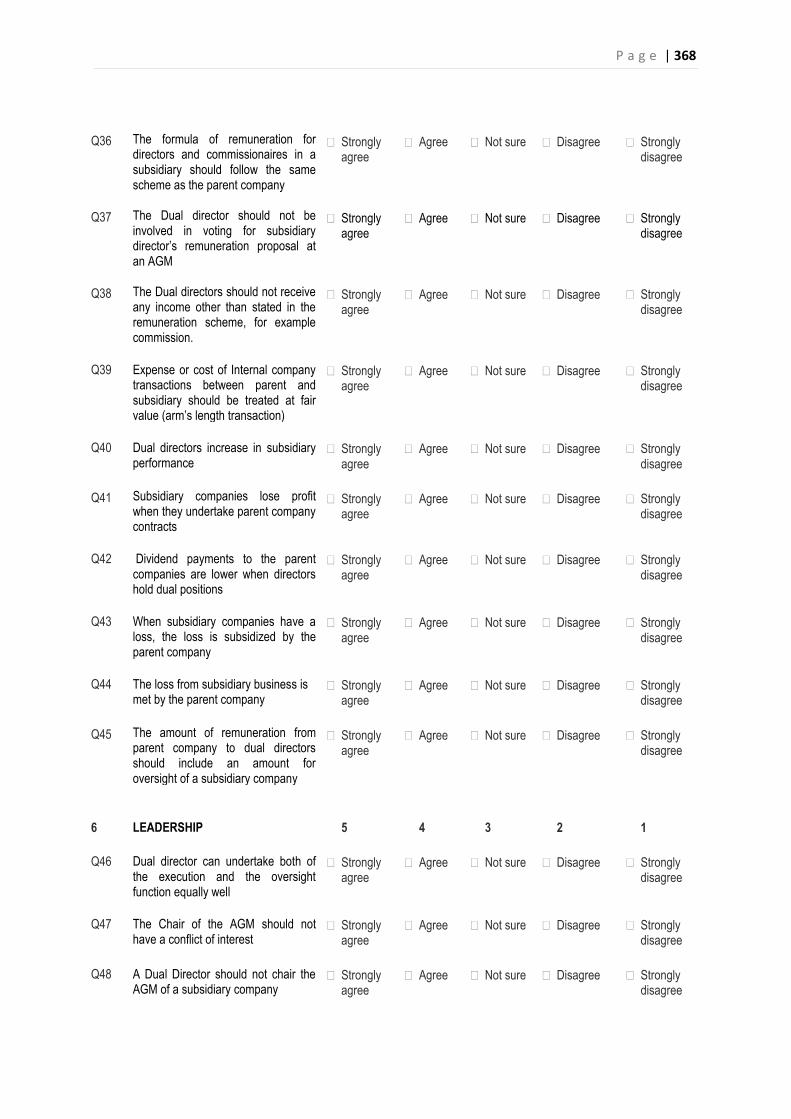
P a g e | 368
Q36
The formula of remuneration for directors and commissionaires in a subsidiary should follow the same scheme as the parent company
� Strongly
agree
� Agree
� Not sure
� Disagree
� Strongly
disagree
Q37
The Dual director should not be involved in voting for subsidiary director’s remuneration proposal at an AGM
� Strongly
agree
� Agree
� Not sure
� Disagree
� Strongly
disagree
Q38
The Dual directors should not receive any income other than stated in the remuneration scheme, for example commission.
� Strongly
agree
� Agree
� Not sure
� Disagree
� Strongly
disagree
Q39 Expense or cost of Internal company
transactions between parent and subsidiary should be treated at fair value (arm’s length transaction)
� Strongly agree
� Agree � Not sure � Disagree � Strongly disagree
Q40 Dual directors increase in subsidiary
performance � Strongly
agree � Agree � Not sure � Disagree � Strongly
disagree Q41
Subsidiary companies lose profit when they undertake parent company contracts
� Strongly
agree
� Agree
� Not sure
� Disagree
� Strongly
disagree
Q42 Dividend payments to the parent
companies are lower when directors hold dual positions
� Strongly agree
� Agree � Not sure � Disagree � Strongly disagree
Q43 When subsidiary companies have a
loss, the loss is subsidized by the parent company
� Strongly agree
� Agree � Not sure � Disagree � Strongly disagree
Q44 The loss from subsidiary business is
met by the parent company � Strongly
agree � Agree � Not sure � Disagree � Strongly
disagree Q45
The amount of remuneration from parent company to dual directors should include an amount for oversight of a subsidiary company
� Strongly
agree
� Agree
� Not sure
� Disagree
� Strongly
disagree
6 LEADERSHIP 5 4 3 2 1 Q46 Dual director can undertake both of
the execution and the oversight function equally well
� Strongly agree
� Agree � Not sure � Disagree � Strongly disagree
Q47 The Chair of the AGM should not
have a conflict of interest � Strongly
agree � Agree � Not sure � Disagree � Strongly
disagree Q48 A Dual Director should not chair the
AGM of a subsidiary company � Strongly
agree � Agree � Not sure � Disagree � Strongly
disagree
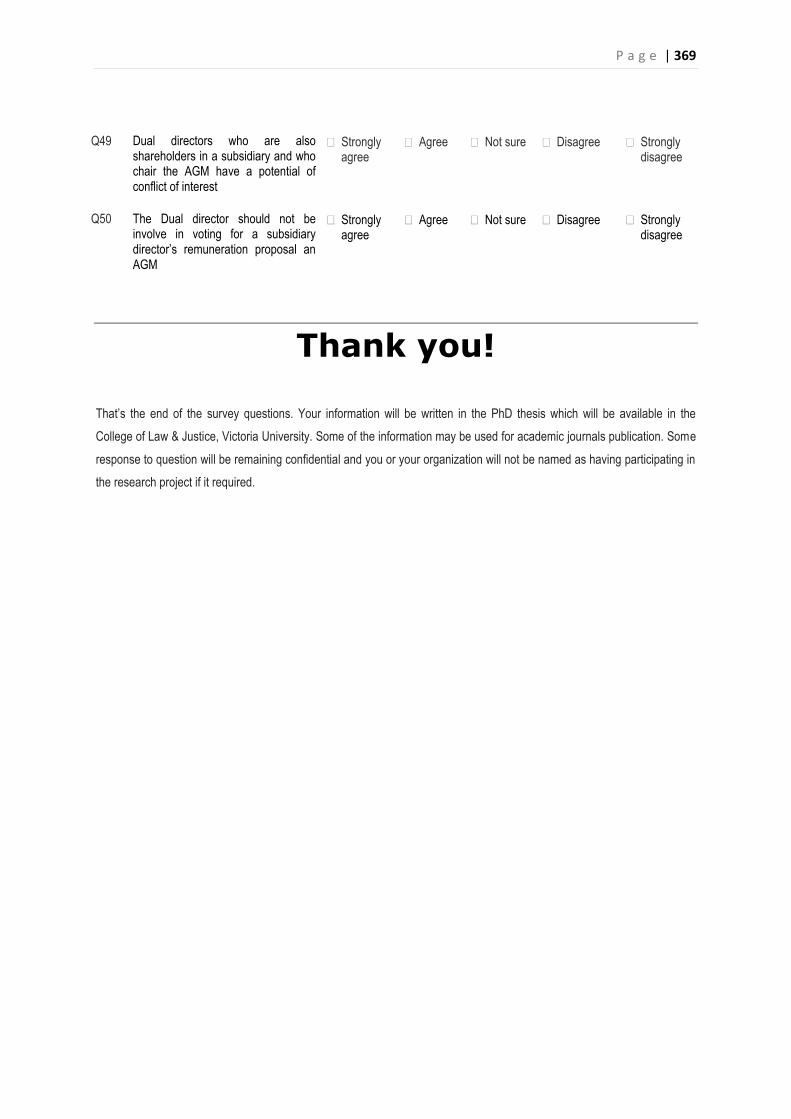
P a g e | 369
Q49 Dual directors who are also
shareholders in a subsidiary and who chair the AGM have a potential of conflict of interest
� Strongly agree
� Agree � Not sure � Disagree � Strongly disagree
Q50 The Dual director should not be
involve in voting for a subsidiary director’s remuneration proposal an AGM
� Strongly agree
� Agree � Not sure � Disagree � Strongly disagree
Thank you! That’s the end of the survey questions. Your information will be written in the PhD thesis which will be available in the College of Law & Justice, Victoria University. Some of the information may be used for academic journals publication. Some response to question will be remaining confidential and you or your organization will not be named as having participating in the research project if it required.
P a g e | 370
APPENDIX E: INTERVIEW QUESTIONNAIRES
PARENT--SUBSIDIARY GOVERNANCE RELATIONSHIP 2014 THE COLLEGE OF LAW AND JUSTICE
Prepared by: Agus Widodo PhD Candidate Student ID 3906938
Supervisor: Prof. Anona Armstrong Co Supervisor: Dr. James Mcconvill
Disclaimer: By participating in this interview, you consent to the transfer of the information you submit to the researcher. The information collected is for research purposes only and will not be publicly associated with any demographic respondent. However, we may share the result of this interview with the public in anonymized or aggregated forms and in academic ways.
INTERVIEW
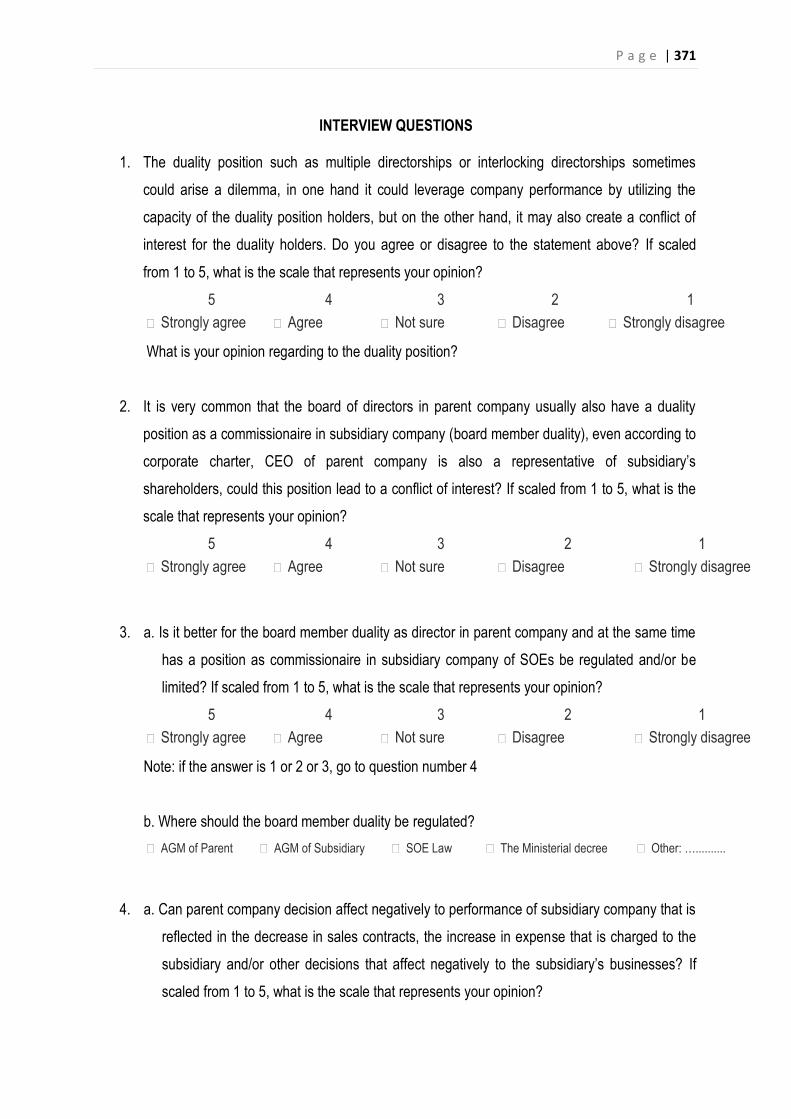
P a g e | 371
INTERVIEW QUESTIONS
1. The duality position such as multiple directorships or interlocking directorships sometimes could arise a dilemma, in one hand it could leverage company performance by utilizing the capacity of the duality position holders, but on the other hand, it may also create a conflict of interest for the duality holders. Do you agree or disagree to the statement above? If scaled from 1 to 5, what is the scale that represents your opinion?
5 4 3 2 1 � Strongly agree � Agree � Not sure � Disagree � Strongly disagree
What is your opinion regarding to the duality position?
2. It is very common that the board of directors in parent company usually also have a duality position as a commissionaire in subsidiary company (board member duality), even according to corporate charter, CEO of parent company is also a representative of subsidiary’s shareholders, could this position lead to a conflict of interest? If scaled from 1 to 5, what is the scale that represents your opinion?
5 4 3 2 1 � Strongly agree � Agree � Not sure � Disagree � Strongly disagree
3. a. Is it better for the board member duality as director in parent company and at the same time has a position as commissionaire in subsidiary company of SOEs be regulated and/or be limited? If scaled from 1 to 5, what is the scale that represents your opinion?
5 4 3 2 1 � Strongly agree � Agree � Not sure � Disagree � Strongly disagree
Note: if the answer is 1 or 2 or 3, go to question number 4 b. Where should the board member duality be regulated? � AGM of Parent � AGM of Subsidiary � SOE Law � The Ministerial decree � Other: …..........
4. a. Can parent company decision affect negatively to performance of subsidiary company that is reflected in the decrease in sales contracts, the increase in expense that is charged to the subsidiary and/or other decisions that affect negatively to the subsidiary’s businesses? If scaled from 1 to 5, what is the scale that represents your opinion?
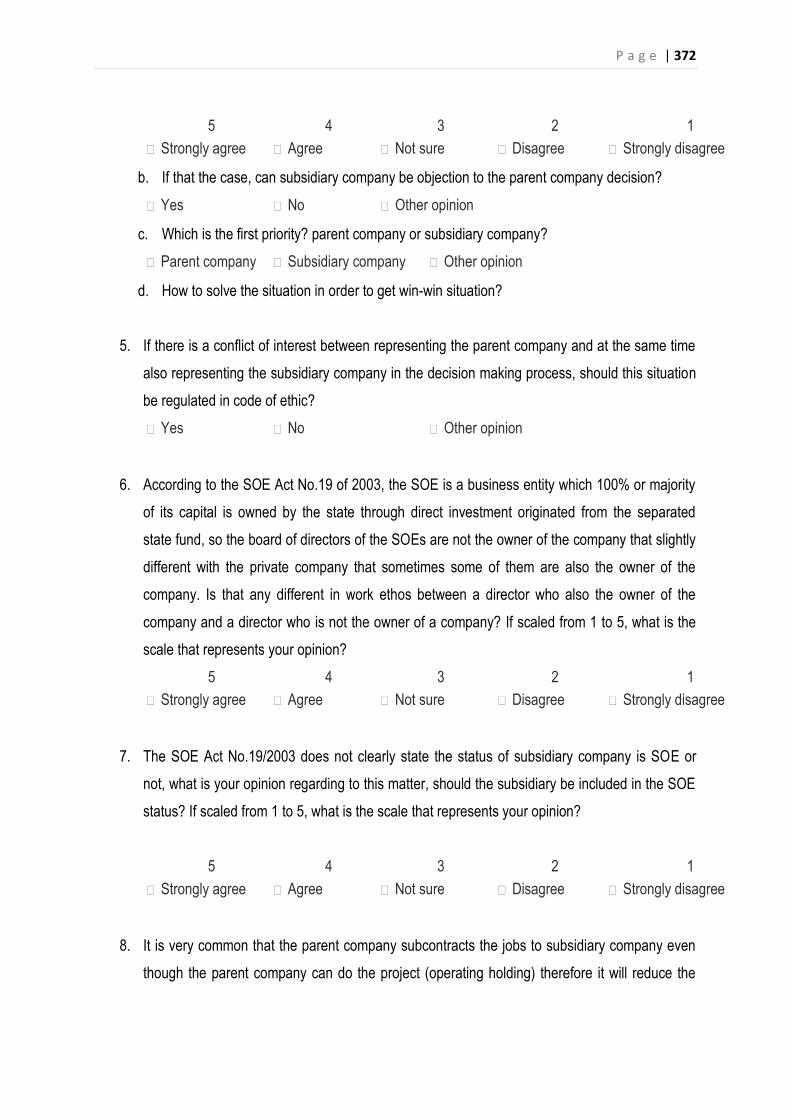
P a g e | 372
5 4 3 2 1 � Strongly agree � Agree � Not sure � Disagree � Strongly disagree
b. If that the case, can subsidiary company be objection to the parent company decision? � Yes � No � Other opinion
c. Which is the first priority? parent company or subsidiary company? � Parent company � Subsidiary company � Other opinion
d. How to solve the situation in order to get win-win situation?
5. If there is a conflict of interest between representing the parent company and at the same time also representing the subsidiary company in the decision making process, should this situation be regulated in code of ethic? � Yes � No � Other opinion
6. According to the SOE Act No.19 of 2003, the SOE is a business entity which 100% or majority
of its capital is owned by the state through direct investment originated from the separated state fund, so the board of directors of the SOEs are not the owner of the company that slightly different with the private company that sometimes some of them are also the owner of the company. Is that any different in work ethos between a director who also the owner of the company and a director who is not the owner of a company? If scaled from 1 to 5, what is the scale that represents your opinion?
5 4 3 2 1 � Strongly agree � Agree � Not sure � Disagree � Strongly disagree
7. The SOE Act No.19/2003 does not clearly state the status of subsidiary company is SOE or
not, what is your opinion regarding to this matter, should the subsidiary be included in the SOE status? If scaled from 1 to 5, what is the scale that represents your opinion?
5 4 3 2 1 � Strongly agree � Agree � Not sure � Disagree � Strongly disagree
8. It is very common that the parent company subcontracts the jobs to subsidiary company even
though the parent company can do the project (operating holding) therefore it will reduce the
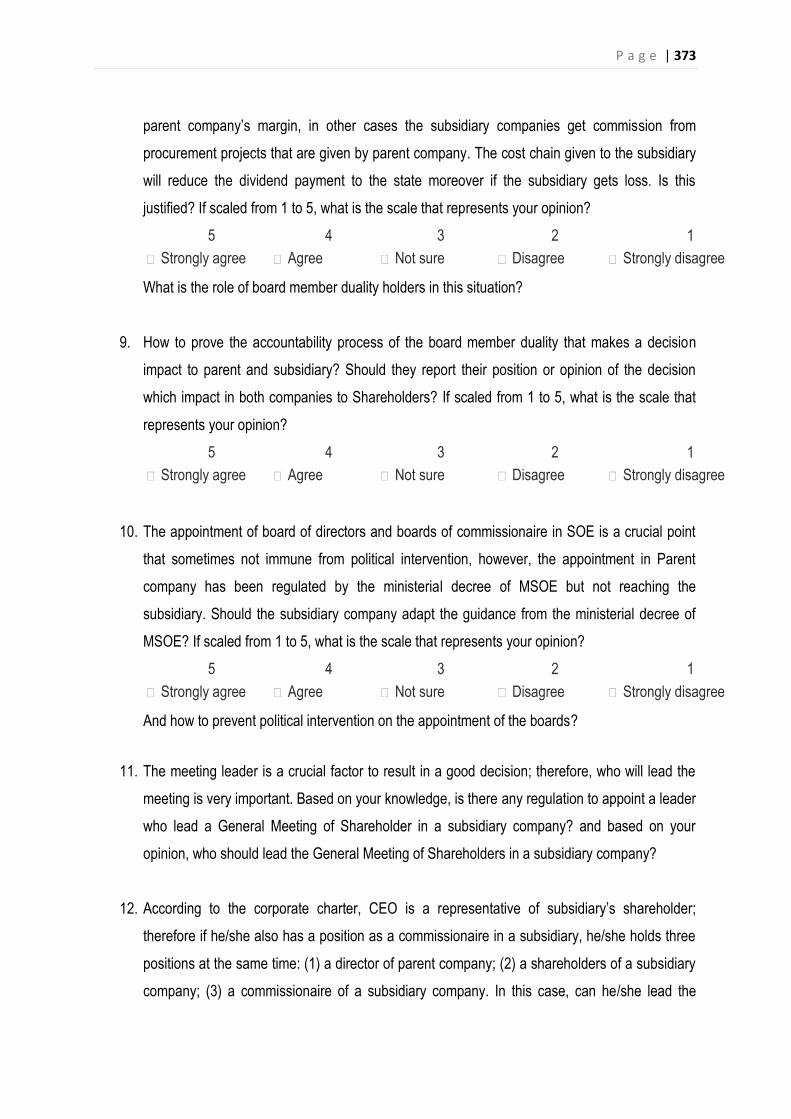
P a g e | 373
parent company’s margin, in other cases the subsidiary companies get commission from procurement projects that are given by parent company. The cost chain given to the subsidiary will reduce the dividend payment to the state moreover if the subsidiary gets loss. Is this justified? If scaled from 1 to 5, what is the scale that represents your opinion?
5 4 3 2 1 � Strongly agree � Agree � Not sure � Disagree � Strongly disagree
What is the role of board member duality holders in this situation?
9. How to prove the accountability process of the board member duality that makes a decision impact to parent and subsidiary? Should they report their position or opinion of the decision which impact in both companies to Shareholders? If scaled from 1 to 5, what is the scale that represents your opinion?
5 4 3 2 1 � Strongly agree � Agree � Not sure � Disagree � Strongly disagree
10. The appointment of board of directors and boards of commissionaire in SOE is a crucial point
that sometimes not immune from political intervention, however, the appointment in Parent company has been regulated by the ministerial decree of MSOE but not reaching the subsidiary. Should the subsidiary company adapt the guidance from the ministerial decree of MSOE? If scaled from 1 to 5, what is the scale that represents your opinion?
5 4 3 2 1 � Strongly agree � Agree � Not sure � Disagree � Strongly disagree
And how to prevent political intervention on the appointment of the boards?
11. The meeting leader is a crucial factor to result in a good decision; therefore, who will lead the meeting is very important. Based on your knowledge, is there any regulation to appoint a leader who lead a General Meeting of Shareholder in a subsidiary company? and based on your opinion, who should lead the General Meeting of Shareholders in a subsidiary company?
12. According to the corporate charter, CEO is a representative of subsidiary’s shareholder; therefore if he/she also has a position as a commissionaire in a subsidiary, he/she holds three positions at the same time: (1) a director of parent company; (2) a shareholders of a subsidiary company; (3) a commissionaire of a subsidiary company. In this case, can he/she lead the
P a g e | 374
General Meeting of Shareholders in a subsidiary companies? If scaled from 1 to 5, what is the scale that represents your opinion?
5 4 3 2 1 � Strongly agree � Agree � Not sure � Disagree � Strongly disagree
On the other hand, If one of commissionaire or director or of subsidiary company lead the General Meeting of Shareholders whereas he/she is not a CEO of parent company but he/she is still the member of director or senior officer in parent company, is this position will tend to inferior to the CEO of parent company who has a position as a commissionaires in a subsidiary company, what is your opinion. If scaled from 1 to 5, what is the scale that represents your opinion?
5 4 3 2 1 � Strongly agree � Agree � Not sure � Disagree � Strongly disagree
13. Should the appointment of commissionaire in subsidiary company be regulated and be asked to the parent’s shareholders (the SOE) c.q. the Ministry of SOE about their opinion? Or alternatively should the board member duality in parent—subsidiary relationship be regulated? If scaled from 1 to 5, what is the scale that represents your opinion?
5 4 3 2 1 � Strongly agree � Agree � Not sure � Disagree � Strongly disagree
14. Basically, salaries, allowances, bonus, and facilities of directors and commissionaires are determined by General Meeting of Shareholders. However, if in the case of board member duality which at the same times the board member also represents the shareholders of subsidiary company, is there any ethical issue in determining compensation for the directors and commissionaires in the subsidiary company? If scaled from 1 to 5, what is the scale that represents your opinion?
5 4 3 2 1 � Strongly agree � Agree � Not sure � Disagree � Strongly disagree
If so, how to solve the ethical issue? Is there any convenances to determine the compensation, especially compared to those in parent company?
P a g e | 375
15. Dividend policy and reinvestment are the crucial point when directors together with commissionaires propose them to shareholders. In the case board member duality, which one the duality holders should stand their position, whether in the position of parent company or subsidiary company? Do you think that establishing the parent—subsidiary governance relationship guidance is urgent to arrange all the relationship matters today? If scaled from 1 to 5, what is the scale that represents your opinion?
5 4 3 2 1 � Strongly agree � Agree � Not sure � Disagree � Strongly disagree
End of Interview Questions
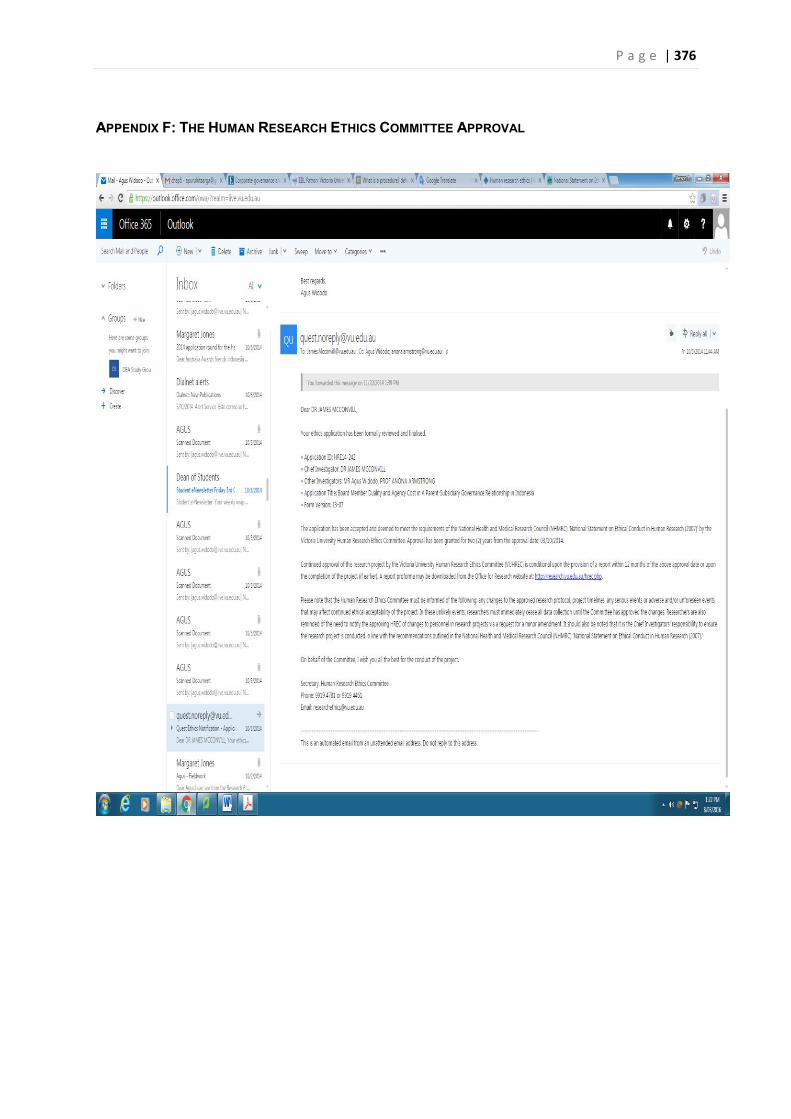
P a g e | 376
APPENDIX F: THE HUMAN RESEARCH ETHICS COMMITTEE APPROVAL
P a g e | 377
APPENDIX G: CONSENT FORM
FORM PERSETUJUAN UNTUK BERPARTISIPASI DALAM PENELITIAN
(CONSENT FORM FOR PARTICIPANTS INVOLVED IN RESEARCH)
INFORMASI KEPADA PARTISIPAN (INFORMATION TO PARTICIPANTS):
Kami mengharapkan anda untuk berpartisipasi dalam penelitihan yang berjudul Rangkap Jabatan dan Biaya Agensi pada Tata kelola Hubungan Induk—Anak Perusahaan di Indonesia
Fokus penelitihan ini adalah menganalisa hubungan antara rangkap jabatan dan biaya agensi pada induk dan anak perusahaan di BUMN, serta aspek etika dalam rangkap jabatan tersebut. Penelitian ini akan menitikberatkan pada analisis secara kritis dan evaluasi perangkapan jabatan dan biaya agensi pada tatakelola hubungan induk dan anak perusahaan di BUMN, selain itu juga akuntabilitas anggota dewan di kedua perusahaan tersebut. Sasaran dari penelitian ini adalah menemukan apakah perangkapan jabatan pada tata kelola hubungan induk dan anak perusahaan memberikan pengaruh lebih ke biaya daripada keuntungan atau sebaliknya, dan apa yang dapat dipelajari dari perangkapan tersebut. Sebagai pencarian filosofi dan teori, riset ini mencoba menemukan pendekatan teori yang mana yang meberikan pengaruh kepada BUMN di Indonesia, apakah pendekatan teori keagenan (Agency Theory) atau pendekatan teori penatalayanan (Stewardship Theory) dan terlebih penting adalah bagaimana meningkatkan kinerja dan akuntabilitas rangkap jabatan sebagai bagian dari mekanisme tata kelola korporasi.
Resiko yang mungkin muncul sangatlah kecil karena ketidaknyamanan untuk menjawab pertanyaan adalah resiko yang mungkin muncul selama wawancara berlangsung.
We would like to invite you to be a part of a study into Board Member Duality and Agency Cost in A Parent—Subsidiary Governance Relationship in Indonesia
This research mainly focuses on an analysing the relationship between the board member duality and agency cost in parent—subsidiary governance in the SOE and also ethical aspect of the duality. The study will also focus on critically analyzing and evaluating the board member duality and agency cost in parent and subsidiary governance relationship in the state-owned enterprises, as well as the accountability of the board in those companies. The objective of the study is to discover whether the board member duality in parent and subsidiary governance relationship gives an impact more to the cost than benefit, or vice versa, and what can be learned from the duality.
As a theoretical and philosophical quest, this research tries to find to which theoretical approach that gives more influence to the state-owned enterprises in Indonesia, whether it is an agency theory or stewardship theory approaches and more importantly how to improve performance and accountability of board member duality as a part of corporate governance mechanism.
The potential risk might be minimal since uncomfortable for answering the questions is the only possible risk throughout the interview.
PERNYATAAN DARI PARTISIPAN
CERTIFICATION BY SUBJECT
Saya,
Alamat,
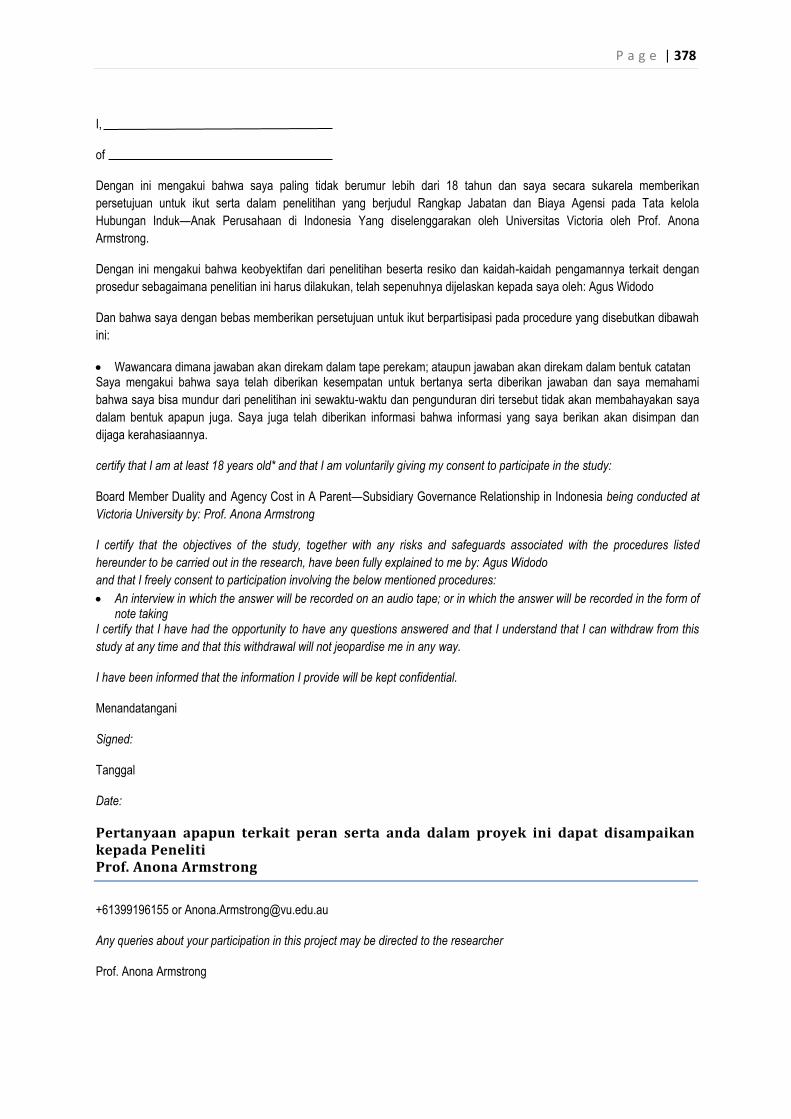
P a g e | 378
I,
of
Dengan ini mengakui bahwa saya paling tidak berumur lebih dari 18 tahun dan saya secara sukarela memberikan persetujuan untuk ikut serta dalam penelitihan yang berjudul Rangkap Jabatan dan Biaya Agensi pada Tata kelola Hubungan Induk—Anak Perusahaan di Indonesia Yang diselenggarakan oleh Universitas Victoria oleh Prof. Anona Armstrong.
Dengan ini mengakui bahwa keobyektifan dari penelitihan beserta resiko dan kaidah-kaidah pengamannya terkait dengan prosedur sebagaimana penelitian ini harus dilakukan, telah sepenuhnya dijelaskan kepada saya oleh: Agus Widodo
Dan bahwa saya dengan bebas memberikan persetujuan untuk ikut berpartisipasi pada procedure yang disebutkan dibawah ini:
x Wawancara dimana jawaban akan direkam dalam tape perekam; ataupun jawaban akan direkam dalam bentuk catatan Saya mengakui bahwa saya telah diberikan kesempatan untuk bertanya serta diberikan jawaban dan saya memahami bahwa saya bisa mundur dari penelitihan ini sewaktu-waktu dan pengunduran diri tersebut tidak akan membahayakan saya dalam bentuk apapun juga. Saya juga telah diberikan informasi bahwa informasi yang saya berikan akan disimpan dan dijaga kerahasiaannya.
certify that I am at least 18 years old* and that I am voluntarily giving my consent to participate in the study:
Board Member Duality and Agency Cost in A Parent—Subsidiary Governance Relationship in Indonesia being conducted at Victoria University by: Prof. Anona Armstrong
I certify that the objectives of the study, together with any risks and safeguards associated with the procedures listed hereunder to be carried out in the research, have been fully explained to me by: Agus Widodo and that I freely consent to participation involving the below mentioned procedures: x An interview in which the answer will be recorded on an audio tape; or in which the answer will be recorded in the form of
note taking I certify that I have had the opportunity to have any questions answered and that I understand that I can withdraw from this study at any time and that this withdrawal will not jeopardise me in any way.
I have been informed that the information I provide will be kept confidential.
Menandatangani
Signed:
Tanggal
Date:
Pertanyaan apapun terkait peran serta anda dalam proyek ini dapat disampaikan kepada Peneliti Prof. Anona Armstrong
+61399196155 or [email protected]
Any queries about your participation in this project may be directed to the researcher
Prof. Anona Armstrong

P a g e | 379
+61399196155 or [email protected]
Jika ada pertanyaan atau ketidakpuasan dalam hal bagaimana anda diperlakukan , anda dapat menghubungi Ethics Secretary, Victoria University Human Research Ethics Committee, Office for Research, Victoria University, PO Box 14428, Melbourne, VIC, 8001 or phone (03) 9919 4781.
If you have any queries or complaints about the way you have been treated, you may contact the Ethics Secretary, Victoria University Human Research Ethics Committee, Office for Research, Victoria University, PO Box 14428, Melbourne, VIC, 8001 or phone (03) 9919 4781
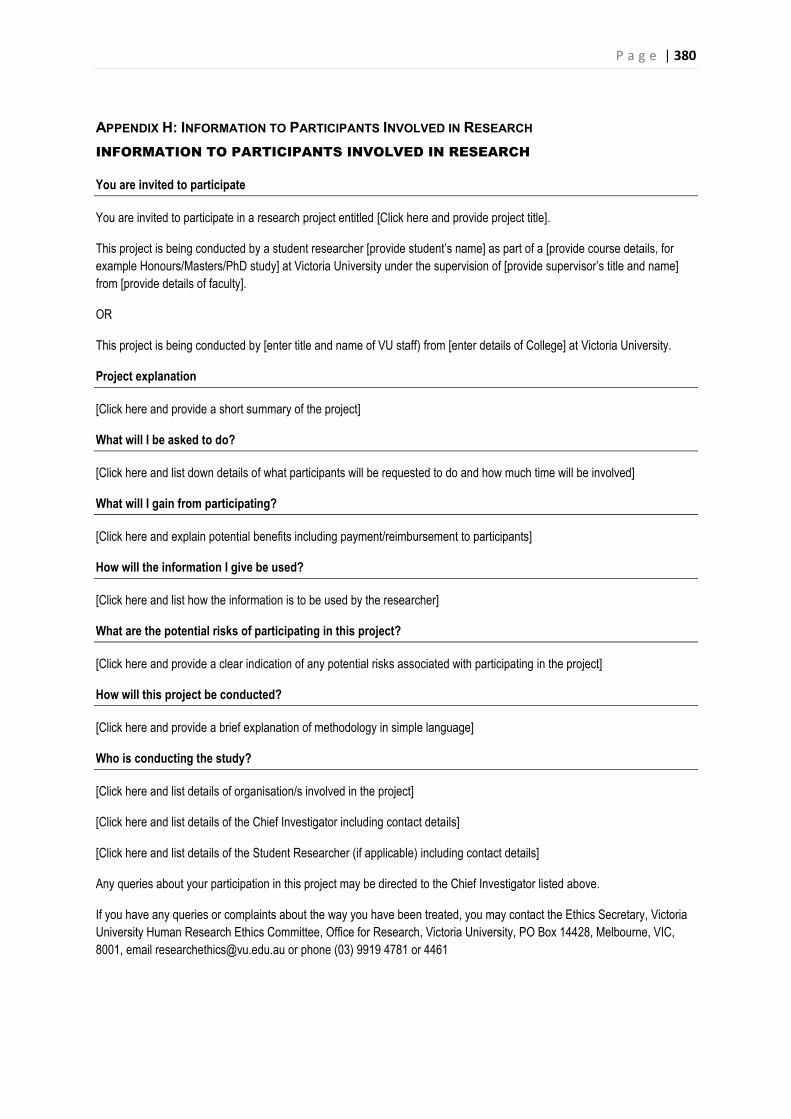
P a g e | 380
APPENDIX H: INFORMATION TO PARTICIPANTS INVOLVED IN RESEARCH INFORMATION TO PARTICIPANTS INVOLVED IN RESEARCH
You are invited to participate
You are invited to participate in a research project entitled [Click here and provide project title].
This project is being conducted by a student researcher [provide student’s name] as part of a [provide course details, for example Honours/Masters/PhD study] at Victoria University under the supervision of [provide supervisor’s title and name] from [provide details of faculty].
OR
This project is being conducted by [enter title and name of VU staff) from [enter details of College] at Victoria University.
Project explanation
[Click here and provide a short summary of the project]
What will I be asked to do?
[Click here and list down details of what participants will be requested to do and how much time will be involved]
What will I gain from participating?
[Click here and explain potential benefits including payment/reimbursement to participants]
How will the information I give be used?
[Click here and list how the information is to be used by the researcher]
What are the potential risks of participating in this project?
[Click here and provide a clear indication of any potential risks associated with participating in the project]
How will this project be conducted?
[Click here and provide a brief explanation of methodology in simple language]
Who is conducting the study?
[Click here and list details of organisation/s involved in the project]
[Click here and list details of the Chief Investigator including contact details]
[Click here and list details of the Student Researcher (if applicable) including contact details]
Any queries about your participation in this project may be directed to the Chief Investigator listed above.
If you have any queries or complaints about the way you have been treated, you may contact the Ethics Secretary, Victoria University Human Research Ethics Committee, Office for Research, Victoria University, PO Box 14428, Melbourne, VIC, 8001, email [email protected] or phone (03) 9919 4781 or 4461
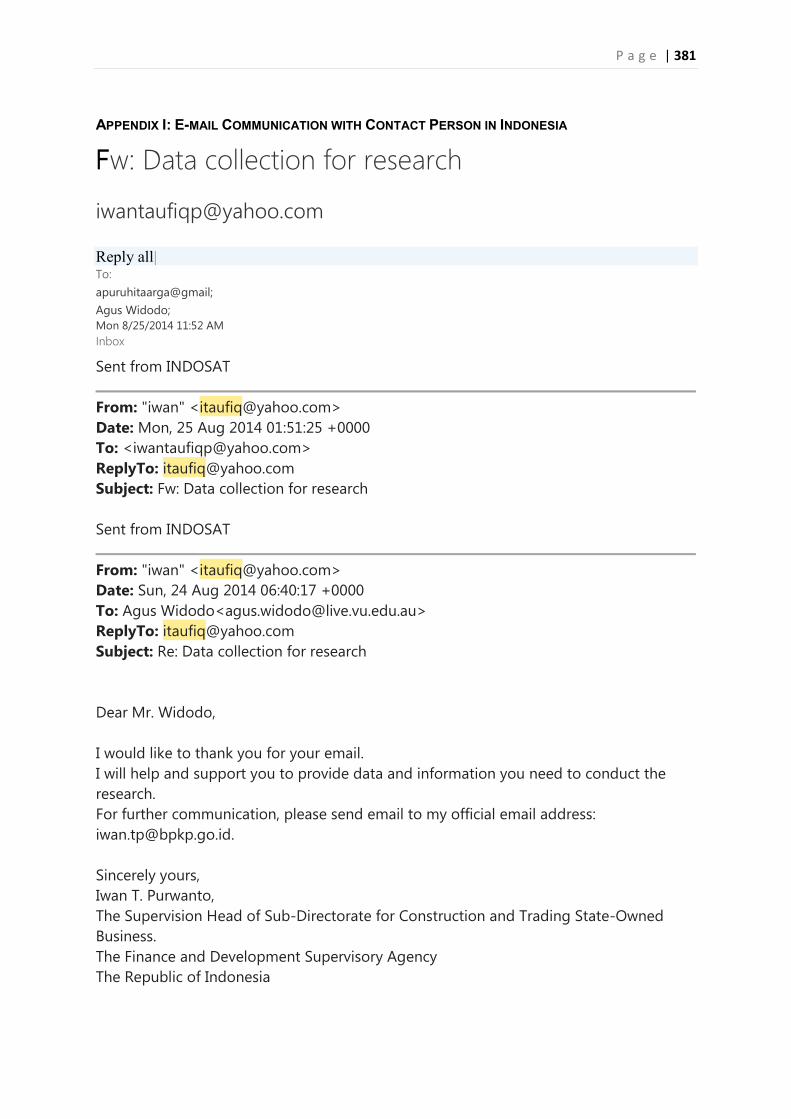
P a g e | 381
APPENDIX I: E-MAIL COMMUNICATION WITH CONTACT PERSON IN INDONESIA
Fw: Data collection for research
[email protected] Reply all| To:
apuruhitaarga@gmail;
Agus Widodo;
Mon 8/25/2014 11:52 AM
Inbox
Sent from INDOSAT
From: "iwan" <[email protected]>
Date: Mon, 25 Aug 2014 01:51:25 +0000
To: <[email protected]>
ReplyTo: [email protected]
Subject: Fw: Data collection for research
Sent from INDOSAT
From: "iwan" <[email protected]>
Date: Sun, 24 Aug 2014 06:40:17 +0000
To: Agus Widodo<[email protected]>
ReplyTo: [email protected]
Subject: Re: Data collection for research
Dear Mr. Widodo,
I would like to thank you for your email.
I will help and support you to provide data and information you need to conduct the
research.
For further communication, please send email to my official email address:
Sincerely yours,
Iwan T. Purwanto,
The Supervision Head of Sub-Directorate for Construction and Trading State-Owned
Business.
The Finance and Development Supervisory Agency
The Republic of Indonesia
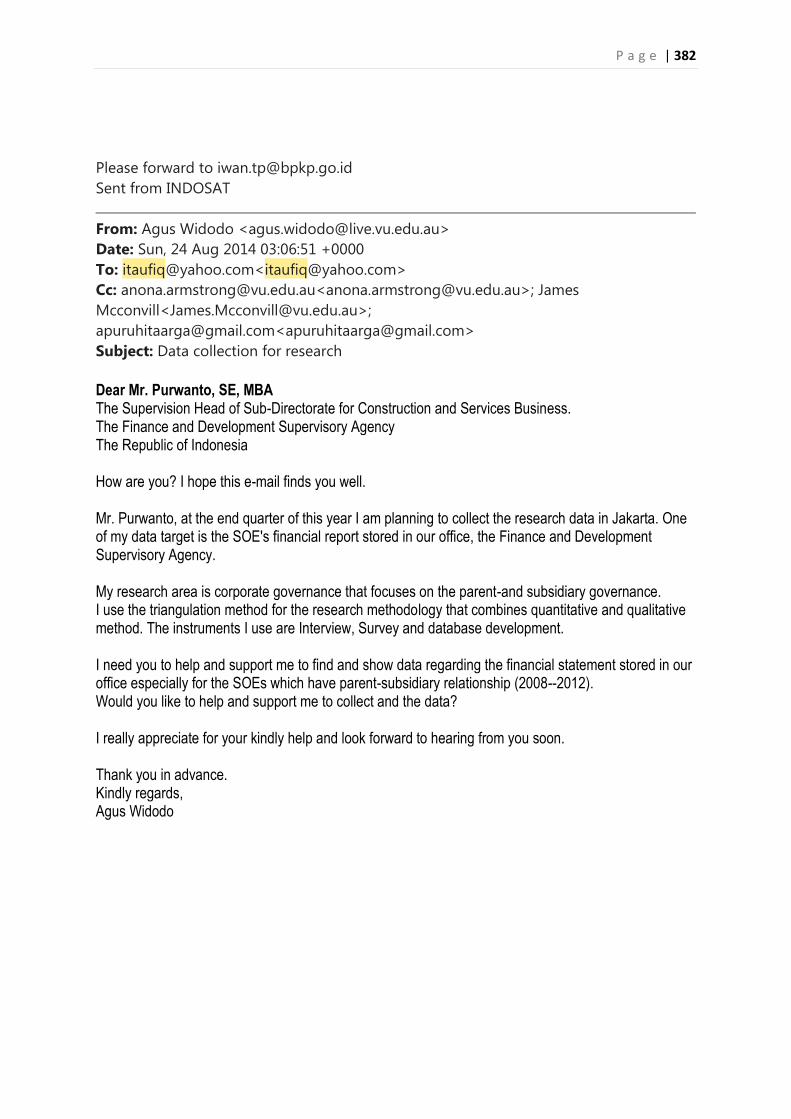
P a g e | 382
Please forward to [email protected]
Sent from INDOSAT
From: Agus Widodo <[email protected]>
Date: Sun, 24 Aug 2014 03:06:51 +0000
To: [email protected]<[email protected]>
Cc: [email protected]<[email protected]>; James
Mcconvill<[email protected]>;
[email protected]<[email protected]>
Subject: Data collection for research
Dear Mr. Purwanto, SE, MBA The Supervision Head of Sub-Directorate for Construction and Services Business. The Finance and Development Supervisory Agency The Republic of Indonesia How are you? I hope this e-mail finds you well. Mr. Purwanto, at the end quarter of this year I am planning to collect the research data in Jakarta. One of my data target is the SOE's financial report stored in our office, the Finance and Development Supervisory Agency. My research area is corporate governance that focuses on the parent-and subsidiary governance. I use the triangulation method for the research methodology that combines quantitative and qualitative method. The instruments I use are Interview, Survey and database development. I need you to help and support me to find and show data regarding the financial statement stored in our office especially for the SOEs which have parent-subsidiary relationship (2008--2012). Would you like to help and support me to collect and the data? I really appreciate for your kindly help and look forward to hearing from you soon. Thank you in advance. Kindly regards, Agus Widodo
P a g e | 383
APPENDIX J: ASSIGNMENT LETTER
P a g e | 384
APPENDIX K: ITINERARY DOCUMENT