BNY Mellon Investment Portfolios, MidCap Stock Portfolio
36
BNY Mellon Investment Portfolios, MidCap Stock Portfolio SEMIANNUAL REPORT June 30, 2021
Transcript of BNY Mellon Investment Portfolios, MidCap Stock Portfolio
BNY Mellon Investment Portfolios, MidCap Stock Portfolio
SEMIANNUAL REPORTJune 30, 2021
Save time. Save paper. View your next shareholder report onlineas soon as it’s available. Log into www.im.bnymellon.com and sign up for eCommunications. It’s simple and only takes a fewminutes.
The views expressed in this report reflect those of the portfoliomanager(s) only through the end of the period covered and do notnecessarily represent the views of BNY Mellon Investment Adviser,Inc. or any other person in the BNY Mellon Investment Adviser, Inc. organization. Any such views are subject to change at any time basedupon market or other conditions and BNY Mellon InvestmentAdviser, Inc. disclaims any responsibility to update such views. Theseviews may not be relied on as investment advice and, because investment decisions for a fund in the BNY Mellon Family of Fundsare based on numerous factors, may not be relied on as an indicationof trading intent on behalf of any fund in the BNY Mellon Family ofFunds.
Not FDIC-Insured • Not Bank-Guaranteed • May Lose Value

Contents T H E F U N D
Discussion of Fund Performance 2 Understanding Your Fund’s Expenses 5 Comparing Your Fund’s Expenses With Those of Other Funds 5 Statement of Investments 6 Statement of Investments in Affiliated Issuers 15 Statement of Assets and Liabilities 16 Statement of Operations 17 Statement of Changes in Net Assets 18 Financial Highlights 19 Notes to Financial Statements 21 Information About the Approval of the Fund’s Management Agreement and Approval of Sub-Investment Advisory Agreement 29 Liquidity Risk Management Program 32
F O R M O R E I N F O R M AT I O N
Back Cover
DISCUSSION OF FUND PERFORMANCE (Unaudited)
2
For the period from January 1, 2021 through June 30, 2021, as provided by Peter D. Goslin, CFA, Adam Logan, CFA, Chris Yao, CFA and Syed A. Zamil, CFA, Portfolio Managers
Market and Fund Performance Overview For the six-month period ended June 30, 2021, BNY Mellon Investment Portfolios, MidCap Stock Portfolio Initial shares produced a total return of 18.11%, and its Service shares produced a total return of 18.02.1 In comparison, the fund’s benchmark, the S&P MidCap 400® Index (the “Index”), produced a total return of 17.59% for the same period.2
Mid-cap stocks delivered strongly positive returns, outperforming their large-cap counterparts as COVID-19 restrictions began to lift, and previously stricken segments of the economy showed signs of recovery. The portfolio outperformed the Index, largely on the strength of positive security selection in the industrials and health care sectors, which more than made up for relatively weak selection among financials and utilities.
The Fund’s Investment Approach The fund seeks investment results that are greater than the total return performance of publicly traded, common stocks of medium-sized, domestic companies in the aggregate, as represented by the Index. To pursue this goal, the fund normally invests at least 80% of its net assets, plus any borrowings for investment purposes, in stocks of mid-cap companies.
The fund invests in growth and value stocks, which are chosen through a disciplined investment process that combines quantitative-modeling techniques, fundamental analysis and risk management. Consistency of returns compared to the Index is a primary goal of the investment process.
The portfolio managers select stocks through a “bottom-up” structured approach that seeks to identify undervalued securities using a quantitative ranking process. The process is driven by a proprietary stock selection model that measures a diverse set of corporate characteristics to identify and rank stocks based on valuation, momentum, sentiment and earnings-quality measures.
Next, the fund’s portfolio managers construct the portfolio through a risk-controlled process, focusing on stock selection, as opposed to making proactive decisions as to industry and sector exposure. The portfolio managers seek to maintain a portfolio that has exposure to industries and market capitalizations that are generally similar to the fund’s benchmark. Finally, within each sector and style subset, the fund will seek to overweight the most attractive stocks and underweight or not hold the stocks that have been ranked least attractive.
Equities Gain as the Pandemic Wanes U.S. equities gained ground as the coronavirus pandemic showed signs of easing during the first quarter of 2021. Although fresh lockdowns were enforced across several major economies, the accelerating rollout of COVID-19 vaccination programs and the promising results witnessed in the countries most advanced in this process bolstered the risk appetite of investors and encouraged them to discount wider economic reopening expected later in 2021. Among equities, strength shifted from momentum to value as investors once again

3
took notice of quality and fundamentals rather than seeking growth at any price. Cyclical sectors saw the greatest gains, with energy stocks rising sharply on increasing oil and gas prices. By contrast, the influence of monetary accommodation, which undoubtedly provided critical support for financial asset prices, took a somewhat different turn. With reflation underway and an elevated pace of growth expected in the second half of the year, investors began to anticipate a dialing back of the exceptional levels of monetary stimulus witnessed over the prior 12 months. This contributed to a sharp rise in government bond yields during the review period, with the long end of the U.S. Treasury market experiencing its worst quarter since 1980. The nature of fiscal stimulus also continued to evolve as President Biden formally announced his long-awaited $2 trillion infrastructure program to underpin and accelerate the U.S. recovery while also encompassing more strategic goals.
U.S. equity markets proceeded to deliver another quarter of gains from April through June 2021, drawing strength from an impressive slate of U.S. economic data, robust corporate earnings and further evidence that vaccination programs were paving the way for a full reopening of economies. Investors shifted focus back to growth over value without abandoning their renewed appreciation for company fundamentals. The inflation debate remained a high-profile and contentious issue, with a series of elevated data points prompting many to question the narrative that this phase would be transitory. The inextricable linkage between interest rates and the direction of monetary policy further affected investor sentiment. Significantly, the two brief bouts of equity market weakness experienced during the review period, first at the start of May, and then toward the end of the quarter, were both prompted by the airing of more hawkish commentary from U.S. Treasury Secretary Janet Yellen, later echoed by some of her former colleagues at the Federal Reserve (Fed). Against this backdrop, markets saw a retracement in longer-dated government bond yields, which had climbed sharply higher in the first quarter. This downward move was exacerbated in late June by Fed members’ comments, which caused investors to discount a weaker outlook for medium-term growth.
Strong Selections in Industrials and Health Care The fund’s performance compared to the Index benefited from good security selection among industrials and health care. As is typically the case for the portfolio, strength was spread across a large number of issues, with individual holdings making small contributions to relative performance. Among the portfolio’s top holdings, shares in residential, commercial and industrial generator manufacturer Generac rose sharply on increasing residential demand in the face of more frequent, weather-related power outages and the need for dependable power sources by employees working from home. Stock in another top holding, pharmaceutical research tool and support services provider Charles River Laboratories International, benefited from the company’s role in providing support and distribution services for COVID-19 vaccine efforts. In the energy sector, which led the market’s overall rise due to increasing oil and gas prices, holdings in independent exploration and production company Murphy Oil performed notably well. The company proved well positioned for prevailing market conditions as a producer of both crude oil and natural gas in the United States and Canada.
On the negative side, the portfolio’s relative performance was constrained by stock selection in the financials and utilities sectors. Among financials, underweight exposure to First Horizon detracted from relative returns. The portfolio focused instead on more liquid
DISCUSSION OF FUND PERFORMANCE (Unaudited) (continued)
4
financial stocks that appeared more attractive from a momentum perspective. In the lagging utilities sector, holdings in IDACORP, an integrated electric utility located in the Pacific Northwest, trailed the broader market along with most other high-yielding stocks in a market subject to rising interest-rate pressure.
Positioned for an Environment of Improving Fundamentals As of the end of the reporting period, we continue to identify what we believe are attractive investment opportunities across a broad spectrum of mid-cap companies and industry groups. The portfolio currently holds 295 individual securities, so performance is not dependent on any individual holding, reflecting instead our disciplined, quantitative analysis of company valuations and fundamentals, while controlling sector and market capitalization risks against the portfolio’s benchmark. Our systematic approach to evaluating securities and building portfolios allows us to create an investment process that participates in rising equity markets and helps protect capital during times of stress in the marketplace.
July 15, 2021 1 DUE TO RECENT MARKET VOLATILITY, CURRENT PERFORMANCE MAY BE
DIFFERENT THAN THE FIGURES SHOWN. Investors should note that the fund’s short-term performance is highly unusual, in part to unusually favorable market conditions, and is unlikely to be repeated or consistently achieved in the future. Total return includes reinvestment of dividends and any capital gains paid. Past performance is no guarantee of future results. Share price and investment return fluctuate such that upon redemption, fund shares may be worth more or less than their original cost. The fund’s performance does not reflect the deduction of additional charges and expenses imposed in connection with investing in variable insurance contracts, which will reduce returns. The fund’s return reflects the absorption of certain fund expenses by BNY Mellon Investment Adviser, Inc. pursuant to an agreement in effect through April 30, 2022, at which time it may be extended, modified or terminated. Had these expenses not been absorbed, returns would have been lower.
2 Source: Lipper Inc. — The S&P MidCap 400® Index provides investors with a benchmark for mid-sized companies. The Index measures the performance of mid-sized companies, reflecting the distinctive risk and return characteristics of this market segment. Investors cannot invest directly in any index.
Equities are subject generally to market, market sector, market liquidity, issuer and investment style risks, among other factors, to varying degrees, all of which are more fully described in the fund’s prospectus. Recent market risks include pandemic risks related to COVID-19. The effects of COVID-19 have contributed to increased volatility in global markets and will likely affect certain countries, companies, industries and market sectors more dramatically than others. To the extent the fund may overweight its investments in certain countries, companies, industries or market sectors, such positions will increase the fund's exposure to risk of loss from adverse developments affecting those countries, companies, industries or sectors. Stocks of mid-cap companies often experience sharper price fluctuations than stocks of large-cap companies. The fund is only available as a funding vehicle under variable life insurance policies or variable annuity contracts issued by insurance companies. Individuals may not purchase shares of the fund directly. A variable annuity is an insurance contract issued by an insurance company that enables investors to accumulate assets on a tax-deferred basis for retirement or other long-term goals. The investment objective and policies of BNY Mellon Investment Portfolios, MidCap Stock Portfolio made available through insurance products may be similar to those of other funds managed by BNY Mellon Investment Adviser, Inc. However, the investment results of the fund may be higher or lower than, and may not be comparable to, those of any other BNY Mellon Investment Adviser, Inc. fund.
UNDERSTANDING YOUR FUND’S EXPENSES (Unaudited)
5
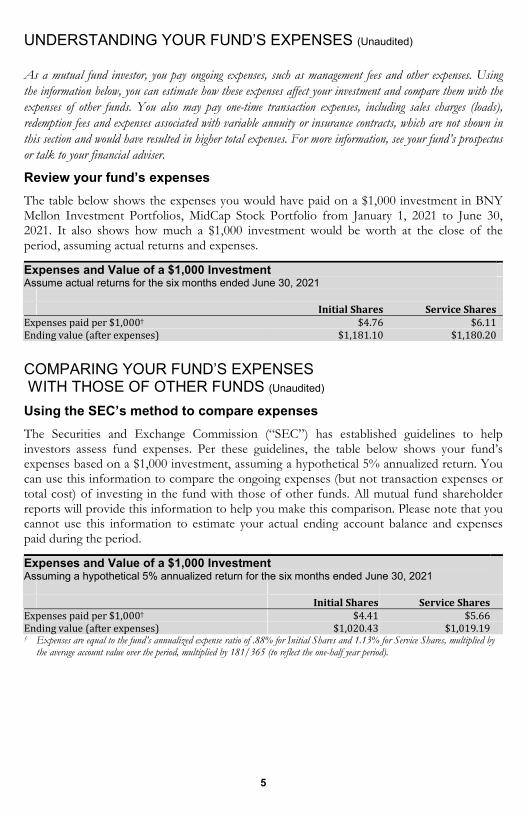
As a mutual fund investor, you pay ongoing expenses, such as management fees and other expenses. Using the information below, you can estimate how these expenses affect your investment and compare them with the expenses of other funds. You also may pay one-time transaction expenses, including sales charges (loads), redemption fees and expenses associated with variable annuity or insurance contracts, which are not shown in this section and would have resulted in higher total expenses. For more information, see your fund’s prospectus or talk to your financial adviser.
Review your fund’s expenses The table below shows the expenses you would have paid on a $1,000 investment in BNY Mellon Investment Portfolios, MidCap Stock Portfolio from January 1, 2021 to June 30, 2021. It also shows how much a $1,000 investment would be worth at the close of the period, assuming actual returns and expenses.
Expenses and Value of a $1,000 Investment Assume actual returns for the six months ended June 30, 2021 Initial Shares Service SharesExpenses paid per $1,000† $4.76 $6.11Ending value (after expenses) $1,181.10 $1,180.20
COMPARING YOUR FUND’S EXPENSES WITH THOSE OF OTHER FUNDS (Unaudited) Using the SEC’s method to compare expenses The Securities and Exchange Commission (“SEC”) has established guidelines to help investors assess fund expenses. Per these guidelines, the table below shows your fund’s expenses based on a $1,000 investment, assuming a hypothetical 5% annualized return. You can use this information to compare the ongoing expenses (but not transaction expenses or total cost) of investing in the fund with those of other funds. All mutual fund shareholder reports will provide this information to help you make this comparison. Please note that you cannot use this information to estimate your actual ending account balance and expenses paid during the period.
Expenses and Value of a $1,000 Investment Assuming a hypothetical 5% annualized return for the six months ended June 30, 2021 Initial Shares Service SharesExpenses paid per $1,000† $4.41 $5.66Ending value (after expenses) $1,020.43 $1,019.19† Expenses are equal to the fund’s annualized expense ratio of .88% for Initial Shares and 1.13% for Service Shares, multiplied by
the average account value over the period, multiplied by 181/365 (to reflect the one-half year period).
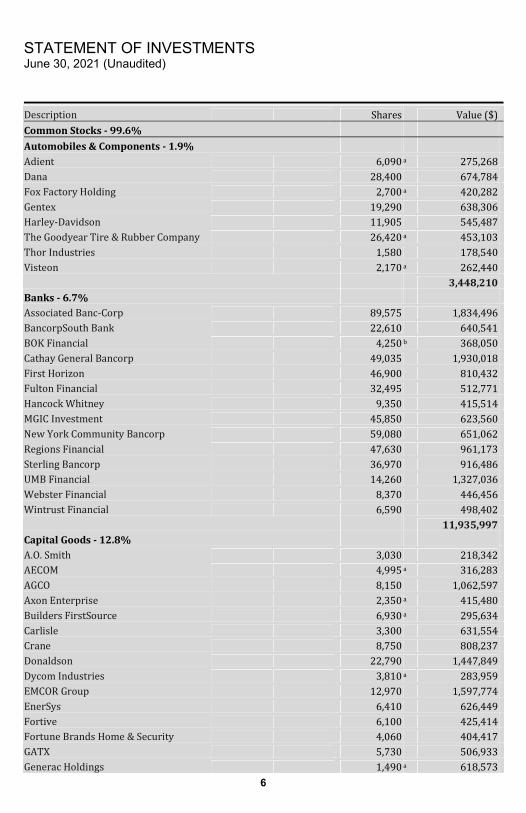
STATEMENT OF INVESTMENTS June 30, 2021 (Unaudited)
6
Description Shares Value ($)Common Stocks - 99.6%
Automobiles & Components - 1.9% Adient 6,090 a 275,268Dana 28,400 674,784Fox Factory Holding 2,700 a 420,282Gentex 19,290 638,306Harley-Davidson 11,905 545,487The Goodyear Tire & Rubber Company 26,420 a 453,103Thor Industries 1,580 178,540Visteon 2,170 a 262,440 3,448,210Banks - 6.7% Associated Banc-Corp 89,575 1,834,496BancorpSouth Bank 22,610 640,541BOK Financial 4,250 b 368,050Cathay General Bancorp 49,035 1,930,018First Horizon 46,900 810,432Fulton Financial 32,495 512,771Hancock Whitney 9,350 415,514MGIC Investment 45,850 623,560New York Community Bancorp 59,080 651,062Regions Financial 47,630 961,173Sterling Bancorp 36,970 916,486UMB Financial 14,260 1,327,036Webster Financial 8,370 446,456Wintrust Financial 6,590 498,402 11,935,997Capital Goods - 12.8% A.O. Smith 3,030 218,342AECOM 4,995 a 316,283AGCO 8,150 1,062,597Axon Enterprise 2,350 a 415,480Builders FirstSource 6,930 a 295,634Carlisle 3,300 631,554Crane 8,750 808,237Donaldson 22,790 1,447,849Dycom Industries 3,810 a 283,959EMCOR Group 12,970 1,597,774EnerSys 6,410 626,449Fortive 6,100 425,414Fortune Brands Home & Security 4,060 404,417GATX 5,730 506,933Generac Holdings 1,490 a 618,573
7
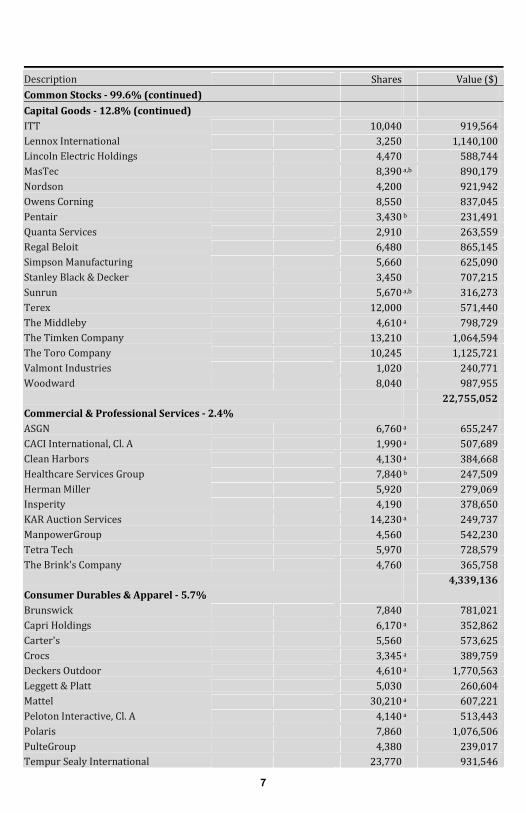
Description Shares Value ($)Common Stocks - 99.6% (continued)
Capital Goods - 12.8% (continued) ITT 10,040 919,564Lennox International 3,250 1,140,100Lincoln Electric Holdings 4,470 588,744MasTec 8,390 a,b 890,179Nordson 4,200 921,942Owens Corning 8,550 837,045Pentair 3,430 b 231,491Quanta Services 2,910 263,559Regal Beloit 6,480 865,145Simpson Manufacturing 5,660 625,090Stanley Black & Decker 3,450 707,215Sunrun 5,670 a,b 316,273Terex 12,000 571,440The Middleby 4,610 a 798,729The Timken Company 13,210 1,064,594The Toro Company 10,245 1,125,721Valmont Industries 1,020 240,771Woodward 8,040 987,955 22,755,052Commercial & Professional Services - 2.4% ASGN 6,760 a 655,247CACI International, Cl. A 1,990 a 507,689Clean Harbors 4,130 a 384,668Healthcare Services Group 7,840 b 247,509Herman Miller 5,920 279,069Insperity 4,190 378,650KAR Auction Services 14,230 a 249,737ManpowerGroup 4,560 542,230Tetra Tech 5,970 728,579The Brink's Company 4,760 365,758 4,339,136Consumer Durables & Apparel - 5.7% Brunswick 7,840 781,021Capri Holdings 6,170 a 352,862Carter's 5,560 573,625Crocs 3,345 a 389,759Deckers Outdoor 4,610 a 1,770,563Leggett & Platt 5,030 260,604Mattel 30,210 a 607,221Peloton Interactive, Cl. A 4,140 a 513,443Polaris 7,860 1,076,506PulteGroup 4,380 239,017Tempur Sealy International 23,770 931,546
STATEMENT OF INVESTMENTS (Unaudited) (continued)
8
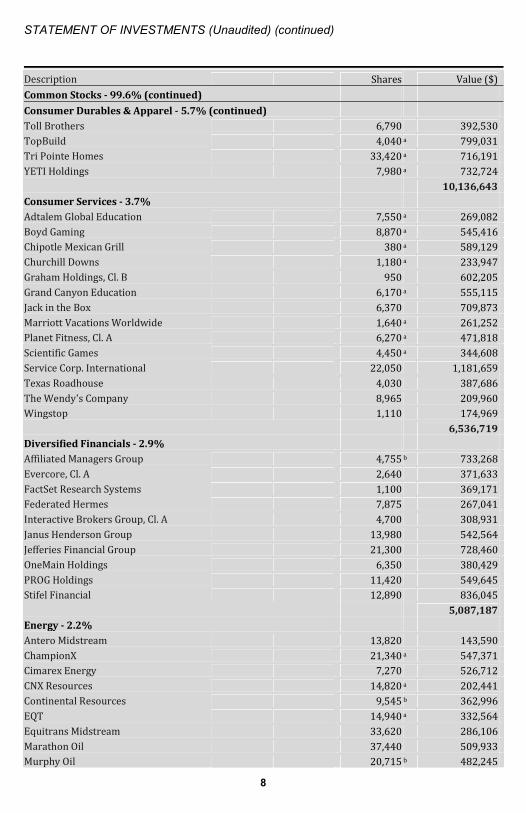
Description Shares Value ($)Common Stocks - 99.6% (continued)
Consumer Durables & Apparel - 5.7% (continued) Toll Brothers 6,790 392,530TopBuild 4,040 a 799,031Tri Pointe Homes 33,420 a 716,191YETI Holdings 7,980 a 732,724 10,136,643Consumer Services - 3.7% Adtalem Global Education 7,550 a 269,082Boyd Gaming 8,870 a 545,416Chipotle Mexican Grill 380 a 589,129Churchill Downs 1,180 a 233,947Graham Holdings, Cl. B 950 602,205Grand Canyon Education 6,170 a 555,115Jack in the Box 6,370 709,873Marriott Vacations Worldwide 1,640 a 261,252Planet Fitness, Cl. A 6,270 a 471,818Scientific Games 4,450 a 344,608Service Corp. International 22,050 1,181,659Texas Roadhouse 4,030 387,686The Wendy's Company 8,965 209,960Wingstop 1,110 174,969 6,536,719Diversified Financials - 2.9% Affiliated Managers Group 4,755 b 733,268Evercore, Cl. A 2,640 371,633FactSet Research Systems 1,100 369,171Federated Hermes 7,875 267,041Interactive Brokers Group, Cl. A 4,700 308,931Janus Henderson Group 13,980 542,564Jefferies Financial Group 21,300 728,460OneMain Holdings 6,350 380,429PROG Holdings 11,420 549,645Stifel Financial 12,890 836,045 5,087,187Energy - 2.2% Antero Midstream 13,820 143,590ChampionX 21,340 a 547,371Cimarex Energy 7,270 526,712CNX Resources 14,820 a 202,441Continental Resources 9,545 b 362,996EQT 14,940 a 332,564Equitrans Midstream 33,620 286,106Marathon Oil 37,440 509,933Murphy Oil 20,715 b 482,245
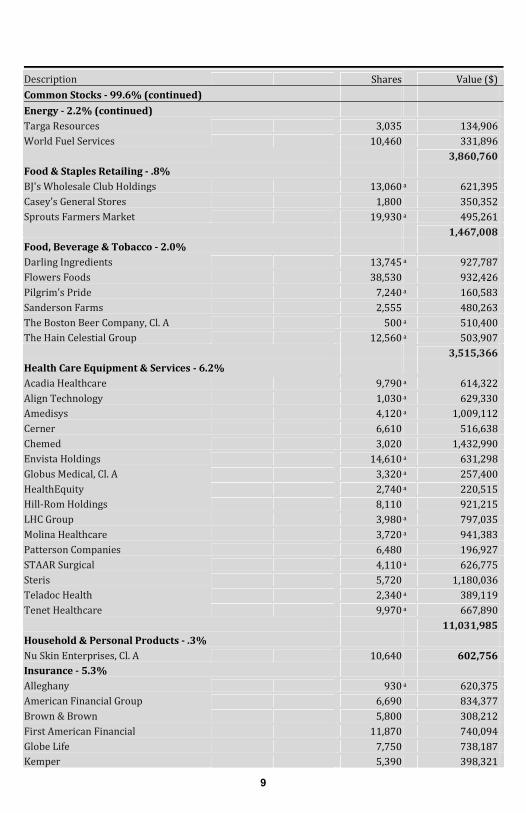
9
Description Shares Value ($)Common Stocks - 99.6% (continued)
Energy - 2.2% (continued) Targa Resources 3,035 134,906World Fuel Services 10,460 331,896 3,860,760Food & Staples Retailing - .8% BJ's Wholesale Club Holdings 13,060 a 621,395Casey's General Stores 1,800 350,352Sprouts Farmers Market 19,930 a 495,261 1,467,008Food, Beverage & Tobacco - 2.0% Darling Ingredients 13,745 a 927,787Flowers Foods 38,530 932,426Pilgrim's Pride 7,240 a 160,583Sanderson Farms 2,555 480,263The Boston Beer Company, Cl. A 500 a 510,400The Hain Celestial Group 12,560 a 503,907 3,515,366Health Care Equipment & Services - 6.2% Acadia Healthcare 9,790 a 614,322Align Technology 1,030 a 629,330Amedisys 4,120 a 1,009,112Cerner 6,610 516,638Chemed 3,020 1,432,990Envista Holdings 14,610 a 631,298Globus Medical, Cl. A 3,320 a 257,400HealthEquity 2,740 a 220,515Hill-Rom Holdings 8,110 921,215LHC Group 3,980 a 797,035Molina Healthcare 3,720 a 941,383Patterson Companies 6,480 196,927STAAR Surgical 4,110 a 626,775Steris 5,720 1,180,036Teladoc Health 2,340 a 389,119Tenet Healthcare 9,970 a 667,890 11,031,985Household & Personal Products - .3% Nu Skin Enterprises, Cl. A 10,640 602,756Insurance - 5.3% Alleghany 930 a 620,375American Financial Group 6,690 834,377Brown & Brown 5,800 308,212First American Financial 11,870 740,094Globe Life 7,750 738,187Kemper 5,390 398,321
STATEMENT OF INVESTMENTS (Unaudited) (continued)
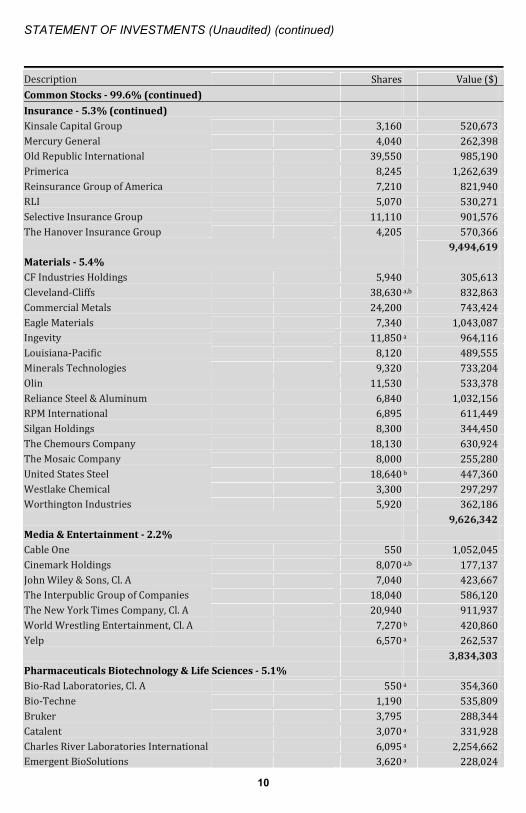
10
Description Shares Value ($)Common Stocks - 99.6% (continued)
Insurance - 5.3% (continued) Kinsale Capital Group 3,160 520,673Mercury General 4,040 262,398Old Republic International 39,550 985,190Primerica 8,245 1,262,639Reinsurance Group of America 7,210 821,940RLI 5,070 530,271Selective Insurance Group 11,110 901,576The Hanover Insurance Group 4,205 570,366 9,494,619Materials - 5.4% CF Industries Holdings 5,940 305,613Cleveland-Cliffs 38,630 a,b 832,863Commercial Metals 24,200 743,424Eagle Materials 7,340 1,043,087Ingevity 11,850 a 964,116Louisiana-Pacific 8,120 489,555Minerals Technologies 9,320 733,204Olin 11,530 533,378Reliance Steel & Aluminum 6,840 1,032,156RPM International 6,895 611,449Silgan Holdings 8,300 344,450The Chemours Company 18,130 630,924The Mosaic Company 8,000 255,280United States Steel 18,640 b 447,360Westlake Chemical 3,300 297,297Worthington Industries 5,920 362,186 9,626,342Media & Entertainment - 2.2% Cable One 550 1,052,045Cinemark Holdings 8,070 a,b 177,137John Wiley & Sons, Cl. A 7,040 423,667The Interpublic Group of Companies 18,040 586,120The New York Times Company, Cl. A 20,940 911,937World Wrestling Entertainment, Cl. A 7,270 b 420,860Yelp 6,570 a 262,537 3,834,303Pharmaceuticals Biotechnology & Life Sciences - 5.1% Bio-Rad Laboratories, Cl. A 550 a 354,360Bio-Techne 1,190 535,809Bruker 3,795 288,344Catalent 3,070 a 331,928Charles River Laboratories International 6,095 a 2,254,662Emergent BioSolutions 3,620 a 228,024

11
Description Shares Value ($)Common Stocks - 99.6% (continued)
Pharmaceuticals Biotechnology & Life Sciences - 5.1% (continued) Exelixis 18,610 a 339,074Halozyme Therapeutics 9,580 a 435,028Jazz Pharmaceuticals 3,410 a 605,752Medpace Holdings 2,410 a 425,678Neurocrine Biosciences 3,345 a 325,535Repligen 6,380 a 1,273,576Royalty Pharma, CI. A 9,640 395,144Sage Therapeutics 3,060 a 173,839Seagen 2,660 a 419,961Syneos Health 5,440 a 486,826United Therapeutics 1,080 a 193,763 9,067,303
Real Estate - 9.7% Brandywine Realty Trust 90,200 b,c 1,236,642Brixmor Property Group 10,725 c 245,495Camden Property Trust 3,400 c 451,078Corporate Office Properties Trust 46,190 c 1,292,858EastGroup Properties 5,710 c 939,009First Industrial Realty Trust 46,310 c 2,418,771Healthcare Realty Trust 35,920 c 1,084,784Highwoods Properties 16,990 c 767,438Jones Lang LaSalle 3,070 a 600,062Kimco Realty 21,300 c 444,105Life Storage 7,485 c 803,515National Retail Properties 23,065 c 1,081,287National Storage Affiliates Trust 9,445 c 477,539Omega Healthcare Investors 17,590 c 638,341Paramount Group 37,270 c 375,309Physicians Realty Trust 41,130 c 759,671PS Business Parks 9,720 c 1,439,338Sabra Health Care REIT 22,270 c 405,314SL Green Realty 7,930 b,c 634,400Urban Edge Properties 37,220 c 710,902VEREIT 6,480 c 297,626Weingarten Realty Investors 7,780 c 249,505 17,352,989Retailing - 4.4% American Eagle Outfitters 5,760 216,173AutoNation 5,680 a 538,521Dick's Sporting Goods 7,320 733,391Five Below 3,405 a 658,084Foot Locker 8,180 504,133
STATEMENT OF INVESTMENTS (Unaudited) (continued)
12
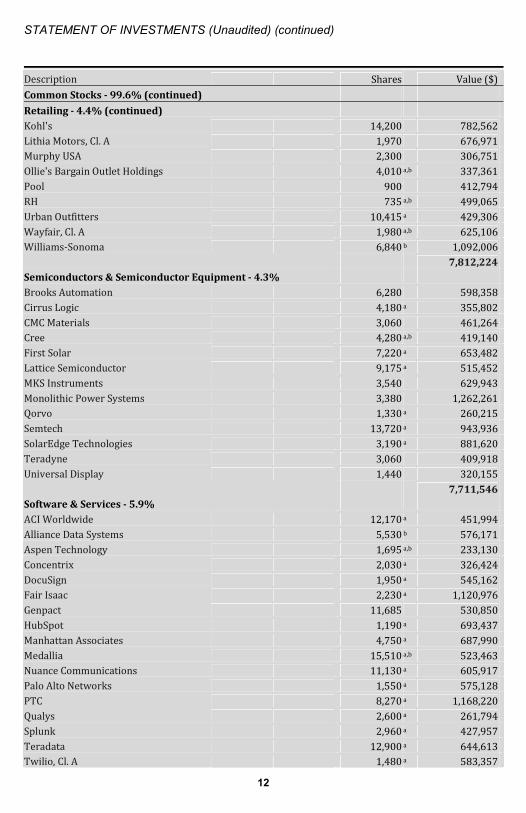
Description Shares Value ($)Common Stocks - 99.6% (continued)
Retailing - 4.4% (continued) Kohl's 14,200 782,562Lithia Motors, Cl. A 1,970 676,971Murphy USA 2,300 306,751Ollie's Bargain Outlet Holdings 4,010 a,b 337,361Pool 900 412,794RH 735 a,b 499,065Urban Outfitters 10,415 a 429,306Wayfair, Cl. A 1,980 a,b 625,106Williams-Sonoma 6,840 b 1,092,006 7,812,224Semiconductors & Semiconductor Equipment - 4.3% Brooks Automation 6,280 598,358Cirrus Logic 4,180 a 355,802CMC Materials 3,060 461,264Cree 4,280 a,b 419,140First Solar 7,220 a 653,482Lattice Semiconductor 9,175 a 515,452MKS Instruments 3,540 629,943Monolithic Power Systems 3,380 1,262,261Qorvo 1,330 a 260,215Semtech 13,720 a 943,936SolarEdge Technologies 3,190 a 881,620Teradyne 3,060 409,918Universal Display 1,440 320,155 7,711,546Software & Services - 5.9% ACI Worldwide 12,170 a 451,994Alliance Data Systems 5,530 b 576,171Aspen Technology 1,695 a,b 233,130Concentrix 2,030 a 326,424DocuSign 1,950 a 545,162Fair Isaac 2,230 a 1,120,976Genpact 11,685 530,850HubSpot 1,190 a 693,437Manhattan Associates 4,750 a 687,990Medallia 15,510 a,b 523,463Nuance Communications 11,130 a 605,917Palo Alto Networks 1,550 a 575,128PTC 8,270 a 1,168,220Qualys 2,600 a 261,794Splunk 2,960 a 427,957Teradata 12,900 a 644,613Twilio, Cl. A 1,480 a 583,357
13
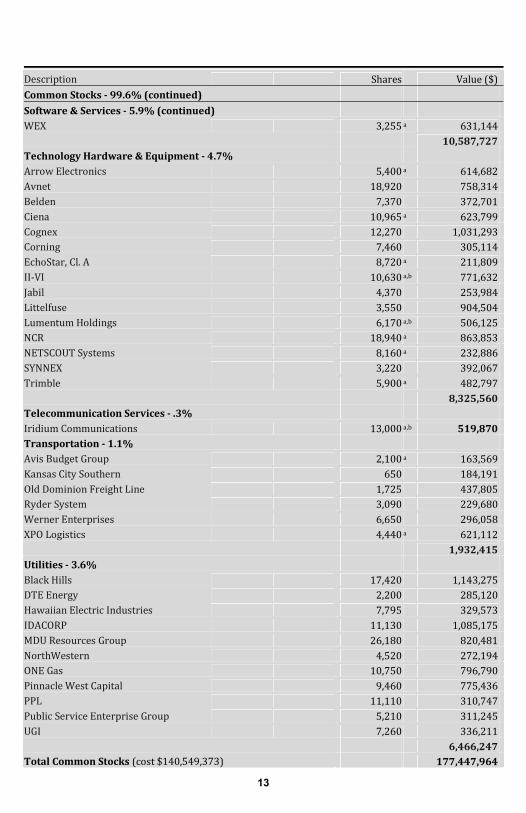
Description Shares Value ($)Common Stocks - 99.6% (continued)
Software & Services - 5.9% (continued) WEX 3,255 a 631,144 10,587,727Technology Hardware & Equipment - 4.7% Arrow Electronics 5,400 a 614,682Avnet 18,920 758,314Belden 7,370 372,701Ciena 10,965 a 623,799Cognex 12,270 1,031,293Corning 7,460 305,114EchoStar, Cl. A 8,720 a 211,809II-VI 10,630 a,b 771,632Jabil 4,370 253,984Littelfuse 3,550 904,504Lumentum Holdings 6,170 a,b 506,125NCR 18,940 a 863,853NETSCOUT Systems 8,160 a 232,886SYNNEX 3,220 392,067Trimble 5,900 a 482,797 8,325,560Telecommunication Services - .3% Iridium Communications 13,000 a,b 519,870Transportation - 1.1% Avis Budget Group 2,100 a 163,569Kansas City Southern 650 184,191Old Dominion Freight Line 1,725 437,805Ryder System 3,090 229,680Werner Enterprises 6,650 296,058XPO Logistics 4,440 a 621,112 1,932,415Utilities - 3.6% Black Hills 17,420 1,143,275DTE Energy 2,200 285,120Hawaiian Electric Industries 7,795 329,573IDACORP 11,130 1,085,175MDU Resources Group 26,180 820,481NorthWestern 4,520 272,194ONE Gas 10,750 796,790Pinnacle West Capital 9,460 775,436PPL 11,110 310,747Public Service Enterprise Group 5,210 311,245UGI 7,260 336,211 6,466,247Total Common Stocks (cost $140,549,373) 177,447,964
STATEMENT OF INVESTMENTS (Unaudited) (continued)
14
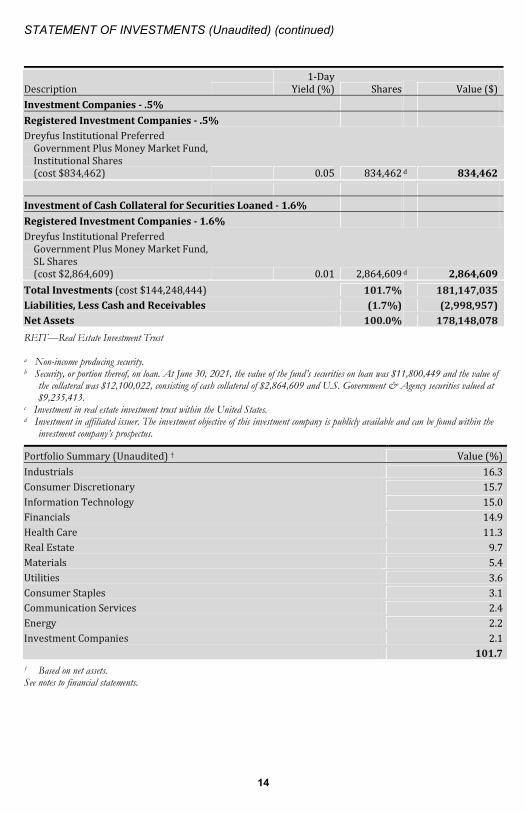
Description 1-Day Yield (%) Shares Value ($)Investment Companies - .5%
Registered Investment Companies - .5% Dreyfus Institutional Preferred Government Plus Money Market Fund, Institutional Shares (cost $834,462) 0.05 834,462 d 834,462 Investment of Cash Collateral for Securities Loaned - 1.6%
Registered Investment Companies - 1.6% Dreyfus Institutional Preferred Government Plus Money Market Fund, SL Shares (cost $2,864,609) 0.01 2,864,609 d 2,864,609
Total Investments (cost $144,248,444) 101.7% 181,147,035Liabilities, Less Cash and Receivables (1.7%) (2,998,957)Net Assets 100.0% 178,148,078
REIT—Real Estate Investment Trust a Non-income producing security. b Security, or portion thereof, on loan. At June 30, 2021, the value of the fund’s securities on loan was $11,800,449 and the value of
the collateral was $12,100,022, consisting of cash collateral of $2,864,609 and U.S. Government & Agency securities valued at $9,235,413.
c Investment in real estate investment trust within the United States. d Investment in affiliated issuer. The investment objective of this investment company is publicly available and can be found within the
investment company’s prospectus. Portfolio Summary (Unaudited) † Value (%)Industrials 16.3Consumer Discretionary 15.7Information Technology 15.0Financials 14.9Health Care 11.3Real Estate 9.7Materials 5.4Utilities 3.6Consumer Staples 3.1Communication Services 2.4Energy 2.2Investment Companies 2.1 101.7† Based on net assets. See notes to financial statements.

STATEMENT OF INVESTMENTS IN AFFILIATED ISSUERS (Unaudited)
15
Investment Companies Value 12/31/20 ($) Purchases ($)† Sales ($) Value 6/30/21 ($) NetAssets(%) Dividends/Distributions ($)Registered Investment Companies; Dreyfus Institutional Preferred Government Plus Money Market Fund, Institutional Shares 1,225,389 14,437,063 (14,827,990) 834,462 .5 416 Investment of Cash Collateral for Securities Loaned; Dreyfus Institutional Preferred Government Plus Money Market Fund, SL Shares 827,423 6,417,276 (4,380,090) 2,864,609 1.6 11,790††Total 2,052,812 20,854,339 (19,208,080) 3,699,071 2.1 12,206
† Included reinvested dividends/distributions. †† Represents securities lending income earned from the reinvestment of cash collateral from loaned securities, net of fees and collateral
investment expenses, and other payments to and from borrowers of securities. See notes to financial statements.
STATEMENT OF ASSETS AND LIABILITIES June 30, 2021 (Unaudited)
16
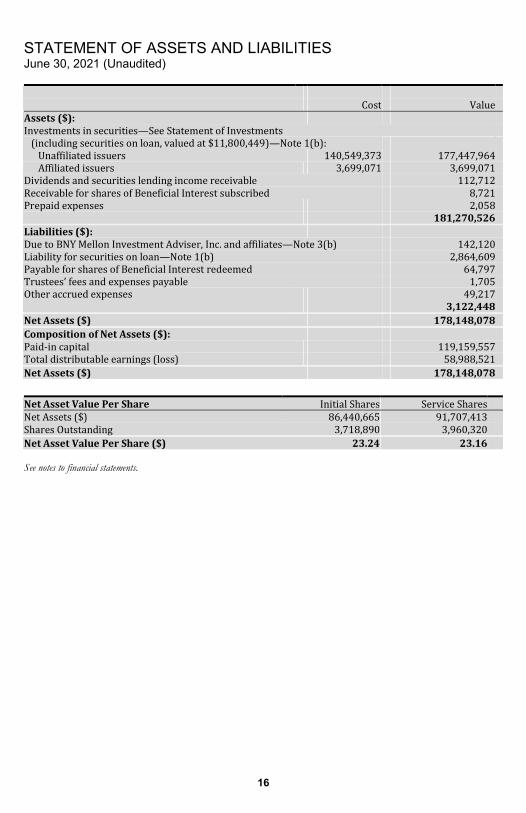
Cost Value
Assets ($): Investments in securities—See Statement of Investments (including securities on loan, valued at $11,800,449)—Note 1(b): Unaffiliated issuers 140,549,373 177,447,964 Affiliated issuers 3,699,071 3,699,071 Dividends and securities lending income receivable 112,712 Receivable for shares of Beneficial Interest subscribed 8,721 Prepaid expenses 2,058 181,270,526 Liabilities ($): Due to BNY Mellon Investment Adviser, Inc. and affiliates—Note 3(b) 142,120 Liability for securities on loan—Note 1(b) 2,864,609 Payable for shares of Beneficial Interest redeemed 64,797 Trustees’ fees and expenses payable 1,705 Other accrued expenses 49,217 3,122,448 Net Assets ($) 178,148,078 Composition of Net Assets ($): Paid-in capital 119,159,557 Total distributable earnings (loss) 58,988,521 Net Assets ($) 178,148,078
Net Asset Value Per Share Initial Shares Service Shares Net Assets ($) 86,440,665 91,707,413 Shares Outstanding 3,718,890 3,960,320 Net Asset Value Per Share ($) 23.24 23.16 See notes to financial statements.
STATEMENT OF OPERATIONS Six Months Ended June 30, 2021 (Unaudited)
17
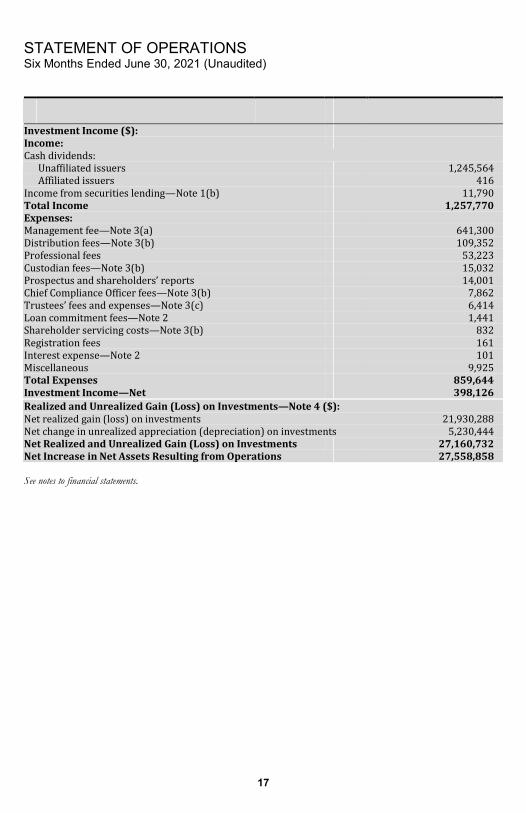
Investment Income ($): Income: Cash dividends: Unaffiliated issuers 1,245,564 Affiliated issuers 416 Income from securities lending—Note 1(b) 11,790 Total Income 1,257,770 Expenses: Management fee—Note 3(a) 641,300 Distribution fees—Note 3(b) 109,352 Professional fees 53,223 Custodian fees—Note 3(b) 15,032 Prospectus and shareholders’ reports 14,001 Chief Compliance Officer fees—Note 3(b) 7,862 Trustees’ fees and expenses—Note 3(c) 6,414 Loan commitment fees—Note 2 1,441 Shareholder servicing costs—Note 3(b) 832 Registration fees 161 Interest expense—Note 2 101 Miscellaneous 9,925 Total Expenses 859,644 Investment Income—Net 398,126 Realized and Unrealized Gain (Loss) on Investments—Note 4 ($): Net realized gain (loss) on investments 21,930,288 Net change in unrealized appreciation (depreciation) on investments 5,230,444 Net Realized and Unrealized Gain (Loss) on Investments 27,160,732 Net Increase in Net Assets Resulting from Operations 27,558,858 See notes to financial statements.
STATEMENT OF CHANGES IN NET ASSETS
18
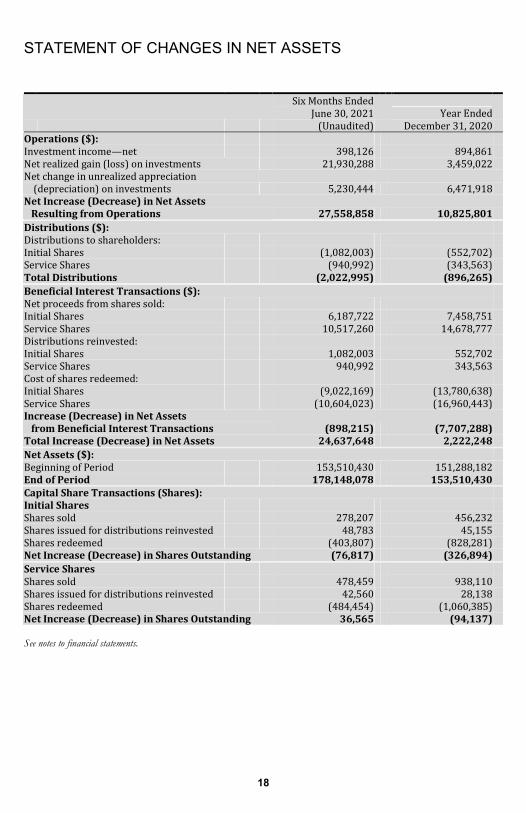
Six Months Ended June 30, 2021 (Unaudited) Year Ended December 31, 2020 Operations ($): Investment income—net 398,126 894,861 Net realized gain (loss) on investments 21,930,288 3,459,022 Net change in unrealized appreciation (depreciation) on investments 5,230,444 6,471,918 Net Increase (Decrease) in Net Assets Resulting from Operations 27,558,858 10,825,801 Distributions ($): Distributions to shareholders: Initial Shares (1,082,003) (552,702) Service Shares (940,992) (343,563) Total Distributions (2,022,995) (896,265) Beneficial Interest Transactions ($): Net proceeds from shares sold: Initial Shares 6,187,722 7,458,751 Service Shares 10,517,260 14,678,777 Distributions reinvested: Initial Shares 1,082,003 552,702 Service Shares 940,992 343,563 Cost of shares redeemed: Initial Shares (9,022,169) (13,780,638) Service Shares (10,604,023) (16,960,443) Increase (Decrease) in Net Assets from Beneficial Interest Transactions (898,215) (7,707,288) Total Increase (Decrease) in Net Assets 24,637,648 2,222,248 Net Assets ($): Beginning of Period 153,510,430 151,288,182 End of Period 178,148,078 153,510,430 Capital Share Transactions (Shares): Initial Shares Shares sold 278,207 456,232 Shares issued for distributions reinvested 48,783 45,155 Shares redeemed (403,807) (828,281) Net Increase (Decrease) in Shares Outstanding (76,817) (326,894) Service Shares Shares sold 478,459 938,110 Shares issued for distributions reinvested 42,560 28,138 Shares redeemed (484,454) (1,060,385) Net Increase (Decrease) in Shares Outstanding 36,565 (94,137) See notes to financial statements.
FINANCIAL HIGHLIGHTS
19
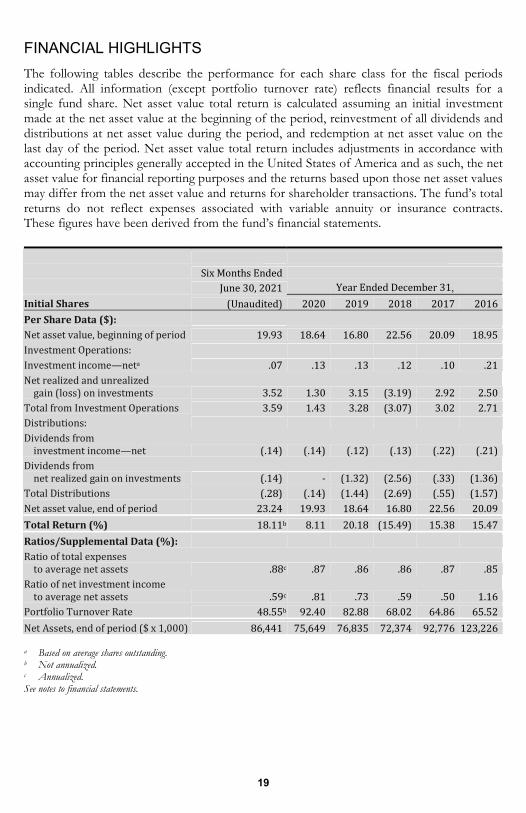
The following tables describe the performance for each share class for the fiscal periods indicated. All information (except portfolio turnover rate) reflects financial results for a single fund share. Net asset value total return is calculated assuming an initial investment made at the net asset value at the beginning of the period, reinvestment of all dividends and distributions at net asset value during the period, and redemption at net asset value on the last day of the period. Net asset value total return includes adjustments in accordance with accounting principles generally accepted in the United States of America and as such, the net asset value for financial reporting purposes and the returns based upon those net asset values may differ from the net asset value and returns for shareholder transactions. The fund’s total returns do not reflect expenses associated with variable annuity or insurance contracts. These figures have been derived from the fund’s financial statements.
Six Months Ended June 30, 2021 Year Ended December 31, Initial Shares (Unaudited) 2020 2019 2018 2017 2016Per Share Data ($): Net asset value, beginning of period 19.93 18.64 16.80 22.56 20.09 18.95Investment Operations: Investment income—neta .07 .13 .13 .12 .10 .21Net realized and unrealized gain (loss) on investments 3.52 1.30 3.15 (3.19) 2.92 2.50Total from Investment Operations 3.59 1.43 3.28 (3.07) 3.02 2.71Distributions: Dividends from investment income—net (.14) (.14) (.12) (.13) (.22) (.21)Dividends from net realized gain on investments (.14) - (1.32) (2.56) (.33) (1.36)Total Distributions (.28) (.14) (1.44) (2.69) (.55) (1.57)Net asset value, end of period 23.24 19.93 18.64 16.80 22.56 20.09Total Return (%) 18.11b 8.11 20.18 (15.49) 15.38 15.47Ratios/Supplemental Data (%): Ratio of total expenses to average net assets .88c .87 .86 .86 .87 .85Ratio of net investment income to average net assets .59c .81 .73 .59 .50 1.16Portfolio Turnover Rate 48.55b 92.40 82.88 68.02 64.86 65.52Net Assets, end of period ($ x 1,000) 86,441 75,649 76,835 72,374 92,776 123,226a Based on average shares outstanding. b Not annualized. c Annualized. See notes to financial statements.
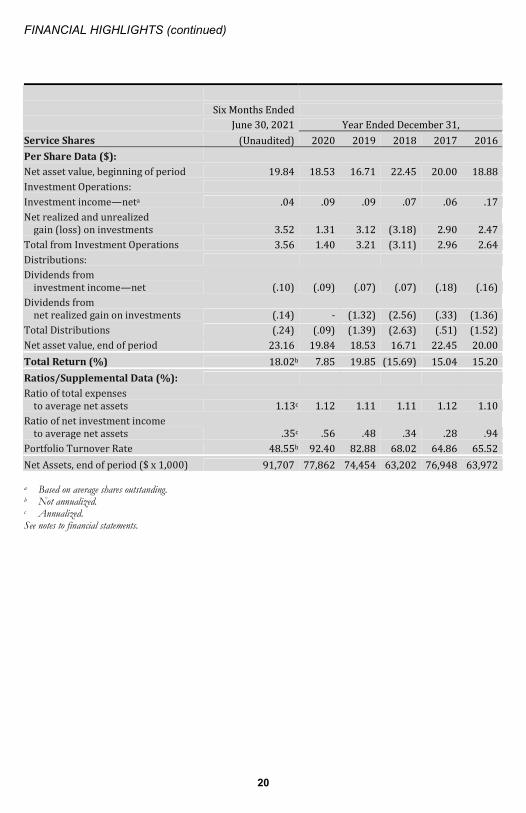
FINANCIAL HIGHLIGHTS (continued)
20
Six Months Ended June 30, 2021 Year Ended December 31, Service Shares (Unaudited) 2020 2019 2018 2017 2016Per Share Data ($): Net asset value, beginning of period 19.84 18.53 16.71 22.45 20.00 18.88Investment Operations: Investment income—neta .04 .09 .09 .07 .06 .17Net realized and unrealized gain (loss) on investments 3.52 1.31 3.12 (3.18) 2.90 2.47Total from Investment Operations 3.56 1.40 3.21 (3.11) 2.96 2.64Distributions: Dividends from investment income—net (.10) (.09) (.07) (.07) (.18) (.16)Dividends from net realized gain on investments (.14) - (1.32) (2.56) (.33) (1.36)Total Distributions (.24) (.09) (1.39) (2.63) (.51) (1.52)Net asset value, end of period 23.16 19.84 18.53 16.71 22.45 20.00Total Return (%) 18.02b 7.85 19.85 (15.69) 15.04 15.20Ratios/Supplemental Data (%): Ratio of total expenses to average net assets 1.13c 1.12 1.11 1.11 1.12 1.10Ratio of net investment income to average net assets .35c .56 .48 .34 .28 .94Portfolio Turnover Rate 48.55b 92.40 82.88 68.02 64.86 65.52Net Assets, end of period ($ x 1,000) 91,707 77,862 74,454 63,202 76,948 63,972a Based on average shares outstanding. b Not annualized. c Annualized. See notes to financial statements.
NOTES TO FINANCIAL STATEMENTS (Unaudited)
21
NOTE 1—Significant Accounting Policies:
MidCap Stock Portfolio (the “fund”) is a separate diversified series of BNY Mellon Investment Portfolios (the “Trust”), which is registered under the Investment Company Act of 1940, as amended (the “Act”), as an open-end management investment company and operates as a series company currently offering three series, including the fund. The fund is only offered to separate accounts established by insurance companies to fund variable annuity contracts and variable life insurance policies. The fund’s investment objective is to seek investment results that are greater than the total return performance of publicly traded common stocks of medium-size domestic companies in the aggregate, as represented by the Standard & Poor’s MidCap 400® Index. BNY Mellon Investment Adviser, Inc. (the “Adviser”), a wholly-owned subsidiary of The Bank of New York Mellon Corporation (“BNY Mellon”), serves as the fund’s investment adviser.
On February 10, 2021, BNY Mellon Investment Management announced its intention to realign several of its investment firms. As a result of this realignment, which is scheduled to occur, subject to regulatory requirements, in the third quarter of 2021 (the “Effective Date”), portfolio managers responsible for managing the fund’s investments who are employees of Mellon Investments Corporation (“Mellon”) in a dual employment arrangement with the Adviser, will become employees of Newton Investment Management North America, LLC (“Newton”), which, like Mellon, will be an affiliate of the Adviser, and will no longer be employees of Mellon. Consequently, as of the Effective Date and subject to the approval of the Trust’s Board of Trustees (the “Board”), the Adviser will engage Newton to serve as the fund’s sub-adviser, pursuant to a sub-investment advisory agreement between the Adviser and Newton. As the fund’s sub-adviser, Newton will provide the day-to-day management of the fund’s investments, subject to the Adviser’s supervision and approval. It is currently anticipated that the fund’s portfolio managers who are responsible for the day-to-day management of the fund’s investments will continue to manage the fund’s investments as of the Effective Date. It is also currently anticipated that there will be no material changes to the fund’s investment objective, strategies or policies, no reduction in the nature or level of services provided to the fund, and no increase in the management fee payable by the fund as a result of the engagement of Newton as the fund’s sub-adviser. The Adviser (and not the fund) will pay Newton for its sub-advisory services.
BNY Mellon Securities Corporation (the “Distributor”), a wholly-owned subsidiary of the Adviser, is the distributor of the fund’s shares, which are
NOTES TO FINANCIAL STATEMENTS (Unaudited) (continued)
22
sold without a sales charge. The fund is authorized to issue an unlimited number of $.001 par value shares of Beneficial Interest in each of the following classes of shares: Initial and Service. Each class of shares has identical rights and privileges, except with respect to the Distribution Plan, and the expenses borne by each class, the allocation of certain transfer agency costs, and certain voting rights. Income, expenses (other than expenses attributable to a specific class), and realized and unrealized gains or losses on investments are allocated to each class of shares based on its relative net assets.
The Trust accounts separately for the assets, liabilities and operations of each series. Expenses directly attributable to each series are charged to that series’ operations; expenses which are applicable to all series are allocated among them on a pro rata basis.
The Financial Accounting Standards Board (“FASB”) Accounting Standards Codification (“ASC”) is the exclusive reference of authoritative U.S. generally accepted accounting principles (“GAAP”) recognized by the FASB to be applied by nongovernmental entities. Rules and interpretive releases of the SEC under authority of federal laws are also sources of authoritative GAAP for SEC registrants. The fund is an investment company and applies the accounting and reporting guidance of the FASB ASC Topic 946 Financial Services-Investment Companies. The fund’s financial statements are prepared in accordance with GAAP, which may require the use of management estimates and assumptions. Actual results could differ from those estimates.
The Trust enters into contracts that contain a variety of indemnifications. The fund’s maximum exposure under these arrangements is unknown. The fund does not anticipate recognizing any loss related to these arrangements.
(a) Portfolio valuation: The fair value of a financial instrument is the amount that would be received to sell an asset or paid to transfer a liability in an orderly transaction between market participants at the measurement date (i.e., the exit price). GAAP establishes a fair value hierarchy that prioritizes the inputs of valuation techniques used to measure fair value. This hierarchy gives the highest priority to unadjusted quoted prices in active markets for identical assets or liabilities (Level 1 measurements) and the lowest priority to unobservable inputs (Level 3 measurements).
Additionally, GAAP provides guidance on determining whether the volume and activity in a market has decreased significantly and whether such a decrease in activity results in transactions that are not orderly.
23
GAAP requires enhanced disclosures around valuation inputs and techniques used during annual and interim periods.
Various inputs are used in determining the value of the fund’s investments relating to fair value measurements. These inputs are summarized in the three broad levels listed below:
Level 1—unadjusted quoted prices in active markets for identical investments.
Level 2—other significant observable inputs (including quoted prices for similar investments, interest rates, prepayment speeds, credit risk, etc.).
Level 3—significant unobservable inputs (including the fund’s own assumptions in determining the fair value of investments).
The inputs or methodology used for valuing securities are not necessarily an indication of the risk associated with investing in those securities.
Changes in valuation techniques may result in transfers in or out of an assigned level within the disclosure hierarchy. Valuation techniques used to value the fund’s investments are as follows:
Investments in equity securities are valued at the last sales price on the securities exchange or national securities market on which such securities are primarily traded. Securities listed on the National Market System for which market quotations are available are valued at the official closing price or, if there is no official closing price that day, at the last sales price. For open short positions, asked prices are used for valuation purposes. Bid price is used when no asked price is available. Registered investment companies that are not traded on an exchange are valued at their net asset value. All of the preceding securities are generally categorized within Level 1 of the fair value hierarchy.
Securities not listed on an exchange or the national securities market, or securities for which there were no transactions, are valued at the average of the most recent bid and asked prices. These securities are generally categorized within Level 2 of the fair value hierarchy.
Fair valuing of securities may be determined with the assistance of a pricing service using calculations based on indices of domestic securities and other appropriate indicators, such as prices of relevant American Depository Receipts and futures. Utilizing these techniques may result in transfers between Level 1 and Level 2 of the fair value hierarchy.
When market quotations or official closing prices are not readily available, or are determined not to accurately reflect fair value, such as when the
NOTES TO FINANCIAL STATEMENTS (Unaudited) (continued)
24
value of a security has been significantly affected by events after the close of the exchange or market on which the security is principally traded (for example, a foreign exchange or market), but before the fund calculates its net asset value, the fund may value these investments at fair value as determined in accordance with the procedures approved by the Board. Certain factors may be considered when fair valuing investments such as: fundamental analytical data, the nature and duration of restrictions on disposition, an evaluation of the forces that influence the market in which the securities are purchased and sold, and public trading in similar securities of the issuer or comparable issuers. These securities are either categorized within Level 2 or 3 of the fair value hierarchy depending on the relevant inputs used.
For securities where observable inputs are limited, assumptions about market activity and risk are used and such securities are generally categorized within Level 3 of the fair value hierarchy.
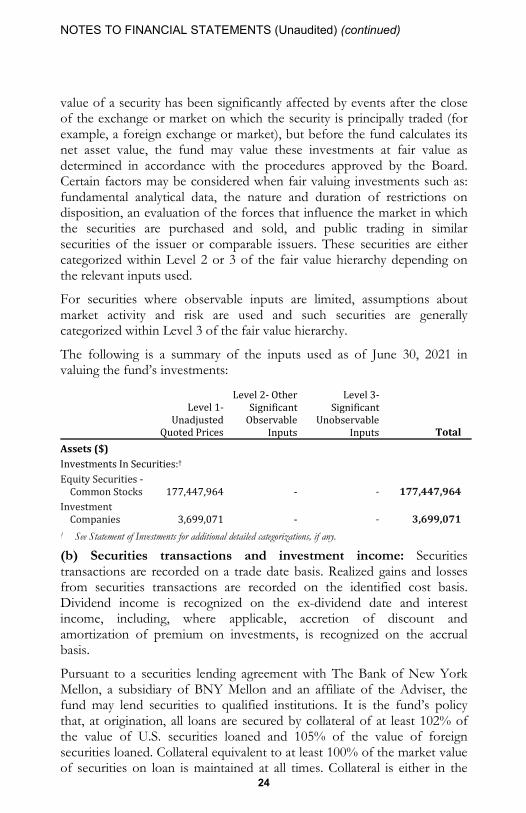
The following is a summary of the inputs used as of June 30, 2021 in valuing the fund’s investments:
Level 1-Unadjusted Quoted PricesLevel 2- Other Significant Observable Inputs
Level 3-Significant Unobservable Inputs Total
Assets ($) Investments In Securities:† Equity Securities - Common Stocks 177,447,964 - - 177,447,964Investment Companies 3,699,071 - - 3,699,071† See Statement of Investments for additional detailed categorizations, if any.
(b) Securities transactions and investment income: Securities transactions are recorded on a trade date basis. Realized gains and losses from securities transactions are recorded on the identified cost basis. Dividend income is recognized on the ex-dividend date and interest income, including, where applicable, accretion of discount and amortization of premium on investments, is recognized on the accrual basis.
Pursuant to a securities lending agreement with The Bank of New York Mellon, a subsidiary of BNY Mellon and an affiliate of the Adviser, the fund may lend securities to qualified institutions. It is the fund’s policy that, at origination, all loans are secured by collateral of at least 102% of the value of U.S. securities loaned and 105% of the value of foreign securities loaned. Collateral equivalent to at least 100% of the market value of securities on loan is maintained at all times. Collateral is either in the
25
form of cash, which can be invested in certain money market mutual funds managed by the Adviser, or U.S. Government and Agency securities. The fund is entitled to receive all dividends, interest and distributions on securities loaned, in addition to income earned as a result of the lending transaction. Should a borrower fail to return the securities in a timely manner, The Bank of New York Mellon is required to replace the securities for the benefit of the fund or credit the fund with the market value of the unreturned securities and is subrogated to the fund’s rights against the borrower and the collateral. Additionally, the contractual maturity of security lending transactions are on an overnight and continuous basis. During the period ended June 30, 2021, The Bank of New York Mellon earned $1,604 from the lending of the fund’s portfolio securities, pursuant to the securities lending agreement.
(c) Affiliated issuers: Investments in other investment companies advised by the Adviser are considered “affiliated” under the Act.
(d) Risk: Certain events particular to the industries in which the fund’s investments conduct their operations, as well as general economic, political and public health conditions, may have a significant negative impact on the investee’s operations and profitability. In addition, turbulence in financial markets and reduced liquidity in equity, credit and/or fixed income markets may negatively affect many issuers, which could adversely affect the fund. Global economies and financial markets are becoming increasingly interconnected, and conditions and events in one country, region or financial market may adversely impact issuers in a different country, region or financial market. These risks may be magnified if certain events or developments adversely interrupt the global supply chain; in these and other circumstances, such risks might affect companies world-wide. Recent examples include pandemic risks related to COVID-19 and aggressive measures taken world-wide in response by governments, including closing borders, restricting international and domestic travel, and the imposition of prolonged quarantines of large populations, and by businesses, including changes to operations and reducing staff. To the extent the fund may overweight its investments in certain countries, companies, industries or market sectors, such positions will increase the fund’s exposure to risk of loss from adverse developments affecting those countries, companies, industries or sectors.
(e) Dividends and distributions to shareholders: Dividends and distributions are recorded on the ex-dividend date. Dividends from investment income-net and dividends from net realized capital gains, if any, are normally declared and paid annually, but the fund may make distributions on a more frequent basis to comply with the distribution
NOTES TO FINANCIAL STATEMENTS (Unaudited) (continued)
26
requirements of the Internal Revenue Code of 1986, as amended (the “Code”). To the extent that net realized capital gains can be offset by capital loss carryovers, it is the policy of the fund not to distribute such gains. Income and capital gain distributions are determined in accordance with income tax regulations, which may differ from GAAP.
(f) Federal income taxes: It is the policy of the fund to continue to qualify as a regulated investment company, if such qualification is in the best interests of its shareholders, by complying with the applicable provisions of the Code, and to make distributions of taxable income and net realized capital gain sufficient to relieve it from substantially all federal income and excise taxes.
As of and during the period ended June 30, 2021, the fund did not have any liabilities for any uncertain tax positions. The fund recognizes interest and penalties, if any, related to uncertain tax positions as income tax expense in the Statement of Operations. During the period ended June 30, 2021, the fund did not incur any interest or penalties.
Each tax year in the three-year period ended December 31, 2020 remains subject to examination by the Internal Revenue Service and state taxing authorities.
The tax character of distributions paid to shareholders during the fiscal year ended December 31, 2020 was as follows: ordinary income $896,265. The tax character of current year distributions will be determined at the end of the current fiscal year.
NOTE 2—Bank Lines of Credit:
The fund participates with other long-term open-end funds managed by the Adviser in a $823.5 million unsecured credit facility led by Citibank, N.A. (the “Citibank Credit Facility”) and a $300 million unsecured credit facility provided by The Bank of New York Mellon (the “BNYM Credit Facility”), each to be utilized primarily for temporary or emergency purposes, including the financing of redemptions (each, a “Facility”). The Citibank Credit Facility is available in two tranches: (i) Tranche A is in an amount equal to $688.5 million and is available to all long-term open-ended funds, including the fund, and (ii) Tranche B is an amount equal to $135 million and is available only to BNY Mellon Floating Rate Income Fund, a series of BNY Mellon Investment Funds IV, Inc. In connection therewith, the fund has agreed to pay its pro rata portion of commitment fees for Tranche A of the Citibank Credit Facility and the BNYM Credit Facility. Interest is charged to the fund based on rates determined pursuant to the terms of the respective Facility at the time of borrowing.
27
The average amount of borrowings outstanding under the Facilities during the period ended June 30, 2021 was approximately $16,575 with a related weighted average annualized rate of 1.22%.
NOTE 3—Management Fee and Other Transactions with Affiliates:
(a) Pursuant to a management agreement with the Adviser, the management fee is computed at the annual rate of .75% of the value of the fund's average daily net assets and is payable monthly. The Adviser has contractually agreed, from January 1, 2021 through April 30, 2022, to waive receipt of its fees and/or assume the expenses of the fund, so that the direct expenses of the fund (excluding Rule 12b-1 Distribution Plan fees, taxes, interest expense, brokerage commissions, commitment fees on borrowings and extraordinary expenses) do not exceed 1.00%. On or after April 30, 2022, the Adviser may terminate this expense limitation at any time. During the period ended June 30, 2021, there were no reduction in expense pursuant to undertaking.
(b) Under the Distribution Plan adopted pursuant to Rule 12b-1 under the Act, Service shares pay the Distributor for distributing its shares, for servicing and/or maintaining Service shares’ shareholder accounts and for advertising and marketing for Service shares. The Distribution Plan provides for payments to be made at an annual rate of .25% of the value of the Service shares’ average daily net assets. The Distributor may make payments to Participating Insurance Companies and to brokers and dealers acting as principal underwriter for their variable insurance products. The fees payable under the Distribution Plan are payable without regard to actual expenses incurred. During the period ended June 30, 2021, Service shares were charged $109,352 pursuant to the Distribution Plan.
The fund has an arrangement with the transfer agent whereby the fund may receive earnings credits when positive cash balances are maintained, which are used to offset transfer agency fees. For financial reporting purposes, the fund includes net earnings credits, if any, as shareholder servicing costs in the Statement of Operations.
The fund has an arrangement with the custodian whereby the fund will receive interest income or be charged an overdraft fees when cash balances are maintained. For financial reporting purposes, the fund includes this interest income and overdraft fees, if any, as interest income in the Statement of Operations.
The fund compensates BNY Mellon Transfer, Inc., a wholly-owned subsidiary of the Adviser, under a transfer agency agreement for providing transfer agency and cash management services inclusive of earnings credits,
NOTES TO FINANCIAL STATEMENTS (Unaudited) (continued)
28
if any, for the fund. The majority of transfer agency fees are comprised of amounts paid on a per account basis, while cash management fees are related to fund subscriptions and redemptions. During the period ended June 30, 2021, the fund was charged $736 for transfer agency services, inclusive of earnings credit, if any. These fees are included in Shareholder servicing costs in the Statement of Operations.
The fund compensates The Bank of New York Mellon under a custody agreement for providing custodial services for the fund. These fees are determined based on net assets, geographic region and transaction activity. During the period ended June 30, 2021, the fund was charged $15,032 pursuant to the custody agreement.
During the period ended June 30, 2021, the fund was charged $7,862 for services performed by the Chief Compliance Officer and his staff. These fees are included in Chief Compliance Officer fees in the Statement of Operations.
The components of “Due to BNY Mellon Investment Adviser, Inc. and affiliates” in the Statement of Assets and Liabilities consist of: management fees of $110,264, Distribution Plan fees of $18,932, custodian fees of $4,800, Chief Compliance Officer fees of $7,862 and transfer agency fees of $262.
(c) Each Board member also serves as a Board member of other funds in the BNY Mellon Family of Funds complex. Annual retainer fees and attendance fees are allocated to each fund based on net assets.
NOTE 4—Securities Transactions:
The aggregate amount of purchases and sales of investment securities, excluding short-term securities, during the period ended June 30, 2021, amounted to $81,687,224 and $83,659,845, respectively.
At June 30, 2021, accumulated net unrealized appreciation on investments was $36,898,591, consisting of $38,948,598 gross unrealized appreciation and $2,050,007 gross unrealized depreciation.
At June 30, 2021, the cost of investments for federal income tax purposes was substantially the same as the cost for financial reporting purposes (see the Statement of Investments).
INFORMATION ABOUT THE APPROVAL OF THE FUND’S MANAGEMENT AGREEMENT AND APPROVAL OF SUB-INVESTMENT ADVISORY AGREEMENT (Unaudited)
29
At a meeting of the fund’s Board of Trustees held on May 18, 2021 (the “Meeting”), the Board discussed with representatives of the Adviser plans to realign Mellon Investments Corporation’s (“Mellon”) equities and multi-asset capabilities with Newton Investment Management North America, LLC (“Newton US”) (the “Firm Realignment”), with such realignment scheduled to occur, subject to regulatory requirements, in the third quarter of 2021 (the “Effective Date”). The Adviser noted that, as a result of the Firm Realignment, the portfolio managers who are currently responsible for managing the investments of the fund as employees of Mellon in a dual employment arrangement with the Adviser, will become employees of Newton US as of the Effective Date. Consequently, the Adviser proposed to engage Newton US to serve as the fund’s sub-investment adviser, pursuant to a sub-investment advisory agreement between the Adviser and Newton US (the “New Sub-Advisory Agreement”), to be effective on the Effective Date. In addition, the Adviser proposed amending the Fund’s current management agreement (the “Current Management Agreement”) to reflect the engagement of Newton US as sub-investment adviser to the fund (as proposed to be amended, the “Amended Management Agreement”), to be effective on the Effective Date.
At the Meeting, the Adviser recommended the approval of the New Sub-Advisory Agreement, pursuant to which Newton US would serve as sub-investment adviser to the fund, and the Amended Management Agreement. The recommendation for the approval of the New Sub-Advisory Agreement and the Amended Management Agreement was based on the following considerations, among others: (i) approval of the New Sub-Advisory Agreement and the Amended Management Agreement would permit the fund’s current portfolio managers to continue to be responsible for the day-to-day management of the Fund’s portfolio after the Effective Date as employees of Newton US; (ii) there will be no material changes to the fund’s investment objective, strategies or policies, no reduction in the nature or level of services provided to the fund, and no increases in the management fee payable by the fund as a result of the proposed changes to the investment advisory arrangements; and (iii) the Adviser (and not the fund) will pay Newton US for its sub-investment advisory services. The Board also considered the fact that the Adviser stated that it believes there are no material changes to the information the Board had previously considered at a Board meeting on July 20-21, 2020 (the “15(c) Meeting”), at which the Board re-approved the Current Management Agreement for the ensuing year, other than the information about the Firm Realignment and Newton US.
At the Meeting, the Board members, none of whom are “interested persons” (as defined in the Investment Company Act of 1940, as amended (the “1940 Act”)) of the fund (the “Independent Trusteess”), considered and approved the New Sub-Advisory Agreement and the Amended Management Agreement. In determining whether to approve the New Sub-Advisory Agreement and the Amended Management Agreement, the Board considered the materials prepared by the Adviser received in advance of the Meeting and other information presented at the

INFORMATION ABOUT THE APPROVAL OF THE FUND’S MANAGEMENT AGREEMENT AND APPROVAL OF SUB-INVESTMENT ADVISORY AGREEMENT (Unaudited) (continued)
30
Meeting, which included: (i) a form of the New Sub-Advisory Agreement and a form of the Amended Management Agreement; (ii) information regarding the Firm Realignment and how it is expected to enhance investment capabilities; (iii) information regarding Newton US; and (iv) an opinion of counsel that the proposed changes to the investment advisory arrangements would not result in an “assignment” of the Current Management Agreement under the 1940 Act and the Investment Advisers Act of 1940, as amended, and, therefore, do not require the approval of fund shareholders. The Board also considered the substance of discussions with representatives of the Adviser at the Meeting and the 15(c) Meeting.
Nature, Extent and Quality of Services to be Provided. In examining the nature, extent and quality of the services that were expected to be provided by Newton US to the fund under the New Sub-Advisory Agreement, the Board considered: (i) Newton US’s organization, qualification and background, as well as the qualifications of its personnel; (ii) the expertise of the personnel providing portfolio management services, which would remain the same after the Effective Date; and (iii) the investment strategy for the fund, which would remain the same after the Effective Date. The Board also considered the review process undertaken by the Adviser and the Adviser’s favorable assessment of the nature and quality of the sub-investment advisory services expected to be provided to the fund by Newton US after the Effective Date. Based on their consideration and review of the foregoing information, the Board concluded that the nature, extent and quality of the sub-investment advisory services to be provided by Newton US under the New Sub-Advisory Agreement, as well as Newton US’s ability to render such services based on its resources and the experience of the investment team, which will include the fund’s current portfolio managers, were adequate and appropriate for the fund in light of the fund’s investment objective, and supported a decision to approve the New Sub-Advisory Agreement. The Board also considered, as it related to the Amended Management Agreement, that the nature, extent and quality of the services that are provided by the Adviser are expected to remain the same, including the Adviser’s extensive administrative, accounting and compliance infrastructures, as well as the Adviser’s supervisory activities over the fund’s portfolio management personnel.
Investment Performance. The Board had considered the fund’s investment performance and that of the investment team managing the fund’s portfolio at the 15(c) Meeting (including comparative data provided by Broadridge Financial Solutions, Inc.). The Board considered the performance and that the same investment professionals would continue to manage the fund’s assets after the Effective Date, as factors in evaluating the services to be provided by Newton US under the New Sub-Advisory Agreement after the Effective Date, and determined that these factors, when viewed together with the other factors considered by the Board, supported a decision to approve the New Sub-Advisory Agreement and the Amended Management Agreement.
31
Costs of Services to be Provided and Profitability. The Board considered the proposed fee payable under the New Sub-Advisory Agreement, noting that the proposed fee would be paid by the Adviser and, thus, would not impact the fees paid by the fund or the Adviser’s profitability. The Board considered the fee payable to Newton US in relation to the fee paid to the Adviser by the fund and the respective services provided by Newton US and the Adviser. The Board recognized that, because Newton US’s fee would be paid by the Adviser, and not the fund, an analysis of profitability was more appropriate in the context of the Board’s consideration of the fund’s Current Management Agreement, and that the Board had received and considered a profitability analysis of the Adviser and its affiliates, including Newton US, at the 15(c) Meeting. The Board concluded that the proposed fee payable to Newton US by the Adviser was appropriate and the Adviser’s profitability was not excessive in light of the nature, extent and quality of the services to be provided to the fund by the Adviser under the Amended Management Agreement and Newton US under the New Sub-Advisory Agreement.
Economies of Scale to be Realized. The Board recognized that, because the fee payable to Newton US would be paid by the Adviser, and not the fund, an analysis of economies of scale was more appropriate in the context of the Board’s consideration of the Current Management Agreement, which had been done at the 15(c) Meeting. At the 15(c) Meeting, the Board determined that the economies of scale which may accrue to the Adviser and its affiliates in connection with the management of the fund had been adequately considered by the Adviser in connection with the fee rate charged to the fund pursuant to the Current Management Agreement and that, to the extent in the future it were determined that material economies of scale had not been shared with the fund, the Board would seek to have those economies of scale shared with the fund.
The Board also considered whether there were any ancillary benefits that would accrue to Newton US as a result of its relationship with the fund, and such ancillary benefits, if any, were determined to be reasonable.
In considering the materials and information described above, the Independent Trustees received assistance from, and met separately with, their independent legal counsel, and were provided with a written description of their statutory responsibilities and the legal standards that are applicable to the approval of investment advisory and sub-investment advisory agreements.
After full consideration of the factors discussed above, with no single factor identified as being of paramount importance, the Board members, all of whom are Independent Trustees, with the assistance of independent legal counsel, approved the New Sub-Advisory Agreement and Amended Management Agreement for the fund effective as of the Effective Date.

LIQUIDITY RISK MANAGEMENT PROGRAM (Unaudited)
32
Effective June 1, 2019, the fund adopted a liquidity risk management program (the “Liquidity Risk Management Program”) pursuant to the requirements of Rule 22e-4 under the Investment Company Act of 1940, as amended. Rule 22e-4 requires registered open-end funds, including mutual funds and exchange-traded funds but not money market funds, to establish liquidity risk management programs in order to effectively manage fund liquidity and shareholder redemptions. The rule is designed to mitigate the risk that a fund could not meet redemption requests without significantly diluting the interests of remaining investors.
The rule requires the fund to assess, manage and review their liquidity risk at least annually considering applicable factors such as investment strategy and liquidity during normal and foreseeable stressed conditions, including whether the strategy is appropriate for an open-end fund and whether the fund has a relatively concentrated portfolio or large positions in particular issuers. The fund must also assess its use of borrowings and derivatives, short-term and long-term cash flow projections in normal and stressed conditions, holdings of cash and cash equivalents, and borrowing arrangements and other funding sources.
The rule also requires the fund to classify its investments as highly liquid, moderately liquid, less liquid or illiquid based on the number of days the fund expects it would take to liquidate the investment, and to review these classifications at least monthly or more often under certain conditions. The periods range from three or fewer business days for a highly liquid investment to greater than seven calendar days for settlement of a less liquid investment. Illiquid investments are those a fund does not expect to be able to sell or dispose of within seven calendar days without significantly changing the market value. The fund is prohibited from acquiring an investment if, after the acquisition, its holdings of illiquid assets will exceed 15% of its net assets. In addition, if a fund permits redemptions in-kind, the rule requires the fund to establish redemption in-kind policies and procedures governing how and when it will engage in such redemptions.
Pursuant to the rule’s requirements, the Liquidity Risk Management Program has been reviewed and approved by the Board. Furthermore, the Board has received a written report prepared by the Program’s Administrator that addresses the operation of the Program, assesses its adequacy and effectiveness and describes any material changes made to the Program.
Assessment of Program
In the opinion of the Program Administrator, the Program approved by the Board continues to be adequate for the fund and the Program has been implemented effectively. The Program Administrator has monitored the fund’s liquidity risk and the liquidity classification of the securities held by the fund and has determined that the Program is operating effectively.
During the period from January 1, 2020 to December 31, 2020, there were no material changes to the Program and no material liquidity events that impacted the fund. During the period, the fund held sufficient highly liquid assets to meet fund redemptions.
Under normal expected foreseeable fund redemption forecasts and foreseeable stressed fund redemption forecasts, the Program Administrator believes that the fund maintains sufficient highly liquid assets to meet expected fund redemptions.

33
This page intentionally left blank.
For More Information
BNY Mellon Investment Portfolios, MidCap Stock Portfolio 240 Greenwich Street New York, NY 10286 Adviser BNY Mellon Investment Adviser, Inc. 240 Greenwich Street New York, NY 10286 Custodian The Bank of New York Mellon 240 Greenwich Street New York, NY 10286
Transfer Agent & Dividend Disbursing Agent BNY Mellon Transfer, Inc. 240 Greenwich Street New York, NY 10286 Distributor BNY Mellon Securities Corporation 240 Greenwich Street New York, NY 10286
Telephone 1-800-258-4260 or 1-800-258-4261
Mail The BNY Mellon Family of Funds, 144 Glenn Curtiss Boulevard, Uniondale, NY 11556-0144 Attn: Institutional Services Department
E-mail Send your request to [email protected]
Internet Information can be viewed online or downloaded at www.im.bnymellon.com
The fund files its complete schedule of portfolio holdings with the Securities and Exchange Commission (“SEC”) for the first and third quarters of each fiscal year on Form N-PORT. The fund’s Forms N-PORT are available on the SEC’s website at www.sec.gov.
A description of the policies and procedures that the fund uses to determine how to vote proxies relating to portfolio securities and information regarding how the fund voted these proxies for the most recent 12-month period ended June 30 is available at www.im.bnymellon.com and on the SEC’s website at www.sec.gov and without charge, upon request, by calling 1-800-373-9387.
© 2021 BNY Mellon Securities Corporation 0174SA0621