BMP Construction and Maintenance Costs · Construction cost data were collected and evaluated for...
39
Best Management Practices Construction Costs, Maintenance Costs, and Land Requirements Prepared for Minnesota Pollution Control Agency June 2011 p-gen3-13x
Transcript of BMP Construction and Maintenance Costs · Construction cost data were collected and evaluated for...

Best Management Practices Construction Costs, Maintenance Costs, and Land Requirements Prepared for Minnesota Pollution Control Agency June 2011
p-gen3-13x

Best Management Practices Construction Costs, Maintenance Costs, and Land Requirements Prepared for Minnesota Pollution Control Agency June 2011
4700 West 77th Street Minneapolis, MN 55435-4803 Phone: (952) 832-2600 Fax: (952) 832-2601

Best Management Practices Construction Costs, Maintenance Costs, and Land Requirements Barr Engineering Company P:\Mpls\23 MN\62\23621050 MIDS\WorkFiles\Work Plan 4\MaintenanceNeedsCostsEasements\Report\BMP Construction Cost Maintenance Cost and Land Requirements.docx
i
Best Management Practices Construction Costs, Maintenance Costs, and Land Requirements
June 2011
Table of Contents
1.0 Introduction ............................................................................................................................................ 1
1.1 Introduction and Project Purpose ................................................................................................ 1
2.0 BMPs Evaluated ..................................................................................................................................... 2
2.1 Bioretention Basin/Rainwater Garden without Drain Tile .......................................................... 2
2.2 Biofiltration Basin/Rainwater Garden with Drain Tile ............................................................... 2
2.3 Wet Detention Basin ................................................................................................................... 2
2.4 Constructed Wetlands ................................................................................................................. 3
2.5 Infiltration Trench/Basin ............................................................................................................. 3
2.6 Underground Infiltration ............................................................................................................. 3
2.7 Pervious Pavement ...................................................................................................................... 4
2.8 Grass Swale/Channel .................................................................................................................. 4
3.0 BMP Cost Factors & Methodology ....................................................................................................... 6
3.1 Construction Costs ...................................................................................................................... 6
3.1.1 Data Uncertainty ............................................................................................................ 6
3.1.2 Approach to Normalizing and Reporting Data .............................................................. 6
3.1.2.1 Unit Construction Costs .................................................................................. 6 3.1.2.2 Regional Adjustment Factors .......................................................................... 7 3.1.2.3 Price Adjustment Factors ................................................................................ 7 3.1.2.4 Data Standard Deviation ................................................................................. 7
3.1.3 Research Results Discussion .......................................................................................... 8
3.2 Annual Maintenance Costs ....................................................................................................... 10
3.2.1 Data Limitations and Uncertainty ................................................................................ 11
3.2.2 Approach to Normalizing and Reporting Data ............................................................ 11
4.0 Estimator Models ................................................................................................................................. 12
4.1 Estimator Models ...................................................................................................................... 12
4.1.1 1999 USEPA Study...................................................................................................... 12
4.1.2 2003 UNC Study .......................................................................................................... 12
4.1.3 2005 MnDOT Report ................................................................................................... 12
4.2. Comparison of Collected Data with Estimator Models ............................................................ 14
4.2.1 Construction Cost Comparison .................................................................................... 14
4.2.2 Annual Maintenance Cost Comparison ....................................................................... 16

Best Management Practices Construction Costs, Maintenance Costs, and Land Requirements Barr Engineering Company P:\Mpls\23 MN\62\23621050 MIDS\WorkFiles\Work Plan 4\MaintenanceNeedsCostsEasements\Report\BMP Construction Cost Maintenance Cost and Land Requirements.docx
ii
4.2.3 Land Area Comparison ................................................................................................ 16
5.0 Land Area Requirements ..................................................................................................................... 18
5.1 Introduction and Research Approach ........................................................................................ 18
5.2 Land Area Requirements for Structural BMPs ......................................................................... 18
5.2.1 O&M Responsibility Policy ......................................................................................... 18
5.2.2 Area Requirements ...................................................................................................... 19
5.3 Vegetated Buffer Requirements ................................................................................................ 20
6.0 MIDS Calculator .................................................................................................................................. 21
References ................................................................................................................................................... 22

Best Management Practices Construction Costs, Maintenance Costs, and Land Requirements Barr Engineering Company P:\Mpls\23 MN\62\23621050 MIDS\WorkFiles\Work Plan 4\MaintenanceNeedsCostsEasements\Report\BMP Construction Cost Maintenance Cost and Land Requirements.docx
iii
List of Tables
Table 1 Summary of Construction Cost Data Collected ................................................................ 9Table 2 Summary of Annual Maintenance Cost Data Collected. ................................................. 10Table 3 Summary of BMP Construction Costs from Estimator Models ....................................... 13Table 4 Summary of Annual BMP Maintenance Costs from Estimator Models ........................... 13Table 5 Summary of BMP Land Areas from Estimator Models .................................................. 14Table 6 Comparison of Construction Cost Estimator Models to Study Data ................................ 15Table 7 Comparison of Maintenance Cost Estimator Models to Study Data ................................ 16Table 8 Comparison of BMP Land Cost Estimator Models to Study Data ................................... 17
List of Appendices
Appendix A BMP Cost Survey Data Tables
Appendix B Land Requirements (Easements) for Stormwater BMPs

Best Management Practices Construction Costs, Maintenance Costs, and Land Requirements Barr Engineering Company P:\Mpls\23 MN\62\23621050 MIDS\WorkFiles\Work Plan 4\MaintenanceNeedsCostsEasements\Report\BMP Construction Cost Maintenance Cost and Land Requirements.docx
1
1.0 Introduction
1.1 Introduction and Project Purpose In this MIDS task, Barr was asked to summarize a typical range of low-impact development
stormwater management best management practices (BMPs) costs. Barr identified a range of
typical construction and operating costs for eight1
In order to develop a basis for estimating the life cycle costs of stormwater BMP implementation,
readily available data from construction projects and other studies were examined. Barr project files
and other public information were used to compile a list of project data that included cost and basic
design information. Few data sets included maintenance or land costs. The data sources used vary
considerably in where and when they occurred. A major element of this effort was to normalize
the data for 2010 Minnesota costs.
structural BMP categories that support low-
impact development. We used these costs and the expected longevity of the BMP to estimate life
cycle costs for these stormwater BMPs.
In addition to summarizing construction cost data, the data was compared to available cost models
that have been developed by the U.S. Environmental Protection Agency (USEPA), the Minnesota
Department of Transportation (MnDOT), and the University of North Carolina. This provided a
method of benchmarking the data collected. Use of predictive models was also used for maintenance
costs and land area requirements. Because of the paucity of data for maintenance costs and land area,
these models provide the greatest source of information for developing life-cycle cost estimates.
Land costs are not included in the life-cycle cost estimates. BMP land costs are dependent on
parcel-specific land costs and land costs vary widely throughout the state and with zoning
classification. Instead of including land costs with the BMP life-cycle cost estimates, Barr
identified and summarized land requirements for the different structural BMP types. Land
requirements depend not only on the size of the BMP, but also on the easement requirements of
the permitting authority. Based on a review of the regulatory requirements and interviews with six
Minnesota cities, Barr determined that the land area required for easements is a small component
of the overall land area needed for each BMP type.
1 The scope of work was for only six BMP categories. However, research sources included data on additional BMP types and this information was added into our database for this project.

Best Management Practices Construction Costs, Maintenance Costs, and Land Requirements Barr Engineering Company P:\Mpls\23 MN\62\23621050 MIDS\WorkFiles\Work Plan 4\MaintenanceNeedsCostsEasements\Report\BMP Construction Cost Maintenance Cost and Land Requirements.docx
2
2.0 BMPs Evaluated
Construction cost data were collected and evaluated for eight structural Best management Practices
(BMPs) categories. These types are described in this section. Each BMP is described using generally
accepted definitions found in the literature. The BMPs on which data were collected are consistent
with these definitions; however, there may be some variation on the size of the BMPs compared to
the typical size ranges included in the definitions below. Water quality treatment volumes are also
discussed for each BMP. These water quality treatment volumes were used to compare BMP costs to
one another.
2.1 Bioretention Basin/Rainwater Garden without Drain Tile A bioretention basin is a natural or constructed impoundment with permeable soils that captures,
temporarily stores, and infiltrates the design volume of stormwater runoff within 48 hours (24 hours
within a trout stream watershed). These facilities typically include vegetation. For the purposes of
this study, the water quality treatment volume of a bioretention basin is considered to be the total
holding capacity below the outlet or overflow elevation of the basin.
2.2 Biofiltration Basin/Rainwater Garden with Drain Tile Biofiltration basins are nearly identical to bioretention basins. The only difference is the addition of
a drain tile below the designed filtration media. Filtration basins are often used in areas of potential
stormwater “hot-spots2
2.3 Wet Detention Basin
,” where groundwater recharge is undesirable, or areas with very low
infiltration rates in the underlying soil. As with bioretention basins, the water quality treatment
volume is considered the total holding capacity below the outlet or overflow elevation of the basin.
These facilities capture a volume of runoff and retain that volume until it is displaced in part or in
total by the next runoff event. Wet detention basins maintain a significant permanent pool of water
between runoff events. Wet detention basins that conform to National Urban Runoff Pollution
(NURP) criteria have permanent pools with average depths of four to ten feet and volumes below the
normal pond outlet that are greater than or equal to the runoff from a 2.5-inch 24-hour storm over the
2 See MID Memorandum: Identify Restrictions for MIDS Practices to Protect Groundwater and Prevent Sinkholes.

Best Management Practices Construction Costs, Maintenance Costs, and Land Requirements Barr Engineering Company P:\Mpls\23 MN\62\23621050 MIDS\WorkFiles\Work Plan 4\MaintenanceNeedsCostsEasements\Report\BMP Construction Cost Maintenance Cost and Land Requirements.docx
3
entire contributing drainage area. These basins utilize gravity settling as the major pollutant removal
mechanism but nutrient and organic removal can be achieved through aquatic vegetation and
microorganism uptake. For the purposes of this study, the water quality treatment volume of a wet
detention basin is considered to be the total holding capacity below the permanent pool (dead
storage). Wet detention basins are not considered stormwater volume control devices.
2.4 Constructed Wetlands Constructed wetlands are similar to wet detention basins, except they are shallower and the bottom is
planted with wetland vegetation. Constructed wetlands remove pollutants through contact time with
the permanent pool of water and vegetation uptake. Constructed wetlands typically require large
areas to allow for adequate storage volumes and long flow paths. The Minnesota Stormwater Manual
recommends that a minimum of 35% of the total wetland surface area should have a depth of 6
inches or less and 10% to 20% of the surface area should be a deep pool (1.5 to 6 foot depth). For the
purposes of this study, the water quality treatment volume of a constructed wetland is estimated as
the surface area of the wetland multiplied by 18 inches. This estimate is needed to develop a water
quality treatment volume for many of the projects samples.
2.5 Infiltration Trench/Basin An infiltration trench is a shallow excavated trench, typically 3 to 12 feet deep, that is backfilled with
a coarse stone aggregate, allowing for the temporary storage of runoff in the void space of the
material. Discharge of this stored runoff occurs through infiltration into the surrounding naturally
permeable soil. Trenches are commonly used for drainage areas less than five acres in size.
An infiltration basin is a natural or constructed impoundment that captures, temporarily stores and
infiltrates the design volume of water over several days. Infiltration basins are commonly used for
drainage areas of 5 to 50 acres with land slopes that area less than 20 percent. Typical depths range
from 2 to 12 feet, including bounce in the basin.
For the purposes of this study, the water quality treatment volume of an infiltration basin or trench is
considered the total holding capacity below any outlet or overflow.
2.6 Underground Infiltration In underground infiltration, storage tanks are either incorporated directly into or before the storm
sewer system. If the storage systems are completely enclosed, stormwater is released at a controlled
rate to a sewer system or open water course, and no stormwater volume is lost. If the storage systems

Best Management Practices Construction Costs, Maintenance Costs, and Land Requirements Barr Engineering Company P:\Mpls\23 MN\62\23621050 MIDS\WorkFiles\Work Plan 4\MaintenanceNeedsCostsEasements\Report\BMP Construction Cost Maintenance Cost and Land Requirements.docx
4
are bottomless or perforated, they will allow infiltration and reduce stormwater volume leaving a site.
For the purposes of this study, the water quality treatment volume of an underground infiltration
system is estimated as its hold capacity before discharging to a sewer system or open water course.
2.7 Pervious Pavement Pervious pavements can be subdivided into three general categories:
1) Porous Pavements – porous surfaces that infiltrate water across the entire surface (i.e., porous
asphalt and pervious concrete pavements);
2) Permeable Pavers – impermeable modular blocks or grids separated by spaces or joints that
water drains through (i.e., block pavers, plastic grids, etc.);
3) Reinforced Soil – soil reinforced with a system of modular cells added to the surface soil to
increase the bearing capacity of soil, maintain soil structure, and prevent compaction. Modular
cells are typically concrete or plastic and are filled with either topsoil to support turf grass or
gravel. They are most commonly used for seasonal (summer) parking and fire lanes. There are
many different types of modular systems available from different manufacturers.
For the purposes of this study, the water quality treatment volume of a pervious pavement is the void
space of the engineered base below the paving surface. This base is typically uniformly sized
crushed rock.
2.8 Grass Swale/Channel Grass channels are designed primarily to convey stormwater runoff. Typical specifications include a
runoff velocity target of 1 foot per second small storms and the ability to handle the peak discharge
from a 2-year, 10-year, or 100-year design storm. Estimating a treatment volume for grass channels is
problematic because most channels are built to meet flow rate needs and available data does not
include sufficient detail to estimate treatment volume. Grass swales are typically considered a water
quality BMP, not a volume control BMP. The velocity in the swale must be low enough to allow
sediment to drop out. There can be some infiltration along the length of the swale but this is highly
dependent on surface soils and the duration of flow in the swale, which is generally too short for
appreciable infiltration.

Best Management Practices Construction Costs, Maintenance Costs, and Land Requirements Barr Engineering Company P:\Mpls\23 MN\62\23621050 MIDS\WorkFiles\Work Plan 4\MaintenanceNeedsCostsEasements\Report\BMP Construction Cost Maintenance Cost and Land Requirements.docx
5
Significant stormwater volume reductions can be created by placing check dams across the swale. A
grass swale with check dams functions similar to a series of bioretention basins and should be viewed
accordingly.

Best Management Practices Construction Costs, Maintenance Costs, and Land Requirements Barr Engineering Company P:\Mpls\23 MN\62\23621050 MIDS\WorkFiles\Work Plan 4\MaintenanceNeedsCostsEasements\Report\BMP Construction Cost Maintenance Cost and Land Requirements.docx
6
3.0 BMP Cost Factors & Methodology
3.1 Construction Costs Actual construction costs were used to calculate construction cost per water quality volume, as
defined in Section 2 for each BMP. Construction cost information from an assortment of locations
and owners was used.
3.1.1 Data Uncertainty The construction data collected varies considerably in its detail and comprehensiveness. Costs for
design, geotechnical testing, legal fees, and other unexpected or additional costs are not usually
included in the reports and are not included in the construction costs listed in this memo. Uncertainty
in these construction cost estimates can come from this variable project related data and from factors
such as complexity of design details, variation in local regulatory requirements, unreported soil
conditions, and other site specifics. For example, variable design parameters that could affect the
total construction cost include pond side slopes, depth and free board on ponds, total wet pond
volume, outlet structure configuration, the need for retaining walls, and other site specific variables.
These details are generally not reported in the data collected.
Another source of uncertainly is a relatively few data sources for some of the BMP categories. For
example, biofiltration devices are lacking in readily available project specific data and are only
represented by two data sources.
Any use of the data set or derivations of it should consider the high level of uncertainty involved.
3.1.2 Approach to Normalizing and Reporting Data The considerable spread in time, space, and size of the projects reporting data, leads to the need for
some normalization of the data. The data were adjusted to account for these factors as described
below.
3.1.2.1 Unit Construction Costs
With an eye toward the potential of producing a calculator for developing cost estimates for BMPs,
the various data points have been “normalized” for project size and scope by dividing the cost by the
water quality treatment volume. This results in a construction cost per cubic foot of water quality
treatment. This unit cost accounts for the size of the project and might provide a convenient basis
for cost estimation. For example, a developer could develop an estimate of water volume to be

Best Management Practices Construction Costs, Maintenance Costs, and Land Requirements Barr Engineering Company P:\Mpls\23 MN\62\23621050 MIDS\WorkFiles\Work Plan 4\MaintenanceNeedsCostsEasements\Report\BMP Construction Cost Maintenance Cost and Land Requirements.docx
7
treated based on one of many watershed runoff models and local regulations, and then apply it
directly to these normalized estimates for individual BMPs.
3.1.2.2 Regional Adjustment Factors
The data for this study was normalized by region using regional cost factors reported in Weiss, P.T.,
J. S. Gulliver and A. J. Erickson, (2005), U.S. Environmental Protection Agency (1999), and first
published by the American Public Works Association in 1992. All of the data were normalized to the
region that includes Minnesota. All of the data statistics then are in “Minnesota” dollars.
3.1.2.3 Price Adjustment Factors
The construction costs reported have also been translated to 2010 dollars. This was done using the
Consumer Price Index (CPI) history as reported by the U.S. Bureau of Labor Statistics. The CPI is a
wide spectrum index that closely parallels the various construction price indices available.
3.1.2.4 Data Standard Deviation
The uncertainty and the small sample size of some of these data categories make statistical analyses
suspect. The standard deviation for each data sample is reported here to indicate the level of variation
within the individual data sets. For data populations with a normal distribution, one standard
deviation above and below the average would encompass about 68% of the data. The figure below
shows a plot of a normal distribution (or bell curve). Each colored band has a width of one standard
deviation.
The construction cost data collected for this study are probably not normally distributed. Weiss et al.
suggested that a log normal distribution would better fit construction cost data. In that case,
confidence interval calculations are not straight forward.
Best Management Practices Construction Costs, Maintenance Costs, and Land Requirements Barr Engineering Company P:\Mpls\23 MN\62\23621050 MIDS\WorkFiles\Work Plan 4\MaintenanceNeedsCostsEasements\Report\BMP Construction Cost Maintenance Cost and Land Requirements.docx
8
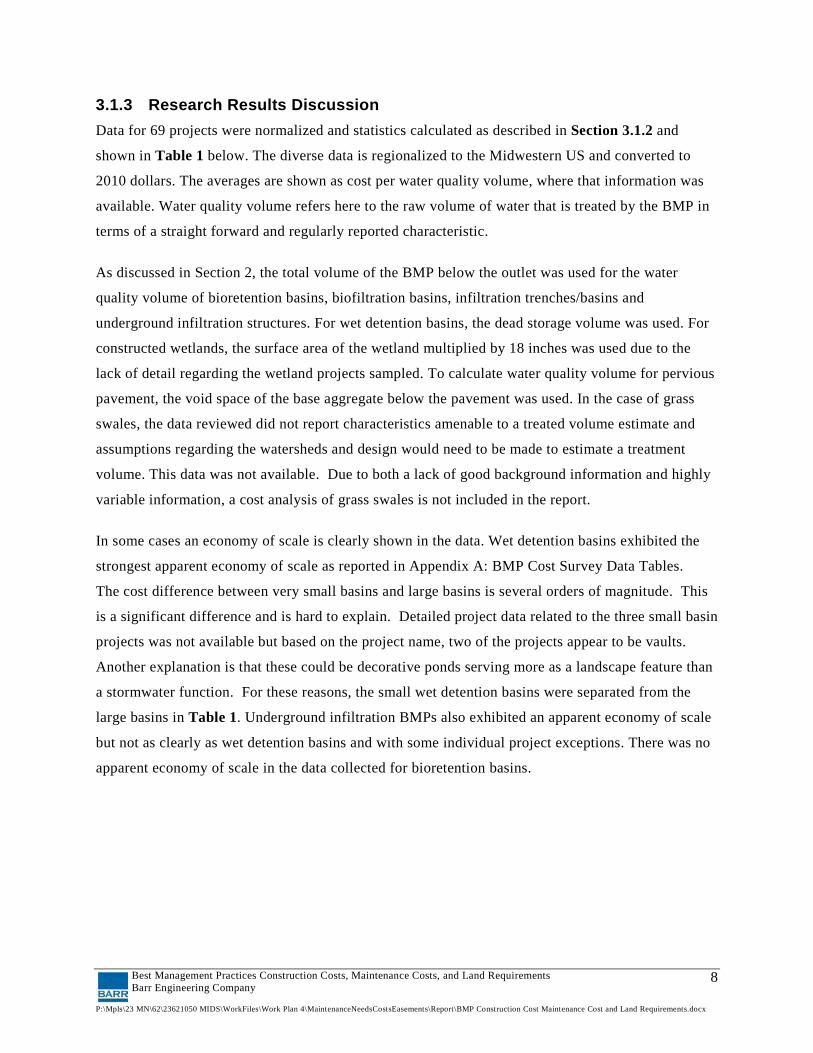
3.1.3 Research Results Discussion Data for 69 projects were normalized and statistics calculated as described in Section 3.1.2 and
shown in Table 1 below. The diverse data is regionalized to the Midwestern US and converted to
2010 dollars. The averages are shown as cost per water quality volume, where that information was
available. Water quality volume refers here to the raw volume of water that is treated by the BMP in
terms of a straight forward and regularly reported characteristic.
As discussed in Section 2, the total volume of the BMP below the outlet was used for the water
quality volume of bioretention basins, biofiltration basins, infiltration trenches/basins and
underground infiltration structures. For wet detention basins, the dead storage volume was used. For
constructed wetlands, the surface area of the wetland multiplied by 18 inches was used due to the
lack of detail regarding the wetland projects sampled. To calculate water quality volume for pervious
pavement, the void space of the base aggregate below the pavement was used. In the case of grass
swales, the data reviewed did not report characteristics amenable to a treated volume estimate and
assumptions regarding the watersheds and design would need to be made to estimate a treatment
volume. This data was not available. Due to both a lack of good background information and highly
variable information, a cost analysis of grass swales is not included in the report.
In some cases an economy of scale is clearly shown in the data. Wet detention basins exhibited the
strongest apparent economy of scale as reported in Appendix A: BMP Cost Survey Data Tables.
The cost difference between very small basins and large basins is several orders of magnitude. This
is a significant difference and is hard to explain. Detailed project data related to the three small basin
projects was not available but based on the project name, two of the projects appear to be vaults.
Another explanation is that these could be decorative ponds serving more as a landscape feature than
a stormwater function. For these reasons, the small wet detention basins were separated from the
large basins in Table 1. Underground infiltration BMPs also exhibited an apparent economy of scale
but not as clearly as wet detention basins and with some individual project exceptions. There was no
apparent economy of scale in the data collected for bioretention basins.

Best Management Practices Construction Costs, Maintenance Costs, and Land Requirements Barr Engineering Company P:\Mpls\23 MN\62\23621050 MIDS\WorkFiles\Work Plan 4\MaintenanceNeedsCostsEasements\Report\BMP Construction Cost Maintenance Cost and Land Requirements.docx
9
Table 1 Summary of Construction Cost Data Collected
BMP name Number of
BMPs Cost per Average cost ($)
Sample standard deviation
Bioretention Basins 11 Water quality
volume/ft3 15 9
Biofiltration Basins 2 Water quality
volume/ft3 58 61
Large Wet Detention Basins treating more than 100,000 ft3 5
Water quality volume/ft3 2 2
Small Detention Basins treating less than 10,000 ft3 3
Water quality volume/ft3 145 42
Constructed Wetlands 4 Water quality
volume/ft3 1 1.5
Infiltration Trenches 8 Water quality
volume/ft3 11 30
Infiltration Basins 6 Water quality
volume/ft3 21 15
Underground Infiltration 8 Water quality
volume/ft3 213 372
Pervious Pavement 7 Water quality
volume/ft3 16 8

Best Management Practices Construction Costs, Maintenance Costs, and Land Requirements Barr Engineering Company P:\Mpls\23 MN\62\23621050 MIDS\WorkFiles\Work Plan 4\MaintenanceNeedsCostsEasements\Report\BMP Construction Cost Maintenance Cost and Land Requirements.docx
10
3.2 Annual Maintenance Costs Of the 69 BMPs presented in Table 1, 25 included annual maintenance costs. The data are
regionalized to the Midwestern U.S., converted to 2010 dollars, and summarized below.
Table 2 Summary of Annual Maintenance Cost Data Collected.
BMP name Number of BMPs Cost per
Average annual maintenance cost
($) Sample standard
deviation
Bioretention Basins 8 Water quality
volume/ft3 1.25 1.18
Biofiltration Basins 0 Water quality
volume/ft3 No data -
Large Wet Detention Basins treating more than 100,000 ft3 4
Water quality volume/ft3 0.07 0.10
Small Wet Detention Basins treating less than 10,000 ft3 0
Water quality volume/ft3 No data -
Constructed Wetlands 0 Water quality
volume/ft3 No data -
Infiltration Trenches 8 Water quality
volume/ft3 0.39 0.11
Infiltration Basins 6 Water quality
volume/ft3 No data
Underground Infiltration 4 Water quality
volume/ft3 1.26 2.16
Pervious Pavement 0 Water quality
volume/ft3 No data -

Best Management Practices Construction Costs, Maintenance Costs, and Land Requirements Barr Engineering Company P:\Mpls\23 MN\62\23621050 MIDS\WorkFiles\Work Plan 4\MaintenanceNeedsCostsEasements\Report\BMP Construction Cost Maintenance Cost and Land Requirements.docx
11
3.2.1 Data Limitations and Uncertainty The data collected varies considerably in its detail and comprehensiveness. This leads to
undocumented variability in the data from factors such as design detail, variation in local regulatory
requirements, unreported soil conditions, and other site specifics. For example, variable maintenance
parameters that could affect maintenance costs include soil conditions, land use within the tributary
watershed, plant selection, precipitation patterns, and other site specific variables. With few
exceptions, these details are generally not reported in the data available. As a whole, the maintenance
cost data collected lists the maintenance costs as a lump sum without detailed breakdown or
discussion.
Another source of uncertainly is a relative few data sources for some of the BMP categories. For
example, constructed wetlands are lacking in readily available project-specific data and are
represented by four data sources. Any use of the data set or derivations of it should consider the high
level of uncertainty involved.
3.2.2 Approach to Normalizing and Reporting Data The data for annual maintenance cost was normalized for region and for the date it was reported.
Regional bias was adjusted using regional cost factors reported in Weiss, P.T., J. S. Gulliver and A.
J. Erickson, (2005), U.S. Environmental Protection Agency (1999), and first published by the
American Public Works Association in 1992. All of the data were normalized to the region that
includes Minnesota.
The maintenance costs reported have also been translated to 2010 dollars. This was done using the
Consumer Price Index (CPI) history as reported by the U.S. Bureau of Labor Statistics. The CPI is a
wide spectrum index that closely parallels the various construction price indices available.

Best Management Practices Construction Costs, Maintenance Costs, and Land Requirements Barr Engineering Company P:\Mpls\23 MN\62\23621050 MIDS\WorkFiles\Work Plan 4\MaintenanceNeedsCostsEasements\Report\BMP Construction Cost Maintenance Cost and Land Requirements.docx
12
4.0 Estimator Models
4.1 Estimator Models 4.1.1 1999 USEPA Study The U.S. Environmental Protection Agency’s (USEPA) Engineering and Analysis Division
conducted a study on stormwater best management practices during 1997 and 1998. The report:
Preliminary Data Summary of Urban Storm Water Best Management Practices
This study has often been referred to and built upon in subsequent studies, including those surveyed
here. The USEPA study cost estimation methods were examined for comparison with the results here.
, (EPA-821-R-99-012)
was published in August 1999. In addition to summarizing existing information and data regarding
the effectiveness of BMPs to control and reduce pollutants in urban stormwater, the report provides a
synopsis of the expected costs and environmental benefits of BMPs and identifies information gaps
as well. It includes simple methods for estimating costs for construction and maintenance of
stormwater BMPs.
4.1.2 2003 UNC Study Ada Wossink and Bill Hunt of the University of North Carolina (UNC) examined the costs of BMPs
including both installation (construction and land) and annual operating costs (inspection and
maintenance) in The Economics of Structural Stormwater BMPs in North Carolina
4.1.3 2005 MnDOT Report
(UNC-WRRI-
2003-344) in 2003. For the UNC study, construction costs and annual operating costs are statistically
analyzed for effects of scale by means of BMP specific nonlinear equations relating the costs to
watershed size. Annual costs were related to the area treated and to the removal effectiveness of the
specific BMP for an economic evaluation. The cost relationships were given in terms of watershed
area, which then requires assumptions regarding runoff characteristics to arrive at a treatment
volume. For this reason, a comparison with the results of the UNC study was not done for
construction or maintenance cost data collected for this study. However, the UNC study also provides
land area requirement estimates that are compared with the data collected for this study.
In 2005, the Minnesota Department of Transportation (MnDOT) published work by Peter T. Weiss
and John S. Gulliver titled The Cost and Effectiveness of Stormwater Management Practices. In
examining the cost effectiveness of various BMPs, collected data were used to derive relationships
between cost and water quality volume to estimate construction and maintenance costs. This study’s
Best Management Practices Construction Costs, Maintenance Costs, and Land Requirements Barr Engineering Company P:\Mpls\23 MN\62\23621050 MIDS\WorkFiles\Work Plan 4\MaintenanceNeedsCostsEasements\Report\BMP Construction Cost Maintenance Cost and Land Requirements.docx
13
cost relationships are examined for comparison with the results here, and suggested as a surrogate for
missing data on maintenance found in readily available data.
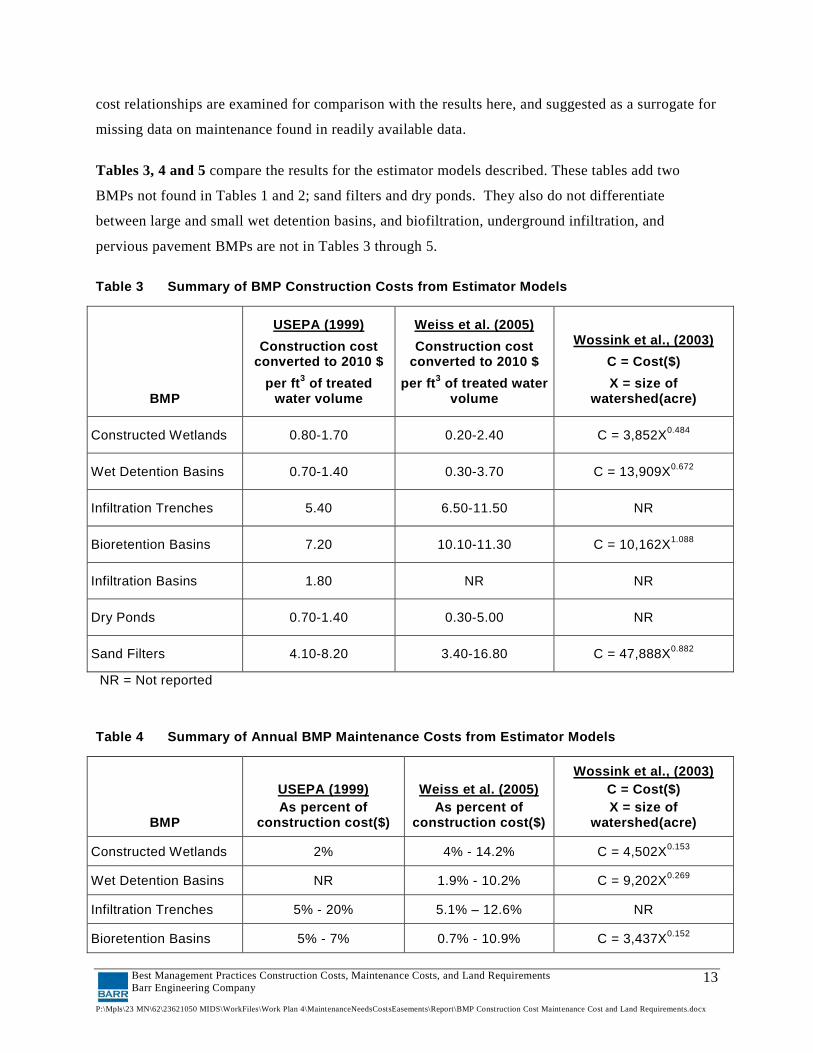
Tables 3, 4 and 5 compare the results for the estimator models described. These tables add two
BMPs not found in Tables 1 and 2; sand filters and dry ponds. They also do not differentiate
between large and small wet detention basins, and biofiltration, underground infiltration, and
pervious pavement BMPs are not in Tables 3 through 5.
Table 3 Summary of BMP Construction Costs from Estimator Models
BMP
Construction cost converted to 2010 $
USEPA (1999)
per ft3 of treated water volume
Construction cost converted to 2010 $
Weiss et al. (2005)
per ft3 of treated water volume
C = Cost($) Wossink et al., (2003)
X = size of watershed(acre)
Constructed Wetlands 0.80-1.70 0.20-2.40 C = 3,852X0.484
Wet Detention Basins 0.70-1.40 0.30-3.70 C = 13,909X0.672
Infiltration Trenches 5.40 6.50-11.50 NR
Bioretention Basins 7.20 10.10-11.30 C = 10,162X1.088
Infiltration Basins 1.80 NR NR
Dry Ponds 0.70-1.40 0.30-5.00 NR
Sand Filters 4.10-8.20 3.40-16.80 C = 47,888X0.882
NR = Not reported Table 4 Summary of Annual BMP Maintenance Costs from Estimator Models
BMP As percent of
construction cost($)
USEPA (1999) As percent of
construction cost($)
Weiss et al. (2005) C = Cost($) Wossink et al., (2003)
X = size of watershed(acre)
Constructed Wetlands 2% 4% - 14.2% C = 4,502X0.153
Wet Detention Basins NR 1.9% - 10.2% C = 9,202X0.269
Infiltration Trenches 5% - 20% 5.1% – 12.6% NR
Bioretention Basins 5% - 7% 0.7% - 10.9% C = 3,437X0.152

Best Management Practices Construction Costs, Maintenance Costs, and Land Requirements Barr Engineering Company P:\Mpls\23 MN\62\23621050 MIDS\WorkFiles\Work Plan 4\MaintenanceNeedsCostsEasements\Report\BMP Construction Cost Maintenance Cost and Land Requirements.docx
14
BMP As percent of
construction cost($)
USEPA (1999) As percent of
construction cost($)
Weiss et al. (2005) C = Cost($) Wossink et al., (2003)
X = size of watershed(acre)
Infiltration Basins 1% - 10% 2.8% - 4.9% NR
Dry Ponds <1% 1.8% - 2.7% NR
Sand Filters 11% -13% 0.9% - 9.5% C = 10,556X0.534
NR = Not reported
Table 5 Summary of BMP Land Areas from Estimator Models
BMP As percent of tributary
impervious area
USEPA (1999) As percent of
construction cost
Weiss et al. (2005) SA = Surface Area(acre) Wossink et al., (2003)
X = size of watershed(acre)
Constructed Wetlands 3-5% NR SA=0.01X (1%)
Wet Detention Basins 2-3% NR SA=0.0075X (0.75%)
Infiltration Trenches 2-3% NR NR
Bioretention Basins 5% NR SA=0.015X (1.5%)
Infiltration Basins 2-3% NR NR
Dry Ponds 2-3% NR NR
Sand Filters 0%-3% NR NR
NR = Not reported
4.2. Comparison of Collected Data with Estimator Models 4.2.1 Construction Cost Comparison The construction cost data collected for this study were compared to data and analyses done by Weiss
et al. (2005), and USEPA (1999). Most BMP costs reported in those studies compare well with the
data collected here (Table 1) but there are a few large deviations and a few BMPs have a wide range
of costs (more than one order of magnitude and high standard deviations). This fact illustrates the
difficulty of generalizing BMP construction costs. These costs should be used for general estimating
purposes. More detailed analysis of the site conditions and design variables for each project will
produce more accurate numbers.
Table 6 shows that for constructed wetlands, large wet detention basins, infiltration trenches, and
sand filters, these three sources are relatively consistent. This study shows a significant cost

Best Management Practices Construction Costs, Maintenance Costs, and Land Requirements Barr Engineering Company P:\Mpls\23 MN\62\23621050 MIDS\WorkFiles\Work Plan 4\MaintenanceNeedsCostsEasements\Report\BMP Construction Cost Maintenance Cost and Land Requirements.docx
15
difference between large and small wet detention basins. The small wet detention basin number is
too high. Based on experience, it should be no more than ten times the cost of the large basin. The
large difference could be due to many unknown variables including the possibility that land costs
could be included, or the small basins are lined and serve more as a decorative landscape feature than
a utilitarian stormwater pond.
The cost data collected for this study for biofiltration basins is about four times higher than for
bioretention basins. The design of the two BMPs is very similar. The primary difference is the drain
tile in the biofiltration BMP. This will not increase the cost four times. Typically, a biofiltration
basin cost should not be more than 25% higher than a bioretention basin.
Construction costs for infiltration basins identified in this study were significantly higher than those
identified in other studies. The high cost may be due to the small sample size for the data collected
for this study or reflect a tendency toward higher costs in a set of California transportation projects,
which represent five of the six data points for infiltration basins. However, the low cost reported by
the USEPA study seems too low when compared to other somewhat similar BMPs, such as
bioretention basins. A cost near the middle of the two numbers is likely the most accurate.
Table 6 Comparison of Construction Cost Estimator Models to Study Data
NR = Not reported
BMP
Construction cost converted to 2010 $
USEPA (1999)
per ft3 of treated water volume
Construction cost converted to 2010 $
Weiss et al. (2005)
per ft3 of treated water volume
Construction cost converted to 2010 $
This study
per ft3 of treated water volume
Constructed Wetlands 0.8-1.7 0.2-2.4 1.
Large Wet Detention Basins
0.7-1.4 0.3-3.7 2.
Infiltration Trenches 5.4 6.5-11.5 11.
Bioretention Basins 7.2 10.1-11.3 15.
Pervious Pavement NR NR 16.
Infiltration Basins 1.80 NR 21.
Dry Ponds 0.7-1.4 0.3-5.0 NR
Sand Filters 4.1-8.2 3.4-16.8 15.
Best Management Practices Construction Costs, Maintenance Costs, and Land Requirements Barr Engineering Company P:\Mpls\23 MN\62\23621050 MIDS\WorkFiles\Work Plan 4\MaintenanceNeedsCostsEasements\Report\BMP Construction Cost Maintenance Cost and Land Requirements.docx
16
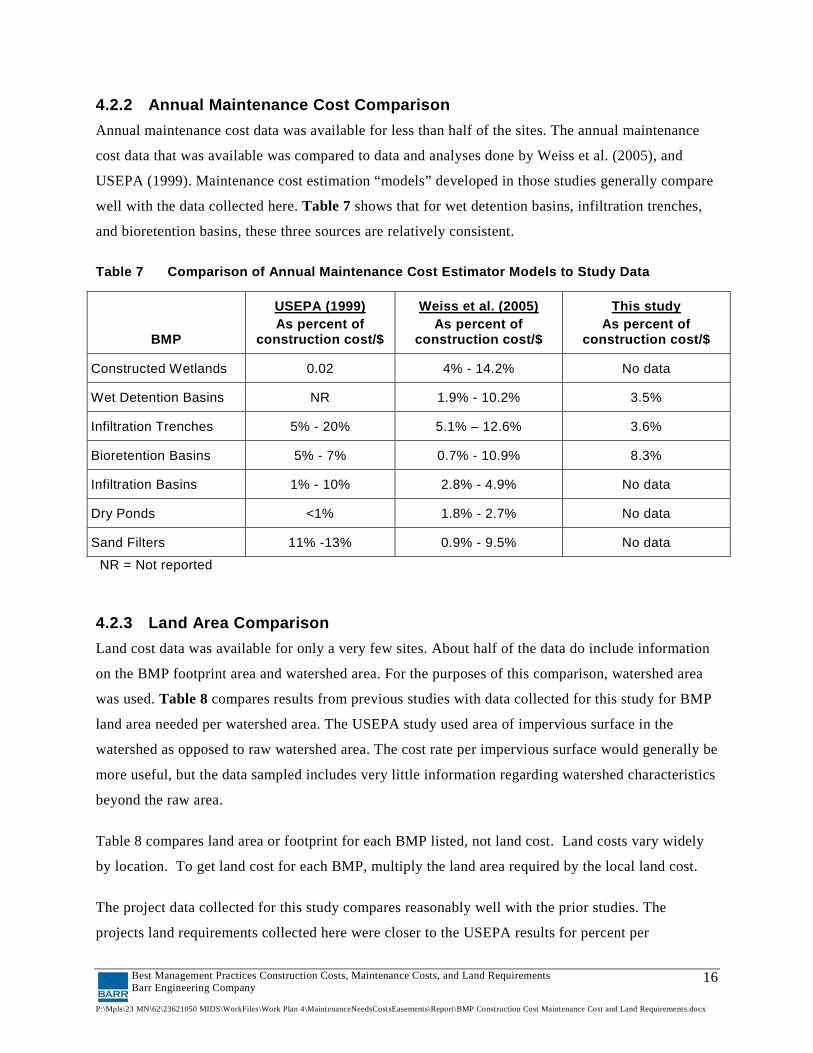
4.2.2 Annual Maintenance Cost Comparison Annual maintenance cost data was available for less than half of the sites. The annual maintenance
cost data that was available was compared to data and analyses done by Weiss et al. (2005), and
USEPA (1999). Maintenance cost estimation “models” developed in those studies generally compare
well with the data collected here. Table 7 shows that for wet detention basins, infiltration trenches,
and bioretention basins, these three sources are relatively consistent.
Table 7 Comparison of Annual Maintenance Cost Estimator Models to Study Data
BMP As percent of
construction cost/$
USEPA (1999) As percent of
construction cost/$
Weiss et al. (2005) As percent of
construction cost/$
This study
Constructed Wetlands 0.02 4% - 14.2% No data
Wet Detention Basins NR 1.9% - 10.2% 3.5%
Infiltration Trenches 5% - 20% 5.1% – 12.6% 3.6%
Bioretention Basins 5% - 7% 0.7% - 10.9% 8.3%
Infiltration Basins 1% - 10% 2.8% - 4.9% No data
Dry Ponds <1% 1.8% - 2.7% No data
Sand Filters 11% -13% 0.9% - 9.5% No data
NR = Not reported
4.2.3 Land Area Comparison Land cost data was available for only a very few sites. About half of the data do include information
on the BMP footprint area and watershed area. For the purposes of this comparison, watershed area
was used. Table 8 compares results from previous studies with data collected for this study for BMP
land area needed per watershed area. The USEPA study used area of impervious surface in the
watershed as opposed to raw watershed area. The cost rate per impervious surface would generally be
more useful, but the data sampled includes very little information regarding watershed characteristics
beyond the raw area.
Table 8 compares land area or footprint for each BMP listed, not land cost. Land costs vary widely
by location. To get land cost for each BMP, multiply the land area required by the local land cost.
The project data collected for this study compares reasonably well with the prior studies. The
projects land requirements collected here were closer to the USEPA results for percent per

Best Management Practices Construction Costs, Maintenance Costs, and Land Requirements Barr Engineering Company P:\Mpls\23 MN\62\23621050 MIDS\WorkFiles\Work Plan 4\MaintenanceNeedsCostsEasements\Report\BMP Construction Cost Maintenance Cost and Land Requirements.docx
17
impervious area in the watersheds. This may be due to the apparent tendency of the reported projects
to have high impervious rates in watersheds, such as road-related and institutional projects. It
probably also has root in the general variability in the data described in Section 3.2.1.
Table 8 Comparison of BMP Land Area Estimator Models to Study Data
BMP As percent of
impervious area
USEPA (1999) As percent of
watershed area
Wossink et al., (2003) As percent of
watershed area
This study
Constructed Wetlands 3-5% 1% 6.5%
Wet Detention Basins 2-3% 0.75% 2.2%
Infiltration Trenches 2-3% NR No data
Bioretention Basins 5% 1.5% 4.1%
Infiltration Basins 2-3% NR 2.4%
Dry Ponds 2-3% NR No data
Sand Filters 0%-3% NR No data
NR = Not reported

Best Management Practices Construction Costs, Maintenance Costs, and Land Requirements Barr Engineering Company P:\Mpls\23 MN\62\23621050 MIDS\WorkFiles\Work Plan 4\MaintenanceNeedsCostsEasements\Report\BMP Construction Cost Maintenance Cost and Land Requirements.docx
18
5.0 Land Area Requirements
5.1 Introduction and Research Approach An important cost of any structural stormwater BMP is the land on which the BMP is located. Land
requirements associated with BMPs include the area needed for the BMP itself plus the area needed
to perform maintenance activities and provide access to the BMP. The amount of land needed varies
with the type of BMP and the design requirements of that BMP. Regulations of the permitting
authority also affect the land requirements of individual BMPs, though to a much lesser extent. These
requirements may stipulate the area needed to perform maintenance and access to the BMP. Some
local regulations also require vegetated buffers be used in conjunction with structural BMPS or as a
separate planning type BMP. Where local governments have such regulations, they are often
enforced through the conveyance of an easement to the permitting authority.
The land area required to access and maintain six structural BMPs for six developing communities is
documented in Appendix B. As part of this effort, the land requirements for stream, lake and wetland
vegetated buffers for these communities was also identified. The six developing communities
included the cities of St. Cloud, Baxter, Rochester, Hanover, Northfield, and Inver Grove Heights.
The zoning and subdivision regulations and stormwater management regulations of each city were
reviewed for access and maintenance requirements, which were most often defined as easements.
Local regulations were also reviewed for vegetated buffer requirements. In most cases, calls were
made to city planners and engineers to clarify the intent and administration of these regulations.
Following is a summary of the land area requirements (easements) and vegetated buffer requirements
for these cities.
5.2 Land Area Requirements for Structural BMPs 5.2.1 O&M Responsibility Policy Whether a city receives fee title for the land or an easement depends on where primary responsibility
for operating and maintenance (O&M) lies. If the city determines that it wants primary O&M
responsibility, the city will take fee title to the land on which the BMP lies along with access to the
BMP. Wet detention basins are the most common BMP for which cities will take this primary O&M
responsibility. This is because these facilities are viewed as flood control devices and cities have a
basic responsibility for the health safety and welfare of their property owners. In most situations,
primary O&M responsibility for BMPs other than wet detention basins lies with the property owner.
In these cases, an access easement is granted to the city for purposes of conducting inspections.

Best Management Practices Construction Costs, Maintenance Costs, and Land Requirements Barr Engineering Company P:\Mpls\23 MN\62\23621050 MIDS\WorkFiles\Work Plan 4\MaintenanceNeedsCostsEasements\Report\BMP Construction Cost Maintenance Cost and Land Requirements.docx
19
Cities may use the access easement to perform maintenance either through an agreement or due to an
enforcement action. In terms of defining O&M responsibility, St. Cloud and Northfield represent
different ends of the policy spectrum. St. Cloud will only take responsibility for wet detention basins
and then only in limited situations where flood control is deemed a high priority. For all other BMPs,
St. Cloud requires that the property owner take sole responsibility for O&M. In contrast, Northfield
is moving in the direction of taking primary responsibility for many BMPs to insure their long term
water quality performance. In these situations, the city will take fee title of the land on which the
BMP is located as well as access to the land.
The City of Rochester is different from most cities in that it does not require any easements. Instead,
Rochester requires a detailed maintenance agreement for all BMPs required by a stormwater
management plan, but not voluntary BMPs such as small rainwater gardens. Through the
maintenance agreement, the city secures its right to access the BMP for inspection and enforcement
action.
5.2.2 Area Requirements The specific easement requirements that each city has for each BMP is shown in Appendix B. Cities
vary widely on the specific requirements for the six BMPs. Rochester does not have any dimensional
requirements for the BMPs, except for grass swales. St. Cloud does not have any dimensional
requirements, except for wet detention basins.
Easements for above-ground BMPs (bioretention basins, biofiltration basins and wet detention
basins) include the BMP plus an area around the BMP. This area around the BMP is defined
differently for each city. Definitions include: top of bank plus 10 feet, up to the 100-year flood level,
the high water level plus 50 feet, and 30 feet from the ordinary high water level. Ten to 20-foot
easements from the nearest right-of-way (ROW) are typically required for access to these above
ground BMPs.
For most cities, the term grass swale refers to drainage easements along property lines. These
typically vary between 10 and 20 feet centered on the property line. For other types of grass swales,
easements are required but not defined. Easements are determined on a case-by-case basis and
depend on the size and function of the swale. Hanover was the only city to specify an easement
dimension for something other than a grass swale within a property line drainage easement. Hanover
requires a 30 foot easement extending outward of the ordinary high water level of the grass swale.

Best Management Practices Construction Costs, Maintenance Costs, and Land Requirements Barr Engineering Company P:\Mpls\23 MN\62\23621050 MIDS\WorkFiles\Work Plan 4\MaintenanceNeedsCostsEasements\Report\BMP Construction Cost Maintenance Cost and Land Requirements.docx
20
Easement policy for pervious pavement and underground infiltration BMPs is less well defined for
most cities. Many have not encountered these types of BMPs yet or they are still relatively rare. As a
result, cities have not yet determined specific dimensional requirements or policies.
5.3 Vegetated Buffer Requirements Three of the cities reviewed have specific dimensional requirements for establishing vegetated
buffers. Northfield has the strictest standard in this regard. The City requires the establishment of a
50 foot vegetated buffer around bioretention basins, biofiltration basins and wet detention basins.
The City also requires establishment of a 50 foot buffer around all wetlands extending outward from
the delineated edge. Hanover requires the establishment of a 30 foot buffer and easement around
wetlands and a 30 foot easement from the ordinary high water level of streams and lakes. Inver
Grove Heights requires a 10 foot buffer around the permanent pool of wet detention basins and 10 –
15 feet around wetlands. All other cities reference the buffer requirements in the Shoreland Rules.
These rules define measures for protecting existing buffers; they do not require the establishment of
new vegetated buffers.
Best Management Practices Construction Costs, Maintenance Costs, and Land Requirements Barr Engineering Company P:\Mpls\23 MN\62\23621050 MIDS\WorkFiles\Work Plan 4\MaintenanceNeedsCostsEasements\Report\BMP Construction Cost Maintenance Cost and Land Requirements.docx
21
6.0 MIDS Calculator
In many ways, the study data supports the work of Weiss et al. for construction costs and operation
and maintenance costs. Data ranges and distributions are similar and include a graphical
representation of a 67% confidence level for each BMP. The Weiss report also links contaminant
removal effectiveness to cost, which would be useful in evaluation of approaches. The Weiss et al.
analyses might provide a relatively accurate platform for developing a simple “calculator” for
construction and maintenance costs.
Land cost estimates become more problematic because those costs vary considerably by locale. A
simple method using a model of BMP footprint area based on watershed or impervious area might be
effectively paired with local land values for use in cost estimating.
Easement requirements for maintenance and access are relatively small compared to the area needed
for the BMP itself. The MIDS calculator could include a dimensional requirement for this to provide
the user with an estimate of the land area needed to meet these requirements. A typical range that
could be included as an input into the calculator would be 30 – 50 feet from the high water level of
any above ground BMP.

Best Management Practices Construction Costs, Maintenance Costs, and Land Requirements 22 Barr Engineering Company P:\Mpls\23 MN\62\23621050 MIDS\WorkFiles\Work Plan 4\MaintenanceNeedsCostsEasements\Report\BMP Construction Cost Maintenance Cost and Land Requirements.docx
References
American Public Works Association (APWA). (1992). A Study of Nationwide Costs to Implement Municipal Storm Water Best Management Practices. Southern California Chapter. Water Resource Committee.
A Public Works Perspective on the Cost Vs. Benefit of Various Stormwater Management Practices, WSB Inc. (2007).
Bloomington Pervious parking area bid tabs, city of Bloomington, (2009).
Century College, White Bear Lake, MN Parking Lot Reconstruction Plans and Specifications, (2009).
City of Shoreview Road Construction, American Public Works Assn, (2009).
East 145th Street Rain Garden/Infiltration Basin, Barr Engineering Co, (2010).
International Stormwater BMP Database: Cost Data Included in July 2007 Database Release, Wright Water Engineers, Inc. and GeoSyntec Consultants (2007).
Lockheed Martin Eagan MN parking Lot 1, Barr Engineering Co, (2009).
Medford MN School Stormwater Wetlands, Barr Engineering Co., (2008).
Oakgreen Avenue, Afton MN; Infiltration Basin Construction Plans and Data, Barr Engineering Co., (2007).
Owatanna Test Alley, Owatonna City Council Packet March 23, 2010.
Stormwater BMP Costs, North Carolina State University (2007).
Stormwater BMP Performance Assessment and Cost-Benefit Analysis, Capitol Region Watershed District, (2010).
U.S. Environmental Protection Agency (USEPA). (1999). “Preliminary data summary of urban stormwater best management practices.” EPA-821-R-99-012, Washington, D.C.
Villanova Urban Stormwater Partnership Website, BMP Research, (2010).
Weiss, P.T., J. S. Gulliver and A. J. Erickson, (2005). “The Cost and Effectiveness of Stormwater Management Practices,” Minnesota Department of Transportation Report 2005-23.
Wossink, Ada, Hunt Bill, (2003) The Economics of Structural Stormwater BMPs in North Carolina, UNC-WRRI-2003-344.

Appendix A
BMP Cost Survey Data Tables

Appendix A: BMP Cost Survey Data Tables
DATA SOURCES
1) International Stormwater BMP Database Cost Data Included in July 2007 Database Release, Wright Water Engineers, Inc. and GeoSyntec Consultants (2007)
2) Century College, White Bear Lake, MN Parking Lot Reconstruction Plans and Specifications, (2009)
3) A Public Works Perspective on the Cost Vs. Benefit of Various Stormwater Management Practices, WSB Inc. (2007)
4) Stormwater BMP Costs, North Carolina State University (2007)
5) Stormwater BMP Performance Assessment and Cost-Benefit Analysis, Capitol Region Watershed District, (2010)
6) Oakgreen Avenue, Afton MN; Infiltration Basin Construction Plans and Data, Barr Engineering Co., (2007)
7) Medford MN School Stormwater Wetlands, Barr Engineering Co., (2008)
8) East 145th Street Raingarden/infiltration basin, Barr Engineering Co., (2010)
9) City of Shoreview road construction, American Public Works Assn, (2009)
10) Lockheed Martin Eagan MN parking Lot 1, Barr Engineering Co., (2009)
11) Owatonna Test Alley, Owatonna City Council Packet March 23, 2010
12) Bloomington Pervious parking area bid tabs, city of Bloomington, (2009)
13) Villanova Urban Stormwater Partnership Website, BMP Research, (2010)
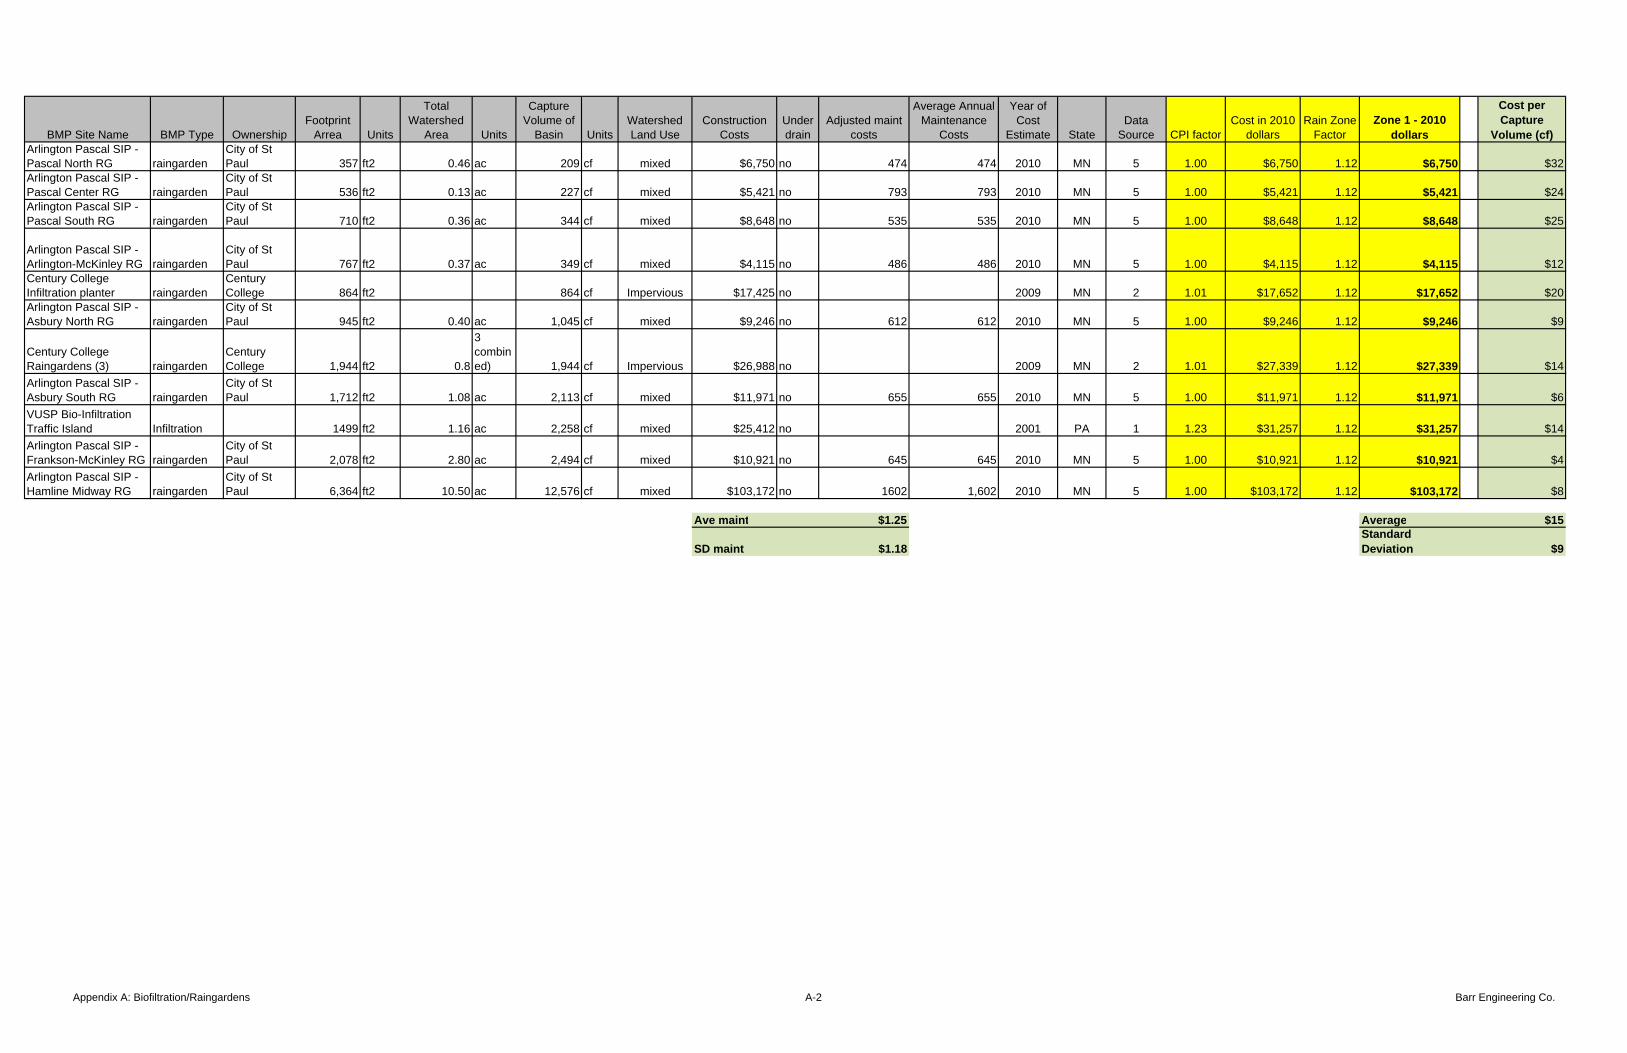
Appendix A: Data Sources A-1 Barr Engineering Co.
BMP Site Name BMP Type OwnershipFootprint
Arrea Units
Total Watershed
Area Units
Capture Volume of
Basin UnitsWatershed Land Use
Construction Costs
Under drain
Adjusted maint costs
Average Annual Maintenance
Costs
Year of Cost
Estimate StateData
Source CPI factorCost in 2010
dollarsRain Zone
FactorZone 1 - 2010
dollars
Cost per Capture
Volume (cf)Arlington Pascal SIP - Pascal North RG raingarden
City of St Paul 357 ft2 0.46 ac 209 cf mixed $6,750 no 474 474 2010 MN 5 1.00 $6,750 1.12 $6,750 $32
Arlington Pascal SIP - Pascal Center RG raingarden
City of St Paul 536 ft2 0.13 ac 227 cf mixed $5,421 no 793 793 2010 MN 5 1.00 $5,421 1.12 $5,421 $24
Arlington Pascal SIP - Pascal South RG raingarden
City of St Paul 710 ft2 0.36 ac 344 cf mixed $8,648 no 535 535 2010 MN 5 1.00 $8,648 1.12 $8,648 $25
Arlington Pascal SIP - Arlington-McKinley RG raingarden
City of St Paul 767 ft2 0.37 ac 349 cf mixed $4,115 no 486 486 2010 MN 5 1.00 $4,115 1.12 $4,115 $12
Century College Infiltration planter raingarden
Century College 864 ft2 864 cf Impervious $17,425 no 2009 MN 2 1.01 $17,652 1.12 $17,652 $20
Arlington Pascal SIP - Asbury North RG raingarden
City of St Paul 945 ft2 0.40 ac 1,045 cf mixed $9,246 no 612 612 2010 MN 5 1.00 $9,246 1.12 $9,246 $9
Century College Raingardens (3) raingarden
Century College 1,944 ft2 0.8
(3 combined) 1,944 cf Impervious $26,988 no 2009 MN 2 1.01 $27,339 1.12 $27,339 $14
Arlington Pascal SIP - Asbury South RG raingarden
City of St Paul 1,712 ft2 1.08 ac 2,113 cf mixed $11,971 no 655 655 2010 MN 5 1.00 $11,971 1.12 $11,971 $6
VUSP Bio-Infiltration Traffic Island Infiltration 1499 ft2 1.16 ac 2,258 cf mixed $25,412 no 2001 PA 1 1.23 $31,257 1.12 $31,257 $14
Arlington Pascal SIP - Frankson-McKinley RG raingarden
City of St Paul 2,078 ft2 2.80 ac 2,494 cf mixed $10,921 no 645 645 2010 MN 5 1.00 $10,921 1.12 $10,921 $4
Arlington Pascal SIP -Hamline Midway RG raingarden
City of St Paul 6,364 ft2 10.50 ac 12,576 cf mixed $103,172 no 1602 1,602 2010 MN 5 1.00 $103,172 1.12 $103,172 $8
Ave maint $1.25 Average $15
SD maint $1.18Standard Deviation $9
Appendix A: Biofiltration/Raingardens A-2 Barr Engineering Co.

BMP Site Name BMP Type OwnershipFootprint
Arrea Units
Total Watershed
Area Units
Capture Volume of
Basin UnitsWatershed Land Use
Expected Life Span
Construction Costs Underdrain
Average Annual Maintenance
Costs
Year of Cost
Estimate StateData
Source CPI factor
Cost in 2010
dollarsRain Zone
FactorZone 1 - 2010
dollars
Cost per Capture Volume
(cf)145th Street Infiltration Basin, Burnsville raingarden
City of Burnsville 15,000 ft2 6,250 cf $91,124 yes 2010 MN 8 1.00 $91,124 1.12 $91,124 $15
VUSP Bio-Infiltration Traffic Island
filtration trench Villanova U 130 ft2 300 cf $27,900 2004 PA 13 1.12 $31,248 1.15 $30,327 $101.09
Average $58Standard Deviation $61
Appendix A: Filtration data A-3 Barr Engineering Co.

BMP Site Name BMP Type OwnershipTreated Volume Units
Total Watershed
Area UnitsWatershed Land Use
Expected Life Span
Construction Costs
Land Costs or Value
Adjusted Maint Costs
Average Annual Maintenance
CostsYear of Cost
Estimate StateData
Source CPI factorCost in 2010
dollarsRain Zone
FactorZone 1 - 2010
dollars
Cost per treatment
volume (cf)Lakewood RP SF Vault (95) Wet Pond 700 cf 1.6 ac $57,000 1995 CO 1 1.43 $81,568 0.76 $120,205 $172Lakewood RP - MF Vault (96) Wet Pond 700 cf 1.6 ac $57,000 1996 CO 1 1.39 $79,174 0.76 $116,677 $167
Average (small) $145
I-5 / La Costa (east) Wet Pond 9,150 cf 4.2 ac $769,841 2000 CA 1 1.27 $974,619 1.24 $880,301 $96Standard Deviation $42
Central Park Wet Pond Wet Pond 273,000 cf 1639.6 ac $585,000 $55,327.16 $22,500 1994 TX 1 1.47 $860,535 0.67 $1,438,506 $5Traver Creek Detention Basin Wet Pond 512,000 cf 2303.2 ac $187,011 $128,750 1980 MI 1 2.65 $494,831 1.12 $494,831 $1Cockroach Bay Agricultural Site Wet Pond 564,793 cf 210.0 ac $563,547 $3,482.87 $1,500 1996 FL 1 1.39 $782,767 0.67 $1,308,506 $2
Average (large) $2
Pittsfield Retention Basin Wet Pond 914,760 cf 4872.8 ac $404,931 $128,750 $70,142.58 $20,214 1977 MI 1 3.47 $1,405,109 1.12 $1,405,109 $2
Standard Deviation $2
Como Park Regional Pond Wet Pond City of St Paul 2,074,893 cf 128 ac mixed 35 $1,364,364 $4,550.00 $4,550 2010 MN 5 1.00 $1,364,364 1.12 $1,364,364 $1
Ave maint $0.07 Average $56
SD maint $0.10Standard Deviation $77
Appendix A: Wet Ponds A-4 Barr Engineering Co.

BMP Site Name BMP Type Ownership Footprint
Area
Units Total
Watershed
Area
Units Capture
Volume of
Basin
Units Watershed
Land Use
Expected
Life Span
Construction
Costs
Land
Costs or
Value
Average Annual
Maintenance
Costs
Year of
Cost
Estimate
State Data
Source
CPI factor Cost in
2010
dollars
Rain Zone
Factor
Zone 1 - 2010
dollars
Cost per WQ
VolumeUSA Brookley Golf Course
Wetland 2.5 ac $16,000 1994 AL 1 1.47 $23,536 0.67 $39,344
Hank Aaron Stadium - NW Wetland
Wetland 1.3 ac 10.80 ac 84,942 cf $5,000 1998 AL 1 1.34 $6,685 0.67 $11,175 $0.13
Mobile County Extension Service
Wetland 12.1 ac $1,500 1996 AL 1 1.39 $2,084 0.67 $3,483
Hank Aaron Stadium - SW Wetland
Wetland 0.25 ac 17.90 ac 16,335 cf $5,000 1998 AL 1 1.34 $6,685 0.67 $11,175 $0.68
Medford MN School Stormwater Wetlands
Wetland System
Steele County 3 ac 50.7 ac 69,696 cf $225,000 2008 MN 7 1.01 $227,925 1.12 $227,925 $3.27
Swift Run Wetland Wetland 1207.10 ac 1,076,991 cf $48,750 $101,000 1983 MI 1 2.19 $106,714 1.12 $106,714 $0.10
Average $1.05Standard Deviation
$1.51
Appendix A: Constructed Wetlands A-5 Barr Engineering Co.

BMP Site Name BMP Type OwnershipFootprint
Arrea Units
Total Watershed
Area Units
Capture Volume of
Basin UnitsWatershed Land Use
Expected Life Span
Construction Costs
Land Costs or Value
Adjusted maint costs
Average Annual Maintenance
Costs
Year of Cost
Estimate StateData
Source CPI factorCost in 2010
dollarsRain Zone
FactorZone 1 - 2010
dollarsCost per Capture
Volume (cf)Arlington Pascal SIP - Trench 1
Underground infiltration trench City of St Paul 0.74 ac 1,871 cf mixed 35 $20,039 $1,061.00 $1,061 2010 MN 5 1.00 $20,039 1.12 $20,039 $10.71
Arlington Pascal SIP - Trench 5
Underground infiltration trench City of St Paul 1.28 ac 2,410 cf mixed 35 $25,812 $1,091.00 $1,091 2010 MN 5 1.00 $25,812 1.12 $25,812 $10.71
I-605 / SR-91 EDB Dry Pond 0.8 ac 2,439 cf $77,389 2000 CA 1 1.27 $97,974 1.24 $88,493 $36.28
Arlington Pascal SIP - Trench 7
Underground infiltration trench City of St Paul 1.63 ac 2,713 cf mixed 35 $29,058 $1,108.00 $1,108 2010 MN 5 1.00 $29,058 1.12 $29,058 $10.71
Arlington Pascal SIP - Trench 2
Underground infiltration trench City of St Paul 0.84 ac 2,783 cf mixed 35 $29,807 $1,112.00 $1,112 2010 MN 5 1.00 $29,807 1.12 $29,807 $10.71 Trench Average $10.71
Arlington Pascal SIP - Trench 6
Underground infiltration trench City of St Paul 2.60 ac 3,246 cf mixed 35 $34,766 $1,518.00 $1,518 2010 MN 5 1.00 $34,766 1.12 $34,766 $10.71 Trench SD $30.13
Arlington Pascal SIP - Trench 8
Underground infiltration trench City of St Paul 7.08 ac 7,992 cf mixed 35 $85,599 $2,165.00 $2,165 2010 MN 5 1.00 $85,599 1.12 $85,599 $10.71
Arlington Pascal SIP - Trench 4
Underground infiltration trench City of St Paul 5.29 ac 8,085 cf mixed 35 $86,595 $2,170.00 $2,170 2010 MN 5 1.00 $86,595 1.12 $86,595 $10.71
Arlington Pascal SIP - Trench 3
Underground infiltration trench City of St Paul 3.21 ac 8,252 cf mixed 35 $88,383 $2,179.00 $2,179 2010 MN 5 1.00 $88,383 1.12 $88,383 $10.71
I-5/Manchester (east) Dry Pond 4.8 ac 9,148 cf $329,833 2000 CA 1 1.27 $417,569 1.24 $377,159 $41.23Dry Pond Average $20.98
I-5 / I-605 EDB Dry Pond 2.7 ac 13,068 cf $127,202 2000 CA 1 1.27 $161,038 1.24 $145,453 $11.13 Dry Pond SD $15.50
I-5 / SR-56 Dry Pond 5.3 ac 13,809 cf $143,555 2000 CA 1 1.27 $181,741 1.24 $164,153 $11.89
I-15/SR-78 EDB Dry Pond 13.4 ac 39,640 cf $819,852 2000 CA 1 1.27 $1,037,933 1.24 $937,488 $23.65
Oakgreen Infiltration Basin Infiltration Pond Watershed 36,460 ft2 35.6 ac 82,764 cf $136,000 2007 MN 6 1.05 $142,936 1.12 $142,936 $1.73
Ave maint $0.39 Average $15
SD maint $0.11Standard Deviation $11
Appendix A: Infiltration A-6 Barr Engineering Co.

BMP Site Name BMP Type Ownership
Volume of permanent
pool Units
Water Quality Surcharge Detention Volume When Full Units
Total Watershed
Area UnitsWatershed Land Use
Expected Life Span
Construction Costs
Land Costs or Value
Adjusted Maint Cost
Average Annual Maintenance
CostsYear of Cost
Estimate StateData
Source CPI factorCost in 2010
dollarsRain Zone
FactorZone 1 - 2010
dollars
Cost per treatment volume
(cf)Cost per
Watershed acre
I-210 / Orcas Ave Hydro-dynamic Device 612.00 cf 612 cf 0.28 ac $39,038 $229.79 $150 2001 VA 1 1.231 $48,056 0.9 $59,803 $98 $213,581
I-210 / Filmore Street Hydro-dynamic Device 36.73 cf 1.10 ac $40,000 2000 CA 1 1.27 $50,640 1.24 $45,739 $41,581Jensen Precast (UVA) - Phase II Hydro-dynamic Device 1751.96 cf 1,752 cf 2.00 ac $61,518 $314.46 $275 2000 CA 1 1.27 $77,882 1.24 $70,345 $40 $35,172Charlottesville Stormceptor Hydro-dynamic Device 36.73 cf 2.50 ac $50,000 2000 CA 1 1.27 $63,300 1.24 $57,174 $22,870
Sunset Park Baffle Box Hydro-dynamic Device 307.47 cf 1,490 cf 2.50 ac $21,750 $6,695.73 $4,250 2000 VA 1 1.27 $27,536 0.9 $34,266 $23 $13,707Jensen Precast (Sacramento) Hydro-dynamic Device 32,000 cf 5.5 ac impervious 30 $121,000 2009 MN 2 1.016 $122,936 1.12 $122,936 $4 $22,352
Austin Rec Center OSTC Hydro-dynamic Device 29,900 cf 10 ac impervious 30 $160,000 2009 MN 2 1.016 $162,560 1.12 $162,560 $5 $16,256Indian River Lagoon CDS Unit Hydro-dynamic Device 101.71 cf 105 cf 24.50 ac $23,421 1998 FL 1 1.337 $31,314 0.67 $52,346 $498 $2,137
Vortec device Hydro-dynamic Device City 777,154cf - treated volume 50 ac mixed 35 $799,087 $2,867.00 $2,867 2010 MN 5 1 $799,087 1.12 $799,087 $1 $15,982
Century College East underground
Underground Treatment Century College 260.98 cf 120 cf 61.50 ac $55,000 1997 FL 1 1.358 $74,690 0.67 $124,855 $1,037 $2,030
Century College West underground
Underground Treatment Century College 90.00 ac $50,000 $10,000 $1,250 1996 TX 1 1.389 $69,450 0.67 $116,096 $1,290
Arlington-Hamlin FacilityVortex + underground storage/infiltration Private 500 ac 30 1,200,000 ROW $5,000 2007 MN 3 1.051 $1,261,200 1.12 $1,261,200 $2,522
Ave maint $1.26 Average $213 $32,457
SD maint $2.16Standard Deviation $372 $58,534
Appendix A: Underground Structures A-7 Barr Engineering Co.

BMP Site Name BMP Type OwnershipFootprint
Arrea Units
treatment volume of
base units
Total Watershed
Area UnitsWatershed Land Use
Expected Life Span
Construction Costs
Land Costs or
Value
Average Annual Maintenance
Costs
Year of Cost
Estimate StateData
Source CPI factorCost in 2010
dollarsRain Zone
FactorZone 1 - 2010
dollars
Cost per treatment
Volume (cf)Cost per
square footDayton Grass Pavement Parking Lot Grass 30,139 ft2 0.79 ac $13,012 $516 1981 OH 1 2.40 $31,203 1.12 $31,203 $1Century College porous pavement Block Century College 2,200 ft2 impervious 30 $25,000 2009 MN 2 1.02 $25,400 1.12 $25,400 $12UDFCD Modular Porous Pavement 94 to 04 Block 90,417 ft2 0.21 ac $14,800 $21,300 1994 CO 1 1.47 $21,771 0.76 $32,083 $0.35Century College porous pavement Asphalt Century College 4,500 ft2 3.6 ac impervious 30 $40,000 2009 MN 2 1.02 $40,640 1.12 $40,640 $9
Owatonna Test Alley Asphalt City 10,755 ft2 8,630 ft3 $64,061 2010 MN 11 1.00 $64,061 1.12 $64,061.00 $7 $6Lockheed Martin Eagan MN parking Lot 1 Asphalt private 10,890 ft2 7,762.50 ft3 $60,742 2009 MN 10 1.02 $61,714 1.12 $61,713.87 $8 $6
Austin Porous Asphalt Lot Asphalt 15,070 ft2 0.35 ac $11,240 1981 TX 1 2.40 $26,954 0.67 $45,057 $3Bloomington Harrison Park parking area Asphalt City 25,700 ft2 18,066 ft3 $242,800 2008 MN 12 1.01 $245,956 1.12 $245,956.40 $14 $10Lockheed Martin Eagan MN parking Lot 1 Concrete private 765 ft2 319 ft3 $7,990 2009 MN 10 1.02 $8,118 1.12 $8,117.84 $25 $11Century College porous pavement Concrete Century College 2,800 ft2 impervious 30 $31,000 2009 MN 2 1.02 $31,496 1.12 $31,496 $11
Owatonna Test Alley Concrete City 6,030 ft2 4,278 ft3 $90,940 2010 MN 11 1.00 $90,940 1.12 $90,940.00 $21 $15Bloomington Public Works parking area Concrete City 7,722 ft2 4,240 ft3 $111,400 2009 MN 12 1.02 $113,182 1.12 $113,182.40 $27 $15
City of Shoreview roadway Concrete City 76,266 ft2 67,500 ft3 $731,000 2009 MN 9 1.02 $742,696 1.12 $742,696 $11 $10
Average $16 $8Standard Deviation $8 $5
Appendix A: Porous Pavement A-8 Barr Engineering Co.

BMP Site Name BMP Type Ownership Length Units
Total Watershed
Area UnitsWatershed Land Use
Expected Life Span
Construction Costs
Land Costs or Value
Adjusted maint costs
Average Annual Maintenance
Costs
Year of Cost
Estimate StateData
Source CPI factorCost in 2010
dollarsRain Zone
FactorZone 1 - 2010
dollarsCost per
Watershed AcreCost per length (ft)
Carlsbad Biofiltration Strip Swale 26.0 ft 2.4 ac $230,000 2000 CA 1 1.27 $291,180 1.24 $263,001 $109,586 $10,115
Altadena (strip) Swale 26.0 ft 1.7 ac $300,000 2000 CA 1 1.27 $379,800 1.24 $343,045 $201,795 $13,194Average (short) $9,382
I-605/SR-91 Strip Swale 26.0 ft 0.5 ac $110,000 2000 CA 1 1.27 $139,260 1.24 $125,783 $251,571 $4,838Standard Deviation $4,226
Cerritos MS Swale 66.0 ft 0.4 ac $60,000 2000 CA 1 1.27 $75,960 1.24 $68,609 $171,526 $1,040
Monticello High School Swale 95.0 ft 0.8 ac $15,000 $472.64 $300 2000 VA 1 1.27 $18,990 0.90 $23,632 $30,298 $249Florida Aquarium Test Site - F8 Swale 130.0 ft 0.3 ac $8,333 1995 FL 1 1.431 $11,925 0.67 $19,934 $76,666 $153Florida Aquarium Test Site - F6 Swale 130.0 ft 0.3 ac $8,333 1995 FL 1 1.431 $11,925 0.67 $19,934 $76,666 $153Florida Aquarium Test Site - F4 Swale 130.0 ft 0.3 ac $8,333 1995 FL 1 1.431 $11,925 0.67 $19,934 $76,666 $153
Average (long) $497
I-5/I-605 Swale Swale 131.0 ft 0.7 ac $73,179 2000 CA 1 1.27 $92,645 1.24 $83,679 $119,544 $639Standard Deviation $309
I-605/SR-91 Swale Swale 131.0 ft 0.2 ac $110,000 2000 CA 1 1.27 $139,260 1.24 $125,783 $628,927 $960
I-605 / Del Amo Swale 177.0 ft 0.7 ac $130,000 2000 CA 1 1.27 $164,580 1.24 $148,653 $212,365 $840
SR-78 / Melrose Dr Swale 347.0 ft 2.4 ac $133,077 2000 CA 1 1.27 $168,475 1.24 $152,171 $63,406 $439I-5 North of Palomar Airport Road Swale 465.0 ft 4.6 ac $140,000 2000 CA 1 1.27 $177,240 1.24 $160,088 $34,802 $344
Ave maint $4.98 Average $157,986 $2,547Standard Deviation $158,031 $4,272
Appendix A: Swales A-9 Barr Engineering Co.

Appendix B
Land Requirements (Easements) for Stormwater BMPs

Appendix B: Land Requirements (fee title, easement) for Stormwater BMPs
Public Responsibility Private Responsibility Public Responsibility Private Responsibility Public Responsibility Private Responsibility Public Responsibility Private Responsibility Public Responsibility Private Responsibility Public Responsibility Private ResponsibilityBioretention Basin/Rainwater Garden None. Private property owner has
sole O&M responsibility for this type of BMP.
No specific requirements for easements or fee title. BMP located on private property. Property owner/developer responsible for O&M in accordance with submitted plan. Plan not recorded.
City receives fee title if City determines it wants control and primary O&M responsibility. Land requirements include at a minimum: reasonable access to facility and facility.
No easements required. A detailed maintenance agreement is required and recorded (1).
City receives fee title if City determines it wants control and primary O&M responsibility. Land requirements include at a minimum those specified for easements under private responsibility.
Easement required up to 100-year 24-hour flood elevation if sewered, otherwise up to 10-day snowmelt elevation if landlocked. Additional easement required (not specified) to allow room to conduct maintenance without affecting infiltration capacity. Easement required for 20 feet access to facility. Recorded maintenance agreement identifies individual party responsibilities.
City receives fee title if City determines it wants control and primary O&M responsibility. Land requirements include at a minimum those specified for easements under private responsibility.
Easement required up to top of bank plus 10 feet beyond top of bank. 10 foot easement also required to access facility.
City receives fee title if City determines it wants control and primary O&M responsibility. Land requirements include at a minimum those specified for easements under private responsibility.
Easement required to high water level of facility plus 50 feet of vegetated buffer as well as reasonable access to facility. Detailed maintenance agreement required and recorded.
City receives fee title if City determines it wants control and primary O&M responsibility. Land requirements include at a minimum those specified for easements under private responsibility.
Easement required over facility plus 30 feet from the Ordinary High Water (OHW) level as well as reasonable access to facility for inspection and maintenance. Detailed maintenance agreement is recorded.
Filtration Basin/Rainwater Garden None. Private property owner has sole O&M responsibility for this type of BMP.
No specific requirements for easements or fee title. BMP located on private property. Property owner/developer responsible for O&M in accordance with submitted plan. Plan not recorded.
City receives fee title if City determines it wants control and primary O&M responsibility. Land requirements include at a minimum: reasonable access to facility and facility.
No easements required. A detailed maintenance agreement is required and recorded (1).
City receives fee title if City determines it wants control and primary O&M responsibility. Land requirements include at a minimum those specified for easements under private responsibility.
Easement required up to 100-year 24-hour flood elevation if sewered, otherwise up to 10-day snowmelt elevation if landlocked. Additional easement required (not specified) to allow room to conduct maintenance without affecting infiltration capacity. Easement required for 20 feet access to facility. Recorded maintenance agreement identifies individual party responsibilities.
City receives fee title if City determines it wants control and primary O&M responsibility. Land requirements include at a minimum those specified for easements under private responsibility.
Easement required up to top of bank plus 10 feet beyond top of bank. 10 foot easement also required to access facility.
City receives fee title if City determines it wants control and primary O&M responsibility. Land requirements include at a minimum those specified for easements under private responsibility.
Easement required to high water level of facility plus 50 feet of vegetated buffer as well as reasonable access to facility. Detailed maintenance agreement required and recorded.
City receives fee title if City determines it wants control and primary O&M responsibility. Land requirements include at a minimum those specified for easements under private responsibility.
Easement required over facility plus 30 feet from the OHW level as well as reasonable access to facility for inspection and maintenance. Detailed maintenance agreement is recorded.
Grass Swale
Porous Pavement No additional requirement if land already in public ROW.
No specific requirements for easements or fee title. BMP located on private property. Property owner/developer responsible for O&M in accordance with submitted plan. Plan not recorded.
No additional requirement if land already in public ROW.
No easements required. A detailed maintenance agreement is required and recorded (1).
No additional requirement if land already in public ROW.
Easement large enough to allow vehicle access beyond pavement. Detailed and recorded maintenance agreement required.
No additional requirement if land already in public ROW.
Easement required over extent of pavement plus access to pavement. May require easement beyond pavement depending on design and site context.
No additional requirement if land already in public ROW.
Easement required over extent of pavement plus access to pavement. May require easement beyond pavement depending on design and site context. Detailed maintenance agreement required and recorded.
No additional requirement if land already in public ROW.
Easement required over facility plus access to facility for inspection and maintenance. Detailed maintenance agreement is recorded.
Wet Detention Basin (Pond) City receives fee title if City determines it wants control and primary O&M responsibility. Land requirements include at a minimum: 12 foot wide access to pond. 15-20 feet beyond extent of 100-year 24-hour elevation.
Easement required. 12 foot wide access to pond. 15-20 feet beyond extent of 100-year 24-hour elevation.
City receives fee title if City determines it wants control and primary O&M responsibility. Land requirements include at a minimum: reasonable access to facility and facility.
No easements required. A detailed maintenance agreement is required and recorded (1).
City receives fee title if City determines it wants control and primary O&M responsibility. Land requirements include at a minimum those specified for easements under private responsibility.
Easement required up to 100-year 24-hour flood elevation if sewered, otherwise up to 10-day snow melt elevation if land locked. Easement required for 20 foot access to facility. Recorded maintenance agreement identifies individual party responsibilities.
City receives fee title if City determines it wants control and primary O&M responsibility. Land requirements include at a minimum those specified for easements under private responsibility.
Easement required up to top of bank plus 10 feet beyond top of bank. 10 foot easement also required to access facility.
City receives fee title if City determines it wants control and primary O&M responsibility. Land requirements include at a minimum those specified for easements under private responsibility.
Easement required to high water level of facility plus 50 feet of vegetated buffer as well as reasonable access to facility. Detailed maintenance agreement required and recorded.
City receives fee title if City determines it wants control and primary O&M responsibility. Land requirements include at a minimum those specified for easements under private responsibility.
Easement required over facility plus 30 feet from the OHW level as well as reasonable access to facility for inspection and maintenance. Detailed maintenance agreement is recorded.
Underground Storage and Infiltration None. Private property owner has sole O&M responsibility for this type of BMP.
No specific requirements for easements or fee title. BMP located on private property. Property owner/developer responsible for O&M in accordance with submitted plan. Plan not recorded.
City receives fee title if City determines it wants control and primary O&M responsibility. Land requirements include at a minimum: reasonable access to facility and facility.
No easements required. A detailed maintenance agreement is required and recorded (1).
City receives fee title if City determines it wants control and primary O&M responsibility. Land requirements include at a minimum those specified for easements under private responsibility.
Easement required to allow access to utility access points (e.g., manholes for vac truck access). Recorded maintenance agreement identifies individual party responsibilities.
City receives fee title if City determines it wants control and primary O&M responsibility. Land requirements include at a minimum those specified for easements under private responsibility.
Easement required over extent of storage area plus access to storage facility. May require easement beyond storage area depending on design and site context.
City receives fee title if City determines it wants control and primary O&M responsibility. Land requirements include at a minimum those specified for easements under private responsibility.
Easement required over extent of storage area plus reasonable access to storage facility. May require easement beyond storage area depending on design and site context. Detailed maintenance agreement required and recorded.
City receives fee title if City determines it wants control and primary O&M responsibility. Land requirements include at a minimum those specified for easements under private responsibility.
Easement required over facility plus reasonable access to facility for inspection and maintenance. Detailed maintenance agreement is recorded.
Vegetated Stream, Lake and Wetland Buffers
(1) Detailed maintenance agreement is required only for BMPs included in the grading plan or part of the site plan approval process. Maintenance agreement does not include any "voluntary" BMPs.
No specific requirements. A case-by-case determination is made based on guidance provided by Natural Resource Plan.
Buffers around streams and lakes per shoreland standards. 10 foot buffer around the permanent pool of stormwater ponds. 10 - 15 feet around all wetlands. Buffers around streams and lakes per shoreland standards.
St. Cloud Rochester
Easement required. Minimum 10 feet along property lines (5 feet per side), or more depending on design.
Easement required: at least 20 feet along property lines (10 feet per side), or more depending on design.
No buffer requirements other than buffer standards in Shoreland rules. City submits all plans within Shoreland Overlay District to MDNR for review and approval.
Easement required. Dimensions vary depending on size of swale. 2 feet wide swale required in ROW along road edge for rural edge ditch drainage. 10 feet required along side and rear property lines. Larger swales may be required depending on design needs.
A 30 foot vegetated buffer strip and setback are required around all wetlands. Where buffers do not exist, new buffers must be planted. Flexibility for narrower buffers is allowed in special circumstances. A 30 foot easement is required around all wetlands and from the OHW level of streams and lakes.
A 30 foot easement extending outward from the OHW level of swales is required. A drainage easement of 12 feet centered on side and rear lot lines and 10 feet along front lot lines and unplatted land is also required.
A planted vegetated buffer of 50 feet is required around all wetlands extending out from the delineated wetland edge. An undisturbed vegetated buffer of 50 feet is to be maintained around all water bodies, 100 feet is required adjacent to the Cannon River and 300 feet is required adjacent to Rice Creek.
Easement required - depends on size of swale.
BMP TypeBaxter Northfield HanoverInver Grove Heights