BMO Global Metals and Mining...
40
BMO Global Metals and Mining Conference February 25-28, 2018
Transcript of BMO Global Metals and Mining...
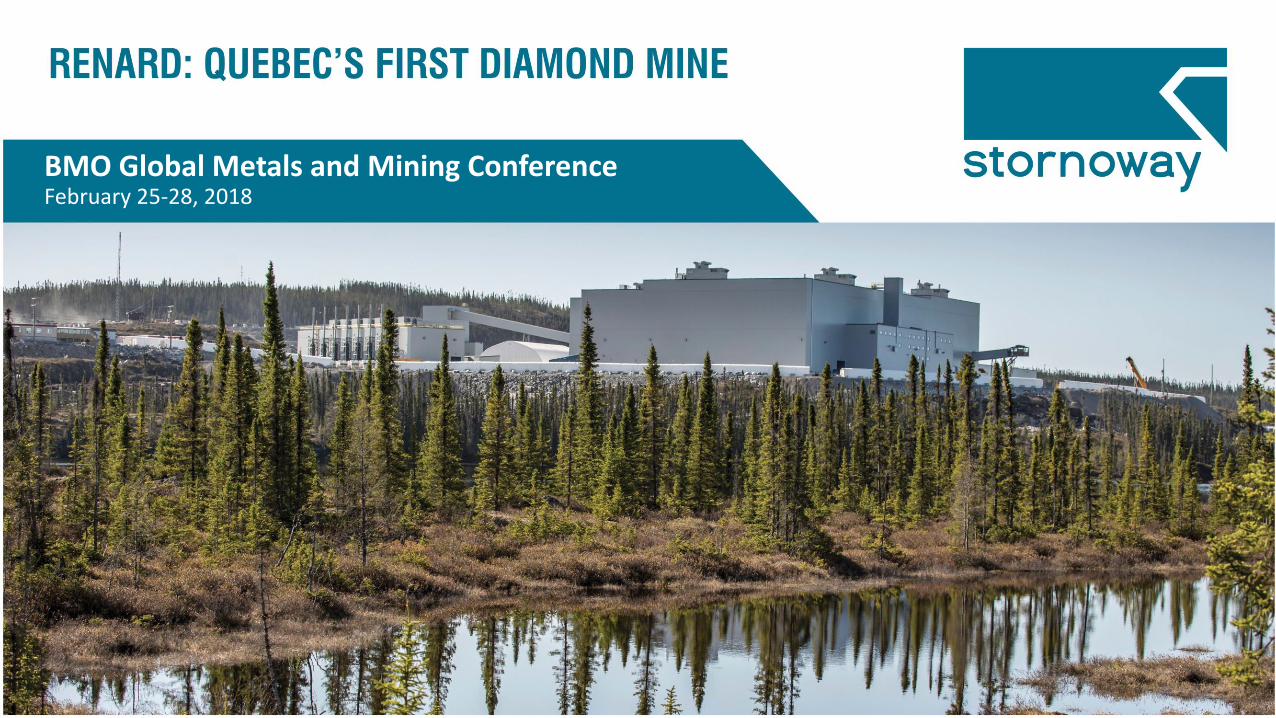
BMO Global Metals and Mining ConferenceFebruary 25-28, 2018
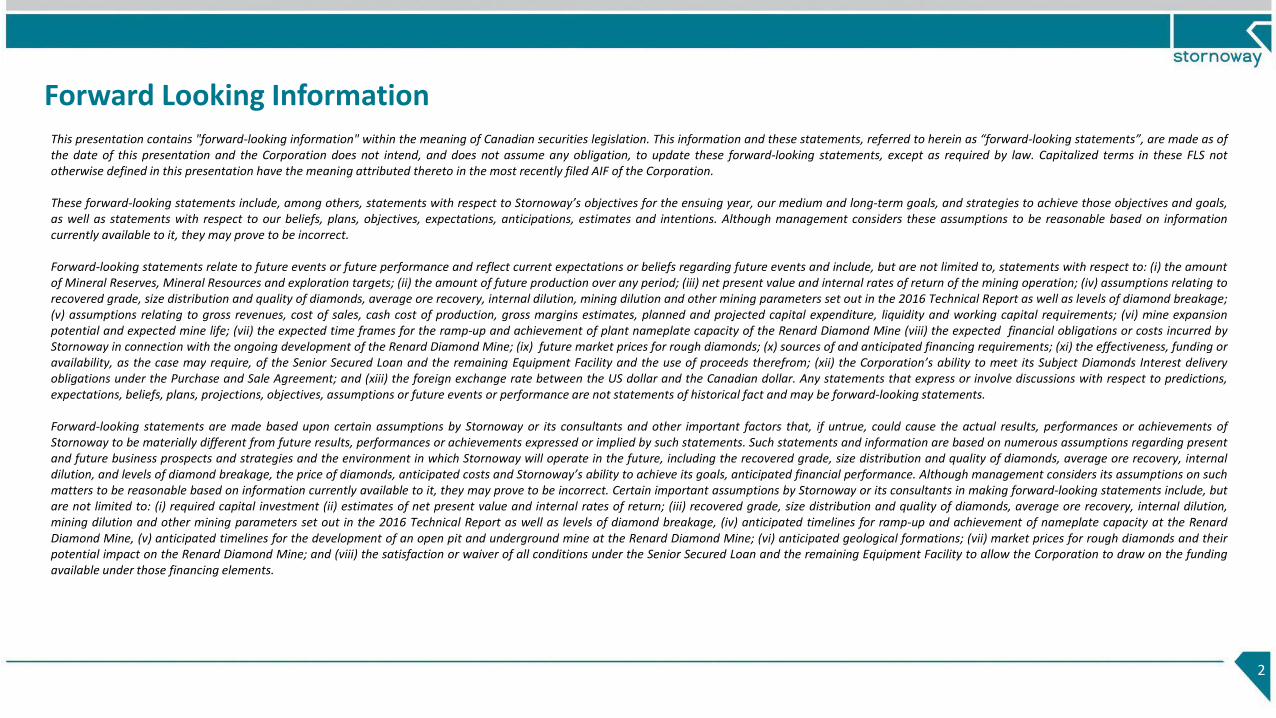
Forward Looking Information
2
This presentation contains "forward-looking information" within the meaning of Canadian securities legislation. This information and these statements, referred to herein as “forward-looking statements”, are made as ofthe date of this presentation and the Corporation does not intend, and does not assume any obligation, to update these forward-looking statements, except as required by law. Capitalized terms in these FLS nototherwise defined in this presentation have the meaning attributed thereto in the most recently filed AIF of the Corporation.
These forward-looking statements include, among others, statements with respect to Stornoway’s objectives for the ensuing year, our medium and long-term goals, and strategies to achieve those objectives and goals,as well as statements with respect to our beliefs, plans, objectives, expectations, anticipations, estimates and intentions. Although management considers these assumptions to be reasonable based on informationcurrently available to it, they may prove to be incorrect.
Forward-looking statements relate to future events or future performance and reflect current expectations or beliefs regarding future events and include, but are not limited to, statements with respect to: (i) the amountof Mineral Reserves, Mineral Resources and exploration targets; (ii) the amount of future production over any period; (iii) net present value and internal rates of return of the mining operation; (iv) assumptions relating torecovered grade, size distribution and quality of diamonds, average ore recovery, internal dilution, mining dilution and other mining parameters set out in the 2016 Technical Report as well as levels of diamond breakage;(v) assumptions relating to gross revenues, cost of sales, cash cost of production, gross margins estimates, planned and projected capital expenditure, liquidity and working capital requirements; (vi) mine expansionpotential and expected mine life; (vii) the expected time frames for the ramp-up and achievement of plant nameplate capacity of the Renard Diamond Mine (viii) the expected financial obligations or costs incurred byStornoway in connection with the ongoing development of the Renard Diamond Mine; (ix) future market prices for rough diamonds; (x) sources of and anticipated financing requirements; (xi) the effectiveness, funding oravailability, as the case may require, of the Senior Secured Loan and the remaining Equipment Facility and the use of proceeds therefrom; (xii) the Corporation’s ability to meet its Subject Diamonds Interest deliveryobligations under the Purchase and Sale Agreement; and (xiii) the foreign exchange rate between the US dollar and the Canadian dollar. Any statements that express or involve discussions with respect to predictions,expectations, beliefs, plans, projections, objectives, assumptions or future events or performance are not statements of historical fact and may be forward-looking statements.
Forward-looking statements are made based upon certain assumptions by Stornoway or its consultants and other important factors that, if untrue, could cause the actual results, performances or achievements ofStornoway to be materially different from future results, performances or achievements expressed or implied by such statements. Such statements and information are based on numerous assumptions regarding presentand future business prospects and strategies and the environment in which Stornoway will operate in the future, including the recovered grade, size distribution and quality of diamonds, average ore recovery, internaldilution, and levels of diamond breakage, the price of diamonds, anticipated costs and Stornoway’s ability to achieve its goals, anticipated financial performance. Although management considers its assumptions on suchmatters to be reasonable based on information currently available to it, they may prove to be incorrect. Certain important assumptions by Stornoway or its consultants in making forward-looking statements include, butare not limited to: (i) required capital investment (ii) estimates of net present value and internal rates of return; (iii) recovered grade, size distribution and quality of diamonds, average ore recovery, internal dilution,mining dilution and other mining parameters set out in the 2016 Technical Report as well as levels of diamond breakage, (iv) anticipated timelines for ramp-up and achievement of nameplate capacity at the RenardDiamond Mine, (v) anticipated timelines for the development of an open pit and underground mine at the Renard Diamond Mine; (vi) anticipated geological formations; (vii) market prices for rough diamonds and theirpotential impact on the Renard Diamond Mine; and (viii) the satisfaction or waiver of all conditions under the Senior Secured Loan and the remaining Equipment Facility to allow the Corporation to draw on the fundingavailable under those financing elements.
Forward Looking Information (continued)
3
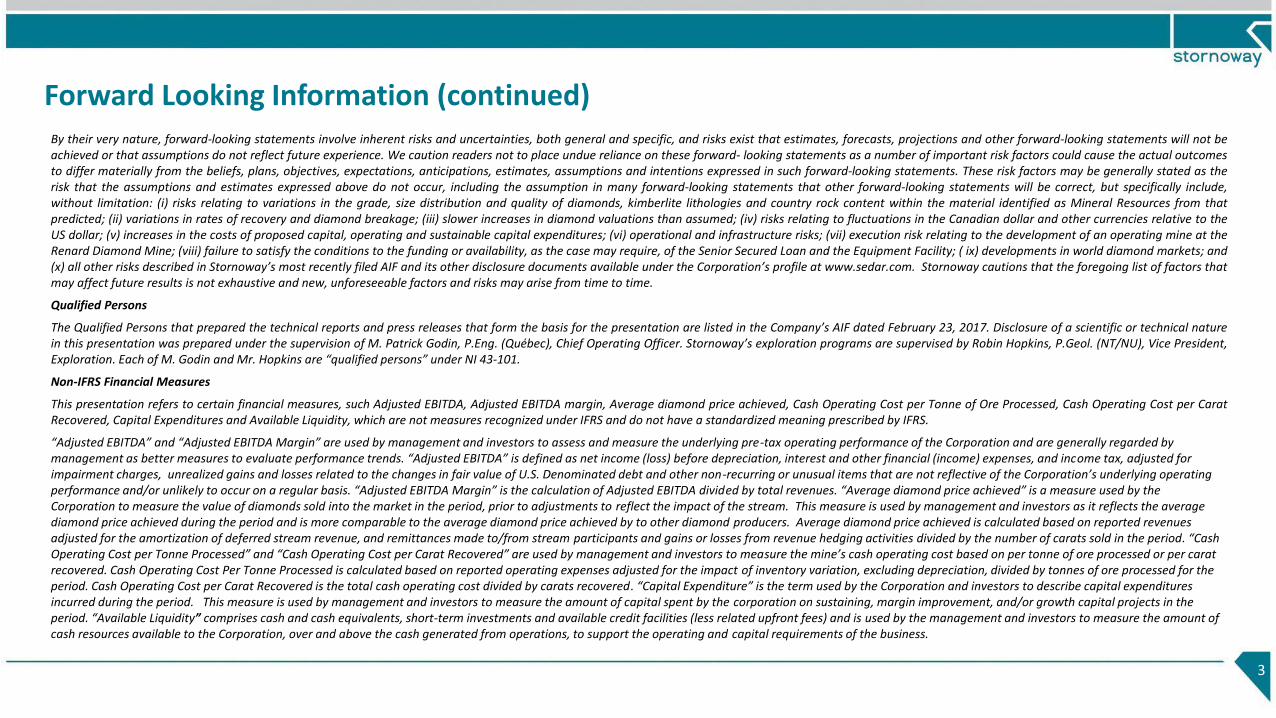
By their very nature, forward-looking statements involve inherent risks and uncertainties, both general and specific, and risks exist that estimates, forecasts, projections and other forward-looking statements will not beachieved or that assumptions do not reflect future experience. We caution readers not to place undue reliance on these forward- looking statements as a number of important risk factors could cause the actual outcomesto differ materially from the beliefs, plans, objectives, expectations, anticipations, estimates, assumptions and intentions expressed in such forward-looking statements. These risk factors may be generally stated as therisk that the assumptions and estimates expressed above do not occur, including the assumption in many forward-looking statements that other forward-looking statements will be correct, but specifically include,without limitation: (i) risks relating to variations in the grade, size distribution and quality of diamonds, kimberlite lithologies and country rock content within the material identified as Mineral Resources from thatpredicted; (ii) variations in rates of recovery and diamond breakage; (iii) slower increases in diamond valuations than assumed; (iv) risks relating to fluctuations in the Canadian dollar and other currencies relative to theUS dollar; (v) increases in the costs of proposed capital, operating and sustainable capital expenditures; (vi) operational and infrastructure risks; (vii) execution risk relating to the development of an operating mine at theRenard Diamond Mine; (viii) failure to satisfy the conditions to the funding or availability, as the case may require, of the Senior Secured Loan and the Equipment Facility; ( ix) developments in world diamond markets; and(x) all other risks described in Stornoway’s most recently filed AIF and its other disclosure documents available under the Corporation’s profile at www.sedar.com. Stornoway cautions that the foregoing list of factors thatmay affect future results is not exhaustive and new, unforeseeable factors and risks may arise from time to time.
Qualified Persons
The Qualified Persons that prepared the technical reports and press releases that form the basis for the presentation are listed in the Company’s AIF dated February 23, 2017. Disclosure of a scientific or technical naturein this presentation was prepared under the supervision of M. Patrick Godin, P.Eng. (Québec), Chief Operating Officer. Stornoway’s exploration programs are supervised by Robin Hopkins, P.Geol. (NT/NU), Vice President,Exploration. Each of M. Godin and Mr. Hopkins are “qualified persons” under NI 43-101.
Non-IFRS Financial Measures
This presentation refers to certain financial measures, such Adjusted EBITDA, Adjusted EBITDA margin, Average diamond price achieved, Cash Operating Cost per Tonne of Ore Processed, Cash Operating Cost per CaratRecovered, Capital Expenditures and Available Liquidity, which are not measures recognized under IFRS and do not have a standardized meaning prescribed by IFRS.
“Adjusted EBITDA” and “Adjusted EBITDA Margin” are used by management and investors to assess and measure the underlying pre-tax operating performance of the Corporation and are generally regarded by management as better measures to evaluate performance trends. “Adjusted EBITDA” is defined as net income (loss) before depreciation, interest and other financial (income) expenses, and income tax, adjusted for impairment charges, unrealized gains and losses related to the changes in fair value of U.S. Denominated debt and other non-recurring or unusual items that are not reflective of the Corporation’s underlying operating performance and/or unlikely to occur on a regular basis. “Adjusted EBITDA Margin” is the calculation of Adjusted EBITDA divided by total revenues. “Average diamond price achieved” is a measure used by the Corporation to measure the value of diamonds sold into the market in the period, prior to adjustments to reflect the impact of the stream. This measure is used by management and investors as it reflects the average diamond price achieved during the period and is more comparable to the average diamond price achieved by to other diamond producers. Average diamond price achieved is calculated based on reported revenues adjusted for the amortization of deferred stream revenue, and remittances made to/from stream participants and gains or losses from revenue hedging activities divided by the number of carats sold in the period. “Cash Operating Cost per Tonne Processed” and “Cash Operating Cost per Carat Recovered” are used by management and investors to measure the mine’s cash operating cost based on per tonne of ore processed or per carat recovered. Cash Operating Cost Per Tonne Processed is calculated based on reported operating expenses adjusted for the impact of inventory variation, excluding depreciation, divided by tonnes of ore processed for the period. Cash Operating Cost per Carat Recovered is the total cash operating cost divided by carats recovered. “Capital Expenditure” is the term used by the Corporation and investors to describe capital expenditures incurred during the period. This measure is used by management and investors to measure the amount of capital spent by the corporation on sustaining, margin improvement, and/or growth capital projects in the period. “Available Liquidity” comprises cash and cash equivalents, short-term investments and available credit facilities (less related upfront fees) and is used by the management and investors to measure the amount of cash resources available to the Corporation, over and above the cash generated from operations, to support the operating and capital requirements of the business.
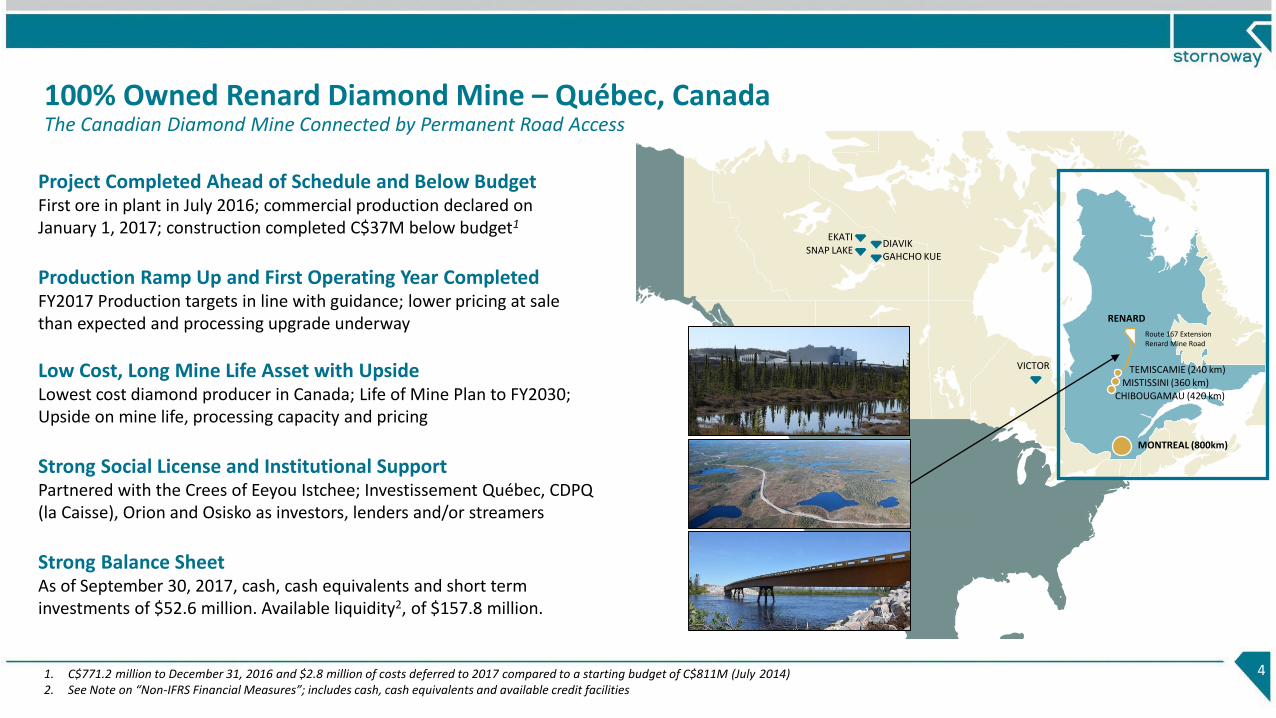
100% Owned Renard Diamond Mine – Québec, CanadaThe Canadian Diamond Mine Connected by Permanent Road Access
4
EKATISNAP LAKE
DIAVIKGAHCHO KUE
VICTOR
MONTREAL (800km)
TEMISCAMIE (240 km)MISTISSINI (360 km)
CHIBOUGAMAU (420 km)
Route 167 ExtensionRenard Mine Road
RENARD
Project Completed Ahead of Schedule and Below BudgetFirst ore in plant in July 2016; commercial production declared on January 1, 2017; construction completed C$37M below budget1
Production Ramp Up and First Operating Year CompletedFY2017 Production targets in line with guidance; lower pricing at sale than expected and processing upgrade underway
Low Cost, Long Mine Life Asset with UpsideLowest cost diamond producer in Canada; Life of Mine Plan to FY2030; Upside on mine life, processing capacity and pricing
Strong Social License and Institutional SupportPartnered with the Crees of Eeyou Istchee; Investissement Québec, CDPQ (la Caisse), Orion and Osisko as investors, lenders and/or streamers
Strong Balance SheetAs of September 30, 2017, cash, cash equivalents and short term investments of $52.6 million. Available liquidity2, of $157.8 million.
1. C$771.2 million to December 31, 2016 and $2.8 million of costs deferred to 2017 compared to a starting budget of C$811M (July 2014)2. See Note on “Non-IFRS Financial Measures”; includes cash, cash equivalents and available credit facilities
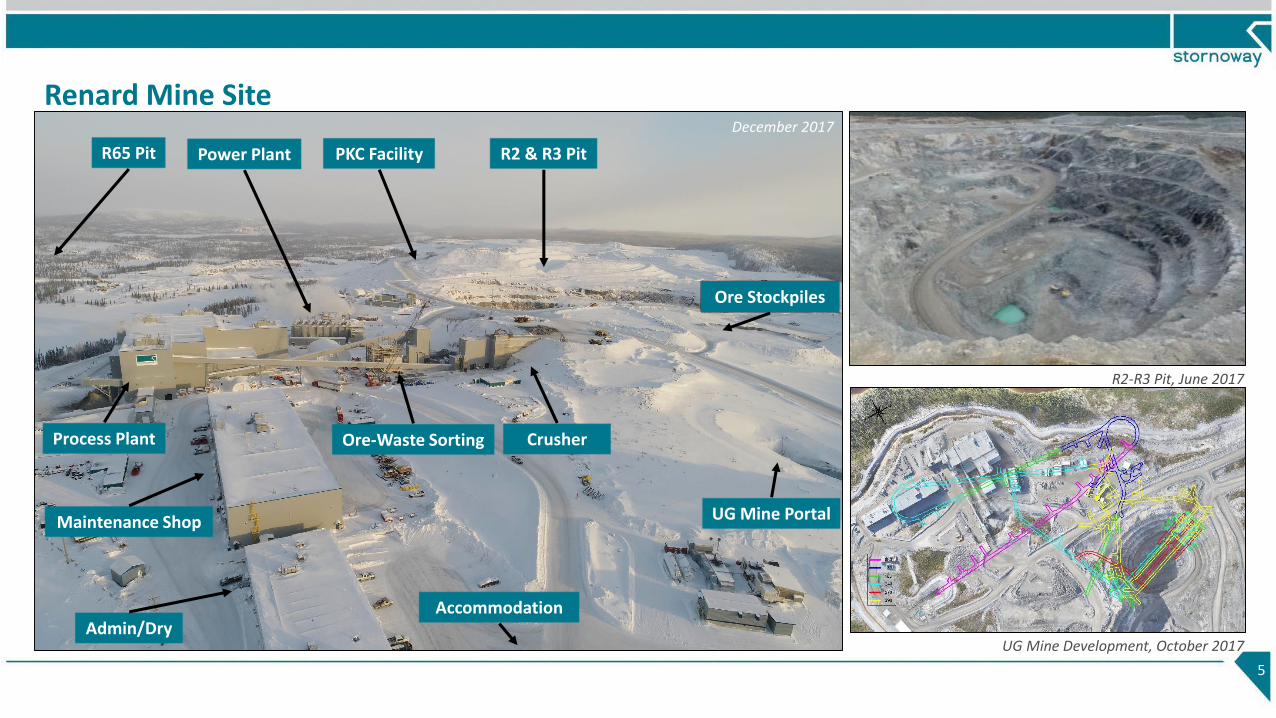
Renard Mine Site
5
Crusher
R2 & R3 Pit
Ore Stockpiles
R65 Pit Power Plant
Process Plant
Maintenance Shop
Admin/DryAccommodation
December 2017
UG Mine Development, October 2017
R2-R3 Pit, June 2017
UG Mine Portal
PKC Facility
Ore-Waste Sorting
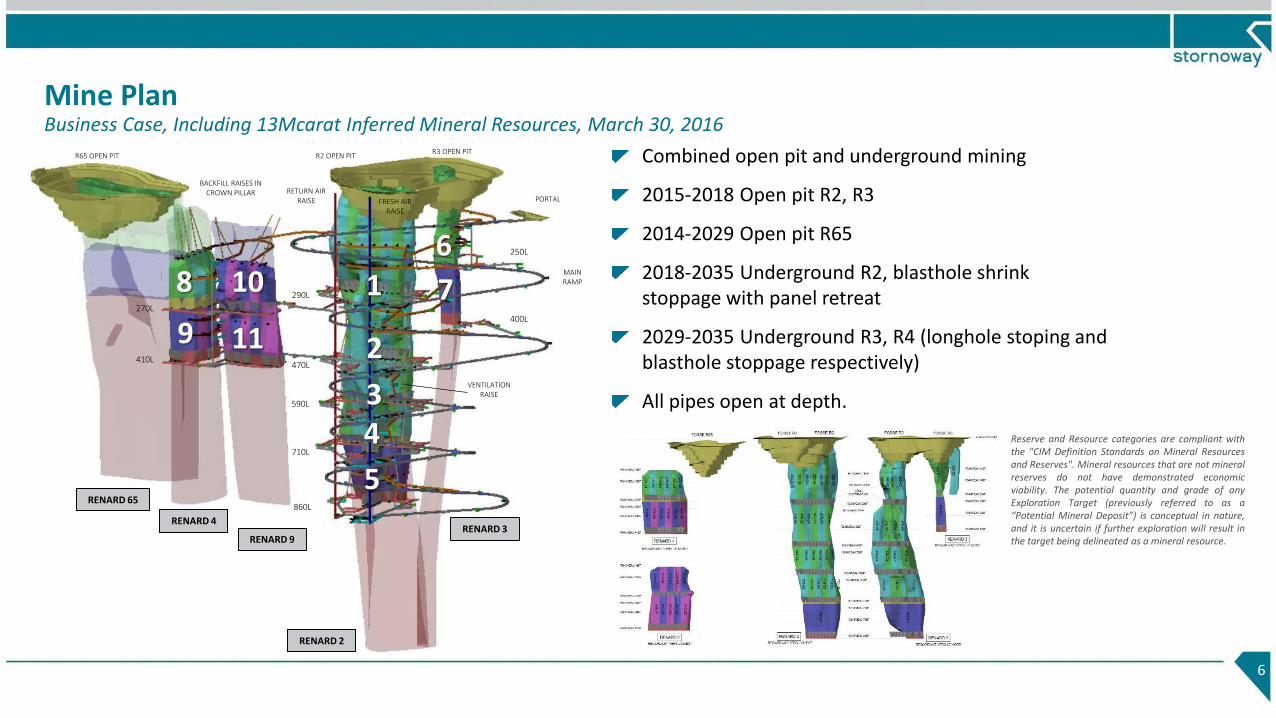
Mine PlanBusiness Case, Including 13Mcarat Inferred Mineral Resources, March 30, 2016
Combined open pit and underground mining
2015-2018 Open pit R2, R3
2014-2029 Open pit R65
2018-2035 Underground R2, blasthole shrink stoppage with panel retreat
2029-2035 Underground R3, R4 (longhole stoping and blasthole stoppage respectively)
All pipes open at depth.
6
7
9
10
11
R3 OPEN PITR2 OPEN PITR65 OPEN PIT
RETURN AIR RAISE FRESH AIR
RAISE
PORTAL
BACKFILL RAISES IN CROWN PILLAR
410L
270L
710L
590L
470L
290L
400L
250L
860L
VENTILATION RAISE
MAIN RAMP
5
1
4
2
3
86
Reserve and Resource categories are compliant withthe "CIM Definition Standards on Mineral Resourcesand Reserves". Mineral resources that are not mineralreserves do not have demonstrated economicviability. The potential quantity and grade of anyExploration Target (previously referred to as a“Potential Mineral Deposit”) is conceptual in nature,and it is uncertain if further exploration will result inthe target being delineated as a mineral resource.
RENARD 65
RENARD 4
RENARD 9
RENARD 2
RENARD 3
Operating and Financial ResultsAs of December 31, 2017 (Operating) and September 30, 2017 (Financial)
7
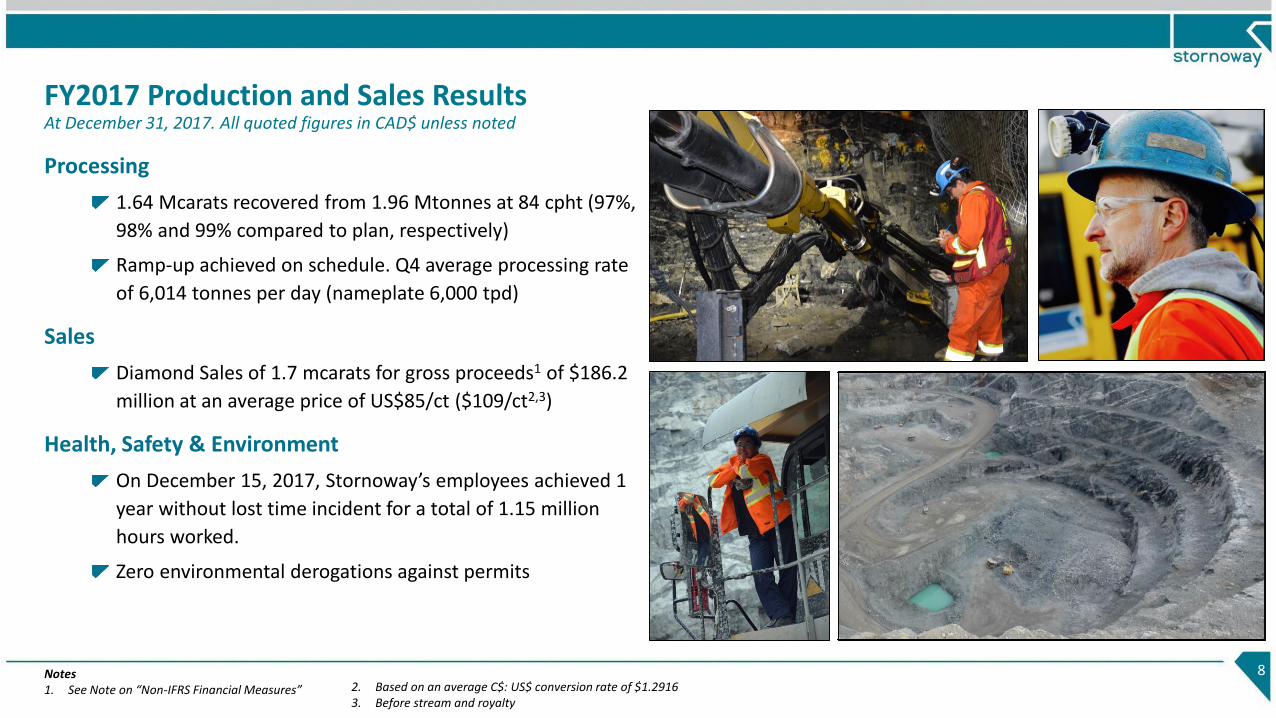
FY2017 Production and Sales ResultsAt December 31, 2017. All quoted figures in CAD$ unless noted
Processing
1.64 Mcarats recovered from 1.96 Mtonnes at 84 cpht (97%,
98% and 99% compared to plan, respectively)
Ramp-up achieved on schedule. Q4 average processing rate
of 6,014 tonnes per day (nameplate 6,000 tpd)
Sales
Diamond Sales of 1.7 mcarats for gross proceeds1 of $186.2
million at an average price of US$85/ct ($109/ct2,3)
Health, Safety & Environment
On December 15, 2017, Stornoway’s employees achieved 1
year without lost time incident for a total of 1.15 million
hours worked.
Zero environmental derogations against permits
8Notes1. See Note on “Non-IFRS Financial Measures” 2. Based on an average C$: US$ conversion rate of $1.2916
3. Before stream and royalty
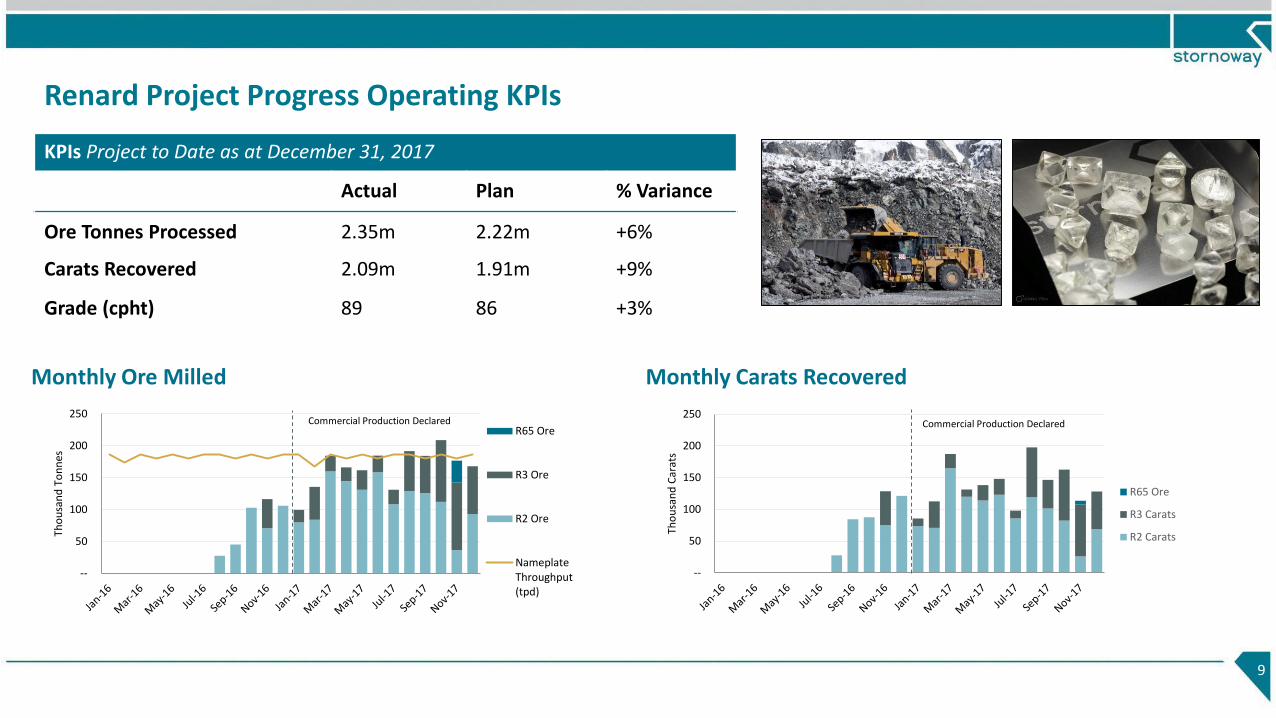
Renard Project Progress Operating KPIs
9
KPIs Project to Date as at December 31, 2017
Actual Plan % Variance
Ore Tonnes Processed 2.35m 2.22m +6%
Carats Recovered 2.09m 1.91m +9%
Grade (cpht) 89 86 +3%
Monthly Carats Recovered
--
50
100
150
200
250
Tho
usa
nd
Car
ats
R65 Ore
R3 Carats
R2 Carats
Commercial Production Declared
Monthly Ore Milled
--
50
100
150
200
250
Tho
usa
nd
To
nn
es
R65 Ore
R3 Ore
R2 Ore
NameplateThroughput(tpd)
Commercial Production Declared
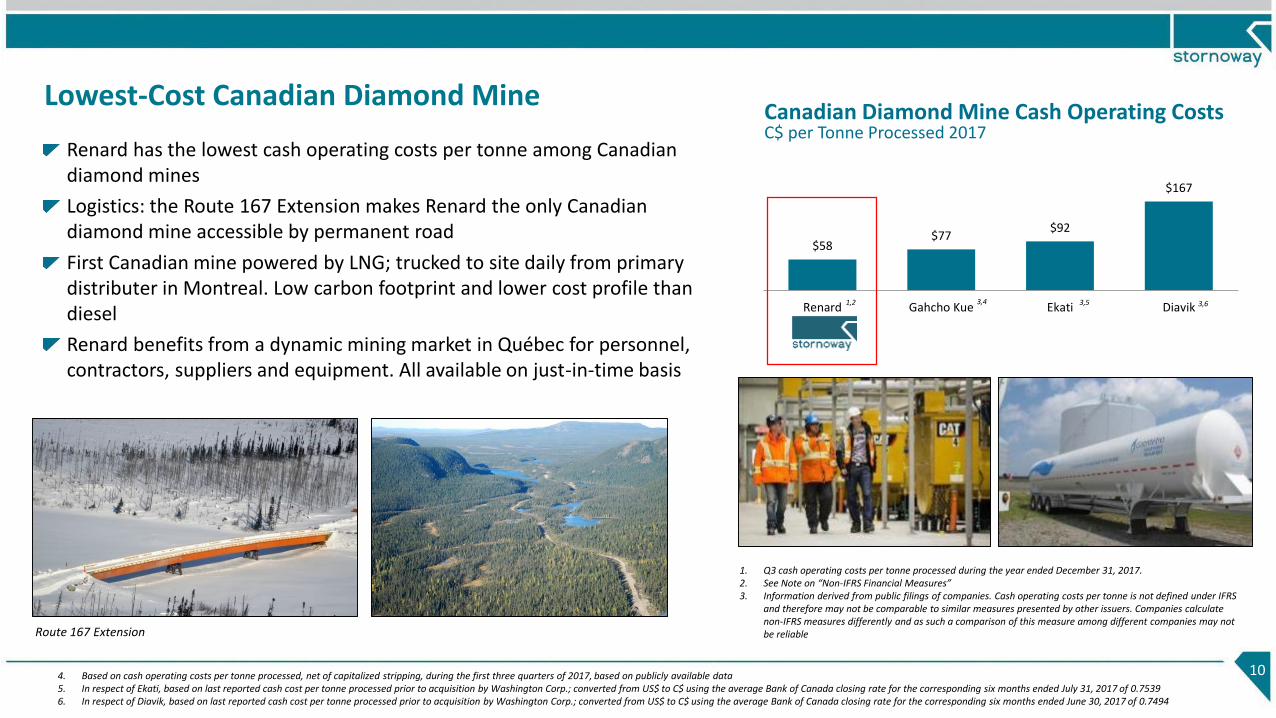
$58$77
$92
$167
Renard Gahcho Kue Ekati Diavik
Lowest-Cost Canadian Diamond MineCanadian Diamond Mine Cash Operating CostsC$ per Tonne Processed 2017
10
Renard has the lowest cash operating costs per tonne among Canadian diamond mines
Logistics: the Route 167 Extension makes Renard the only Canadian diamond mine accessible by permanent road
First Canadian mine powered by LNG; trucked to site daily from primary distributer in Montreal. Low carbon footprint and lower cost profile than diesel
Renard benefits from a dynamic mining market in Québec for personnel, contractors, suppliers and equipment. All available on just-in-time basis
1,2 3,5 3,6
1. Q3 cash operating costs per tonne processed during the year ended December 31, 2017. 2. See Note on “Non-IFRS Financial Measures”3. Information derived from public filings of companies. Cash operating costs per tonne is not defined under IFRS
and therefore may not be comparable to similar measures presented by other issuers. Companies calculate non-IFRS measures differently and as such a comparison of this measure among different companies may not be reliable
3,4
4. Based on cash operating costs per tonne processed, net of capitalized stripping, during the first three quarters of 2017, based on publicly available data5. In respect of Ekati, based on last reported cash cost per tonne processed prior to acquisition by Washington Corp.; converted from US$ to C$ using the average Bank of Canada closing rate for the corresponding six months ended July 31, 2017 of 0.75396. In respect of Diavik, based on last reported cash cost per tonne processed prior to acquisition by Washington Corp.; converted from US$ to C$ using the average Bank of Canada closing rate for the corresponding six months ended June 30, 2017 of 0.7494
Route 167 Extension
Underground Mine Development
11
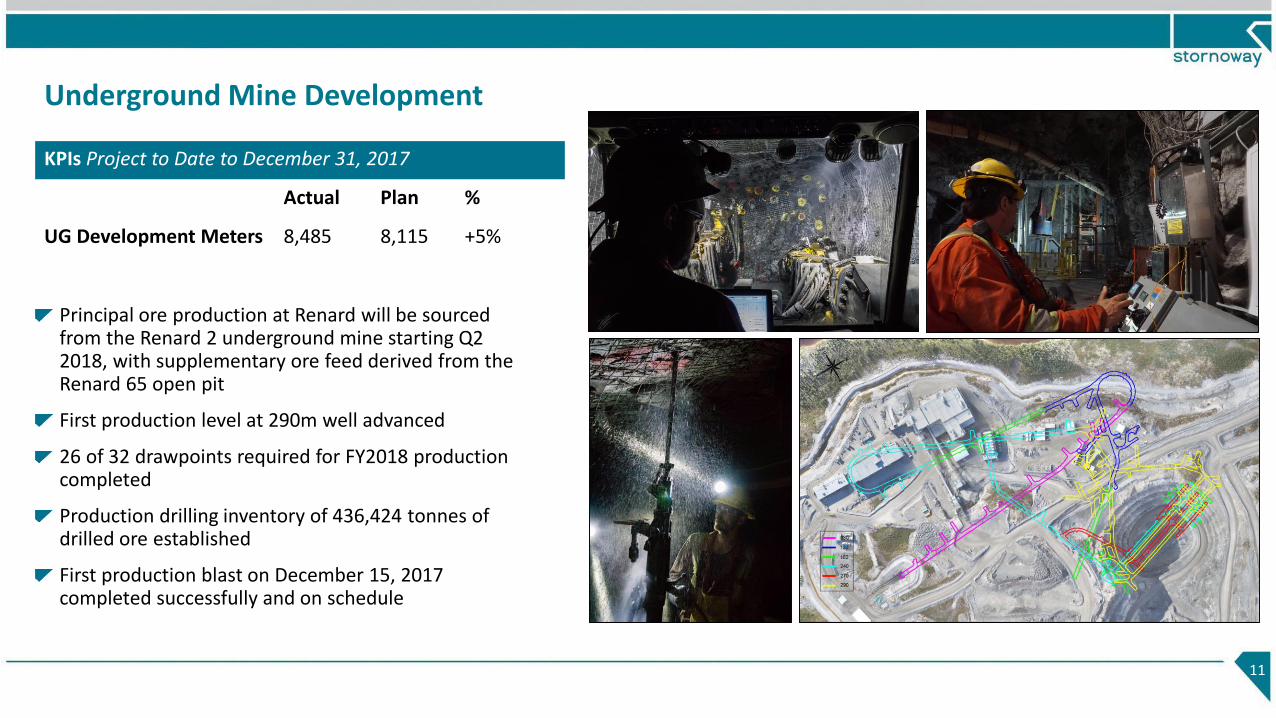
Principal ore production at Renard will be sourced from the Renard 2 underground mine starting Q2 2018, with supplementary ore feed derived from the Renard 65 open pit
First production level at 290m well advanced
26 of 32 drawpoints required for FY2018 production completed
Production drilling inventory of 436,424 tonnes of drilled ore established
First production blast on December 15, 2017 completed successfully and on schedule
KPIs Project to Date to December 31, 2017
Actual Plan %
UG Development Meters 8,485 8,115 +5%
100.0
111.7109.9
113.9 115.4119.2 119.0
110.1 111.1113.5
120.0
90.0
100.0
110.0
120.0
130.0
Ind
ex
(No
v 2
01
6=1
00
)
Diamond Sales
12
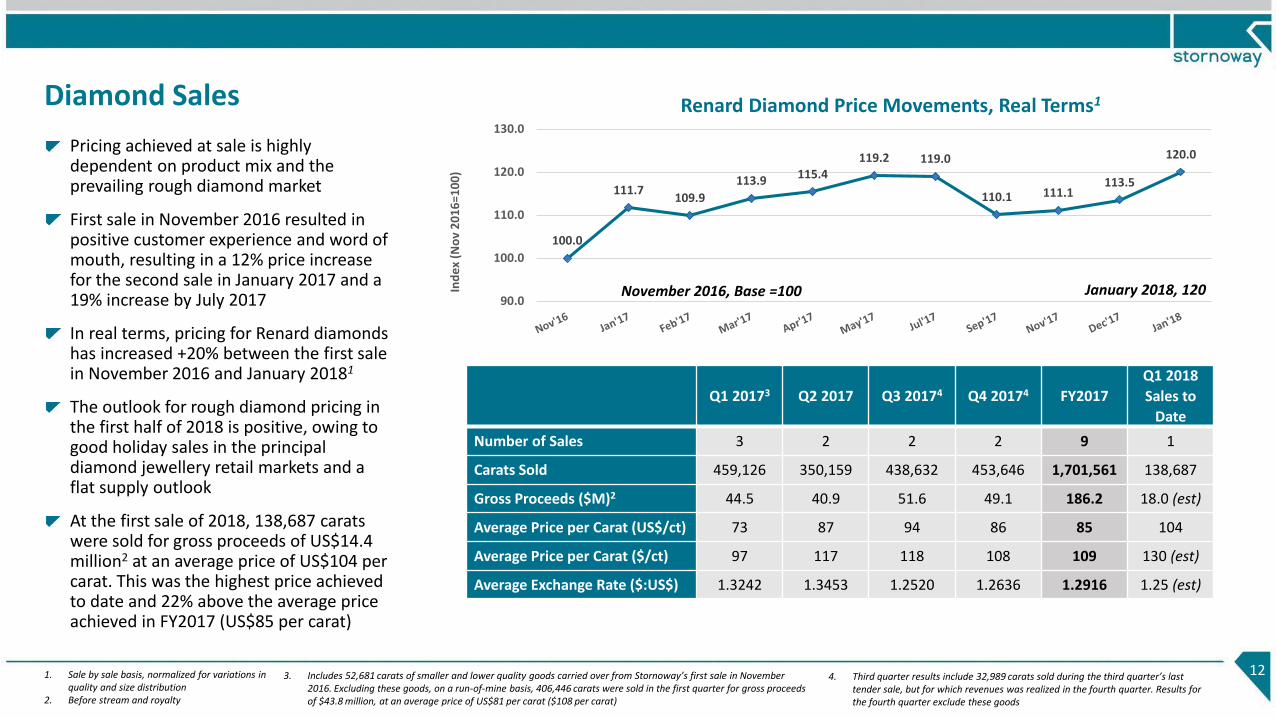
Renard Diamond Price Movements, Real Terms1
1. Sale by sale basis, normalized for variations in quality and size distribution
2. Before stream and royalty
November 2016, Base =100 January 2018, 120
Q1 20173 Q2 2017 Q3 20174 Q4 20174 FY2017
Q1 2018
Sales to
Date
Number of Sales 3 2 2 2 9 1
Carats Sold 459,126 350,159 438,632 453,646 1,701,561 138,687
Gross Proceeds ($M)2 44.5 40.9 51.6 49.1 186.2 18.0 (est)
Average Price per Carat (US$/ct) 73 87 94 86 85 104
Average Price per Carat ($/ct) 97 117 118 108 109 130 (est)
Average Exchange Rate ($:US$) 1.3242 1.3453 1.2520 1.2636 1.2916 1.25 (est)
3. Includes 52,681 carats of smaller and lower quality goods carried over from Stornoway’s first sale in November 2016. Excluding these goods, on a run-of-mine basis, 406,446 carats were sold in the first quarter for gross proceeds of $43.8 million, at an average price of US$81 per carat ($108 per carat)
Pricing achieved at sale is highly dependent on product mix and the prevailing rough diamond market
First sale in November 2016 resulted in positive customer experience and word of mouth, resulting in a 12% price increase for the second sale in January 2017 and a 19% increase by July 2017
In real terms, pricing for Renard diamonds has increased +20% between the first sale in November 2016 and January 20181
The outlook for rough diamond pricing in the first half of 2018 is positive, owing to good holiday sales in the principal diamond jewellery retail markets and a flat supply outlook
At the first sale of 2018, 138,687 carats were sold for gross proceeds of US$14.4 million2 at an average price of US$104 per carat. This was the highest price achieved to date and 22% above the average price achieved in FY2017 (US$85 per carat)
4. Third quarter results include 32,989 carats sold during the third quarter’s last tender sale, but for which revenues was realized in the fourth quarter. Results for the fourth quarter exclude these goods
13
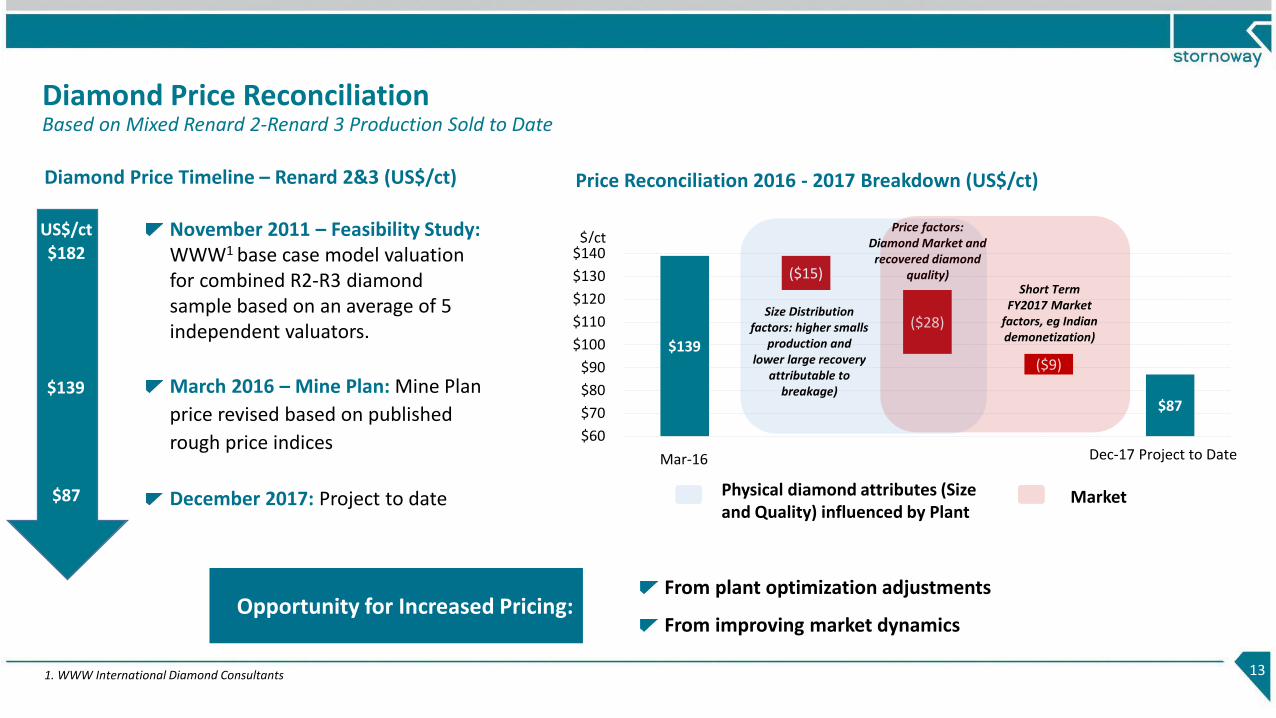
Diamond Price ReconciliationBased on Mixed Renard 2-Renard 3 Production Sold to Date
Diamond Price Timeline – Renard 2&3 (US$/ct)
November 2011 – Feasibility Study: WWW1 base case model valuation for combined R2-R3 diamond sample based on an average of 5 independent valuators.
March 2016 – Mine Plan: Mine Plan
price revised based on published
rough price indices
December 2017: Project to date
Opportunity for Increased Pricing:From plant optimization adjustments
From improving market dynamics
$139
$87
($15)
($28)
($9)
$60
$70
$80
$90
$100
$110
$120
$130
$140
($15) ($28) ($9)Mar-16 Dec-17 Project to Date
$/ct
Price Reconciliation 2016 - 2017 Breakdown (US$/ct)
Price factors: Diamond Market and recovered diamond
quality)
Size Distribution factors: higher smalls
production and lower large recovery
attributable to breakage)
Short Term FY2017 Market
factors, eg Indian demonetization)
MarketPhysical diamond attributes (Size and Quality) influenced by Plant
US$/ct
$182
$139
$87
1. WWW International Diamond Consultants
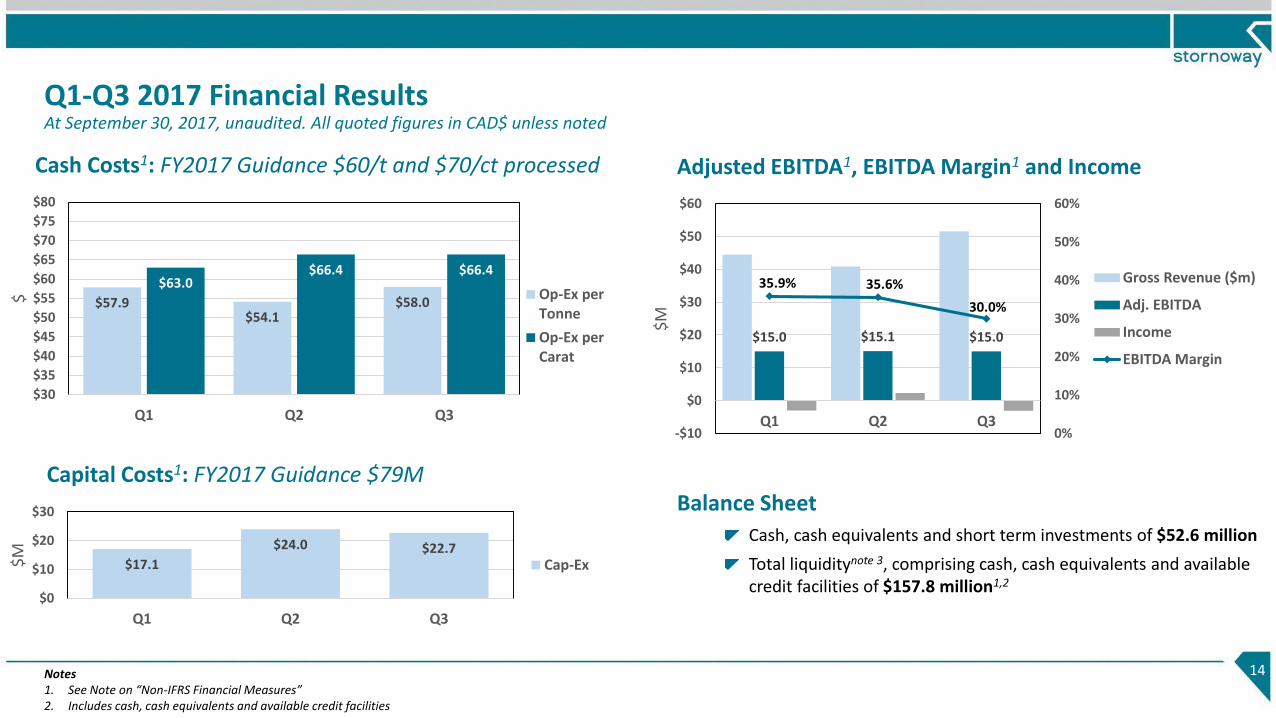
Q1-Q3 2017 Financial ResultsAt September 30, 2017, unaudited. All quoted figures in CAD$ unless noted
Adjusted EBITDA1, EBITDA Margin1 and Income
Balance Sheet
Cash, cash equivalents and short term investments of $52.6 million
Total liquiditynote 3, comprising cash, cash equivalents and available credit facilities of $157.8 million1,2
14Notes1. See Note on “Non-IFRS Financial Measures”2. Includes cash, cash equivalents and available credit facilities
$15.0 $15.1 $15.0
35.9% 35.6%
30.0%
0%
10%
20%
30%
40%
50%
60%
-$10
$0
$10
$20
$30
$40
$50
$60
Q1 Q2 Q3
$M
Gross Revenue ($m)
Adj. EBITDA
Income
EBITDA Margin
Cash Costs1: FY2017 Guidance $60/t and $70/ct processed
$57.9$54.1
$58.0
$63.0$66.4 $66.4
$30
$35
$40
$45
$50
$55
$60
$65
$70
$75
$80
Q1 Q2 Q3
$ Op-Ex perTonne
Op-Ex perCarat
$17.1
$24.0 $22.7
$0
$10
$20
$30
Q1 Q2 Q3
$M
Cap-Ex
Capital Costs1: FY2017 Guidance $79M
OutlookAs of December 31, 2017
15
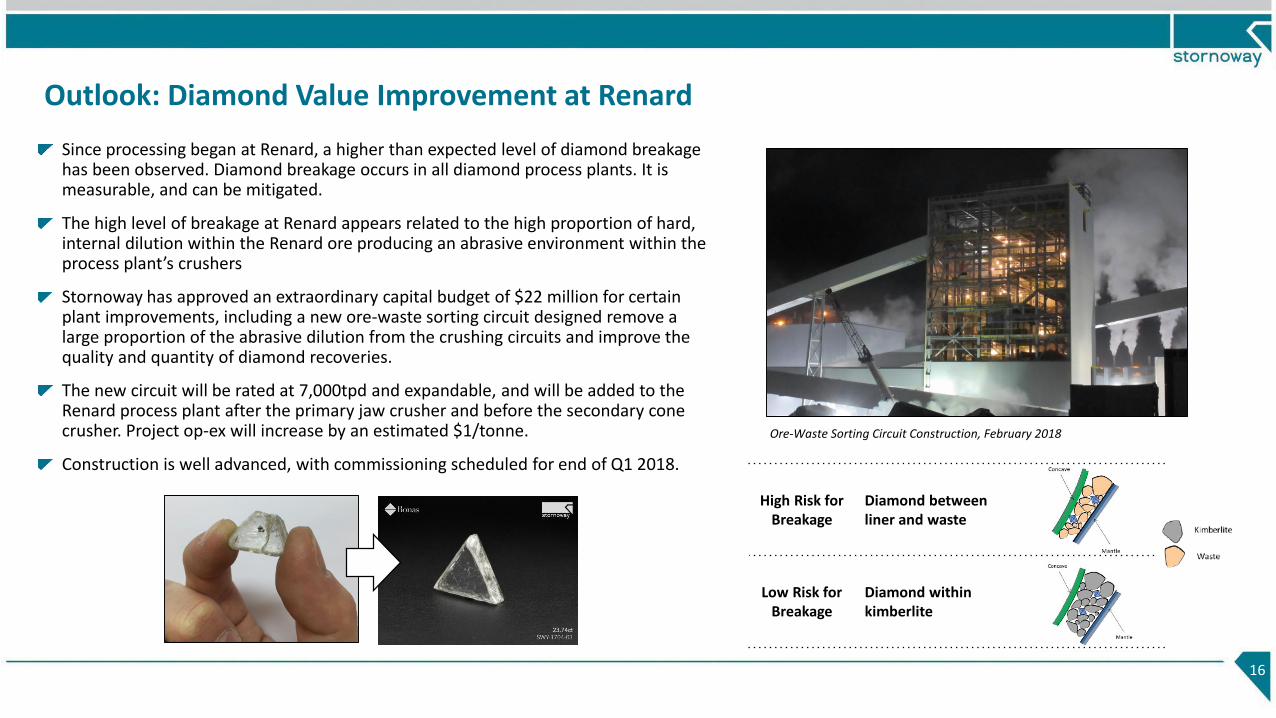
High Risk for Breakage
Diamond between liner and waste
Low Risk for Breakage
Diamond within kimberlite
Outlook: Diamond Value Improvement at Renard
Since processing began at Renard, a higher than expected level of diamond breakage has been observed. Diamond breakage occurs in all diamond process plants. It is measurable, and can be mitigated.
The high level of breakage at Renard appears related to the high proportion of hard, internal dilution within the Renard ore producing an abrasive environment within the process plant’s crushers
Stornoway has approved an extraordinary capital budget of $22 million for certain plant improvements, including a new ore-waste sorting circuit designed remove a large proportion of the abrasive dilution from the crushing circuits and improve the quality and quantity of diamond recoveries.
The new circuit will be rated at 7,000tpd and expandable, and will be added to the Renard process plant after the primary jaw crusher and before the secondary cone crusher. Project op-ex will increase by an estimated $1/tonne.
Construction is well advanced, with commissioning scheduled for end of Q1 2018.
16
Ore-Waste Sorting Circuit Construction, February 2018
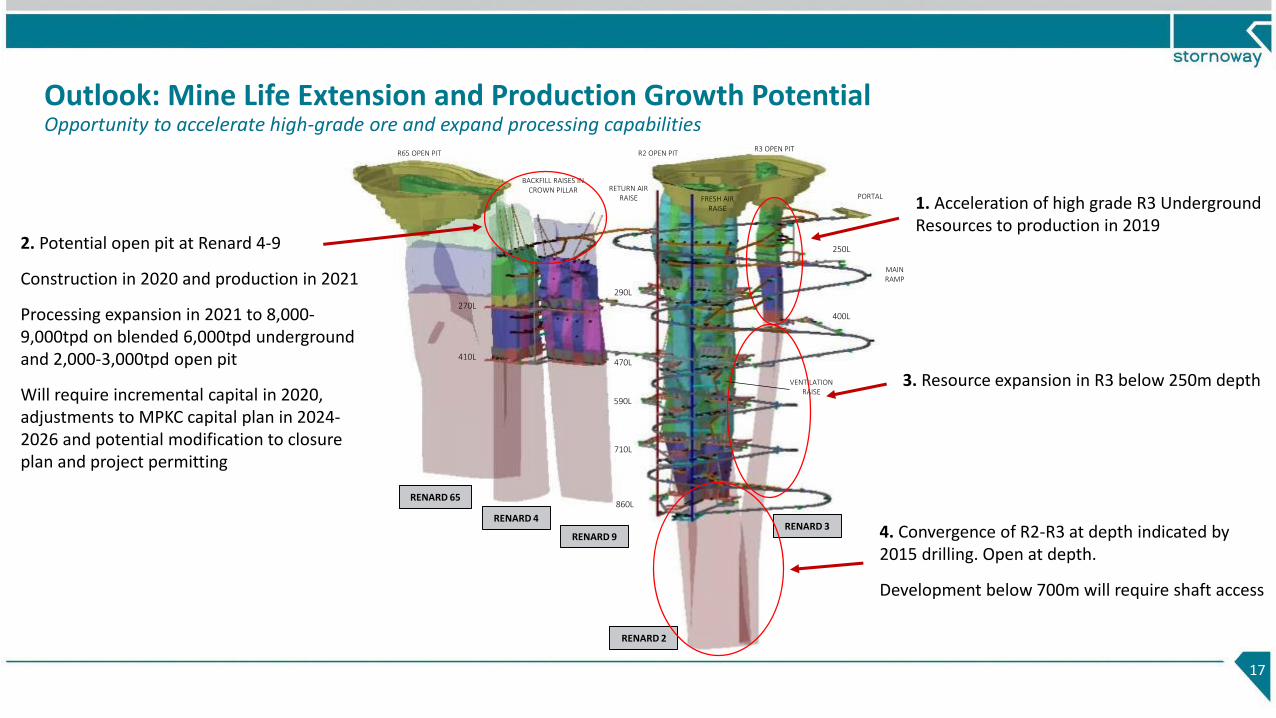
Outlook: Mine Life Extension and Production Growth Potential Opportunity to accelerate high-grade ore and expand processing capabilities
17
R3 OPEN PITR2 OPEN PITR65 OPEN PIT
RETURN AIR RAISE FRESH AIR
RAISE
PORTAL
BACKFILL RAISES IN CROWN PILLAR
410L
270L
710L
590L
470L
290L
400L
250L
860L
VENTILATION RAISE
MAIN RAMP
RENARD 65
RENARD 4
RENARD 9
RENARD 2
RENARD 3
1. Acceleration of high grade R3 Underground Resources to production in 2019
3. Resource expansion in R3 below 250m depth
2. Potential open pit at Renard 4-9
Construction in 2020 and production in 2021
Processing expansion in 2021 to 8,000-9,000tpd on blended 6,000tpd underground and 2,000-3,000tpd open pit
Will require incremental capital in 2020, adjustments to MPKC capital plan in 2024-2026 and potential modification to closure plan and project permitting
4. Convergence of R2-R3 at depth indicated by 2015 drilling. Open at depth.
Development below 700m will require shaft access
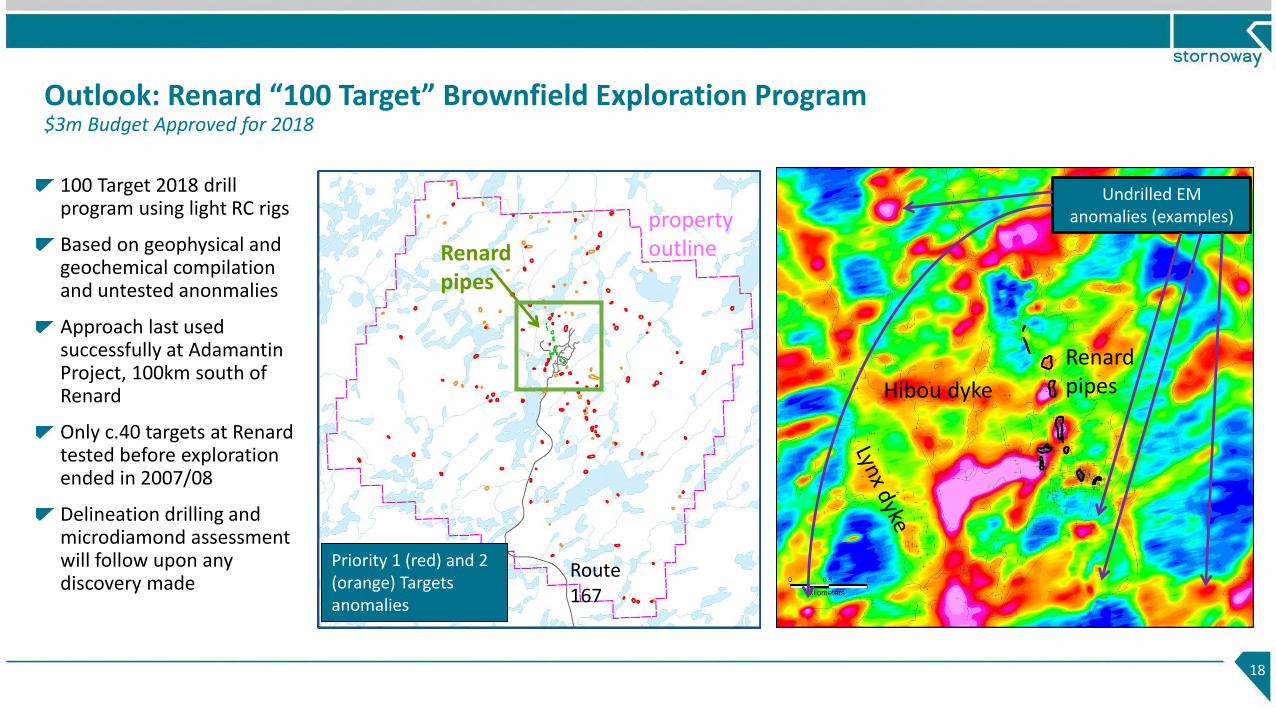
Outlook: Renard “100 Target” Brownfield Exploration Program$3m Budget Approved for 2018
100 Target 2018 drill program using light RC rigs
Based on geophysical and geochemical compilation and untested anonmalies
Approach last used successfully at AdamantinProject, 100km south of Renard
Only c.40 targets at Renardtested before exploration ended in 2007/08
Delineation drilling and microdiamond assessment will follow upon any discovery made
18
Renard pipesHibou dyke
Priority 1 (red) and 2 (orange) Targets anomalies
Route 167
property outline
Undrilled EM anomalies (examples)
Renard pipes
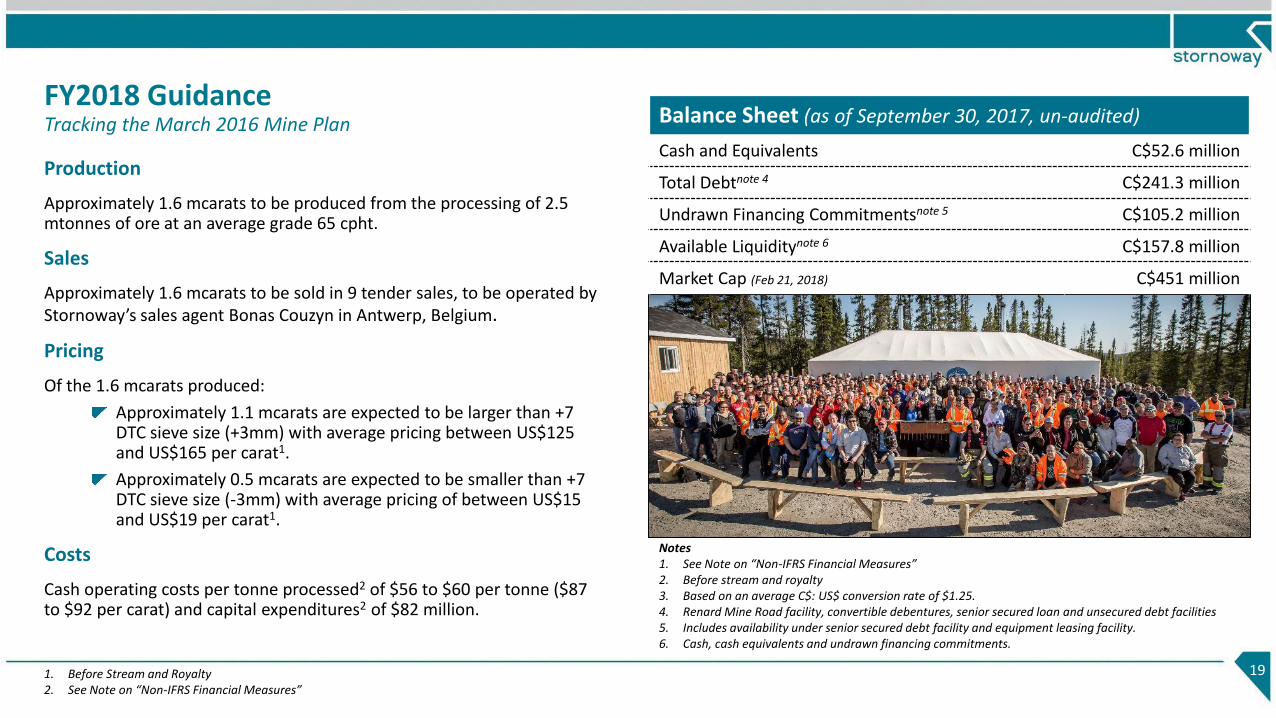
FY2018 GuidanceTracking the March 2016 Mine Plan
191. Before Stream and Royalty2. See Note on “Non-IFRS Financial Measures”
Production
Approximately 1.6 mcarats to be produced from the processing of 2.5 mtonnes of ore at an average grade 65 cpht.
Sales
Approximately 1.6 mcarats to be sold in 9 tender sales, to be operated by Stornoway’s sales agent Bonas Couzyn in Antwerp, Belgium.
Pricing
Of the 1.6 mcarats produced:
Approximately 1.1 mcarats are expected to be larger than +7 DTC sieve size (+3mm) with average pricing between US$125 and US$165 per carat1.
Approximately 0.5 mcarats are expected to be smaller than +7 DTC sieve size (-3mm) with average pricing of between US$15 and US$19 per carat1.
Costs
Cash operating costs per tonne processed2 of $56 to $60 per tonne ($87 to $92 per carat) and capital expenditures2 of $82 million.
Balance Sheet (as of September 30, 2017, un-audited)
Cash and Equivalents C$52.6 million
Total Debtnote 4 C$241.3 million
Undrawn Financing Commitmentsnote 5 C$105.2 million
Available Liquiditynote 6 C$157.8 million
Market Cap (Feb 21, 2018) C$451 million
Notes1. See Note on “Non-IFRS Financial Measures”2. Before stream and royalty3. Based on an average C$: US$ conversion rate of $1.25.4. Renard Mine Road facility, convertible debentures, senior secured loan and unsecured debt facilities5. Includes availability under senior secured debt facility and equipment leasing facility.6. Cash, cash equivalents and undrawn financing commitments.
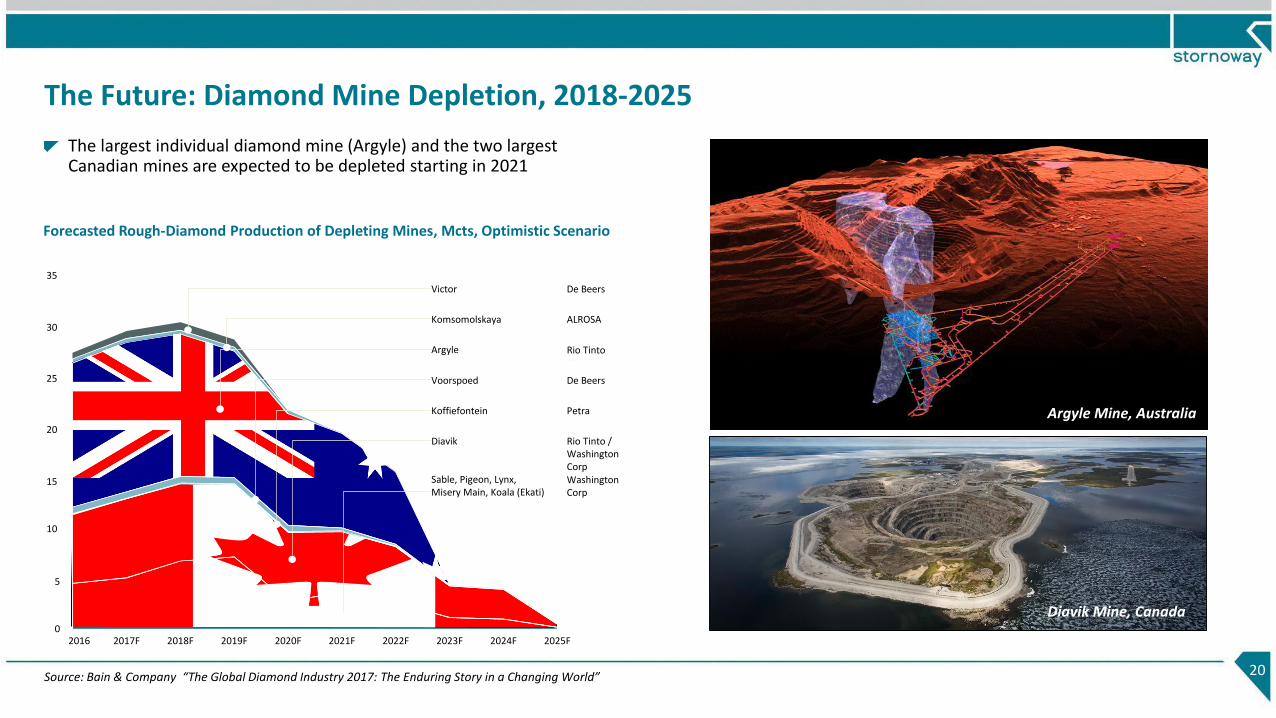
The Future: Diamond Mine Depletion, 2018-2025
The largest individual diamond mine (Argyle) and the two largest Canadian mines are expected to be depleted starting in 2021
20
Forecasted Rough-Diamond Production of Depleting Mines, Mcts, Optimistic Scenario
Argyle Mine, Australia
Source: Bain & Company “The Global Diamond Industry 2017: The Enduring Story in a Changing World”
Victor De Beers
Komsomolskaya ALROSA
Argyle Rio Tinto
Voorspoed De Beers
Koffiefontein Petra
Diavik Rio Tinto / Washington Corp
Sable, Pigeon, Lynx,Misery Main, Koala (Ekati)
Washington Corp
30
25
20
15
0
35
2016 2017F 2018F 2019F 2020F 2021F
10
5
2022F 2023F 2024F 2025F
Diavik Mine, Canada
Victor De Beers
Komsomolskaya ALROSA
Argyle Rio Tinto
Voorspoed De Beers
Koffiefontein Petra
Diavik Rio Tinto / Washington Corp
Sable, Pigeon, Lynx,Misery Main, Koala (Ekati)
Washington Corp
30
25
20
15
0
35
2016 2017F 2018F 2019F 2020F 2021F
10
5
2022F 2023F 2024F 2025F
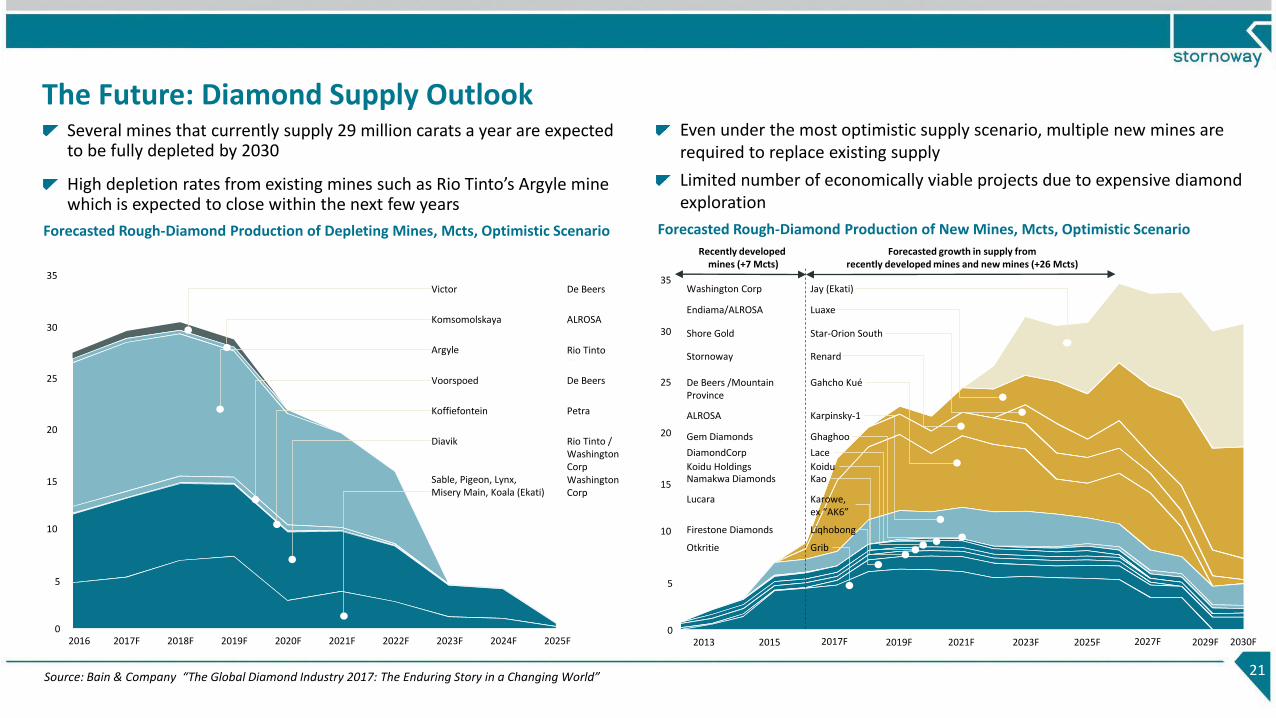
Several mines that currently supply 29 million carats a year are expected to be fully depleted by 2030
High depletion rates from existing mines such as Rio Tinto’s Argyle mine which is expected to close within the next few years
Even under the most optimistic supply scenario, multiple new mines are required to replace existing supply
Limited number of economically viable projects due to expensive diamond exploration
Forecasted Rough-Diamond Production of Depleting Mines, Mcts, Optimistic Scenario
The Future: Diamond Supply Outlook
Forecasted Rough-Diamond Production of New Mines, Mcts, Optimistic Scenario
Source: Bain & Company “The Global Diamond Industry 2017: The Enduring Story in a Changing World” 21
Washington Corp
Endiama/ALROSA
Shore Gold
Stornoway
De Beers /Mountain Province
ALROSA
Namakwa Diamonds
Gem Diamonds
DiamondCorp
Koidu Holdings
Lucara
Firestone Diamonds
Otkritie
Jay (Ekati)
Luaxe
Star-Orion South
Renard
Gahcho Kué
Karpinsky-1
Kao
Ghaghoo
Lace
Koidu
Karowe,ex “AK6”
Liqhobong
Grib
30
25
20
15
0
35
2013 2015 2017F 2019F 2021F 2023F
10
5
2025F 2027F 2029F 2030F
Forecasted growth in supply fromrecently developed mines and new mines (+26 Mcts)
Recently developedmines (+7 Mcts)
22
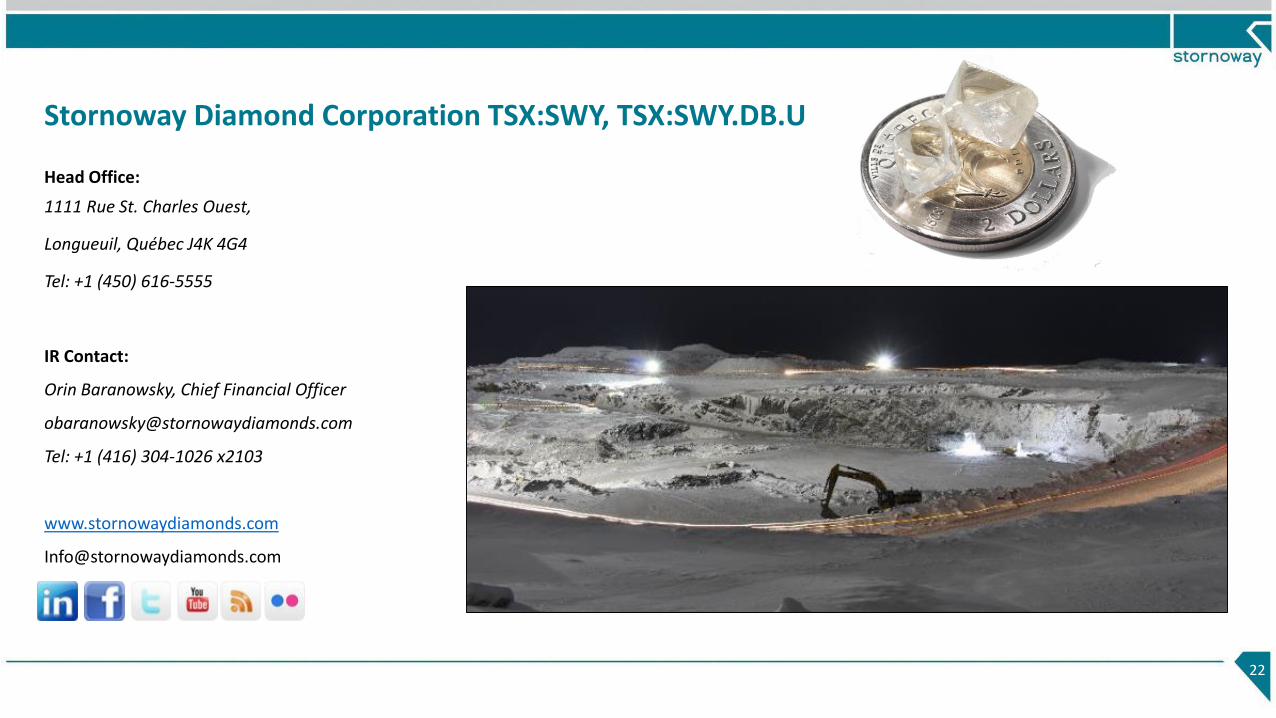
Head Office:
1111 Rue St. Charles Ouest,
Longueuil, Québec J4K 4G4
Tel: +1 (450) 616-5555
IR Contact:
Orin Baranowsky, Chief Financial Officer
Tel: +1 (416) 304-1026 x2103
www.stornowaydiamonds.com
Stornoway Diamond Corporation TSX:SWY, TSX:SWY.DB.U
Appendix
23
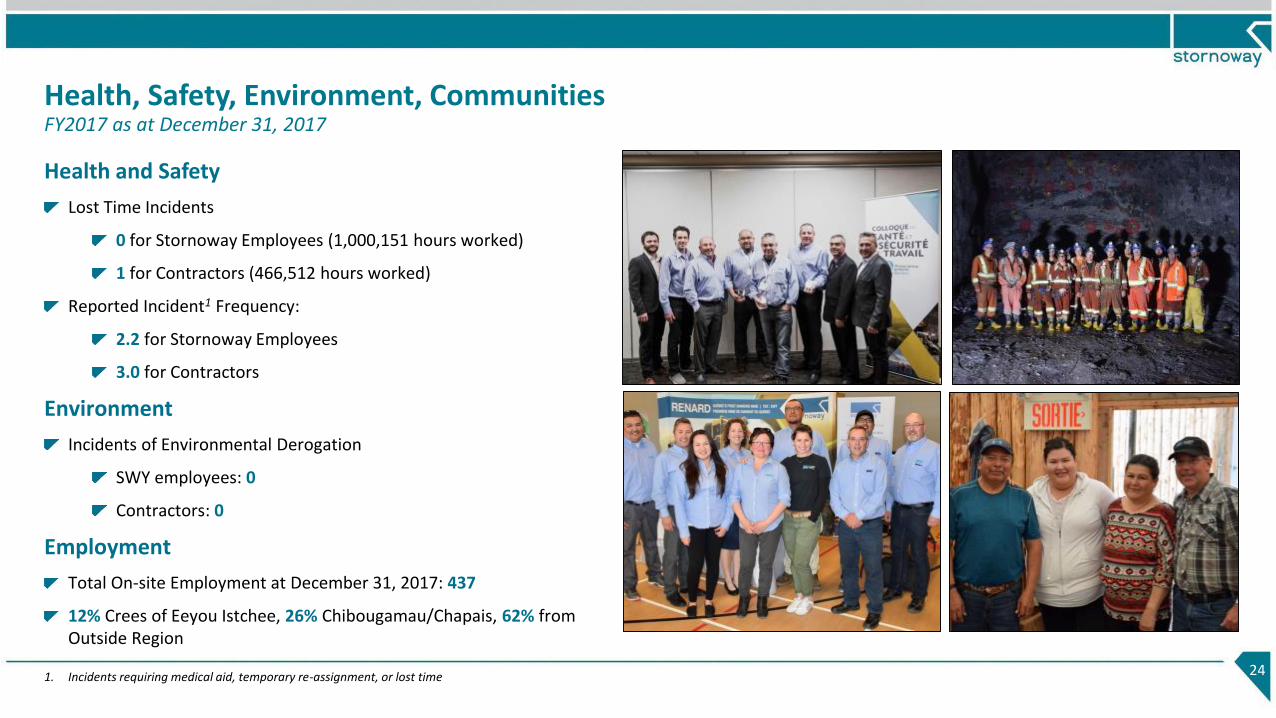
Health, Safety, Environment, CommunitiesFY2017 as at December 31, 2017
24
Health and Safety
Lost Time Incidents
0 for Stornoway Employees (1,000,151 hours worked)
1 for Contractors (466,512 hours worked)
Reported Incident1 Frequency:
2.2 for Stornoway Employees
3.0 for Contractors
Environment
Incidents of Environmental Derogation
SWY employees: 0
Contractors: 0
Employment
Total On-site Employment at December 31, 2017: 437
12% Crees of Eeyou Istchee, 26% Chibougamau/Chapais, 62% from Outside Region
1. Incidents requiring medical aid, temporary re-assignment, or lost time
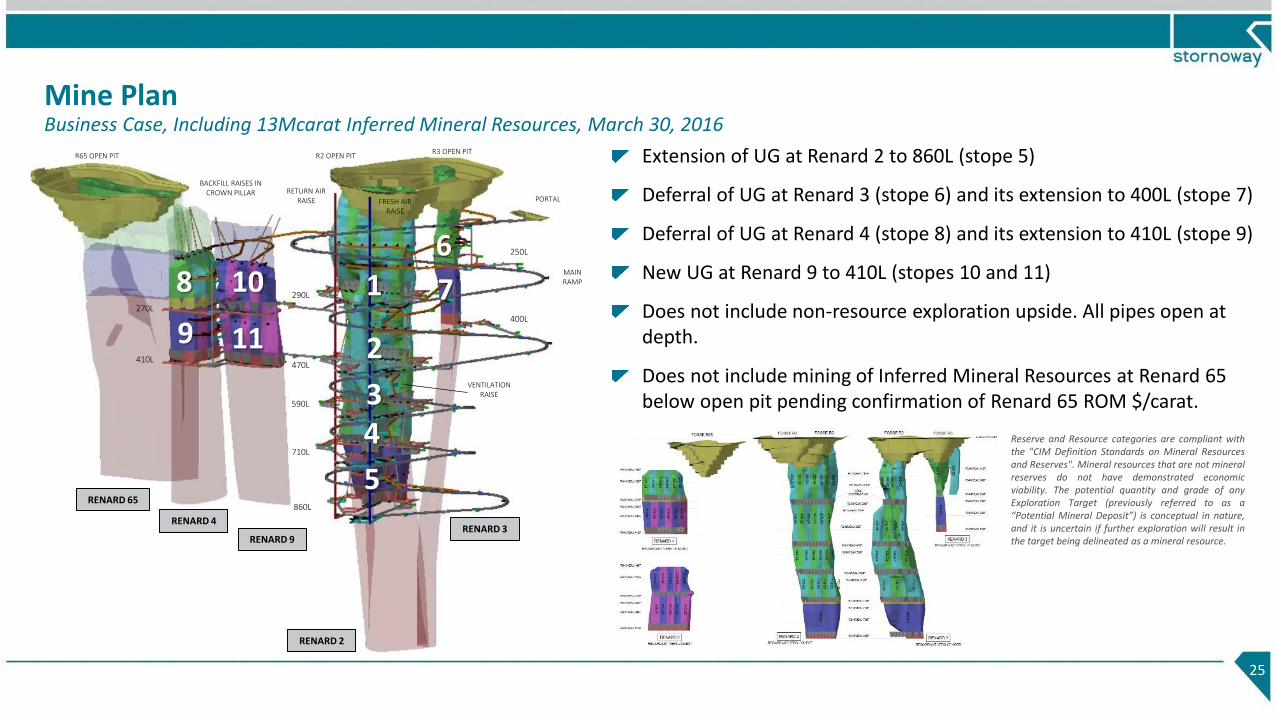
Mine PlanBusiness Case, Including 13Mcarat Inferred Mineral Resources, March 30, 2016
Extension of UG at Renard 2 to 860L (stope 5)
Deferral of UG at Renard 3 (stope 6) and its extension to 400L (stope 7)
Deferral of UG at Renard 4 (stope 8) and its extension to 410L (stope 9)
New UG at Renard 9 to 410L (stopes 10 and 11)
Does not include non-resource exploration upside. All pipes open at depth.
Does not include mining of Inferred Mineral Resources at Renard 65 below open pit pending confirmation of Renard 65 ROM $/carat.
25
7
9
10
11
R3 OPEN PITR2 OPEN PITR65 OPEN PIT
RETURN AIR RAISE FRESH AIR
RAISE
PORTAL
BACKFILL RAISES IN CROWN PILLAR
410L
270L
710L
590L
470L
290L
400L
250L
860L
VENTILATION RAISE
MAIN RAMP
5
1
4
2
3
86
Reserve and Resource categories are compliant withthe "CIM Definition Standards on Mineral Resourcesand Reserves". Mineral resources that are not mineralreserves do not have demonstrated economicviability. The potential quantity and grade of anyExploration Target (previously referred to as a“Potential Mineral Deposit”) is conceptual in nature,and it is uncertain if further exploration will result inthe target being delineated as a mineral resource.
RENARD 65
RENARD 4
RENARD 9
RENARD 2
RENARD 3
RENARD 65
RENARD 4
RENARD 9
RENARD 2
RENARD 3
RETURN AIR RAISE FRESH AIR
RAISE
PORTAL
BACKFILL RAISES IN CROWN PILLAR
410L
270L
710L
590L
470L
290L
400L
250L
860L
VENTILATION RAISE
MAIN RAMP
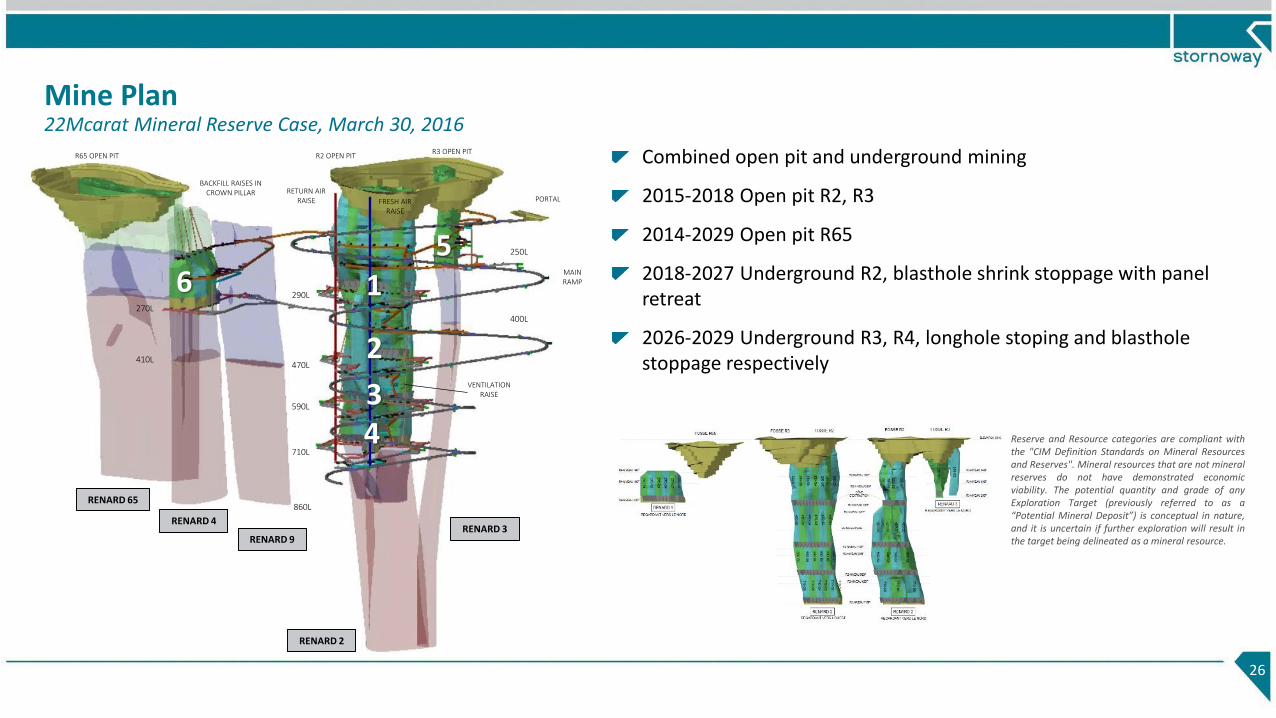
Mine Plan22Mcarat Mineral Reserve Case, March 30, 2016
Combined open pit and underground mining
2015-2018 Open pit R2, R3
2014-2029 Open pit R65
2018-2027 Underground R2, blasthole shrink stoppage with panel retreat
2026-2029 Underground R3, R4, longhole stoping and blastholestoppage respectively
26
1
4
2
3
65
R3 OPEN PITR2 OPEN PITR65 OPEN PIT
Reserve and Resource categories are compliant withthe "CIM Definition Standards on Mineral Resourcesand Reserves". Mineral resources that are not mineralreserves do not have demonstrated economicviability. The potential quantity and grade of anyExploration Target (previously referred to as a“Potential Mineral Deposit”) is conceptual in nature,and it is uncertain if further exploration will result inthe target being delineated as a mineral resource.
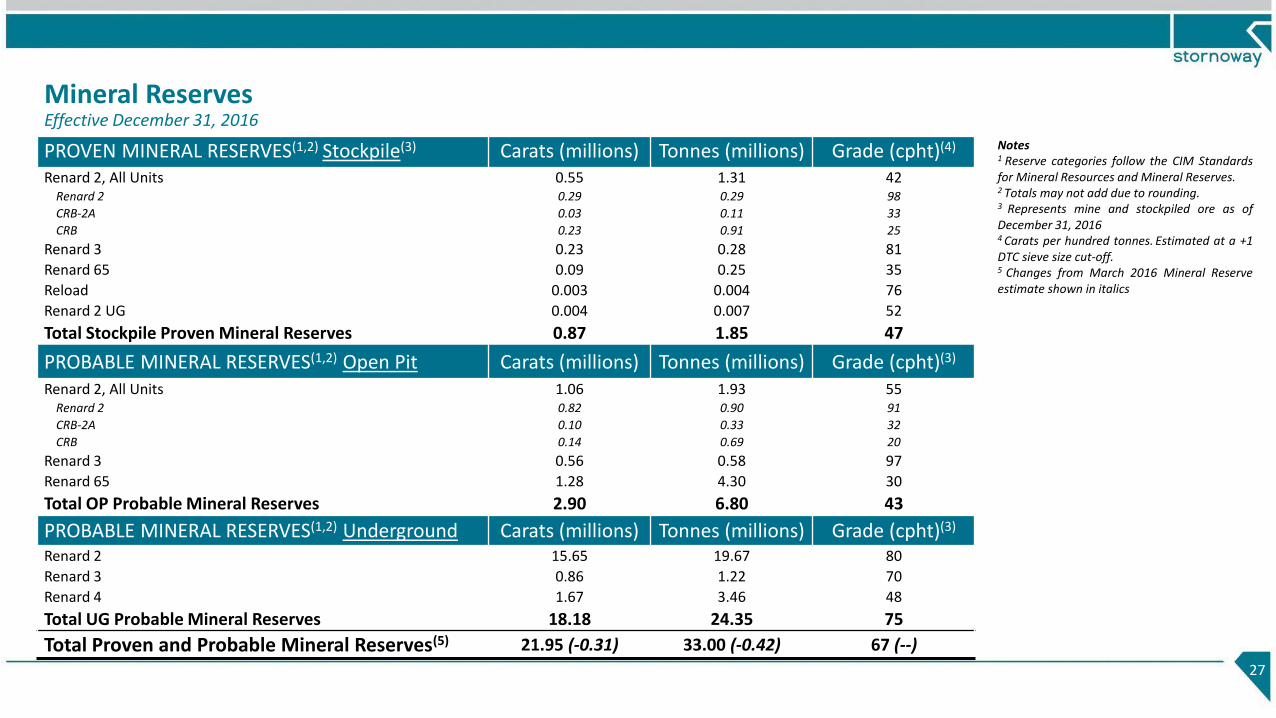
Mineral ReservesEffective December 31, 2016
27
Notes1 Reserve categories follow the CIM Standardsfor Mineral Resources and Mineral Reserves.2 Totals may not add due to rounding.3 Represents mine and stockpiled ore as ofDecember 31, 20164 Carats per hundred tonnes. Estimated at a +1DTC sieve size cut-off.5 Changes from March 2016 Mineral Reserveestimate shown in italics
PROVEN MINERAL RESERVES(1,2) Stockpile(3) Carats (millions) Tonnes (millions) Grade (cpht)(4)
Renard 2, All Units 0.55 1.31 42Renard 2 0.29 0.29 98
CRB-2A 0.03 0.11 33
CRB 0.23 0.91 25
Renard 3 0.23 0.28 81
Renard 65 0.09 0.25 35
Reload 0.003 0.004 76
Renard 2 UG 0.004 0.007 52
Total Stockpile Proven Mineral Reserves 0.87 1.85 47
PROBABLE MINERAL RESERVES(1,2) Open Pit Carats (millions) Tonnes (millions) Grade (cpht)(3)
Renard 2, All Units 1.06 1.93 55Renard 2 0.82 0.90 91
CRB-2A 0.10 0.33 32
CRB 0.14 0.69 20
Renard 3 0.56 0.58 97
Renard 65 1.28 4.30 30
Total OP Probable Mineral Reserves 2.90 6.80 43
PROBABLE MINERAL RESERVES(1,2) Underground Carats (millions) Tonnes (millions) Grade (cpht)(3)
Renard 2 15.65 19.67 80
Renard 3 0.86 1.22 70
Renard 4 1.67 3.46 48
Total UG Probable Mineral Reserves 18.18 24.35 75
Total Proven and Probable Mineral Reserves(5) 21.95 (-0.31) 33.00 (-0.42) 67 (--)
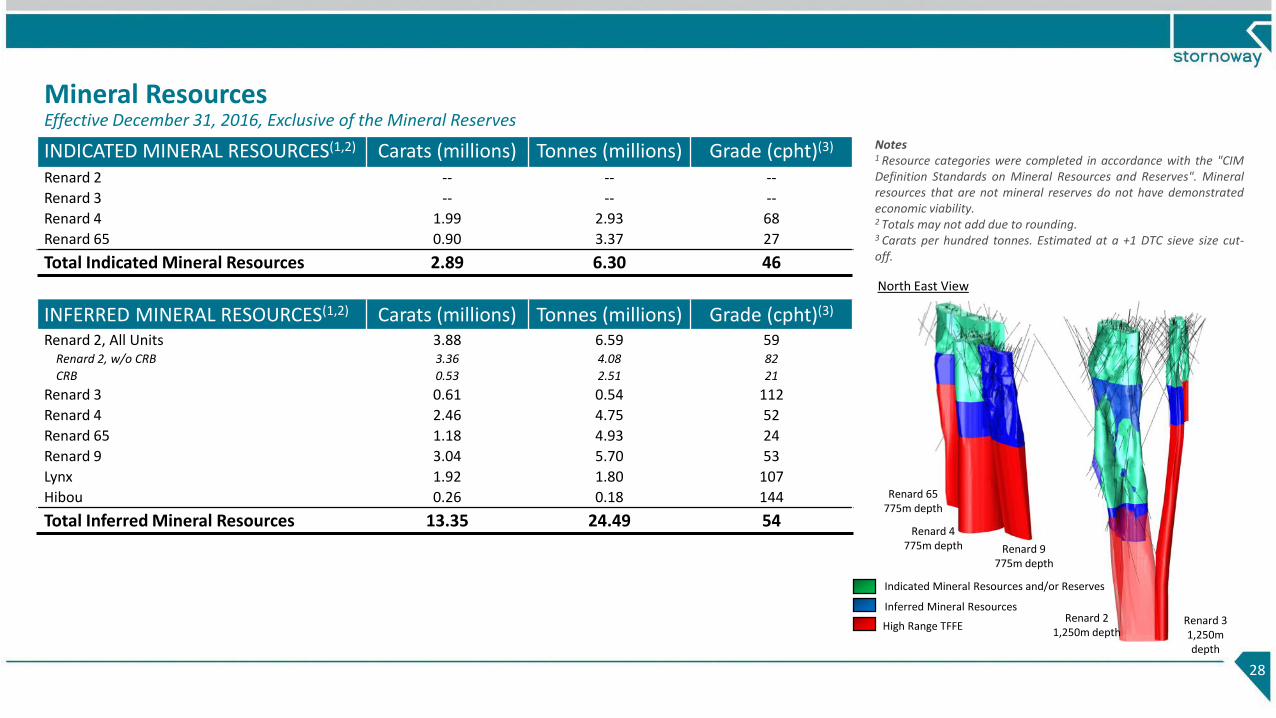
Mineral ResourcesEffective December 31, 2016, Exclusive of the Mineral Reserves
28
INDICATED MINERAL RESOURCES(1,2) Carats (millions) Tonnes (millions) Grade (cpht)(3)
Renard 2 -- -- --
Renard 3 -- -- --
Renard 4 1.99 2.93 68
Renard 65 0.90 3.37 27
Total Indicated Mineral Resources 2.89 6.30 46
INFERRED MINERAL RESOURCES(1,2) Carats (millions) Tonnes (millions) Grade (cpht)(3)
Renard 2, All Units 3.88 6.59 59Renard 2, w/o CRB 3.36 4.08 82
CRB 0.53 2.51 21
Renard 3 0.61 0.54 112
Renard 4 2.46 4.75 52
Renard 65 1.18 4.93 24
Renard 9 3.04 5.70 53
Lynx 1.92 1.80 107
Hibou 0.26 0.18 144
Total Inferred Mineral Resources 13.35 24.49 54
Notes1 Resource categories were completed in accordance with the "CIMDefinition Standards on Mineral Resources and Reserves". Mineralresources that are not mineral reserves do not have demonstratedeconomic viability.2 Totals may not add due to rounding.3 Carats per hundred tonnes. Estimated at a +1 DTC sieve size cut-off.
Inferred Mineral Resources
Indicated Mineral Resources and/or Reserves
High Range TFFE
Renard 65775m depth
Renard 4775m depth Renard 9
775m depth
Renard 21,250m depth
Renard 31,250m depth
North East View
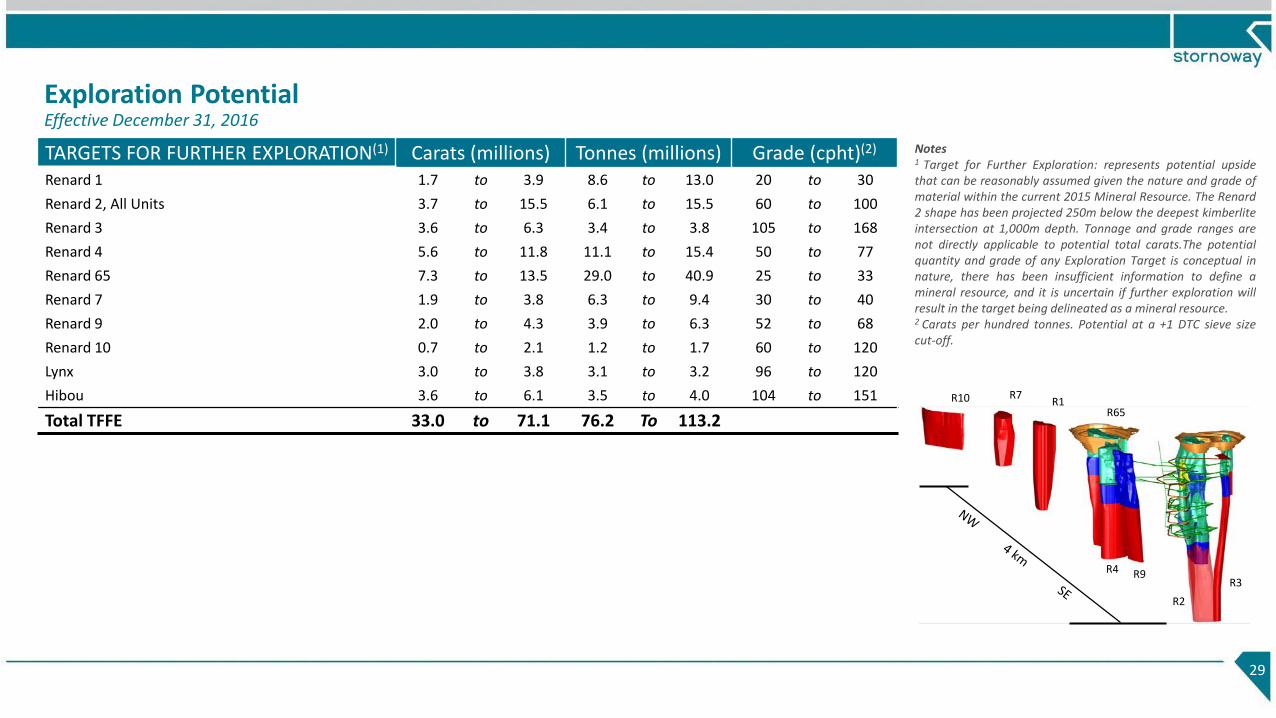
Notes1 Target for Further Exploration: represents potential upsidethat can be reasonably assumed given the nature and grade ofmaterial within the current 2015 Mineral Resource. The Renard2 shape has been projected 250m below the deepest kimberliteintersection at 1,000m depth. Tonnage and grade ranges arenot directly applicable to potential total carats.The potentialquantity and grade of any Exploration Target is conceptual innature, there has been insufficient information to define amineral resource, and it is uncertain if further exploration willresult in the target being delineated as a mineral resource.2 Carats per hundred tonnes. Potential at a +1 DTC sieve sizecut-off.
Exploration PotentialEffective December 31, 2016
29
TARGETS FOR FURTHER EXPLORATION(1) Carats (millions) Tonnes (millions) Grade (cpht)(2)
Renard 1 1.7 to 3.9 8.6 to 13.0 20 to 30
Renard 2, All Units 3.7 to 15.5 6.1 to 15.5 60 to 100
Renard 3 3.6 to 6.3 3.4 to 3.8 105 to 168
Renard 4 5.6 to 11.8 11.1 to 15.4 50 to 77
Renard 65 7.3 to 13.5 29.0 to 40.9 25 to 33
Renard 7 1.9 to 3.8 6.3 to 9.4 30 to 40
Renard 9 2.0 to 4.3 3.9 to 6.3 52 to 68
Renard 10 0.7 to 2.1 1.2 to 1.7 60 to 120
Lynx 3.0 to 3.8 3.1 to 3.2 96 to 120
Hibou 3.6 to 6.1 3.5 to 4.0 104 to 151
Total TFFE 33.0 to 71.1 76.2 To 113.2
R10 R7R1
R65
R4 R9
R2
R3
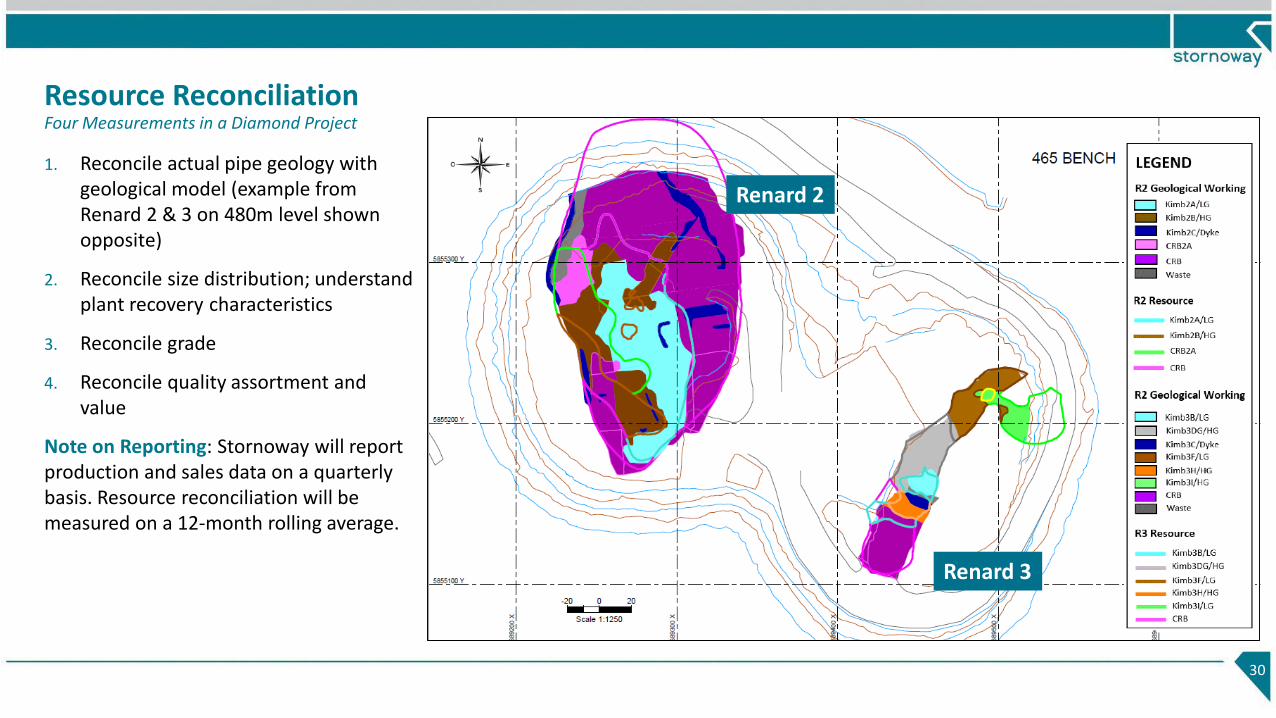
Resource ReconciliationFour Measurements in a Diamond Project
1. Reconcile actual pipe geology with geological model (example from Renard 2 & 3 on 480m level shown opposite)
2. Reconcile size distribution; understand plant recovery characteristics
3. Reconcile grade
4. Reconcile quality assortment and value
Note on Reporting: Stornoway will report production and sales data on a quarterly basis. Resource reconciliation will be measured on a 12-month rolling average.
30
Renard 2
Renard 3
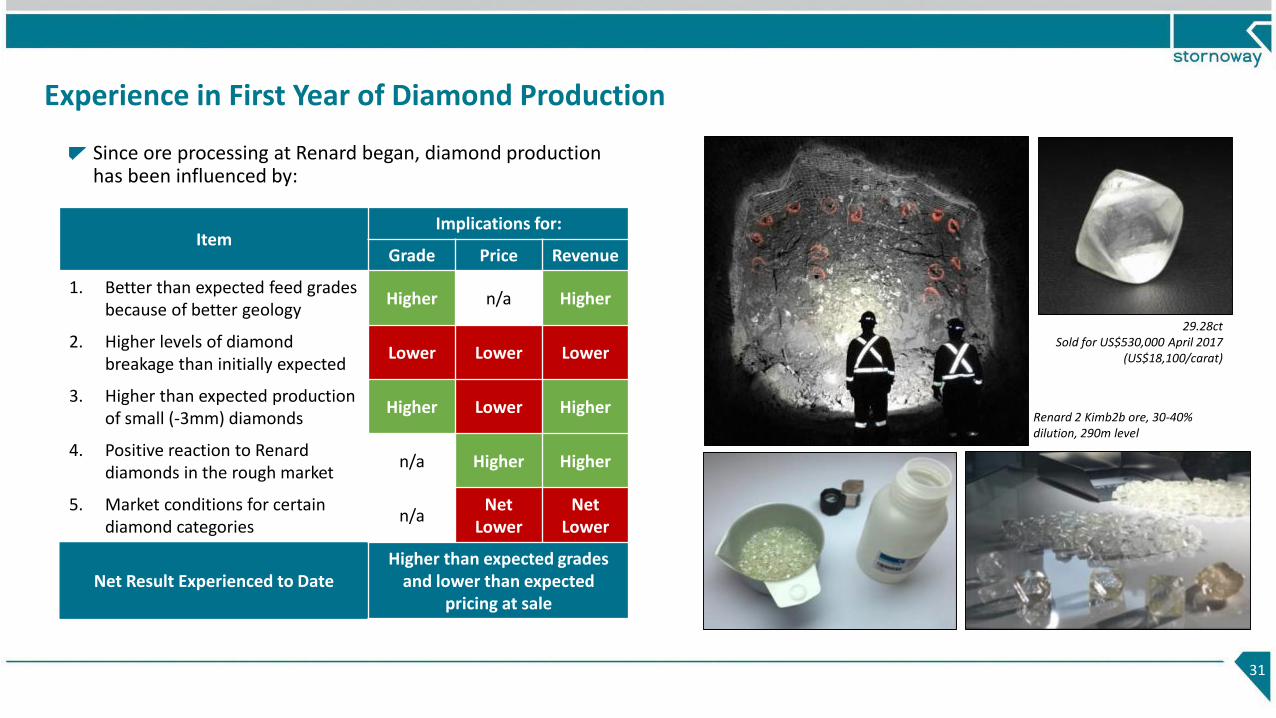
Since ore processing at Renard began, diamond production has been influenced by:
Experience in First Year of Diamond Production
31
ItemImplications for:
Grade Price Revenue
1. Better than expected feed grades because of better geology
Higher n/a Higher
2. Higher levels of diamondbreakage than initially expected
Lower Lower Lower
3. Higher than expected production of small (-3mm) diamonds
Higher Lower Higher
4. Positive reaction to Renard diamonds in the rough market
n/a Higher Higher
5. Market conditions for certain diamond categories
n/aNet
LowerNet
Lower
Net Result Experienced to DateHigher than expected grades
and lower than expected pricing at sale
29.28ctSold for US$530,000 April 2017
(US$18,100/carat)
Renard 2 Kimb2b ore, 30-40% dilution, 290m level
32
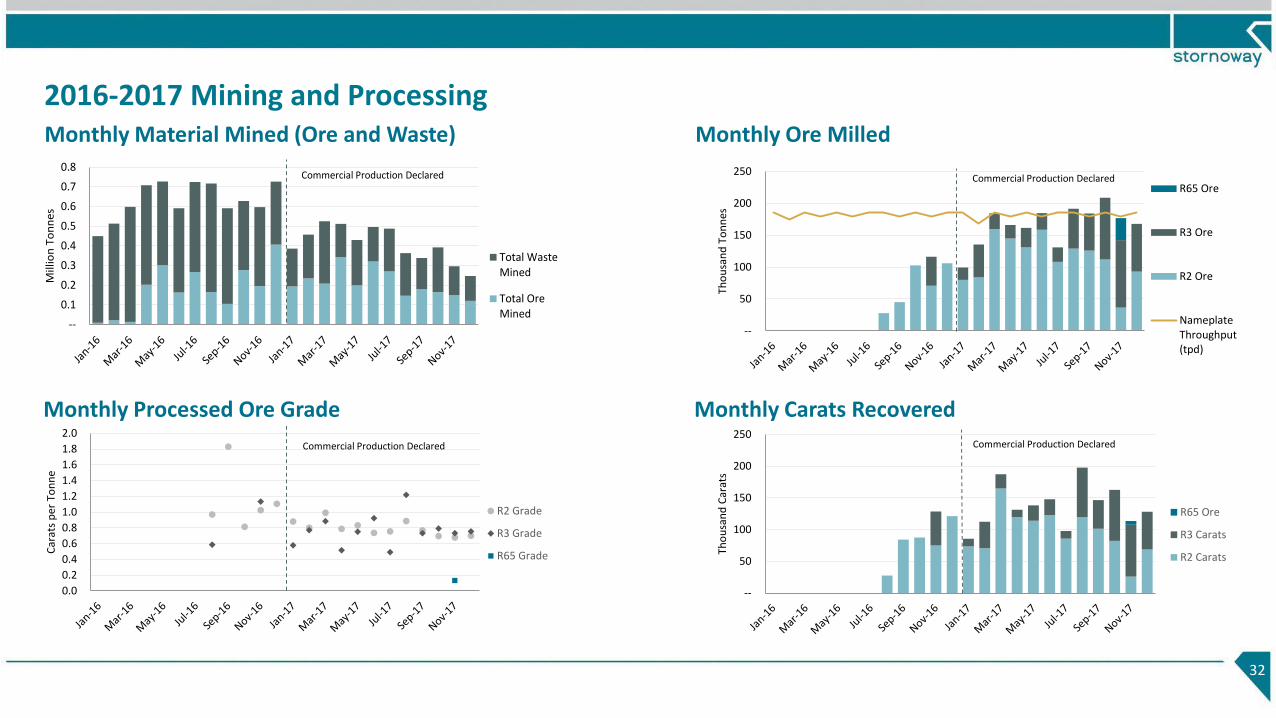
2016-2017 Mining and Processing
Ore Processed, Carats Recovered, head grade
Monthly Material Mined (Ore and Waste)
Monthly Processed Ore Grade
Monthly Ore Milled
Monthly Carats Recovered
0.0
0.2
0.4
0.6
0.8
1.0
1.2
1.4
1.6
1.8
2.0
Car
ats
per
To
nn
e
R2 Grade
R3 Grade
R65 Grade
Commercial Production Declared
--
50
100
150
200
250
Tho
usa
nd
Car
ats
R65 Ore
R3 Carats
R2 Carats
Commercial Production Declared
--
50
100
150
200
250
Tho
usa
nd
To
nn
es
R65 Ore
R3 Ore
R2 Ore
NameplateThroughput(tpd)
Commercial Production Declared
--
0.1
0.2
0.3
0.4
0.5
0.6
0.7
0.8
Mill
ion
To
nn
es
Total WasteMined
Total OreMined
Commercial Production Declared
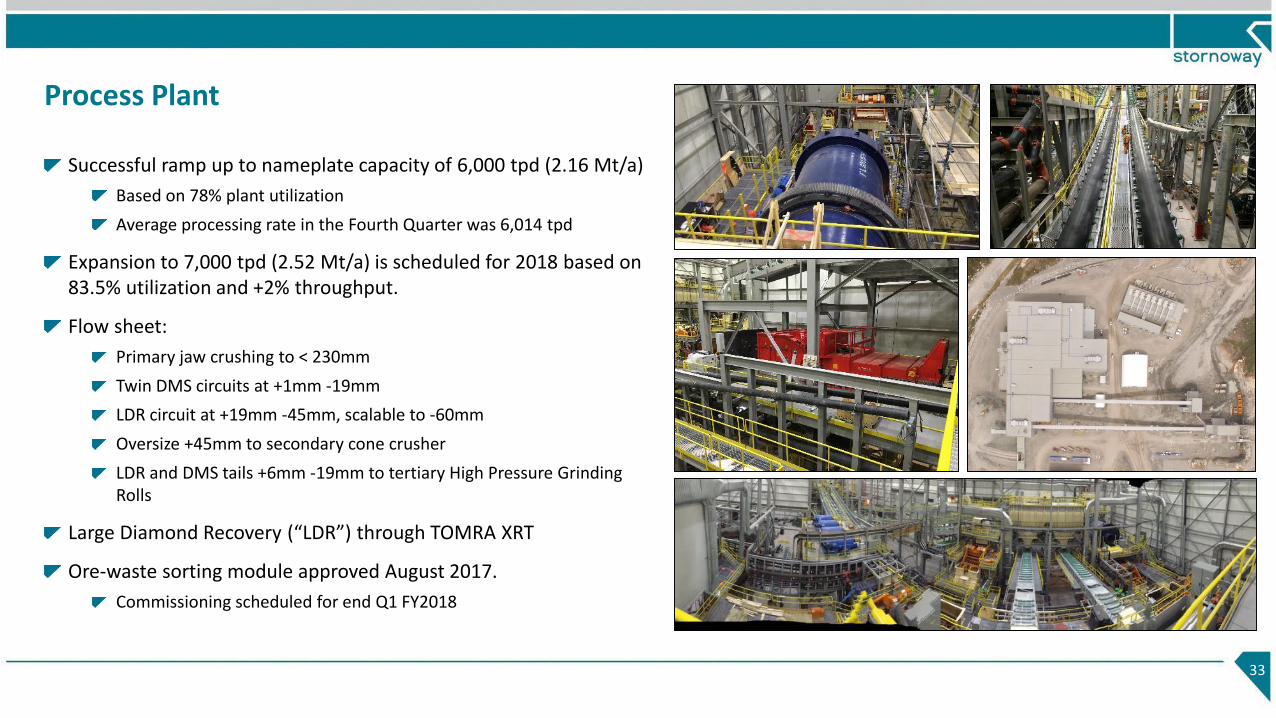
Process Plant
33
Successful ramp up to nameplate capacity of 6,000 tpd (2.16 Mt/a)
Based on 78% plant utilization
Average processing rate in the Fourth Quarter was 6,014 tpd
Expansion to 7,000 tpd (2.52 Mt/a) is scheduled for 2018 based on 83.5% utilization and +2% throughput.
Flow sheet:
Primary jaw crushing to < 230mm
Twin DMS circuits at +1mm -19mm
LDR circuit at +19mm -45mm, scalable to -60mm
Oversize +45mm to secondary cone crusher
LDR and DMS tails +6mm -19mm to tertiary High Pressure Grinding Rolls
Large Diamond Recovery (“LDR”) through TOMRA XRT
Ore-waste sorting module approved August 2017.
Commissioning scheduled for end Q1 FY2018
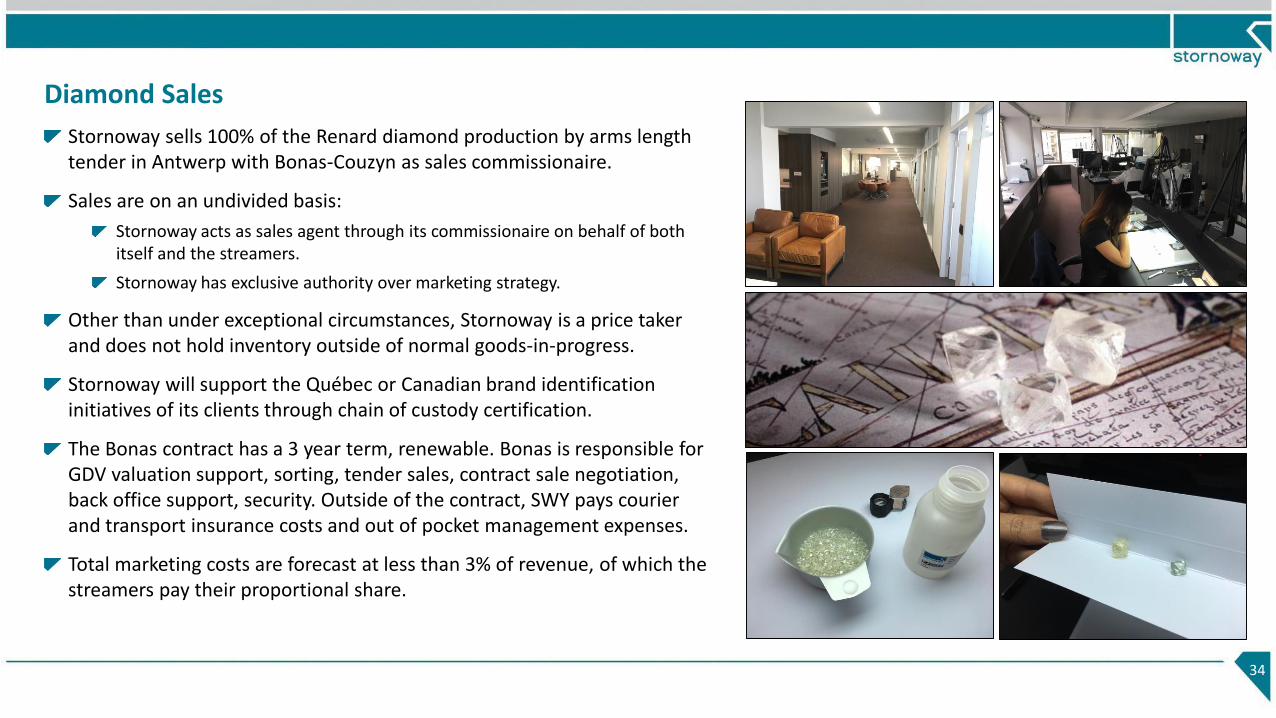
Diamond Sales
Stornoway sells 100% of the Renard diamond production by arms length tender in Antwerp with Bonas-Couzyn as sales commissionaire.
Sales are on an undivided basis:
Stornoway acts as sales agent through its commissionaire on behalf of both itself and the streamers.
Stornoway has exclusive authority over marketing strategy.
Other than under exceptional circumstances, Stornoway is a price taker and does not hold inventory outside of normal goods-in-progress.
Stornoway will support the Québec or Canadian brand identification initiatives of its clients through chain of custody certification.
The Bonas contract has a 3 year term, renewable. Bonas is responsible for GDV valuation support, sorting, tender sales, contract sale negotiation, back office support, security. Outside of the contract, SWY pays courier and transport insurance costs and out of pocket management expenses.
Total marketing costs are forecast at less than 3% of revenue, of which the streamers pay their proportional share.
34
35
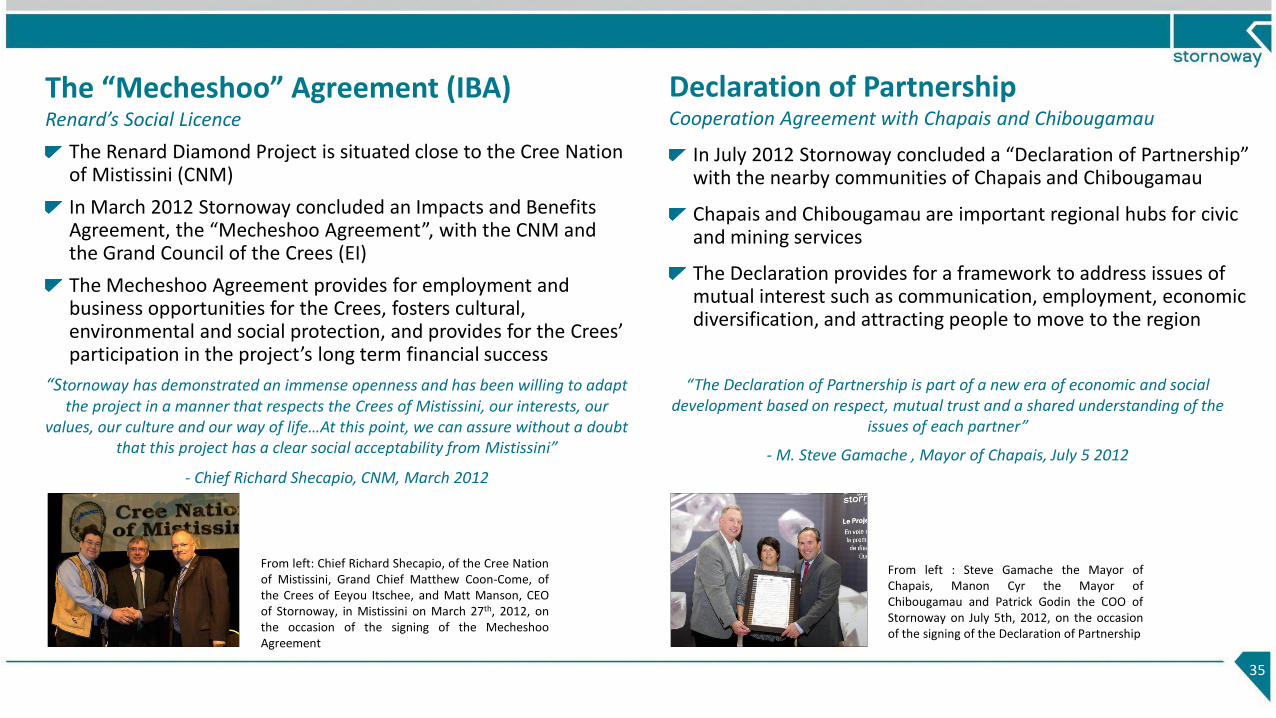
The “Mecheshoo” Agreement (IBA)Renard’s Social Licence
The Renard Diamond Project is situated close to the Cree Nation of Mistissini (CNM)
In March 2012 Stornoway concluded an Impacts and Benefits Agreement, the “Mecheshoo Agreement”, with the CNM and the Grand Council of the Crees (EI)
The Mecheshoo Agreement provides for employment and business opportunities for the Crees, fosters cultural, environmental and social protection, and provides for the Crees’ participation in the project’s long term financial success
“Stornoway has demonstrated an immense openness and has been willing to adapt the project in a manner that respects the Crees of Mistissini, our interests, our
values, our culture and our way of life…At this point, we can assure without a doubt that this project has a clear social acceptability from Mistissini”
- Chief Richard Shecapio, CNM, March 2012
Declaration of PartnershipCooperation Agreement with Chapais and Chibougamau
In July 2012 Stornoway concluded a “Declaration of Partnership” with the nearby communities of Chapais and Chibougamau
Chapais and Chibougamau are important regional hubs for civic and mining services
The Declaration provides for a framework to address issues of mutual interest such as communication, employment, economic diversification, and attracting people to move to the region
“The Declaration of Partnership is part of a new era of economic and social development based on respect, mutual trust and a shared understanding of the
issues of each partner”
- M. Steve Gamache , Mayor of Chapais, July 5 2012
From left: Chief Richard Shecapio, of the Cree Nationof Mistissini, Grand Chief Matthew Coon-Come, ofthe Crees of Eeyou Itschee, and Matt Manson, CEOof Stornoway, in Mistissini on March 27th, 2012, onthe occasion of the signing of the MecheshooAgreement
From left : Steve Gamache the Mayor ofChapais, Manon Cyr the Mayor ofChibougamau and Patrick Godin the COO ofStornoway on July 5th, 2012, on the occasionof the signing of the Declaration of Partnership
36
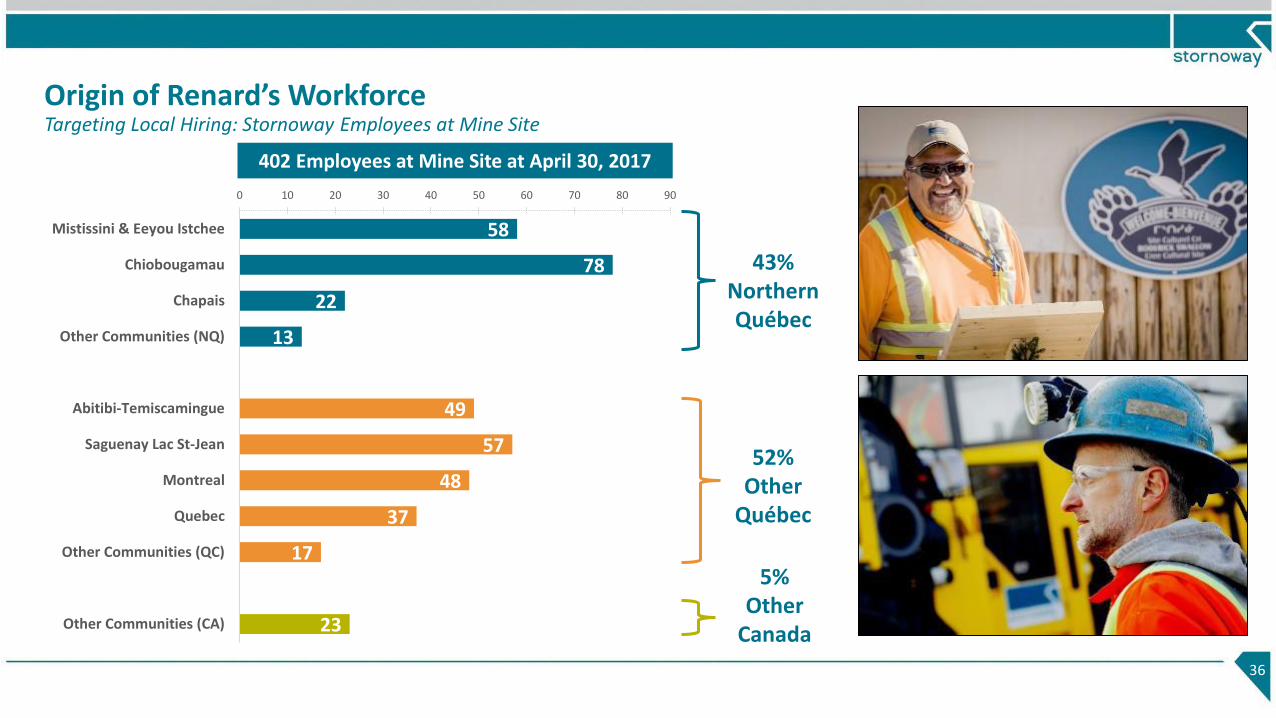
Origin of Renard’s WorkforceTargeting Local Hiring: Stornoway Employees at Mine Site
43% Northern Québec
52% Other
Québec
5% Other
Canada
58
78
22
13
49
57
48
37
17
23
0 10 20 30 40 50 60 70 80 90
Mistissini & Eeyou Istchee
Chiobougamau
Chapais
Other Communities (NQ)
Abitibi-Temiscamingue
Saguenay Lac St-Jean
Montreal
Quebec
Other Communities (QC)
Other Communities (CA)
402 Employees at Mine Site at April 30, 2017
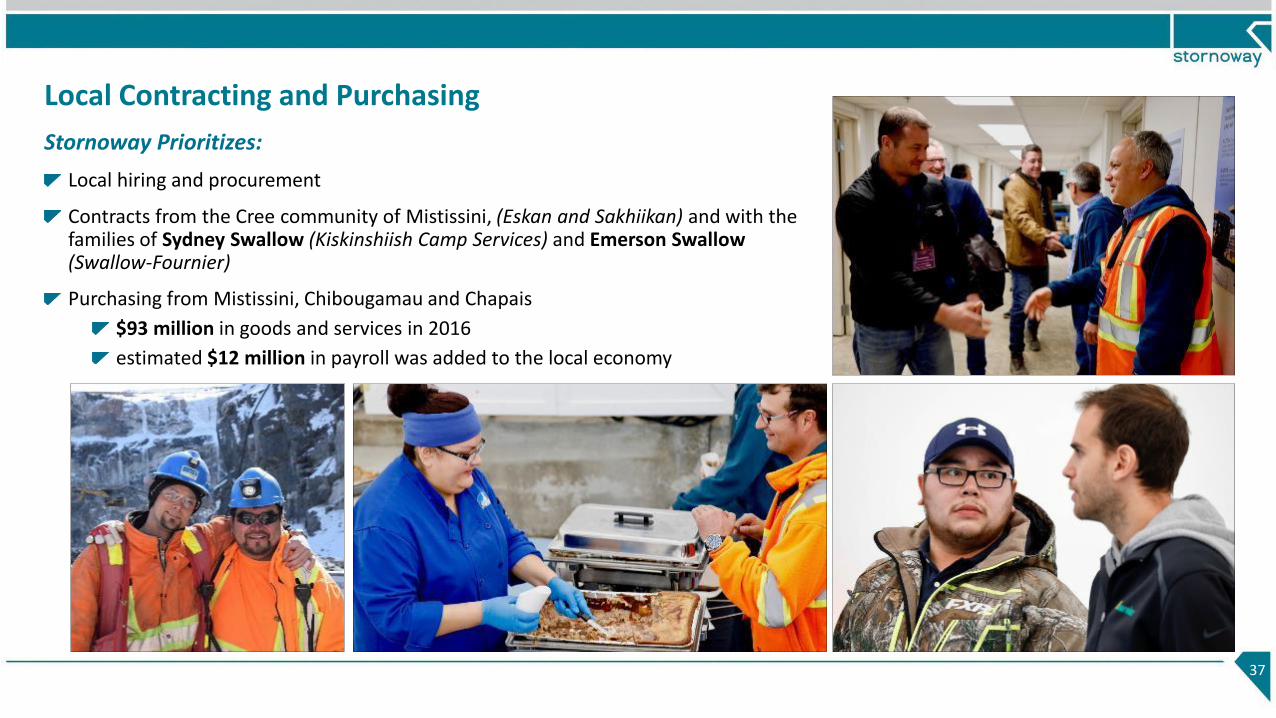
Local Contracting and Purchasing
Stornoway Prioritizes:
Local hiring and procurement
Contracts from the Cree community of Mistissini, (Eskan and Sakhiikan) and with the families of Sydney Swallow (Kiskinshiish Camp Services) and Emerson Swallow (Swallow-Fournier)
Purchasing from Mistissini, Chibougamau and Chapais
$93 million in goods and services in 2016
estimated $12 million in payroll was added to the local economy
37
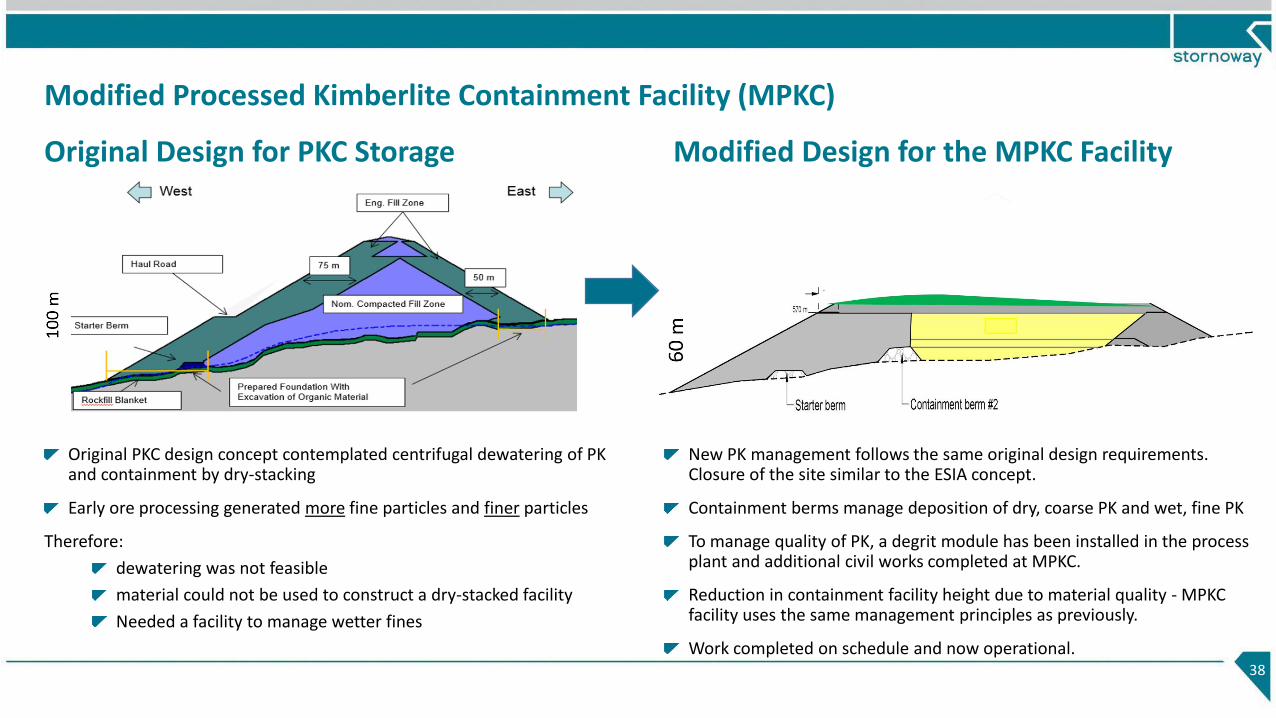
Modified Processed Kimberlite Containment Facility (MPKC)
38
Original Design for PKC Storage Modified Design for the MPKC Facility
Original PKC design concept contemplated centrifugal dewatering of PK and containment by dry-stacking
Early ore processing generated more fine particles and finer particles
Therefore:
dewatering was not feasible
material could not be used to construct a dry-stacked facility
Needed a facility to manage wetter fines
New PK management follows the same original design requirements. Closure of the site similar to the ESIA concept.
Containment berms manage deposition of dry, coarse PK and wet, fine PK
To manage quality of PK, a degrit module has been installed in the process plant and additional civil works completed at MPKC.
Reduction in containment facility height due to material quality - MPKC facility uses the same management principles as previously.
Work completed on schedule and now operational.
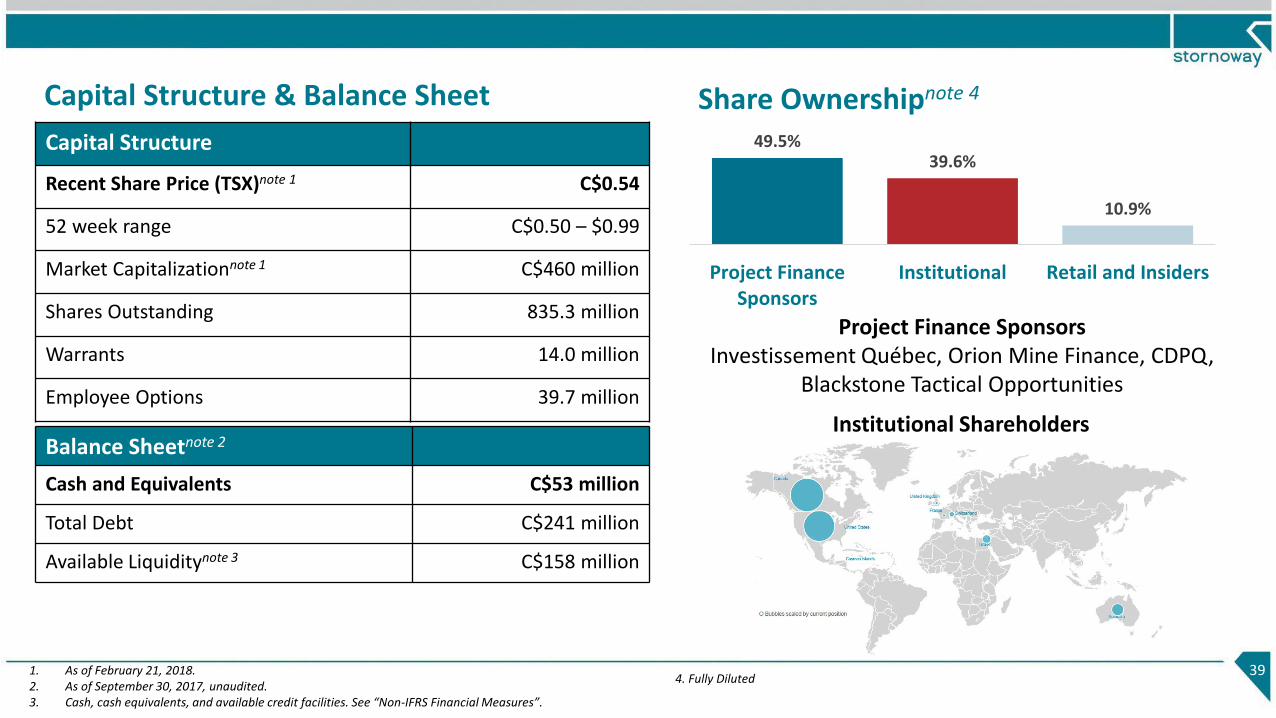
Capital Structure & Balance Sheet
39
Balance Sheetnote 2
Cash and Equivalents C$53 million
Total Debt C$241 million
Available Liquiditynote 3 C$158 million
Project Finance SponsorsInvestissement Québec, Orion Mine Finance, CDPQ,
Blackstone Tactical Opportunities
1. As of February 21, 2018.2. As of September 30, 2017, unaudited.3. Cash, cash equivalents, and available credit facilities. See “Non-IFRS Financial Measures”.
Capital Structure
Recent Share Price (TSX)note 1 C$0.54
52 week range C$0.50 – $0.99
Market Capitalizationnote 1 C$460 million
Shares Outstanding 835.3 million
Warrants 14.0 million
Employee Options 39.7 million
49.5%39.6%
10.9%
Project FinanceSponsors
Institutional Retail and Insiders
Share Ownershipnote 4
Institutional Shareholders
4. Fully Diluted
Pat GodinCOO & Director
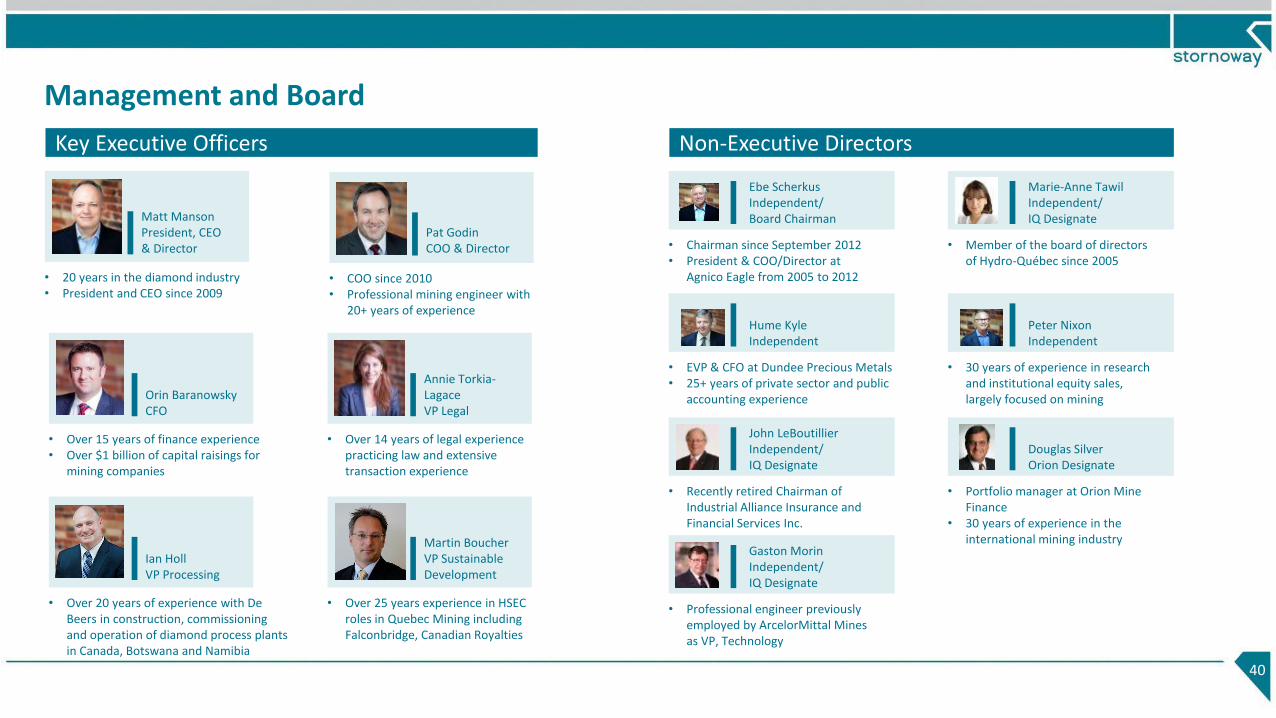
Management and Board
40
Non-Executive DirectorsKey Executive Officers
Matt Manson President, CEO& Director
• 20 years in the diamond industry• President and CEO since 2009
• COO since 2010• Professional mining engineer with
20+ years of experience
Annie Torkia-LagaceVP Legal
• Over 14 years of legal experience practicing law and extensive transaction experience
Ebe ScherkusIndependent/Board Chairman
• Chairman since September 2012• President & COO/Director at
Agnico Eagle from 2005 to 2012
Hume KyleIndependent
• EVP & CFO at Dundee Precious Metals• 25+ years of private sector and public
accounting experience
John LeBoutillierIndependent/ IQ Designate
• Recently retired Chairman of Industrial Alliance Insurance and Financial Services Inc.
Gaston MorinIndependent/ IQ Designate
• Professional engineer previously employed by ArcelorMittal Mines as VP, Technology
Marie-Anne TawilIndependent/ IQ Designate
• Member of the board of directors of Hydro-Québec since 2005
Peter NixonIndependent
• 30 years of experience in research and institutional equity sales, largely focused on mining
Douglas SilverOrion Designate
• Portfolio manager at Orion Mine Finance
• 30 years of experience in the international mining industry
Orin BaranowskyCFO
• Over 15 years of finance experience• Over $1 billion of capital raisings for
mining companies
Martin BoucherVP Sustainable Development
• Over 25 years experience in HSEC roles in Quebec Mining including Falconbridge, Canadian Royalties
Ian HollVP Processing
• Over 20 years of experience with De Beers in construction, commissioning and operation of diamond process plants in Canada, Botswana and Namibia