BMCE BANK · E-mail: [email protected] Website: BALANCE SHEET 2012 2011 ASSETS...
47
BMCE BANK CONSOLIDATED FINANCIAL STAT MENTS UNDER IAS/IFRS December 31, 2012 BMCE BANK
Transcript of BMCE BANK · E-mail: [email protected] Website: BALANCE SHEET 2012 2011 ASSETS...

BMCE BANK CONSOLIDATEDFINANCIAL STAT MENTS
UNDER IAS/IFRS
December 31, 2012
BMCE BANK

CONTENTFINANCIAL COMMUNICATION OF BMCE BANK GROUP 3
ACCOUNTING STANDARDS AND PRINCIPLES APPLIED BY THE GROUP 8
IFRS CONDSOLITATD FINANCIAL STATEMENTS AS OF DECEMBER 31, 2012 18
Balance Sheet 18 Income Statement 19 Statement of Changes in Shareholder’s Equity 20 Cash Flows Statement 21
2. NOTES TO CONSOLIDATED INCOME 22
2.1 Net Interest Income 222.2 Net Fee Income 222.3 Net gain/loss on financial instruments at fair value through profit or loss 222.4 Net gain/loss on available for sale assets 232.5 Net income from other activities 232.6 Cost of risk 232.7 Net gain/loss on other assets 242.8 Income Tax 24
3. SEGMENT INFORMATION 25
4. RISK EXPOSURE AND HEDGING STRATEGIES 26
4.1 Risk Management System 264.2 Credit Risk 284.3 Market Risk 314.4 Operational Risk 334.5 Stress Testing 354.6 Capital Components and Capital Adequacy 364.7 Country Risk 364.8 Asset Liability Management 36
5. BALANCE SHEET NOTE 37
5.1 Financial assets, financial liabilities, and derivatives at fair value through profit or loss 375.2 Available for sale financial assets 385.3 Interbank and money-market items 385.4 Loans and receivables due from customers 395.5 Debt securities and subordinated debts 405.6 Held to maturity financial assets 405.7 Current and deferred taxes 405.8 Accrued income/expense and other assets/liabilities 415.9 Investments in companies consolidated under the equity method 415.10 Property, plant and equipment and intangible assets used in operations 415.11 Goodwill 425.12 Provisions for contingencies and charges 42
6. FINANCING COMMITMENTS AND GUARANTEE 43
6.1 Financing Commitments 436.2 Guarantee Commitments 43
7. SALARIES AND EMPLOYEE BENEFITS 44
7.1 Description of evaluation method 447.2 Summary of provisions and description of existing schemes 447.3 Cost of post- employment plans 447.4 Provision evolution included in the balance sheet 44
8. ADDITIONAL INFORMATION 45
8.1 Changes in share capital and earnings per share 458.2 Scope of consolidation 458.3 Related parties 45

FY
FiNANciAl coMMUNicATioN oF BMcE BANk GRoUP
A SOLID FINANCIAL PERFORMANCE IN 2012 IN LINE WITH OBJECTIVES
2012BMcE Bank’s Board of directors, chaired by Mr othman Benjelloun, met on Friday 22 March 2013 at the bank’s registered officein casablanca. it examined the business activity of the bank and of the Group for the financial year ended 31 december 2012and drew up the financial statements for the year in question.
The Board of directors will propose to the Annual General Meeting of Shareholders a dividend of 3.30 dirhams per share.
The 2012 financial statements under iAS/iFRS are published on the bank’s website www.bmcebank.ma.
cOnSOLIDATEDAcTIVITY
AGGREGATEDAcTIVITY
MAD 9 billion
MAD 1.2 billion
MAD 3.6 billion
+11%
Net banking income
+47%
Net Income Attributable to ParentExcluding exceptional items
+19%
Gross operating income
MAD 1.0 billion$148 m and €112m $119 m and €90m
MAD 4.6 billion$1bn and €809m $544 m and €412m
MAD 1.8 billion$425 m and €321m $218 m and €165m
+90%
Aggregated net incomeExcluding exceptional items
MAD 923 million+9%
Net Income Attributable to Parent
MAD 713 million$109 m and €83m $85 m and €64m
+31%
Aggregated net income
Net banking income
Gross operating income
+13%
+41%
Net earnings excluding exceptional items of more than MAd 1 billion –more than
$119 m and €90m
capital base strengthened with a 15% rise to MAd 14.3 billion -$1.7bn and €1.3 bn-
in shareholders’ equity attributable to Parent
BMcE Bank Group expands further in Africawith operations in 19 countries
FiNANciAl coMMUNicATioNTel: +212 522 49 80 03/04 - Fax: +212 522 26 49 65E-mail: [email protected]: www.bmcebank.ma
BALANCE SHEET 2012 2011
ASSETS EUR USd MAd % change MAd12-11
cash, central banks, treasury & giro accounts 890 1 176 9 922 55% 6 392
Financial assets at fair value through profit or loss 3 072 4 058 34 245 8% 31 732
Available for financial assets 251 331 2 796 20% 2 330
loans and receivables due from credit institutions 1 920 2 535 21 397 -10% 23 823
loans and receivables due from customers 12 453 16 449 138 809 14% 121 343
Held to maturity financial assets 944 1 246 10 519 10% 9 591
investment property 55 73 614 12% 547
Tangible fixed assets 460 608 5 131 1% 5 064
intangible fixed assets 67 89 751 16% 645
Goodwill 75 99 832 0% 832
other assets 527 696 5 873 3% 5 689
TOTAL ASSETS 20 714 27 360 230 889 11% 207 988
LIABILITIESdue to credit institutions 3 071 4 056 34 228 38% 24 849
due to customers 12 977 17 141 144 651 4% 139 152
debt securities 1 257 1 661 14 015 17% 12 009
Provisions for contigencies and charges 47 62 523 14% 457
Subordinated debts 427 564 4 760 -3% 4 904
Shareholders Equity 1 652 2 182 18 413 12% 16 385
Attributable to Parent 1 279 1 690 14 260 15% 12 428Non-controlling interests 373 492 4 153 5% 3 957
other liabilities 1 283 1 694 14 299 40% 10 232
TOTAL LIABILITIES & SHAREHOLDERS EQUITY 20 714 27 360 230 889 11% 207 988
2012 2011IncOME STATEMEnT EUR USd MAd % change MAd
12-11 Net interest income 560 740 6 243 12% 5 572
Net fee income 137 181 1 526 7% 1 423
income from market transactions 72 95 801 10% 730
Net miscellaneous 40 53 448 8% 415
net Banking Income 809 1 069 9 018 11% 8 140
General operating expenses 436 576 4 861 6% 4 589
Provision for amortization and depreciation 51 68 574 7% 535
Gross Operating Income 321 425 3 583 19% 3 016
cost of risk 99 131 1 108 27% 872
operating income 222 293 2 476 15% 2 144
Pretax income 193 255 2 151 -1% 2 181
income tax 51 68 571 -15% 674
net Income 142 187 1 579 5% 1 508
Non-controlling interests 59 78 656 0% 657
nET IncOME ATTRIBUTABLE TO PAREnT 83 109 923 9% 850
in million
in million
in millionExchange rates as of december 31st, 2012EUR/MAD: 11.1465USD/MAD: 8.4390
coNSolidATEd AcTiviTy
IFRS SIMPLIFIED FINANCIAL STATEMENTS
Plaquette ANGLast.qxd:Mise en page 1 10/04/13 11:17 Page 1

SPECIALISED FINANCIAL SERVICES:RESILIENT PERFORMANCE DESPITE ANuNFAVOuRABLE ENVIRONMENT
MAGHREBAIL
6.3% growth in net outstandings versus 3% growthfor the sector resulting in a rise in market share from19.8% to 20.5%.
SALAFIn
6% rise in distributed loans against a fall in that of thesector with net income broadly unchanged at MAd 92 million -$11 m and €8.2 m - inclusive of a MAd 1.4 million -$170 k and €130 k - Social cohesioncontribution.
MAROc FAcTORInG
2012 was marked by a refocusing of activities on thecore business, full factoring, by outsourcing thecorporate client portfolio, reorganising sales andreducing costs in a highly competitive environment.
RM EXPERTS
Positive performance from BMcE Bank Group’s debtrecovery subsidiary with the volume of debt recoveredtotalling MAd 305 million -$36 m and €27.4 m - in2012 resulting in MAd 130 million -$15.4 m and €12 m - in provision write-backs.
SuB-SAHARAN AFRICAN ACTIVITIES:GROuP INCREASINGLY ANCHORED INAFRICA
BAnK OF AFRIcA
Solid consolidated results with 15% rise to € 291 million -$ 384 million- in net banking incomeand 13.6% increase to € 119 million -$ 157 million- ingross operating income.
Strong commercial performance with (i) 11% growthin customer deposits to € 3.2 billion -$ 4.2 bn- and20% increase to € 2.2 billion -$ 2.9 bn- in customerloans and (ii) 23% rise in customer portfolio to 1.4 million accounts.
BoA Group continues to grow organically with 32 newbranch openings taking the total distribution networkto 370 branches covering 15 countries.
Banking licence granted to Bank of Africa in Togo in2012,taking the total number of countries in whichthe Group has operations to 15.
LA cOnGOLAISE DE BAnQUE
Another positive financial performance in line withprevious years with a 17% rise to € 30 million -$ 39.7 million- in net banking income and a 16% riseto € 10.7 million -$ 14.1 million- in net income.
BAnQUE DE DEVELOPPEMEnT DU MALI
Significant growth of 21% to €12.7 million -$ 16.8 million- in net income at 31 december 2012.
EuROPEAN ACTIVITIES: RETuRN TOBREAk-EVEN
Recovery seen at BMcE Bank international Plc, theGroup’s london-based subsidiary, with net income of£ 1.2 billion, positive for the first time sinceestablishment, due to a major restructuringprogramme since 2011.
Satisfactory results from BMcE Bank internationalMadrid despite a difficult economic environment inSpain with net banking income stable at € 11 million-$ 14.5 million- and net income of € 3 million -$ 4 million-.
CSR AND SuSTAINABLE DEVELOPMENT:CONSOLIDATION OF SOCIALLY-RESPONSIBLE AND ENVIRONMENTALPRACTICES
BMcE Bank Foundation honoured by the awardsbestowed upon its President, dr leila MezianBenjelloun, in acknowledgment of her commitment topromoting Amazigh culture and human developmentincluding the Prix du Mérite de la culture Amazighe2011 from the Royal institute of Amazigh culture aswell as the Woman of the year 2012 prize from theAmerican chamber of commerce.
Expansion of the Medersat.com network to 174complexes, school and pre-school units following theopening of a school in imouzzer Marmoucha and thebuilding of an establishment in Bamako in Mali. Thistakes the total number of children educated and caredfor by the Foundation to 14,000.
Energico, Morocco’s first green product, introduced bythe corporate banking network, aimed primarily atSMEs to help them finance the purchase of energy-saving equipment.
Encouraging results which exceeded expectationsfollowing the implementation of iSo 14001 aimed atreducing water, electricity and paper consumption.
RETAIL BANkING: NEW MARkETSEGMENTS TARGETED
Significant growth of 29% in total bancassurancerevenue to MAd 1.7 billion -$198 m and €153 m -.
Enhanced services for Moroccans living abroad tosatisfy their changing needs such as E-transfert andcash to Account.
development strategy launched targeting the high-growth private client market segment.
BMcE direct, the bank’s remote banking serviceenhanced with the introduction of an onlinestockbroking service.
New services introduced dedicated to very smallenterprises such as Forfait TPE and crédit damaneExpress.
CORPORATE BANkING: A SuCCESSFuLSME STRATEGY GENERATING ADDTIONALVALuE
11.2% growth in corporate banking deposits to MAd 25 billion -$3 bn and €2.2 bn - and 4.3% growthin corporate loans to MAd 61.3 billion -$7.3 bn and €5.5 bn -.
coverage of SME banking market segment bolsteredthrough: (i) a more personalised products and servicesoffering and greater innovation e.g. Pack BusinessPME and club PME and (ii) closer relations with SMEcustomers by organising regional meetings.
Foreign trade business strengthened as can be seenin the 12% rise in import volumes and the 16% rise inexport volumes, registering a stronger pace of growththan the industry average (+7% and +4%respectively).
Market leadership in Project Finance consolidateddue to a number of large-scale deals in various sectors despite less than favourable businessconditions.
closer relations developed with corporate customerswith the opening of 3 new business centres in Nador,oujda and laâyoune.
INVESTMENT BANkING: MARkETCONDITIONS STILL uNFAVOuRABLE
BMcE capital Markets’ share of the private debt market rose to 53.2% due to aggressive sales approach and a differentiated product offering, resulting in the bank retaining its position as themarket leader.
Synergies derived between BMcE capital Bourse andcM-cic Securities as part of the African SecuritiesNetwork project with an agreement signed todistribute each other’s research products.
5% rise to MAd 33.5 billion -$4 bn and €3 bn - inBMcE capital Gestion’s assets under managementversus a 4.6% rise for the sector, resulting in increasedmarket share to 14%.
BMcE capital Titres’ volume of assets under custodystable and market share unchanged at 28% despite adecline in stock market volume in 2012.
PoSiTivE PERFoRMANcE By THE GRoUP’S iNdividUAl BUSiNESS liNESSTRoNG GRoWTH AcRoSS THE BoARd
CONSOLIDATED ACTIVITY: 47% RISE INNET INCOME ATTRIBuTABLE TO PARENTEXCLuDING EXCEPTIONAL ITEMS TO MAD 1.2 BILLION -$148 m and €112m-
9% rise in Net income Attributable to Parent to MAd 923 million -$109 m and €83m- despite morethan MAd 1 billion in provisions (MAd 1.1 billion;$131 m and €99m-).
47% rise in Net income Attributable to Parentexcluding exceptional items to MAd 1.2 billion -$148 m and €112m - exceptional net charge of MAd 323 million -related to taxation and the Socialcohesion contribution.
- A very strong performance by domesticactivities including (i) BMcE Bank SA whichsaw its contribution rise by 78% and (ii) theinvestment banking and assetmanagement division which registered a15% increase in its contribution to Netincome Attributable to Parent excludingexceptional items;
- Solid results from international activitieswith (i) a positive contribution fromEuropean subsidiaries, accounting for 4% ofNet income Attributable to Parent excludingexceptional items versus a negativecontribution the previous year and (ii) a30% rise in the contribution from sub-Sahara African activities.
11% rise in consolidated Net Banking income tomore than MAd 9 billion -$1bn and €809m- for thefirst time. This, together with a 6% rise in generaloperating expenses resulted in a 2.6 pointsimprovement in the cost-to-income ratio to 60.3%.
19% rise in gross operating income to almost MAd 3.6 billion -$425 m and €321m-in 2012 versusMAd 3 billion -$349 m and €270m-the previousyear due to a sustainable performance at theoperating level.
capital base strengthened with a 15% increase inshareholders’ equity attributable to parent fromMAd 12.4 billion -$1.4bn and €1.1 bn - in 2011 toMAd 14.3 billion -$1.7bn and €1.3 bn -in 2012following a MAd 1.5 billion -$180 m and €135 m -equity issue reserved for reference shareholders.The purpose was to provide adequate funds for theGroup’s strategic development domestically andoverseas and to meet new regulatory capitalrequirements.
Steady growth in the Group’s assets at 11% overthe past 4 years with total consolidated assets ofMAd 231 billion -$27bn and €21 bn -in 2012.
4% rise to MAd 144.6 billion - $17bn and €13 bn -in consolidated deposits and 14% increase toMAd 138.8 billion - $16bn and €12.5 bn -inconsolidated loans.
AGGREGATED ACTIVITY: DOuBLE-DIGITGROWTH IN THE MAIN INDICATORS
90% year-on-year rise in aggregated net income excluding exceptional items to more than MAd 1 billion -$119 m and €90m- and 31%rise from MAd 545 million -$65 m and €49m- in 2011 to MAd 713 million -$85 m and €64m - in 2012 after recognition of an exceptional tax expense.
13% rise to MAd 4.6 billion -$544 m and €412m-in aggregated net banking income due to a strongperformance by the bank’s core business as can beseen in an 11% increase in net interest income anda 9% rise in fee income.
contained growth in general operating expenses at5.5% resulting in a 4.3 points improvement in thecost-to-income ratio to 60.6%.
41% rise in gross operating income to MAd 1.8 billion -$209 m and €165m- due to asubstantial provisioning effort of almost MAd 712 million - $84 m and €64m - including aMAd 217 million -$26 m and €19.5m - sector-specific gross provision for general risks taking totalgross provisions for general risks to MAd 472 million -$56 m and €42.4m -.
Strong ability to attract savings with a 6% rise indeposits to MAd 107 billion -$12.7 bn and €9.6 bn- versus 2.7% growth in sector deposits resulting ina 43 basis point improvement in BMcE Bank’smarket share to 14.78%.
Strong momentum in lending with a 6% rise in totalloans to MAd 93.5 billion -$11 bn and €8.4 bn -,resulting in an 11 basis point improvement inmarket share.
IMPROVEMENT IN THE BANk’S SOLVENCYAND RISk PROFILE
core capital bolstered resulting in a Tier 1 capitalratio of more than 9% and a solvency ratio of morethan 12%.
40 basis point decline in the loan loss ratioto 4.53% which is below the sector average of 4.96%
improvement in the non-performing loan coverageratio from 67.4% in 2011 to 71.6% in 2012.
coNSolidATEd ANNUAl RESUlTS 2012
2012-2013 HIGHLIGHTS
Shareholding in Bank of Africa Groupincreased to 68%.
BoA granted banking licence in Togo.
BMcE Bank named “Best Trade Finance Bankin Morocco” by Global Trade Review as wellas “Socially Responsible Bank of the year”by African Banker Awards.
BMcE Bank international Plc awarded“African Project Finance – Transport deal ofthe year” by Euromoney.
MAd 1.5 billion -$180 m and €135 m - equity issue by BMcE Bank reserved formajor shareholders.
MAd 1 billion -$119 m and €90m-subordinated bond issue.
$75 million credit line obtained from theEuropean Bank for Reconstruction anddevelopment (EBRd) to refinance foreigntrade activities.
Spanish subsidiary BMcE Euroservicesestablished to take charge of the Moroccansliving Abroad business in partnership withthe domestic network in the context of theGroup reorganising its European platform.
BMCE BANk GROuP CONSOLIDATED ACTIVITY
231 MAd
208
+11%
20122011
Total Assets - In billion
1 246 MAd
850
+47%
20122011
Net Income Attributable to ParentExcluding exceptional items - In million
9 018 MAd
+11%
20122011
Net Banking Income - In million
3 583 MAd+19%
20122011
Gross Operating Income - In million
923 MAd850
+9%
20122011
Net Income Attributable to Parent - In million
3 016
8 140
2012 NET INCOME GROuP SHARE By GEoGRAPHic AREA
Morocco
Sub-Saharan Africa
Europe
51%
44%
5%
112€
148$
109$
1069$
425$
321€
20.7€
27.4$
83€
809€
Plaquette ANGLast.qxd:Mise en page 1 10/04/13 11:17 Page 2

5
SPECIALISED FINANCIAL SERVICES:RESILIENT PERFORMANCE DESPITE ANuNFAVOuRABLE ENVIRONMENT
MAGHREBAIL
6.3% growth in net outstandings versus 3% growthfor the sector resulting in a rise in market share from19.8% to 20.5%.
SALAFIn
6% rise in distributed loans against a fall in that of thesector with net income broadly unchanged at MAd 92 million -$11 m and €8.2 m - inclusive of a MAd 1.4 million -$170 k and €130 k - Social cohesioncontribution.
MAROc FAcTORInG
2012 was marked by a refocusing of activities on thecore business, full factoring, by outsourcing thecorporate client portfolio, reorganising sales andreducing costs in a highly competitive environment.
RM EXPERTS
Positive performance from BMcE Bank Group’s debtrecovery subsidiary with the volume of debt recoveredtotalling MAd 305 million -$36 m and €27.4 m - in2012 resulting in MAd 130 million -$15.4 m and €12 m - in provision write-backs.
SuB-SAHARAN AFRICAN ACTIVITIES:GROuP INCREASINGLY ANCHORED INAFRICA
BAnK OF AFRIcA
Solid consolidated results with 15% rise to € 291 million -$ 384 million- in net banking incomeand 13.6% increase to € 119 million -$ 157 million- ingross operating income.
Strong commercial performance with (i) 11% growthin customer deposits to € 3.2 billion -$ 4.2 bn- and20% increase to € 2.2 billion -$ 2.9 bn- in customerloans and (ii) 23% rise in customer portfolio to 1.4 million accounts.
BoA Group continues to grow organically with 32 newbranch openings taking the total distribution networkto 370 branches covering 15 countries.
Banking licence granted to Bank of Africa in Togo in2012,taking the total number of countries in whichthe Group has operations to 15.
LA cOnGOLAISE DE BAnQUE
Another positive financial performance in line withprevious years with a 17% rise to € 30 million -$ 39.7 million- in net banking income and a 16% riseto € 10.7 million -$ 14.1 million- in net income.
BAnQUE DE DEVELOPPEMEnT DU MALI
Significant growth of 21% to €12.7 million -$ 16.8 million- in net income at 31 december 2012.
EuROPEAN ACTIVITIES: RETuRN TOBREAk-EVEN
Recovery seen at BMcE Bank international Plc, theGroup’s london-based subsidiary, with net income of£ 1.2 billion, positive for the first time sinceestablishment, due to a major restructuringprogramme since 2011.
Satisfactory results from BMcE Bank internationalMadrid despite a difficult economic environment inSpain with net banking income stable at € 11 million-$ 14.5 million- and net income of € 3 million -$ 4 million-.
CSR AND SuSTAINABLE DEVELOPMENT:CONSOLIDATION OF SOCIALLY-RESPONSIBLE AND ENVIRONMENTALPRACTICES
BMcE Bank Foundation honoured by the awardsbestowed upon its President, dr leila MezianBenjelloun, in acknowledgment of her commitment topromoting Amazigh culture and human developmentincluding the Prix du Mérite de la culture Amazighe2011 from the Royal institute of Amazigh culture aswell as the Woman of the year 2012 prize from theAmerican chamber of commerce.
Expansion of the Medersat.com network to 174complexes, school and pre-school units following theopening of a school in imouzzer Marmoucha and thebuilding of an establishment in Bamako in Mali. Thistakes the total number of children educated and caredfor by the Foundation to 14,000.
Energico, Morocco’s first green product, introduced bythe corporate banking network, aimed primarily atSMEs to help them finance the purchase of energy-saving equipment.
Encouraging results which exceeded expectationsfollowing the implementation of iSo 14001 aimed atreducing water, electricity and paper consumption.
RETAIL BANkING: NEW MARkETSEGMENTS TARGETED
Significant growth of 29% in total bancassurancerevenue to MAd 1.7 billion -$198 m and €153 m -.
Enhanced services for Moroccans living abroad tosatisfy their changing needs such as E-transfert andcash to Account.
development strategy launched targeting the high-growth private client market segment.
BMcE direct, the bank’s remote banking serviceenhanced with the introduction of an onlinestockbroking service.
New services introduced dedicated to very smallenterprises such as Forfait TPE and crédit damaneExpress.
CORPORATE BANkING: A SuCCESSFuLSME STRATEGY GENERATING ADDTIONALVALuE
11.2% growth in corporate banking deposits to MAd 25 billion -$3 bn and €2.2 bn - and 4.3% growthin corporate loans to MAd 61.3 billion -$7.3 bn and €5.5 bn -.
coverage of SME banking market segment bolsteredthrough: (i) a more personalised products and servicesoffering and greater innovation e.g. Pack BusinessPME and club PME and (ii) closer relations with SMEcustomers by organising regional meetings.
Foreign trade business strengthened as can be seenin the 12% rise in import volumes and the 16% rise inexport volumes, registering a stronger pace of growththan the industry average (+7% and +4%respectively).
Market leadership in Project Finance consolidateddue to a number of large-scale deals in various sectors despite less than favourable businessconditions.
closer relations developed with corporate customerswith the opening of 3 new business centres in Nador,oujda and laâyoune.
INVESTMENT BANkING: MARkETCONDITIONS STILL uNFAVOuRABLE
BMcE capital Markets’ share of the private debt market rose to 53.2% due to aggressive sales approach and a differentiated product offering, resulting in the bank retaining its position as themarket leader.
Synergies derived between BMcE capital Bourse andcM-cic Securities as part of the African SecuritiesNetwork project with an agreement signed todistribute each other’s research products.
5% rise to MAd 33.5 billion -$4 bn and €3 bn - inBMcE capital Gestion’s assets under managementversus a 4.6% rise for the sector, resulting in increasedmarket share to 14%.
BMcE capital Titres’ volume of assets under custodystable and market share unchanged at 28% despite adecline in stock market volume in 2012.
PoSiTivE PERFoRMANcE By THE GRoUP’S iNdividUAl BUSiNESS liNESSTRoNG GRoWTH AcRoSS THE BoARd
CONSOLIDATED ACTIVITY: 47% RISE INNET INCOME ATTRIBuTABLE TO PARENTEXCLuDING EXCEPTIONAL ITEMS TO MAD 1.2 BILLION -$148 m and €112m-
9% rise in Net income Attributable to Parent to MAd 923 million -$109 m and €83m- despite morethan MAd 1 billion in provisions (MAd 1.1 billion;$131 m and €99m-).
47% rise in Net income Attributable to Parentexcluding exceptional items to MAd 1.2 billion -$148 m and €112m - exceptional net charge of MAd 323 million -related to taxation and the Socialcohesion contribution.
- A very strong performance by domesticactivities including (i) BMcE Bank SA whichsaw its contribution rise by 78% and (ii) theinvestment banking and assetmanagement division which registered a15% increase in its contribution to Netincome Attributable to Parent excludingexceptional items;
- Solid results from international activitieswith (i) a positive contribution fromEuropean subsidiaries, accounting for 4% ofNet income Attributable to Parent excludingexceptional items versus a negativecontribution the previous year and (ii) a30% rise in the contribution from sub-Sahara African activities.
11% rise in consolidated Net Banking income tomore than MAd 9 billion -$1bn and €809m- for thefirst time. This, together with a 6% rise in generaloperating expenses resulted in a 2.6 pointsimprovement in the cost-to-income ratio to 60.3%.
19% rise in gross operating income to almost MAd 3.6 billion -$425 m and €321m-in 2012 versusMAd 3 billion -$349 m and €270m-the previousyear due to a sustainable performance at theoperating level.
capital base strengthened with a 15% increase inshareholders’ equity attributable to parent fromMAd 12.4 billion -$1.4bn and €1.1 bn - in 2011 toMAd 14.3 billion -$1.7bn and €1.3 bn -in 2012following a MAd 1.5 billion -$180 m and €135 m -equity issue reserved for reference shareholders.The purpose was to provide adequate funds for theGroup’s strategic development domestically andoverseas and to meet new regulatory capitalrequirements.
Steady growth in the Group’s assets at 11% overthe past 4 years with total consolidated assets ofMAd 231 billion -$27bn and €21 bn -in 2012.
4% rise to MAd 144.6 billion - $17bn and €13 bn -in consolidated deposits and 14% increase toMAd 138.8 billion - $16bn and €12.5 bn -inconsolidated loans.
AGGREGATED ACTIVITY: DOuBLE-DIGITGROWTH IN THE MAIN INDICATORS
90% year-on-year rise in aggregated net income excluding exceptional items to more than MAd 1 billion -$119 m and €90m- and 31%rise from MAd 545 million -$65 m and €49m- in 2011 to MAd 713 million -$85 m and €64m - in 2012 after recognition of an exceptional tax expense.
13% rise to MAd 4.6 billion -$544 m and €412m-in aggregated net banking income due to a strongperformance by the bank’s core business as can beseen in an 11% increase in net interest income anda 9% rise in fee income.
contained growth in general operating expenses at5.5% resulting in a 4.3 points improvement in thecost-to-income ratio to 60.6%.
41% rise in gross operating income to MAd 1.8 billion -$209 m and €165m- due to asubstantial provisioning effort of almost MAd 712 million - $84 m and €64m - including aMAd 217 million -$26 m and €19.5m - sector-specific gross provision for general risks taking totalgross provisions for general risks to MAd 472 million -$56 m and €42.4m -.
Strong ability to attract savings with a 6% rise indeposits to MAd 107 billion -$12.7 bn and €9.6 bn- versus 2.7% growth in sector deposits resulting ina 43 basis point improvement in BMcE Bank’smarket share to 14.78%.
Strong momentum in lending with a 6% rise in totalloans to MAd 93.5 billion -$11 bn and €8.4 bn -,resulting in an 11 basis point improvement inmarket share.
IMPROVEMENT IN THE BANk’S SOLVENCYAND RISk PROFILE
core capital bolstered resulting in a Tier 1 capitalratio of more than 9% and a solvency ratio of morethan 12%.
40 basis point decline in the loan loss ratioto 4.53% which is below the sector average of 4.96%
improvement in the non-performing loan coverageratio from 67.4% in 2011 to 71.6% in 2012.
coNSolidATEd ANNUAl RESUlTS 2012
2012-2013 HIGHLIGHTS
Shareholding in Bank of Africa Groupincreased to 68%.
BoA granted banking licence in Togo.
BMcE Bank named “Best Trade Finance Bankin Morocco” by Global Trade Review as wellas “Socially Responsible Bank of the year”by African Banker Awards.
BMcE Bank international Plc awarded“African Project Finance – Transport deal ofthe year” by Euromoney.
MAd 1.5 billion -$180 m and €135 m - equity issue by BMcE Bank reserved formajor shareholders.
MAd 1 billion -$119 m and €90m-subordinated bond issue.
$75 million credit line obtained from theEuropean Bank for Reconstruction anddevelopment (EBRd) to refinance foreigntrade activities.
Spanish subsidiary BMcE Euroservicesestablished to take charge of the Moroccansliving Abroad business in partnership withthe domestic network in the context of theGroup reorganising its European platform.
BMCE BANk GROuP CONSOLIDATED ACTIVITY
231 MAd
208
+11%
20122011
Total Assets - In billion
1 246 MAd
850
+47%
20122011
Net Income Attributable to ParentExcluding exceptional items - In million
9 018 MAd
+11%
20122011
Net Banking Income - In million
3 583 MAd+19%
20122011
Gross Operating Income - In million
923 MAd850
+9%
20122011
Net Income Attributable to Parent - In million
3 016
8 140
2012 NET INCOME GROuP SHARE By GEoGRAPHic AREA
Morocco
Sub-Saharan Africa
Europe
51%
44%
5%
112€
148$
109$
1069$
425$
321€
20.7€
27.4$
83€
809€
Plaquette ANGLast.qxd:Mise en page 1 10/04/13 11:17 Page 2

STATUTORY AUDITORS STATEMENTIFRS CONSOLIDATED FINANCIALS

LIMITED REVIEW ATTESTATION OF THE CONSOLIDATED SITUATION AS OF DECEMBER 31st, 2012(This is a free translation of the original French text for information purposes only)
We have conducted a limited review of the consolidated situation of the Banque Marocaine du Commerce Extérieur and its subsidiaries (BMCE Bank Group) including the consolidated balance sheet, the consolidated income statement, the global income statement, the cash flow statement, the statement of changes in shareholders’ equity and a selection of explicative notes to the financial statements covering the period from January 1st to December 31th, 2012. This consolidated financial situation shows a consolidated shareholders’ equity of KMAD 18.413.529, including a consolidated net income of KMAD 1.579.754.
We conducted our limited review in accordance with the Moroccan Standards. Those standards require that we plan and perform the limited review in order to obtain a moderate assurance about whether that the consolidated financial statements mentioned above in the first paragraph are free from significant misstatement. A limited review consists essentially of interviews with the personnel of the company and the analytical review of the financial data; in thus provides a lower level of assurance than an audit. We did not carry out an audit and as a consequence, we do not express an opinion of audit.
Based on our limited review, subject to the impact of the situation described in the paragraph above, we did not identify any fact that makes us believe that the attached consolidated financial statements does not give a true and fair view of the results of the operations for the ended period, as well as the financial situation and assets of the BMCE Bank Group at December 31, 2012, in accordance with IAS/IFRS international accounting standards.
Without qualifying the conclusion expressed above, we draw your attention to note 2.7 which describes how the final outcome of tax audits of BMCE Bank which took as an effect the recognition in 2012 of a gross expense of KMAD 387.058.
Casablanca, March 22th, 2013
The Statutory Auditors
Faïçal MEKOUARPartner
Bachir TAZI Partner

8
1. CONTEXT
The application of IAS/IFRS is obligatory starting from the fiscal year 2008.
The paramount objective of the regulatory authorities is to provide credit institutions with an accounting framework in accordance with international standards in terms of disclosure and financial transparency.
BMCE Bank Group has adopted IFRS, approved by IASB to the consolidated accounts for the 2008 fiscal year compared to the 2007 fiscal year as well.
2. APPLICABLE ACCOUNTING STANDARDS
2.1. CONSOLIDATION
The scope of consolidation includes all domestic and foreign entities in which the Group has direct or indirect control. The consolidation method, i.e. full consolidation, proportional consolidation, and equity method, is respectively determined by whether the Group exercises exclusive control, joint control, or significant influence. However, joint ventures are consolidated using the proportional method or the equity method.
Options Adopted by BMCE Bank
Definition of the Consolidation Scope
BMCE Bank Group consolidates entities, regardless of their activity, in which it holds at least 20% of the voting power.
On the other hand, the Group consolidates entities meeting the following conditions :
• The subsidiary’s total assets is greater than 0,5% of the parent company’s ;
• The subsidiary’s net assets is greater than 0,5% of the parent company’s ;
• The subsidiary’s banking revenues are greater than 0,5% of the parent company’s ;
• Cumulated thresholds where the total of unconsolidated entities does not exceed 5% of the consolidated aggregate.
Exception
Any entity having a non significant contribution has to be consolidated if it holds stakes in subsidiaries which meet one of the conditions mentioned above.
2.2. TANGIBLE FIXED ASSETS
A tangible fixed asset is a long term asset held by the firm to be used for operations or lease.
Initial Recognition
Tangible fixed assets are initially recognised at purchase price plus directly attributable costs.
Subsequent Measurement
Subsequent to initial recognition, tangible fixed assets can be measured according to two methods :
• Cost method (recommended) : assets are measured at cost less cumulated depreciation and any impairment losses ;
• Reevaluation method (optional) : assets are measured
at fair value at the date of reevaluation less subsequent cumulated depreciation and any impairment losses. Fair value is the amount for which an asset could be exchanged, or liability settled, between knowledgeable, willing parties in an arm’s length transaction.
Reevaluation should be conducted on a sufficient regular basis so that the book value will not be significantly different from the fair value at the closing date.
Component-based Approach
Where an asset consists of a number of components that have different users or different patterns of consumption of economic benefits, each component is recognised separately and depreciated using an appropriate method to that component.
Depreciation rules
The depreciation of a tangible fixed asset is the cost of this asset less any residual value, which corresponds to the current value of the asset, taking into account its estimated age and condition over its useful life.
A tangible fixed asset is depreciated over its useful life, which corresponds to the period over which the entity expects to use this asset. The depreciation should reflect the consumption patterns of future economic benefits. The depreciation periods and methods have to be reviewed periodically by the firm, and hence the depreciation expenses for the current and future fiscal years must be readjusted.
Even if the fair value of the asset is greater than its book value, depreciation is recognised, as long as the residual value does not exceed the book value.
Impairment
The amount of impairment is the excess of the carrying value over the recoverable value, which corresponds to the highest value between the net disposal price and the value in use.
Impairment losses are recognised when there is an indication of impairment (internal or external), which has to be valued at the end of each fiscal year.
Options Adopted by BMCE Bank
Initial Recognition
The Group has chosen the cost method instead of the reevaluation method, as specified by IAS16. The entry cost of an asset includes borrowing costs incurred in compliance with IAS 23 (page 9).
Residual Value
Given the nature of BMCE Bank’s fixed assets, the Group did not retain any residual value, except for equipment transport of the subsidiary LOCASOM. Actually, there is no sufficiently active market or replacement policy over a period that is shorter than the asset’s useful life so that a residual value can be recognised.
Depreciation Period
The Group has adopted an identical depreciation scheme in the IAS/IFRS consolidated accounts.
accounting standards and principles applied by the group
9
Component-based Approach
Given the nature of the Group’s activity, depreciation by component is essentially applied to buildings. For the opening balance sheet, the recognition of the historical depreciation cost by component is applied, using a different depreciation periods as a function of the construction characteristics.
Headquarters’ Buildings Branch Offices
Period QP Period QPShell 80 years 55% 80 years 65%
Facade 30 years 15% - -General and Technical
Installations 20 years 20% 20 years 15%
Fixtures and Fittings 10 years 10% 10 years 20%
Impairment
The Group considers that impairment is only applied to constructions and therefore the market value (appraisal value) is used for depreciation.
2.3. INVESTMENT PROPERTY
According to IAS 40, an investment property comprises property assets held to generate rental income and capital gains. Unlike a fixed asset used in operations or in the provision of services, an investment property generates cash flows, independent from the other assets of the firm.
IAS 40 gives the choice for the measurement of an investment property :
• The fair value through profit or loss ;
• The amortised cost method.
Any used method must be applied to all investment properties.
Options Adopted by BMCE Bank
Definition
The Group considers any non operating property as an investment property.
Measurement
BMCE Bank Group has adopted the amortised cost method for the measurement of its investment properties. The treatment in terms of measurement is identical to that used in the measurement of operating properties.
2.4. INTANGIBLE FIXED ASSETS
An intangible fixed asset is a non monetary and non physical asset.
It is :
• Identifiable in order to distinguish it from goodwill ;
• Controlled if the firm has the power to get the future economic benefits generated from the underlying asset and if the firm can also restrain the access of a third party to its benefits.
IAS 38 states two phases for in-house intangible fixed assets.
Phase Fixed asset/expenseResearch ExpenseDevelopment Fixed asset
Expenses resulting from the development phase are recorded under fixed assets if it is possible to demonstrate :
• The technical feasibility of the product ;
• The intention to carry out the project ;
• The capacity of the firm to sell or use the product ;
• The financial capacity to carry out the project ;
• That the firm will profit from the future economic benefits.
Initial Recognition
An intangible fixed asset is initially recognised at cost that is equal to the amount of cash or cash equivalent paid or at the fair value of any counterpart given to purchase the asset at the acquisition or construction date.
IAS 38 refers to two options for the subsequent measurement of an intangible fixed asset :
• Amortised cost : assets are measured at cost less cumulated depreciation and any impairment losses ;
• Reevaluation method : assets are measured at fair value at the date of reevaluation less subsequent cumulated depreciation and any impairment losses. Fair value has to be measured based on an active market. Reevaluation should be conducted in a sufficient regular basis so that the book value will not significantly different from the fair value at the closing date.
Amortisation
Intangible fixed assets are amortised over a maximum period of 20 years. An intangible fixed asset enjoying an unlimited useful life period is not amortised. In this case, a depreciation test should be carried out at the end of each fiscal year.
The amortisation method must reflect the consumption pattern of the future economic benefits.
Impairment Loss
Impairment losses are recognised when there is an indication of impairment (internal or external), which has to be valued at the end of each fiscal year.
Options Adopted by BMCE Bank
For the first time adoption, BMCE Bank has chosen the amortised cost method.
It has been decided to not include internally developed software on the opening balance sheet and to put in place a tracking system for development costs in the future.
For subsequent measurement of intangible fixed assets, the Group has adopted the amortised cost method.
Amortisation
The Group has decided to maintain the currently used amortisation periods.
Residual Value

10
Given the nature of BMCE Bank’s intangible fixed assets, the Group considers that the concept of residual value is not relevant and thus did not retain any.
2.5. SECURITIES
IAS 39 classifies financial assets into 4 categories, defined as a function of the management purpose.
Financial Assets at Fair Value Through Profit or Loss
It is classified under this category any financial asset meeting the following criteria .
It is considered a trading financial instrument because :
• It is acquired or contracted to be sold or purchased in the short term ;
• It is part of a portfolio made of distinct financial instruments, for which exists a recent effective pattern of retained earnings in the short term ;
• It is a derivative (except for hedging instruments) ;
• It is designated as so during its acquisition.
Financial instruments can be classified under financial assets or liabilities at fair value through profit or loss, except for equity investments for which an active market does not exist and thus the fair value cannot be precisely measured.
Derivatives are also classified as financial assets or liabilities at fair value through profit or loss, except for hedging instruments.
Accounting Principles
Initial Recognition
Financial assets at fair value through profit or loss must be initially recognised at acquisition price, excluding transaction costs directly attributable to the acquisition, and accrued interest on fixed income securities.
Subsequent Measurement
Securities in this category are measured at fair value. Changes in fair value are presented in the profit and loss account.
These securities are not subject to amortisation.
Held-to-maturity investments
Held-to-maturity investments are financial assets with fixed or determinable payments and fixed maturity that an entity has the intention and ability to hold until maturity. These securities do not include financial instruments initially designated as assets or liabilities at fair value through profit or loss or loans and receivables.
An entity cannot classify securities under held to maturity investments if it has, during the current fiscal year or during the two previous fiscal years, sold or reclassified before maturity a significant portion of these securities. This restriction is not applicable to disposals :
• Near maturity (less than three months) where a change in interest rates has no significant impact on the fair value of the securities;
• Occur after the accumulation of a substantial portion of the initial principal (about 90% of the asset’s carried amount);
• Attributable to an isolated and incontrollable event, which
could not be predicted ;
• Between the group entities (intra-group transactions).
An entity does not have the intention to hold a financial
asset until maturity if one of the following criteria is met :
• The entity intends to hold the financial asset for an
undetermined period ;
• The entity is willing to sell the asset as a response to
changes in interest rates or risks, to liquidity needs,
to changes in the availability and yield of alternative
investments, to changes in the funding base, and foreign
exchange risks ;
• The issuer has the right to pay for the financial asset an
amount that is well below its amortised cost.
Any entity does not have the ability to hold a financial asset
until maturity if one of the following two criteria is not met :
• It does not have adequate financial resources to continue
the financing of its held-to maturity investments ;
• It is subject to an existing legal constraint or other, which
could distrust its intention to hold the financial asset until
maturity.
Accounting Principles
Initial Recognition
Held to maturity investments must be initially accounted
for at acquisition price, plus transactions costs directly
attributable to the acquisition, and accrued interest on
fixed income securities (in a related receivables account).
Subsequent Measurement
Subsequent to initial recognition, held to maturity
investments are accounted for at amortised cost using the
effective interest method, which builds in amortisation of
premium or discount
11
Impairment loss
When there is objective evidence of measurable decrease in value, an impairment loss is recognised for the difference in the carrying amount and the estimated recoverable value.
The estimated recoverable value is measured through discounted future cash flows at the original effective interest rate.
Any subsequent decrease in the impairment loss is credited to the profit and loss account.
Loans and Receivables
Loans and receivables are assets rather than derivatives with fixed or determinable payments and which are not quoted in an active market. The following assets are not classified under this category :
• Assets that the entity has the intention to sell immediately or in the short term; these assets are classified under ‘‘assets held for trading purposes’’and financial assets at fair value through profit or loss ;
• Assets that the entity designates as available for sell ;
• Assets of which a significant portion of the investment could not be recovered for other reasons than the deterioration of the loan; these assets are classified under ‘‘available-for-sale financial assets’’.
Accounting Principles
Loans and receivables are recognised at amortised cost, net of provisions for impairment loss.
Impairment Loss
When there is objective evidence of measurable decrease in value, an impairment loss is recognised for the difference in the carrying amount and the estimated recoverable value.
Any subsequent decrease in the impairment loss is credited to the profit and loss account.
Available for Sale Financial Assets
These are financial assets other than derivatives, loans and receivables, held to maturity investments, or financial assets at fair value through profit or loss.
Accounting Principles
According to IAS 39, the accounting principles for ‘‘available for sale financial assets’’ are as follows :
Initial Recognition
Available for sale financial assets are initially recognised at the acquisition price plus transaction costs directly attributable to the acquisition, and accrued interest on fixed income securities (in a related receivables account).
Subsequent Measurement
The changes in the fair value of these securities are recognised in shareholders’ equity. On disposal or on recognition of an impairment loss, unrealised gains and losses on fixed income securities are taken to the profit or loss account, using effective interest method.
Impairment Loss
When there is objective evidence of measurable decrease in value for equity securities, or the occurring of credit risk for debt securities, unrealised capital losses are transferred from shareholders’ equity to the profit or loss account.
Any subsequent decrease in the impairment loss is credited to the profit and loss account for debt securities, but not for equity securities. Any positive change in the fair value of the latter will be recognised in the shareholders’ equity, whereas any negative change in the fair value will be accounted for in the profit or loss account.
Options Adopted by BMCE Bank
BMCE Bank Group has chosen a classification as a function of the intention of management and the nature of securities.
The portfolio is made of the following securities :
• Equity investments ;
• Trading securities ;
• Regulated securities
Securities
Classification
These securities are classified as available-for-sale financial assets, recognised at fair value.
Valuation
Listed securities : the reference value is the last stock price.
Unlisted securities : the fair value is measured according to internal models.
Impairment Loss
Listed securities : decrease by 20% in the stock price over the last 6 months ;
Unlisted securities : according to impairment indications for the monitoring of provisioning.
Trading Room
Classification
The purpose of management is defined in accordance with the future management of the Trading Room. At the opening balance sheet, the securities managed under the trading room were essentially for trading purposes.
Valuation
Listed Securities : the fair value corresponds to the market share.
Unlisted Securities : the fair value is measured according to an internal model.
Regulated Securities
These securities are classified as held-to-maturity financial assets.
2.6. IMPAIRMENT
Portfolio Impairment
If there is no objective evidence of impairment, whether it is

12
significant or not, the financial asset is included in a portfolio of securities having the same credit risk characteristics to be collectively assessed.
Indication of Impairment
In a portfolio assessment, an objective evidence of impairment can be reduced to observable events indicating a measurable decrease in the estimated future cash flows of a group of loans, since the initial recognition, although this decrease can be associated with the different loans making this portfolio :
• Adverse changes in the capacity of borrowers ;
• A national or local economic situation correlated to the default payment on the assets of the portfolio.
Individual Impairment
An impairment loss is recognised when there is objective evidence or several objective indications of a decrease in the value of loans, including:
• Significant financial difficulties of the issuer or the debtor ;
• A breach in the contract resulting from a default payment (interest or principal) ;
• The granting by the lender to the borrower, for economic or legal reasons related to financial difficulties, of a facility that the lender did not expect in other circumstances ;
• The increasing likelihood of bankruptcy or other restructuring of the borrower ;
• The disappearance of an active market for that financial asset following financial difficulties, or ;
• Observable events indicating a measurable decrease in the estimated future cash flows of a group of financial assets, since the initial recognition, although this decrease can be associated with every single asset in the portfolio :
- Adverse changes in the solvency of borrowers ;
- A national or local economic situation correlated to the default payment on the assets of the portfolio.
Impairment Method
IAS 39 does not distinguish different methodologies for the assessment of individually and collectively impaired assets.
Instead, the only principle is to provision the excess of the book value (carrying amount) on the recovered value.
The recoverable value is the present value, discounted at the effective interest rate, of the estimated future cash flows of the asset (or a group of assets).
An impairment loss is recognised when there is an evidence of a measurable decrease in the value (impact on the cash flows of the asset).
Given the valuation technique of recoverable values under IFRS, companies must be able to correlate the observed objective evidence of impairment and its impact on the expected cash flows of the portfolio.
Impairment Loss
Under IFRS, the amount of impairment is the difference between the carrying amount and the recoverable value, which corresponds to the present value of the estimated recoverable cash flows, discounted at the effective interest rate.
Options Adopted by BMCE Bank
Portfolio Impairment
Only an observable decrease in value is subject to impairment according to IAS 39. Expected losses are not subject to impairment.
As for portfolio impairment, BMCE Bank has identified a certain number of criteria for the analysis of the behavior of loans and receivables, and their categorisation in types of anomalies that will be used for the constitution of homogenous groups of assets.
The used method consists of assessing a portfolio of loans, classified under surveillance during the last fiscal years, in order to determine the level at which loans will be considered as ‘‘non performing’’ based on statistical studies. This is applied, along with the impairment loss defined under IFRS, to these loans to measure the portfolio impairment.
Individual Impairment
The Group considers that it is possible and necessary to apply the contagion principle to identify outstanding loans with objective evidence of a decrease in value according to IFRS standards.
To measure the impact at the opening balance sheet, BMCE Bank’s portfolio of nonperforming loans was broken down as follows :
- ‘‘Large loans’’ ;
- Review of every individual loan application by BMCE Bank in order to calculate the estimated recovered cash flows over a time horizon ;
- The impairment under IFRS corresponds to the difference between the debit balance and the sum of the expected recovered amount ;
- The loans not included in the large loans category are subject to an extrapolation on the basis of the impairment rate used for large loans.
2.7. GOODWILL
The cost of a business combination
The cost of a business combination is measured as the aggregate of the fair values, at the date of exchange, of assets given, liabilities incurred or assumed and equity instruments issued by the acquirer in exchange for control of the acquired entity. Expenses related to the acquisition are accounted in expenses.
Recognition of the cost of a business combination in the assets acquired and the liabilities and contingent liabilities assumed
The acquirer must recognise the acquired entity’s identifiable assets, liabilities and contingent liabilities,

13
that satisfy the recognition criteria, at fair value at the acquisition date. Any difference between the cost of a business combination and the acquirer’s interest in the net fair value of the identifiable assets, liabilities and contingent liabilities is recognised under Goodwill.
Goodwill
Goodwill acquired must be recognised as an asset from the acquisition date. It is initially recognised at its historical cost i.e. the excess cost of the business combination over the acquirer’s interest in the net fair value of the identifiable assets, liabilities and contingent liabilities.
After initially being recognised at historical cost, Goodwill must subsequently be recognised at cost less cumulative impairment.
Goodwill may not be amortised but, instead, is tested for impairment.
In accordance with the IAS 36, impairment tests must be performed annually to verify that goodwill’s recorded for each subsidiary do not have to be impaired.
Options Adopted by BMCE Bank
• In accordance with IFRS 1, BMCE Bank has decided not to amortise existing Goodwill.
• Goodwill will not be amortised.
Impairment tests of goodwill were made in the fiscal year 2012. They aim to ensure that the carrying amount of the cash generating units is always less than the recoverable amount. These tests will be realized once a year if there is a risk of impairment, and in any event.
The recoverable amount of a cash generating unit is defined as the highest value of its fair value less the selling costs and its use value.
The fair value is the amount that we can normally expect for the sale of a CGU in normal market conditions.
The use value is based on estimated discounted cash flows generated by the business as part of its running by the bank:
• If the recoverable amount of the subsidiary is higher than the book value, so there is no need to observe impairment;
• Otherwise, the difference is recognized as an expense of impairment. It will be primarily allocated to goodwill and other assets on a pro rata basis.
The bank used different methods for the valuation of the fair value of CGU according to the criteria of each subsidiary. These methods are based on assumptions and assessments:
• The income approach, commonly called «Discounted Dividend Model,» which is a standard method in the banking sector. The implementation of this method is based on the business plan of the subsidiary and thereby enhances it through the actual value of future dividends. These flows are discounted at the cost of equity.
• The method of «discounted cash flow» is a traditional method for the evaluation of companies in the service sector. It is based on discounted cash flows at the weighted average cost of capital.
2.8. TRANSLATION DIFFERENCES
IAS 21 «The effects of changes in foreign exchange rates» contains the following general provisions concerning translation differences:
• Non-monetary items that are measured in terms of historical cost in a foreign currency remain at historical cost ;
• Non-monetary items that are measured at fair value are translated using the exchange rates when the fair value was determined ;
• Monetary items are translated using the closing rate ;
• Items of income and expenditure are translated at exchange rates at the transaction dates except for amortisation charges and provisions for non-monetary items which are translated at historical cost.
Exchange differences for monetary items are recognised in profit or loss in the period in which they arise.
Translation of financial statements of foreign subsidiaries
Assets and liabilities are translated at closing exchange rates :
• Items of income and expenditure are translated the exchange rates prevailing at the date of each transaction but, for convenience, may be translated at average exchange rates over the period except in the case of material changes ;
• Translation differences are posted to shareholders’ equity, although the share of minority interests must be clearly differentiated.
Options Adopted by BMCE Bank
In the case of equity securities of non-consolidated companies qualified as assets available for sale (AFS), translation differences will be a constituent of fair value recognised in shareholders’ equity.
BMCE Bank Group has considered its overall translation differences at the adoption date to be zero for all its foreign activities.
The consequences are, therefore, as follows :
• Translation differences or reserves are reclassified under opening shareholders’ equity ;
• Translation differences accumulated prior to the IFRS adoption date are not to be taken into consideration when determining income on the future disposal of the activities in question. On subsequent disposal, the entity will not recognise these differences in income. On the other hand, any translation difference arising after IFRS adoption by the subsidiaries in question will be recognised in income.
2.9. PROVISIONS
A provision is a liability of uncertain timing or amount.
A liability is a present liability arising from past events whose settlement is expected to result in an outflow of resources (economic benefits).

14
Measurement
The amount recognised as a provision must be the best estimate of the expenditure required to settle the present liability at the closing balance sheet date.
According to IAS 37, the amount of the provision must be discounted if the impact is material. The standard states that a company must recognise a provision if the following three criteria are met :
• A present liability towards a third party ;
• Probability of resources outflow to settle the liability ;
• The amount can be estimated reliably.
Options Adopted by BMCE Bank
First-time adoption
• The Bank has discounted those provisions meeting the three criteria outlined above if the impact is material ;
• Incompatible provisions are written back to shareholders’ equity.
2.10. OUT-OF-MARKET LOANS
Under IFRS, a loan’s entry value is equal to its fair value plus the internal and external transaction costs directly attributable to the issue of the loan.
Fair value is equal to :
• The nominal value if the loan is “in the market” and if there are no transaction costs ;
• The sum of future expected cash flows discounted at the market rate; any difference between the loan’s market rate and contractual rate results in immediate recognition of a write-down through income which may be subsequently written back over the loan’s life.
The decision to classify an issued loan “out-of-market” is made if the issuer has offered very advantageous financing terms by comparison with those generally offered by competitors in order to win a customer. If this is the case, a write-down relating to the difference between the market rate and contractual rate is recognised in income and is amortised over the loan’s life at the effective interest rate.
Options Adopted by BMCE Bank
BMCE Bank must therefore decide which loans have been issued by the Group at rates considered to be “out-of-market”.
In the absence of clear guidelines on the concept of “out-of-market”, the Bank has decided to apply Bank Al-Maghrib’s minimum lending rates.
2.11. LEASES
IAS 17 makes a distinction between two types of lease :
• A lease is classified as a finance lease if it transfers a substantial portion of the risks and rewards incident to ownership of an asset. Title may or may not be transferred in fine ;
• A lease contract is classified as an operating lease if it does not transfer a substantial portion of the risks and rewards incident to ownership.
IAS 17 provides five examples which would normally lead to a lease being classified as a finance lease :
• The lease transfers ownership of the asset to the lessee by the end of the lease term ;
• The lessee has the option to purchase the asset at a price which is substantially lower than fair value at the date the option becomes exercisable on the basis that, at the inception of the lease, it is reasonably certain that the option will be exercised ;
• The lease term is for the major part of the economic life of the asset, even if title is not transferred ;
• At the inception of the lease, the present value of the minimum lease payments amounts to at least a substantial portion of the fair value of the leased asset ; and
• The leased assets are of a specialised nature such that only the lessee can use them without major modifications being made.
Accounting for finance leases
• The lessor should record an asset held under a finance lease in the balance sheet as a receivable at an amount equal to the net investment in the lease ;
• Finance lease payments should be apportioned between the finance charge and the reduction of the outstanding liability ;
• An operating lease does not transfer to the lessee all risks and rewards incident to ownership.
Accounting for operating leases
• Assets held under operating leases should be recorded on the lessor’s balance sheet according to the nature of the asset ;
• Income statement – the lease payments should be recognised as an expense in income over the lease term on a straight-line basis, unless another systematic basis is more representative of the time pattern in which use benefit is derived from the diminished leased asset;
• The depreciation policy for leased assets should be consistent with the policy normally adopted by the lessor for similar assets and must be calculated on the basis outlined in IAS 16 (plant, property and equipment) and IAS 38 (intangible fixed assets).
Options Adopted by BMCE Bank
The entities concerned by application of the standard relating to leases are Maghrebail, Salafin, Locasom as well as some subsidiaries of BOA Group.
The contracts entered into Maghrébail, Salafin and BOA subsidiaries meet the definition of leases. However, contracts of Locasom meet the definition of a finance lease.
As all BMCE Group’s lease contracts are classified as finance leases, the accounting treatment currently employed at a consoldiated level is in accordance with IFRS. The impact is therefore zero.
2.12. EMPLOYEE BENEFITS
Classification of employee benefits

15
Short-term benefits
These relate to benefits due within the 12 months following the close of the period in which staff members have provided the corresponding services. They are recognised as expenses in the period in which they are consumed.
Post-employment defined contribution schemes
The employer makes a fixed payment contribution to an external fund and has no other liability. Benefits received are determined as a function of contributions made plus any interest and are recognised as expenses in the period in which they are consumed.
Post-employment defined benefit schemes
These are defined as all post-employment benefits other than those relating to defined contribution schemes. The employer undertakes to make available a certain level of benefit after an employee’s departure, whatever the liability’s cover. Provisions are required.
Long-term benefits
These relate to benefits which are not due within the 12 months following the close of the period in which staff members have provided the corresponding services. Provisions are required if the benefit depends on an employee’s length of service.
Termination payments
Termination payments are made in the event of dismissal or voluntary redundancy. The company may book provisions if it is clearly committed to making employees redundant.
Funding and accounting principles for post-employment defined benefit schemes and other long-term benefits
Assessment and accounting principles of the Post-employment benefits and other long-term benefits
Valuation principles
The valuation method adopted is the projected unit credit method which apportions benefits by service on a pro-rata basis. This method comprises two phases .
• An assessment of long-term benefits, relating to future cash flows, based on actuarial assumptions; ;
• Apportioning the long-term benefits over the period of activity during which BMCE Bank benefits from the service of its employees.
Accounting principles
Definitions
Net present value of the gross liability i.e. the actuarial value of employee benefits or actuarial liability.
Non-recognised items – unrealised gains and losses to be amortised in the future or non-recognised items.
Accounting for post-employment benefits
The provision required is equal to the net liability less non-recognised items. There are two categories of non-recognised items:
• In the event that the company opts for the corridor method, actuarial gains and losses, comprising the difference
between the actual liability’s estimated net present value at the closing balance sheet date on the basis of the opening net present value and events arising during the period, result from one of the following two factors :
- Changes to actuarial assumptions made between the opening and closing balance sheet dates in the light of specific events arising during the period or changes to the general economic environment i.e. assumption-based actuarial gains and losses ;
- Differences between initial expectations of employees’ socio-economic behaviour or the general economic environment during the period – reflected in actuarial assumptions – and what actually occured i.e. experience-based actuarial gains and losses.
• Past service cost, arising from changes to scheme arrangements, which is the term used to describe the change in the liability for employee service in prior periods.
Non-amortised items are amortised differently, depending on the situation :
• Past service cost is amortised on a straight-line basis over the average period until the amended benefits become vested.
The corridor rule consists of amortising at least over one period and generally over the remaining active service life of employees, at the closing balance sheet date, the portion of net accumulative non-recognised actuarial gains and losses equal to or exceeding 10% of the actuarial liability at the opening balance sheet date or the fair value of assets, whichever is the greater.
Accounting for other long-term benefits
The provision required at each closing balance sheet date is equal to the liability’s current value.
Options adopted by BMCE Bank
A provision is required, at each closing balance sheet date, equal to the liability’s current value, in respect of actuarially assessed defined benefits using the projected unit credit method. This allowance is recognized under the «provisions» item of liabilities.
Employee benefits recognised relate to end-of-career bonuses and termination benefits.
Long service award ‘’médaille du travail’’: compensation paid to employees when they reach 6 levels of seniority between 15 and 40 years.
Compensation at retirement: bonus granted during retirement depends on age, resulting from enterprise agreement
No provision has been booked relating to post-employment health cover (CMIM) due to the lack of required information.
2.13. RESTRUCTURED LOANS
Restructured loans are loans whose terms, including interest received by BMCE Bank, have been modified due to difficulties encountered by the counterparty.
Accounting principles
16
When a loan is restructured due to the borrower’s financial situation, future cash flows are discounted at the original effective interest rate and the difference between this amount and the loan’s carrying amount is immediately recognised in the cost of risk. This write-down is incorporated over the life of the loan in interest income.
Options Adopted by BMCE Bank
Restructured loans have been identified by cross-checking consolidated loans in the accounting statements held for accounting purposes against management records held for monitoring loan commitments for loans of above one million dirhams.
In each case, the write-down at the date of renegotiation has been calculated based on original maturities and renegotiation terms.
The write-down is calculated as the difference between :
• The sum, at the date of renegotiation, of contractual initial cash flows, discounted at the effective interest rate ;
• And the sum, at the date of renegotiation of renegotiated initial cash flows, discounted at the effective interest rate.
For the opening balance, the write-down net of amortisation is recognised by a decrease in the value of loans outstanding against shareholders’ equity with amortisation charged to net banking income.
On a recurring basis, write-downs are charged to income at the time of restructuring.
2.14. TREASURY SHARES
When an entity buys back its own shares, they must be deducted from shareholders’ equity. Any profit or loss must not be recognised in income on purchase, sale, issue or cancellation of a company’s Treasury stock. Treasury shares may be acquired or held by the entity or members of the consolidated entity. The counterpart payment made or received must be recognised directly in shareholders’ equity.
Treasury securities held for an employee stock-option scheme must be deduced from consolidated shareholders’ equity, regardless of why they were acquired.
Options Adopted by BMCE Bank
All BMCE Bank securities held by Group entities must be cancelled by deducting shareholders’ equity.
The entity deducts directly from shareholders’ equity, net of any related tax credit in income, distributions to equity shareholders.
Transaction costs relating to shareholders’ equity, with the exception of equity issuance costs, directly attributable to the acquisition of an entity, must be recognised by deducting shareholders’ equity, net of any related tax credit in income.
Only BMCE Bank Maroc is concerned by the application of this standard.
2.15. EFFECTIVE INTEREST RATE
IAS 39 defines the effective interest rate as the rate which equates the net present value of future cash flows and
the loan’s initial carrying amount, which incorporates transaction costs and fees.
Costs and royalties to be included when calculating the effective interest rate.
Costs
IAS 39 provides for transaction costs to be amortised over the period at the effective interest rate.
These are marginal costs directly attributable to the acquisition, issue or exit of a financial asset or financial liability.
Fees
IAS 18 differentiates between 3 fee categories depending on the nomenclature :
- Fees forming an integral part of a financial instrument’s effective interest rate ;
• Origination fees on loan sanctioning ;
• Commitment fees received ;
- Fees received in line with services provided ;
- Fees for completion of an important act.
Accounting principles
Issued loans are recognised at amortised cost at the effective interest rate.
Options Adopted by BMCE Bank
Analysis has shown that costs and fees are not material. It was decided, therefore, not to amortise them for the purpose of first-time adoption. Transaction costs and fees must be regularly monitored to ensure that they are not material.
Depending on the outcome, the Group will decide whether transaction costs and fees for loans maturing after one year will be amortised or not. Loans maturing in less than one year will be held at historical cost.
2.16. CUSTOMER DEPOSITS
Accounting principles
Initial measurement
When a financial liability is recognised initially, an entity shall measure it at fair value plus, in the case of a financial liability not at fair value through income, transaction costs that are directly attributable to the acquisition or issue of the financial liability.
Subsequent measurement
After initial recognition, a financial liability must be measured at amortised cost using the effective interest rate, except for :
• Financial liabilities at fair value, through profit and loss ;
• Financial liabilities that arise when a transfer of a financial asset does not qualify for recognition or when the continuing involvement approach applies.
Options Adopted by BMCE Bank
17
Currently, the Group categorises all deposits under “Other financial liabilities”. No deposit is categorised under “Financial liabilities held for trading purposes”.
BMCE Bank deposits systematically have a maturity of no more than one year. It was concluded, therefore, that the impact from calculating a write-down and its amortisation over the life of the deposit was not material.
No other item needs to be incorporated in the calculation regarding either existing or new deposits.
No restatement has been made for sight deposits and savings accounts ;
Interest-bearing deposits must be categorised under loans and advances and treated accordingly.
2.17. DEFERRED TAXES
Deferred taxes are recognized when they are temporary differences between the book and tax value of assets and liabilities.
A deferred tax asset is a tax which is recoverable in the future.
A tax liability is a tax which is payable in the future.
Options Adopted by BMCE Bank
The Group has chosen to assess the probability of recovering deferred tax assets.
Deferred tax assets are not recognised unless recovery of future taxable profit is probable. The probability of recovery may be ascertained by evaluating the business plans of the companies in question.
Under IFRS, the phrase “probable recovery” must be interpreted as meaning that “recovery is more probable than improbable”. This could result, in certain cases, of recognising a high level of deferred tax assets than under generally accepted accounting principles, where this phrase is often interpreted as implying “a high level of probability”.
2.18. DERIVATIVES
A derivative is a financial instrument (firm or optional) whose value varies as a function of the value of an underlying variable such as an interest rate, commodity or security price.
These are generally highly-geared instruments which require none or limited initial investment. Derivative instruments include swaps, options, futures and forward contracts.
Derivatives (swaps, options etc.) are recognised on the balance sheet at fair value. At each balance sheet, they are marked to market on the balance sheet. Changes in fair value are recognised in income.
Options Adopted by BMCE Bank
Analysis conducted internally has concluded that BMCE Bank Group does not undertake hedging activities.
2.19. SHARE-BASED PAYMENT
This standard deals with the payment of share based transactions in which and that are settled in equity
instruments in return for goods or services are received as consideration for equity instruments. The payment can also be concluded by the equivalent of equity instruments issued.
In fiscal year 2010, BMCE Bank carried out a capital increase in cash reserved for employees of BMCE BANK Group.
An expense was recorded in the consolidated accounts taking into consideration the terms of this offer and the requirements of IFRS 2 and IAS 39.

18
Assets NOTES 2012 2011
Cash and amounts due from central banks and post office banks 9 922 200 6 391 958
Financial assets at fair value through profit or loss 5.1 34 244 677 31 732 316
Derivatives used for hedging purposes - -
Available-for-sale financial assets 5.2 2 795 923 2 330 377
Loans and receivables due from credit institutions 5.3 21 396 946 23 822 680
Loans and receivables due from customers 5.4 138 808 778 121 342 658
Remeasurement adjustment on interest rate risk hedged assets - -
Held-to-maturity financial assets 5.6 10 518 941 9 590 911
Current tax assets 5.7 215 856 408 979
Deferred tax assets 5.7 310 849 321 084
Accrued income and other assets 5.8 4 938 775 4 559 041
Non current assets held for sale - -
Investment in companies consolidated under the equity method 5.9 406 928 399 358
Investment property 5.10 614 160 547 099
Property, plant and equipment 5.10 5 131 528 5 064 126
Intangible assets 5.10 751 455 645 081
Goodwill 5.11 832 470 832 470
TOTAL ASSETS 230 889 486 207 988 138
(In thousand MAD)
LIABILITIES & SHAREHOLDERS EQUITY NOTES 2012 2011
Due to Central Banks and Post Office Banks 67 382 -
Financial liabilities at fair value through profit or loss 5.1 1 614 1 752
Derivatives used for hedging purposes - -
Due to credit institutions 5.3 34 228 166 24 848 609
Due to customers 5.4 144 650 757 139 152 010
Debt securities 5.5 14 014 898 12 008 860
Remeasurement adjustment on interest rate risk hedged portfolios - -
Current tax liabilities 5.7 36 296 324 592
Deferred tax liabilities 5.7 983 149 934 127
Accrued expenses and other liabilities 5.8 13 210 127 8 971 070
Liabilities related to non-current assets held for sale - -
Technical reserves of insurance companies - -
Provisions for contingencies and charges 5.12 523 235 457 440
Subsidies, assigned public funds and special guarantee funds - -
Subordinated debts 5.5 4 760 333 4 904 381
TOTAL DEBTS 212 475 957 191 602 841
Capital and related reserves 11 981 368 10 451 134
Consolidated reserves - -
- Attributable to parent 1 269 541 1 045 085
- Non-controlling interests 3 516 000 3 318 803
Unrealized or deferred gains or losses, attributable to parent 86 129 82 186
Unrealized or deferred gains or losses, non-controlling interests -18 970 -19 665
Net Income
- Attributable to parent 923 152 850 199
- Non-controlling interests 656 309 657 555
TOTAL CONSOLIDATED SHARE HOLDERS’S EQUITY 18 413 529 16 385 297
TOTAL 230 889 486 207 988 138
(In thousand MAD)
BALANCE SHEET
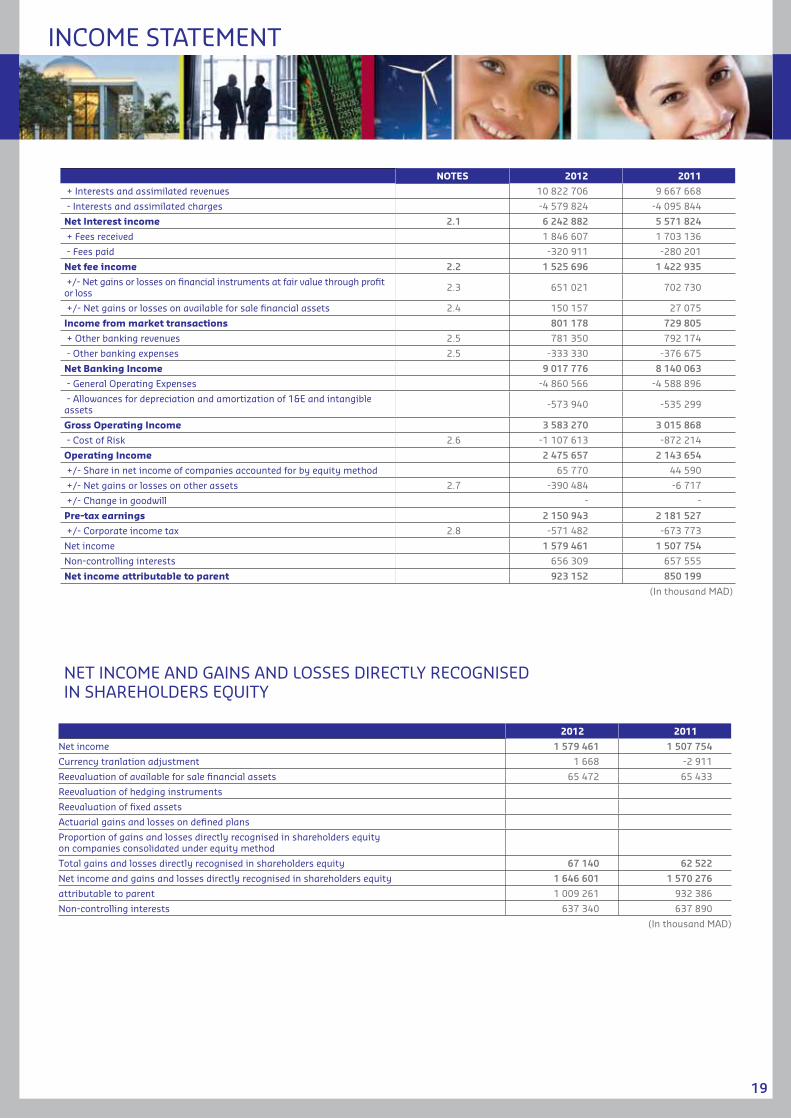
19
NOTES 2012 2011
+ Interests and assimilated revenues 10 822 706 9 667 668
- Interests and assimilated charges -4 579 824 -4 095 844
Net Interest income 2.1 6 242 882 5 571 824
+ Fees received 1 846 607 1 703 136
- Fees paid -320 911 -280 201
Net fee income 2.2 1 525 696 1 422 935
+/- Net gains or losses on financial instruments at fair value through profit or loss 2.3 651 021 702 730
+/- Net gains or losses on available for sale financial assets 2.4 150 157 27 075
Income from market transactions 801 178 729 805
+ Other banking revenues 2.5 781 350 792 174
- Other banking expenses 2.5 -333 330 -376 675
Net Banking Income 9 017 776 8 140 063
- General Operating Expenses -4 860 566 -4 588 896
- Allowances for depreciation and amortization of 1&E and intangible assets -573 940 -535 299
Gross Operating Income 3 583 270 3 015 868
- Cost of Risk 2.6 -1 107 613 -872 214
Operating Income 2 475 657 2 143 654
+/- Share in net income of companies accounted for by equity method 65 770 44 590
+/- Net gains or losses on other assets 2.7 -390 484 -6 717
+/- Change in goodwill - -
Pre-tax earnings 2 150 943 2 181 527
+/- Corporate income tax 2.8 -571 482 -673 773
Net income 1 579 461 1 507 754
Non-controlling interests 656 309 657 555
Net income attributable to parent 923 152 850 199
(In thousand MAD)
2012 2011
Net income 1 579 461 1 507 754
Currency tranlation adjustment 1 668 -2 911
Reevaluation of available for sale financial assets 65 472 65 433
Reevaluation of hedging instruments
Reevaluation of fixed assets
Actuarial gains and losses on defined plans
Proportion of gains and losses directly recognised in shareholders equityon companies consolidated under equity method
Total gains and losses directly recognised in shareholders equity 67 140 62 522
Net income and gains and losses directly recognised in shareholders equity 1 646 601 1 570 276
attributable to parent 1 009 261 932 386
Non-controlling interests 637 340 637 890
(In thousand MAD)
NET INCOME AND GAINS AND LOSSES DIRECTLY RECOGNISEDIN SHAREHOLDERS EQUITY
INCOME STATEMENT

20
Share Capital
Reserves related to
stock
Treasury stock
Reserves &
consolidated earnings
Unrealised or deferred
gains or losses
Shareholder’s Equity
attributable to parent
Non-controlling
interestsTotal
Ending balance of Shareholder’s Equity 12.31.2010 1 719 514 8 719 711 0 1 972 189 -20 979 12 390 435 3 428 530 15 818 965
Change in the accounting methods
Beginning Balance of adjusted Shareholder’s Equity 12.31.2010 1 719 514 8 719 711 0 1 972 189 -20 979 12 390 435 3 428 530 15 818 965
Operations on capital 11 909 -36 548 -24 639 276 523 251 884
Share-based payment plans 0 0
Operations on treasury stock
Dividends -510 486 -510 486 -242 559 -753 045
Net income 850 199 850 199 657 555 1 507 754
PP&E and intangible assets : Revaluations and disposals (A) 0 0
Financial instruments : change in fair Value and transfer to earnings (B) -8 029 103 165 95 136 -19 665 75 471
Currency translation adjustments : Changes and transfer to earnings (C) 23 758 23 758 -23 169 589
Unrealized or deferred gains or losses (A)+ (B) + (C) 0 0 0 15 729 103 165 118 894 -42 834 76 060
Change in the scope of consolidation -177 271 -177 271 -120 522 -297 793
Others -218 528 -218 528 -218 528
Ending Balance of Shareholder’s Equity 12.31.2011 1 719 514 8 731 620 0 1 895 284 82 186 12 428 604 3 956 693 16 385 297
Impact of changes in accounting methods
Ending Balance of adjusted Shareholder’s Equity 12.31.2011 1 719 514 8 731 620 0 1 895 284 82 186 12 428 604 3 956 693 16 385 297
Operations on capital (1); (2) 75 000 1 455 234 151 846 1 682 080 45 587 1 727 667
Share-based payment plans 0 0
Operations on treasury stock 0 0
Dividends -530 954 -530 954 -329 259 -860 213
Net income 923 152 923 152 656 309 1 579 461
PP&E and intangible assets: Revaluations and disposals (E) 0 0
Financial instruments: change in fair Value and transfer to earnings (F) 19 471 3 943 23 414 837 24 251
Currency translation adjustments: Changes and transfer to earnings (G) -14 888 -14 888 10 680 -4 208
Unrealized or deferred gains or losses (E)+ (F) + (G) 0 0 0 4 583 3 943 8 526 11 517 20 043
Change in the scope of consolidation -251 218 -251 218 -187 508 -438 726
Others 0 0 0
Ending Balance of adjusted Shareholder’s Equity 06.30.2012 1 794 514 10 186 854 0 2 192 693 86 129 14 260 190 4 153 339 18 413 529
(In thousand MAD)
NB: A cash account of around 1.5 million KMAD devoted to capital increase of BMCE Bank SA, the increase has resulted in the creation of 7.5 million new shares at an issue price of 200 MAD, a nominal of 10 MAD and an issue premium of 190 MAD.
(1) : Creation of 7.5 million shares at par value of 10 MAD
(2) : Capital reserves
Allocation of net income to reserves in 2011.
Premium: 7 500 000 shares with an issue of 190 MAD per share.
STATEMENT OF CHANGES IN SHAREHOLDER’S EQUITY

21
CASH FLOWS
CASH FLOWS BY GEOGRAPHIC AREA
2012 2011Pre-tax net income 2 150 943 2 181 527+/- Net depreciation/amortization expense on property, plant, and equipment and intangible assets 3 054 760 2 963 886+/- Impairment of goodwill and other non- current assets 0 0+/- Impairment of financial assets 109 300 165 026+/- Net allowances for provisions 665 231 659 723+/- Share of earnings in subsidiaries accounted for by equity method -55 215 -44 591+/- Net loss (income) from investing activities -990 901 -1 465 434+/- Net loss (income) from financing activities 0 0+/- Other movements 195 374 95 910Non monetary items included in pre-tax net income and other adjustments 2 978 549 2 374 520+/- Cash flows related to transactions with credit institutions 13 027 531 10 723 883+/- Cash flows related to transactions with customers -14 814 540 -10 060 593+/- Cash flows related to transactions involving other financial assets and liabilities -2 343 396 -3 805 482+/- Cash flows related to transactions involving non financial assets and liabilities 3 581 880 -28 000+/- Taxes paid -602 893 -626 156Net Increase (Decrease) in cash related to assets and liabilities generated by operating activities -1 151 418 -3 796 348Net Cash Flows from Operating Activities 3 978 074 759 699+/- Cash Flows related to financial assets and equity investments -1 093 317 -1 090 685+/- Cash flows related to investment property -286 -177+/- Cash flows related to PP&E and intangible assets -528 089 -1 298 024Net Cash Flows from Investing Activities -1 621 692 -2 388 886+/- Cash flows related to transactions with shareholders 1 096 982 -339 866+/- Cash flows generated by other financing activities 1 949 786 703 344Net Cash Flows from Financing Activities 3 046 768 363 478Effect of movements in exchange rates on cash and equivalents 57 761 -30 074Net Increase in Cash and equivalents 5 460 911 -1 295 783 Beginning Balance of Cash and Equivalents 10 638 001 11 933 784Net Balance of cash accounts and accounts with central banks and post office banks 6 391 958 8 033 096Net Balance of demand loans and deposits- credit institutions 4 246 043 3 900 688Ending Balance of Cash and Equivalents 16 098 912 10 638 001Net Balance of cash accounts and accounts with central banks and post office banks 9 854 817 6 391 958Net Balance of demand loans and deposits- credit institutions 6 244 095 4 246 043Net increase in cash and equivalents 5 460 911 -1 295 783
(In thousand MAD)
MOROCCO EUROPE AFRICAPre-tax net income 994 251 66 060 1 090 753+/- Net depreciation/amortization expense on property, plant, and equipment and intangible assets 2 786 704 24 487 243 569+/- Impairment of goodwill and other non- current assets -86 389 284 86 105+/- Impairment of financial assets 109 300 0 0+/- Net allowances for provisions 261 647 28 727 374 857+/- Share of earnings in subsidiaries accounted for by equity method -10 157 0 -45 058+/- Net loss (income) from investing activities -843 863 -14 178 -132 860+/- Net loss (income) from financing activities 0 0 0+/- Other movements 175 881 34 802 -15 430Non monetary items included in pre-tax net income and other adjustments 2 393 123 74 122 511 183+/- Cash flows related to transactions with credit institutions 10 460 395 -1 049 898 3 617 034+/- Cash flows related to transactions with customers -14 131 874 55 536 -738 202+/- Cash flows related to transactions involving other financial assets and liabilities -1 579 885 16 039 -779 550+/- Cash flows related to transactions involving non financial assets and liabilities 4 819 766 -50 461 -1 187 425+/- Taxes paid -447 704 3 023 -158 212Net Increase (Decrease) in cash related to assets and liabilities generated by operating activities -879 302 -1 025 761 753 645Net Cash Flows from Operating Activities 2 508 072 -885 579 2 355 581+/- Cash Flows related to financial assets and equity investments -644 483 -11 800 -437 034+/- Cash flows related to investment property -286 0 0+/- Cash flows related to PP&E and intangible assets -327 339 4 718 -205 468Net Cash Flows from Investing Activities -972 108 -7 082 -642 502+/- Cash flows related to transactions with shareholders 1 167 095 94 260 -164 373+/- Cash flows generated by other financing activities 1 406 465 -31 588 574 909Net Cash Flows from Financing Activities 2 573 560 62 672 410 536Effect of movements in exchange rates on cash and equivalents -4 083 27 195 34 649Net Increase in Cash and equivalents 4 105 441 -802 794 2 158 264 Beginning Balance of Cash and Equivalents 2 530 547 1 354 696 6 752 758Net Balance of cash accounts and accounts with central banks and post office banks 1 712 872 85 154 4 593 932Net Balance of demand loans and deposits- credit institutions 817 675 1 269 542 2 158 826Ending Balance of Cash and Equivalents 6 635 988 551 902 8 911 022Net Balance of cash accounts and accounts with central banks and post office banks 3 764 729 -12 496 6 102 584Net Balance of demand loans and deposits- credit institutions 2 871 259 564 398 2 808 438Net increase in cash and equivalents 4 105 441 -802 794 2 158 264
(In thousand MAD)
CASH FLOW STATEMENT

22
(In thousand MAD)
2012 2011
Income Expense Net Income Expense Net
Customer Items 8 581 131 2 818 182 5 762 949 7 614 768 2 772 953 4 841 815
Deposits, loans and borrowings 7 991 041 2 702 532 5 288 509 6 987 941 2 601 939 4 386 002
Repurchase agreements 115 650 -115 650 171 014 -171 014
Finance leases 590 090 0 590 090 626 827 626 827
Interbank items 730 430 1 018 766 -288 336 729 381 633 259 96 122
Deposits, loans and borrowings 487 627 969 104 -481 477 524 514 576 358 -51 844
Repurchase agreements 242 803 49 662 193 141 204 867 56 901 147 966
Debt securities issued 0 0 0 0 0 0
Cash flow hedge instruments 0 0 0 0 0 0
Interest rate portfolio hedge instruments 0 0 0 0 0 0
Trading book 841 682 742 876 98 806 740 126 689 632 50 494
Fixed income securities 841 682 525 899 315 783 740 126 456 680 283 446
Repurchase agreements 0 0
Loans/borrowings 0 0
Debt securities 0 216 977 -216 977 0 232 952 -232 952
Available for sale financial assets 0 0
Held to maturity financial assets 669 463 669 463 583 393 583 393
TOTAL INTEREST INCOME (ExPENSE) 10 822 706 4 579 824 6 242 882 9 667 668 4 095 844 5 571 824
Income Expense Net
Net fee on transactions 741 051 195 633 545 418
With credit institutions -
With customers 267 891 267 891
On custody 146 743 125 284 21 459
On foreign exchange 326 417 70 349 256 068
On financial instruments and off balance sheet -
Banking and financial services 1 105 556 125 278 980 278
Income from mutual funds management -
Income from electronic payment services 249 979 43 237 206 742
Insurance -
Other 855 577 82 041 773 536
NET FEE INCOME 1 846 607 320 911 1 525 696
2012 2011
Trading Book
Assets measured under
the fair value option
Total Trading Book
Assets measured under
the fair value option
Total
Fixed income and variable income securities 654 050 654 050 711 421 711 421
Derivative instruments -3 029 -3 029 -8 691 -8 691
Repurchase agreements
Loans
Borrowings
Remeasurement of interest rate risk hedged portfolios
Remeasurement of currency positions
TOTAL 651 021 0 651 021 702 730 0 702 730
(In thousand MAD)
(In thousand MAD)
2. NOTES TO CONSOLIDATED INCOME
2.1 - NET INTEREST INCOME
2.2 - NET FEE INCOME
2.3 - GAIN/LOSS ON FINANCIAL INSTRUMENTS AT FAIR VALUE THROUGH PROFIT OR LOSS
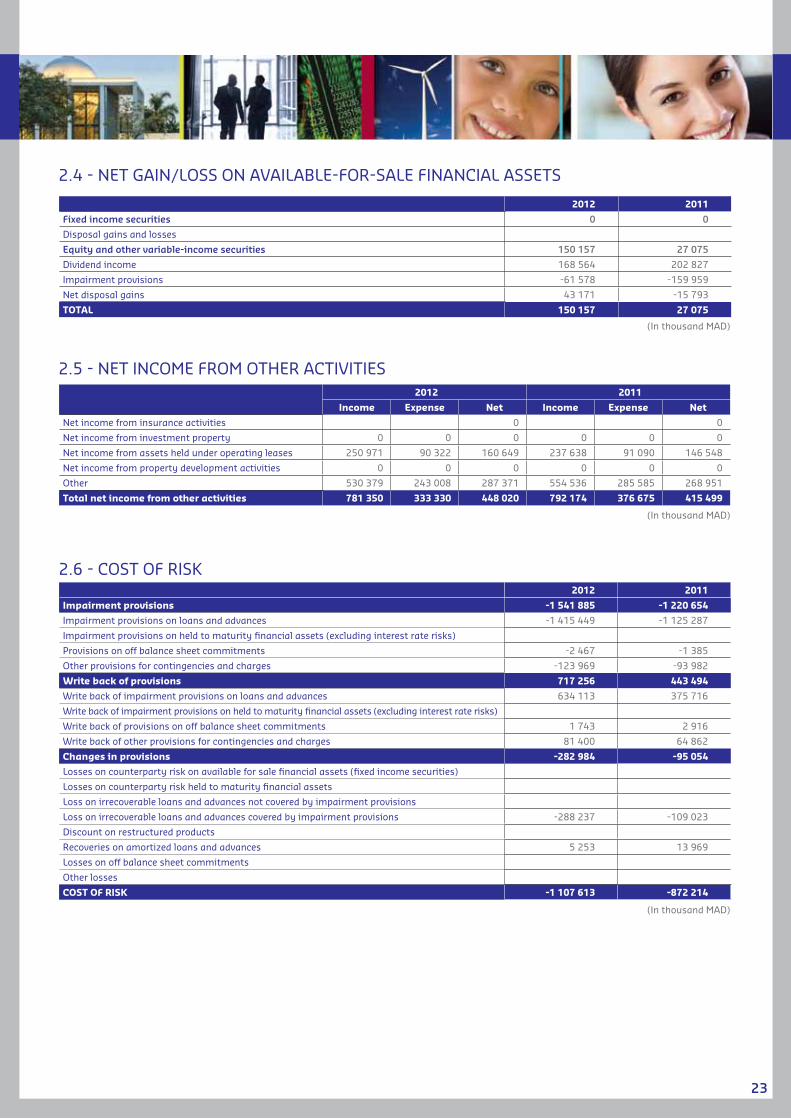
23
2012 2011
Fixed income securities 0 0
Disposal gains and losses
Equity and other variable-income securities 150 157 27 075
Dividend income 168 564 202 827
Impairment provisions -61 578 -159 959
Net disposal gains 43 171 -15 793
TOTAL 150 157 27 075
2012 2011
Income Expense Net Income Expense Net
Net income from insurance activities 0 0
Net income from investment property 0 0 0 0 0 0
Net income from assets held under operating leases 250 971 90 322 160 649 237 638 91 090 146 548
Net income from property development activities 0 0 0 0 0 0
Other 530 379 243 008 287 371 554 536 285 585 268 951
Total net income from other activities 781 350 333 330 448 020 792 174 376 675 415 499
2012 2011
Impairment provisions -1 541 885 -1 220 654
Impairment provisions on loans and advances -1 415 449 -1 125 287
Impairment provisions on held to maturity financial assets (excluding interest rate risks)
Provisions on off balance sheet commitments -2 467 -1 385
Other provisions for contingencies and charges -123 969 -93 982
Write back of provisions 717 256 443 494
Write back of impairment provisions on loans and advances 634 113 375 716
Write back of impairment provisions on held to maturity financial assets (excluding interest rate risks)
Write back of provisions on off balance sheet commitments 1 743 2 916
Write back of other provisions for contingencies and charges 81 400 64 862
Changes in provisions -282 984 -95 054
Losses on counterparty risk on available for sale financial assets (fixed income securities)
Losses on counterparty risk held to maturity financial assets
Loss on irrecoverable loans and advances not covered by impairment provisions
Loss on irrecoverable loans and advances covered by impairment provisions -288 237 -109 023
Discount on restructured products
Recoveries on amortized loans and advances 5 253 13 969
Losses on off balance sheet commitments
Other losses
COST OF RISK -1 107 613 -872 214
(In thousand MAD)
(In thousand MAD)
(In thousand MAD)
2.4 - NET GAIN/LOSS ON AVAILABLE-FOR-SALE FINANCIAL ASSETS
2.5 - NET INCOME FROM OTHER ACTIVITIES
2.6 - COST OF RISK
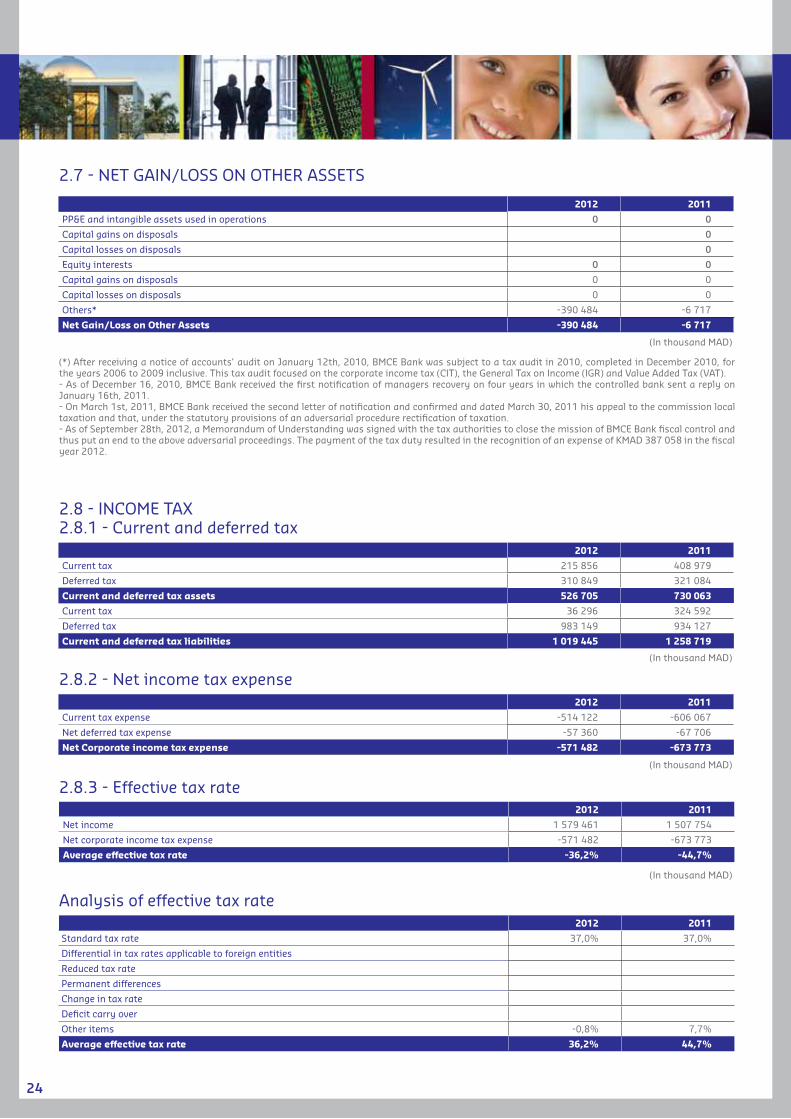
24
2.7 - NET GAIN/LOSS ON OTHER ASSETS
(*) After receiving a notice of accounts’ audit on January 12th, 2010, BMCE Bank was subject to a tax audit in 2010, completed in December 2010, for the years 2006 to 2009 inclusive. This tax audit focused on the corporate income tax (CIT), the General Tax on Income (IGR) and Value Added Tax (VAT).- As of December 16, 2010, BMCE Bank received the first notification of managers recovery on four years in which the controlled bank sent a reply on January 16th, 2011.- On March 1st, 2011, BMCE Bank received the second letter of notification and confirmed and dated March 30, 2011 his appeal to the commission local taxation and that, under the statutory provisions of an adversarial procedure rectification of taxation.- As of September 28th, 2012, a Memorandum of Understanding was signed with the tax authorities to close the mission of BMCE Bank fiscal control and thus put an end to the above adversarial proceedings. The payment of the tax duty resulted in the recognition of an expense of KMAD 387 058 in the fiscal year 2012.
2012 2011
PP&E and intangible assets used in operations 0 0
Capital gains on disposals 0
Capital losses on disposals 0
Equity interests 0 0
Capital gains on disposals 0 0
Capital losses on disposals 0 0
Others* -390 484 -6 717
Net Gain/Loss on Other Assets -390 484 -6 717
2012 2011
Standard tax rate 37,0% 37,0%
Differential in tax rates applicable to foreign entities
Reduced tax rate
Permanent differences
Change in tax rate
Deficit carry over
Other items -0,8% 7,7%
Average effective tax rate 36,2% 44,7%
(In thousand MAD)
2012 2011
Net income 1 579 461 1 507 754
Net corporate income tax expense -571 482 -673 773
Average effective tax rate -36,2% -44,7%
(In thousand MAD)
2012 2011
Current tax 215 856 408 979
Deferred tax 310 849 321 084
Current and deferred tax assets 526 705 730 063
Current tax 36 296 324 592
Deferred tax 983 149 934 127
Current and deferred tax liabilities 1 019 445 1 258 719
(In thousand MAD)
2012 2011
Current tax expense -514 122 -606 067
Net deferred tax expense -57 360 -67 706
Net Corporate income tax expense -571 482 -673 773
(In thousand MAD)
2.8 - INCOME TAx2.8.1 - Current and deferred tax
2.8.2 - Net income tax expense
2.8.3 - Effective tax rate
Analysis of effective tax rate

25
3 - SEGMENT INFORMATION
ACTIVITY IN MOROCCO
ASSET MANAGEMENT
SPECIALISED FINANCIAL SERVICES
OTHERS INTERNATIONAL ACTIVITIES TOTAL
TOTAL ASSETS 160 441 588 370 334 14 060 259 170 881 55 846 424 230 889 486
ASSETS ITEMS
Available for sale assets 1 312 325 101 008 5 711 25 440 1 351 439 2 795 923
Customer loans 95 425 585 5 824 13 185 602 0 30 191 767 138 808 778
Held to maturity assets 1 790 606 0 27 0 8 728 308 10 518 941
LIABILITIES & SHAREHOLDERS EQUITY ITEMS
Customer deposits 102 081 985 0 1 184 435 0 41 384 337 144 650 757
Shareholders equity 13 567 426 104 114 1 213 349 -97 626 3 626 266 18 413 529
MOROCCO EUROPE SUB SAHARAN AFRICA TOTAL
Total Asset 175 043 062 3 805 281 52 041 143 230 889 486
Net Banking Income 5 002 546 289 607 3 725 623 9 017 776
ACTIVITY IN MOROCCO
ASSET MANAGEMENT
SPECIALISED FINANCIAL SERVICES
OTHERS INTERNATIONAL ACTIVITIES TOTAL
Net interest Income 2 757 212 15 497 591 988 -6 771 2 884 956 6 242 882
Net Fee income 701 661 105 417 2 727 0 715 891 1 525 696
Net Banking Income 4 019 818 211 639 621 378 149 712 4 015 229 9 017 776
General Operating Expenses & allowances for depreciation and amortization -2 564 334 -208 723 -155 289 -80 480 -2 425 680 (5 434 506)
Operating Income 1 455 604 2 916 466 089 69 112 1 589 549 3 583 270
Corporate income tax -239 534 -19 326 -101 087 -8 728 -202 807 ( 571 482)
Net Earnings Group Share 285 945 43 573 114 449 26 437 452 748 923 152
(In thousand MAD)
(In thousand MAD)
(In thousand MAD)
3.1 - GENERAL INFORMATIONThe Group is composed of the following core businesses :- Activity in Morocco : BMCE Bank SA, BMCE Bank Offshore- Asset Management : BMCE Capital, BMCE Capital Bourse, BMCE Capital Gestion, Casablanca Finance Market- Specialized Financial Services : Salafin, Maghrébail, Maroc Factoring, Euler Hermes Acmar- International Activities : BMCE Paris, BMCE International (Madrid), Banque de Développement du Mali, La Congolaise de Banque,
BMCE Bank International (London), Bank Of Africa
3.2 - SEGMENT INFORMATION3.2.1 Income by Operational segment
3.2.2 Assets & Liabilities by operational segment

26
4.1 RISK MANAGEMENT SYSTEM
4.1.1 Types of Risks
4.1.1.1 Credit risk
Inherent in the banking activity, credit risk is the risk of clients default on the bank’s loans in full or in time. This might cause a financial loss for the bank. It is the most widespread type of risk and can be correlated with other risk categories.
4.1.1.2 Market risk
Market risk is he risk of loss caused by the unfavourable market factors such as exchange rates, interest rates, stock prices, mutual funds... It is also related to settlement risk, which can be described as follows:
- Pre-settlement risk : pre-settlement risk is the risk of loss due to a counterparty defaulting on a contract with the Bank during the life of a transaction. The Presettlement risk is calculated in terms of the replacement cost of such contract by another one on a mark to market basis,
- Settlement risk : settlement risk takes place at a simultaneous exchange of values with counterparty for the same value date, when the Bank is not able to verify if the settlement has actually taken place, while it has already initiated the transfer of its side.
4.1.1.3 Interest rate and liquidity risks
The interest rate risk is the vulnerability of the financial situation of an institution to unfavorable change in interest rates.
Liquidity risk is defined as the risk for the institution of not being able to honour its commitments to maturity in normal conditions.
4.1.1.4 Operational risk
Operational risk is the possibility of losses arising from inadequate or failed internal processes, people and systems or from external events.
This definition includes legal risk but excludes strategic and reputation risks.
4.1.1.5 Other Risks
Risk of Equity Investments
This risk occurs when BMCE Bank invests, holds in its portfolio, or acquires equity or quasi equity holdings in entities other than its own subsidiaries. These investments may include ordinary shares, preferred stock, derivatives, warrants, options or futures.
Country Risk
The country risk includes political risk and transfer risk.
The political risk is usually caused by an action of a country’s government, such as nationalization or expropriation, or independent events such as a war or a revolution, which affect the ability of customers to meet their obligations.
The transfer risk is the risk that a resident client cannot acquire foreign currency in his country so that he can meet his commitments abroad.
The country risk management system is based on the following axes:
• Identification of Country Risk
• Exposure Calculation and consolidation by country
• Development of internal rating and Country Profile
• Allocation of Limits by Country
• Reporting and Alerts
• Provisioning
Monitoring and supervision of the Group’s exposure to country risk are insured through monthly reporting from the subsidiaries to Risk Management Group.
This reporting covers the situation at the end of month of:
• Exposures by country, geographic area, industry, risk class, by balance sheet and off balance items ...
• Indicators of Credit Risk (NPL ratio, provisions, NPL coverage ratio ...)
4.1.2. Risk-Management Organisation
4.1.2.1. General control system
At the Group level, BMCE Bank has a General Control body that is mandated to carry out inspections and audit in different operational segments both in Morocco and abroad.
4.1.2.2. Group Risk Management
The mission of Group Risk Management is to monitor credit, market and operational risks, with an active contribution to:
• The definition of BMCE Bank’s risk policy ;
• The set up of a control system for credit, market and operational risks ;
• The definition and management of a decision-making process and monitoring of commitments.
The Group Risk Management is composed of :
• Group Risk Management Division, which is in charge of monitoring risks (credit, market and operational) for BMCE Bank Group, supported by Group entities ;
• The Credit Analysis and Management Division, which examines the lending policy for BMCE Bank clients.
4.1.3. Governance Bodies
4.1.3.1. The Audit And Internal Control Committee
The Audit and Internal Control Committee (AICC) is a governance body established within the Bank and is directly under its Board of Directors. Its mission is to ensure a third level control through the structures of the Bank. In other words, the AICC Assess the relevance and permanence of accounting policies, Controls the existence, the adequacy and implementation of internal procedures and processes for control, monitoring and surveillance of banking risks and prudential ratios Examine aggregated and consolidated accounts before submission to the Board of Directors, and keep close watch on the quality of information released to shareholders.
In this regard, the Committee permanently ensures the
RISK ExPOSURE AND HEDGING STRATEGIES

27
follow up and the achievement of the objectives and missions, defined as below :
• Verification of internal operations and procedures ;
• Assessment, control and supervision of risks ;
• Verification of the reliability of collection, processing, dissemination and conservation of accounting data ;
• Effective flow of documentation and information internally and externally ;
• Assessment of coherence and adequacy of the established control systems ;
• Assessment of the pertinence of the corrective measures proposed or implemented ;
• Ensure compliance of accounting and coherence of the internal control systems at the level of each entity with a financial vocation belonging to the Group ;
• Examination of aggregated and consolidated accounts before submittal to approval by the Board of Directors ;
• Devising of the annual report on activity, earnings and internal control submitted for examination by the Board of Directors ;
• Information at least once per year, to the Board of Directors regarding the amount of nonperforming loans, the debt collection processes, as well as the outstanding amount of restructured loans and the situation of reimbursement ;
• Keep close watch on the quality of the information released to the shareholders.
Furthermore, back in July 2007, the Board of Directors set up the CACI Group –a body instituted within the Bank, its subsidiaries, as well as entities integrated into the consolidation scope.
CACI’s tasks consist of seeing the integrity of accounts and ensure full adherence to the legal and regulatory obligations across the various structures of the Bank and all the subsidiaries/branches of the Bank, both in Morocco and abroad.
The tasks of the Group CACI (or, AICC) intertwine with those of the Bank CACI, even if they are extended to cover the entities placed within the consolidation scope. More explicitly, they include: (i) reviewing proposals for the appointment or renewal of the statutory auditors for Group entities, by analyzing their intervention programmes, checking the outcomes of their verification, their recommendations, as well as the corrective measures proposed or implemented; (ii) whenever it is necessary, asks for any internal or external audit.
4.1.3.2. Major Risks Monitoring Committee
The Major Risks Monitoring Committee is issued from the Internal Audit and Control Committee. It consists of non-executive directors (CACI members). The meetings of the committee are held on a quarterly basis. In the framework of the prerogatives devolving to it, the Committee :
• Evaluates and makes recommendations on the quality of risks;
• Ascertains that management norms and internal
procedures, as set by the competent bodies in the area of credit risks ;
• Monitors the limits of credit risks (sector-based, major risks…).
4.1.3.3. General Management Committee
The General Management Committee, which is chaired by the Director & Delegate General Manager to the Chairman, gathers together the Director & Delegate General Manager in charge of Remedial Management; Delegate General Managers, the Adviser to the General Management, and the General Controller. Associate Members include the Chairman of the Board of BMCE Capital and the other Deputy General Managers of BMCE Bank. The meetings of the Committee are held on a weekly basis.
In the framework of the prerogatives devolving to it, the Committee is in charge of :
Steering Activities :
• Steers the drawing up of the strategic plan of BMCE Bank and affiliated entities, in tandem with the decisions taken by the Group Strategic Committee and takes care of its implementation ;
• Give impetus to the main cross-cutting projects which impact on the operation and the development of the Bank;
• Translates the strategic plan into clear budgetary objectives for the Bank’s various entities;
• Validates annual budgets and follows up on the allocation and optimisation of resources made available to the entities of the Bank;
• Monitors the effective execution of the Bank’s budgetary plan and that of each of its entities. It also sees to the implementation of corrective actions in case of gaps;
• Decides on the tariff policy relating to products and services, while ensuring that the business lines remain profitable;
• Evaluates opportunities for launching new activities, products, and services and follows up on implementation;
• Arbitrates on operational questions pertaining to the various Bank’s Divisions, and internal committees for which it also sets the objectives;
• Sees to the efficiency of organisation by undertaking all the actions necessary relating to human resources, organisation, computing, logistics, and security as would contribute to the development of the Bank.
Internal Control, Audit, and Risk Management :
• Formulates orientations in terms of the Bank’s risk policy and ascertains its alignment with the Group’s risk policy;
• On the basis of the propositions made by the entity in charge of risk management, it sets and follows the limits and levels of aggregate risks for each of the Bank’s business lines;
• Ensures observance of regulatory ratios, compliance with the regulations governing risks, and the efficiency of internal control.

28
Human Resources :
• Examines the policy of Bank personnel remuneration, training, mobility, and recruitment;
• Ascertains that operational priorities are in adequacy with the recruitment and training policy;
• Follows up on the career management of the Bank’s high-flyers.
Other Prerogatives:
• Sees to it that there is a coherent commercial, corporate, and financial communication;
• Arbitrates on possible conflicts of interest and all unresolved files falling within the competency of the various Bank entities and internal committees;
• Proposes the main Bank development poles to the Group Strategic Committee.
4.1.3.4. The Credit Committee
Senior Credit Committee
It is chaired by the Chief Executive Officer of the Bank and vice-chaired by the Director & Delegate General Manager to the Chairman. Depending on the market concerned, there are two committees: one is in charge of the Enterprise market while the other is in charge of the Private/Professionals market. The committees, which gather together the Bank’s senior managers, convene twice a week.
The Regional Credit Committee
The Regional Credit Committee is held once a week. Its dates are determined by the Regional Director of each region, provided to all members and time respected.
4.1.3.5. Declassification Committee
The task of this Committee, which meets on a monthly basis, consists in dealing with anomalous accounts.
4.1.3.6. Group Market Risk Committee
The Group Market Risk Committee sees to the efficiency of the steering mechanism as it applies to risks related to BMCE Bank Group market operations and to ensure its adequacy and conformity with the established risk management policy.
In this respect, the Committee takes care of the following missions, among others:
• Following up on the evolution of exposure to market risks;
• Surveying the evolution of exposure to market risks;
• Approving new products;
• Approving limits.
4.2. CREDIT RISK
4.2.1. Decision Procedures
The procedure for granting loans at BMCE Bank is based on two approaches :
• A standardised approach for products to individuals subject to ‘‘Product Programmes’’, which define, for each product, the rules of risk management for the marketing
of the product. Indeed, risk policy relies on two pillars :
• The use of a fact sheet, which states the approval criteria, and based on which the assessment Risk is conducted. This fact sheet explains the credit terms and verifies compliance and the meeting of the loan standards. If the loan does not meet the standards set by all the acceptance risk criteria, the request must be rejected unless an exception is granted by the Committee ;
• A system of delegation which identifies the authority levels for loan granting. It ensures compliance of the decision making process and the integrity of the credit agent. Each loan application passes through all subordinated entities until its approval.
• A customised approach based on the specific needs of clients based on three principles: (i) loan portfolio management, which allows the Senior Management to have sufficient information to assess the risk profile of the customer; (ii) the delegation of approval authority to individuals (intuitu personae) on the basis of their experience, judgment, competence, education and professional training; (iii) the balance of power, the facilities being granted based on the judgment of at least three persons « Troika ».
For certain levels of risk, approval of the Senior Credit Committee or the President of the Bank must be sought. Note also that an independent control of the credit quality and compliance with procedures is provided by the General control and external auditors. Similarly, the Group’s Risks Division independently ensures the continuity of the risk management quality and respect for rules and procedures.
Implementation of the new network reorganization by Region within BMCE Bank was accompanied by a change in the delegation system to include this new dimension, through the allocation of delegations of authority to these regional structures and the establishment of a Regional Credit Committee.
4.2.2. Diversification by Counterparty
Assessed by taking the entire loans granted to a single beneficiary, the diversification of the loan portfolio remains a major concern for the Bank’s risk policy. Possible concentrations are subject to regular review, and if the need should arise, corrective measures are taken.
4.2.3. Sector-based Diversification
Sector-based diversification of the credit portfolio, likewise, receives particular attention, sustained by prospective analysis which allows for a proactive and dynamic management of the Bank’s exposures. It relies on research and studies which express an opinion on the evolution of given sectors and identify the factors which account for the risks incurred by the main actors.
4.2.4. Monitoring
Through the entity in charge of “the Group Credit Risk Management”, the Group Risk Division takes care of the following tasks at BMCE Bank Group :
• Prevention of credit risks ;• Contribution to the overall credit policy ;• On-going monitoring of credit risk.

29
As a key function in risk control process, such preventive management consists in anticipating situations where risk is likely to worsen and to bring in the appropriate adjustments. In the exercise of this function, the entity is called upon to :
• Monitor the regularity of commitments: conformity of the purpose for which the loan is sought, observance of the authorised rating, examination of default in payment, review of overdue loan repayments.
• Detect debts showing persistent weakness signs, on the basis of a certain number of flashing warning signals ;
• Together with the branch network, follow up on the evolution of the main risks (non performing loans, the most important commitments/ or the most sensitive ones) ;
• Determine files that are eligible for downgrading, in view of the regulations in force governing non performing loans.
4.2.5. Non Performing Loans
With a view to identify non performing loans which are eligible for provisioning in compliance with the regulation in force, an exhaustive review of the Bank’s portfolio is undertaken on a monthly basis, with the help of a statement of risk-prone accounts, designed by means of reference to the criteria governing the classification of non performing loans instituted by Circular no. 19 issued by the Central Bank, as well as other additional security criteria adopted by the Bank.
It should be noted that the additional risk management indicators have been set up in order to spot forerunning signs of a worsening risk.
4.2.6. Remedial Management : Debt collection
Recovery
In order to improve the efficiency of the recovery of failed debts, a revamped out-of-court recovery system was set up within the Bank. The system consists of two entities –one dedicated to the activities of the corporate network, while the other is devoted to the Private/Professional network.
The entities are tasked with the following :
• Permanently oversee the regularity and the quality of the entire Bank’s commitments ;
• Follow-up on the settlement of any insufficiency, either through the network, or directly with the customers concerned;
• Adopt a proactive approach designed to prevent any degradation of the outstanding debts.
Internal Ratings
Under the Basel Agreements, BMCE Bank Group has opted for the IRBF Approach for credit risk (excluding retail).
Regarding the internal rating project excluding Retail, the deployment of internal rating tool FACT was widespread. Training has been provided to all members in the commercial network. Thus, the operational anchor of the internal ratings in the various processes of granting credit is effective.
The draft Scoring for Retail customer segment, initiated in 2012, continues with effective implementation expected in 2013.
These projects fall within the scope of BMCE Bank Group (including local subsidiaries) have the following objectives:
- Prepare the implementation of the Basel II advanced approaches through the establishment, in advance, of internal rating models for the calculation of weighted risked assets under the Basel regulatory.
- Operationally reinforce the internal rating and the Retail scoring in the bank’s and its subsidiaries business process (eg: use of the rating system for delegation, pricing, sales targeting and marketing) hence facilitating the credit grant decision-making.
Rating Definition Category
1Extremely stable in the short and medium terms; very stable in the long term ; solvent or creditworthy even in serious financial distress
Low
ris
k
Inve
stm
ent
grad
e
2Very stable in the short and medium terms; stable in the long term; sufficient solvency even in persistent negative events
3
Solvent in the short and medium terms; even after serious hardship or difficulties ; slightly negative events might be absorbed in the long term
4
Very stable in the short term; no material ad-verse effect expected within the year; sufficient financial strength to survive in the medium term ; uncertain long term creditworthiness
5
Stable in the short term ; no material adverse effect expected within the year ; only slightly negative events could be absorbed in the me-dium term
Mod
erat
e ri
sk
6 Limited capacity to absorb unexpected nega-tive events
7 Very limited capacity to absorb unexpected negative events
8
Weak creditworthiness (principal and inte-rests). Any change in the economic and com-mercial conditions would make timely reim-bursement difficult
Hig
h r
isk
Sub-
inve
stm
ent
grad
e
9
Inability to serve debt (principal and interests) in due time. Creditworthiness is linked to posi-tive evolution of economic and commercial conditions
10Very high default risk, inability to serve debt (principal and interests) in due time. Default payment on part of principal and interests
Very
hig
h
risk
11 Default payment on principal and interests
Décembre 2012
1
3,5
9%
2
18
,24
%
3
10
,23
%
4
10
,03
%
5
11
,02
%
6
9,3
3%
7
27
,18
%
8
4,2
6%
9
0,4
7%
10
1,1
2%
11
3,4
1%
Pas
de n
otat
ion
1,1
2%
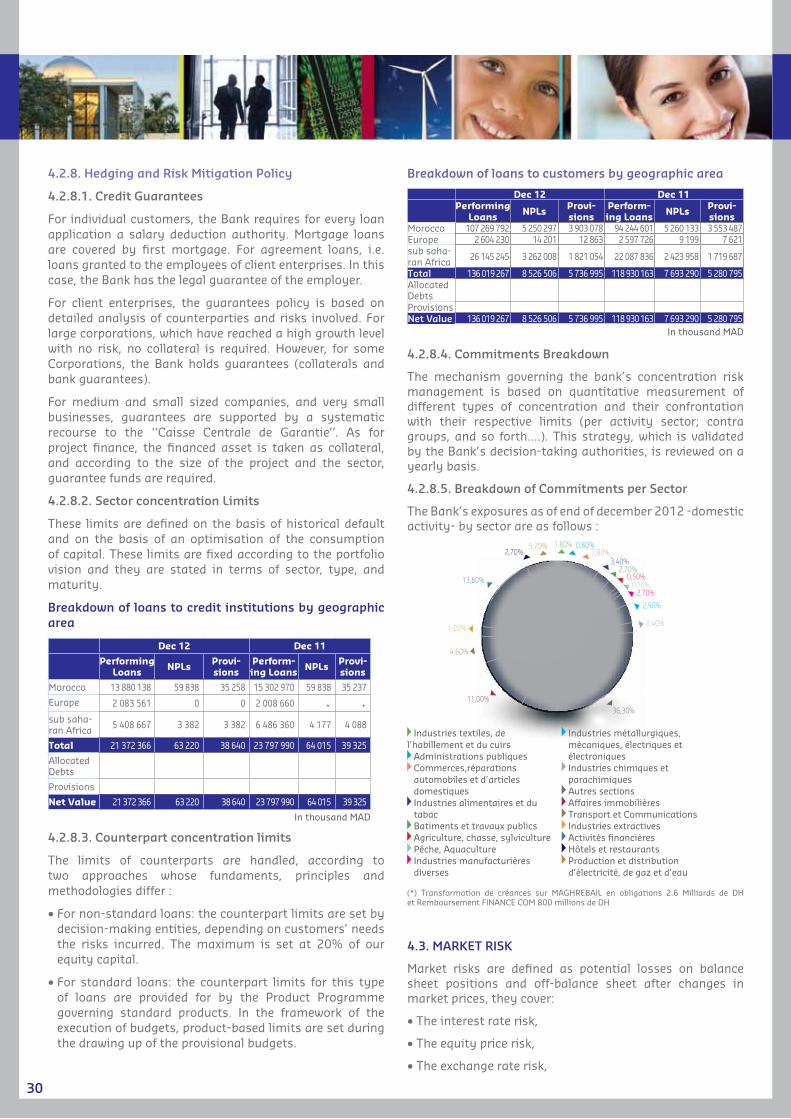
30
4.2.8. Hedging and Risk Mitigation Policy
4.2.8.1. Credit Guarantees
For individual customers, the Bank requires for every loan application a salary deduction authority. Mortgage loans are covered by first mortgage. For agreement loans, i.e. loans granted to the employees of client enterprises. In this case, the Bank has the legal guarantee of the employer.
For client enterprises, the guarantees policy is based on detailed analysis of counterparties and risks involved. For large corporations, which have reached a high growth level with no risk, no collateral is required. However, for some Corporations, the Bank holds guarantees (collaterals and bank guarantees).
For medium and small sized companies, and very small businesses, guarantees are supported by a systematic recourse to the ‘‘Caisse Centrale de Garantie’’. As for project finance, the financed asset is taken as collateral, and according to the size of the project and the sector, guarantee funds are required.
4.2.8.2. Sector concentration Limits
These limits are defined on the basis of historical default and on the basis of an optimisation of the consumption of capital. These limits are fixed according to the portfolio vision and they are stated in terms of sector, type, and maturity.
Breakdown of loans to credit institutions by geographic area
Dec 12 Dec 11
Performing Loans NPLs Provi-
sionsPerform-ing Loans NPLs Provi-
sions
Morocco 13 880 138 59 838 35 258 15 302 970 59 838 35 237
Europe 2 083 561 0 0 2 008 660 0 0sub saha-ran Africa 5 408 667 3 382 3 382 6 486 360 4 177 4 088
Total 21 372 366 63 220 38 640 23 797 990 64 015 39 325
Allocated Debts
Provisions
Net Value 21 372 366 63 220 38 640 23 797 990 64 015 39 325
In thousand MAD
4.2.8.3. Counterpart concentration limits
The limits of counterparts are handled, according to two approaches whose fundaments, principles and methodologies differ :
• For non-standard loans: the counterpart limits are set by decision-making entities, depending on customers’ needs the risks incurred. The maximum is set at 20% of our equity capital.
• For standard loans: the counterpart limits for this type of loans are provided for by the Product Programme governing standard products. In the framework of the execution of budgets, product-based limits are set during the drawing up of the provisional budgets.
Breakdown of loans to customers by geographic area
Dec 12 Dec 11Performing
Loans NPLs Provi-sions
Perform-ing Loans NPLs Provi-
sionsMorocco 107 269 792 5 250 297 3 903 078 94 244 601 5 260 133 3 553 487Europe 2 604 230 14 201 12 863 2 597 726 9 199 7 621sub saha-ran Africa 26 145 245 3 262 008 1 821 054 22 087 836 2 423 958 1 719 687
Total 136 019 267 8 526 506 5 736 995 118 930 163 7 693 290 5 280 795Allocated DebtsProvisionsNet Value 136 019 267 8 526 506 5 736 995 118 930 163 7 693 290 5 280 795
In thousand MAD
4.2.8.4. Commitments Breakdown
The mechanism governing the bank’s concentration risk management is based on quantitative measurement of different types of concentration and their confrontation with their respective limits (per activity sector; contra groups, and so forth….). This strategy, which is validated by the Bank’s decision-taking authorities, is reviewed on a yearly basis.
4.2.8.5. Breakdown of Commitments per Sector
The Bank’s exposures as of end of december 2012 -domestic activity- by sector are as follows :
36,30%11,00%
4,60%
1,20%
13,60%
2,70%5,70% 1,80% 0,60%
7,80%3,40%
2,70%0,50%0,10%2,70%
2,90%
2,40%
Industries textiles, de l’habillement et du cuirs Administrations publiques Commerces,réparations automobiles et d’articles domestiques
Industries alimentaires et du tabac Batiments et travaux publics Agriculture, chasse, sylviculture Pêche, Aquaculture Industries manufacturières diverses
Industries métallurgiques, mécaniques, électriques et électroniques Industries chimiques et parachimiques Autres sections Affaires immobilières Transport et Communications Industries extractives Activités financières Hôtels et restaurants Production et distribution d’électricité, de gaz et d’eau
(*) Transformation de créances sur MAGHREBAIL en obligations 2.6 Milliards de DH et Remboursement FINANCE COM 800 millions de DH
4.3. MARKET RISK
Market risks are defined as potential losses on balance sheet positions and off-balance sheet after changes in market prices, they cover:
• The interest rate risk,
• The equity price risk,
• The exchange rate risk,

31
• The commodity risk
And two types of credit risk on market transactions:
• Counterparty risk,
• Settlement risk
Foreign Exchange Instruments
Cash instruments Spot Foreign ExchangeForward Foreign ExchangeForeign exchange Derivatives Foreign exchange Swaps
Equity Instruments Equity sharesDerivatives on equity or and IndicesMutual funds on equities
Fixed income Instru-ments
I- Corporate and Interbank loans and borrowingFixed rate (in MAD and Foreign Currency) Floating Rate (in MAD and Foreign Currency)II- Negotiable Debt Securities and bonds II-1 Sovereign Debt (Including bonds issued by the Kingdom of Morocco)Fixed rate (in MAD) Floating Rate (in MAD and Foreign Currency) II-2 Securities issued by Credit institutions and CompaniesFixed rate (in MAD and Foreign Currency) Floating Rate (in MAD and Foreign Currency)III- Loans / borrowing of SecuritiesLoans / borrowing of securitiesRepo / Reverse repoIV- Rate DerivativesRate SwapsRate FuturesForward Rate AgreementV- Fixed income mutual fundsMoney market mutual fundsDebt mutual funds
Commodity Products Commodity futures Commodity futures optionsCredit Default Swap (CDS) Credit Linked Note (CLN)
On a consolidated basis
Capital Requirements Amounts
Capital Requirement for raw material prices Risk 5 289
Capital Requirement for Interest Rate Risks 877 229
Capital Requirement for change Risks on Property Investment 70 348
Capital Requirement for Foreign Exchange Risks 39 154
Capital Requirement for market Risks 992 021
Total Risk Weighted Assets on Market Risk 12 400 259
4.3.1 Market risk management process
Governance:
Main players of the market risk management system within BMCE Bank Group are :
• General Management, which sets up market risk management policies and strategies approved by the Board of Directors,
• The Group Risk Committee, which ensures efficiency of the policy of market operations risk management within the BMCE Bank Group and its consistency with the Group’s risk management policy.
• The Group’s market risk department centralizes the whole Group market risk management. BMCE Bank, as an independent function of Front Offices of the Group’s different
entities, enjoys maximum objectivity in the management of market risk.
• Risk Management Units of BMCE Bank Group, which ensure market activities’ control within their entity, report to Group Risk Management.
• Internal Audit ensures the implementation of the market risk management system and the respect of procedures in force.
4.3.2. Description of the market risk management system
BMCE Bank’s market risk management system is based on :
• Limits ;
• Risk Indicators ;
• Capital Requirement ;
Limits
Counterparty limits on market transactions
The process of granting counterparty limits and excess in exposure limits on market transactions is governed within BMCE Bank Group via a system of delegation of powers framed by different procedures depending on the type of counterparty.
Market limits
Taken to control the market risks within the Group BMCE and diversification of trading, a set of market limits was introduced, and is available as follows:
Sop / Loss limits by business line over different time horizons;
• Exposure limits by activity ;
• Exposure limits by duration for the Dirham denominated interest rate ;
• Exposure limits by currency and time for the currency cash Fx ;
• Greeks limits for derivatives ;
• Exposure limits by currency for the FX activity ;
• Transaction limits
Regulatory limits
Apart from monitoring the limits put in place internally, BMCE Bank Group ensures compliance with regulatory limits set by Bank Al-Maghrib as :
• The minimum capital regulatory adequacy ratio of 8% ;
• The exposure limit on the foreign currency should not exceed 10% on Capital ;
• The limit on the aggregate foreign exchange which does not exceed 20% of Capital.
4.3.2.2. Risk indicators
Different risk indicators reflecting the level of exposure to market risk are used within the BMCE Bank Group and are as follows:
• Overall Value at Risk (VaR) and by type of asset

32
Value-at-Risk is a probabilistic global measure of the market risk. It summarizes the risk through the calculation of any potential loss on a time horizon and a given degree of probability. Unlike traditional indicators of risk, value at risk combines various risk factors and measures their interaction, thus taking into account the diversification of portfolios.
• Stress Testing by Risk Factor
A set of stress tests are conducted daily for each activity of trading. These stress tests are based on hypothetical scenarios set up, and reflect the exposure of the trading group’s losses in case of moderate fluctuations, averages and extremes of market risk factors.
Thus, hypothetical scenarios are based on the following stress components:
- Change in interest rates ;- Translation of the yield curve ;- Change in exchange rates ;- Change in the basket ;- Movement of currency volatility ;- Change in the price of the underlying asset ;
• Overall Sensitivity and portfolio duration or by activity for the intereset rate exposure.
• The sensitivities of type delta, gamma, vega, theta, rho for derivative exposure.
4.3.2.3. Capital Requirements
The regulatory capital requirements under the Market Risk of BMCE Bank Group can appropriately assess the exposure of the Group to various market risks.
4.4. OperatiOnal risk
Operational risk can be defined as the risk of loss or incident resulting from insufficient or unsuccessful internal processes, people and systems, or from external events
4.4.1. Operational risk Management policy
4.4.1.1 Objective of Operational Risk Management
The Operational Risk Management system seeks to achieve the following objectives :
• Assess and prevent operational risks ;
• Evaluate the control process ;
• Undertake corrective actions in the face of major risks.
4.4.1.2 Classification
Operational risks or loss may be analysed and categorised according to two principles, which need to be distinguished:
causes and consequences, in terms of impact (financial or other). They are then categorised per Basel Event type.
4.4.1.3 Links with credit and market risks
Operational risk management is potentially linked to the management of credit and market risks. The link is two-fold :
• At the global level, reflection on the global level of aversion to risks incurred by the Bank (and eventually the allocation
of capital) calls for “trans-risk” analysis and follow up
• More specifically, certain operational risks may be linked directly to the management of market and credit risks.
4.4.2. Organisation of Operational risk Management
The framework for the operational risk management at BMCE Bank Group is structured around three guiding principles :
• Set a target system in line with the Group’s organisation and the best practices ;
• Entrust the different Group’s business units and subsidiaries with the daily management of operational risk ;
• Ensure the separation of the functions ‘‘Audit/Control’’ and operational risk management.
The operational risks management at the Bank implies 4 major entities :
• Operational Risk Management Department ;
• BMCE Bank branch network ;
• Functional entities of BMCE Bank ;
• Subsidiaries.
Operational risks interlocutors have been appointed at the level of the aforementioned entities, namely :
• Operational Risk Correspondents (or, CRO) ;
• Operational Risk Coordinators (or, CORO) ;
• Operational Risk Relays (RRO).
The scope of operational risk management also concerns the various group subsidiaries :
4.4.3. Governance of Operational risk Management
The governance of operational risk within the BMCE is divided into three Operational Risk Committees
• The Group Operational Risk Committee ;
• The Business-line-based Operational Risk Follow-up Committee ;
• The Subsidiary Operational Risk Committee.
The task of these committees consists in the periodic review of the following :
• Evolution of exposure to operational risks and the control environment of these risks ;
• Identification of the main risk areas, in terms of activities and type of risk ;
• Definition of preventive and corrective actions to take in order to curb risk levels ;
• The amount of equity capital allocated to operational risks, the cost of preventive actions to take, and the cost of insurance to take out.
Fundamental Principles
The major strategic objective of the operational risk management system at BMCE Bank is twofold :

33
• Reduce the exposure to operational risks ;
• Optimize capital requirements for operational risks.
The internal system for measuring operational risk is closely related to the daily management of risk through :
• Collection of events ;
• Risk mapping ;
• Key risk indicators
Exposure to operational risks and incurred losses are regularly reported to the entity concerned, general management, and to the Board. The management system is properly documented, to ensure compliance with a set of formalised controls, procedures and corrective measures for non-compliance.
Internal and/or external auditors are called to periodically review the management process and systems for measuring operational risk. These reviews concern the activities of the units and the independent function of the operational risk management.
The management of BMCE Bank Group operational risks has been fully automated through the use of a dedicated tool, namely MEGA GRC. Accordingly, the gathering of data pertaining to risk events, the mapping of operational risks, as well as the key risk indicators are today handled by this tool which has been deployed at the level of the bank as well as its Morocco and Europe-based subsidiaries.
Containment and Mitigation of Operational Risks
Several types of attitudes may be considered in the management of operational risks :
• Enhancing controls ;
• Covering risks, by taking out insurance ;
• Avoiding risks, notably by the re-deployment of activities ;
• Elaborating business continuity plans.
BMCE Bank Group has a secure and very strong control system apt to considerably reduce operational risks.Nevertheless, as far as the management of operational risk via a dedicated apparatus is concerned, it reserves itself all the latitude necessary to identify on a case-per-case basis optimal behavior to adopt, depending on the different risk types which are made explicit beforehand.
Furthermore, the Group has insurance policies designed to mitigate risks attendant to damage to premises, fraud, theft of valuables, and third party liability …
4.4.4. Business Continuity Plan
Driven by a regulatory trend, the Business Continuity Plan responds to the growing importance granted to the minimisation of the effects of interruption of activities, owing to the interdependence links between them and to the resources they rely on (being human, computing, or logistical). Based on sundry crisis scenarios –including situations of extreme shock—the plan consists of a set of measures and procedures aimed to keep up (albeit in a temporary and eroded fashion, if the need should arise) the provision of essential services and thereafter to ensure
planned resumption of business activities.
The cross-cutting strategic principles underlying the business continuity are as follows :
• BMCE Bank has social responsibility vis-à-vis its clientele. This means that the latter should be able to avail itself of the liquidity it has entrusted with the Bank. Non compliance with this obligation in times of crisis may well have an impact on public law and order. This principle prevails above all the other principles ;
• BMCE Bank must guarantee its commitments through the interbank compensation system on the Moroccan market ;
• BMCE Bank, as a matter of priority, intends to abide by the legal and contract commitments (as they relate to the credit and commitments area) which it has already underwritten, before making any other commitments ;
• BMCE Bank intends to uphold its international credibility and guarantee its commitments vis-à-vis foreign correspondents.
• BMCE Bank customers are given priority over other beneficiaries to benefit from the Bank’s services.
• The latter are taken into account in front-to-back operations –in other words, from the branch office to the accounting service.
The year 2009 saw the deployment of the business continuity plan. Several simulations to test the reliability and performance of this plan have been carried out in several regions across the Kingdom
4.5. STRESS TESTING:
The Stress Testing analyzes different scenarios due to extreme portfolio shocks and aims to:
• Strengthen risk measurement tools to predict and anticipate potential credit risk;
• A better allocation of capital, taking into account the continuous increase of the credit portfolio.
BMCE BANK Group includes stress testing as a fundamental component of its risk management policy, as such, exercise stress tests are regularly carried in excess of the new interim reporting established by the regulator during fiscal 2012.
4.6. DESCRIPTION OF THE COUNTRY RISK:
Country risk is the possibility that a given sovereign counterparty is unable or refuses country, and the other counterparts of this country will not be able to fulfill their obligations abroad for reasons of socio-political, economic or financial. Country risk can also result from limiting the free movement of capital or from other political or economic factors, this is called risk transfer. It may also result from other risks in connection with the occurrence of events affecting the value of liabilities on the country (natural disasters, external shocks).

34
The risk management
frameworkAllocation
and monitoring
of limits
Internal country ratings
Stress Testing
Entering into a relationship
and identification of exposures by country
Individual and
consolidated reporting
Alerts and provisioning
4.6.1. Description of the Country risk Management
4.6.1.1. Country rating system
BMCE Bank has developed an internal country rating which is based on the combination of information gathered from various reports from the country authorities, international organizations (World Bank, IMF ...) and international rating agencies (Coface S & P ...). The internal rating can have its own appreciation over the group risks in each country, taking into account the most relevant criteria.
4.6.1.2. Country Allocation Limits
The commitments limits are established by country considering the following:
• Assessing country risk incurred in the light of the internal rating of the country as described above;
• Allocation and portfolio diversification for each subsidiary and for the group respecting a maximum concentration by country based on a percentage of regulatory capital.
4.6.1.3. Country Risk Monitoring system
4.6.1.3.1. Identification of country exposures
The breakdown of categories of transactions by business lines are as follows:
• Credit transactions on foreign counterparties;
• Operations in foreign securities;
• Market transactions inducing risks on foreign counterparties;
• Foreign trade operations and various guarantees.
4.6.1.3.2. Reporting of exposures by country
Tracking and monitoring of BMCE Bank Group exposures on foreign counterparties are provided through a monthly rise in the form of reporting, from 36 branches to the Risk Management Group.
These reporting stand the situation at the end of the month:
Exposures by country, geographic area, industry, risk class, type of line in the balance sheet and the off balance sheet ...
Indicators of Credit Risk (NPL ratio, provisions, coverage ratio ...)
The Risk Management Group calculates exposure to country risk as well as the consolidation of the Group’s exposures in order to identify the areas and countries with high exposure.
4.7. ASSET LIABILITIY MANAGEMENT
In order to maintain a balance sheet at equilibrium, in a context of a strong growth in assets, the management of liquidity and interest rate risks system should :
• Ensure the stability of earnings against the change in interest rates, with a sustained net interest income and optimised economic value of equity ;
• Manage an adequate level of liquidity, allowing the bank to meet its obligations at any time, away of any potential crisis ;
• Ensure that the risk inherent in foreign exchange does reduce the margin of the bank ;
• Adjust the bank’s strategy so as to fully capture the growth opportunities offered by the macroeconomic environment.
- Formulates the ALM policy
- Organize and facilitate the ALM subcommittees
- Have a thorough knowledge of the types of risks inherent in the Bank’s activities and stay informed of the evolution of these risks based on the trend of financial markets, of risk management practices, and activity of the Bank;
- Review and approve procedures to limit risks inherent in the Bank’s credit activity, investment, trading and other activities and significant products;
- Master the reporting systems that measure and daily control the main sources of risk;
- Periodically review and approve risk limits accordance with any changes in the institution’s strategy, approve new products and respond to significant changes in market conditions;
- Ensure that the various lines of business are properly managed by HR with a level of knowledge, experience and expertise consistent with the nature of supervised activities.
4.7.1. Liquidity Risk
The bank’s strategy in terms of liquidity risk management aims at adjusting the structure of its resources in phase with the development of its business activity.
Liquidity risk is defined as the inability of the Bank to meet its obligations when unexpected needs occur and that the bank’s liquid assets cannot cover them.
Such an event might be induced by other causes than liquidity, such as default of counterparts, or adverse changes in the market, resulting in potential losses.
An adequate level of liquidity is a level that allows the Bank to finance the growth of its assets and meet its obligations once they are due, putting it away from any potential crisis.
Two major factors may generate a liquidity risk :
• The inability of the establishment to raise the necessary funds to face unexpected situations over the short term, notably in case of massive withdrawal of deposited assets

35
and maximal drawing of off-balance-sheet commitments.
• Non backing of assets and liabilities or the financing of medium and long term assets by means of short-term liabilities
A liquidity level is deemed acceptable when it enables the Bank to finance the evolution of its assets and to meet its commitments as soon as they are due for payment, thereby shielding the Bank against any possible crisis.
In this respect, two indicators serve to assess the Bank’s liquidity profile :
• Liquidity ratio, as defined by the central bank ;
• Cumulative static gaps for a 12 months period.
Periodic or cumulative gaps in local or foreign currency measure the bank’s risk of liquidity in the short, medium and long terms. This allows estimating the net refinancing needs on different buckets and determining the appropriate coverage.
4.7.2. Interest Rate Risk
Interest rate risk is the risk of reducing the margins of the Bank due to changes in interest rates. The latter also impacts the discounted value of expected future cash flows.
The degree of the impact on the economic value of assets and liabilities depends on how sensitive the balance sheet items are to the change in interest rates.
The interest rate risk can be assessed through stress testing, based on an interest rate shock of 200 basis points, as recommended by Basel Committee.
The Bank’s strategy in terms of interest rate risk management aims at stabilizing earnings against any change in interest rates, with a sustained net interest income and optimised economic value of equity.
Changes in interest rates can have negative impact on the Bank’s net interest income, and thus cause serious deviation from initial forecasts.
To counter these discrepancies, the ALM department regularly matches uses with resources of the same nature, and defines the tolerance level for a maximum deviation in net interest income from the forecasted net banking income.
Periodic or cumulative gaps in local or foreign currency measure the bank’s risk of liquidity in the short, medium and long terms. This allows estimating the net refinancing needs on different buckets and determining the appropriate coverage.
4.7.3. Sensitivity of the value of banking book
Interest Rate Stress Testing and Sensitivity Analysis
ALM department performs stress testing simulations in order to measure the impact of a change in interest rates on net interest income and the economic value of equity.
An interest rate shock of 200 basis points on the Net Banking Income is estimated at MAD+122 million in 2012. Likewise, an interest rate shock of 200 basis points would have an impact of MAD 108 million on the economic value of equity or 0,78% of the regulatory capital.
Stress Testing applied to Liquidity
In order to assess the Bank’s liquidity in a crisis situation, ALM department performs stress testing in case of a pressure on resources (massive withdrawal of deposits). These scenarios allow an assessment of the bank’s capacity to meet its obligations in situations of liquidity crisis.
Three Scenarios are defined :
• Scenario 1 : this scenario takes into account a pressure on demand deposits for 3 months, while maintaining the credit activity. The liquidity behaviour is studied thanks to liquidity gaps on the first three months. This stress test assumes the withdrawal of 30% of time deposits (10% per month) ;
• Scenario 2 : this scenario takes into account a pressure on demand deposits for 10 days, while maintaining the credit activity. The objective of this scenario is to test the capacity of the Bank to meet its obligations, following the withdrawal of volatile time deposits, on a very short period (10 days) ;
• Scenario 3 : This is the worst case scenario, with a maximum pressure on deposits in a major crisis situation, where the bank looses the totality of demand deposits in 10 days.
In 2012, the 12-month-span liquidity gap shows a liquidity surplus of 7 billion MAD compared with +9.9 billion MAD to the end of December 2010. Furthermore, the liquidity ratio (1 month liquid assets to 1 month liabilities) stands at 105.6%.
4.8. CAPITAL COMPONENTS AND CAPITAL ADEQUACY
The Main Characteristics of the components of Capital
Share Capital
BMCE Bank has a capital of MAD 1,794,633 900, consisting of 179,463,390 ordinary shares with a nominal value of 10 MAD, fully paid. Each action usually gives a right to vote.
Subordinated debts
Total subordinated debt added up to about 4.3 billion MAD in 2011.
4.8.1. Evaluation of the Capital Adequacy
BMCE BANK Group has opted for the standard approach, as presented in the circulars issued by Bank Al-Maghrib (BAM), (or, the Central Bank of Morocco). The circulars in question are :
• Circular no. 26/G/2006 relative to regulatory requirements in equity capital for credit institutions and similar entities ;
• Circular no. B3/G/2006 relative to the methods of calculating credit risk weighted assets ;
• Circular no. 25/G/2006 relative to the minimum requirement of capital adequacy ratio for credit institutions and similar entities;
• Circular no. 24/G/2006 relative to capital.
These circulars cover all the risks taken by the Bank. In fact, the methods of calculating market risks are governed by these selfsame circulars, according to the standard approach.
Regulatory capital requirements for credit risks are applied on an individual basis for each entity in the Group and on a

36
consolidated basis at the level of BMCE Bank Group.
NB: In 2009, BMCE Bank Group launched an internal rating project for the purpose of preparing for advanced methods
4.8.2. Capital Components
Pursuant to the standardised approach, BMCE Bank Group capital is calculated in conformity with Circular no. 26/G/2006 relative to regulatory capital requirements for credit institutions and similar entities and to Circular no. 24/G/2006 relative to capital.
Capital Requirements by Type of Risks on a Consolidated Base
2012
Credit Risk 136 566
Market Risk 12 400
Operational Risk 14 664
Total of Weighted Risks 163 631
Tier I 15 838
Tier I Ratio 9,68%
Net Equity 21 287
Capital Adequacy 13,14%

37
2012 2011
Trading book
Assets desig-nated at fair
value through profit or loss
Total Trading book
Assets desig-nated at fair
value through profit or loss
Total
FINANCIAL ASSETS AT FAIR VALUE THROUGH PROFIT OR LOSSNegotiable certificates of deposits 12 855 398 0 12 855 398 7 493 340 0 7 493 340Treasury bills and other eligible for central bank refinancing 5 751 852 5 751 852 6 979 579 6 979 579
Other negotiable certificates of deposits 7 103 546 7 103 546 513 761 513 761Bonds 399 217 0 399 217 433 914 0 433 914Government bonds 0 0Other bonds 399 217 399 217 433 914 433 914Equities and other variable income securities 20 970 684 0 20 970 684 23 763 897 0 23 763 897Repurchase agreements 0 0 0 0 0 0Loans 0 0 0 0 0 0To credit institutionsTo corporate customersTo private individual customersTrading Book Derivatives 19 378 0 19 378 41 165 0 41 165Currency derivatives 18 801 18 801 40 588 40 588Interest rate derivatives 577 577 577 577Equity derivativesCredit derivativesOther derivativesTOTAL FINANCIAL ASSETS AT FAIR VALUE THROUGH PROFIT OR LOSS 34 244 677 0 34 244 677 31 732 316 0 31 732 316
Of which loaned securitiesExcluding equities and other variable-income securitiesFINANCIAL LIABILITIES AT FAIR VALUE THROUGH PROFIT OR LOSSBorrowed securities and short sellingRepurchase agreementsBorrowings 0 0 0 0 0 0Credit institutionsCorporate customersDebt securitiesTrading Book Derivatives 1 614 0 1 614 1 752 0 1 752Currency derivatives 1 614 1 614 1 752 1 752Interest rate derivatives 0 0Equity derivatives 0 0Credit derivativesOther derivativesTOTAL FINANCIAL LIABILITIES AT FAIR VALUE THROUGH PROFIT OR LOSS 1 614 0 1 614 1 752 0 1 752
2012 2011
Market Price
Model with observable parameters
Model with non
observable parameters
TOTAL Market Price
Model with observable parameters
Model with non
observable parameters
TOTAL
FINANCIAL ASSETS
Financial assets held for trading purposes at fair value through profit or loss 34 244 677 34 244 677 31 732 316 31 732 316
Financial assets at fair value through profit or loss under the fair value option
FINANCIAL LIABILITIES
Financial liabilities held for trading pur-poses at fair value through profit or loss 1 614 1 614 1 752 1 752
Financial liabilities at fair value through profit or loss under the fair value option
(In thousand MAD)
(In thousand MAD)
5 - BALANCE SHEET NOTES AS OF DECEMBER 31, 2012
5.1. FINANCIAL ASSETS, FINANCIAL LIABILITIES, AND DERIVATIVES AT FAIR VALUE THROUGH PROFIT OR LOSS
BREAKDOWN OF FINANCIAL INSTRUMENTS BY TYPE OF FAIR PRICE MEASUREMENT

38
5.2 - AVAILABLE FOR SALE ASSETS
5.3 - INTERBANKING TRANSACTIONS, CREDIT INSTITUTIONS, LOANS AND RECEIVABLES
Loans and receivables due from credit institutions
Loans due to credit institutions
2012 2011
Negotiable certificates of deposit 0 0
Treasury bills and other bills eligible for central bank refinancing
Other negotiable certificates of deposit
Bonds 0 0
Government bonds
Other bonds
Equities and other variable-income securities 3 135 119 2 628 596
Of which listed securities 240 129 435 416
Of which unlisted securities 2 894 990 2 193 180
Total available-for-sale financial assets, before impairment provisions 3 135 119 2 628 596
Of which unrealized gains and losses -339 196 -298 219
Of which fixed-income securities
Of which loaned securities -339 196 -298 219
Total available-for-sale financial assets, net of impairment provisions 2 795 923 2 330 377
Of which fixed-income securities, net of impairment provisions
2012 2011
Demand accounts 6 731 875 5 911 143
Loans 13 251 828 17 945 572
Repurchase agreements 1 451 883 5 310
Total loans and receivables due from credit institutions, before impairment provisions 21 435 586 23 862 025
Provisions for impairment of loans and receivables due from credit institutions -38 640 -39 345
Total loans and receivables due from credit institutions, net of impairment provisions 21 396 946 23 822 680
2012 2011
Demand accounts 1 829 261 2 348 107
Borrowings 18 433 119 13 583 608
Repurchase agreements 13 965 786 8 916 894
Total Due to Credit Institutions 34 228 166 24 848 609
(In thousand MAD)
(In thousand MAD)
(In thousand MAD)
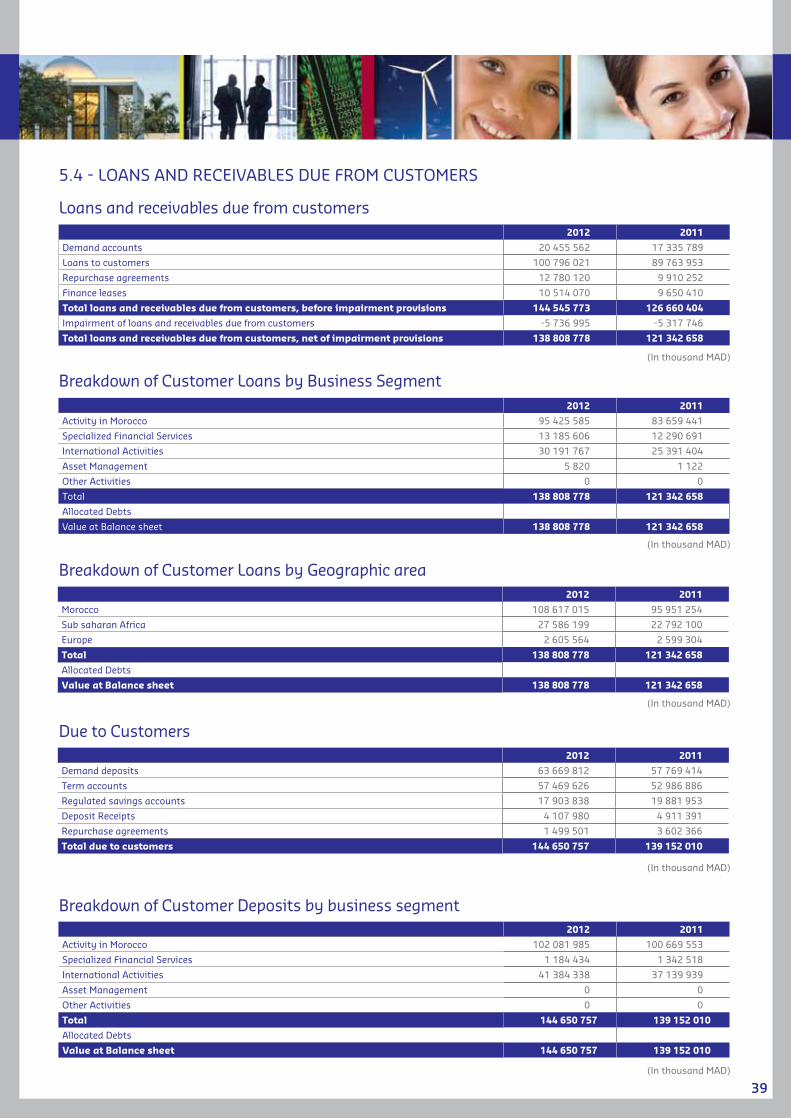
39
2012 2011
Demand accounts 20 455 562 17 335 789
Loans to customers 100 796 021 89 763 953
Repurchase agreements 12 780 120 9 910 252
Finance leases 10 514 070 9 650 410
Total loans and receivables due from customers, before impairment provisions 144 545 773 126 660 404
Impairment of loans and receivables due from customers -5 736 995 -5 317 746
Total loans and receivables due from customers, net of impairment provisions 138 808 778 121 342 658
2012 2011
Activity in Morocco 95 425 585 83 659 441
Specialized Financial Services 13 185 606 12 290 691
International Activities 30 191 767 25 391 404
Asset Management 5 820 1 122
Other Activities 0 0
Total 138 808 778 121 342 658
Allocated Debts
Value at Balance sheet 138 808 778 121 342 658
2012 2011
Morocco 108 617 015 95 951 254
Sub saharan Africa 27 586 199 22 792 100
Europe 2 605 564 2 599 304
Total 138 808 778 121 342 658
Allocated Debts
Value at Balance sheet 138 808 778 121 342 658
2012 2011
Demand deposits 63 669 812 57 769 414
Term accounts 57 469 626 52 986 886
Regulated savings accounts 17 903 838 19 881 953
Deposit Receipts 4 107 980 4 911 391
Repurchase agreements 1 499 501 3 602 366
Total due to customers 144 650 757 139 152 010
2012 2011
Activity in Morocco 102 081 985 100 669 553
Specialized Financial Services 1 184 434 1 342 518
International Activities 41 384 338 37 139 939
Asset Management 0 0
Other Activities 0 0
Total 144 650 757 139 152 010
Allocated Debts
Value at Balance sheet 144 650 757 139 152 010
(In thousand MAD)
(In thousand MAD)
(In thousand MAD)
(In thousand MAD)
(In thousand MAD)
Loans and receivables due from customers
Breakdown of Customer Loans by Geographic area
Due to Customers
Breakdown of Customer Deposits by business segment
5.4 - LOANS AND RECEIVABLES DUE FROM CUSTOMERS
Breakdown of Customer Loans by Business Segment

40
2012 2011
Current taxes 215 856 408 979
Deferred taxes 310 849 321 084
Current and deferred tax assets 526 706 730 063
Current taxes 36 296 324 592
Deferred taxes 983 149 934 127
Current and deferred tax liabilities 1 019 445 1 258 719
2012 2011
Morocco 103 266 419 102 012 071
Sub saharan Africa 40 317 675 36 114 558
Europe 1 066 663 1 025 381
Total 144 650 757 139 152 010
Allocated Debts
Value at Balance sheet 144 650 757 139 152 010
2012 2011
Other debt securities 14 014 897 12 008 860
Negotiable certificates of deposit 14 014 897 12 008 860
Bond issues
Subordinated debts 4 633 718 3 803 161
Subordinated debt 4 633 718 3 803 161
Redeemable subordinated debt 1 853 463 3 803 161
Undated subordinated debt 2 780 255
Subordinated Notes 0 860 172
Redeemable subordinated notes
Undated subordinated notes 0 860 172
Public Funds and special guarantee funds 126 616 241 048
Total 18 775 231 16 913 241
2012 2011
Negotiable certificates of deposit 9 689 814 8 756 623
Treasury bills and other bills eligible for central bank refinancing 9 669 842 8 721 040
Other negotiable certificates of deposit 19 972 35 583
Bonds 829 127 834 288
Government bonds
Other bonds 829 127 834 288
Total held-to-maturity financial assets 10 518 941 9 590 911
(In thousand MAD)
(In thousand MAD)
(In thousand MAD)
(In thousand MAD)
Breakdown of Customer Deposits by Geographic area
5.5 - DEBT SECURITIES AND SUBORDINATED DEBTS
5.7 - CURRENT AND DEFERRED TAxES
5.6 - HELD-TO-MATURITY FINANCIAL ASSETS

41
2012 2011
Guarantee deposits and bank guarantees paid 5 257 5 110
Settlement accounts related to securities transactions 23 329 24 020
Collection accounts 329 945 297 910
Reinsurers' share of technical reserves
Accrued income and prepaid expenses 381 273 356 710
Other debtors and miscellaneous assets 4 198 971 3 875 291
Total accrued income and other assets 4 938 775 4 559 041
Guarantee deposits received 42 250 60 221
Settlement accounts related to securities transactions 9 297 681 4 230 455
Collection accounts 770 861 685 798
Accrued expenses and deferred income 537 031 365 626
Other creditors and miscellaneous liabilities 2 562 304 3 628 970
Total accrued expenses and other liabilities 13 210 127 8 971 070
Total Assets Net Banking Income or Net Revenues Net income
Euler Hermes Acmar 333 421 125 337 5 996
Banque de Développement du Mali 7 665 758 414 523 38 567
Eurafric Information 203 766 4 422 -531
Hanouty 27 146 21 025 -10 940
Société Conseil Ingenierie et Développement 92 303 297 341 15 632
2012 2011
Euler Hermes Acmar 27 177 21 180
Banque de Développement du Mali 214 595 184 792
Casablanca Finance Markets 0 31 752
Eurafric Information -4 888 -3 503
Hanouty -5 544 7 165
Investments in associates 123 141 112 177
Inverstments in equity methods companies belonging to subsidiaries 52 447 45 795
Investments in equity methods companies 406 928 399 358
2012 2011
Gross Value
Accumulated depreciation amortization and impair-
ment
Carrying Amount Gross Value
Accumulated depreciation amortization and impair-
ment
Carrying Amount
PP&E 8 936 538 3 805 010 5 131 528 8 152 649 3 088 523 5 064 126
Land and buildings 2 031 429 516 758 1 514 671 2 617 698 534 135 2 083 563
Equipment, furniture and fixtures 3 551 517 1 507 439 2 044 078 2 859 747 1 290 230 1 569 517
Plant and equipment leased as lessor under operating leases 0 0 0 0 0
Other PP&E 3 353 592 1 780 813 1 572 779 2 675 204 1 264 158 1 411 046
Intangible Assets 1 592 323 840 868 751 455 1 339 715 694 634 645 081
Purchased software 1 020 384 520 987 499 397 821 009 410 414 410 595
Internally-developed software 0 0 0 0 0
Other intangible assets 571 939 319 881 252 058 518 706 284 220 234 486
Investment Property 693 382 79 222 614 160 594 302 47 203 547 099
(In thousand MAD)
(In thousand MAD)
(In thousand MAD)
(In thousand MAD)
5.9 - INVESTMENTS IN ASSOCIATES (COMPANIES CARRIED UNDER THE EQUITY METHOD)
Financial data as published by the Group’s principal associates under local generallyaccepted accounting principles are as follows:
5.8 - ACCRUED INCOME/ExPENSE AND OTHER ASSETS/LIABILITIES
5.10 - PROPERTY, PLANT AND EQUIPMENT AND INTANGIBLE ASSETS USED IN OPERATIONS

42
2012 2011Gross value at start of period 832 470 531 006Accumulated impairment at start of period
Carrying amount at start of period 832 470 531 006Acquisitions 403 987Cessions
Impairment losses recognized during the period
Translation adjustments
Subsidiaries previously accounted for by the equity method
Other movements -102 523Gross value at end of period 832 470 832 470Accumulated impairment at end of periodCarrying amount at end of period 832 470 832 470
(*) Recognition of corrections to the GoodWill previously Recognized on Hanouty.
2012 2011
Total provisions at start of period 457 440 349 988
Additions to provisions 131 271 93 783
Reversals of provisions -83 187 14 713
Effect of movements in exchange rates and other movements 16 737
Gross value at end of period 974 -1 044
Total provisions at end of period 523 235 457 440
Valeur nettecomptable 12/2012
Valeur nettecomptable 12/2011
Maghrébail 10 617 10 617
Banque de Développement du Mali 3 588 3 588
Salafin 5 174 5 174
Maroc Factoring 1 703 1 703
BMCE Capital Bourse 2 618 2 618
BMCE International (Madrid) 3 354 3 354
Bank Of Africa 207 863 207 863
Locasom 98 725 98 725
Hanouty 0 0
CID 14 555 14 555
Other 484 273 484 273
TOTAL 832 470 832 470
(In thousand MAD)
(In thousand MAD)
(In thousand MAD)
5.11 - GOODWILL
Goodwill by core business is as follows
5.12 - PROVISIONS FOR CONTINGENCIES AND CHARGES
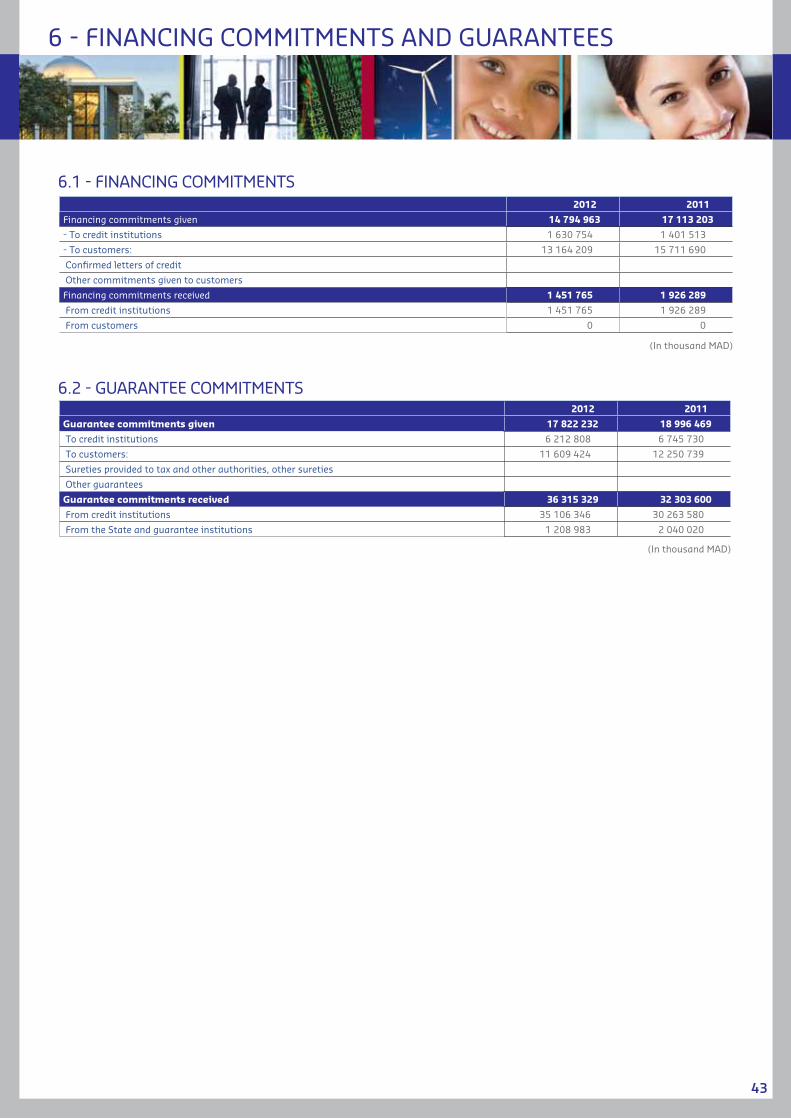
43
2012 2011
Financing commitments given 14 794 963 17 113 203
- To credit institutions 1 630 754 1 401 513
- To customers: 13 164 209 15 711 690
Confirmed letters of credit
Other commitments given to customers
Financing commitments received 1 451 765 1 926 289
From credit institutions 1 451 765 1 926 289
From customers 0 0
2012 2011
Guarantee commitments given 17 822 232 18 996 469
To credit institutions 6 212 808 6 745 730
To customers: 11 609 424 12 250 739
Sureties provided to tax and other authorities, other sureties
Other guarantees
Guarantee commitments received 36 315 329 32 303 600
From credit institutions 35 106 346 30 263 580
From the State and guarantee institutions 1 208 983 2 040 020
(In thousand MAD)
(In thousand MAD)
6.1 - FINANCING COMMITMENTS
6.2 - GUARANTEE COMMITMENTS
6 - FINANCING COMMITMENTS AND GUARANTEES

44
2012 2011
Retirement allowances and equivalents 235 228 400 230 679 497
Special seniority premiums allowances
Other
TOTAL 235 228 400 230 679 497
2012 2011
Discount rate 4,50% 4,50%
Rate of increase in salaries 3% 3%
Expected return on assets N/A N/A
Other 11% 11%
2012 2011
Normal cost 17 046 276 14 571 320
Interest cost 9 773 304 9 842 698
Expected returns of funds
Amortization of actuarial gains/ losses
Amortization of net gains/ losses - 11 352 669
Additional allowances
Other
Net cost of the period 26 819 580 35 766 687
Dont coût relatif aux indemnités de retraite et assimilées
Dont autres…
2012 2011
Actuarial liability, beginning of the period 230 679 497 219 185 849
Normal cost 17 046 276 25 923 989
Interest cost 9 773 304 9 842 698
Experience gains/ losses
Other actuarial gains/ losses
Depreciation of net gains/losses
Paid benefits -22 270 677 -24 273 039
Additional benefits
Other
Actuarial liability, end of the period 235 228 400 230 679 497
Dont coût relatif aux indemnités de retraite et assimilées
Dont autres…
7.1 DESCRIPTION OF EVALUATION METHOD
7.2 SUMMARY OF PROVISIONS AND DESCRIPTION OF ExISTING SCHEMES
7.2.1 Provisions for post-employment benefits and other long-term benefits granted to employees
7.3 COST OF POST- EMPLOYMENT PLANS
7.4 PROVISION EVOLUTION INCLUDED IN THE BALANCE SHEET
7.2.2 Assumptions
7 - SALARIES AND EMPLOYEE BENEFITS
Salary and employee benefit expenses corresponds to medal and end of career compensation. Assessment of the commitment related to these two benefits was conducted following the method of credit unit projected, as advocated by the standard IAS 19.

45
2012 2011
Share Capital (MAD) 1 794 633 900 1 719 633 900
Number of shares 179 463 390 171 963 390
Net income attributable to parent (MAD) 923 152 000 850 199 000
Earning per share (MAD) 5,1 4,9
Consolidated entities under the proportionate method
Consolidated entities under the equity method
Consolidated entities un-der the full consolidation
method
Assets
Loans, advances and securities 23 627 8 960 910
Demand accounts 14 315 3 526 878
Loans 9 312 1 892 863
Securities 3 541 169
Finance Leases
Other Assets 444 311
Total 23 627 9 405 221
Liabilities
Deposits 30 848 5 036 253
Demand accounts 30848 4 785 499
Other borrowings 250 754
Debt securities 3 508 809
Other liabilities 860 159
Total 30 848 9 405 221
Financing Commitments & Guarantee Commitments
Financing commitments given 879 154
Guarantee commitments given 879 154
(In thousand MAD)
8.1 CHANGES IN SHARE CAPITAL AND EARNINGS PER SHARE
8.2 - SCOPE OF CONSOLIDATION
8 - ADDITIONNAL INFORMATION
8.3 - RELATED PARTIES
8.3.1 - Relationship between consolidated companies of the group
Company Activity % of voting interests
% of ownership interests Method
BMCE BANK Banking Parent company
BMCE CAPITAL Investment Bank 100,00% 100,00% full consolidation
BMCE CAPITAL GESTION Asset Management 100,00% 100,00% full consolidation
BMCE CAPITAL BOURSE Financial Intermediation 100,00% 100,00% full consolidation
MAROC FACTORING Factoring 100,00% 100,00% full consolidation
MAGHREBAIL Leasing 51,00% 51,00% full consolidation
SALAFIN Consumer Loans 74,50% 74,50% full consolidation
BMCE INTERNATIONAL MADRID Banking 100,00% 100,00% full consolidation
LA CONGOLAISE DE BANQUE Banking 25,00% 25,00% full consolidation
BMCE BANK INTERNATIONAL UK Banking 100,00% 100,00% full consolidation
BANK OF AFRICA Banking 65,02% 65,02% full consolidation
LOCASOM Car Rental 100,00% 97,31% full consolidation
RM ExPERTS recovery 100,00% 100,00% full consolidation
BANQUE DE DEVELOPPEMENT DU MALI Banking 27,38% 27,38% Equity method
EULER HERMES ACMAR Insurance 20,00% 20,00% Equity method
HANOUTY Distribution 45,55% 45,55% Equity method
EURAFRIC INFORMATION Information Technology Services 41,00% 41,00% Equity method
CONSEIL INGENIERIE ET DEVELOPPEMENT Study Office 38,90% 38,90% Equity method
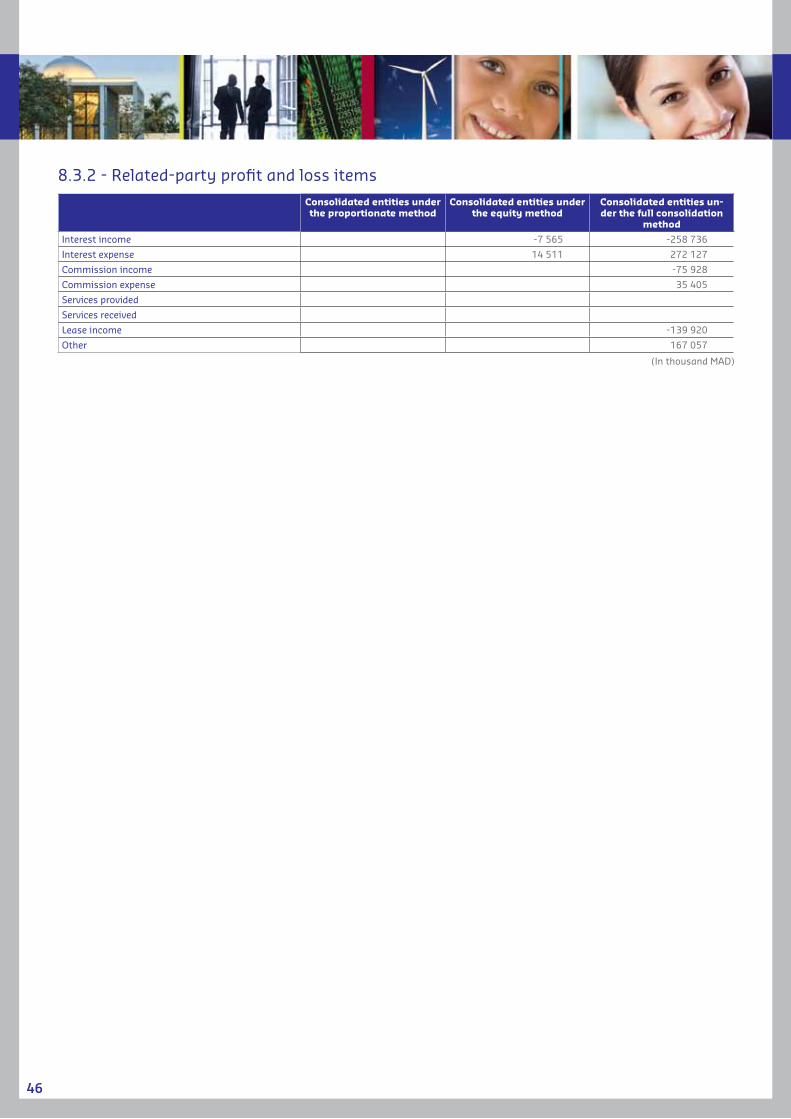
46
Consolidated entities under the proportionate method
Consolidated entities under the equity method
Consolidated entities un-der the full consolidation
method
Interest income -7 565 -258 736
Interest expense 14 511 272 127
Commission income -75 928
Commission expense 35 405
Services provided
Services received
Lease income -139 920
Other 167 057
(In thousand MAD)
8.3.2 - Related-party profit and loss items

BMCE BankCapital : 1 794 633 900 dirhamsHeadoffice : 140, avenue Hassan II, 20 000, CasablancaBP 13425 Casa PrincipaleArrêté du Ministre des Finances n° 2348-94 du 14 rabii I 1415 (23 août 1994)Trade register : casa 27.129Swift : bmce ma mcTelex : 21.931 - 24.004
GROUP GENERAL SECRETARIAT Tel. : 05 22 49 80 04Fax : 05 22 26 46 55
FINANCIAL COMMUNICATIONTel. : 05 22 49 80 03 / 05 22 46 21 97Fax : 05 22 26 49 65E-mail : [email protected]
BMCE BANK web site : www.bmcebank.maINTERNATIONAL TRADE web site : www.bmcetrade.comINVESTMENT BANK web site : www.bmcecapital.com

![Untitled-1 [] Company... · 2018. 1. 16. · Smad Construction Smad Sm Smad Construction mad Construction nstruction MAD Smad Construction MAD' Smad Construction MAD Smad Construction](https://static.fdocuments.net/doc/165x107/60b16e4aa21c90011033e8c0/untitled-1-company-2018-1-16-smad-construction-smad-sm-smad-construction.jpg)