
BMC Cancer BioMed Central - core.ac.uk · PDF filetumor stage. Pathological ... 30 um...
14
BioMed Central Page 1 of 14 (page number not for citation purposes) BMC Cancer Open Access Research article Pathway analysis of gene signatures predicting metastasis of node-negative primary breast cancer Jack X Yu 1 , Anieta M Sieuwerts 2 , Yi Zhang 1 , John WM Martens 2 , Marcel Smid 2 , Jan GM Klijn 2 , Yixin Wang 1,3 and John A Foekens* 2 Address: 1 Veridex LLC, a Johnson & Johnson Company, 3210 Merryfield Row, San Diego, CA 92121, USA, 2 Erasmus MC, Josephine Nefkens Institute, Dr. Molewaterplein 50, 3015 GE Rotterdam, The Netherlands and 3 Veridex LLC, a Johnson & Johnson Company, 33 Technology Drive, Warren, NJ 07059, USA Email: Jack X Yu - [email protected]; Anieta M Sieuwerts - [email protected]; Yi Zhang - [email protected]; John WM Martens - [email protected]; Marcel Smid - [email protected]; Jan GM Klijn - [email protected]; Yixin Wang - [email protected]; John A Foekens* - [email protected] * Corresponding author Abstract Background: Published prognostic gene signatures in breast cancer have few genes in common. Here we provide a rationale for this observation by studying the prognostic power and the underlying biological pathways of different gene signatures. Methods: Gene signatures to predict the development of metastases in estrogen receptor- positive and estrogen receptor-negative tumors were identified using 500 re-sampled training sets and mapping to Gene Ontology Biological Process to identify over-represented pathways. The Global Test program confirmed that gene expression profilings in the common pathways were associated with the metastasis of the patients. Results: The apoptotic pathway and cell division, or cell growth regulation and G-protein coupled receptor signal transduction, were most significantly associated with the metastatic capability of estrogen receptor-positive or estrogen-negative tumors, respectively. A gene signature derived of the common pathways predicted metastasis in an independent cohort. Mapping of the pathways represented by different published prognostic signatures showed that they share 53% of the identified pathways. Conclusion: We show that divergent gene sets classifying patients for the same clinical endpoint represent similar biological processes and that pathway-derived signatures can be used to predict prognosis. Furthermore, our study reveals that the underlying biology related to aggressiveness of estrogen receptor subgroups of breast cancer is quite different. Background Microarray technology has become a popular tool to clas- sify breast cancer patients into histological subtypes, sub- groups with a different prognosis, different site of relapse, and different types of response to treatment [1-9]. A major challenge for application of gene expression profiling is stability of the gene list as a signature [10]. Considering that many genes have correlated expression on a gene Published: 25 September 2007 BMC Cancer 2007, 7:182 doi:10.1186/1471-2407-7-182 Received: 3 August 2007 Accepted: 25 September 2007 This article is available from: http://www.biomedcentral.com/1471-2407/7/182 © 2007 Yu et al; licensee BioMed Central Ltd. This is an Open Access article distributed under the terms of the Creative Commons Attribution License (http://creativecommons.org/licenses/by/2.0 ), which permits unrestricted use, distribution, and reproduction in any medium, provided the original work is properly cited.
Transcript of BMC Cancer BioMed Central - core.ac.uk · PDF filetumor stage. Pathological ... 30 um...
BioMed CentralBMC Cancer
ss
Open AcceResearch articlePathway analysis of gene signatures predicting metastasis of node-negative primary breast cancerJack X Yu1, Anieta M Sieuwerts2, Yi Zhang1, John WM Martens2, Marcel Smid2, Jan GM Klijn2, Yixin Wang1,3 and John A Foekens*2Address: 1Veridex LLC, a Johnson & Johnson Company, 3210 Merryfield Row, San Diego, CA 92121, USA, 2Erasmus MC, Josephine Nefkens Institute, Dr. Molewaterplein 50, 3015 GE Rotterdam, The Netherlands and 3Veridex LLC, a Johnson & Johnson Company, 33 Technology Drive, Warren, NJ 07059, USA
Email: Jack X Yu - [email protected]; Anieta M Sieuwerts - [email protected]; Yi Zhang - [email protected]; John WM Martens - [email protected]; Marcel Smid - [email protected]; Jan GM Klijn - [email protected]; Yixin Wang - [email protected]; John A Foekens* - [email protected]
* Corresponding author
AbstractBackground: Published prognostic gene signatures in breast cancer have few genes in common.Here we provide a rationale for this observation by studying the prognostic power and theunderlying biological pathways of different gene signatures.
Methods: Gene signatures to predict the development of metastases in estrogen receptor-positive and estrogen receptor-negative tumors were identified using 500 re-sampled training setsand mapping to Gene Ontology Biological Process to identify over-represented pathways. TheGlobal Test program confirmed that gene expression profilings in the common pathways wereassociated with the metastasis of the patients.
Results: The apoptotic pathway and cell division, or cell growth regulation and G-protein coupledreceptor signal transduction, were most significantly associated with the metastatic capability ofestrogen receptor-positive or estrogen-negative tumors, respectively. A gene signature derived ofthe common pathways predicted metastasis in an independent cohort. Mapping of the pathwaysrepresented by different published prognostic signatures showed that they share 53% of theidentified pathways.
Conclusion: We show that divergent gene sets classifying patients for the same clinical endpointrepresent similar biological processes and that pathway-derived signatures can be used to predictprognosis. Furthermore, our study reveals that the underlying biology related to aggressiveness ofestrogen receptor subgroups of breast cancer is quite different.
BackgroundMicroarray technology has become a popular tool to clas-sify breast cancer patients into histological subtypes, sub-groups with a different prognosis, different site of relapse,
and different types of response to treatment [1-9]. A majorchallenge for application of gene expression profiling isstability of the gene list as a signature [10]. Consideringthat many genes have correlated expression on a gene
Published: 25 September 2007
BMC Cancer 2007, 7:182 doi:10.1186/1471-2407-7-182
Received: 3 August 2007Accepted: 25 September 2007
This article is available from: http://www.biomedcentral.com/1471-2407/7/182
© 2007 Yu et al; licensee BioMed Central Ltd. This is an Open Access article distributed under the terms of the Creative Commons Attribution License (http://creativecommons.org/licenses/by/2.0), which permits unrestricted use, distribution, and reproduction in any medium, provided the original work is properly cited.
Page 1 of 14(page number not for citation purposes)
BMC Cancer 2007, 7:182 http://www.biomedcentral.com/1471-2407/7/182
expression array, especially for genes involved in the samebiological process, it is quite possible that different genesmay be present in different signatures when differenttraining sets of patients and different statistical tools areused. Furthermore, genes are usually included in a classi-fier applying stringent statistical criteria. At these strict sig-nificance levels, there is only a small chance for anyspecific gene to be included. Reproducibility in gene sig-natures identified in different datasets is thus unlikely[11]. To our knowledge, so far prognostic gene signatureswere identified based on the performance of individualgenes, regardless of their biological functions. We andothers have previously suggested that it might be moreappropriate to interrogate the gene lists for biologicalthemes, rather than individual genes [8,12-19]. Moreover,identification of the distinct biological processes betweensubtypes of cancer patients is more relevant to understandthe mechanism of the disease development and for tar-geted drug development.
In this study we associated biological processes with thetumor's metastatic capability. We re-sampled our data setnumerous times to get multiple gene lists whose expres-sion correlated with patients' survival. Based on thesegene lists, over-represented pathways defined in GeneOntology Biological Process (GOBP) were identified forestrogen receptor (ER)-positive or ER-negative breast can-cer patients, separately. One step further, we comparedthe pathways represented by different published prognos-tic gene signatures with the over-represented pathwaysassociated with metastatic capability. This study also dem-onstrated it is feasible to construct a gene signature fromthe key pathways to predict clinical outcomes.
MethodsPatient populationThe study was approved by the Medical Ethics Committeeof the Erasmus MC Rotterdam, The Netherlands (MEC02.953), and was performed in accordance to the Code ofConduct of the Federation of Medical Scientific Societiesin the Netherlands [20]. A cohort of 344 breast tumorsamples from our tumor bank at the Erasmus MedicalCenter (Rotterdam, Netherlands) was used in this study.All these samples were from patients with lymph node-negative breast cancer who had not received any adjuvantsystemic therapy, and had more than 70% tumor content.Among them, 286 samples had been used to derive a 76-gene signature to predict distant metastasis [8]. Fifty-eightadditional ER-negative cases were included to increase thenumbers in this subgroup. According to our previousstudy [21], array-measured ER status and clinical ER statushave the best correlation when the cutoff is set at 1000,after scaling the average intensity of probe sets on anAffymetrix HG-U133A chip to 600. Using array-based ERstatus allows us to avoid the variations of the measures of
ER by either immunohistochemistry or biochemicalassays, as well as including tumors whose ER status isundetermined. Therefore, ER status for a patient wasdetermined based on the expression level of the ER geneon the chip in this study. A sample is considered ER-posi-tive if its ER expression level is higher than 1000. Other-wise, the sample is ER-negative [21]. As a result, there are221 ER-positive and 123 ER-negative patients in the 344-patient population. The mean age of the patients was 53years (median 52, range 26–83 years), 197 (57%) werepremenopausal and 147 (43%) postmenopausal. T1tumors (≤ 2 cm) were present in 168 patients (49%), T2tumors (> 2–5 cm) in 163 patients (47%), T3/4 tumors (>5 cm) in 12 patients (3%), and 1 patient had unknowntumor stage. Pathological examination was carried out byregional pathologists as described previously [22] and thehistological grade was coded as poor in 184 patients(54%), moderate in 45 patients (13%), good in 7 patients(2%), and unknown for 108 patients (31%). During fol-low-up 103 patients showed a relapse within 5 years andwere counted as failures in the analysis for DMFS. Eightytwo patients died after a previous relapse. The median fol-low-up time of patients still alive was 101 months (range61–171 months).
RNA isolation and hybridizationTotal RNA was extracted from 20–40 cryostat sections of30 um thickness with RNAzol B (Campro Scientific,Veenendaal, Netherlands). After being biotinylated, tar-gets were hybridized to Affymetrix HG-U133A chips asdescribed [8]. Gene expression signals were calculatedusing Affymetrix GeneChip analysis software MAS 5.0.Chips with an average intensity less than 40 or a back-ground higher than 100 were removed. Global scaling wasperformed to bring the average signal intensity of a chipto a target of 600 before data analysis. For the validationdataset [23], quantile normalization was performed andANOVA was used to eliminate batch effects from differentsample preparation methods, RNA extraction methods,different hybridization protocols and scanners.
Multiple gene signaturesFor ER-positive and ER-negative patients, 80 samples wererandomly selected as a training set and univariate Coxproportional-hazards regression was performed to iden-tify genes whose expression patterns were most correlatedto patients' DMFS time. Our previous analysis suggestedthat 80 patients represent a minimum size of the trainingset for producing a prognostic gene signature with stableperformance [8]. Because the majority of the publishedgene expression signatures had less than 100 genes, thetop 100 genes from the Cox regression were used as a sig-nature to predict tumor recurrence for the remainingpatients. A relapse score for a patient was used to calculatea patient's risk of distant metastasis and was defined as the
Page 2 of 14(page number not for citation purposes)
BMC Cancer 2007, 7:182 http://www.biomedcentral.com/1471-2407/7/182
linear combination of logarithmically transformed geneexpression levels weighted by the standardized Cox regres-sion coefficient as described [8]. ROC analysis with dis-tant metastasis within 5 years as a defining point wasconducted. Patients who did not have 5-year follow-upwere excluded from ROC analysis. The AUC of the ROCplots was used as a measure of the performance of a signa-ture in the test set. The above procedure was repeated 500times (Figure 1). Thus, 500 signatures of 100 genes eachwere obtained for both the ER-positive and ER-negativesubgroups. The frequency of the selected genes in the 500signatures was calculated and the genes were ranked basedon the frequency.
As a control, the patient survival data for the ER-positivepatients or ER-negative patients was permuted randomlyand re-assigned to the chip data. As described above, 80chips were then randomly selected as a training set andthe top 100 genes were selected using the Cox modelingbased on the permuted clinical information. The clinicalinformation was permuted 10 times. For each permuta-
tion of the survival data, 50 training sets of 80 patientswere created. For each training set, the top 100 genes wereobtained as a control gene list based on the Cox mode-ling. Thus, a total of 500 control signatures were obtained.The predictive performance of the 100 genes was exam-ined in the remaining patients. A ROC analysis was con-ducted and AUC was calculated in the test set.
Mapping signatures to GOBP and identification of over-represented pathwaysTo identify over-representation of biological pathways inthe signatures, genes on Affymetrix HG-U133A chip weremapped to the categories of GOBP based on the annota-tion table downloaded from [24]. Categories that con-tained at least 10 probe sets from the HG-U133A chipwere retained for subsequent pathway analysis. As a result,304 categories were used for following pathway analysis.The 100 genes of each signature were mapped to GOBP.Hypergeometric distribution probabilities for all includedGOBP categories were calculated for each signature toevaluate its statistical significance. A pathway that had ahypergeometric distribution probability < 0.05 and washit by two or more genes from the 100 genes was consid-ered an over-represented pathway in a signature. The totalnumber of times a pathway occurred in the 500 signatureswas considered as the frequency of over-representation.
To evaluate the relationship between a pathway as awhole and the clinical outcome, each of the top 20 over-represented pathways that have the highest frequencies inthe 500 signatures were subjected to Global Test program[12,14]. The Global Test examines the association of agroup of genes as a whole to a specific clinical parametersuch as DMFS. The contribution of individual genes in thetop over-represented pathways to the association was alsoevaluated.
Building pathway-based signaturesTo explore the possibility of using the genes from over-represented pathways as a signature to predict distantmetastasis, the top two pathways for ER-positive and ER-negative tumors that were in the top 20 list based on fre-quency of over-representation and had the smallest p val-ues with the Global Test program were chosen to build agene signature. First, genes in the pathway were selected iftheir z-score was greater than 1.96 from the Global Testprogram. A z-score greater than 1.96 indicates that theassociation of the gene expression with DMFS time is sig-nificant (p < 0.05) [12,14]. To determine the optimalnumber of genes in a given pathway used for building thesignature, combinations of gene markers were tested byadding one gene at a time according to their z-scores. Thenumber of significant genes that gave the highest AUCvalue of the ROC analysis with distant metastasis within 5
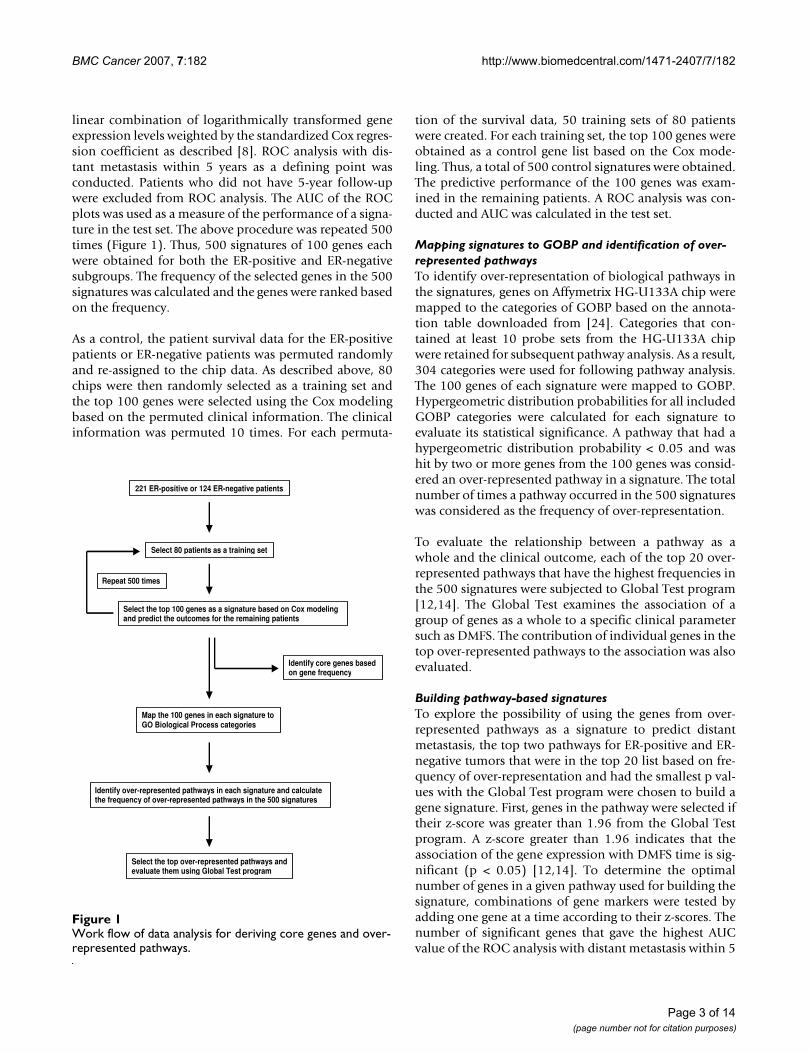
Work flow of data analysis for deriving core genes and over-represented pathwaysFigure 1Work flow of data analysis for deriving core genes and over-represented pathways.
221 ER-positive or 124 ER-negative patients
Select 80 patients as a training set
Select the top 100 genes as a signature based on Cox modeling and predict the outcomes for the remaining patients
Repeat 500 times
Identify core genes based on gene frequency
Map the 100 genes in each signature to GO Biological Process categories
Identify over-represented pathways in each signature and calculate the frequency of over-represented pathways in the 500 signatures
Select the top over-represented pathways and evaluate them using Global Test program
Page 3 of 14(page number not for citation purposes)

BMC Cancer 2007, 7:182 http://www.biomedcentral.com/1471-2407/7/182
years as the defining point was considered optimal andused to build a pathway-based signature.
The relapse score for a given patient was calculated as thedifference between the linear combination of the logarith-mically transformed expression signals weighted by theirz-scores for negatively correlated genes and that for posi-tively correlated genes. The predicting performance of thegene signature was evaluated by ROC and Kaplan-Meiersurvival analysis in an independent patient group [23] forER-positive patients and ER-negative patients both sepa-rately and combined.
Comparing multiple gene signaturesTo compare the genes from various prognostic signaturesfor breast cancer, five gene signatures were selected[3,8,23,25,26]. Identity of the genes between the signa-tures was determined by BLAST program. To examine therepresentation of the top 20 pathways in the signatures,genes in each of the signatures were mapped to GOBP.
Data availabilityThe microarray data analyzed in this paper have been sub-mitted to the NCBI/Genbank GEO database (series entryGSE2034 for the first 286 patients, and GSE5327 for theadditional 58 patients). The microarray and clinical dataused for the independent validation testing set analysiswere obtained from the GEO database with accessionnumber GSE2990.
ResultsMultiple gene signaturesUsing re-sampling, we constructed a total of 1,000 prog-nostic gene signatures derived from different patientgroups aiming to improve understanding of the underly-ing biological processes of breast cancer metastasis. Sincegene expression patterns of ER-subgroups of breasttumors are quite different [1-4,8,27] data analysis toderive gene signatures and subsequent pathway analysiswere conducted separately [8]. For both ER-positive andER-negative patients, 80 samples were randomly selectedas a training set and the 100 genes most significantly asso-ciated with distant metastasis-free survival (DMFS) wereused as a signature to predict tumor recurrence for theremaining ER-positive and ER-negative patients, respec-tively (Figure 1). The area under the curve (AUC) ofreceiver operating characteristic (ROC) analysis with dis-tant metastasis within 5 years as a defining point was usedas a measure of the performance of a signature in a corre-sponding test set. The above procedure was repeated 500times. The average of AUCs for the 500 signatures in theER-positive test sets was 0.70 (95% confidence interval(CI): 0.61–0.77) whereas the average of AUCs for 500 ran-dom gene lists was 0.50 (95% CI: 0.33–0.66), indicatinga non-random prediction for the true test sets (Figure 2A).
For ER-negative datasets, these values of average AUCswere 0.67 (95% CI: 0.53–0.80) and 0.51 (95% CI: 0.31–0.76), respectively (Figure 2B). The results demonstratethat depending on the training set different gene signa-tures can be identified with comparable performance.This could explain the results obtained by earlier studies,which reported different gene signatures with similarpower to predict risk groups. The 20 most frequentlyfound genes in the 500 signatures for ER-positive and ER-negative tumors are listed in Table 1. The most frequentgenes were KIAA0241 protein (KIAA0241) for ER-positivetumors, and zinc finger protein multitype 2 (ZFPM2) forER-negative tumors. There was no overlap between genesof the ER-positive and -negative core gene lists suggestingthat different molecular mechanisms are associated withthe subtypes of breast cancer disease.
Over-represented pathways in gene signatures and Global TestThe 100 genes in each of the 500 signatures for ER-posi-tive and ER-negative tumors were mapped to the catego-ries of GOBP. For a given gene signature, a pathway (orcategory) that had a hypergeometric distribution proba-bility smaller than 0.05 and included two or more geneswas considered an over-represented pathway. The "inclu-sion of 2 or more genes" as a selection criterion in addi-tion to the statistical significance was to avoid selectingstatistically significant pathways containing only one genein the signature. The frequency of over-representation ofGOBP in the 500 signatures for ER-positive and ER-nega-tive dataset was calculated. Like the observation of mostfrequently found genes, the biological pathways over-rep-resented in the gene signatures are distinct for ER-positiveand ER-negative tumors (Table 2). For ER-positivetumors, cell division-related processes and immune-response-related pathways are frequently found in the top20 over-represented pathways. All of the 20 pathways hada significant association with DMFS as analyzed by theGlobal Test program [12,14], with the 2 most significantbeing "apoptosis" (mainly containing genes of the extrin-sic apoptotic pathway) and "regulation of cell cycle"(Table 2). For ER-negative tumors, many of the top 20pathways are related with RNA processing, transportationand signal transduction. Eighteen of the top 20 pathwaysdemonstrated a significant association with DMFS in theGlobal Test, the 2 most significant being "regulation ofcell growth" and "regulation of G-protein coupled recep-tor signaling" (Table 2).
The contribution and significance of individual genes inthe top over-represented pathways to the association withDMFS were determined for ER-positive [see Additionalfiles 1 and 2] and ER-negative tumors [see Additional files3 and 4]. Genes can either show a positive associationwith DMFS, indicating a higher expression in tumors
Page 4 of 14(page number not for citation purposes)

BMC Cancer 2007, 7:182 http://www.biomedcentral.com/1471-2407/7/182
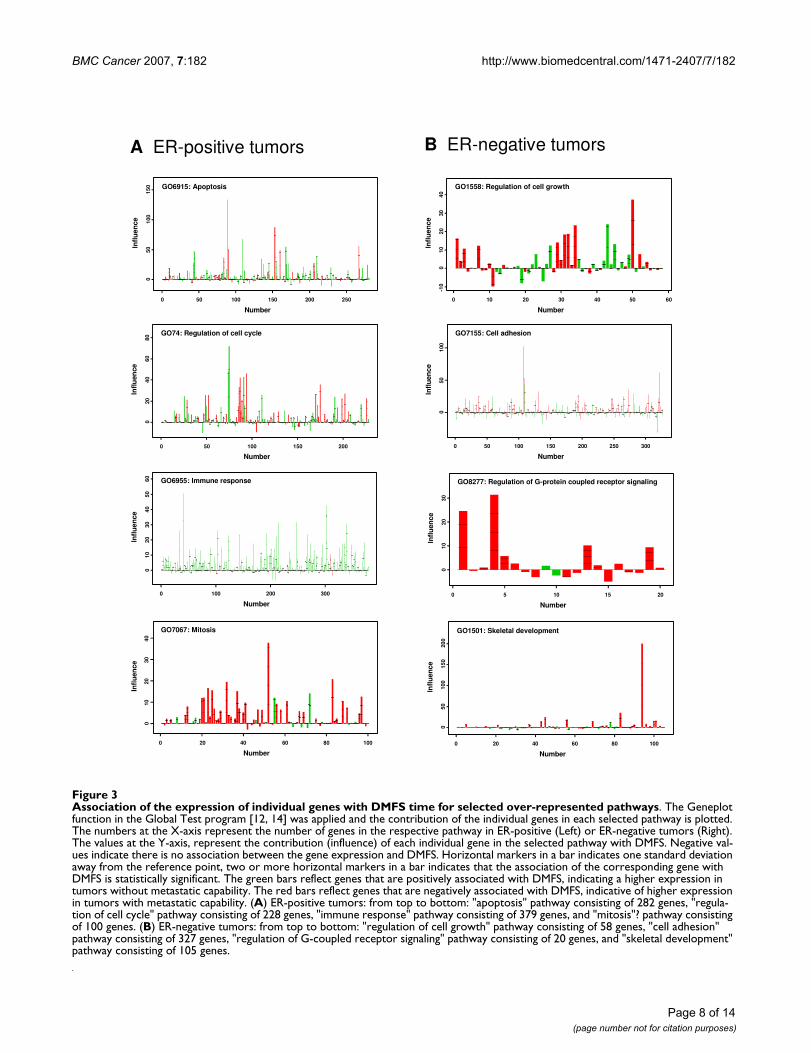
without metastatic capability, or a negative association,indicative of a higher expression in metastatic tumors. InER-positive tumors, pathways with a mixed associationinclude the 2 most significant pathways "apoptosis" and"regulation of cell cycle" (Figure 3A). There were also anumber of pathways that had a predominant positive ornegative correlation with DMFS. For example, the path-way "immune response" is associated with 379 probe sets,of which the majority showed positive correlation toDMFS (Figure 3A). Similarly in the biological processes"cellular defense response" and "chemotaxis", most genes
displayed a strong positive correlation with DMFS [seeAdditional file 1]. On the other hand, genes in "mitosis"(Figure 3A), "mitotic chromosome segregation" and "cellcycle" showed a predominant negative correlation withDMFS [see Additional file 1].
In ER-negative tumors (Figure 3B), examples of pathwayswith genes that had both positive and negative correlationto DMFS include "regulation of cell growth", the most sig-nificant pathway, and "cell adhesion". Of the top 20 path-ways in ER-negative tumors, none showed a dominant
Table 1: Genes with highest frequencies in 500 signatures
Gene title Gene symbol Frequency
Top 20 core genes from ER-positive tumorsKIAA0241 protein KIAA0241 321CD44 antigen (homing function and Indian blood group system) CD44 286ATP-binding cassette, sub-family C (CFTR/MRP), member 5 ABCC5 251serine/threonine kinase 6 STK6 245cytochrome c, somatic CYCS 235KIAA0406 gene product KIA0406 212uridine-cytidine kinase 1-like 1 UCKL1 201zinc finger, CCHC domain containing 8 ZCCHC8 188Rac GTPase activating protein 1 RACGAP1 186staufen, RNA binding protein (Drosophila) STAU 176lactamase, beta 2 LACTB2 175eukaryotic translation elongation factor 1 alpha 2 EEF1A2 172RAE1 RNA export 1 homolog (S. pombe) RAE1 153tuftelin 1 TUFT1 150zinc finger protein 36, C3H type-like 2 ZFP36L2 150origin recognition complex, subunit 6 homolog-like (yeast) ORC6L 143zinc finger protein 623 ZNF623 140extra spindle poles like 1 ESPL1 139transcription elongation factor B (SIII), polypeptide 1 TCEB1 138ribosomal protein S6 kinase, 70 kDa, polypeptide 1 RPS6KB1 127
Top 20 core genes from ER-negative tumorszinc finger protein, multitype 2 ZFPM2 445ribosomal protein L26-like 1 RPL26L1 372hypothetical protein FLJ14346 FLJ14346 372mitogen-activated protein kinase-activated protein kinase 2 MAPKAPK2 347collagen, type II, alpha 1 COL2A1 340muscleblind-like 2 (Drosophila) MBNL2 320G protein-coupled receptor 124 GPR124 314splicing factor, arginine/serine-rich 11 SFRS11 300heterogeneous nuclear ribonucleoprotein A1 HNRPA1 297CDC42 binding protein kinase alpha (DMPK-like) CDC42BPA 296regulator of G-protein signalling 4 RGS4 276transient receptor potential cation channel, subfamily C, member 1
TRPC1 265
transcription factor 8 (represses interleukin 2 expression) TCF8 263chromosome 6 open reading frame 210 C6orf210 262dynamin 3 DNM3 260centrosome protein Cep63 Cep63 251tumor necrosis factor (ligand) superfamily, member 13 TNFSF13 251dapper, antagonist of beta-catenin, homolog 1 (Xenopus laevis) DACT1 248heterogeneous nuclear ribonucleoprotein A1 HNRPA1 245reversion-inducing-cysteine-rich protein with kazal motifs RECK 243
The top 20 genes are ranked by their frequency in the 500 signatures of 100 genes for ER-positive and ER-negative tumors (for details see Figure 1).
Page 5 of 14(page number not for citation purposes)

BMC Cancer 2007, 7:182 http://www.biomedcentral.com/1471-2407/7/182
positive association with DMFS. Although for some path-ways most genes correlated negatively with DMFS [seeAdditional file 3], including "regulation of G-protein cou-pled receptor signaling" and "skeletal development" (Fig-ure 3B), ranked among the top 3 pathways in significance(Table 2). Of the top 20 core pathways 4 overlappedbetween ER-positive and -negative tumors, i.e., "regula-tion of cell cycle", "protein amino acid phosphorylation","protein biosynthesis", and "cell cycle" (Table 2).
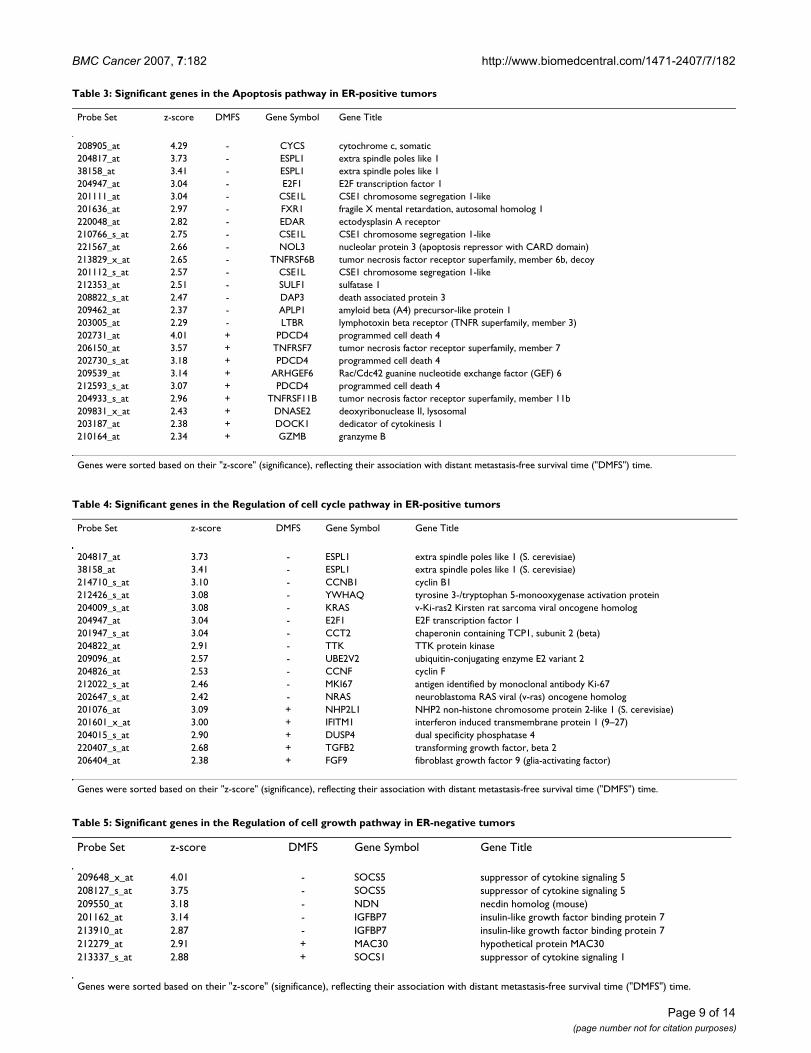
Pathway-derived gene expression profiles as a predictorIn an attempt to use gene expression profiles in the mostsignificant biological processes to predict distant metas-tases we used the genes of the top 2 significant pathwaysin both ER-positive (Table 3, Table 4) and -negativetumors (Table 5, Table 6) to construct a gene signature for
the prediction of distant recurrence. A 50-gene signaturewas constructed by combining the 38 genes from the top2 ER-positive pathways ("apoptosis", "regulation of cellcycle") and 12 genes for the top 2 ER-negative pathways("regulation of cell growth", "regulation of G-coupledreceptor signaling"). This signature was further validatedusing an independent 152-patient cohort [23], whichconsisted of 125 ER-positive tumors and 27 ER-negativetumors (after removing 36 lymph node positive patientsand a patient who died 15 days after surgery). When the38 genes was applied to the 125 ER-positive patients, aROC analysis gave an AUC of 0.782 (95% CI: 0.681–0.883) (Figure 4A, left), and Kaplan-Meier analysis forDMFS showed a clear separation in risk groups (p < 0.001,HR: 3.36 and 95% CI: 1.68–6.70) (Figure 4A, right). Forthe 12 genes for the 27 ER-negative patients, an AUC of0.872 (95% CI: 0.719–1) (Figure 4B, left) and separationbetween risk groups with a p < 0.001 and a HR of 19.8(95% CI: 2.41–163) (Figure 4B, right) was obtained. Thecombined 50-gene signature for ER-positive and ER-nega-tive patients gave an AUC of 0.795 (95% CI: 0.705–0.878) (Figure 4C, left) and a p < 0.001 and a HR of 4.44(95% CI: 2.31–8.54) for separation between risk groups(Figure 4C, right).
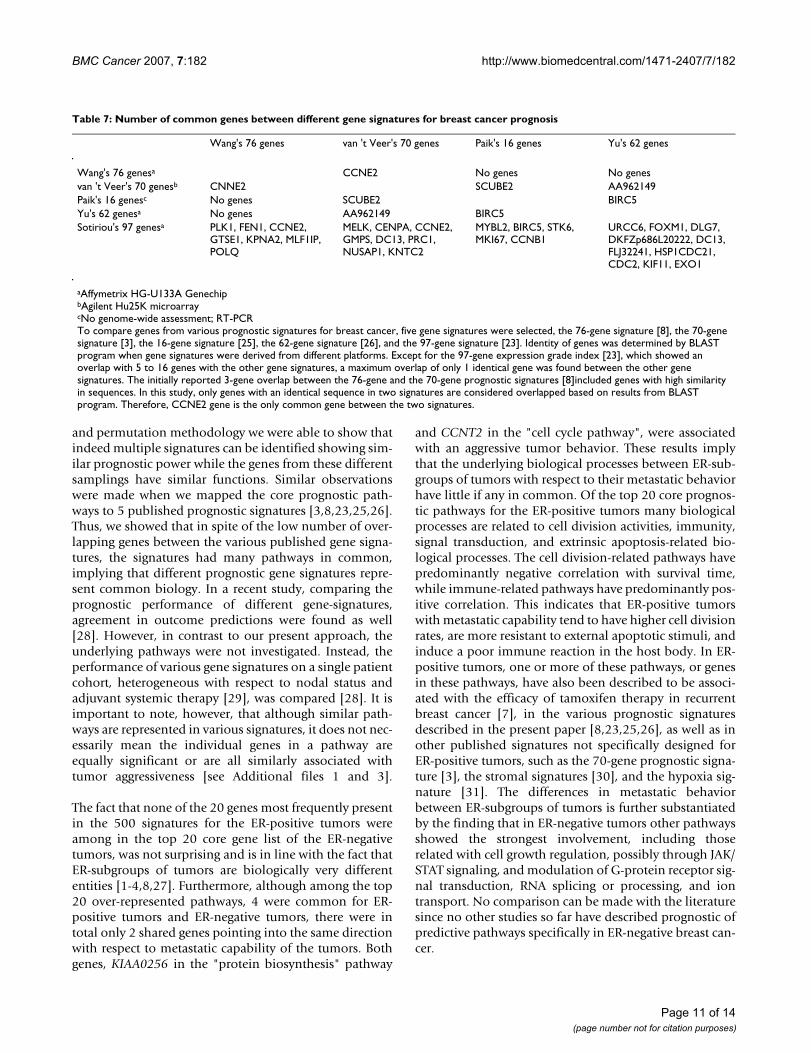
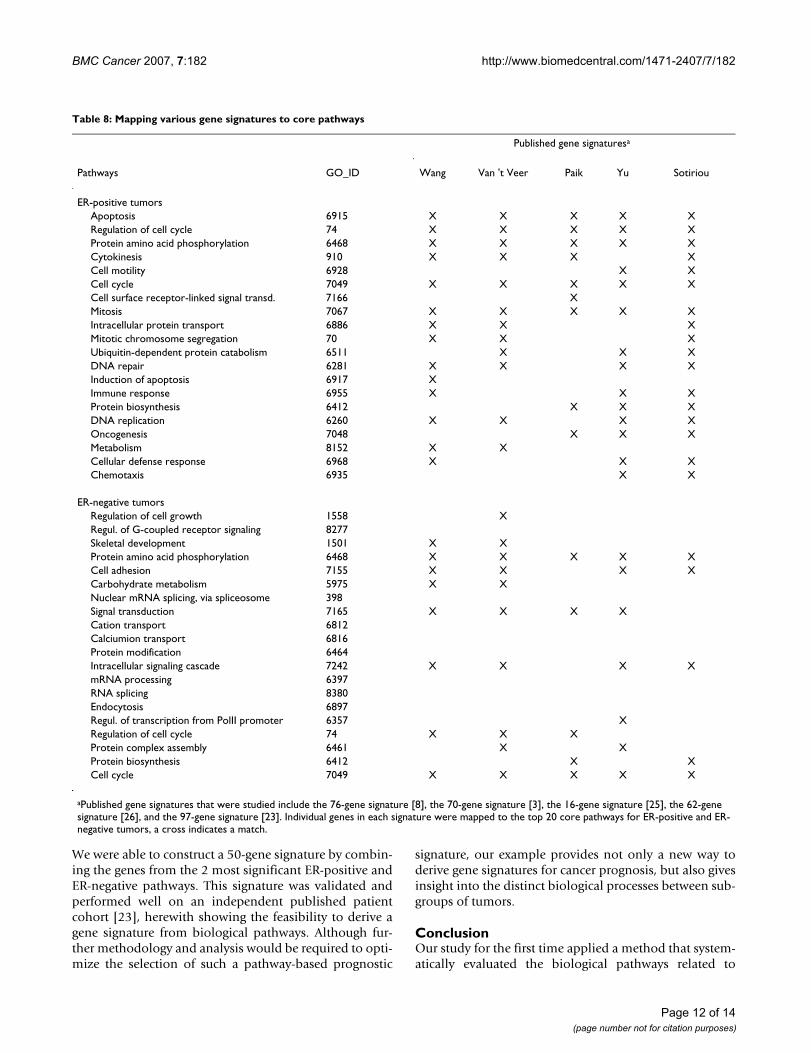
Pathway analysis of published prognostic gene signaturesTo compare genes from various prognostic signatures forbreast cancer, five published gene signatures were selected[3,8,23,25,26]. We first compared the gene sequenceidentity between each pair of the gene signatures andfound, consistent with previous reports, very few overlap-ping genes (Table 7). The grade index gene expression sig-nature comprising 97 genes, of which most are associatedwith cell cycle regulation and proliferation [23], showedthe highest number of overlapping genes between the var-ious signatures ranging from 5 of the 16 genes of GenomicHealth [25] to 10 with Yu's 62 genes [26]. The other 4gene signatures showed only 1 gene overlap in a pair-wisecomparison, and there was no common gene for all signa-tures. In spite of the low number of overlapping genesacross signatures, we hypothesized that the representationof common pathways in the various signatures mayunderlie their individual prognostic value [8]. Therefore,we examined the representation of the core prognosticpathways (Table 2) in the 5 signatures. The GenomicHealth 16-gene signature mapped to 10 of the 36 distinctcore pathways (20 for both ER-positive and -negativetumors but counting the 4 overlapping pathways once)whereas it mapped to a total of 25 out of 304 GOBPs. Thestatistical significance for the enrichment of GOBP, ascomputed by hypergeometric distribution probability was2 × 10-5. Each of the other 4 signatures have 62 or moregenes and were mapped to 19 (53%) distinct prognosticpathways and their statistical significance of enrichmentwas 1 × 10⁻⁷ for Wang and van 't Veer, 1 × 10⁻⁶ for Sotiriou
Evaluation of the 500 gene signaturesFigure 2Evaluation of the 500 gene signatures. Each of the 100-gene signatures for 80 randomly selected tumors in the train-ing set was used to predict relapsed patients in the corre-sponding test set. Its performance was measured by the AUC of the ROC analysis. (A) Performance of the gene sig-natures for ER-positive patients in test sets. (B) Performance of the gene signatures for ER-negative patients in test sets. (Left) Frequency of AUC in 500 prognostic signatures panels as derived following the flow chart presented in Figure 1. (Right) Frequency of AUC in 500 random gene lists. To gen-erate a gene list as a control, the survival data for the ER-positive patients or ER-negative patients was permutated randomly and reassigned to the chip data.
Signatures
0.2 0.3 0.4 0.5 0.6 0.7 0.8 0.9
05
01
00
15
02
00
AUC: 0.70
(95% CI: 0.61-0.77)
0.2 0.3 0.4 0.5 0.6 0.7 0.8 0.9
05
01
00
15
02
00
Area under curve in testing sets Area under curve in testing sets
Random lists
AUC: 0.50
(95% CI: 0.33-0.66)
Fre
qu
en
cy
Fre
qu
en
cy
A
Area under curve in testing sets
Fre
qu
en
cy
05
01
00
15
0
05
01
00
15
0
Area under curve in testing sets
Signatures Random lists
AUC: 0.67
(95% CI: 0.53-0.80)
AUC: 0.51
(95% CI: 0.31-0.76)
0.2 0.3 0.4 0.5 0.6 0.7 0.8 0.9 0.2 0.3 0.4 0.5 0.6 0.7 0.8 0.9
Fre
qu
en
cy
B
Page 6 of 14(page number not for citation purposes)

BMC Cancer 2007, 7:182 http://www.biomedcentral.com/1471-2407/7/182
and 6 × 10-11 for Yu's signature (Table 8). Of these 19pathways, 9 were identical for all 4 signatures, i.e., "mito-sis", "apoptosis", "regulation of cell cycle", "DNA repair","cell cycle", "protein amino acid phosphorylation", "DNAreplication", "intracellular signaling cascade", and "celladhesion".
DiscussionGene-expression profiling for separating patients into dif-ferent subtypes and risk groups have been focused on theidentification of differential expression of individualgenes rather than obtaining biological insight. In thepresent study we have used an alternative approach toidentify in ER-positive and ER-negative populations ofbreast cancer patients the underlying biological processesassociated with metastasis. Using a stringent re-sampling
Table 2: Top 20 pathways in the 500 signatures of ER-positive and ER-negative tumors evaluated by Global Test
Pathways GO_ID P Frequency
ER-positive tumorsApoptosis 6915 3.06E-7 250Regulation of cell cycle 74 2.46E-5 203Protein amino acid phosphorylation 6468 2.48E-5 114Cytokinesis 910 6.13E-5 165Cell motility 6928 0.00015 93Cell cycle 7049 0.00028 138Cell surface receptor-linked signal transd. 7166 0.00033 172Mitosis 7067 0.00036 256Intracellular protein transport 6886 0.00054 141Mitotic chromosome segregation 70 0.00057 98Ubiquitin-dependent protein catabolism 6511 0.00074 158DNA repair 6281 0.00079 156Induction of apoptosis 6917 0.00083 115Immune response 6955 0.00094 167Protein biosynthesis 6412 0.0010 145DNA replication 6260 0.0015 92Oncogenesis 7048 0.0020 228Metabolism 8152 0.0021 83Cellular defense response 6968 0.0025 131Chemotaxis 6935 0.0027 89
ER-negative tumorsRegulation of cell growth 1558 0.00012 136Regul. of G-coupled receptor signaling 8277 0.00013 153Skeletal development 1501 0.00024 160Protein amino acid phosphorylation 6468 0.0051 151Cell adhesion 7155 0.0065 110Carbohydrate metabolism 5975 0.0066 86Nuclear mRNA splicing, via spliceosome 398 0.0067 203Signal transduction 7165 0.0078 160Cation transport 6812 0.0098 160Calciumion transport 6816 0.010 93Protein modification 6464 0.011 132Intracellular signaling cascade 7242 0.012 135mRNA processing 6397 0.012 81RNA splicing 8380 0.014 192Endocytosis 6897 0.026 166Regul. of transcription from PolII promoter 6357 0.031 109Regulation of cell cycle 74 0.043 88Protein complex assembly 6461 0.048 183Protein biosynthesis 6412 0.063 99Cell cycle 7049 0.084 72
Each of the top 20 over-represented pathways that have the highest frequencies in the 500 signatures of ER-positive and ER-negative tumors were subjected to Global Test program [12, 14]. The Global Test examines the association of a group of genes as a whole to a specific clinical parameter, in this case DMFS, and generates an asymptotic theory p value for the pathway. The pathways are ranked by their p value in the respective ER-subgroup of tumors.
Page 7 of 14(page number not for citation purposes)
BMC Cancer 2007, 7:182 http://www.biomedcentral.com/1471-2407/7/182
Page 8 of 14(page number not for citation purposes)
Association of the expression of individual genes with DMFS time for selected over-represented pathwaysFigure 3Association of the expression of individual genes with DMFS time for selected over-represented pathways. The Geneplot function in the Global Test program [12, 14] was applied and the contribution of the individual genes in each selected pathway is plotted. The numbers at the X-axis represent the number of genes in the respective pathway in ER-positive (Left) or ER-negative tumors (Right). The values at the Y-axis, represent the contribution (influence) of each individual gene in the selected pathway with DMFS. Negative val-ues indicate there is no association between the gene expression and DMFS. Horizontal markers in a bar indicates one standard deviation away from the reference point, two or more horizontal markers in a bar indicates that the association of the corresponding gene with DMFS is statistically significant. The green bars reflect genes that are positively associated with DMFS, indicating a higher expression in tumors without metastatic capability. The red bars reflect genes that are negatively associated with DMFS, indicative of higher expression in tumors with metastatic capability. (A) ER-positive tumors: from top to bottom: "apoptosis" pathway consisting of 282 genes, "regula-tion of cell cycle" pathway consisting of 228 genes, "immune response" pathway consisting of 379 genes, and "mitosis"? pathway consisting of 100 genes. (B) ER-negative tumors: from top to bottom: "regulation of cell growth" pathway consisting of 58 genes, "cell adhesion" pathway consisting of 327 genes, "regulation of G-coupled receptor signaling" pathway consisting of 20 genes, and "skeletal development" pathway consisting of 105 genes.
0 50 100 150 200 250
05
01
00
15
0
Infl
ue
nce
Number
GO6915: Apoptosis
0 50 100 150 200
020
40
60
80
Infl
uen
ce
Number
GO74: Regulation of cell cycle
0 100 200 300
01
02
03
04
05
06
0
Infl
ue
nce
Number
GO6955: Immune response
0 20 40 60 80 100
010
20
30
40
Infl
uen
ce
Number
GO7067: Mitosis
0 10 20 30 40 50 60
-10
010
20
30
40
Infl
ue
nce
Number
GO1558: Regulation of cell growth
0 50 100 150 200 250 3000
50
100
Infl
uen
ce
Number
GO7155: Cell adhesion
0 5 10 15 20
01
02
03
0
Infl
uen
ce
Number
GO8277: Regulation of G-protein coupled receptor signaling
0 20 40 60 80 100
05
01
00
15
020
0
Infl
uen
ce
Number
GO1501: Skeletal development
A ER-positive tumors B ER-negative tumors
BMC Cancer 2007, 7:182 http://www.biomedcentral.com/1471-2407/7/182
Page 9 of 14(page number not for citation purposes)
Table 3: Significant genes in the Apoptosis pathway in ER-positive tumors
Probe Set z-score DMFS Gene Symbol Gene Title
208905_at 4.29 - CYCS cytochrome c, somatic204817_at 3.73 - ESPL1 extra spindle poles like 138158_at 3.41 - ESPL1 extra spindle poles like 1204947_at 3.04 - E2F1 E2F transcription factor 1201111_at 3.04 - CSE1L CSE1 chromosome segregation 1-like201636_at 2.97 - FXR1 fragile X mental retardation, autosomal homolog 1220048_at 2.82 - EDAR ectodysplasin A receptor210766_s_at 2.75 - CSE1L CSE1 chromosome segregation 1-like221567_at 2.66 - NOL3 nucleolar protein 3 (apoptosis repressor with CARD domain)213829_x_at 2.65 - TNFRSF6B tumor necrosis factor receptor superfamily, member 6b, decoy201112_s_at 2.57 - CSE1L CSE1 chromosome segregation 1-like212353_at 2.51 - SULF1 sulfatase 1208822_s_at 2.47 - DAP3 death associated protein 3209462_at 2.37 - APLP1 amyloid beta (A4) precursor-like protein 1203005_at 2.29 - LTBR lymphotoxin beta receptor (TNFR superfamily, member 3)202731_at 4.01 + PDCD4 programmed cell death 4206150_at 3.57 + TNFRSF7 tumor necrosis factor receptor superfamily, member 7202730_s_at 3.18 + PDCD4 programmed cell death 4209539_at 3.14 + ARHGEF6 Rac/Cdc42 guanine nucleotide exchange factor (GEF) 6212593_s_at 3.07 + PDCD4 programmed cell death 4204933_s_at 2.96 + TNFRSF11B tumor necrosis factor receptor superfamily, member 11b209831_x_at 2.43 + DNASE2 deoxyribonuclease II, lysosomal203187_at 2.38 + DOCK1 dedicator of cytokinesis 1210164_at 2.34 + GZMB granzyme B
Genes were sorted based on their "z-score" (significance), reflecting their association with distant metastasis-free survival time ("DMFS") time.
Table 4: Significant genes in the Regulation of cell cycle pathway in ER-positive tumors
Probe Set z-score DMFS Gene Symbol Gene Title
204817_at 3.73 - ESPL1 extra spindle poles like 1 (S. cerevisiae)38158_at 3.41 - ESPL1 extra spindle poles like 1 (S. cerevisiae)214710_s_at 3.10 - CCNB1 cyclin B1212426_s_at 3.08 - YWHAQ tyrosine 3-/tryptophan 5-monooxygenase activation protein204009_s_at 3.08 - KRAS v-Ki-ras2 Kirsten rat sarcoma viral oncogene homolog204947_at 3.04 - E2F1 E2F transcription factor 1201947_s_at 3.04 - CCT2 chaperonin containing TCP1, subunit 2 (beta)204822_at 2.91 - TTK TTK protein kinase209096_at 2.57 - UBE2V2 ubiquitin-conjugating enzyme E2 variant 2204826_at 2.53 - CCNF cyclin F212022_s_at 2.46 - MKI67 antigen identified by monoclonal antibody Ki-67202647_s_at 2.42 - NRAS neuroblastoma RAS viral (v-ras) oncogene homolog201076_at 3.09 + NHP2L1 NHP2 non-histone chromosome protein 2-like 1 (S. cerevisiae)201601_x_at 3.00 + IFITM1 interferon induced transmembrane protein 1 (9–27)204015_s_at 2.90 + DUSP4 dual specificity phosphatase 4220407_s_at 2.68 + TGFB2 transforming growth factor, beta 2206404_at 2.38 + FGF9 fibroblast growth factor 9 (glia-activating factor)
Genes were sorted based on their "z-score" (significance), reflecting their association with distant metastasis-free survival time ("DMFS") time.
Table 5: Significant genes in the Regulation of cell growth pathway in ER-negative tumors
Probe Set z-score DMFS Gene Symbol Gene Title
209648_x_at 4.01 - SOCS5 suppressor of cytokine signaling 5208127_s_at 3.75 - SOCS5 suppressor of cytokine signaling 5209550_at 3.18 - NDN necdin homolog (mouse)201162_at 3.14 - IGFBP7 insulin-like growth factor binding protein 7213910_at 2.87 - IGFBP7 insulin-like growth factor binding protein 7212279_at 2.91 + MAC30 hypothetical protein MAC30213337_s_at 2.88 + SOCS1 suppressor of cytokine signaling 1
Genes were sorted based on their "z-score" (significance), reflecting their association with distant metastasis-free survival time ("DMFS") time.

BMC Cancer 2007, 7:182 http://www.biomedcentral.com/1471-2407/7/182
Page 10 of 14(page number not for citation purposes)
Table 6: Significant genes in the Regulation of G-protein coupled receptor signaling pathway in ER-negative tumors
Probe Set z-score DMFS Gene Symbol Gene Title
204337_at 3.99 - RGS4 regulator of G-protein signalling 4209324_s_at 3.73 - RGS16 regulator of G-protein signalling 16220300_at 2.61 - RGS3 regulator of G-protein signalling 3202388_at 2.61 - RGS2 regulator of G-protein signalling 2, 24 kDa204396_s_at 2.34 - GRK5 G protein-coupled receptor kinase 5
Genes were sorted based on their "z-score" (significance), reflecting their association with distant metastasis-free survival time ("DMFS") time.
Validation of pathway-based breast cancer classifiers constructed from the optimal significant genesFigure 4Validation of pathway-based breast cancer classifiers constructed from the optimal significant genes. To find the optimal number of genes as a signature, ROC analyses, with 5-year DMFS as defining point, with an increasing number of genes were conducted in the training set of ER-positive tumors or ER-negative tumors. For ER-positive tumors, in the "apoptosis" pathway, 24 genes (reaching an AUC of 0.784) were considered optimal (Table 3). For the "regulation of cell cycle pathway" in ER-positive tumors, 17 genes (AUC of 0.777) were considered optimal (Table 4). For ER-negative tumors, the optimal number of genes was 7 (AUC of 0.790) for the "regulation for cell growth" pathway (Table 5), and 5 (AUC of 0.788) for the "regulation of G-protein coupled receptor signaling" pathway (Table 6), respectively. The selected genes for the top 2 pathways for ER-positive and ER-negative tumors were subsequently used to construct prognostic gene signatures separately for the 2 ER-sub-groups of tumors. The 152-patient test set [23] consisted of 125 ER-positive tumors and 27 ER-negative tumors based on the expression level of ER gene on the chip. (A) ROC (Left) and Kaplan-Meier (Right) analysis of the 38-gene signature for ER-pos-itive tumors. Thirteen patients with less than 5-year follow-up were excluded from ROC analysis. (B) ROC (Left) and Kaplan-Meier (Right) analysis of the 12-gene signature for ER-negative tumors. One patient with less than 5-year follow-up was excluded from ROC analysis. (C) ROC (Left) and Kaplan-Meier (Right) analysis of a combined 50-gene signature for ER-posi-tive and ER-negative tumors. Fourteen patients with less than 5-year follow-up were excluded from ROC analysis.
HR (95% CI): 3.36 (1.68-6.70)
0.0
0.2
0.4
0.6
0.8
1.0
Log rank P < 0.001
Pro
bab
ilit
y D
MF
S
good signature
poor signature
Patients at risk:Good signaturePoor signature
58 58 56 51 49 48 41 36 32 26 1967 61 56 47 43 35 26 24 20 14 10
Time (years)
0 1 2 3 4 5 6 7 8 9 10
HR (95% CI): 19.8 (2.41-163)
0.0
0.2
0.4
0.6
0.8
1.0
Log rank P < 0.001
Pro
bab
ilit
y D
MF
Sgood signature
poor signature
Time (years)
0 1 2 3 4 5 6 7 8 9 10
17 17 17 17 16 16 15 13 13 9 610 7 6 5 3 3 3 3 2 2 1
Patients at risk:Good signaturePoor signature
HR (95% CI): 4.44 (2.31-8.54)
0.0
0.2
0.4
0.6
0.8
1.0
Log rank P < 0.001
Pro
bab
ilit
y D
MF
S
good signature
poor signature
Patients at risk:Good signaturePoor signature
Time (years)
0 1 2 3 4 5 6 7 8 9 10
75 75 73 68 65 64 56 49 45 35 2577 68 62 52 46 38 29 27 22 16 11
0.0 0.2 0.4 0.6 0.8 1.0
0.0
0.2
0.4
0.6
0.8
1.0
1-Specificity
Sen
sit
ivit
y
AUC (95% CI): 0.782 (0.681-0.883)
ER-positive testing set patients: 38-gene signatureA
0.0 0.2 0.4 0.6 0.8 1.0
0.0
0.2
0.4
0.6
0.8
1.0
1-Specificity
Sen
sit
ivit
y
AUC (95% CI): 0.872 (0.719-1)
ER-negative testing set patients: 12-gene signatureB
0.0 0.2 0.4 0.6 0.8 1.0
0.0
0.2
0.4
0.6
0.8
1.0
1-Specificity
Sen
sit
ivit
y
AUC (95% CI): 0.795 (0.705-0.878)
All testing set patients: 50-gene signatureC
BMC Cancer 2007, 7:182 http://www.biomedcentral.com/1471-2407/7/182
and permutation methodology we were able to show thatindeed multiple signatures can be identified showing sim-ilar prognostic power while the genes from these differentsamplings have similar functions. Similar observationswere made when we mapped the core prognostic path-ways to 5 published prognostic signatures [3,8,23,25,26].Thus, we showed that in spite of the low number of over-lapping genes between the various published gene signa-tures, the signatures had many pathways in common,implying that different prognostic gene signatures repre-sent common biology. In a recent study, comparing theprognostic performance of different gene-signatures,agreement in outcome predictions were found as well[28]. However, in contrast to our present approach, theunderlying pathways were not investigated. Instead, theperformance of various gene signatures on a single patientcohort, heterogeneous with respect to nodal status andadjuvant systemic therapy [29], was compared [28]. It isimportant to note, however, that although similar path-ways are represented in various signatures, it does not nec-essarily mean the individual genes in a pathway areequally significant or are all similarly associated withtumor aggressiveness [see Additional files 1 and 3].
The fact that none of the 20 genes most frequently presentin the 500 signatures for the ER-positive tumors wereamong in the top 20 core gene list of the ER-negativetumors, was not surprising and is in line with the fact thatER-subgroups of tumors are biologically very differententities [1-4,8,27]. Furthermore, although among the top20 over-represented pathways, 4 were common for ER-positive tumors and ER-negative tumors, there were intotal only 2 shared genes pointing into the same directionwith respect to metastatic capability of the tumors. Bothgenes, KIAA0256 in the "protein biosynthesis" pathway
and CCNT2 in the "cell cycle pathway", were associatedwith an aggressive tumor behavior. These results implythat the underlying biological processes between ER-sub-groups of tumors with respect to their metastatic behaviorhave little if any in common. Of the top 20 core prognos-tic pathways for the ER-positive tumors many biologicalprocesses are related to cell division activities, immunity,signal transduction, and extrinsic apoptosis-related bio-logical processes. The cell division-related pathways havepredominantly negative correlation with survival time,while immune-related pathways have predominantly pos-itive correlation. This indicates that ER-positive tumorswith metastatic capability tend to have higher cell divisionrates, are more resistant to external apoptotic stimuli, andinduce a poor immune reaction in the host body. In ER-positive tumors, one or more of these pathways, or genesin these pathways, have also been described to be associ-ated with the efficacy of tamoxifen therapy in recurrentbreast cancer [7], in the various prognostic signaturesdescribed in the present paper [8,23,25,26], as well as inother published signatures not specifically designed forER-positive tumors, such as the 70-gene prognostic signa-ture [3], the stromal signatures [30], and the hypoxia sig-nature [31]. The differences in metastatic behaviorbetween ER-subgroups of tumors is further substantiatedby the finding that in ER-negative tumors other pathwaysshowed the strongest involvement, including thoserelated with cell growth regulation, possibly through JAK/STAT signaling, and modulation of G-protein receptor sig-nal transduction, RNA splicing or processing, and iontransport. No comparison can be made with the literaturesince no other studies so far have described prognostic ofpredictive pathways specifically in ER-negative breast can-cer.
Table 7: Number of common genes between different gene signatures for breast cancer prognosis
Wang's 76 genes van 't Veer's 70 genes Paik's 16 genes Yu's 62 genes
Wang's 76 genesa CCNE2 No genes No genesvan 't Veer's 70 genesb CNNE2 SCUBE2 AA962149Paik's 16 genesc No genes SCUBE2 BIRC5Yu's 62 genesa No genes AA962149 BIRC5Sotiriou's 97 genesa PLK1, FEN1, CCNE2,
GTSE1, KPNA2, MLF1IP, POLQ
MELK, CENPA, CCNE2, GMPS, DC13, PRC1, NUSAP1, KNTC2
MYBL2, BIRC5, STK6, MKI67, CCNB1
URCC6, FOXM1, DLG7, DKFZp686L20222, DC13, FLJ32241, HSP1CDC21, CDC2, KIF11, EXO1
aAffymetrix HG-U133A GenechipbAgilent Hu25K microarraycNo genome-wide assessment; RT-PCRTo compare genes from various prognostic signatures for breast cancer, five gene signatures were selected, the 76-gene signature [8], the 70-gene signature [3], the 16-gene signature [25], the 62-gene signature [26], and the 97-gene signature [23]. Identity of genes was determined by BLAST program when gene signatures were derived from different platforms. Except for the 97-gene expression grade index [23], which showed an overlap with 5 to 16 genes with the other gene signatures, a maximum overlap of only 1 identical gene was found between the other gene signatures. The initially reported 3-gene overlap between the 76-gene and the 70-gene prognostic signatures [8]included genes with high similarity in sequences. In this study, only genes with an identical sequence in two signatures are considered overlapped based on results from BLAST program. Therefore, CCNE2 gene is the only common gene between the two signatures.
Page 11 of 14(page number not for citation purposes)
BMC Cancer 2007, 7:182 http://www.biomedcentral.com/1471-2407/7/182
We were able to construct a 50-gene signature by combin-ing the genes from the 2 most significant ER-positive andER-negative pathways. This signature was validated andperformed well on an independent published patientcohort [23], herewith showing the feasibility to derive agene signature from biological pathways. Although fur-ther methodology and analysis would be required to opti-mize the selection of such a pathway-based prognostic
signature, our example provides not only a new way toderive gene signatures for cancer prognosis, but also givesinsight into the distinct biological processes between sub-groups of tumors.
ConclusionOur study for the first time applied a method that system-atically evaluated the biological pathways related to
Table 8: Mapping various gene signatures to core pathways
Published gene signaturesa
Pathways GO_ID Wang Van 't Veer Paik Yu Sotiriou
ER-positive tumorsApoptosis 6915 X X X X XRegulation of cell cycle 74 X X X X XProtein amino acid phosphorylation 6468 X X X X XCytokinesis 910 X X X XCell motility 6928 X XCell cycle 7049 X X X X XCell surface receptor-linked signal transd. 7166 XMitosis 7067 X X X X XIntracellular protein transport 6886 X X XMitotic chromosome segregation 70 X X XUbiquitin-dependent protein catabolism 6511 X X XDNA repair 6281 X X X XInduction of apoptosis 6917 XImmune response 6955 X X XProtein biosynthesis 6412 X X XDNA replication 6260 X X X XOncogenesis 7048 X X XMetabolism 8152 X XCellular defense response 6968 X X XChemotaxis 6935 X X
ER-negative tumorsRegulation of cell growth 1558 XRegul. of G-coupled receptor signaling 8277Skeletal development 1501 X XProtein amino acid phosphorylation 6468 X X X X XCell adhesion 7155 X X X XCarbohydrate metabolism 5975 X XNuclear mRNA splicing, via spliceosome 398Signal transduction 7165 X X X XCation transport 6812Calciumion transport 6816Protein modification 6464Intracellular signaling cascade 7242 X X X XmRNA processing 6397RNA splicing 8380Endocytosis 6897Regul. of transcription from PolII promoter 6357 XRegulation of cell cycle 74 X X XProtein complex assembly 6461 X XProtein biosynthesis 6412 X XCell cycle 7049 X X X X X
aPublished gene signatures that were studied include the 76-gene signature [8], the 70-gene signature [3], the 16-gene signature [25], the 62-gene signature [26], and the 97-gene signature [23]. Individual genes in each signature were mapped to the top 20 core pathways for ER-positive and ER-negative tumors, a cross indicates a match.
Page 12 of 14(page number not for citation purposes)
BMC Cancer 2007, 7:182 http://www.biomedcentral.com/1471-2407/7/182
patient outcomes of breast cancer and showed that vari-ous published prognostic gene signatures providing simi-lar outcome predictions are based on the representationof largely overlapping biological processes. Identificationof the key biological processes, rather than the assessmentof signatures based on individual genes, allows not onlyto build a biological meaningful gene signature fromfunctionally related genes, but also provides insight intothe mechanism of the disease development and, as spinoff, potential targets for future drug development. In thisrespect, as pharmacologic inhibitors for specific pathwaysbecome available for the clinic, the signatures that definetumors according to their vital pathways may provide cru-cial guidance for designing appropriate drug combina-tions [32].
AbbreviationsAUC, area under the curve; DMFS, distant metastasis-freesurvival; ER, estrogen receptor. GOBP, gene ontology bio-logical process; ROC, receiver operating characteristic.
Competing interestsRegarding conflict of interest, three co-authors areemployed by Veridex LLC, a Johnson & Johnson company(Jack Yu, Yi Zhang, Yixin Wang). Johnson & Johnson is ahealthcare company that is in the business of commercial-ising diagnostic products. The Erasmus Medical Center(Anieta Sieuwerts, John Martens, Marcel Smid, Jan Klijn,John Foekens) was financially supported by Veridex LLCfor tissue processing and isolating RNA for microarrayanalysis.
Authors' contributionsJXY assisted in the study design study, carried out the dataanalysis and drafted the manuscript; AMS processed thetumor tissues, isolated the RNA and did the quality con-trol; YZ JXY assisted in the study design study and carriedout the data analysis; JWMM assisted in the study designand contributed to the drafting of the manuscript; MScontributed to the data analysis; JGMK assisted in the col-lection of the clinical data and the study design; YWassisted in the study design, data analysis and drafting ofthe manuscript; JAF assisted in the study design, providedthe clinical samples with the follow-up data, and contrib-uted to the drafting of the manuscript. All authors haveread and approved the final paper.
Additional material
AcknowledgementsThis work was supported in part by the by a research grant from the Neth-erlands Genomics Initiative/Netherlands Organization for Scientific Research (M.S, J.G.M.K., J.A.F.). The Netherlands Genomics Initiative had no role in the design and conduct of the study, in the collection, analysis, and interpretation of the data, in the writing of the mansucript and the deci-sion to submit the manuscript for publication.
References1. Perou CM, Sorlie T, Eisen MB, van de Rijn M, Jeffrey SS, Rees CA, Pol-
lack JR, Ross DT, Johnsen H, Akslen LA, Fluge O, Pergamenschikov A,Williams C, Zhu SX, Lonning PE, Borresen-Dale AL, Brown PO, Bot-stein D: Molecular portraits of human breast tumours. Nature2000, 406:747-752.
2. Sorlie T, Perou CM, Tibshirani R, Aas T, Geisler S, Johnsen H, HastieT, Eisen MB, van de Rijn M, Jeffrey SS, Thorsen T, Quist H, Matese JC,Brown PO, Botstein D, Eystein Lonning P, Borresen-Dale AL: Geneexpression patterns of breast carcinomas distinguish tumorsubclasses with clinical implications. Proc Natl Acad Sci USA2001, 98:10869-10874.
3. Van 't Veer LJ, Dai H, van de Vijver MJ, He YD, Hart AA, Mao M,Peterse HL, van der Kooy K, Marton MJ, Witteveen AT, Schreiber GJ,Kerkhoven RM, Roberts C, Linsley PS, Bernards R, Friend SH: Gene
Additional file 1Top 20 prognostic pathways in ER-positive tumors. The data provided rep-resent the results of the Geneplot function in the Global test program. The contribution of each individual gene in the top 20 prognostic pathways with distant metastasis-free survival in ER-positive tumors is plotted.Click here for file[http://www.biomedcentral.com/content/supplementary/1471-2407-7-182-S1.pdf]
Additional file 2Significant genes in the top 20 prognostic pathways for ER-positive tumors. The data provided represent the contribution, standard deviation, and z-scores of each individual gene with distant metastasis-free survival in ER-positive tumors in the top 20 prognostic pathways.Click here for file[http://www.biomedcentral.com/content/supplementary/1471-2407-7-182-S2.pdf]
Additional file 3Top 20 prognostic pathways in ER-negative tumors. The data provided represent the results of the Geneplot function in the Global test program. The contribution of each individual gene in the top 20 prognostic path-ways with distant metastasis-free survival in ER-negative tumors is plot-ted.Click here for file[http://www.biomedcentral.com/content/supplementary/1471-2407-7-182-S3.pdf]
Additional file 4Significant genes in the top 20 prognostic pathways for ER-negative tumors. The data provided represent the contribution, standard deviation, and z-scores of each individual gene with distant metastasis-free survival in ER-negative tumors in the top 20 prognostic pathways.Click here for file[http://www.biomedcentral.com/content/supplementary/1471-2407-7-182-S4.pdf]
Page 13 of 14(page number not for citation purposes)
BMC Cancer 2007, 7:182 http://www.biomedcentral.com/1471-2407/7/182
Publish with BioMed Central and every scientist can read your work free of charge
"BioMed Central will be the most significant development for disseminating the results of biomedical research in our lifetime."
Sir Paul Nurse, Cancer Research UK
Your research papers will be:
available free of charge to the entire biomedical community
peer reviewed and published immediately upon acceptance
cited in PubMed and archived on PubMed Central
yours — you keep the copyright
Submit your manuscript here:http://www.biomedcentral.com/info/publishing_adv.asp
BioMedcentral
expression profiling predicts clinical outcome of breast can-cer. Nature 2002, 415:530-536.
4. Sorlie T, Tibshirani R, Parker J, Hastie T, Marron JS, Nobel A, Deng S,Johnsen H, Pesich R, Geisler S, Demeter J, Perou CM, Lønning PE,Brown PO, Børresen-Dale AL, Botstein D: Repeated observationof breast tumor subtypes in independent gene expressiondata sets. Proc Natl Acad Sci USA 2003, 100:8418-8423.
5. Sotiriou C, Neo SY, McShane LM, Korn EL, Long PM, Jazaeri A, Mar-tiat P, Fox SB, Harris AL, Liu ET: Breast cancer classification andprognosis based on gene expression profiles from a popula-tion-based study. Proc Natl Acad Sci USA 2003, 100:10393-10398.
6. Brenton JD, Carey LA, Ahmed AA, Caldas C: Molecular classifica-tion and molecular forecasting of breast cancer: ready forclinical application? J Clin Oncol 2005, 23:7350-7360.
7. Jansen MP, Foekens JA, van Staveren IL, Dirkzwager-Kiel MM, RitstierK, Look MP, Meijer-van Gelder ME, Sieuwerts AM, Portengen H,Dorssers LC, Klijn JG, Berns EM: Molecular classification oftamoxifen-resistant breast carcinomas by gene expressionprofiling. J Clin Oncol 2005, 23:732-740.
8. Wang Y, Klijn JG, Zhang Y, Sieuwerts AM, Look MP, Yang F, TalantovD, Timmermans M, Meijer-van Gelder ME, Yu J, Jatkoe T, Berns EM,Atkins D, Foekens JA: Gene-expression profiles to predict dis-tant metastasis of lymph-node-negative primary breast can-cer. Lancet 2005, 365:671-679.
9. Smid M, Wang Y, Klijn JG, Sieuwerts AM, Zhang Y, Atkins D, MartensJW, Foekens JA: Genes associated with breast cancer meta-static to bone. J Clin Oncol 2006, 24:2261-2267.
10. Michiels S, Koscielny S, Hill C: Prediction of cancer outcomewith microarrays: a multiple random validation strategy.Lancet 2005, 365:488-492.
11. Simon R: Development and evaluation of therapeutically rel-evant predictive classifiers using gene expression profiling. JNatl Cancer Inst 2006, 98:1169-1171.
12. Goeman JJ, van de Geer SA, de Kort F, van Houwelingen HC: A glo-bal test for groups of genes: testing association with a clinicaloutcome. Bioinformatics 2004, 20:93-99.
13. Vogelstein B, Kinzler KW: Cancer genes and the pathways theycontrol. Nat Med 2004, 10:789-799.
14. Goeman JJ, Oosting J, Cleton-Jansen AM, Anninga JK, van Houwelin-gen HC: Testing association of a pathway with survival usinggene expression data. Bioinformatics 2005, 21:1950-1957.
15. Segal E, Friedman N, Kaminski N, Regev A, Koller D: From signa-tures to models: understanding cancer using microarrays.Nat Genet 2005:S38-45.
16. Subramanian A, Tamayo P, Mootha VK, Mukherjee S, Ebert BL, Gil-lette MA, Paulovich A, Pomeroy SL, Golub TR, Lander ES, Mesirov JP:Gene set enrichment analysis: a knowledge-based approachfor interpreting genome-wide expression profiles. Proc NatlAcad Sci USA 2005, 102:15545-15550.
17. Tian L, Greenberg SA, Kong SW, Altschuler J, Kohane IS, Park PJ: Dis-covering statistically significant pathways in expression pro-filing studies. Proc Natl Acad Sci USA 2005, 102:13544-13549.
18. Adler AS, Lin M, Horlings H, Nuyten DS, van de Vijver MJ, Chang HY:Genetic regulators of large-scale transcriptional signaturesin cancer. Nat Genet 2006, 38:421-430.
19. Tinker AV, Boussioutas A, Bowtell DD: The challenges of geneexpression microarrays for the study of human cancer. Can-cer Cell 2006, 9:333-339.
20. [http://www.fmwv.nl].21. Foekens JA, Atkins D, Zhang Y, Sweep FC, Harbeck N, Paradiso A,
Cufer T, Sieuwerts AM, Talantov D, Span PN, Tjan-Heijnen VC, ZitoAF, Specht K, Hoefler H, Golouh R, Schittulli F, Schmitt M, Beex LV,Klijn JG, Wang Y: Multicenter validation of a gene expression-based prognostic signature in lymph node-negative primarybreast cancer. J Clin Oncol 2006, 24:1665-1671.
22. Foekens JA, Portengen H, van Putten WL, Trapman AM, Reubi JC,Alexieva-Figusch J, Klijn JGM: Prognostic value of receptors forinsulin-like growth factor 1, somatostatin, and epidermalgrowth factor in human breast cancer. Cancer Res 1989,49:7002-7009.
23. Sotiriou C, Wirapati P, Loi S, Harris A, Fox S, Smeds J, Nordgren H,Farmer P, Praz V, Haibe-Kains B, Desmedt C, Larsimont D, CardosoF, Peterse H, Nuyten D, Buyse M, van de Vijver MJ, Bergh J, Piccart M,Delorenzi M: Gene expression profiling in breast cancer:understanding the molecular basis of histologic grade toimprove prognosis. J Natl Cancer Inst 2006, 98:262-272.
24. [http://www.affymetrix.com].25. Paik S, Shak S, Tang G, Kim C, Baker J, Cronin M, Baehner FL, Walker
MG, Watson D, Park T, Hiller W, Fisher ER, Wickerham DL, BrynatJ, Wolmark N: A multigene assay to predict recurrence oftamoxifen-treated, node-negative breast cancer. N Engl J Med2004, 351:2817-2826.
26. Yu K, Lee CH, Tan PH, Hong GS, Wee SB, Wong CY, Tan P: Amolecular signature of the Nottingham prognostic index inbreast cancer. Cancer Res 2004, 64:2962-2968.
27. Gruvberger S, Ringner M, Chen Y, Panavally S, Saal LH, Borg A, FernoM, Peterson C, Meltzer PS: Estrogen receptor status in breastcancer is associated with remarkably distinct gene expres-sion patterns. Cancer Res 2001, 61:5979-5984.
28. Fan C, Oh DS, Wessels L, Weigelt B, Nuyten DS, Nobel AB, van'tVeer LJ, Perou CM: Concordance among gene-expression-based predictors for breast cancer. N Engl J Med 2006,355:560-569.
29. van de Vijver MJ, He YD, van't Veer LJ, Dai H, Hart AA, Voskuil DW,Schreiber GJ, Peterse JL, Roberts C, Marton MJ, Parrish M, Atsma D,Witteveen A, Glas A, Delahaye L, van der Velde T, Bartelink H,Rodenhuis S, Rutgers ET, Friend SH, Bernards R: A gene-expres-sion signature as a predictor of survival in breast cancer. NEngl J Med 2002, 347:1999-2009.
30. West RB, Nuyten DS, Subramanian S, Nielsen TO, Corless CL, RubinBP, Montgomery K, Zhu S, Patel R, Hernandez-Boussard T, GoldblumJR, Brown PO, van de Vijver M, van de Rijn M: Determination ofstromal signatures in breast carcinoma. PLoS Biol 2005, 3:e187.
31. Winter SC, Buffa FM, Silva P, Miller C, Valentine HR, Turley H, ShahKA, Cox GJ, Corbridge RJ, Homer JJ, Musgrove R, Slevin N, Sloan P,Price P, West CM, Harris AL: Relation of a hypoxia metagenederived from head and neck cancer to prognosis of multiplecancers. Cancer Res 2007, 67:3441-3449.
32. Massague J: Sorting out breast-cancer gene signatures. N EnglJ Med 2007, 356:294-297.
Pre-publication historyThe pre-publication history for this paper can be accessedhere:
http://www.biomedcentral.com/1471-2407/7/182/prepub
Page 14 of 14(page number not for citation purposes)
http://www.ncbi.nlm.nih.gov/entrez/query.fcgi?cmd=Retrieve&db=PubMed&dopt=Abstract&list_uids=2555057
http://www.ncbi.nlm.nih.gov/entrez/query.fcgi?cmd=Retrieve&db=PubMed&dopt=Abstract&list_uids=2555057


