Blueprint for Academic Excellence in the University of ... · PDF fileBlueprint for Academic...
26
1 Blueprint for Academic Excellence in the University of South Carolina School of Medicine (SOM) 2015-2016 6 April 2015
Transcript of Blueprint for Academic Excellence in the University of ... · PDF fileBlueprint for Academic...
1
Blueprint for Academic Excellence in the University of South Carolina
School of Medicine (SOM)
2015-2016
6 April 2015
2
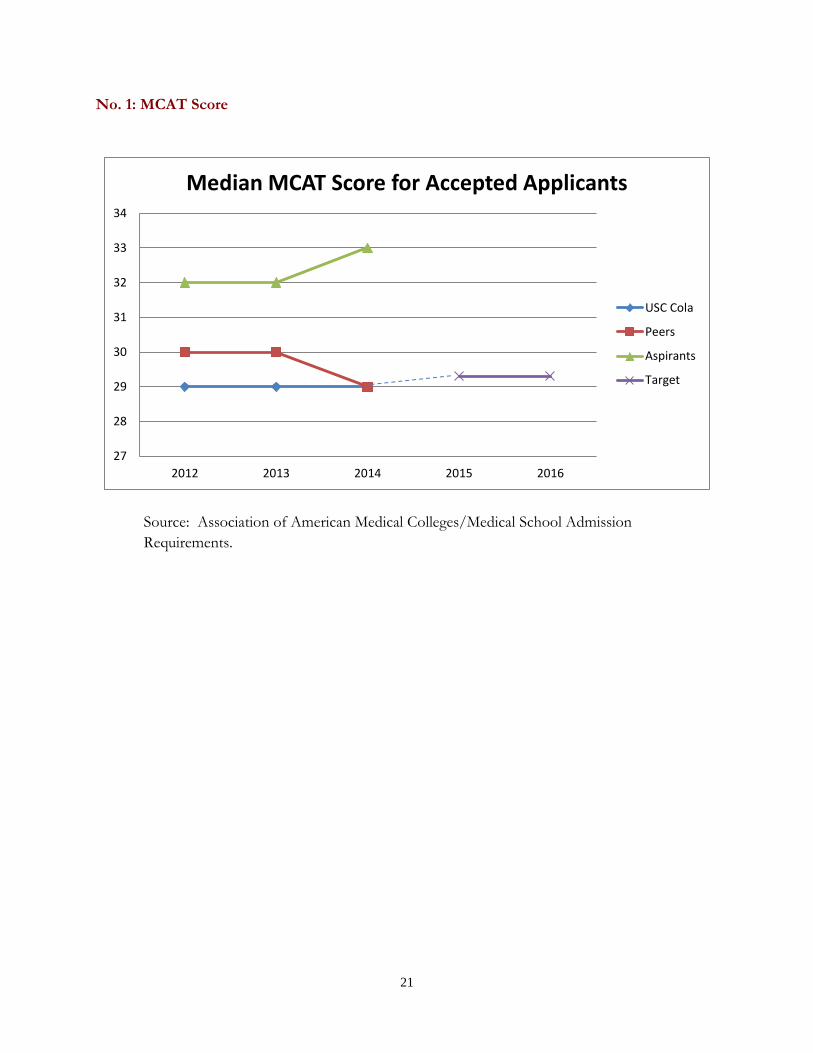
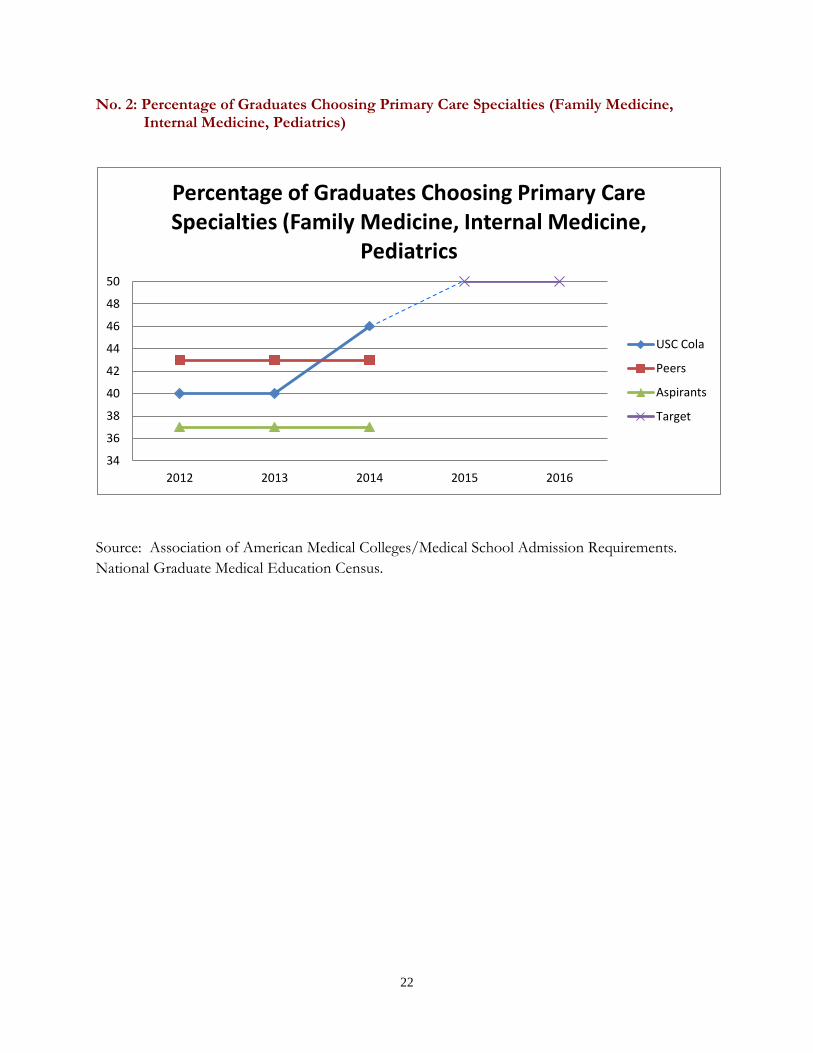
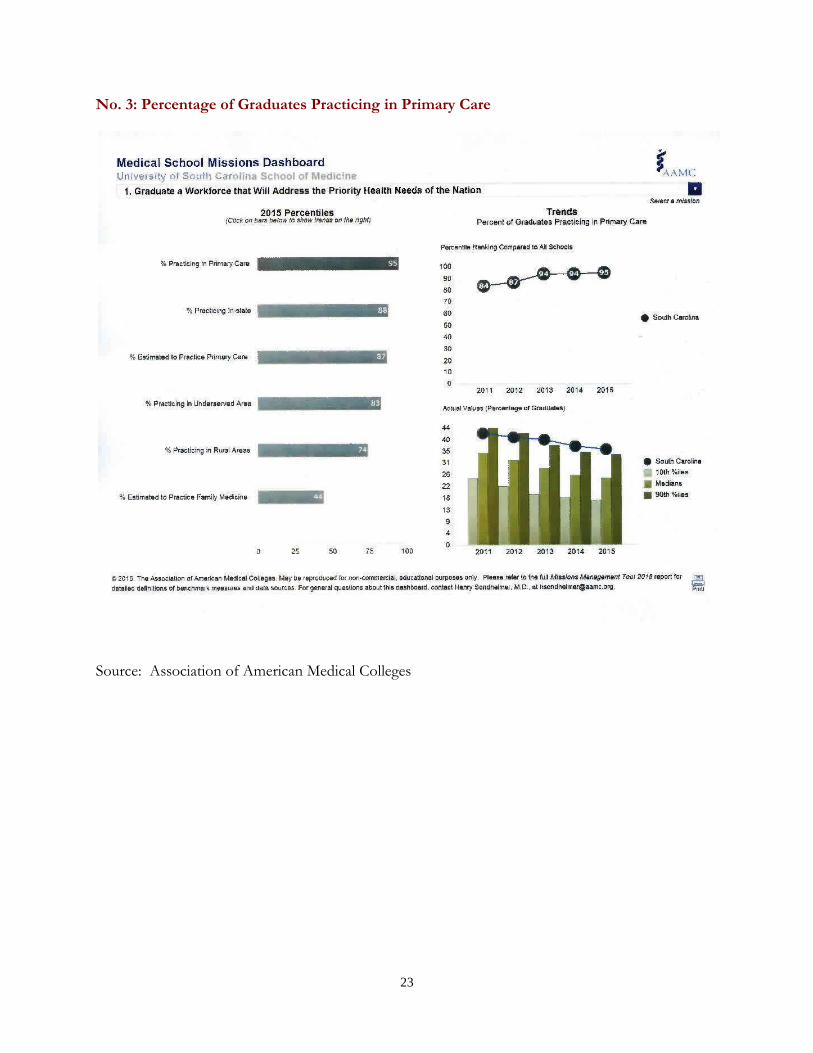
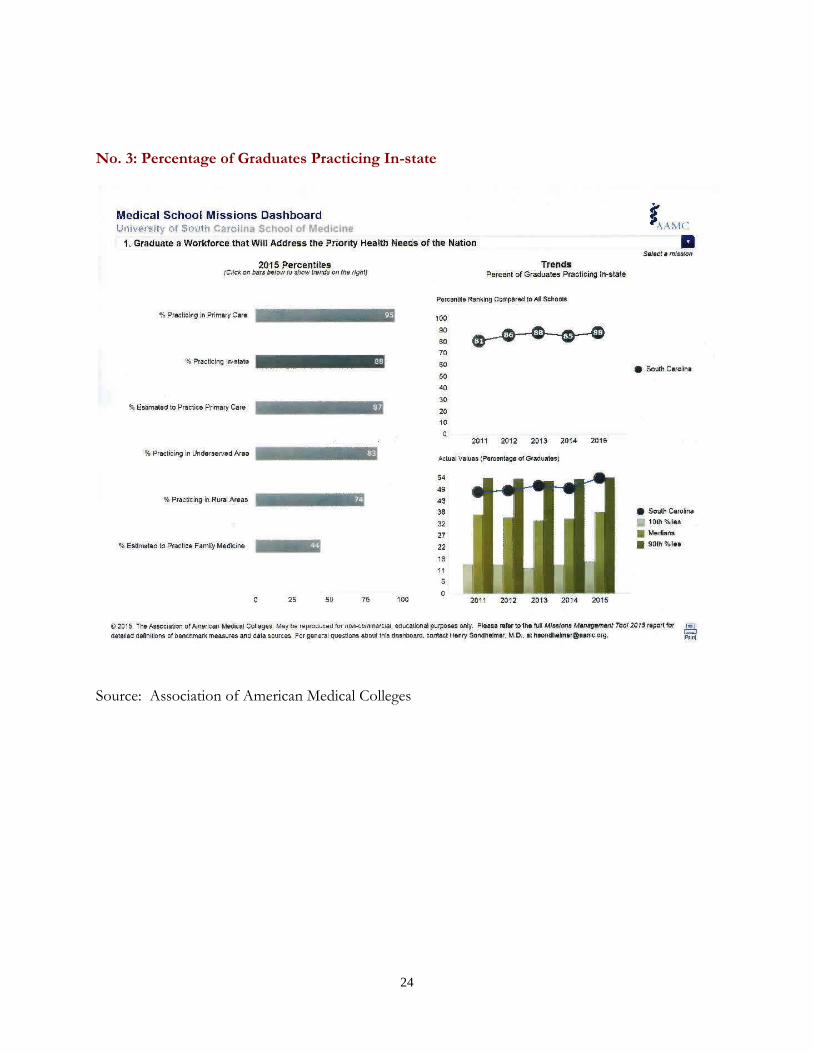
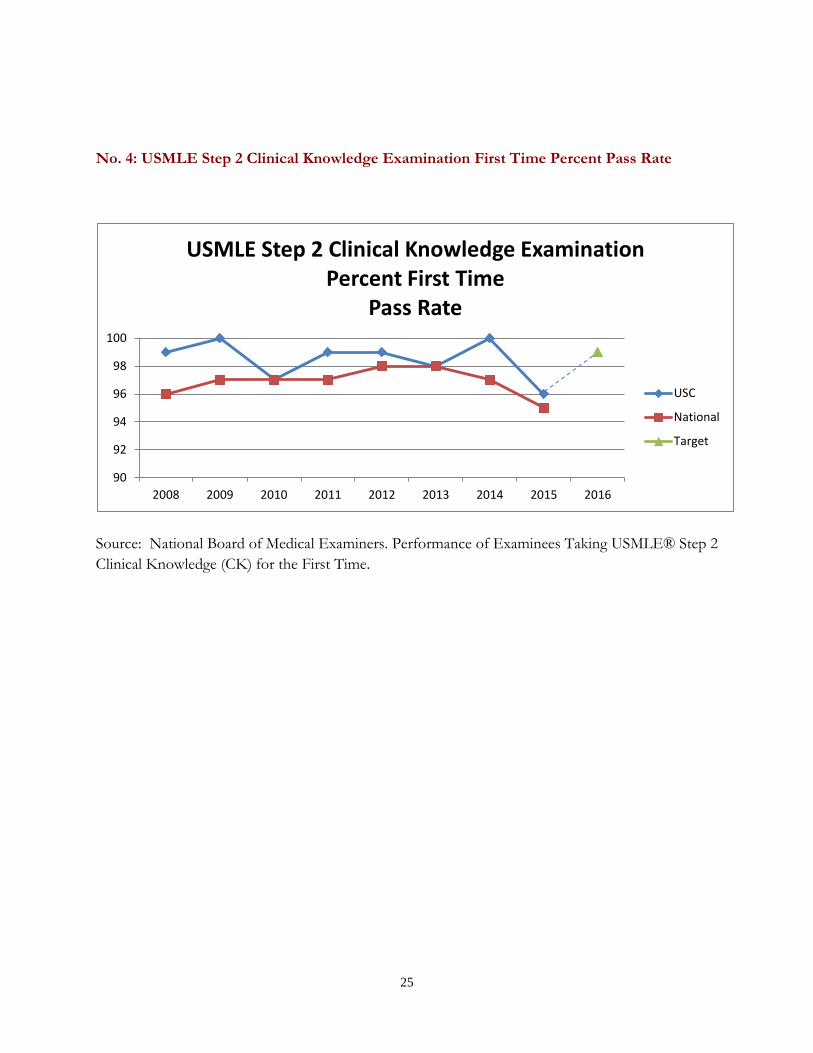
Section I. Executive Summary School of Medicine Contributions to Meeting the Academic Dashboard Targets Since it only enrolls post-baccalaureate students, many of the University Academic Dashboard targets are inapplicable to the School of Medicine. The School of Medicine (SOM) uses the following items for its Dashboard (Appendix G). 1. MCAT score – The SOM median MCAT score for accepted applicants held steady at 29 compared to its peers (29) and its aspirants (33). 2. Percentage of Graduates Choosing Primary Care Specialties (Family Medicine, Internal Medicine, Pediatrics) – The percentage of SOM graduates choosing primary care specialties (46%) increased this year to surpass its peers (43%). This percentage also remains higher than its aspirants (37%). 3. Percentage of Graduates Practicing in Primary Care and Practicing In-state – The SOM ranks in the 95th percentile nationally for percent of graduates practicing in primary care and ranks in the 88th percentile nationally for percent of graduates practicing in-state. 4. United States Medical Licensing Examination (USMLE) Step 2 Clinical Knowledge First Time Percent Pass Rate – The 96% first time pass rate of SOM graduates exceeded the national average this year of 95%.
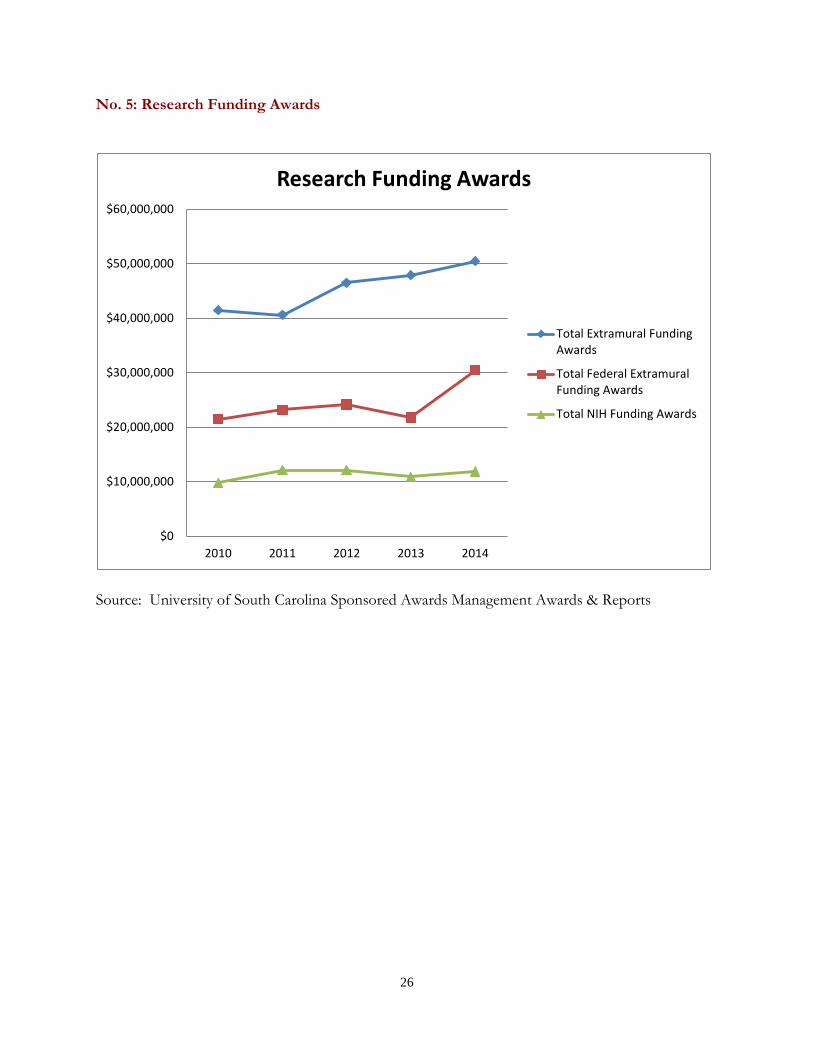
5. Research Awards – SOM extramural funding awards increased to $50.4 million with federal research funding at ~$30.5 million and over 35% of the federal funding being from NIH awards. School of Medicine Contributions to Key Performance Parameters Teaching Excellence – The SOM collaborated with other health sciences schools to expand inter-professional education by adding Genetic Counseling students, continued to be a leader in ultrasound education, completed strategic planning for curriculum innovation, and partnered with South Carolina Honors College to create a seven-year accelerated medical degree program. Research/scholarship reputation and productivity - The SOM has fostered research collaborations and interdisciplinary research resulting in extramural funding increasing to over $50M, and expanded its research in telemedicine, stroke, health disparities, and personalized medicine. The SOM is nearing completion of a search for a new Associate Dean for Research who will oversee basic science research and growth of translational and clinical research as the Palmetto Health-USC Medical Group is formed. Service to state, community, profession and university- The SOM has provided exceptional clinical care to patients in the community, opened a state-of-the-art orthopaedic and sports medicine clinic at Baptist Parkridge Hospital, initiated the CenteringPregnancy program, and formed partnerships with Francis Marion University, McLeod Regional Medical Center, and Carolinas Health System to establish medical student clinical rotations in Florence for the regional campus. Sustainability – The SOM established a stronger financial base through the Palmetto Health-USC Medical Group, new clinical affiliations with hospitals, and stronger communication with Dorn VA.
3
Section II. Meeting the University’s Academic Dashboard Targets School of Medicine Contributions to Meeting the Academic Dashboard Targets Since it only enrolls post-baccalaureate students, many of the University Academic Dashboard targets are inapplicable to the School of Medicine. The School of Medicine uses the following items for its Dashboard (Appendix G). 1. MCAT score – The School of Medicine median MCAT score for accepted applicants held steady at 29 compared to its peers (29) and its aspirants (33). 2015-16 Strategy – Optimize student recruitment strategies including a more personal approach to the admissions process and emphasis on the uniqueness of our ultrasound program and the Florence option. Increase SOM endowment to provide additional tuition scholarships for academically gifted and underrepresented minority students. 2. Percentage of Graduates Choosing Primary Care Specialties (Family Medicine, Internal Medicine, Pediatrics) – The percentage of School of Medicine graduates choosing primary care specialties (46%) increased this year to surpass its peers (43%). This percentage also remains higher than its aspirants (37%). 2015-16 Strategy – Maintain commitment to current rural primary care training sites and seek additional sites which provide students with first-hand experience in rural practice. Continue inclusion of Primary Care Week in curriculum. Encourage faculty participation in the Institute for Primary Care Education and Practice, an initiative from the South Carolina Area Health Education Consortium. Implement third year medical student rotations in Florence with a focus on primary care. 3. Percentage of Graduates Practicing in Primary Care and Practicing In-state – The School of Medicine ranks in the 95th percentile nationally for percent of graduates practicing in primary care and ranks in the 88th percentile nationally for percent of graduates practicing in-state.
2015-16 Strategy – Maintain commitment to rural primary care training sites which provide students with first-hand experience in rural practice. Continue inclusion of Primary Care Week in curriculum. Encourage faculty participation in the Institute for Primary Care Education and Practice, an initiative from the South Carolina Area Health Education Consortium. Introduce third year medical students to rural practice environments through their clinical rotations in Florence and potentially other rural practice sites in South Carolina. The leadership/community institute in Florence program will emphasize the joys, benefits, positives of practicing in rural areas.
4. United States Medical Licensing Examination (USMLE) Step 2 Clinical Knowledge First Time Percent Pass Rate and Mean Score – The 96% first time pass rate of School of Medicine graduates exceeded the national average of 95%. 2015-16 Strategy – Will continue to provide multiple opportunities for formative evaluation of clinical knowledge through the use of internal and end of clerkship subject exams plus the provision
4
of a low teaching faculty-student ratio. Time will be provided in the fourth year schedule to allow students adequate preparation for the exam. 5. Research Awards – School of Medicine extramural funding awards increased to a total of over $50.4 million with federal research funding (NIH, NSF, HHS) at $30.5 million and over 35% of federal funding coming from NIH awards. 2015-16 Strategy – Secure a joint leadership appointment of the new Associate Dean for Research within Palmetto Health System, promoting synergy in translational and clinical research programs. Expand and enhance research infrastructure by completing renovation of Building One research space and SOM animal resource facility, plus leasing research space from VA. Promote research collaborations with VA Medical Center by seeking additional VA eligibility for SOM faculty and negotiating an agreement with the VA for sharing newly renovated VA research space, sharing equipment, and creating a research center of combined research strengths of SOM and the VAMC.
5
Section III. School of Medicine Goals and their Contribution to the University’s Key Performance Parameters 2015-2016 Academic Year Goals
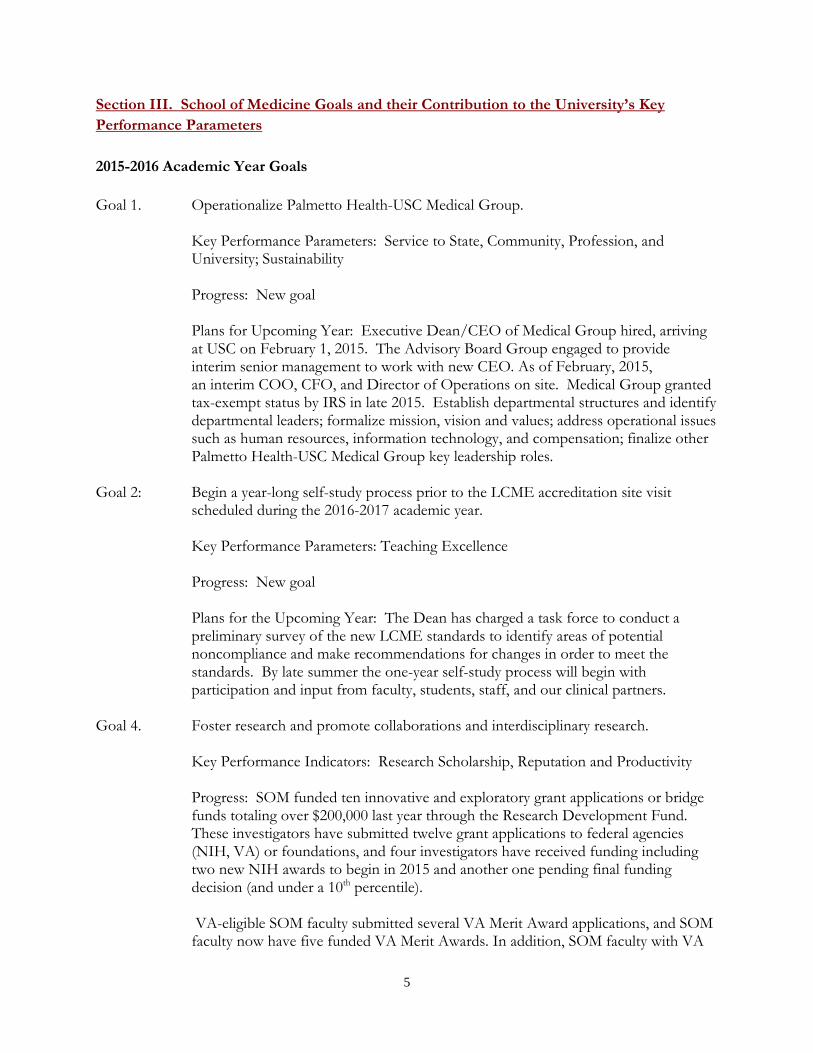
Goal 1. Operationalize Palmetto Health-USC Medical Group.
Key Performance Parameters: Service to State, Community, Profession, and University; Sustainability Progress: New goal Plans for Upcoming Year: Executive Dean/CEO of Medical Group hired, arriving at USC on February 1, 2015. The Advisory Board Group engaged to provide interim senior management to work with new CEO. As of February, 2015, an interim COO, CFO, and Director of Operations on site. Medical Group granted tax-exempt status by IRS in late 2015. Establish departmental structures and identify departmental leaders; formalize mission, vision and values; address operational issues such as human resources, information technology, and compensation; finalize other Palmetto Health-USC Medical Group key leadership roles. Goal 2: Begin a year-long self-study process prior to the LCME accreditation site visit scheduled during the 2016-2017 academic year. Key Performance Parameters: Teaching Excellence Progress: New goal Plans for the Upcoming Year: The Dean has charged a task force to conduct a preliminary survey of the new LCME standards to identify areas of potential noncompliance and make recommendations for changes in order to meet the standards. By late summer the one-year self-study process will begin with participation and input from faculty, students, staff, and our clinical partners. Goal 4. Foster research and promote collaborations and interdisciplinary research. Key Performance Indicators: Research Scholarship, Reputation and Productivity Progress: SOM funded ten innovative and exploratory grant applications or bridge funds totaling over $200,000 last year through the Research Development Fund. These investigators have submitted twelve grant applications to federal agencies (NIH, VA) or foundations, and four investigators have received funding including two new NIH awards to begin in 2015 and another one pending final funding decision (and under a 10th percentile). VA-eligible SOM faculty submitted several VA Merit Award applications, and SOM faculty now have five funded VA Merit Awards. In addition, SOM faculty with VA
6
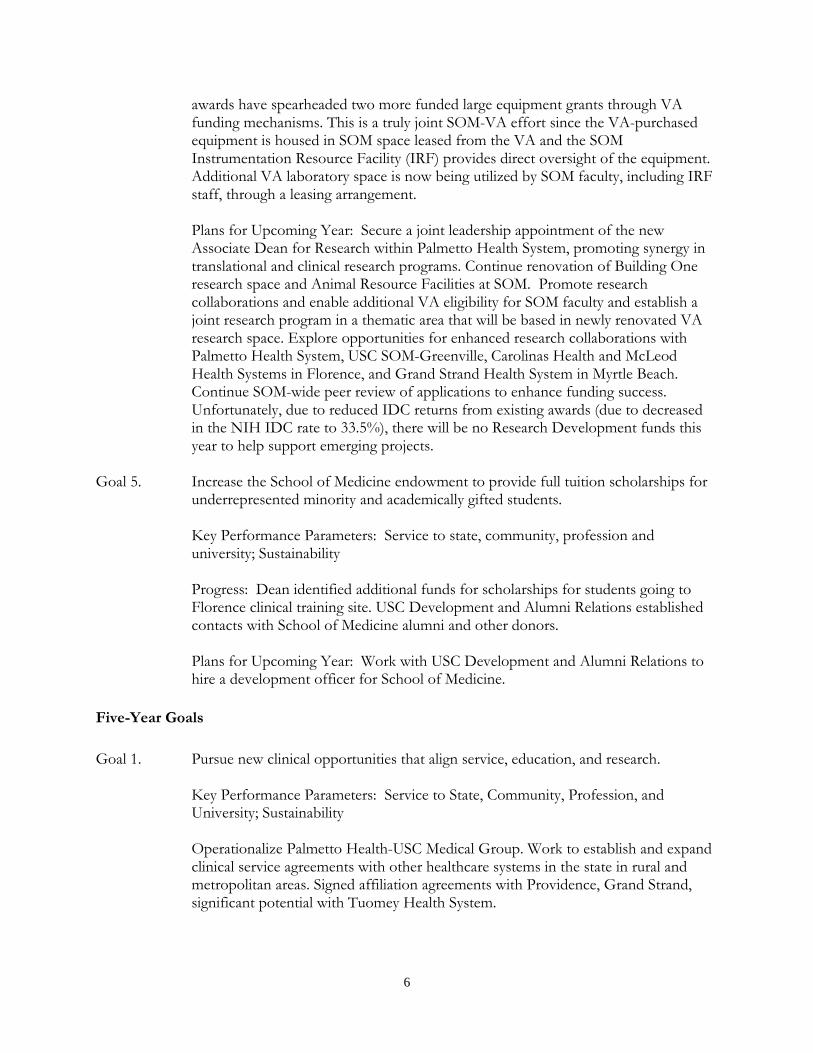
awards have spearheaded two more funded large equipment grants through VA funding mechanisms. This is a truly joint SOM-VA effort since the VA-purchased equipment is housed in SOM space leased from the VA and the SOM Instrumentation Resource Facility (IRF) provides direct oversight of the equipment. Additional VA laboratory space is now being utilized by SOM faculty, including IRF staff, through a leasing arrangement. Plans for Upcoming Year: Secure a joint leadership appointment of the new Associate Dean for Research within Palmetto Health System, promoting synergy in translational and clinical research programs. Continue renovation of Building One research space and Animal Resource Facilities at SOM. Promote research collaborations and enable additional VA eligibility for SOM faculty and establish a joint research program in a thematic area that will be based in newly renovated VA research space. Explore opportunities for enhanced research collaborations with Palmetto Health System, USC SOM-Greenville, Carolinas Health and McLeod Health Systems in Florence, and Grand Strand Health System in Myrtle Beach. Continue SOM-wide peer review of applications to enhance funding success. Unfortunately, due to reduced IDC returns from existing awards (due to decreased in the NIH IDC rate to 33.5%), there will be no Research Development funds this year to help support emerging projects. Goal 5. Increase the School of Medicine endowment to provide full tuition scholarships for underrepresented minority and academically gifted students. Key Performance Parameters: Service to state, community, profession and
university; Sustainability
Progress: Dean identified additional funds for scholarships for students going to Florence clinical training site. USC Development and Alumni Relations established contacts with School of Medicine alumni and other donors.
Plans for Upcoming Year: Work with USC Development and Alumni Relations to hire a development officer for School of Medicine. Five-Year Goals Goal 1. Pursue new clinical opportunities that align service, education, and research.
Key Performance Parameters: Service to State, Community, Profession, and University; Sustainability Operationalize Palmetto Health-USC Medical Group. Work to establish and expand clinical service agreements with other healthcare systems in the state in rural and metropolitan areas. Signed affiliation agreements with Providence, Grand Strand, significant potential with Tuomey Health System.
7
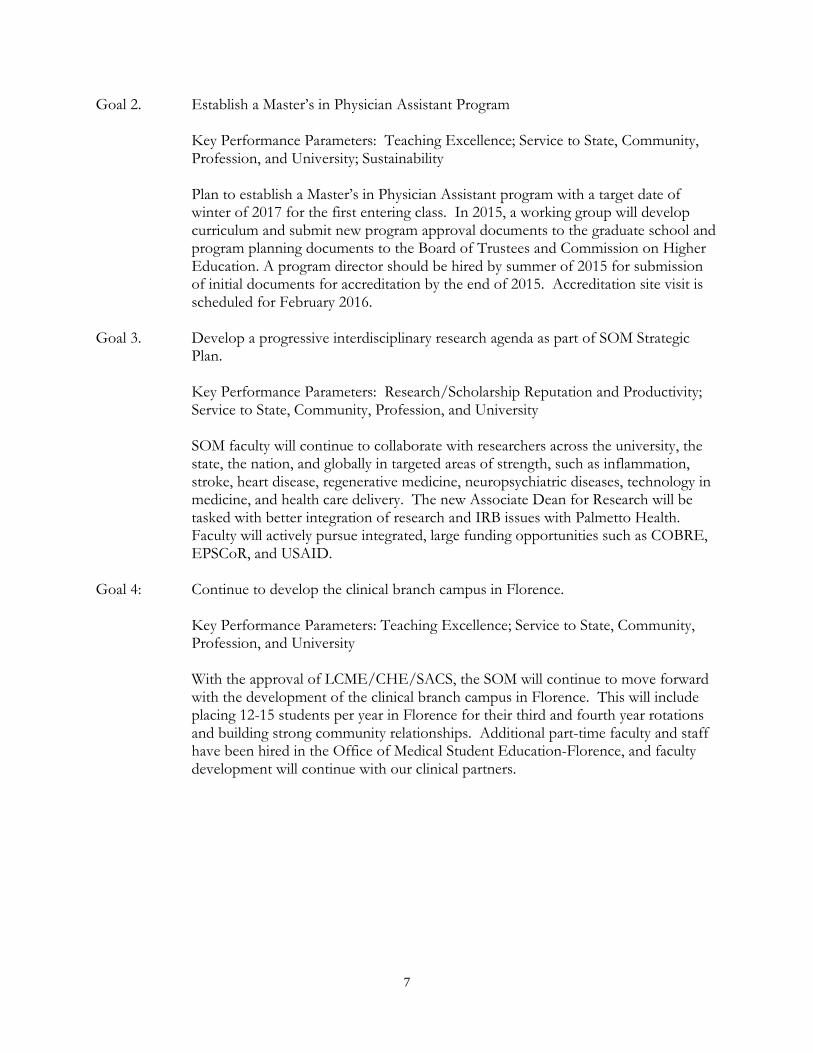
Goal 2. Establish a Master’s in Physician Assistant Program
Key Performance Parameters: Teaching Excellence; Service to State, Community, Profession, and University; Sustainability Plan to establish a Master’s in Physician Assistant program with a target date of winter of 2017 for the first entering class. In 2015, a working group will develop curriculum and submit new program approval documents to the graduate school and program planning documents to the Board of Trustees and Commission on Higher Education. A program director should be hired by summer of 2015 for submission of initial documents for accreditation by the end of 2015. Accreditation site visit is scheduled for February 2016.
Goal 3. Develop a progressive interdisciplinary research agenda as part of SOM Strategic
Plan. Key Performance Parameters: Research/Scholarship Reputation and Productivity; Service to State, Community, Profession, and University SOM faculty will continue to collaborate with researchers across the university, the state, the nation, and globally in targeted areas of strength, such as inflammation, stroke, heart disease, regenerative medicine, neuropsychiatric diseases, technology in medicine, and health care delivery. The new Associate Dean for Research will be tasked with better integration of research and IRB issues with Palmetto Health. Faculty will actively pursue integrated, large funding opportunities such as COBRE, EPSCoR, and USAID. Goal 4: Continue to develop the clinical branch campus in Florence.
Key Performance Parameters: Teaching Excellence; Service to State, Community, Profession, and University With the approval of LCME/CHE/SACS, the SOM will continue to move forward with the development of the clinical branch campus in Florence. This will include placing 12-15 students per year in Florence for their third and fourth year rotations and building strong community relationships. Additional part-time faculty and staff have been hired in the Office of Medical Student Education-Florence, and faculty development will continue with our clinical partners.

8
Section IV. Appendices
9
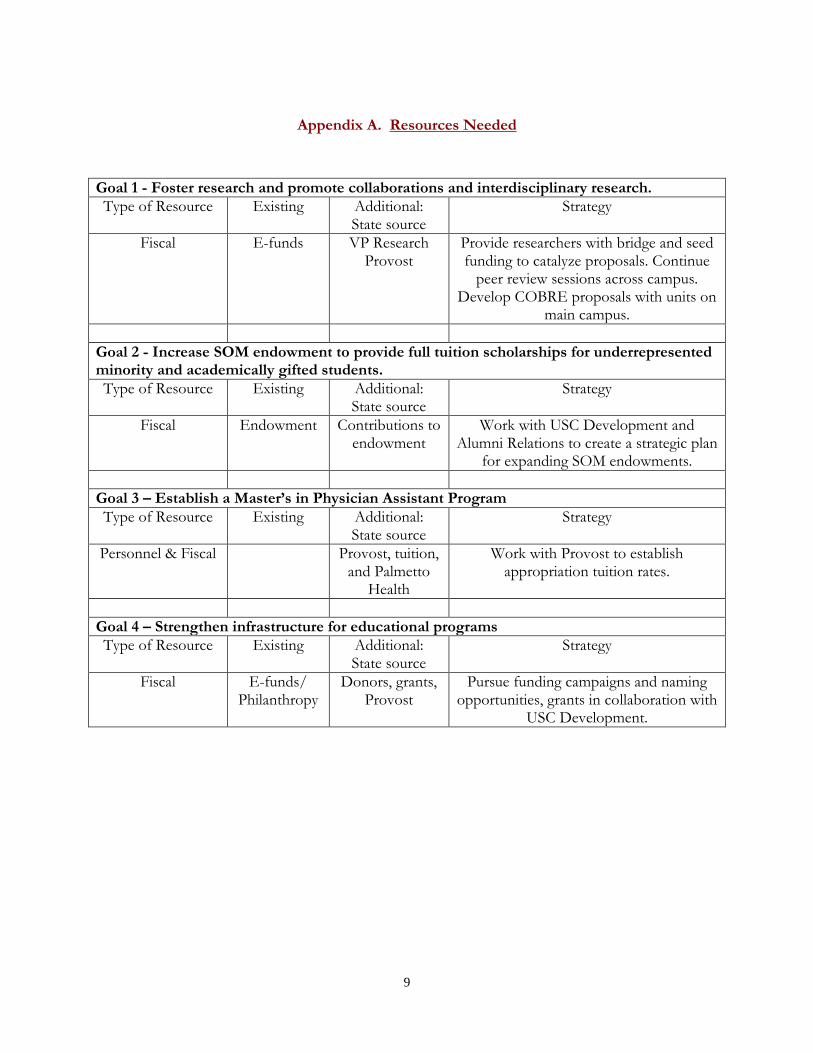
Appendix A. Resources Needed
Goal 1 - Foster research and promote collaborations and interdisciplinary research. Type of Resource Existing Additional:
State source Strategy
Fiscal E-funds VP Research Provost
Provide researchers with bridge and seed funding to catalyze proposals. Continue
peer review sessions across campus. Develop COBRE proposals with units on
main campus.
Goal 2 - Increase SOM endowment to provide full tuition scholarships for underrepresented minority and academically gifted students. Type of Resource Existing Additional:
State source Strategy
Fiscal Endowment Contributions to endowment
Work with USC Development and Alumni Relations to create a strategic plan
for expanding SOM endowments.
Goal 3 – Establish a Master’s in Physician Assistant Program Type of Resource Existing Additional:
State source Strategy
Personnel & Fiscal Provost, tuition, and Palmetto
Health
Work with Provost to establish appropriation tuition rates.
Goal 4 – Strengthen infrastructure for educational programs Type of Resource Existing Additional:
State source Strategy
Fiscal E-funds/ Philanthropy
Donors, grants, Provost
Pursue funding campaigns and naming opportunities, grants in collaboration with
USC Development.
10
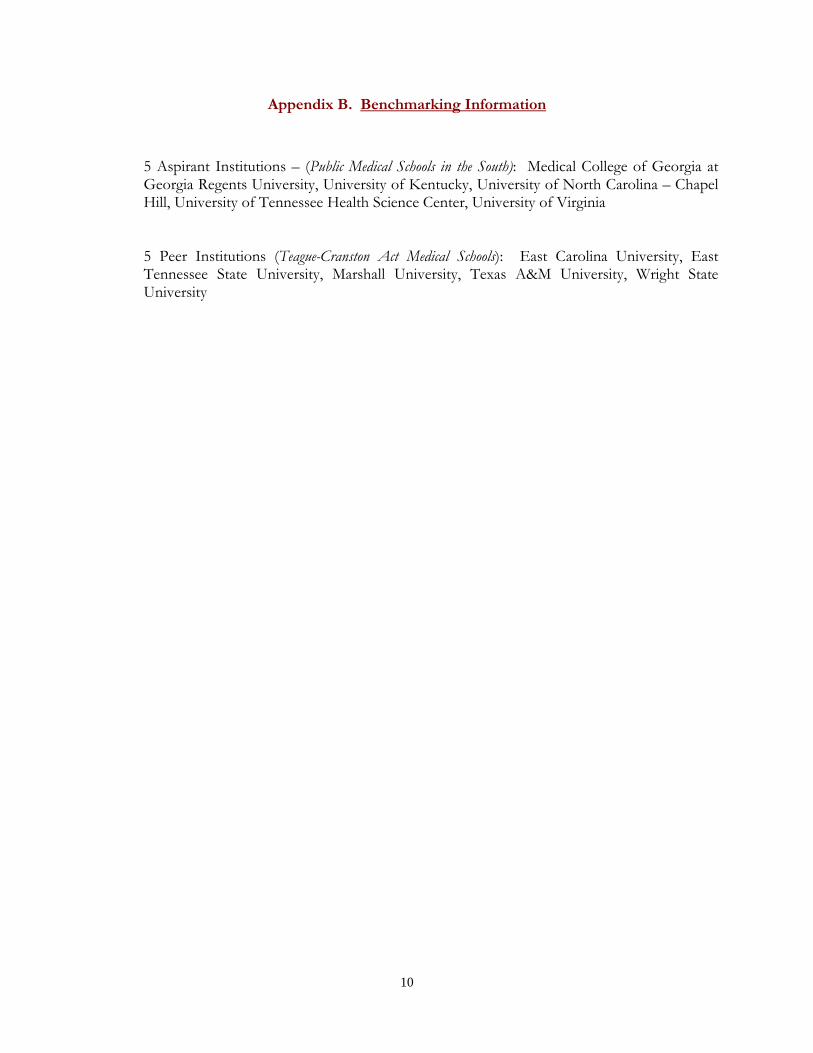
Appendix B. Benchmarking Information
5 Aspirant Institutions – (Public Medical Schools in the South): Medical College of Georgia at Georgia Regents University, University of Kentucky, University of North Carolina – Chapel Hill, University of Tennessee Health Science Center, University of Virginia
5 Peer Institutions (Teague-Cranston Act Medical Schools): East Carolina University, East Tennessee State University, Marshall University, Texas A&M University, Wright State University
11
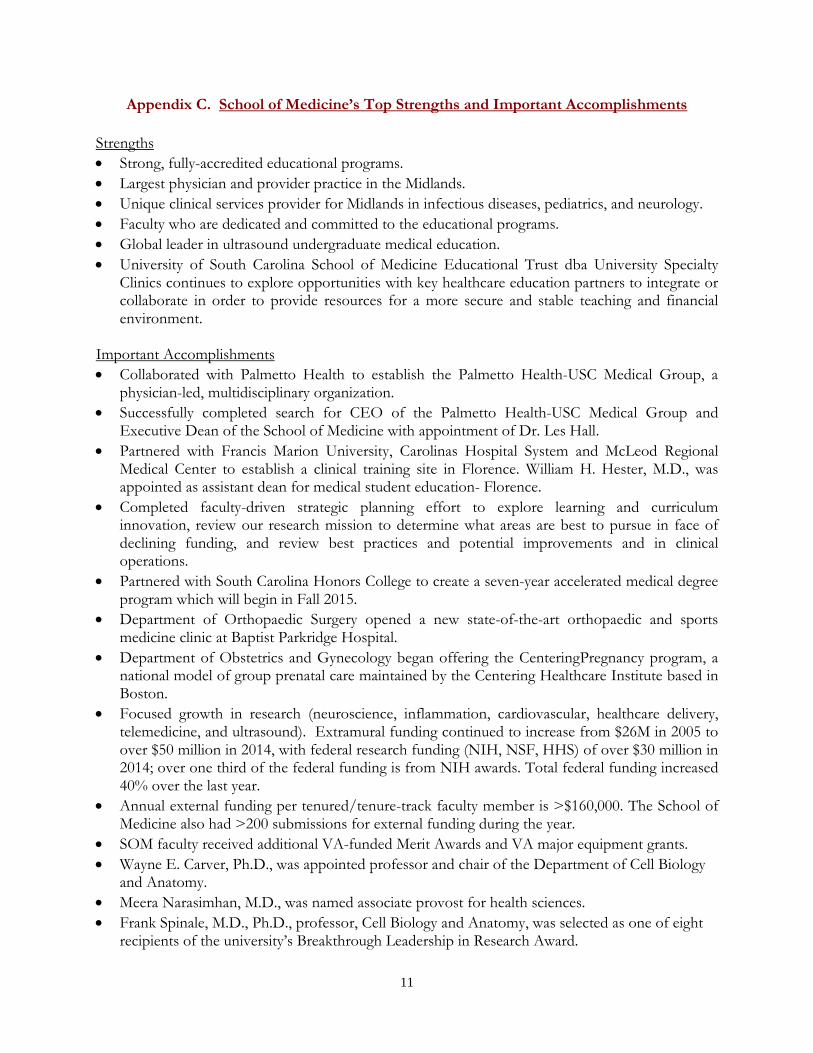
Appendix C. School of Medicine’s Top Strengths and Important Accomplishments Strengths • Strong, fully-accredited educational programs. • Largest physician and provider practice in the Midlands. • Unique clinical services provider for Midlands in infectious diseases, pediatrics, and neurology. • Faculty who are dedicated and committed to the educational programs. • Global leader in ultrasound undergraduate medical education. • University of South Carolina School of Medicine Educational Trust dba University Specialty
Clinics continues to explore opportunities with key healthcare education partners to integrate or collaborate in order to provide resources for a more secure and stable teaching and financial environment.
Important Accomplishments • Collaborated with Palmetto Health to establish the Palmetto Health-USC Medical Group, a
physician-led, multidisciplinary organization. • Successfully completed search for CEO of the Palmetto Health-USC Medical Group and
Executive Dean of the School of Medicine with appointment of Dr. Les Hall. • Partnered with Francis Marion University, Carolinas Hospital System and McLeod Regional
Medical Center to establish a clinical training site in Florence. William H. Hester, M.D., was appointed as assistant dean for medical student education- Florence.
• Completed faculty-driven strategic planning effort to explore learning and curriculum innovation, review our research mission to determine what areas are best to pursue in face of declining funding, and review best practices and potential improvements and in clinical operations.
• Partnered with South Carolina Honors College to create a seven-year accelerated medical degree program which will begin in Fall 2015.
• Department of Orthopaedic Surgery opened a new state-of-the-art orthopaedic and sports medicine clinic at Baptist Parkridge Hospital.
• Department of Obstetrics and Gynecology began offering the CenteringPregnancy program, a national model of group prenatal care maintained by the Centering Healthcare Institute based in Boston.
• Focused growth in research (neuroscience, inflammation, cardiovascular, healthcare delivery, telemedicine, and ultrasound). Extramural funding continued to increase from $26M in 2005 to over $50 million in 2014, with federal research funding (NIH, NSF, HHS) of over $30 million in 2014; over one third of the federal funding is from NIH awards. Total federal funding increased 40% over the last year.
• Annual external funding per tenured/tenure-track faculty member is >$160,000. The School of Medicine also had >200 submissions for external funding during the year.
• SOM faculty received additional VA-funded Merit Awards and VA major equipment grants. • Wayne E. Carver, Ph.D., was appointed professor and chair of the Department of Cell Biology
and Anatomy. • Meera Narasimhan, M.D., was named associate provost for health sciences. • Frank Spinale, M.D., Ph.D., professor, Cell Biology and Anatomy, was selected as one of eight
recipients of the university’s Breakthrough Leadership in Research Award.
12
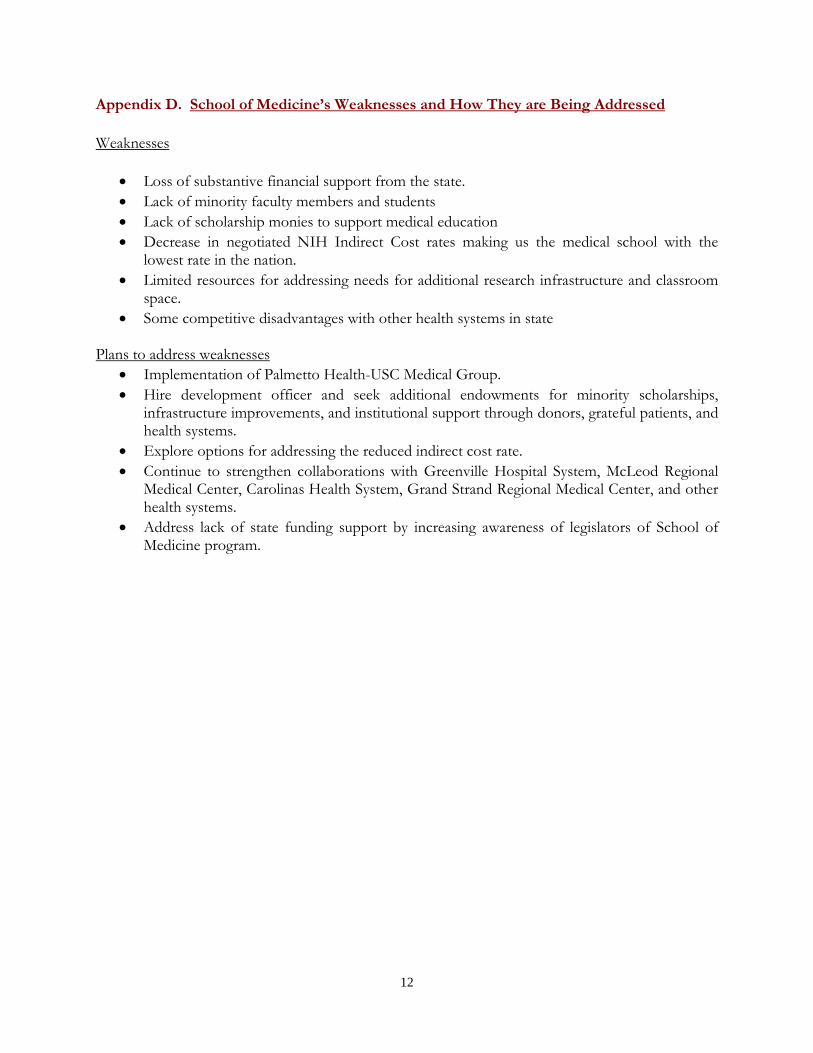
Appendix D. School of Medicine’s Weaknesses and How They are Being Addressed Weaknesses
• Loss of substantive financial support from the state. • Lack of minority faculty members and students • Lack of scholarship monies to support medical education • Decrease in negotiated NIH Indirect Cost rates making us the medical school with the
lowest rate in the nation. • Limited resources for addressing needs for additional research infrastructure and classroom
space. • Some competitive disadvantages with other health systems in state
Plans to address weaknesses
• Implementation of Palmetto Health-USC Medical Group. • Hire development officer and seek additional endowments for minority scholarships,
infrastructure improvements, and institutional support through donors, grateful patients, and health systems.
• Explore options for addressing the reduced indirect cost rate. • Continue to strengthen collaborations with Greenville Hospital System, McLeod Regional
Medical Center, Carolinas Health System, Grand Strand Regional Medical Center, and other health systems.
• Address lack of state funding support by increasing awareness of legislators of School of Medicine program.
13
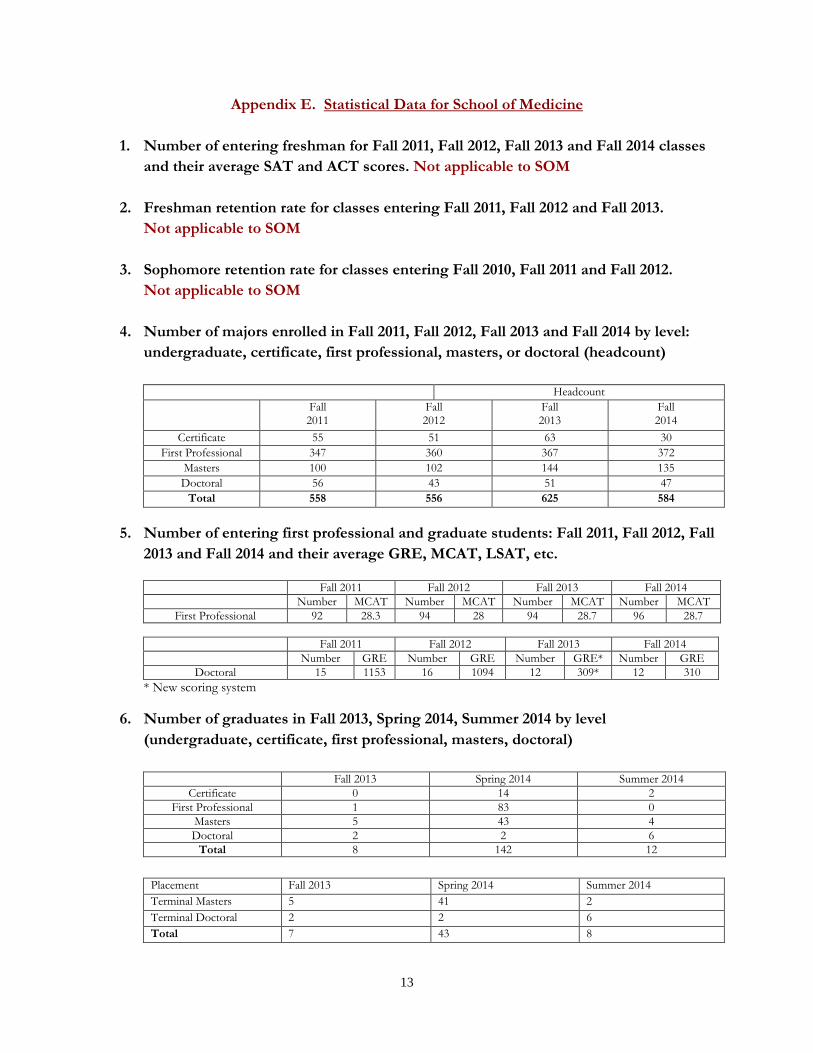
Appendix E. Statistical Data for School of Medicine
1. Number of entering freshman for Fall 2011, Fall 2012, Fall 2013 and Fall 2014 classes and their average SAT and ACT scores. Not applicable to SOM
2. Freshman retention rate for classes entering Fall 2011, Fall 2012 and Fall 2013.
Not applicable to SOM
3. Sophomore retention rate for classes entering Fall 2010, Fall 2011 and Fall 2012. Not applicable to SOM
4. Number of majors enrolled in Fall 2011, Fall 2012, Fall 2013 and Fall 2014 by level: undergraduate, certificate, first professional, masters, or doctoral (headcount)
Headcount
Fall 2011
Fall 2012
Fall 2013
Fall 2014
Certificate 55 51 63 30 First Professional 347 360 367 372
Masters 100 102 144 135 Doctoral 56 43 51 47
Total 558 556 625 584
5. Number of entering first professional and graduate students: Fall 2011, Fall 2012, Fall 2013 and Fall 2014 and their average GRE, MCAT, LSAT, etc.
Fall 2011 Fall 2012 Fall 2013 Fall 2014 Number MCAT Number MCAT Number MCAT Number MCAT
First Professional 92 28.3 94 28 94 28.7 96 28.7
Fall 2011 Fall 2012 Fall 2013 Fall 2014 Number GRE Number GRE Number GRE* Number GRE
Doctoral 15 1153 16 1094 12 309* 12 310 * New scoring system
6. Number of graduates in Fall 2013, Spring 2014, Summer 2014 by level (undergraduate, certificate, first professional, masters, doctoral)
Fall 2013 Spring 2014 Summer 2014
Certificate 0 14 2 First Professional 1 83 0
Masters 5 43 4 Doctoral 2 2 6
Total 8 142 12
Placement Fall 2013 Spring 2014 Summer 2014 Terminal Masters 5 41 2 Terminal Doctoral 2 2 6 Total 7 43 8
14
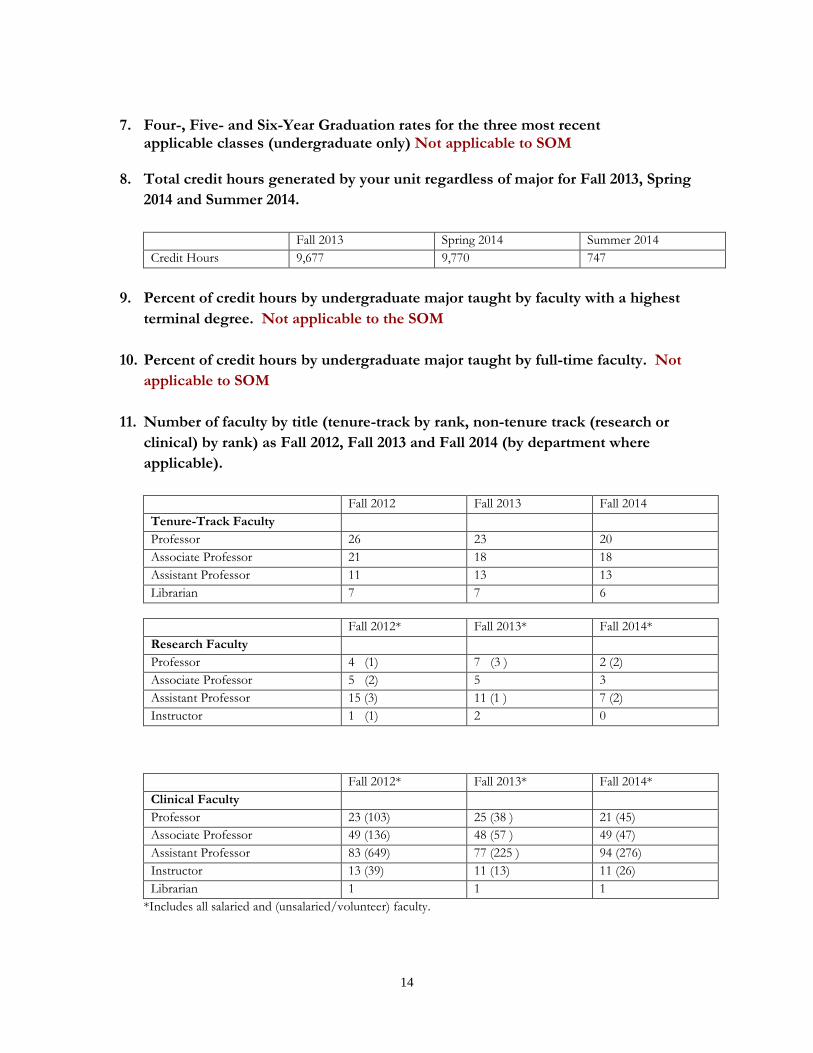
7. Four-, Five- and Six-Year Graduation rates for the three most recent
applicable classes (undergraduate only) Not applicable to SOM 8. Total credit hours generated by your unit regardless of major for Fall 2013, Spring
2014 and Summer 2014.
Fall 2013 Spring 2014 Summer 2014 Credit Hours 9,677 9,770 747
9. Percent of credit hours by undergraduate major taught by faculty with a highest
terminal degree. Not applicable to the SOM
10. Percent of credit hours by undergraduate major taught by full-time faculty. Not applicable to SOM
11. Number of faculty by title (tenure-track by rank, non-tenure track (research or
clinical) by rank) as Fall 2012, Fall 2013 and Fall 2014 (by department where applicable).
Fall 2012 Fall 2013 Fall 2014 Tenure-Track Faculty Professor 26 23 20 Associate Professor 21 18 18 Assistant Professor 11 13 13 Librarian 7 7 6
Fall 2012* Fall 2013* Fall 2014* Research Faculty Professor 4 (1) 7 (3 ) 2 (2) Associate Professor 5 (2) 5 3 Assistant Professor 15 (3) 11 (1 ) 7 (2) Instructor 1 (1) 2 0
Fall 2012* Fall 2013* Fall 2014* Clinical Faculty Professor 23 (103) 25 (38 ) 21 (45) Associate Professor 49 (136) 48 (57 ) 49 (47) Assistant Professor 83 (649) 77 (225 ) 94 (276) Instructor 13 (39) 11 (13) 11 (26) Librarian 1 1 1
*Includes all salaried and (unsalaried/volunteer) faculty.
15
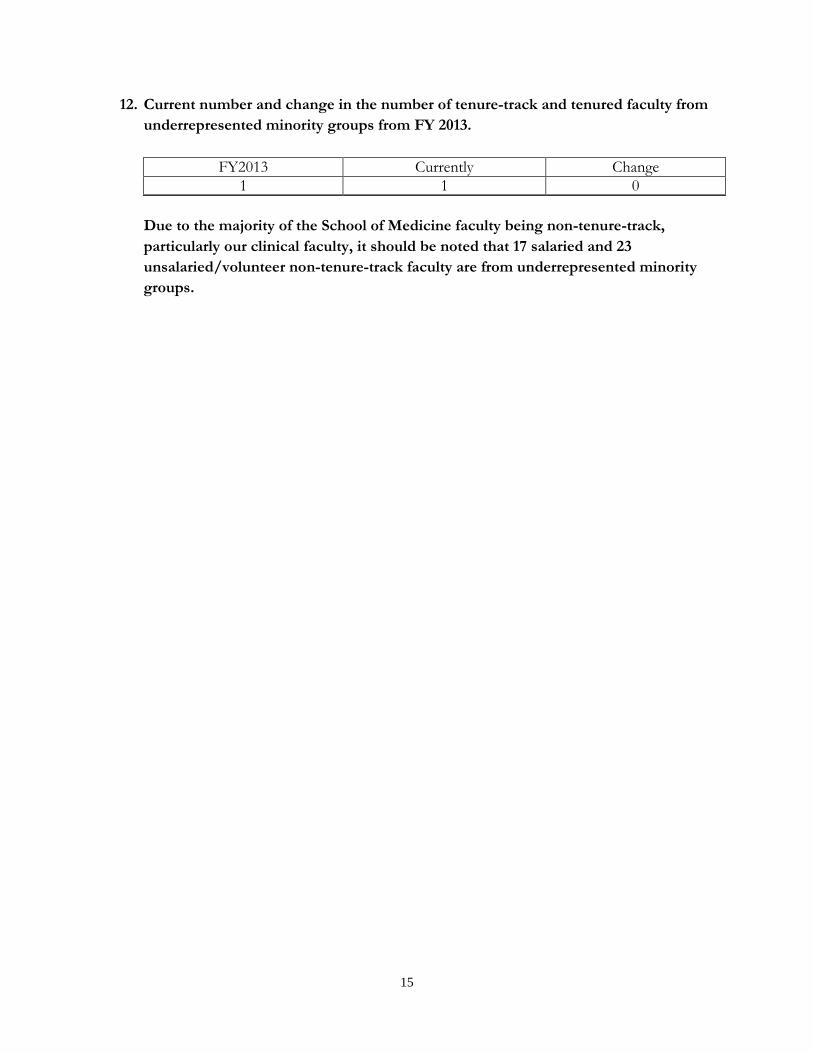
12. Current number and change in the number of tenure-track and tenured faculty from underrepresented minority groups from FY 2013.
FY2013 Currently Change
1 1 0
Due to the majority of the School of Medicine faculty being non-tenure-track, particularly our clinical faculty, it should be noted that 17 salaried and 23 unsalaried/volunteer non-tenure-track faculty are from underrepresented minority groups.
16
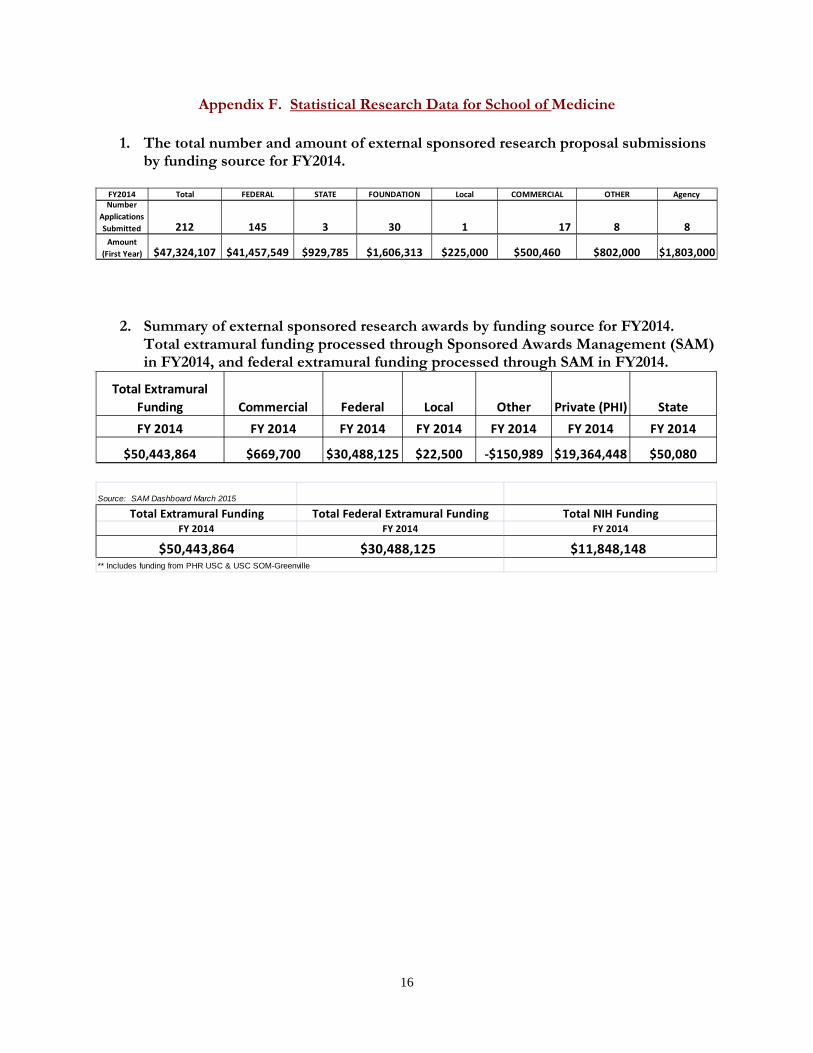
Appendix F. Statistical Research Data for School of Medicine
1. The total number and amount of external sponsored research proposal submissions by funding source for FY2014.
2. Summary of external sponsored research awards by funding source for FY2014.
Total extramural funding processed through Sponsored Awards Management (SAM) in FY2014, and federal extramural funding processed through SAM in FY2014.
FY2014 Total FEDERAL STATE FOUNDATION Local COMMERCIAL OTHER Agency
8
Number Applications Submitted
Amount (First Year)
212 145 3 30 17
$47,324,107 $41,457,549 $929,785 $1,606,313 $500,460 $802,000 $1,803,000
1
$225,000
8
Total Extramural Funding Commercial Federal Local Other Private (PHI) StateFY 2014 FY 2014 FY 2014 FY 2014 FY 2014 FY 2014 FY 2014
$50,443,864 $669,700 $30,488,125 $22,500 -$150,989 $19,364,448 $50,080
Source: SAM Dashboard March 2015
Total Extramural Funding Total Federal Extramural Funding Total NIH FundingFY 2014 FY 2014 FY 2014
$50,443,864 $30,488,125 $11,848,148** Includes funding from PHR USC & USC SOM-Greenville
17
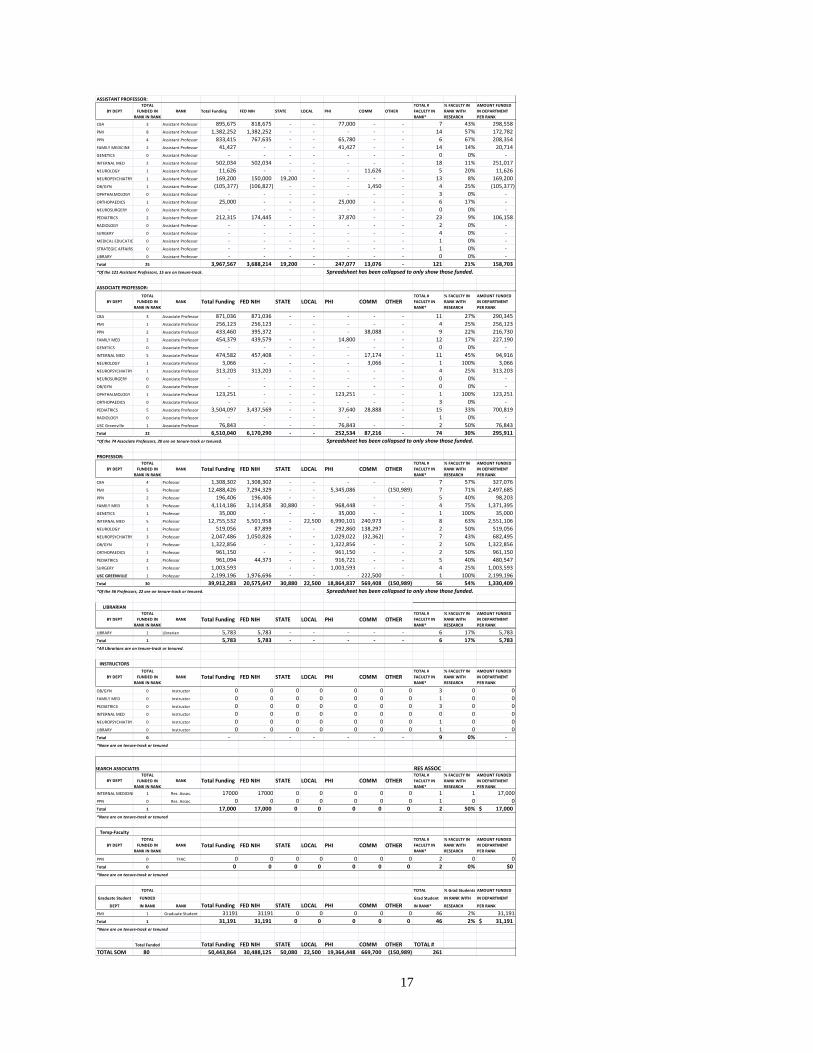
ASSISTANT PROFESSOR:
BY DEPTTOTAL
FUNDED IN RANK IN RANK
RANK Total Funding FED NIH STATE LOCAL PHI COMM OTHERTOTAL # FACULTY IN RANK*
% FACULTY IN RANK WITH RESEARCH
AMOUNT FUNDED IN DEPARTMENT PER RANK
CBA 3 Assistant Professor 895,675 818,675 - - 77,000 - - 7 43% 298,558 PMI 8 Assistant Professor 1,382,252 1,382,252 - - - - - 14 57% 172,782 PPN 4 Assistant Professor 833,415 767,635 - - 65,780 - - 6 67% 208,354 FAMILY MEDICINE 2 Assistant Professor 41,427 - - - 41,427 - - 14 14% 20,714 GENETICS 0 Assistant Professor - - - - - - - 0 0% - INTERNAL MED 2 Assistant Professor 502,034 502,034 - - - - - 18 11% 251,017 NEUROLOGY 1 Assistant Professor 11,626 - - - - 11,626 - 5 20% 11,626 NEUROPSYCHIATRY 1 Assistant Professor 169,200 150,000 19,200 - - - - 13 8% 169,200 OB/GYN 1 Assistant Professor (105,377) (106,827) - - - 1,450 - 4 25% (105,377) OPHTHALMOLOGY 0 Assistant Professor - - - - - - - 3 0% - ORTHOPAEDICS 1 Assistant Professor 25,000 - - - 25,000 - - 6 17% - NEUROSURGERY 0 Assistant Professor - - - - - - - 0 0% - PEDIATRICS 2 Assistant Professor 212,315 174,445 - - 37,870 - - 23 9% 106,158 RADIOLOGY 0 Assistant Professor - - - - - - - 2 0% - SURGERY 0 Assistant Professor - - - - - - - 4 0% - MEDICAL EDUCATIO 0 Assistant Professor - - - - - - - 1 0% - STRATEGIC AFFAIRS 0 Assistant Professor - - - - - - - 1 0% - LIBRARY 0 Assistant Professor - - - - - - - 0 0% - Total 25 3,967,567 3,688,214 19,200 - 247,077 13,076 - 121 21% 158,703 *Of the 121 Assistant Professors, 15 are on tenure-track. Spreadsheet has been collapsed to only show those funded.
ASSOCIATE PROFESSOR:
BY DEPTTOTAL
FUNDED IN RANK IN RANK
RANK Total Funding FED NIH STATE LOCAL PHI COMM OTHERTOTAL # FACULTY IN RANK*
% FACULTY IN RANK WITH RESEARCH
AMOUNT FUNDED IN DEPARTMENT PER RANK
CBA 3 Associate Professor 871,036 871,036 - - - - - 11 27% 290,345 PMI 1 Associate Professor 256,123 256,123 - - - - - 4 25% 256,123 PPN 2 Associate Professor 433,460 395,372 - - 38,088 - 9 22% 216,730 FAMILY MED 2 Associate Professor 454,379 439,579 - - 14,800 - - 12 17% 227,190 GENETICS 0 Associate Professor - - - - - - - 0 0% - INTERNAL MED 5 Associate Professor 474,582 457,408 - - - 17,174 - 11 45% 94,916 NEUROLOGY 1 Associate Professor 3,066 - - - - 3,066 - 1 100% 3,066 NEUROPSYCHIATRY 1 Associate Professor 313,203 313,203 - - - - - 4 25% 313,203 NEUROSURGERY 0 Associate Professor - - - - - - - 0 0% - OB/GYN 0 Associate Professor - - - - - - - 0 0% - OPHTHALMOLOGY 1 Associate Professor 123,251 - - - 123,251 - - 1 100% 123,251 ORTHOPAEDICS 0 Associate Professor - - - - - - - 3 0% - PEDIATRICS 5 Associate Professor 3,504,097 3,437,569 - - 37,640 28,888 - 15 33% 700,819 RADIOLOGY 0 Associate Professor - - - - - - 1 0% - USC Greenville 1 Associate Professor 76,843 - - - 76,843 - - 2 50% 76,843 Total 22 6,510,040 6,170,290 - - 252,534 87,216 - 74 30% 295,911 *Of the 74 Associate Professors, 20 are on tenure-track or tenured. Spreadsheet has been collapsed to only show those funded.
PROFESSOR:
BY DEPTTOTAL
FUNDED IN RANK IN RANK
RANK Total Funding FED NIH STATE LOCAL PHI COMM OTHERTOTAL # FACULTY IN RANK*
% FACULTY IN RANK WITH RESEARCH
AMOUNT FUNDED IN DEPARTMENT PER RANK
CBA 4 Professor 1,308,302 1,308,302 - - - - - 7 57% 327,076 PMI 5 Professor 12,488,426 7,294,329 - - 5,345,086 (150,989) 7 71% 2,497,685 PPN 2 Professor 196,406 196,406 - - - - - 5 40% 98,203 FAMILY MED 3 Professor 4,114,186 3,114,858 30,880 - 968,448 - - 4 75% 1,371,395 GENETICS 1 Professor 35,000 - - - 35,000 - - 1 100% 35,000 INTERNAL MED 5 Professor 12,755,532 5,501,958 - 22,500 6,990,101 240,973 - 8 63% 2,551,106 NEUROLOGY 1 Professor 519,056 87,899 - - 292,860 138,297 - 2 50% 519,056 NEUROPSYCHIATRY 3 Professor 2,047,486 1,050,826 - - 1,029,022 (32,362) - 7 43% 682,495 OB/GYN 1 Professor 1,322,856 - - - 1,322,856 - - 2 50% 1,322,856 ORTHOPAEDICS 1 Professor 961,150 - - - 961,150 - - 2 50% 961,150 PEDIATRICS 2 Professor 961,094 44,373 - - 916,721 - - 5 40% 480,547 SURGERY 1 Professor 1,003,593 - - 1,003,593 - - 4 25% 1,003,593 USC GREENVILLE 1 Professor 2,199,196 1,976,696 - - - 222,500 - 1 100% 2,199,196 Total 30 39,912,283 20,575,647 30,880 22,500 18,864,837 569,408 (150,989) 56 54% 1,330,409 *Of the 56 Professors, 22 are on tenure-track or tenured. Spreadsheet has been collapsed to only show those funded.
LIBRARIAN
BY DEPTTOTAL
FUNDED IN RANK IN RANK
RANK Total Funding FED NIH STATE LOCAL PHI COMM OTHERTOTAL # FACULTY IN RANK*
% FACULTY IN RANK WITH RESEARCH
AMOUNT FUNDED IN DEPARTMENT PER RANK
LIBRARY 1 Librarian 5,783 5,783 - - - - - 6 17% 5,783 Total 1 5,783 5,783 - - - - - 6 17% 5,783 *All Librarians are on tenure-track or tenured.
INSTRUCTORS
BY DEPTTOTAL
FUNDED IN RANK IN RANK
RANK Total Funding FED NIH STATE LOCAL PHI COMM OTHERTOTAL # FACULTY IN RANK*
% FACULTY IN RANK WITH RESEARCH
AMOUNT FUNDED IN DEPARTMENT PER RANK
OB/GYN 0 Instructor 0 0 0 0 0 0 0 3 0 0FAMILY MED 0 Instructor 0 0 0 0 0 0 0 1 0 0PEDIATRICS 0 Instructor 0 0 0 0 0 0 0 3 0 0INTERNAL MED 0 Instructor 0 0 0 0 0 0 0 0 0 0NEUROPSYCHIATRY 0 Instructor 0 0 0 0 0 0 0 1 0 0LIBRARY 0 Instructor 0 0 0 0 0 0 0 1 0 0Total 0 - - - - - - - 9 0% - *None are on tenure-track or tenured
SEARCH ASSOCIATES RES ASSOC
BY DEPTTOTAL
FUNDED IN RANK IN RANK
RANK Total Funding FED NIH STATE LOCAL PHI COMM OTHERTOTAL # FACULTY IN RANK*
% FACULTY IN RANK WITH RESEARCH
AMOUNT FUNDED IN DEPARTMENT PER RANK
INTERNAL MEDICINE 1 Res. Assoc. 17000 17000 0 0 0 0 0 1 1 17,000PPN 0 Res. Assoc. 0 0 0 0 0 0 0 1 0 0Total 1 17,000 17,000 0 0 0 0 0 2 50% 17,000$ *None are on tenure-track or tenured
Temp-Faculty
BY DEPTTOTAL
FUNDED IN RANK IN RANK
RANK Total Funding FED NIH STATE LOCAL PHI COMM OTHERTOTAL # FACULTY IN RANK*
% FACULTY IN RANK WITH RESEARCH
AMOUNT FUNDED IN DEPARTMENT PER RANK
PPN 0 TFAC 0 0 0 0 0 0 0 2 0 0Total 0 0 0 0 0 0 0 0 2 0% $0*None are on tenure-track or tenured
TOTAL TOTAL % Grad Students AMOUNT FUNDED
Graduate Student FUNDED Grad Student IN RANK WITH IN DEPARTMENT
DEPT IN RANK RANK Total Funding FED NIH STATE LOCAL PHI COMM OTHER IN RANK* RESEARCH PER RANK
PMI 1 Graduate Student 31191 31191 0 0 0 0 0 46 2% 31,191Total 1 31,191 31,191 0 0 0 0 0 46 2% 31,191$ *None are on tenure-track or tenured
Total Funded Total Funding FED NIH STATE LOCAL PHI COMM OTHER TOTAL #TOTAL SOM 80 50,443,864 30,488,125 50,080 22,500 19,364,448 669,700 (150,989) 261
18
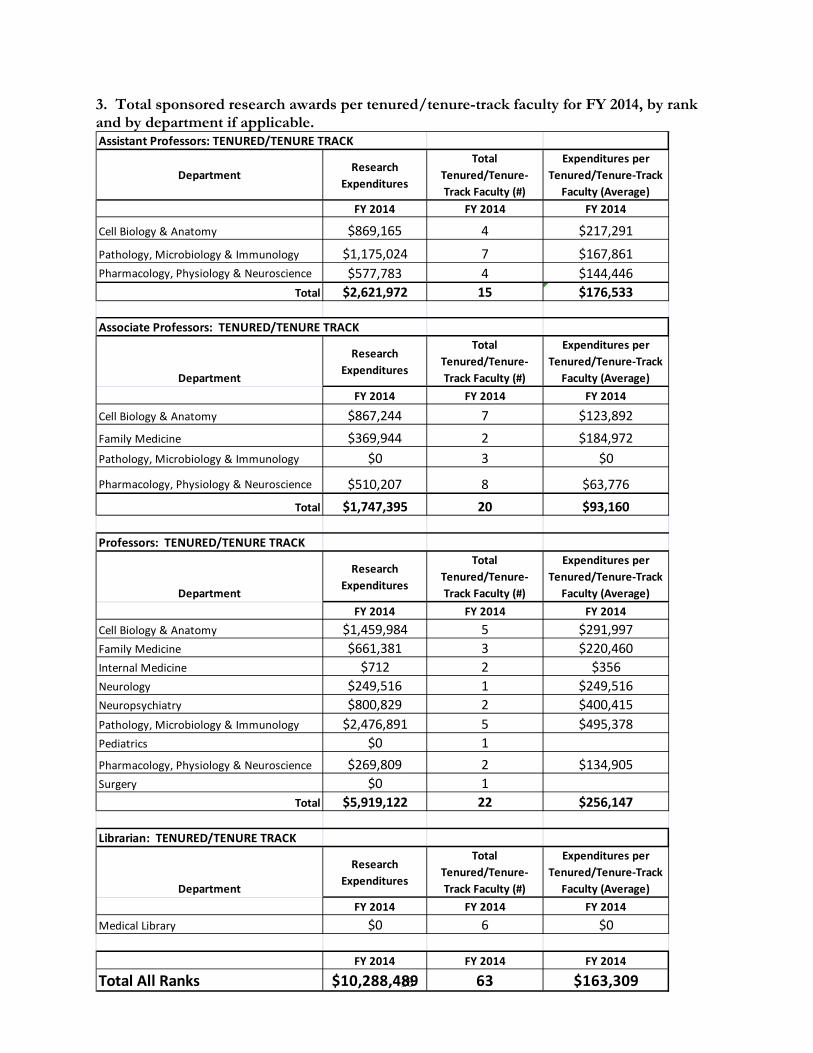
3. Total sponsored research awards per tenured/tenure-track faculty for FY 2014, by rank and by department if applicable.
Assistant Professors: TENURED/TENURE TRACK
DepartmentResearch
Expenditures
Total Tenured/Tenure-Track Faculty (#)
Expenditures per Tenured/Tenure-Track
Faculty (Average)FY 2014 FY 2014 FY 2014
Cell Biology & Anatomy $869,165 4 $217,291
Pathology, Microbiology & Immunology $1,175,024 7 $167,861Pharmacology, Physiology & Neuroscience $577,783 4 $144,446
Total $2,621,972 15 $176,533
Associate Professors: TENURED/TENURE TRACK
Department
Research Expenditures
Total Tenured/Tenure-Track Faculty (#)
Expenditures per Tenured/Tenure-Track
Faculty (Average)FY 2014 FY 2014 FY 2014
Cell Biology & Anatomy $867,244 7 $123,892Family Medicine $369,944 2 $184,972Pathology, Microbiology & Immunology $0 3 $0
Pharmacology, Physiology & Neuroscience $510,207 8 $63,776Total $1,747,395 20 $93,160
Professors: TENURED/TENURE TRACK
Department
Research Expenditures
Total Tenured/Tenure-Track Faculty (#)
Expenditures per Tenured/Tenure-Track
Faculty (Average)FY 2014 FY 2014 FY 2014
Cell Biology & Anatomy $1,459,984 5 $291,997Family Medicine $661,381 3 $220,460Internal Medicine $712 2 $356Neurology $249,516 1 $249,516Neuropsychiatry $800,829 2 $400,415Pathology, Microbiology & Immunology $2,476,891 5 $495,378Pediatrics $0 1Pharmacology, Physiology & Neuroscience $269,809 2 $134,905Surgery $0 1
Total $5,919,122 22 $256,147
Librarian: TENURED/TENURE TRACK
Department
Research Expenditures
Total Tenured/Tenure-Track Faculty (#)
Expenditures per Tenured/Tenure-Track
Faculty (Average)FY 2014 FY 2014 FY 2014
Medical Library $0 6 $0
FY 2014 FY 2014 FY 2014
Total All Ranks $10,288,489 63 $163,309
19
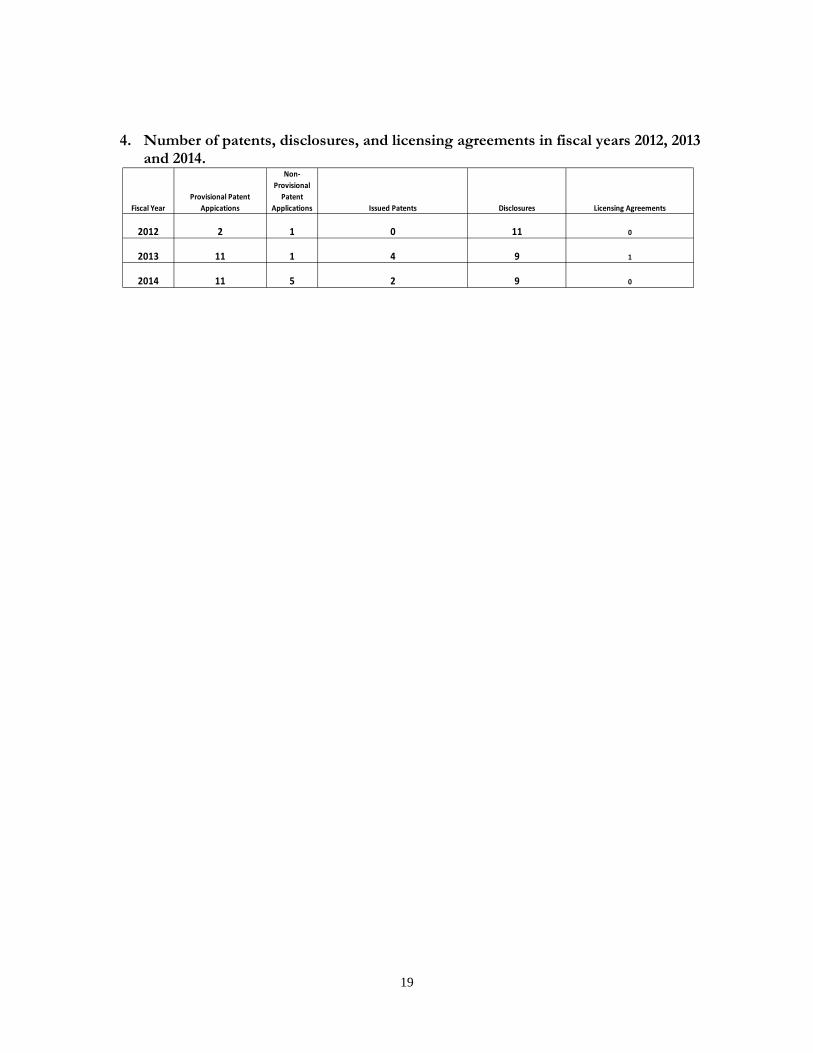
4. Number of patents, disclosures, and licensing agreements in fiscal years 2012, 2013 and 2014.
Fiscal YearProvisional Patent
Appications
Non-Provisional
Patent Applications Issued Patents Disclosures Licensing Agreements
2012 2 1 0 11 0
2013 11 1 4 9 1
2014 11 5 2 9 0
20
Appendix G. School of Medicine Academic Dashboard
Academic Dashboard Measures for School of Medicine 1. MCAT Score
2. Percentage of Graduates Choosing Primary Care Specialties (Family Medicine, Internal Medicine, Pediatrics)
3. Percentage of Graduates Practicing in Primary Care and Practicing In-state 4. United States Medical Licensing Examination (USMLE) Step 2 First Time Percent Pass Rate
5. Research Funding Awards
21
No. 1: MCAT Score
Source: Association of American Medical Colleges/Medical School Admission Requirements.
27
28
29
30
31
32
33
34
2012 2013 2014 2015 2016
Median MCAT Score for Accepted Applicants
USC Cola
Peers
Aspirants
Target
22
No. 2: Percentage of Graduates Choosing Primary Care Specialties (Family Medicine, Internal Medicine, Pediatrics)
Source: Association of American Medical Colleges/Medical School Admission Requirements. National Graduate Medical Education Census.
34
36
38
40
42
44
46
48
50
2012 2013 2014 2015 2016
Percentage of Graduates Choosing Primary Care Specialties (Family Medicine, Internal Medicine,
Pediatrics
USC Cola
Peers
Aspirants
Target
23
No. 3: Percentage of Graduates Practicing in Primary Care
Source: Association of American Medical Colleges
24
No. 3: Percentage of Graduates Practicing In-state
Source: Association of American Medical Colleges
25
No. 4: USMLE Step 2 Clinical Knowledge Examination First Time Percent Pass Rate
Source: National Board of Medical Examiners. Performance of Examinees Taking USMLE® Step 2 Clinical Knowledge (CK) for the First Time.
90
92
94
96
98
100
2008 2009 2010 2011 2012 2013 2014 2015 2016
USMLE Step 2 Clinical Knowledge Examination Percent First Time
Pass Rate
USC
National
Target
26
No. 5: Research Funding Awards
Source: University of South Carolina Sponsored Awards Management Awards & Reports
$0
$10,000,000
$20,000,000
$30,000,000
$40,000,000
$50,000,000
$60,000,000
2010 2011 2012 2013 2014
Research Funding Awards
Total Extramural FundingAwards
Total Federal ExtramuralFunding Awards
Total NIH Funding Awards