Blueprint Data Center - Siemens Data Center ... RTU´s, power quality meters and mid-size up to ......
12
Blueprint Data Center Systems and Applications for Data Center Siemens Industy
Transcript of Blueprint Data Center - Siemens Data Center ... RTU´s, power quality meters and mid-size up to ......
Blueprint Data Center
Systems and Applications for Data Center Siemens Industy
Blueprint Data Center Solutions and Applications Date: 21.03.2016
____________________________________________________________________________________________________________ Siemens IC SG EA LM Page 2 of 12
1. Overview / Purpose In EM EA the datacenter market is seen as one of the fastest growing of the energy businesses. This blueprint is designed to show the use of applications and systems of EM EA and SGS found within a typical data center projects. It provides a detailed view of the implementation of EM Products and Systems. 2. Data center structure and requirements Figure 1 (below) provides a typical graphical representation of a datacenter power grid.
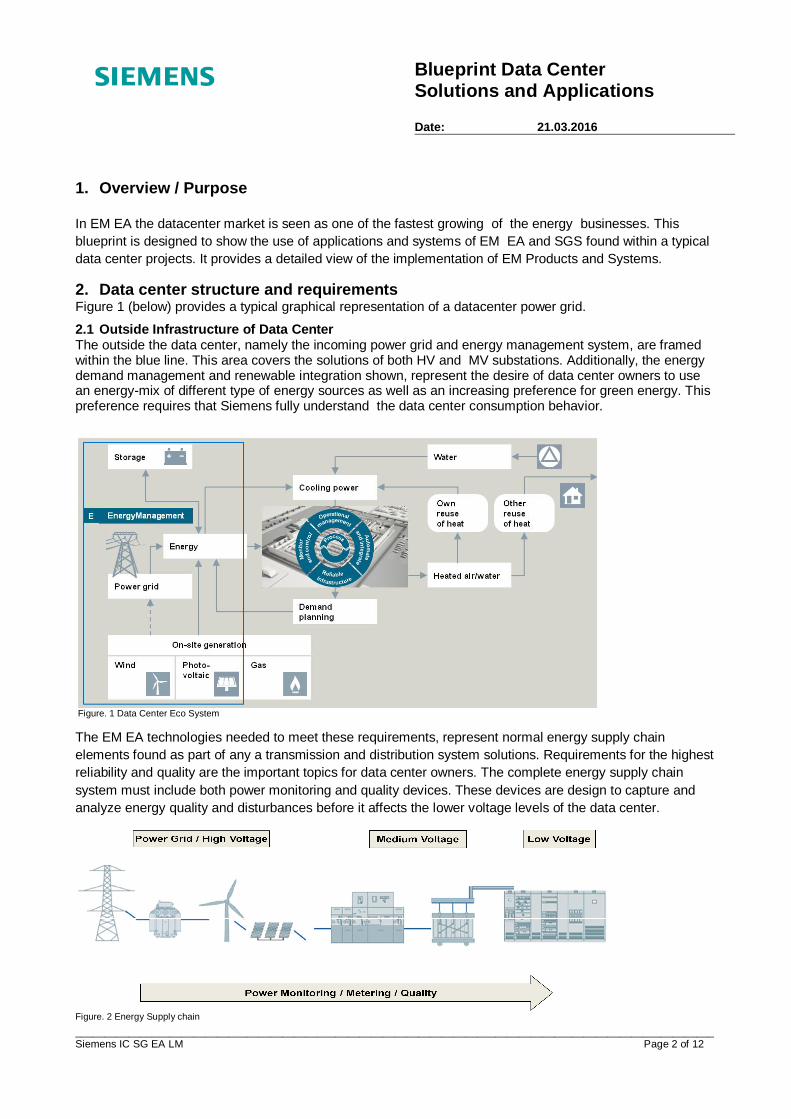
2.1 Outside Infrastructure of Data Center The outside the data center, namely the incoming power grid and energy management system, are framed within the blue line. This area covers the solutions of both HV and MV substations. Additionally, the energy demand management and renewable integration shown, represent the desire of data center owners to use an energy-mix of different type of energy sources as well as an increasing preference for green energy. This preference requires that Siemens fully understand the data center consumption behavior.
Figure. 1 Data Center Eco System The EM EA technologies needed to meet these requirements, represent normal energy supply chain elements found as part of any a transmission and distribution system solutions. Requirements for the highest reliability and quality are the important topics for data center owners. The complete energy supply chain system must include both power monitoring and quality devices. These devices are design to capture and analyze energy quality and disturbances before it affects the lower voltage levels of the data center.
Figure. 2 Energy Supply chain
Blueprint Data Center Solutions and Applications Date: 21.03.2016
____________________________________________________________________________________________________________ Siemens IC SG EA LM Page 3 of 12
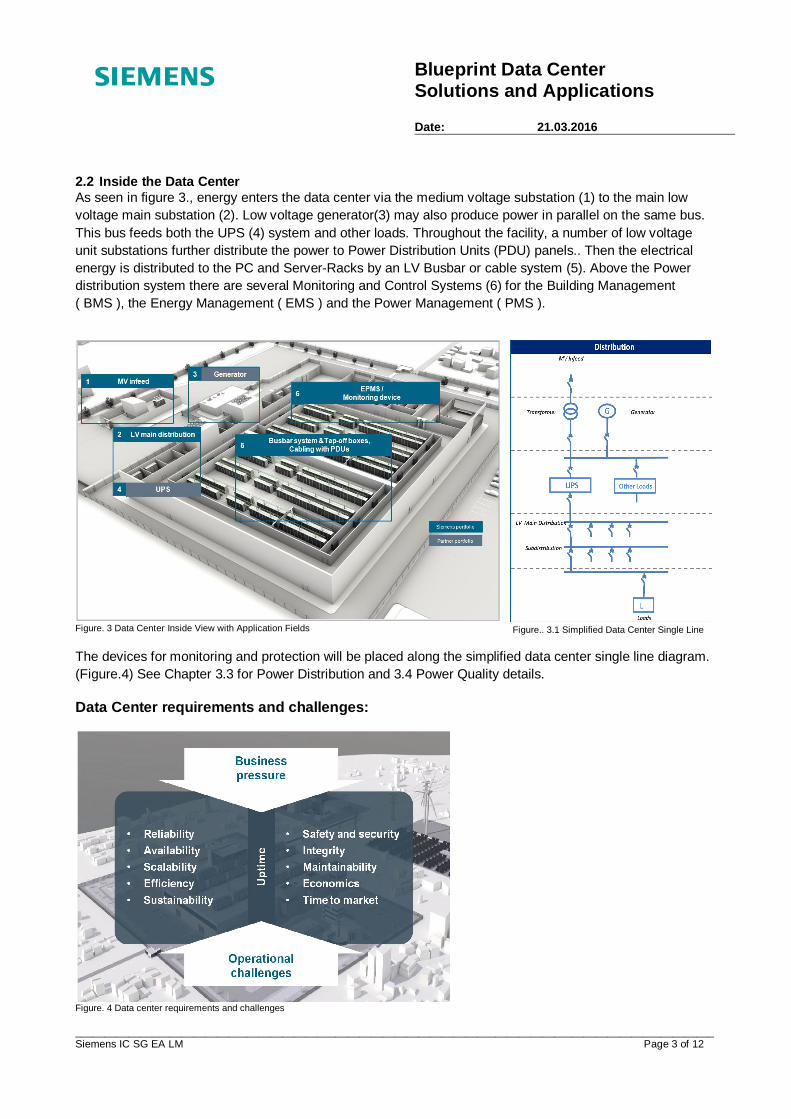
2.2 Inside the Data Center As seen in figure 3., energy enters the data center via the medium voltage substation (1) to the main low voltage main substation (2). Low voltage generator(3) may also produce power in parallel on the same bus. This bus feeds both the UPS (4) system and other loads. Throughout the facility, a number of low voltage unit substations further distribute the power to Power Distribution Units (PDU) panels.. Then the electrical energy is distributed to the PC and Server-Racks by an LV Busbar or cable system (5). Above the Power distribution system there are several Monitoring and Control Systems (6) for the Building Management ( BMS ), the Energy Management ( EMS ) and the Power Management ( PMS ).
Figure. 3 Data Center Inside View with Application Fields The devices for monitoring and protection will be placed along the simplified data center single line diagram. (Figure.4) See Chapter 3.3 for Power Distribution and 3.4 Power Quality details. Data Center requirements and challenges:
Figure. 4 Data center requirements and challenges
Figure.. 3.1 Simplified Data Center Single Line
Blueprint Data Center Solutions and Applications Date: 21.03.2016
____________________________________________________________________________________________________________ Siemens IC SG EA LM Page 4 of 12
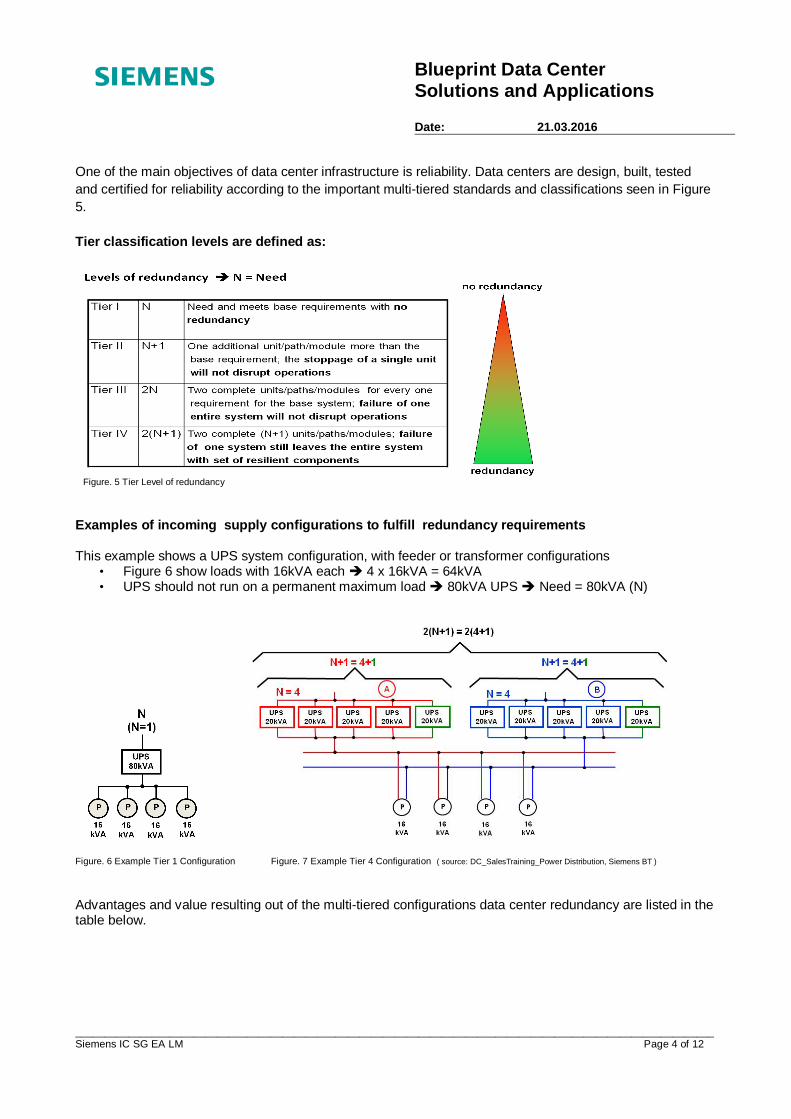
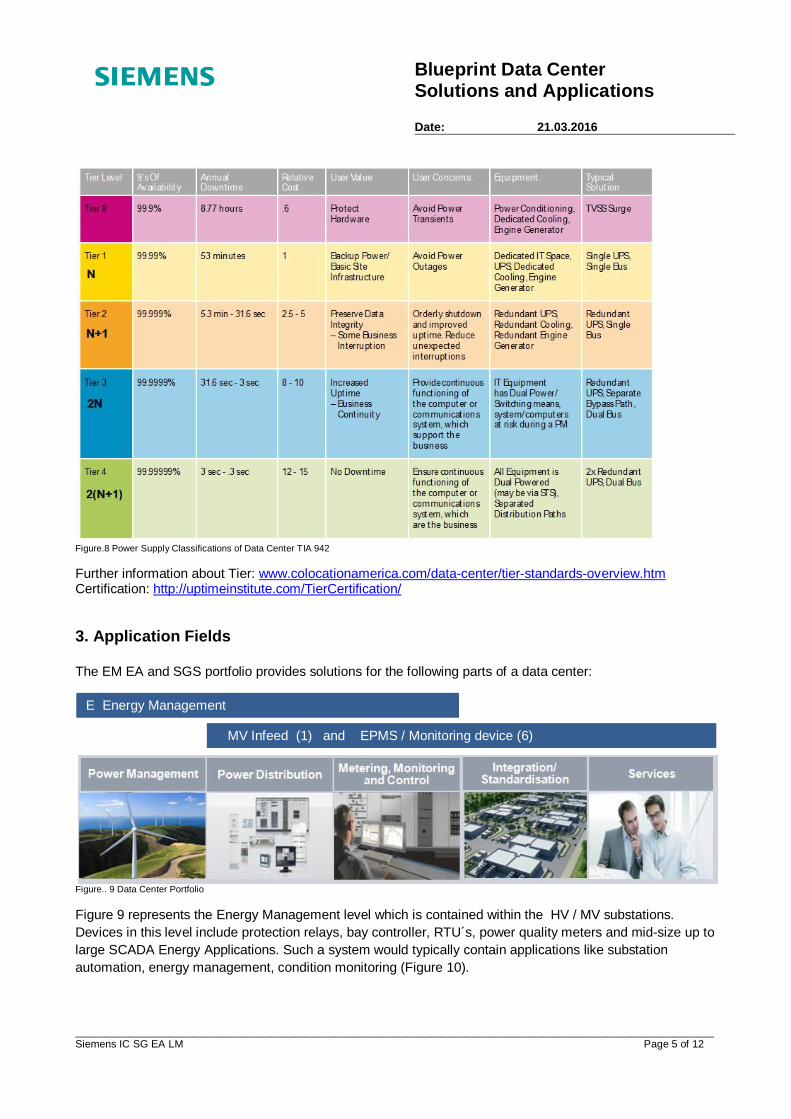
One of the main objectives of data center infrastructure is reliability. Data centers are design, built, tested and certified for reliability according to the important multi-tiered standards and classifications seen in Figure 5. Tier classification levels are defined as:
Figure. 5 Tier Level of redundancy Examples of incoming supply configurations to fulfill redundancy requirements This example shows a UPS system configuration, with feeder or transformer configurations
• Figure 6 show loads with 16kVA each 4 x 16kVA = 64kVA • UPS should not run on a permanent maximum load 80kVA UPS Need = 80kVA (N)
Figure. 6 Example Tier 1 Configuration Figure. 7 Example Tier 4 Configuration ( source: DC_SalesTraining_Power Distribution, Siemens BT ) Advantages and value resulting out of the multi-tiered configurations data center redundancy are listed in the table below.
Blueprint Data Center Solutions and Applications Date: 21.03.2016
____________________________________________________________________________________________________________ Siemens IC SG EA LM Page 5 of 12
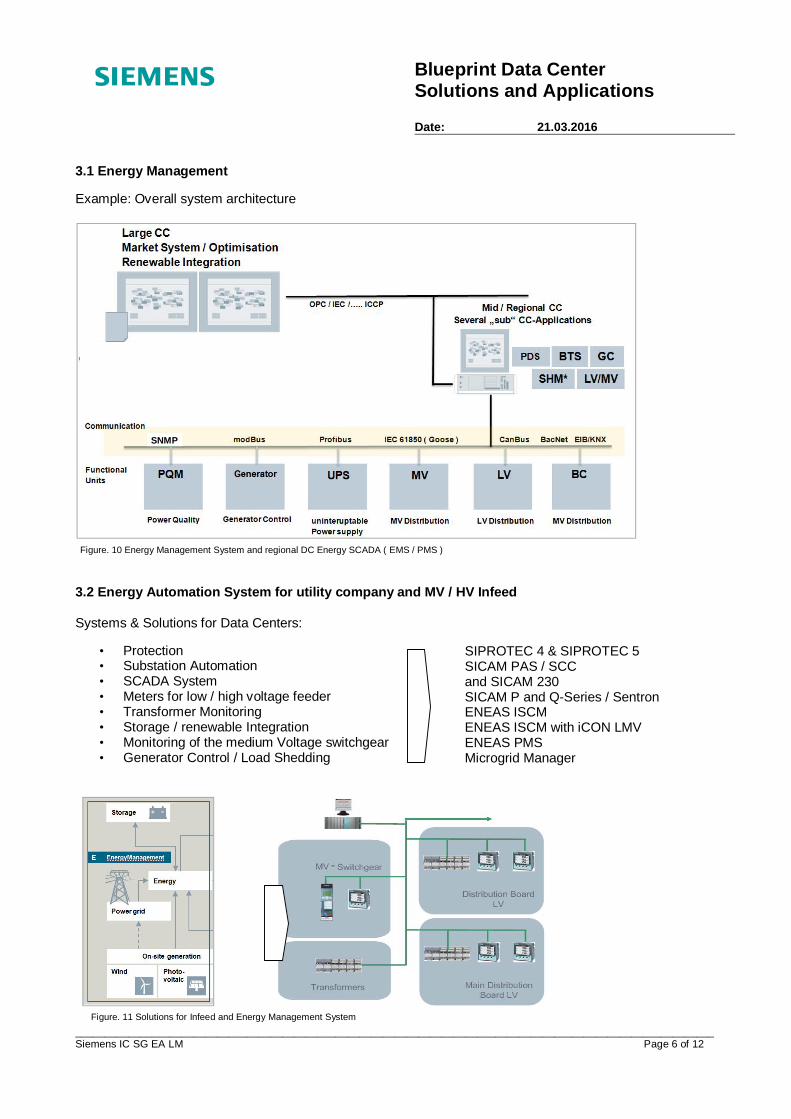
Figure.8 Power Supply Classifications of Data Center TIA 942 Further information about Tier: www.colocationamerica.com/data-center/tier-standards-overview.htm Certification: http://uptimeinstitute.com/TierCertification/ 3. Application Fields The EM EA and SGS portfolio provides solutions for the following parts of a data center:
Figure.. 9 Data Center Portfolio Figure 9 represents the Energy Management level which is contained within the HV / MV substations. Devices in this level include protection relays, bay controller, RTU´s, power quality meters and mid-size up to large SCADA Energy Applications. Such a system would typically contain applications like substation automation, energy management, condition monitoring (Figure 10).
E Energy Management
MV Infeed (1) and EPMS / Monitoring device (6)
Blueprint Data Center Solutions and Applications Date: 21.03.2016
____________________________________________________________________________________________________________ Siemens IC SG EA LM Page 6 of 12
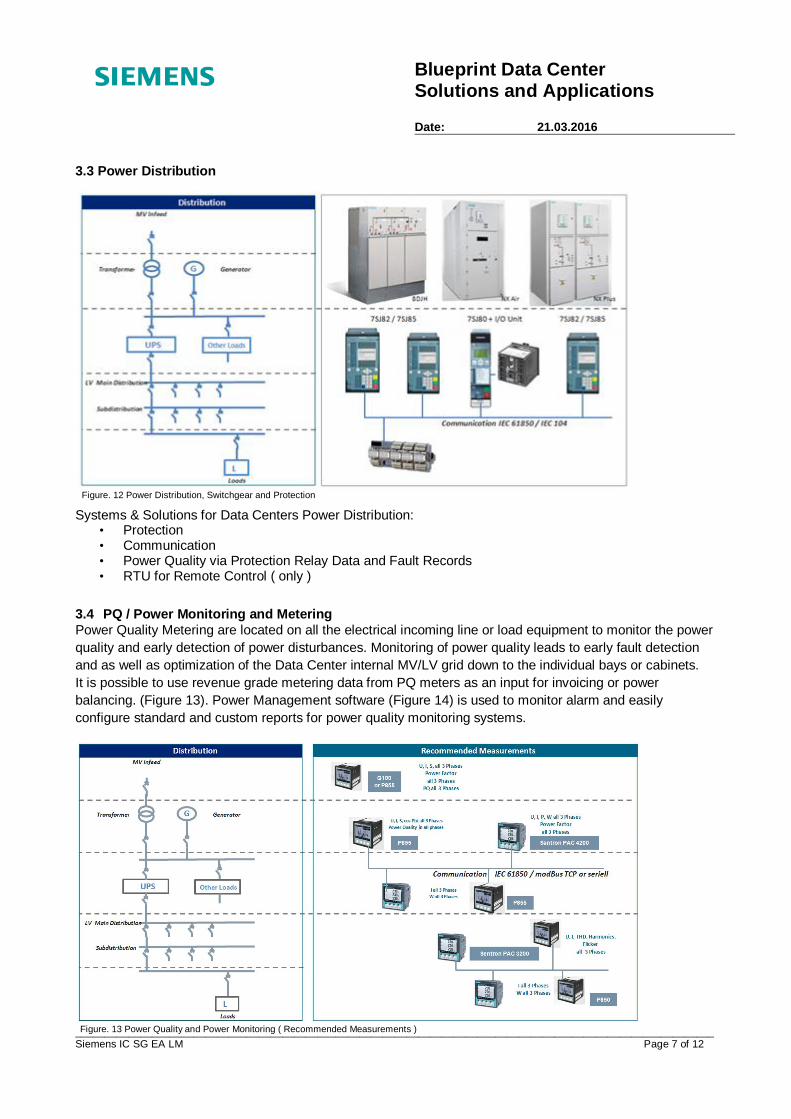
3.1 Energy Management Example: Overall system architecture
3.2 Energy Automation System for utility company and MV / HV Infeed Systems & Solutions for Data Centers:
• Protection • Substation Automation • SCADA System • Meters for low / high voltage feeder • Transformer Monitoring • Storage / renewable Integration • Monitoring of the medium Voltage switchgear • Generator Control / Load Shedding
Figure. 10 Energy Management System and regional DC Energy SCADA ( EMS / PMS )
Figure. 11 Solutions for Infeed and Energy Management System
SIPROTEC 4 & SIPROTEC 5 SICAM PAS / SCC and SICAM 230 SICAM P and Q-Series / Sentron ENEAS ISCM ENEAS ISCM with iCON LMV ENEAS PMS Microgrid Manager
SNMP
Blueprint Data Center Solutions and Applications Date: 21.03.2016
____________________________________________________________________________________________________________ Siemens IC SG EA LM Page 7 of 12
3.3 Power Distribution
Systems & Solutions for Data Centers Power Distribution:
• Protection • Communication • Power Quality via Protection Relay Data and Fault Records • RTU for Remote Control ( only )
3.4 PQ / Power Monitoring and Metering Power Quality Metering are located on all the electrical incoming line or load equipment to monitor the power quality and early detection of power disturbances. Monitoring of power quality leads to early fault detection and as well as optimization of the Data Center internal MV/LV grid down to the individual bays or cabinets. It is possible to use revenue grade metering data from PQ meters as an input for invoicing or power balancing. (Figure 13). Power Management software (Figure 14) is used to monitor alarm and easily configure standard and custom reports for power quality monitoring systems.
Figure. 12 Power Distribution, Switchgear and Protection
Figure. 13 Power Quality and Power Monitoring ( Recommended Measurements )
Blueprint Data Center Solutions and Applications Date: 21.03.2016
____________________________________________________________________________________________________________ Siemens IC SG EA LM Page 8 of 12
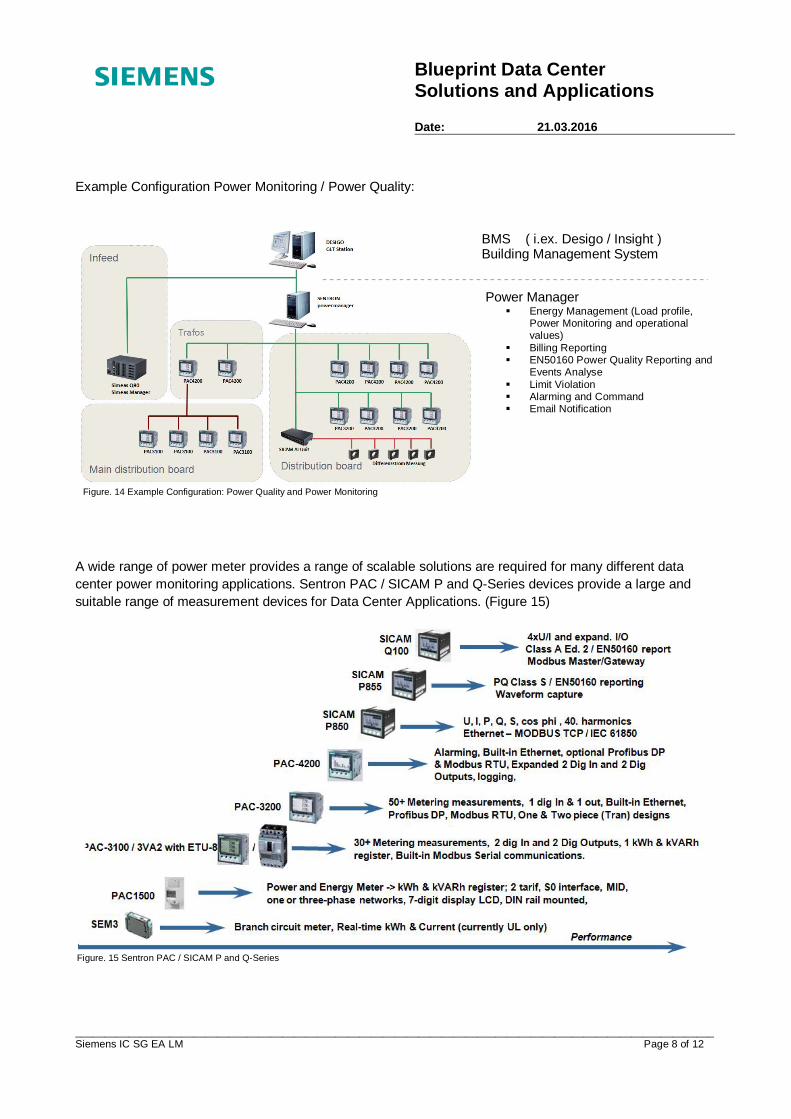
Example Configuration Power Monitoring / Power Quality:
A wide range of power meter provides a range of scalable solutions are required for many different data center power monitoring applications. Sentron PAC / SICAM P and Q-Series devices provide a large and suitable range of measurement devices for Data Center Applications. (Figure 15)
Figure. 14 Example Configuration: Power Quality and Power Monitoring
BMS ( i.ex. Desigo / Insight ) Building Management System Power Manager
Energy Management (Load profile, Power Monitoring and operational values)
Billing Reporting EN50160 Power Quality Reporting and
Events Analyse Limit Violation Alarming and Command Email Notification
Figure. 15 Sentron PAC / SICAM P and Q-Series
Blueprint Data Center Solutions and Applications Date: 21.03.2016
____________________________________________________________________________________________________________ Siemens IC SG EA LM Page 9 of 12
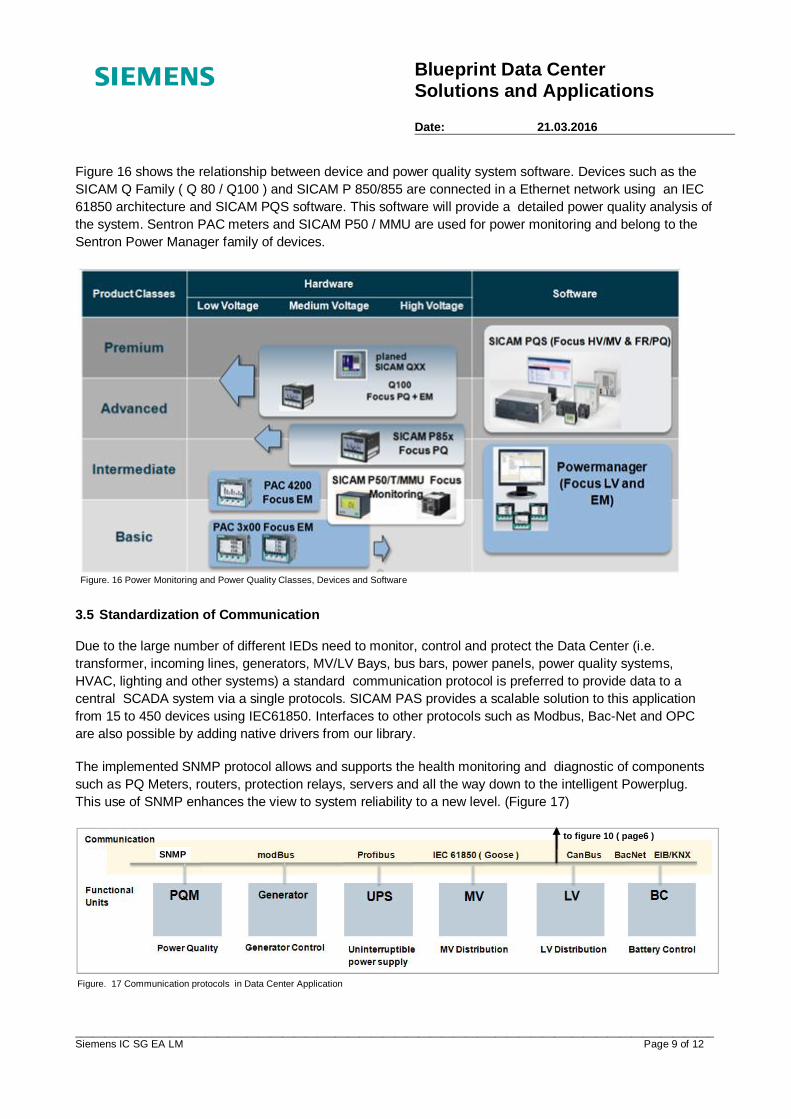
Figure 16 shows the relationship between device and power quality system software. Devices such as the SICAM Q Family ( Q 80 / Q100 ) and SICAM P 850/855 are connected in a Ethernet network using an IEC 61850 architecture and SICAM PQS software. This software will provide a detailed power quality analysis of the system. Sentron PAC meters and SICAM P50 / MMU are used for power monitoring and belong to the Sentron Power Manager family of devices.
3.5 Standardization of Communication
Due to the large number of different IEDs need to monitor, control and protect the Data Center (i.e. transformer, incoming lines, generators, MV/LV Bays, bus bars, power panels, power quality systems, HVAC, lighting and other systems) a standard communication protocol is preferred to provide data to a central SCADA system via a single protocols. SICAM PAS provides a scalable solution to this application from 15 to 450 devices using IEC61850. Interfaces to other protocols such as Modbus, Bac-Net and OPC are also possible by adding native drivers from our library.
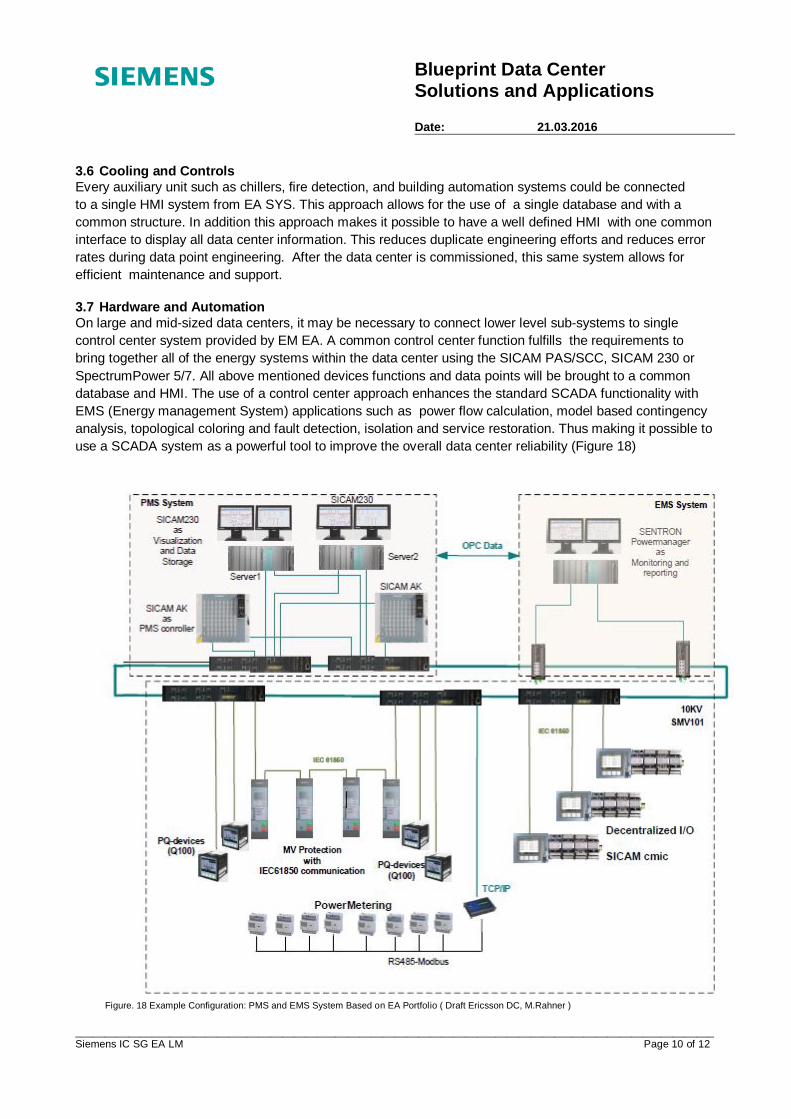
The implemented SNMP protocol allows and supports the health monitoring and diagnostic of components such as PQ Meters, routers, protection relays, servers and all the way down to the intelligent Powerplug. This use of SNMP enhances the view to system reliability to a new level. (Figure 17)
Figure. 16 Power Monitoring and Power Quality Classes, Devices and Software
Figure. 17 Communication protocols in Data Center Application
SNMP
to figure 10 ( page6 )
Blueprint Data Center Solutions and Applications Date: 21.03.2016
____________________________________________________________________________________________________________ Siemens IC SG EA LM Page 10 of 12
3.6 Cooling and Controls Every auxiliary unit such as chillers, fire detection, and building automation systems could be connected to a single HMI system from EA SYS. This approach allows for the use of a single database and with a common structure. In addition this approach makes it possible to have a well defined HMI with one common interface to display all data center information. This reduces duplicate engineering efforts and reduces error rates during data point engineering. After the data center is commissioned, this same system allows for efficient maintenance and support.
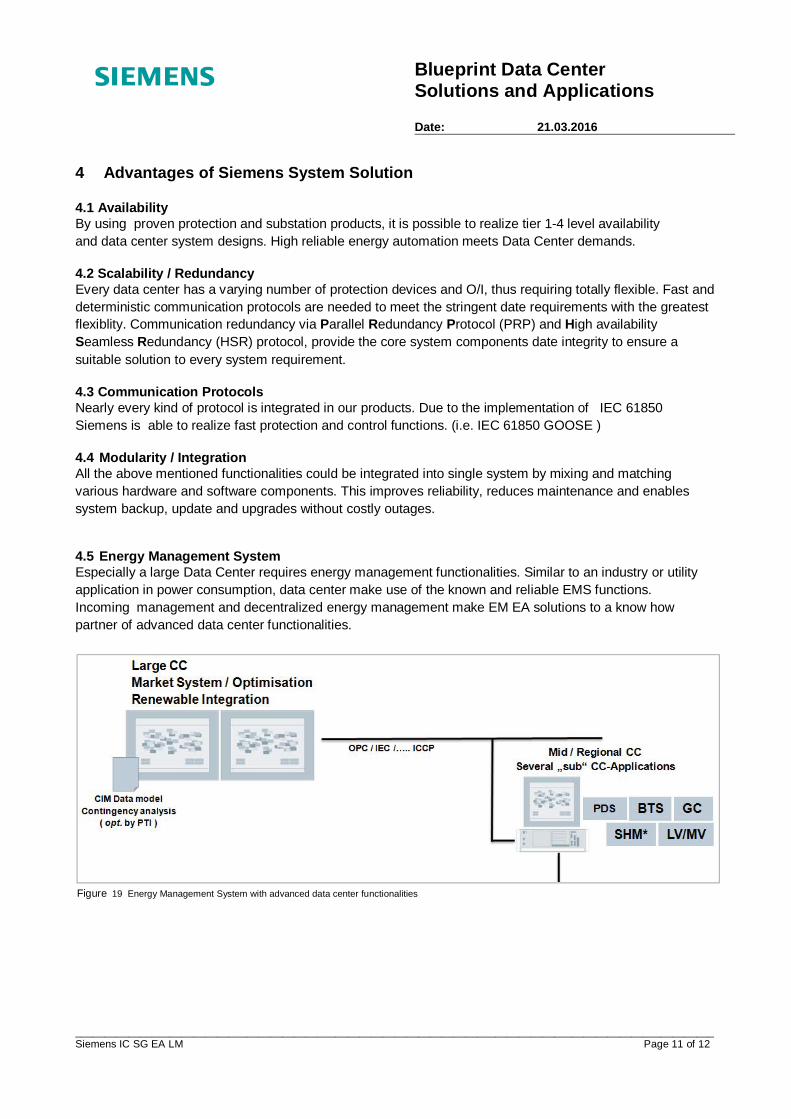
3.7 Hardware and Automation On large and mid-sized data centers, it may be necessary to connect lower level sub-systems to single control center system provided by EM EA. A common control center function fulfills the requirements to bring together all of the energy systems within the data center using the SICAM PAS/SCC, SICAM 230 or SpectrumPower 5/7. All above mentioned devices functions and data points will be brought to a common database and HMI. The use of a control center approach enhances the standard SCADA functionality with EMS (Energy management System) applications such as power flow calculation, model based contingency analysis, topological coloring and fault detection, isolation and service restoration. Thus making it possible to use a SCADA system as a powerful tool to improve the overall data center reliability (Figure 18)
Figure. 18 Example Configuration: PMS and EMS System Based on EA Portfolio ( Draft Ericsson DC, M.Rahner )
Blueprint Data Center Solutions and Applications Date: 21.03.2016
____________________________________________________________________________________________________________ Siemens IC SG EA LM Page 11 of 12
4 Advantages of Siemens System Solution
4.1 Availability By using proven protection and substation products, it is possible to realize tier 1-4 level availability and data center system designs. High reliable energy automation meets Data Center demands.
4.2 Scalability / Redundancy Every data center has a varying number of protection devices and O/I, thus requiring totally flexible. Fast and deterministic communication protocols are needed to meet the stringent date requirements with the greatest flexiblity. Communication redundancy via Parallel Redundancy Protocol (PRP) and High availability Seamless Redundancy (HSR) protocol, provide the core system components date integrity to ensure a suitable solution to every system requirement. 4.3 Communication Protocols Nearly every kind of protocol is integrated in our products. Due to the implementation of IEC 61850 Siemens is able to realize fast protection and control functions. (i.e. IEC 61850 GOOSE ) 4.4 Modularity / Integration All the above mentioned functionalities could be integrated into single system by mixing and matching various hardware and software components. This improves reliability, reduces maintenance and enables system backup, update and upgrades without costly outages.
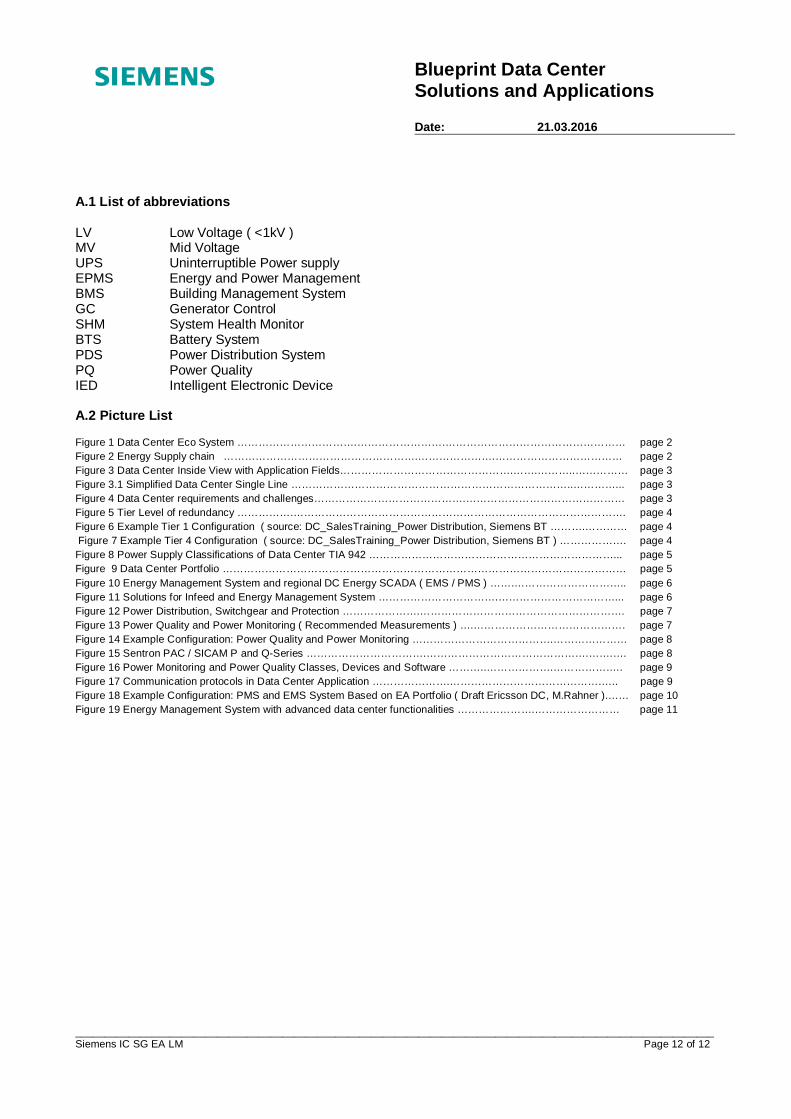
4.5 Energy Management System Especially a large Data Center requires energy management functionalities. Similar to an industry or utility application in power consumption, data center make use of the known and reliable EMS functions. Incoming management and decentralized energy management make EM EA solutions to a know how partner of advanced data center functionalities.
Figure 19 Energy Management System with advanced data center functionalities
Blueprint Data Center Solutions and Applications Date: 21.03.2016
____________________________________________________________________________________________________________ Siemens IC SG EA LM Page 12 of 12
A.1 List of abbreviations LV Low Voltage ( <1kV ) MV Mid Voltage UPS Uninterruptible Power supply EPMS Energy and Power Management BMS Building Management System GC Generator Control SHM System Health Monitor BTS Battery System PDS Power Distribution System PQ Power Quality IED Intelligent Electronic Device A.2 Picture List Figure 1 Data Center Eco System …………………………….…………………….…………………………………………… page 2 Figure 2 Energy Supply chain ……………………………………………….………………….……………………………… page 2 Figure 3 Data Center Inside View with Application Fields………………………………………….…….………..…………… page 3 Figure 3.1 Simplified Data Center Single Line ……………………………………………………………………..…………... page 3 Figure 4 Data Center requirements and challenges…………………………………….……………………………………… page 3 Figure 5 Tier Level of redundancy …………….…………………………………………………………………………………. page 4 Figure 6 Example Tier 1 Configuration ( source: DC_SalesTraining_Power Distribution, Siemens BT ……….………… page 4 Figure 7 Example Tier 4 Configuration ( source: DC_SalesTraining_Power Distribution, Siemens BT ) ………………. page 4 Figure 8 Power Supply Classifications of Data Center TIA 942 ……………………………………………………………... page 5 Figure 9 Data Center Portfolio …………………………………………………………………………………………………… page 5 Figure 10 Energy Management System and regional DC Energy SCADA ( EMS / PMS ) …….………………………….. page 6 Figure 11 Solutions for Infeed and Energy Management System …………………………….……………………………... page 6 Figure 12 Power Distribution, Switchgear and Protection ………………….…………………………………………………. page 7 Figure 13 Power Quality and Power Monitoring ( Recommended Measurements ) ….……………………………………. page 7 Figure 14 Example Configuration: Power Quality and Power Monitoring ………………………………….………………… page 8 Figure 15 Sentron PAC / SICAM P and Q-Series …………………………….……………………………………….…….…. page 8 Figure 16 Power Monitoring and Power Quality Classes, Devices and Software ………..……………….…………….…. page 9 Figure 17 Communication protocols in Data Center Application ………………….…………………………………….….. page 9 Figure 18 Example Configuration: PMS and EMS System Based on EA Portfolio ( Draft Ericsson DC, M.Rahner ).…… page 10 Figure 19 Energy Management System with advanced data center functionalities ………………….…………………… page 11