
Blue Whale (Balaenoptera musculus) Behavior and Group ...
21
Animal Behavior and Cognition ABC 2016, 3(1):1-21 ©Attribution 3.0 Unported (CC BY 3.0) DOI: 10.12966/abc.02.01.2016 Blue Whale (Balaenoptera musculus) Behavior and Group Dynamics as Observed from an Aircraft off Southern California Kate Lomac-MacNair 1, 2, * and Mari Ann Smultea 1, 3 1 Smultea Environmental Sciences, P.O. Box 256, Preston, WA 98050 USA 2 Environmental Science Advanced Academic Program, Johns Hopkins University, Washington D.C. 20036, USA 3 Texas A&M University at Galveston, Pelican Island, Galveston, TX 77553 USA *Corresponding author (Email: [email protected]) Citation – Lomac-MacNair, K., & Smultea, M. A. (2016). Blue whale (Balaenoptera musculus) behavior and group dynamics as observed from an aircraft off Southern California. Animal Behavior and Cognition, 3(1), 1-21. doi: 10.12966/abc.02.01.2016 Abstract - Group behavior and interactions of endangered blue whales (Balaenoptera musculus) have not been systematically studied. Such behavioral data are often overlooked when assessing anthropogenic effects. Yet behavioral data are necessary to compare “normal” behaviors with behavior affected by anthropogenic factors of concern relative to effective management and recovery of blue whales. For a baseline study, we hypothesized that the response variables sighting rate, group size, calf presence and group cohesion (i.e., spacing between individuals within a group) differed according to the spatio-temporal explanatory variables behavioral state, time of day, season, water depth and distance from shore. To address our hypotheses, we flew systematic line transect surveys in southern California and collected focal group data. Two sets of data were separately analyzed using different sampling approaches: (1) point sample data associated with the first sighting of a blue whale(s), and (2) extended all-occurrence focal group behavioral sampling data (i.e., focal follows) collected on a subsample of all sightings while the aircraft circled at a radial distance of approximately 0.5-1 km and an altitude of 1,500 m for extended periods of 5 – 60 minutes. Chi-square contingency table and G² analyses were used to assess statistical relationships between response and explanatory variables. We conducted 18 one-week-long aerial surveys spanning October 2008 through May 2013 (at least once during every month except December), totaling 87,555 km of observation effort. Seventy blue whale sightings (117 individuals) were seen, ranging in size from 1 – 6 whales, and focal follow was performed on over half (55%) of these sightings. Results supported our hypotheses that blue whale group characteristics were related to behavioral state and spatio-temporal variables. Sighting rates were significantly highest during summer followed by spring, fall, and winter. Group type differed significantly by season: groups (at least three individuals) were seen only during summer but singles and pairs were seen from spring through fall. Non- calf groups and mother/calf pairs engaged predominantly in mill and slow travel/rest, while singles and pairs were only observed in medium/fast travel. Behavioral state differed significantly by time of day, group type, water depth and distance from shore. On average mother/calf pairs (n = 3) and singles (n = 43) were found in deeper offshore waters than groups (n = 8) and pairs (n = 16). Group cohesion and group size were negatively correlated: as group size increased whales became less cohesive and more spread out. Our study suggests that group characteristics and behavior are sensitive to spatio-temporal factors. These data are important in providing the first systematic quantitative study of blue whale behavior, providing a baseline against which to assess potential impacts of increasing anthropogenic marine activities in the study area and elsewhere. Results further indicate that social, behavioral and spatio-temporal factors influencing blue whales must be considered when attempting to differentiate potential impacts of anthropogenic activities. We thus suggest that our study parameters be applied as behavioral indices of anthropogenic disturbance to blue whales. To identify effective management and conservation actions to assist in recovery of the blue whale population, it is imperative to describe and quantify natural behavior and habitat- use patterns.
Transcript of Blue Whale (Balaenoptera musculus) Behavior and Group ...
Animal Behavior and Cognition ABC 2016, 3(1):1-21 ©Attribution 3.0 Unported (CC BY 3.0) DOI: 10.12966/abc.02.01.2016
Blue Whale (Balaenoptera musculus) Behavior and Group Dynamics as Observed from an Aircraft
off Southern California
Kate Lomac-MacNair1, 2, * and Mari Ann Smultea1, 3
1Smultea Environmental Sciences, P.O. Box 256, Preston, WA 98050 USA 2Environmental Science Advanced Academic Program, Johns Hopkins University, Washington D.C. 20036, USA 3Texas A&M University at Galveston, Pelican Island, Galveston, TX 77553 USA
*Corresponding author (Email: [email protected]) Citation – Lomac-MacNair, K., & Smultea, M. A. (2016). Blue whale (Balaenoptera musculus) behavior and group dynamics as observed from an aircraft off Southern California. Animal Behavior and Cognition, 3(1), 1-21. doi: 10.12966/abc.02.01.2016 Abstract - Group behavior and interactions of endangered blue whales (Balaenoptera musculus) have not been systematically studied. Such behavioral data are often overlooked when assessing anthropogenic effects. Yet behavioral data are necessary to compare “normal” behaviors with behavior affected by anthropogenic factors of concern relative to effective management and recovery of blue whales. For a baseline study, we hypothesized that the response variables sighting rate, group size, calf presence and group cohesion (i.e., spacing between individuals within a group) differed according to the spatio-temporal explanatory variables behavioral state, time of day, season, water depth and distance from shore. To address our hypotheses, we flew systematic line transect surveys in southern California and collected focal group data. Two sets of data were separately analyzed using different sampling approaches: (1) point sample data associated with the first sighting of a blue whale(s), and (2) extended all-occurrence focal group behavioral sampling data (i.e., focal follows) collected on a subsample of all sightings while the aircraft circled at a radial distance of approximately 0.5-1 km and an altitude of 1,500 m for extended periods of 5 – 60 minutes. Chi-square contingency table and G² analyses were used to assess statistical relationships between response and explanatory variables. We conducted 18 one-week-long aerial surveys spanning October 2008 through May 2013 (at least once during every month except December), totaling 87,555 km of observation effort. Seventy blue whale sightings (117 individuals) were seen, ranging in size from 1 – 6 whales, and focal follow was performed on over half (55%) of these sightings. Results supported our hypotheses that blue whale group characteristics were related to behavioral state and spatio-temporal variables. Sighting rates were significantly highest during summer followed by spring, fall, and winter. Group type differed significantly by season: groups (at least three individuals) were seen only during summer but singles and pairs were seen from spring through fall. Non-calf groups and mother/calf pairs engaged predominantly in mill and slow travel/rest, while singles and pairs were only observed in medium/fast travel. Behavioral state differed significantly by time of day, group type, water depth and distance from shore. On average mother/calf pairs (n = 3) and singles (n = 43) were found in deeper offshore waters than groups (n = 8) and pairs (n = 16). Group cohesion and group size were negatively correlated: as group size increased whales became less cohesive and more spread out. Our study suggests that group characteristics and behavior are sensitive to spatio-temporal factors. These data are important in providing the first systematic quantitative study of blue whale behavior, providing a baseline against which to assess potential impacts of increasing anthropogenic marine activities in the study area and elsewhere. Results further indicate that social, behavioral and spatio-temporal factors influencing blue whales must be considered when attempting to differentiate potential impacts of anthropogenic activities. We thus suggest that our study parameters be applied as behavioral indices of anthropogenic disturbance to blue whales. To identify effective management and conservation actions to assist in recovery of the blue whale population, it is imperative to describe and quantify natural behavior and habitat-use patterns.

Lomac-MacNair & Smultea 2
Keywords – Blue whales, Balaenoptera musculus, Behavioral state, Distribution, Group size, Spatio-temporal factors
Blue whales (Balaenoptera musculus) are the largest, yet currently one of the most endangered whales worldwide due to historical intensive whaling that nearly decimated populations during the 1800 and early 1900s. Though protected by the International Whaling Commission since 1966, blue whale populations have not recovered and are threatened by increasing anthropogenic activities. Potential related threats include ship strikes, coastal development, pollution, military training activities, fishing, vessel traffic, etc. Like most mysticetes, blue whales are thought to migrate between high-latitude feeding grounds and low-latitude, largely unidentified, calving/breeding areas in both coastal and oceanic habitats. Due to their oceanic tendencies and low numbers, blue whales remain one of the least studied of the large baleen whales. This is especially evident with respect to basic natural history, including migratory routes as well as social, foraging, breeding, nursing, and calving behaviors. Blue whale behavioral ecology and more specifically group composition characteristics are poorly studied and virtually unpublished. To identify effective management and conservation actions to assist in recovery of the blue whale population, it is imperative to describe and quantify natural behavior and habitat-use patterns. Such information provides important insight as to how this species may alter behavioral ecology strategies in response to anthropogenic activities.
Many techniques and dedicated field studies of live blue whales have increased our understanding of various aspects its biology. These include photographic identification (e.g., Calambokidis & Barlow, 2004; Calambokidis et al., 1990; Sears, 1987; Sears & Larsen, 2002), and vessel- and aircraft-based studies examining distribution, density and abundance (e.g., Calambokidis & Barlow, 2004; Forney & Barlow, 1998; Hucke-Gaete, Osman, Moreno, Findlay, & Ljungblad, 2004), satellite tagging documenting migratory movements (Mate, Lagerquist, & Calambokidis, 1999), and acoustic studies using detections of vocalizations to examine the distribution, seasonality, and vocalization (call) behavior of blue whales (Burtenshaw et al., 2004; McDonald, Calambokidis, Terinishi, & Hildebrand, 2001; Oleson, Calambokidis, Burgess, McDonald, & Hildebrand, 2007; Stafford, Nieukirk, & Fox, 1999). Behavioral studies of individual blue whales (including tagged whales) have been conducted from small vessels, focusing on respiration, dive, and underwater movement/orientation metrics of feeding individuals and their prey (e.g., Croll, Acevedo-Gutiérrez, Tershy, & Urbán-Ramı ́rez, 2001; Goldbogen et al., 2012; Hazen, Friedlaender, & Goldbogen 2015; Schoenherr, 1991), and responses to underwater playback of Navy sonar off southern California (Goldbogen et al., 2013). However, it is problematic during such vessel-based studies to discount potential confounding effects of the vessel observation platform (e.g., underwater noise and movements) as well as the tag and tagging activity itself on blue whale behavior. Furthermore, tagging studies focus on individual whales and omit the influence of social behavioral factors (e.g., other whales) on behavior, which are known to influence these social animals. Aerial surveys, when conducted outside the calculated air-to-water sound transmission cone of the aircraft (Richardson, Greene, Malme, & Thomson, 1995; Urick, 1972), provide a non-intrusive observation platform and mechanism for studying undisturbed cetacean behavior (e.g., Richardson, Fraker, Würsig, & Wells, 1985; Richardson et al., 1995; Würsig, Dorsey, Fraker, Payne, & Richardson, 1985).
Group composition and detailed behaviors as observed from an aerial platform have previously been recorded and described systematically in published literature only for bowhead (Balaena mysticetus) and gray whales (Eschrichtius robustus) using both visual observers and video (e.g., Malme, Würsig, Bird, & Tyack, 1988; Würsig et al., 1984, 1985; Würsig, Wells, & Croll, 1986), but never for blue whales. These previous and other studies demonstrate that observations from an aerial platform in relatively clear waters allow a “bird’s eye” view through the water of three-dimensional behavioral interactions of large whales (Scheidat et al., 2011; Smultea & Bacon, 2012). Although aerial platforms do not now allow for behavioral observations when animals are at depth, shallow sub-surface behaviors can still be recorded in the SCB study area due to the clarity of the water and the blue whale’s large size and

Lomac-MacNair & Smultea 3
light-blue body coloration. We estimate that the animal can be observed 2 – 3 body lengths (BL; 60-90 m) below the surface based on our video recordings (Smultea & Bacon, 2012). These observations allow for continual monitoring when animals are not deep diving. Calambokidis et al. (2007) examined the underwater behavior of blue whales off California and Gulf of California (GoC) using CRITTERCAM, a suction-cup-attached video-imaging instrument. From the 13 successful deployments (a total of 19 hrs of video recordings) observations indicated that inter-whale associations seen at the surface also continue underwater. The lead and follow orientations noted at the surface were consistent with the positioning seen underwater in the video. This suggests that what is observed for inter-whale associations from the aerial platform could be representative of underwater associations and related behaviors.
Despite such extensive study efforts there is still little known about even basic behavioral ecology, social behavior, and group dynamics of blue whales. This is due, for the most part, to the species’ typically offshore pelagic distribution. Blue whale calving, breeding and courting behaviors have never been described in the literature. Thus, calving and breeding grounds remain to be identified, should they occur. Some authors have postulated that this species does not aggregate for breeding and calving unlike other baleen species such as humpback and gray whales (e.g., Sears, Ramp, Douglas, & Calambokidis, 2014). Available data report that blue whales tend to occur alone or in pairs; furthermore, social associations and aggregations are not thought to be long term (Sears & Perrin, 2009). Although rare, there are records of concentrations of 50 or more animals spread out in foraging areas of high productivity (Sears & Perrin, 2009).
Little is known about the mating behavior or social dynamics of this species. Female–male pairings have been noted with regularity in Eastern Canada from summer into fall, and the approach of the winter breeding season with some pairings lasting upwards of 5 weeks (Sears & Perrin, 2009; Sears et al., 2014). Sears et al. (2014) noted that on occasion a second male joins pairs, resulting in surface-active behaviors associated with competitive breeding, such as one animal pursuing another and breaching by all three individuals. Physical contact between the males, using head, body and tail swipes has been recorded. These observations support the hypothesis that the blue whale mating strategy is polygynous with antagonistic male–male competition (Sears et al., 2014). Information on the reproductive system of blue whales is still largely based on Southern Ocean whaling data. As in most balaenopterids, females give birth to a single calf after a gestation period of 10 to 11 months. The calf remains with the lactating mother and nurses for 6 to 7 months before weaning (Ottestad, 1950; Yochem & Leatherwood, 1985). First parturition is thought occur at the age of around 10 years or more (Sears et al., 2014). Based on GoC data calves are estimated to be 10-14 m at one to three months of age (Sears et al., 2014. Some females have shown site fidelity to nursing grounds, such as the GoC; however, the lack of documented births in the GoC may indicate that female blue whales choose open, pelagic water for calving and move to GoC and coastal waters when calves are older (Sears et al., 2014). Blues Whales in the SCB Study Area
The eastern stock of blue whales migrates biannually through the SCB during spring and fall,
often remaining there to feed primarily during summer/fall (Calambokidis et al., 2015). This stock ranges from summer/fall feeding grounds in the Gulf of Alaska to California and southern tropical winter breeding areas off Mexico and the GoC (Calambokidis et al., 1990; Reilly & Thayer, 1990; Sears et al., 2014) and Central America (Costa Rica and Nicaragua) (Mate et al., 1999). In California waters during summer months, blue whales typically forage in dense subsurface layers of euphausiids (krill) on both the continental shelf and beyond (Fiedler et al., 1998). Blue whale feeding aggregations are often found at the continental shelf edge where upwelling produces larger concentrations of krill (Fiedler et al., 1998; Schoenherr, 1991). The main sources of prey for blue whales in the North Pacific include Euphausia pacifica and Thysanoessa spinifera (Fiedler et al., 1998).

Lomac-MacNair & Smultea 4
Objectives Our overall objective was to provide a baseline description of what constitutes natural blue whale
behavior and group dynamics (within the Southern California Bight study area). Our specific objectives were to identify behavioral indices that could be used to quantify how blue whale behaviors varied by group types (i.e., single, pair, mother/calf pair and group) and spatio-temporal variables. To address these objectives we developed a series of questions and predictions (Table 1) focused on the variables of interest: group type (GT) (size and composition), behavioral state (BS), and cohesion (i.e., inter-individual spacing within groups). Selected explanatory spatial and temporal variables were season, time of day (TOD), distance from shore (km), and water depth (m). Each of these four explanatory variables was compared separately to the two Response variables BS and GT. Table 1 Variables, Questions and Predictions
Response Variables Questions and Explanatory Variables Predictions Season?
TOD?
Distance?
Group Type (GT) Does GT vary by:
Depth?
GT varies spatio-temporally
GT? GT varies by BS
Season?
TOD?
Distance?
Behavior State (BS) Does BS vary by:
Depth?
BS varies spatio-temporally
Cohesion Does Cohesion vary by: GT? Cohesion varies by GT - As group size increases cohesion decreases (i.e., larger distance between neighbors for larger groups) and groups are less cohesive than pairs.
Data collected during our surveys represent the most extensive record of systematically quantified, undisturbed behavior and group characteristics on blue whales in available published literature. This includes behavioral, social and spatial interactions not previously documented (Smultea & Bacon, 2012).
Method Survey Methods
Aerial surveys were conducted two to four times per year between 2008 and 2013, each over a period of 7-10 days. The study area was located within the SCB extending from the coastline up to approximately 200 km offshore, east of San Clemente Island (Figure 1). Nearly all surveys (n = 17; 94%) occurred from a high-wing, twin-engine Partenavia aircraft (P68 or Observer); the remaining survey (n = 1; 6%) was conducted from an Aero Commander aircraft.

Lomac-MacNair & Smultea 5
Three observation effort types were defined: search, verify and focal follow. Systematic line-transect “search” effort occurred along east-to-west oriented lines located east and west of San Clemente Island (SCI) (flown at 244 – 305 m altitude and 100 knots [kt]; Figure 1). Search effort followed conventional distance sampling line transect protocol (Buckland et al., 2001). Two observers searched for marine mammals on each side of the aircraft through a bubble window. The recorder collected data on a laptop running customized Mysticetus data collection and mapping software. Upon making a sighting the observer estimated the bearing and used a clinometer to measure the declination angle to the sighting; the latter data were instantly converted by Mysticetus to distance from the aircraft and a GPS position and plotted on a bathymetric map of the study area. Point sampling protocol (Altmann, 1974; Mann, 1999) was used to record the first-observed pre-selected behavioral data (behavioral state, travel heading (magnetic orientation), and individual spacing (i.e., cohesion) distances in estimated adult body lengths)). Verify involved breaking from line-transect effort to circle and photograph sightings to verify species, group size, number of calves, and behavioral data, as needed. During verify effort, one observer took photographs out of an opening porthole in a rear window while the second observer verified data visually. Focal follow involved circling sightings to collect video and focal individual and group behavioral (i.e., “focal follow”) data for periods of 5 to 60 min (typically 15 to 20 min). Focal follows occurred outside Snell’s sound cone (Urick, 1972) at a target altitude of 457 m and radial distance 0.5 – 1 km to avoid potential disturbance of whales (Richardson et al., 1995). A primary observer continuously called out individual whale behavioral events; in addition, pre-selected behavioral data were called out approximately once per minute to the recorder. A third biologist used a video camera to record behavior through the open porthole window.
Figure 1. 2008 – 2013 SCB aerial survey area developed based on priority areas selected within the Southern California Range Complex: (1) San Nicolas Basin, (2) Santa Catalina Basin, (3) south of San Clemente Island/San Clemente Basin.
Lomac-MacNair & Smultea 6
Data Analysis Two separate types of data streams were analyzed using different methods: (1) first-observed
point sampling behavioral data on all blue whale sightings made during search and verify effort, analyzed quantitatively and statistically, and (2) descriptive narrative analyses from a subsample of the video focal follows. After data QA/QC, all first-observed blue whale sighting data and blue whale focal follow data were extracted into two different Excel databases. For point sample data, Chi-square contingency table and G² analyses were used to assess statistical relationships between response and explanatory variables. Descriptive analyses were limited to groups of three or more individual blue whales and presumed mothers with calves, since our focus was on social interactions. Specific analyses are further detailed below by the two different data streams. First-Observed Data Analyses
First-observed data parameters collected for sightings included group size, number of calves,
behavioral state (Table 3), and minimum and maximum estimated distance (i.e., cohesion) between neighbors within a group (estimated in adult body lengths [BL]). Sighting is defined as a group of one or more whales swimming in a coordinated manner within 50 BL of each other First-observed variables were collected once upon initial sighting of the animal(s). Each sighting was associated with selected environmental and other explanatory variables including time of day (TOD), season, distance to shore (km) and water depth at sighting (m). Distance to shore and water depth were measured based on calculations from Mysticetus Observation Software integrated with a Global Positioning System (GPS). Response Variables
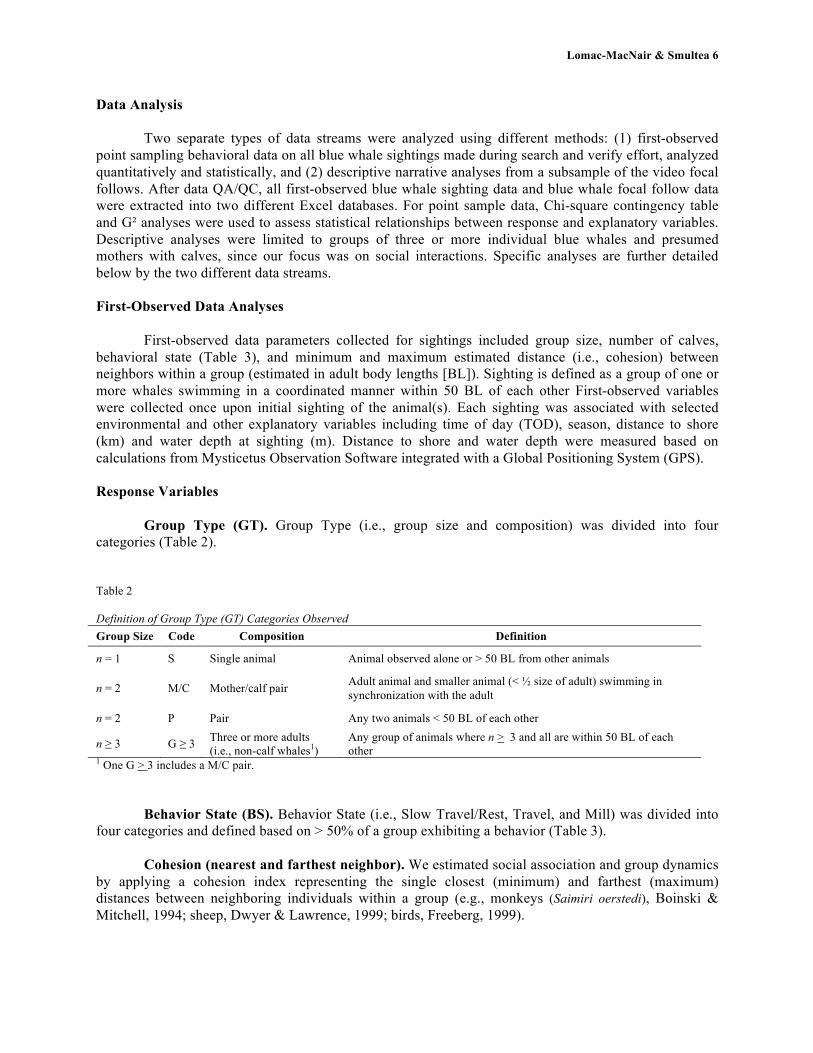
Group Type (GT). Group Type (i.e., group size and composition) was divided into four
categories (Table 2). Table 2 Definition of Group Type (GT) Categories Observed Group Size Code Composition Definition
n = 1 S Single animal Animal observed alone or > 50 BL from other animals
n = 2 M/C Mother/calf pair Adult animal and smaller animal (< ½ size of adult) swimming in synchronization with the adult
n = 2 P Pair Any two animals < 50 BL of each other
n ≥ 3 G ≥ 3 Three or more adults (i.e., non-calf whales1)
Any group of animals where n > 3 and all are within 50 BL of each other
1 One G > 3 includes a M/C pair. Behavior State (BS). Behavior State (i.e., Slow Travel/Rest, Travel, and Mill) was divided into
four categories and defined based on > 50% of a group exhibiting a behavior (Table 3).
Cohesion (nearest and farthest neighbor). We estimated social association and group dynamics by applying a cohesion index representing the single closest (minimum) and farthest (maximum) distances between neighboring individuals within a group (e.g., monkeys (Saimiri oerstedi), Boinski & Mitchell, 1994; sheep, Dwyer & Lawrence, 1999; birds, Freeberg, 1999).

Lomac-MacNair & Smultea 7
Table 3 Definition of Behavioral States
Behavior State Code Definition
Slow Travel/Rest ST/R > 50% of group exhibiting little or no forward movement (< 1 km/hr) remaining at the surface in the same location or drifting/traveling slowly with no wake
Travel (medium/fast) TR > 50% of group swimming with an obvious consistent orientation (directional) and speed, no surface activity. Medium travel = 1 – 3 km/hr wake no white water; Fast travel = > 3 km/hr with white water
Mill MI > 50% of group swimming with no obvious consistent orientation (non-directional) characterized by asynchronous headings, circling, changes in speed, and no surface activity. Includes feeding.
Unknown UN Not able to determine behavior state. (e.g., animals out of sight, too far to determine, on a dive, etc.)
Spatio-temporal Explanatory Variables
Explanatory variables considered for spatio-temporal trends were distance from shore (km), water depth at sighting (m), season, and time of day (TOD). Seasons were defined as Spring (1 March – 31 May), Summer (1 June – 31 August), Fall (1 September – 30 November), and Winter (1 December – 29 February). TOD was defined as “morning” (0801 – 1159), “early afternoon” (1200 – 1559), and “late afternoon” (1600 – 1959). Descriptive Analyses from Video Focal Follows
Descriptive analyses consisted of case studies on two of the G ≥ 3 (n = 6 and n = 3 individuals), presented in descriptive form (i.e., transcribed observations of the focal follow). Transcribed observations of video recording of focal follows included recording duration of 1) behavior state, 2) cohesion index (single closest (minimum) and farthest (maximum) distances between neighboring individuals within a group), 3) group type, and 4) heading for animals when visible at the surface. Descriptive analyses of behavior from aerial platforms have been published for other large whales such as the bowhead whale in the Beaufort Sea (Würsig et al., 1985).
Results
We conducted 18 aerial surveys totaling 87,555 km of effort on 97 days during 2008 through
2013 in every season in the SCB study area. We recorded 70 blue whale sightings composed of 117 individuals (Table 4, Figure 2). Group size ranged from a single animal (n = 1) to six individuals (n = 6), with a mean group size of 1.67 (SD = 1.2, n = 70). Of the 70 sightings, 61% were single (S) animals (n = 43), 23% were pairs (P) (n = 16), 11% were groups of three or more non-calf whales (G ≥ 3) (n = 8), and the remaining 4% were mother/calf pairs (M/C) (n = 3). G ≥ 3 consisted of three sightings of three individuals, one sightings of four individuals, one sighting of five individuals and three sightings of six individuals. Of the three-mother/calf pairs recorded, two occurred during May and one during August. One sighting with six individuals included a fourth mother/calf pair; however, because it included additional individuals, for the purpose of data analysis, this mother/calf pair was included within the G ≥ 3 rather than the M/C. Over half (55%) of the total 70 blue whale sightings were subsequently circled to conduct extended focal follow observations.
Sighting rates (Table 4) were calculated based on number of individuals observed per 1,000 km of observation effort. Sighting rates were highest during summer (4.54 individuals/1,000 km, n = 51 sightings) followed by spring (0.56 individuals/1,000 km, n = 18 sightings) and fall (0.12

Lomac-MacNair & Smultea 8
individuals/1,000 km, n = 1 sighting). Despite over 9,100 km of effort, no blue whales were recorded during winter. Table 4 Summary of Blue Whale Sightings1, Individuals, Total Observation Effort (km) and Sighting Rates by Season
Season Total No. Sightings
Total No. Individuals
Mean Group Size SD
Range of Group Size
Total Observation Effort (km)
Sighting Rate by Season (Individuals per 1000 km observation effort)
Fall 1 2 2.0 2 17,142 0.12 Spring 18 23 1.3 0.46 1 to 2 40,961 0.56 Summer 51 92 1.8 1.36 1 to 6 20,286 4.54 Winter 0 0 0.0 9,166 0.00
All Seasons 70 117 1.67 1.20 1 to 6 87,555 1.34
1Sighting is defined as a group of one or more whales swimming in a coordinated manner within 50 body lengths of each other.
Figure 2. Map of all blue whale sightings during all months in the Southern California Bight study area 2008 - 2013.
Group Type (GT)
Overall, most blue whale groups were seen during summer followed by spring (Table 4). Only one sighting occurred in fall and no blue whales were seen during winter (Figure 3). However, sighting

Lomac-MacNair & Smultea 9
frequency of GT differed significantly by season (spring to summer) and TOD. By season, GT differed significantly between spring and summer among S, P, and G ≥ 3 whales (χ2 = 17.52, df = 2, n = 66, p < 0.001). This significant difference between spring and summer was due primarily to G ≥ 3 whales being seen only during summer (Freeman-Tukey Deviate, z = -1.96). However, during both spring and summer, S were the most commonly sighted GT. P and M/C were seen in smaller numbers in both spring and summer. The only fall sighting was one adult P. Thus, P was the only GT seen during all seasons except winter. In addition to season, TOD was also significantly related to GT sighting frequency (χ2 = 17.58, df = 2, n = 67, p < 0.001; the sample size of three M/C was too small to include in the analyses). S tended to be the most commonly observed GT across the day (i.e., during all three TOD periods). M/C pairs were only seen during “morning” and “early afternoon.”
Figure 3. Group type frequency by season.
Figure 4. Group type frequency by TOD.

Lomac-MacNair & Smultea 10
We assessed variations in GT by distance from shore (km) and water depth (m) at each sighting location. On average, blue whales were found 12.1 km (SD = 9.3) from shore and in 431 m (SD = 296.50) of water. Although the three M/C pairs were found farther from shore than other GTs (18.1km), this should be interpreted with caution due to small sample size. G ≥ 3 and P were found closer to shore and in shallower water (9.9 km/285 m and 9.0 km/380 m, respectively). Again, although M/C and S were found in deeper water than P and G ≥ 3 whales (419 and 477 m depth, respectively) this should be interpreted cautiously based on small sample size. Distance and depth were positively correlated (R² = 0.53), which was statistically significant (p < 0.0005): as distance from shore increased, water depth at blue whale sighting locations increased as well. Group Type (GT) by Behavior State (BS) and Time of Day (TOD)
We assessed GT by BS for the 113 individuals where initial behavior was recorded (excludes 4 unknowns). BS differed significantly by GT (g2 = 100.4, df = 4, n = 107, p < 0.001). G ≥ 3 whales were more often engaged in Mill (MI) and Slow Travel/Rest (ST/R) than S and P. Medium/Fast travel (TR) was observed only among S and P, and never among G ≥ 3. Furthermore, as group size increased, animals engaged more frequently MI or ST/R behaviors, whereas S were more likely to TR. P were exclusively observed TR.
Overall, blue whale behavior for all periods was most frequently TR (51%) followed by MI (25%) and ST/R (21%) (Figure 8). However, BS differed significantly by TOD (χ2 = 20.19, df = 2, n = 113, p < 0.001). For all whales, MI decreased in late afternoon vs. morning and early afternoon (Figure 5). In contrast, ST/R increased in late afternoon compared to morning and early afternoon (Figure 5). However, G ≥ 3 were predominantly engaged in MI, with only three such groups engaged in ST/R and none in TR (Figure 5). Sample sizes in morning (n = 1) and late afternoon (n = 2) were too small for this GT to discern any potential patterns by TOD. Similarly, M/C were also too infrequently seen (n = 3) for reasonable interpretation.
Confirmed feeding with lunge feeding behavioral events were observed on five separate occasions among blue whales. One was a M/C pair and the remaining four were S, all during spring or summer seasons. One S was observed feeding in the morning, the M/C pair was observed feeding in the early afternoon, and the remaining three S were observed feeding in the late afternoon. BS by Season, Distance to Shore (km) and Depth (m)
BS differed significantly between spring and summer among blue whale GT (χ2 = 40.44, df = 2, n = 111, p < 0.001). As only one P was observed during fall with no sightings during winter, analyses of BS were limited to spring and summer. During both spring and summer, TR was the dominant BS (52% and 50% respectively) followed by MI (31% and 24% respectively) and ST/R (13% and 23% respectively). MI was observed more during spring than summer while ST/R was observed more during summer. MI was observed more near coastal and shallow waters (mean 8.4 km and 250.2 m, SD = 5.00 and 164.82, respectively). In contrast, while TR and ST/R were both observed farther offshore and in deeper waters (mean 12.6 km (SD = 10.20)/443.3 m (SD = 320.420) and 15.5 km (SD = 13.83) /436.5 m (SD = 180.65), respectively). Cohesion
Cohesion measure for pairs (excluding M/C pairs given small sample size) and G ≥ 3 whales were collected for 16 pairs (32 individuals) and 8 groups (36 individuals). Among pairs, cohesion ranged from 1 to 20 BL with over 90% separated by 1 to 2 BL (Table 5). Mean distance to nearest neighbor was 1.3 BL (SD = 4.67). (Note that for pairs the mean, minimum, and maximum distance between nearest neighbor is the same because there are only two individuals.) Cohesion in G ≥ 3 whales was more variable, ranging from 1 to 50 BL with a mean minimum distance of 2.8 BL (SD = 2.76), a mean

Lomac-MacNair & Smultea 11
maximum of 25 BL (SD = 13.36), and an overall mean of 13.9 BL (SD = 7.15; Table 5). Cohesion was positively correlated with group size (R² = 0.39; Figure 6), which was statistically significant (p < 0.05). Thus, G ≥ 3 whales were more spread out than P, exhibiting less cohesive behavior.
Figure 5. Behavior State by TOD for all blue whales combined: A. Activities during the “morning” (0801 – 1159), B. Activities during the “early afternoon” (1200 – 1559), C. Activities during the “late afternoon” (1500 – 1959), D. Activities during “all periods” (0801 – 1959). Table 5 Mean and Standard Deviations of Minimum and Maximum Cohesion for Blue Whale Pairs (P) and Groups ≥ 3 Whales (G ≥ 3) Whales
Cohesion Index Pairs
(n = 14, 28 individuals) Groups of ≥ 3 whales (n = 8, 36 individuals)
Mean minimum distance to nearest neighbor (BL)
2.8 (± 2.76)
Mean maximum distance to nearest neighbor (BL)
25 (± 13.36)
Mean distance to nearest neighbor (BL)
1.3 (±4.67)
13.9 (± 7.15)
B A
C D

Lomac-MacNair & Smultea 12
Figure 3. Blue whale cohesion by group size.
Descriptive Analyses of Focal Sessions
27 July 2010 - Group of Six. On 27 July 2010 at 15:24 we encountered a group of six blue whales. The group composition consisted of four adults separated into two pairs and one M/C pair. A focal follow of ~20 min was conducted and 10:08 min of video footage was recorded. The following table (Table 6) and associated photos provide descriptive analyses of the event (Figures 7-8). The calf was slightly over one-half the length of the mother and consistently swam within 0.25 BL from the mother. The three pairs (two pairs of two adults and the M/C pair) were separated by 8-14 BL.
Figure 4. Photos of a pair of adult blue whales (1, 2, 4) and a photo of two pairs of blue whales (3) within a group of six blue whales on 27 July 2010.

Lomac-MacNair & Smultea 13
Table 6 Descriptive Analyses of a Group of Six Blue Whales (Four Adults and One Mother/Calf Pair) in July 2010 from Video Analyses
Video timestamp
Animals in View
Group Composition in
View
(Cohesion Index (BL)1 Details of observation Associated
Photos
00:00 – 04:08 Pair 1 2 Adults 1.5
Two adults within 1.5 BL, slow movement in the same direction. Surfacing synchronously. Observed at or subsurface throughout this ~4 min observational period.
1 & 2
05:21 – 05:30 Pair 1 & 2 4 Adults 1 Four adults (Pair 1 and Pair 2) at surface and all visible in video frame. All animals heading same direction.
3
04:29 – 06:05 Pair 2 2 Adults 1
Pair 2 observed ~14 BL from Pair 1. Two adults within 1 BL, slow movement in same direction. Surfacing synchronously. Observed at the surface or subsurface for this ~1.5 min observational period. Both animals fluke up dive at 06:05
4
06:10 Pair 2 & 3 2 Adults and mother/calf 0.25
Pair 3 surfaces 8 BL from visible fluke print of Pair 2, heading opposite direction from last visible heading of Pair 2
5
06:10 – 08:48 Pair 3 Mother/calf (n = 2) 0.25
Mother/calf pair, slow movement in same direction less than 0.25 BL apart, possible contact and touching. Calf on right side of mother. Observed at the surface or subsurface for this ~2.5 min observational period.
6 & 7
08:49 – 09:24 Pair 3 Mother/calf (n = 2) 0.25 Calf subsurface under mom's belly. 8
09:25 – 09:28 Pair 3 Mother/calf (n = 2) 0.25 Dive and no longer visible subsurface, end focal session at 10:08
1 Cohesion index representing the single closest (minimum) and farthest (maximum) distances between neighboring individuals.

Lomac-MacNair & Smultea 14
Figure 5. Photo of a blue whale adult pair (5) and photos of a mother-calf pair (6, 7, 8) within a group of six blue whales on 27 July 2010.
29 July 2010 Group of Three. On 29 July 2010 at 16:19 we encountered a group of three blue whales traveling slowly in a southeasterly direction (120 degrees magnetic) approximately 7 km from shore, where water depth was approximately 341 m. The group composition consisted of three adults. A focal follow of ~30 min was conducted and 16.5 min of video footage was recorded. The following table (Table 7, Figure 9) and associated photos provide descriptive analyses of the event.
Figure 6. Photos of the lead pair (9, 10, 11, 12) among a group of 3 blue whales on 29 July 2010.

Lomac-MacNair & Smultea 15
Table 7 Descriptive Analyses of Blue Whale Group on 29 July 2010
1 Cohesion index representing the single closest (minimum) and farthest (maximum) distances between neighboring individuals.
Discussion We provide a novel baseline quantitative understanding and description of natural blue whale
behavior and group dynamics in the SCB. This social perspective of blue whales is previously unreported and available only in the grey literature. Blue whales are thought to be largely solitary animals that aggregate in small numbers solely for foraging and breeding/calving (Mate et al., 1999; Sears & Perrin, 2009). Moreover, aggregations of feeding blue whales are believed to be individuals gathered for a common clumped food source rather than a socially interactive gathering (Mate et al., 1999). Actual breeding or courting of blue whales has never been published/reported and breeding and calving ground locations remain undiscovered or perhaps do not exist (Sears et al., 2014). In the SCB, blue whales are known to feed during spring, summer, and fall months and generally migrate south during late fall, returning to the SCB again the following spring. It is within this little described and little understood framework that we present and discuss the relative contributions of our study results.
Documenting and comparing patterns and frequencies of group dynamics and baseline behaviors among animals in groups can offer more insight into levels of biological organization than those at an individual level (West- Eberhard, 1983; Whitehead & Dufault, 1999). Group size/composition, cohesion,
Video Timestamp
Animals in View
Group Composition in
View
(Cohesion Index (BL)1 Details of Observation Associated
Photos
00:00 – 01:04
Animal
(A) 1, 2 & 3
3 Adults
2 - 12
Two adults (A1 & A2) traveling slowly SE within 2.5 BL. A1 directly in front of A2 and separated by 2 BL. Surfacing synchronously. Single adult (A3) surfacing ~12 BL behind A1 & A2, traveling in the same SW heading. A3 surfacing at different intervals than A1 & A2 (i.e., surfacing asynchronously). A1 & A2 exhibit fluke up dive at 1:04. A3 dive not observed.
9
01:04 – 10:00 A3 3 Adults NA A1, A2 & A3 sub surface and not visible for video observation.
10:00 – 11:06 A1 & 2 2 Adults 1 -12 A1 & A2 surfacing synchronously separated by 1 BL. A1 in lead and A2 directly behind.
10
11:06 A2 2 Adults 0.5 A2 increased speed and changed orientation slightly to left rear side of A1, BL distance decreased from 2.5 to 0.5.
11 & 12
11:06 – 13:55 A1, 2 & 3 3 Adults 0.5 – 12 A1 & A2 exhibit fluke up dive at ~13:55. A3 ~12 BL behind A1&2.
13:55 – 16:29 A3 3 Adults NA A3 at surface alone. Continuing same slow travel SW heading as the pair had been.

Lomac-MacNair & Smultea 16
and behavior are important factors that provide better understanding of habitat use and potential social, mating and feeding dynamics.
Our analyses show that blue whale group type and behavior state are significantly influenced by spatio-temporal variables in feeding and migration regions of the SCB. It is possible that there may be other variables responsible for these observed relationships such as prey behavior causing feeding to be more efficient at certain TOD or prey distribution located closer to shore than offshore. However, our results suggest that blue whales may interact socially and in a coordinated and synchronized manner during feeding and migration periods. Feeding and migrating blue whales are typically considered aggregations of individuals gathered solely to feed or because they share a migration route. While results herein are based on a relatively small sample size in a specific geographic region, they provide important quantified systematic and descriptive information suggesting that some blue whales instead are social while migrating and feeding.
The following Discussion is divided in to six subsections organized to follow the variables delineated in both the methods and results. Herein, results are interpreted and linked to initially proposed hypotheses and predictions, relative to a literature review. However, since very little is known about baleen whale social behavior, particularly for the typically oceanic blue whales, much of this discussion and postulations remain to be confirmed and further studied, as expected in the field of science. This Discussion section is followed by Conclusions, where the key contributions of results are discussed relative to their application and utility within the overall underlying framework of conservation and management of the blue whale. Group Type and Behavior State by Season
There is little to no information on blue whale group dynamics and associated behaviors,
including within the SCB, particularly relative to spatio-temporal factors. We predicted that GT and BS would vary by season and found this to be true for our study sample. GT differed between spring and summer for S, P and G ≥ 3. In spring, S animals were more common than P and M/C and no G ≥ 3 (non-calf) whales were observed. In contrast, G ≥ 3 were seen exclusively during summer (i.e., none were seen during spring, fall or winter). Overall, these results suggest that blue whales arrive from their southern presumed breeding migration to the SCB alone or in pairs. At this time, they form at least short-term (< 1 hr) social associations involving synchronized behavior and close cohesion spacing associated with the migration/feeding season. P were recorded during spring through fall, providing additional evidence that blue whales sometimes form at least short-term (< 1 hr) social associations during both foraging and migratory periods. Only one P was observed during fall, and no animals were observed during winter months. The latter results support other studies indicating that blue whales migrate to the SCB for the summer feeding season and depart in fall, presumably to spend the winter months in warmer, more southern waters. In addition to GT, BS also varied by season, with MI more frequent during spring and ST/RE more common during summer. This could be due to more foraging and social behaviors as animals arrive from migration, with a decrease in these behaviors during the summer with more resting intervals. Group Type and Behavior State by TOD
We predicted that both GT and BS would vary by TOD and found this prediction to be true. S
was the most commonly seen GT during all morning, early afternoon and late afternoon. M/C were only observed during the morning and early afternoon, although the sample size of M/C (n = 3) was too small to reach any meaningful interpretations. Regardless of GT, during late afternoon, most blue whales were engaged in ST/RE. In contrast, during morning and early afternoon, most blue whale GTs consisted of S or P engaging in MI and TR, with MI decreasing in late afternoon. Regardless of time of day, S was always the most commonly seen GT. This may be in part due to the fact that blue whales, being the largest of marine mammals, have a reduced risk of predation and are solitary for periods of time.

Lomac-MacNair & Smultea 17
During early afternoon and late afternoon G ≥ 3 were more common than S and P. Furthermore, most of these larger groups were engaged in either MI or ST/RE. This possibly correlates with social and feeding behaviors associated with foraging relative to the vertical migration of blue whale prey. Blue whale prey organisms migrate vertically upward to shallower water during night and downward to deeper water during the day (Wiggins, Oleson, McDonald, & Hildebrand 2005). Although surface feeding has been observed during the day, it is thought that blue whales at these daylight times are conducting deeper dives (100 m) into layers of euphausiids concentrated at depth (Calambokidis et al., 2007 Croll et al., 2001; Fiedler et al., 1998). In contrast, during evening and darkness, blue whales make comparably shallower dives associated with these prey rising to feed closer to the water surface, essentially following the ascent of their prey in the water column (Wiggins et al., 2005). When euphausiids are in deeper waters during the day, blue whales must expend more energy expenditure to find prey and forage. Thus, blue whales may rest or move between foraging areas in preparation for nighttime feeding when prey are closer to the surface and easier to consume. In both the Eastern Tropical Pacific and off southern California, patterns in blue whale call production have been correlated with patterns of prey distribution, with the highest calling rates occurring when prey have been reported to be closest to the surface (Stafford et al., 1999; Thompson, 1965). In California waters, Wiggins et al. (2005) found fewer blue whale calls produced during the day while prey are aggregated at depth and foraging is less efficient. More calls were produced during the twilight time periods when prey are vertically migrating and at night when prey are dispersed near the sea surface. Call peaks correlated with the vertical migration times of krill, the blue whales’ primary prey source. Group Type and Behavior State by Distance from Shore & Depth
Blue whales are most commonly reported as occurring in both offshore oceanic waters and more
coastal zones along the shelf. Our results indicate that blue whales in the SCB were seen over water depths ranging from 54 m – 1,465 m and areas 2.7 km to 47.7 km from shore. This observation supports previous descriptions that this generally pelagic species inhabits both offshore and near-coastal waters. However, behavior was found to vary by distance from shore and water depth at sighting. MI behavior occurred in shallow, more coastal waters whereas TR occurred in deeper offshore waters. Mate et al. (1999) associated feeding and foraging behaviors with clustered locations, based on 10 satellite-tagged blue whales in the northeastern Pacific. Therefore, this trend is a possible indicator that blue whales are moving inshore to forage and offshore to migrate or travel between high-productivity foraging areas. Fiedler et al. (1998) reported that blue whales in Southern California were found feeding in cold, well-mixed and productive upwelling zones on dense sub-surface layers of prey both on and extending off the shelf edge. Blue whales were found to feed primarily on euphausiids, Thysanoessa spinifer and Euphausia pacifica with a preference for the later species, often found in more coastal waters (Fiedler et al., 1998). Also supporting this, our results showed that G ≥ 3 were found in more nearshore waters. Both group type and behavior state recorded in shallow waters support the idea that groups of blue whales may aggregate in nearshore waters to feed, and then disperse to P or S animals as they travel between foraging areas or during resting periods.
Group Type and Behavior State
We found our prediction of GT to vary by BS to be true: BS for P was exclusively TR with no
other BS recorded. G ≥ 3 were only found engaging in MI or ST/RE, with no TR recorded. S animals were predominantly observed in TR with a small percentage in MI and ST/RE. This significant difference in BS observed between GT could indicate that S and P are traveling between foraging areas and congregating in larger groups in inshore waters where more milling, and presumably feeding occurs. This also leads to speculation that G ≥ 3 are congregating in nearshore waters specific to social and foraging interactions, subsequently disassociating into S and P for travel between these foraging areas. Thus, P are forming associations beyond solely foraging while in the SCB.

Lomac-MacNair & Smultea 18
Cohesion We found our prediction of cohesion to be true: as group size increased cohesion decreased,
indicating that pairs are more closely associated or cohesive and larger groups more spread out and thus less cohesive. Gowans, Würsig, and Karczmarski (2007) explain “animals form groups when survival and reproductive success of an individual is enhanced by group living.” Although blue whales are not reported or traditionally considered animals that form groups and conversely are considered to be more solitary, our results indicate that group formation is related to season, TOD, location, and behavior state. Benefits to groups for blue whales could include enhanced detection of prey and foraging techniques, enhanced reproductive opportunities, social interaction preparation for reproductive activity, ontogeny, learning, and reduced predation, as shown among terrestrial mammals (e.g., Krebs & Davies, 2009).
Focal follows and descriptive analyses from video support our aforementioned trends in blue whale group behavior and social dynamics. However, we are limited by relatively small sample sizes, particularly for blue whale mothers and calves, from one region of the SCB. Thus, more focal follow data would be necessary to draw stronger conclusions. Based on our study sample we found that within groups, synchronized coordinated pairs or sub-groups exist within which animals remain in close association. Subgroups or pairs within groups demonstrated synchronized surface and dive times. They moved in the same direction or pace for the relatively short durations of time they were in view at or near the water surface during video recorded visual observations. It is possible that these are short-term associations specific to feeding, migration or social behaviors. However, it is unclear if these associations continue for extended periods of time beyond the relatively short periods we observed them (< 1 hr). Sub-groups within groups have been documented as very important social components contributing to survival and thus reproductive success for multiple other species including primates. These subgroups have been shown to have stronger alliances, associate more commonly, and coordinate their behavior, including in competition with conspecifics within and across social groups (Lehmann & Dunbar, 2009). This has been hypothesized to occur because as group size increases, there comes a cost-benefit breaking point where it is more beneficial for an individual to invest in stronger associations with a few individuals than short multiple associations with all or many individuals (Lehmann & Dunbar, 2009). Conclusion
Observed variations and statistically significant trends in blue whale BS, GT and spatio-temporal variables are likely associated with foraging behaviors. This is not unexpected in the SCB where their prey experiences highly productive seasonal but patchy masses associated with characteristically high biological oceanographic productivity related to upwelling in the SCB summer and fall (Mate et al., 1999; Fiedler et al., 1998). However, at these times, we found distinctions related to GT, BS, and spatio-temporal factors previously unreported for this species. We found that blue whales in the SCB study years tended to aggregate in shallow coastal waters to feed, that P and S animals nearly always traveled, possibly between high-productivity foraging areas, and that the four M/C were found in offshore, deeper waters. GT was closely related to BS. P and S most frequently traveled possibly representing animals moving quickly between foraging or socializing areas. In contrast, G ≥ 3 were nearly always engaged in ST/RE and/or MI. These larger groups may thus represent aggregations of blue whales gathered where their prey is clumped to forage (i.e., mill) resulting in increased social interactions. After feeding, these larger groups may rest and socialize in a productive feeding area while their prey are at depth during peak daylight hours, after which they may again resume feeding.
Overall our findings show that as group size increased individuals were found to be less cohesive and more spread out. The time duration of social associations between blue whale pairs and groups is unknown based on available studies. Such associations are suspected to be short term however there is little published literature on group associations for this species. We hypothesize that P associations are longer-term than previously thought. It is possible that P are traveling between foraging areas and associating within a group but remain in the P association. We base this working hypothesis on the small
Lomac-MacNair & Smultea 19
number of focal follows we analyzed from video, where the “paired” animals remained in close association, synchronizing surface intervals and movement speeds and headings.
In conclusion, this study found that BS is related to GT. In addition, GT and BS are influenced by spatio-temporal variables. Our narratives of inter-whale associations from focal follows of two different blue whale groups provide additional insight into blue whale group behavior, demonstrating P association behaviors among groups (i.e., synchronicity in surfacing and movements). Results provide the first quantitative summary of inter-relationships between blue whale behavior, group dynamics and spatio-temporal variables. These first glimpses into the social lives of blue whales in the SCB suggest the importance of considering and differentiating the influences of inter-animal associations and spatio-temporal factors when assessing potential impacts of anthropogenic activities. The latter approach is critical in order to separate “normal” behaviors from the effects of anthropogenic factors and to consider their potential interactions.
Acknowledgements
Thank you to Smultea Environmental Sciences team for their support, reinforcement and constant
inspiration: G. Campbell, S. Corbis, H. Dramis, R. Grady, J. Hopkins and S. Steckler. Gratitude to the various reviewers: M. Anderson, D. Fertl, J. Hopkins, A. and L. Lomac-MacNair, S. Leiter and A. Zoidis, Thanks to D. Steckler for the use and genius of Mysticetus. Thanks to those who participated in the aerial surveys and assisted in the collection and/or processing of data: K. Ampela, J. Biondi, J. Black, A. Bowles, C. Boerger, J. Bredvik, M. Cotter, M. Deakos, D. Engelhaupt, A. Fowler, G. Fulling, S. Garrett, V. James, T.A. Jefferson, C. Johnson, C. Kyburg, M. MacKay, L. Mazzuca, R. Merizan, J. Mobley, Jr., M. Moore, T. Norris, M. Richie, and D. Steckler. Many thanks to the Aspen Helicopters Team (C. Bartush, A. Blasingame, N. Carillo, M. Estomo, B. Hansen, D. Moody, R. Throckmorton, I. Ufford, and K. Veatch). The U.S. Navy, U.S. Pacific Fleet, either through Smultea Environmental Sciences, or through HDR, provided funding for the aerial surveys and we especially thank C. Johnson, J. Bredvik, and K. Ampela for their help. Data were collected under NMFS permit numbers 14451, 15369, and 774-1714-09.
References Altmann, J. (1974). Observational study of behavior: Sampling methods. Behaviour, 49, 227–266. Boinski, S., & Mitchell, C. L. (1994). Male residence and association patterns in Costa Rican squirrel monkeys
(Saimiri oerstedi). American Journal of Primatology, 34, 157–169. Buckland, S. T., Anderson, D. R., Burnham, K. P., Laake, J. L., Borchers, D. L., & Thomas, L. (2001). Introduction
to distance sampling estimating abundance of biological populations. Introduction to distance sampling: Estimating abundance of biological populations (pp.1–28). Pondicherry, India: Springer Science & Business Media.
Burtenshaw, J. C., Oleson, E. M., Hildebrand, J. A., McDonald, M. A., Andrew, R. K., Howe, B. M., & Mercer, J. A. (2004). Acoustic and satellite remote sensing of blue whale seasonality and habitat in the Northeast Pacific. Deep Sea Research – Part II, 51, 967–986.
Calambokidis, J., & Barlow, J. (2004). Abundance of blue and humpback whale in the Eastern North Pacific estimated by capture-recapture and line transect methods. Marine Mammal Science, 20, 63–85.
Calambokidis, J., Chandler, T., Falcone, E., & Douglas, A. (2004). Research on large whales off California, Oregon, and Washington in 2003 (Report No. 50ABNF100065). Retrieved from http://www.cascadiaresearch.org/reports/rep-03-SW-final.pdf.
Calambokidis, J., Schorr, G. S., Steiger, G. H., Francis, J., Bakhtiari, M., Marshall, G., ... Robertson, K. (2007). Insights into the underwater diving, feeding, and calling behavior of blue whales from a suction-cup-attached video-imaging tag (CRITTERCAM). Marine Technology Society Journal, 41(4), 19–29.

Lomac-MacNair & Smultea 20
Calambokidis, J., Steiger, G. H., Cubbage, J. C., Balcomb, K. C., Ewald, C., Kruse, S., ...Sears, R. (1990). Sightings and movements of blue whales off central California 1986-88 from photo-identification of individuals. Report of the International Whaling Commission, Special Issue 12, 343–348.
Calambokidis, J., Steiger, G. H., Curtice, C., Harrison, J., Ferguson, M. C., Becker, E., ... & Van Parijs, S. M. (2015). 4. Biologically important areas for selected cetaceans within US waters–West Coast region. Aquatic Mammals, 41(1), 39–53.
Carretta, J. V., Forney, K. A., Lowry, M. S., Barlow, J., Baker, J. Johnston, D., . . . Carswell, L. (2009). Draft U.S. Pacific Marine Mammal Stock Assessments: 2009. (NOAA Technical Memorandum NOAA-TM-NMFS-SWFSC-xxx). Retrieved from http://swfsc.noaa.gov//prd-sars.aspx?ParentMenuId=148
Croll, D. A., Acevedo-Gutiérrez, A., Tershy, B. R., & Urbán-Ramı ́rez, J. (2001). The diving behavior of blue and fin whales: Is dive duration shorter than expected based on oxygen stores? Comparative Biochemistry and Physiology Part A: Molecular & Integrative Physiology, 129, 797–809.
Dwyer, C. M., & Lawrence, A. B. (1999). Does the behaviour of the neonate influence the expression of maternal behaviour in sheep? Behaviour, 136, 367–389.
Fiedler, P. C., Reilly, S. B., Hewitt, R. P., Demer, D., Philbrick, V. A., Smith, S., ...Mate, B. R. (1998). Blue whale habitat and prey in the California Channel Islands. Deep Sea Research Part II: Topical Studies in Oceanography, 45, 1781–1801.
Forney, K. A., & Barlow, J. (1998). Seasonal patterns in the abundance and distribution of California cetaceans, 1991–1992. Marine Mammal Science, 14, 460–489.
Freeberg, T. M. (1999). Spatial associations provide a context for social learning of courtship patterns in brown-headed cowbirds (Molothrus ater). Journal of Comparative Psychology, 113, 327.
Goldbogen, J. A., Calambokidis, J., Croll, D. A., McKenna, M. F., Oleson, E., Potvin, J., ...Tershy, B. R. (2012). Scaling of lunge-feeding performance in rorqual whales: Mass-specific energy expenditure increases with body size and progressively limits diving capacity. Functional Ecology, 26, 216–226.
Goldbogen, J. A., Southall, B. L., DeRuiter, S. L., Calambokidis, J., Friedlaender, A. S., Hazen, E. L., ...Kyburg, C. (2013). Blue whales respond to simulated mid-frequency military sonar. Proceedings of the Royal Society of London B: Biological Sciences, 280(1765). doi: 10.1098/rspb.2013.0657
Gowans, S., Würsig, B., & Karczmarski, L. (2007). The social structure and strategies of delphinids: Predictions based on an ecological framework. Advances in Marine Biology, 53, 195–294.
Hazen, E. L., Friedlaender, A. S., & Goldbogen, J. A. (2015). Blue whales (Balaenoptera musculus) optimize foraging efficiency by balancing oxygen use and energy gain as a function of prey density. Science Advances, 1(9), e1500469. doi: 10.1126/sciadv.1500469
Hucke-Gaete, R., Osman, L. P., Moreno, C. A., Findlay, K. P., & Ljungblad, D. K. (2004). Discovery of a blue whale feeding and nursing ground in southern Chile. Proceedings of the Royal Society of London Series B: Biological Sciences, 271, S170–S173.
Krebs, J. R., & Davies, N. B. (2009). Behavioural ecology: An evolutionary approach. Oxford, UK: John Wiley & Sons.
Lehmann, J., & Dunbar, R. I. M. (2009). Network cohesion, group size and neocortex size in female-bonded old world primates. Proceedings of the Royal Society of London B: Biological Sciences, 276B, 4417–4422. doi: 10.1098/rspb.2009.1409
Malme, C. I., Würsig, B., Bird, J. E., & Tyack, P. (1988). Observations of feeding gray whale responses to controlled industrial noise exposure. Port and ocean engineering under arctic conditions, 2, 55–73.
Mann, J. (1999). Behavioral sampling methods for cetaceans: A review and critique. Marine Mammal Science, 15, 102–122.
Mate, B. R., Lagerquist, B. A., & Calambokidis, J. (1999). Movements of north pacific blue whales during the feeding season off southern California and their southern fall migration. Marine Mammal Science, 15, 1246–1257.
McDonald, M. A., Calambokidis, J. C., Terinishi, A., & Hildebrand, J. A. (2001). The acoustic calls of blue whales off California with gender data. Journal of the Acoustical Society of America, 109, 1728–1735.
Oleson, E., Calambokidis, J., Burgess, W., McDonald, M. C. L., & Hildebrand, J. (2007). Behavioral context of call production by eastern North Pacific blue whales. Marine Ecology Progress Series, 330, 269–284.
Ottestad, P. (1950). On age and growth of blue whales. Hvalrådets Skrifter, 33, 67–72.

Lomac-MacNair & Smultea 21
Reilly, S. B., & Thayer, V. G. (1990). Blue whale (Balaenoptera musculus) distribution in the eastern tropical Pacific. Marine Mammal Science, 6, 265–277.
Richardson, W. J., Fraker, M. A., Würsig, B., & Wells, R. S. (1985). Behaviour of bowhead whales (Balaena mysticetus) summering in the Beaufort Sea: Reactions to industrial activities. Biological Conservation, 32, 195–230.
Richardson, W. J., Greene, Jr., C. R., Malme, C. I., & Thomson, D. H. (1995). Marine mammals and noise. San Diego, CA: Academic Press.
Sears, R. (1987). The photographic identification of individual blue whales (Balaenoptera musculus) in the Sea of Cortez. Cetus, 7(1), 14–17.
Scheidat, M., Friedlaender, A., Kock, K. H., Lehnert, L., Boebel, O., Roberts, J., & Williams, R. (2011). Cetacean surveys in the Southern Ocean using icebreaker-supported helicopters. Polar Biology, 34, 1513–1522.
Schoenherr, J. R. (1991). Blue whales feeding on high concentrations of euphausiids around Monterey Submarine Canyon. Canadian Journal of Zoology, 69, 583–594.
Sears, R., & Larsen, F. (2002). Long range movements of a blue whale (Balaenoptera musculus) between the Gulf of St. Lawrence and West Greenland. Marine Mammal Science, 18, 281–285.
Sears, R., & Perrin W. F. (2009) Blue whale (Balaenoptera musculus). In: W. F. Perrin, B. Würsig, J. G. M. Thewissen (Eds.), Encyclopedia of marine mammals (pp. 120 – 124). San Diego, CA: Academic Press.
Sears, R., Ramp, C., Douglas, A. B., & Calambokidis, J. (2014). Reproductive parameters of eastern North Pacific blue whales Balaenoptera musculus. Endangered Species Research, 22, 23–31.
Smultea, M. A., & Bacon, C. E. (2012). A comprehensive report of aerial marine mammal monitoring in the Southern California Range Complex: 2008-2012. Prepared for Commander, US Pacific Fleet, Pearl Harbor, Hawaii. Submitted to Naval Facilities Engineering Command Southwest (NAVFAC SW), EV5 Environmental, San Diego, 92132 under Contract No. N62470-10-D-3011 issued to HDR, Inc., San Diego, California.
Stafford, K. M., Nieukirk, S. L., & Fox, C. G. (1999). Low-frequency whale sounds recorded on hydrophones moored in the eastern tropical Pacific. The Journal of the Acoustical Society of America, 106, 3687–3698.
Thompson, P. O. (1965). Marine biological sound west of San Clemente Island (No. Nel-1290). San Diego, CA: Navy Electronics Lab.
Urick, R. J. (1972). Noise signature of an aircraft in level flight over a hydrophone in the sea. The Journal of the Acoustical Society of America, 52, 993–999.
West-Eberhard, M. J. (1983). Sexual selection, social competition, and speciation. Quarterly Review of Biology, 155–183.
Whitehead, H., & Dufault, S. (1999). Techniques for analyzing vertebrate social structure using identified individuals: Review and recommendations. Advances in the Study of Behavior, 28, 33-74.
Wiggins, S. M., Oleson, E. M., McDonald, M. A., & Hildebrand, J. A. (2005). Blue whale (Balaenoptera musculus) diel call patterns offshore of Southern California. Aquatic Mammals, 31, 161-168.
Würsig, B., Dorsey, E. M., Fraker, M. A., Payne, R. S., Richardson, W. J., & Wells, R. S. (1984). Behavior of bowhead whales, Balaena mysticetus, summering in the Beaufort Sea: Surfacing, respiration, and dive characteristics. Canadian Journal of Zoology, 62, 1910–1921.
Würsig, B., Dorsey, E. M., Fraker, M. A., Payne, R. S., & Richardson, W. J. (1985). Behavior of bowhead whales, Balaena mysticetus, summering in the Beaufort Sea: A description. Fishery Bulletin, 83, 357–377.
Würsig, B., Wells, R. S., & Croll, D. A. (1986). Behavior of gray whales summering near St. Lawrence Island, Bering Sea. Canadian Journal of Zoology, 64, 611–621.
Yochem, P. K., & Leatherwood, S. (1985). Blue whale Balaenoptera musculus (Linnaeus, 1758). In S. H. Ridgway, & R. Harrison (Eds.), Handbook of marine mammals: Vol. 3 (pp. 193 – 240). London, UK: Academic Press.