Blue Fox Enterprises NV annual report 2006...Blue Fox Enterprises NV annual report 2006 Blue Fox...
33
Blue Fox Enterprises NV annual report 2006 Blue Fox Enterprises NV annual report 2006 Blue Fox Enterprises N.V. Ir. D.S. Tuynmanweg 10 4131 PN Vianen the Netherlands P.O. Box 151 4130 ED Vianen the Netherlands Telephone +31 347 329 755 Fax +31 347 329 736 E-mail [email protected] Internet www.bluefox.nl Trade register Utrecht Chamber of Commerce under number 23092326.
Transcript of Blue Fox Enterprises NV annual report 2006...Blue Fox Enterprises NV annual report 2006 Blue Fox...

Blue Fox Enterprises NV annual report 2006
Blue Fox Enterprises NV annual report 2006
Blue Fox Enterprises N.V.
Ir. D.S. Tuynmanweg 10
4131 PN Vianen
the Netherlands
P.O. Box 151
4130 ED Vianen
the Netherlands
Telephone +31 347 329 755
Fax +31 347 329 736
E-mail [email protected]
Internet www.bluefox.nl
Trade register Utrecht Chamber of Commerce
under number 23092326.

Blue Fox Enterprises NV annual report 2006

Contents
1 Letter from the CEO 4
2 Key figures 7
3 Profile 8
Company profile 8
Description of the divisions 8
4 Composition of the Boards 11
Board of Directors 11
Supervisory Board 11
5 Report of the Board of Directors 12
Operational review 2006 12
Financial review 2006 12
Staff and organisation 13
6 Report of the Supervisory Board 15
7 Corporate governance 17
8 Shareholders’ information 18
9 Risk & Control 21
10 Financial statements 2006 25
11 Other information 58

4 5
1 Letter from the CEODear shareholder,
The year 2006 has been a year of drastic changes for Blue Fox. The cost reduction measures
announced in 2005 proved to be inadequate given the revenue and margin development
seen during the first quarter of 2006. The lagging result development necessitated further
restructuring and stringent measures. After Mr. Eisma’s departure in May 2006, the
organisation was assessed by an external agency at the request of the Supervisory Board.
The ensuing report pointed out that drastic measures were vital to transform Blue Fox into
a profitable organisation again.
During the second half of 2006, we worked intensively on the turnaround. The holding
has been downsized and the Dordrecht head office was closed. We sold Reset C&T B.V.,
a specialist in the secondment of CAD specialists, to the management of this subsidiary.
Recently we were able to close the sale of Carrier to Carrier Telecom, another non-core
activity. In this case as well, we sold the company to the management of the subsidiary.
The sales organisation of the textile and apparel division has been restructured drastically.
We were able to secure a new credit facility with our bank to bridge the period of the
planned turnaround. The restructuring inevitably led to considerable one-off costs, relating
to severance payments, legal expenses and other costs. A total of € 4.4 million has been
charged to the 2006 results, including other provisions.
However, cost reductions were not the only item on the agenda. Establishing the strategic
direction of the company received a great deal of attention and it became clear that our
good position in the textile and apparel industry justifies investments to develop the next
generation of software for CAD/CAM. Furthermore, the development of ERP software in the
Microsoft Industry Builder Initiative is developing well. The first release of the software was
certified in mid-January 2007, after a short delay. Expectations are that the first turnover
related to this new software will be recorded in 2007.
The comprehensive turnaround, the reduction of debts and the investments in the textile
and apparel software development could not be financed from the current cash flow. We
therefore started to put operating companies up for sale. On this basis, we will create the
position to fully focus on the chances and opportunities in the textile and apparel industry,
for which we are able to free up the funds necessary thanks to all the measures taken
since mid-2006.
Although the textile and apparel division did not contribute to the result for 2006, we
expect this division to form the basis of future growth, partly based on the slightly
improved market conditions. Determining factors are the quality of the new generation
CAD/CAM software and the future success of the ERP software. The cooperation with
Microsoft is currently in the second phase of development. After the conclusion of this
phase, the marketing power of Microsoft could play a significant role in the future success
of the ERP software.
Due to all the hard work, we are far better positioned at the beginning of 2007 than we
were one year ago. Obviously there is no reason to be proud of an operating loss of € 6.8
million, which we incurred over 2006, but we should realise that € 4.4 million of this loss
was due to one-off costs and impairments.
The year 2007 will be a transitional year for Blue Fox. Much will depend upon the pace at
which our new ERP software for the textile and apparel industry builds up a presence in
the market. The expectations are high, but it is difficult to make a reliable assessment.
Combined with Microsoft’s marketing power, a fascinating new beginning could be made
with the new generation of software.
Finally, I would like to thank our customers and business partners for their continued
support and all Blue Fox staff for their commitment during this difficult year. Your
contributions have been key in realising the turnaround and achieving a better starting
position for the new year.
Vianen, 4 April 2007
Cees van Steijn,
Chairman of the Board of Directors
name Ruud de Jong
position Channel Manager
division Blue Fox Porini Sales Department
“It is amazing. Our participation in the Microsoft Industry BuilderInitiative is like a high-speed train. The main challenge this year is to go forward at the same speed.”
What is your job at Blue Fox? “I divide my time between our offices in the Netherlands and Lomazzo
in Italy. This means I am involved in two roles. My main responsibility as a channel manager
is business development. In Italy I am part of the ‘Microsoft Project’ team that delivers the
software for Microsoft’s Dynamics AX solutions suite. In this capacity I am responsible for all
sales activities in Australia, New Zealand and Europe excluding Italy, regarding our enterprise
resource planning software for the textile and apparel industry, known as Blue Fox Porini.”
What are you proud of? “I am very proud of the trust customers have in our solution. Although the
second release of our ERP-solution for Microsoft Dynamics AX is scheduled for end 2007, we
already signed our first deal in December 2006. This is a testimony to the confidence our
clients have in Blue Fox and Microsoft. You mustn’t forget that our people in Lomazzo have a
tremendous track record in the textile and apparel industry. If you manage to merge more than
37 years of experience in this business with all the innovative power of Microsoft, you know
that you have created something extraordinary.”
Outlook for 2007 “Our software was recently tested and certified by Microsoft. We even received
the highest scores of all the industrial builders that provide their vertical industry segment
solutions for Microsoft Dynamics. Our main focus in 2007 is to expand our network of Value
Added Resellers worldwide. In March 2007, we officially launched the Microsoft solution in
San Diego. From there on we will carefully execute our Go to Market strategy together with
Microsoft.”
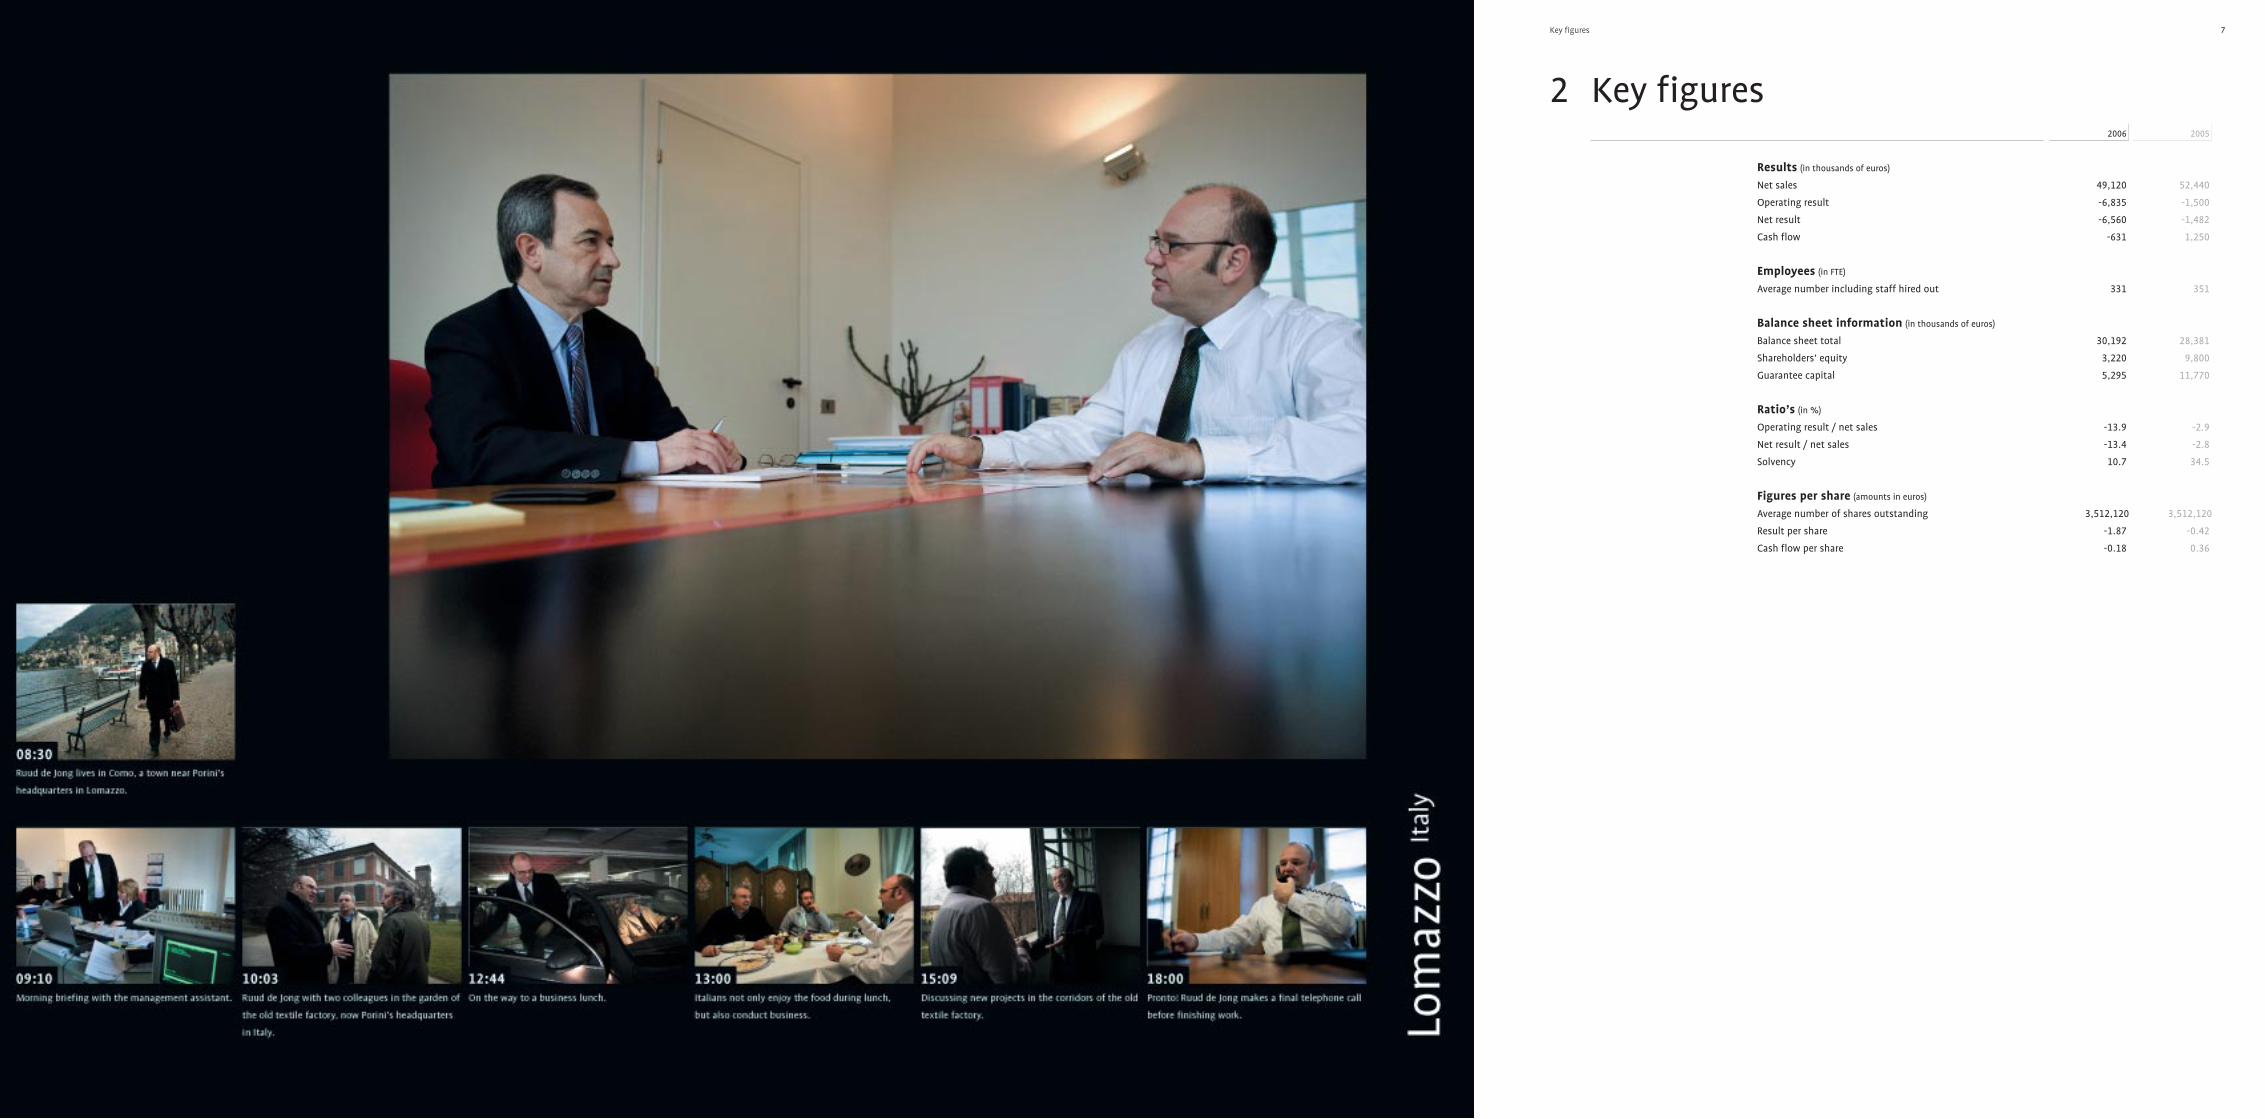
7Key figures
2 Key figures
Results (in thousands of euros)
Net sales 49,120 52,440
Operating result -6,835 -1,500
Net result -6,560 -1,482
Cash flow -631 1,250
Employees (in FTE)
Average number including staff hired out 331 351
Balance sheet information (in thousands of euros)
Balance sheet total 30,192 28,381
Shareholders’ equity 3,220 9,800
Guarantee capital 5,295 11,770
Ratio’s (in %)
Operating result / net sales -13.9 -2.9
Net result / net sales -13.4 -2.8
Solvency 10.7 34.5
Figures per share (amounts in euros)
Average number of shares outstanding 3,512,120 3,512,120
Result per share -1.87 -0.42
Cash flow per share -0.18 0.36
2006 2005

98 Profile
complete supply chain, and personal service (customisation)
in all stages of the design, production and resource planning
process. Furthermore, Blue Fox supports clients in almost every
segment of the trade, including vertical producers (fibre to
finished garment) or importers of apparel, footwear, textile,
home furnishings, outdoor and fashion accessories.
With its NedGraphics software solutions, Blue Fox has over
28 years of experience in developing, marketing and supporting
the leading CAD/CAM software for thousands of companies
worldwide. The NedGraphics software line covers solutions for
textile design (CAD) and production (CAM) associated with:
• Fashion and apparel
• Woven textiles
• Printed textiles
• Floor coverings (woven, tufted, and printed)
• Product presentation & merchandising
• Design management & communication
• Networking of production machines
The Porini software is the leading Enterprise Resource Planning
solution for the textile and apparel industry. It entails more than
38 years of experience in the development and implementation
of innovative, world-class IT solutions. The Porini software line
offers a broad and powerful suite of applications helping
organisations to optimise their activities and results with
respect to:
• Product development
• Sales and order management
• Sourcing
• Manufacturing
• Planning and scheduling
• Production monitoring
• Forecasting
• Supply chain management
• Distribution
• Retail
Profile
Company profile
Blue Fox is a global provider of high-quality software solutions
and services for manufacturers and designers of the products,
designs and brands which surround us in our day-to-day lives.
Either in the form of fashion items, accessories, carpets, or other
woven materials, but also in the form of buildings, machines
and appliances, roads, bridges, waterways, etc.
Through its Textile and Apparel Software division, Blue Fox
develops Computer Aided Design (CAD) and Computer Aided
Manufacturing (CAM) and Enterprise Resource Planning (ERP)
system software for the international textile and apparel industry.
The software aids the design and production of textiles, as well
as sales and order management, planning and scheduling,
forecasting, supply chain management, and distribution.
Blue Fox NedGraphics develops software for design studios to
create, visualise and present their products. Textile and fashion
product manufacturers are using Blue Fox software to operate
their production machines. More and more companies operating
in the global textile and apparel industry are beginning to use
Blue Fox Porini Enterprise Resource Planning software to further
improve their efficiency. Furthermore, Blue Fox Porini was selected
by Microsoft as their partner for the development of the vertical
ERP software for the textile and apparel market. This new ERP
software will be introduced in 2007.
The company’s Engineering and Geographic Information
Software (GIS) division designs and distributes software for
governments and for engineering applications in mechanical and
civil engineering, construction and architecture, and industrial
design. In the engineering and industrial design sector, Blue Fox
subsidiary Pollux helps its clients throughout the Benelux to
increase their productivity and fully exploit their creative
capabilities. In addition, Blue Fox develops highly sophisticated
geographic information software solutions, mainly used by
municipal, provincial and national governmental organisations
in the Netherlands.
Blue Fox employs about 330 staff worldwide. Software
development activities are concentrated in three locations:
Vianen (the Netherlands), Lomazzo (Italy) and Bucharest
(Romania). Consultancy services, sales and support activities are
carried out locally through a global network of regional offices
and agents in 35 different countries. Blue Fox’s global operations
in 2006 generated sales of approximately € 49 million, of which
the Textile and Apparel Software division contributed
approximately 35%, with the Engineering and Geographic
Information Software division accounting for about 56%.
Blue Fox Enterprises N.V. shares are listed on Eurolist of Euronext
Amsterdam N.V.
Description of the divisions
Engineering & GIS division The Engineering and
Geographic Information Software division consists of two
operations in the Benelux. The division sells software to support
processes involving Computer Aided Design, visualisation and
presentation activities. Not only for environments traditionally
associated with the engineering profession, but also for market
segments such as media & entertainment, building & construction
and the public sector.
Pollux is specialised in the distribution of standardised design,
visualisation and presentation software. This software is produced
by leading manufacturers in this field and sold to professional
users through a network of independent resellers. The vast
majority of sales consist of AutoCAD software produced by
Autodesk. This design software is the de facto standard application
in engineering professions. The company has managed to develop
a long-lasting and mutually beneficial relationship with Autodesk
as that company’s distribution agent in the Benelux, as well as
with a number of producers of other leading software brands.
Technological innovations relating to design software - such as the
improved three-dimensional modelling, photo-realistic visualisation
and animation features - are making these applications
increasingly popular with end-users in other design professions.
NedGraphics CAD/GIS develops and markets specific software
solutions for geographic information systems. The company has
a firmly established client base in the Netherlands, mainly selling
its products and services to local and central governments,
engineering and building companies. The division’s market
share of geographic information systems in the municipal
government market is over 50%. In general, the production of
computerised maps continues to be the responsibility of
departments involved in surveying, town planning, road
construction and the maintenance of infrastructural works.
However, the advantage of adding other types of information to
these maps has opened up channels of communication to other
users and potential customers for the company. The combination
of browser functionality for intranet viewing and operational
data storage products marketed by NedGraphics CAD/GIS is
becoming the de facto standard front office solution for
municipalities, just as its NedView application has become the
standard desktop viewer for geographic information systems.
Textile & Apparel division The Textile and Apparel
Software division develops and markets innovative software
solutions for the global textile and apparel market. It comprises
two different groups of software solutions: design and production
software applications marketed under the name Blue Fox
NedGraphics, and Enterprise Resource Planning systems market-
ed under the name Blue Fox Porini. Blue Fox fully supports its
customers by providing both flexible solutions, covering the
3 Profile
name Jeroen Leeuw
position Product & Account Manager
division Pollux B.V.
“The shift from 2D to 3D has a huge impact on the way products are designed.”
What is your job at Blue Fox? “Actually, I have several roles. As a product manager, I provide product
support for our clients, operating between technology and marketing. As an account manager,
I am responsible for our key accounts. Finally, I am also part of the Pollux Management Team.”
What are you proud of? “I am very proud of the fact that we obtained the distribution rights for
Autodesk’s Building Solutions in the Benelux. Until last year we only had the right to distribute
the general AutoCAD software. Now we can offer a much broader range of solutions to our
customers, such as Autodesk ADT and the Autodesk Revit series. This is a major step forward
for Pollux if you consider that the building market is one of the fastest growing markets for
CADware. Moreover, we now offer more added value in training, support and implementation.”
Outlook for 2007 “2007 will be a fascinating year. The breakthrough of 3D has triggered new and
broader demand for high-end design, visualisation and presentation software in more diverse
market segments. It will also be a ‘transition year’ for us, during which we will further expand
our knowledge of the building market. One of the challenges is regulation. Every country has
different laws when it comes to designing and building houses. How can we help our clients
with these local compliance issues? All in all, I am convinced that we have the right team and
the right people to match our ambitions.”

11Composition of the Boards
Board of Directors
Cees van Steijn (1951) Chairman Cees van Steijn studied
Business Economics in Amsterdam, and got his MBA at IMD in
Lausanne. During the 1970s, he gained international experience at
Fokker B.V. After earning his Master’s Degree in 1981, he worked
for 12 years at the Amsterdam-based management consultancy
firm Van de Bunt, where he was a Senior Consultant and partner.
He served as Managing Director of two publishing companies,
first at Meulenhoff Educatief B.V. in Amsterdam from 1993, and
from 1996 also at the Leiden-based SMD Uitgevers. From 1999,
Cees van Steijn served on the boards at Amsterdam RAI B.V.,
Newconomy N.V., Landis ICT Group N.V., NOB N.V., Veronica and
Priority Telecom N.V. These positions entailed that Cees van
Steijn was also a member of the supervisory boards of various
companies (e.g., SBS Broadcasting, Veronica Holding, Explainer
DC and Centraal Boekhuis).
Sjoerd W. Eisma (1950) Chairman* Sjoerd Eisma started
selling PC CAD systems after a management buy-out in 1985,
which in 1990 led to the incorporation of Blue Fox Enterprises
and a number of subsidiaries. Sjoerd Eisma was the Chairman
of the Board of Directors of Blue Fox Enterprises, responsible
for Investor Relations and the strategy of the company. He was
also responsible for the control of the operating companies.
Roelof J. Brolsma (1951) Member** Roelof Brolsma joined
Blue Fox Enterprises in 1991 as Business Development Manager
and was appointed Managing Director of Blue Fox subsidiary
TOPCAD in 1996. He joined the Board of Directors at the time of
the listing in 1999, and was responsible for business development,
acquisitions, divestments and strategic alliances.
* Mr. Eisma resigned from the Board of Directors as per 2 May 2006.** Mr. Brolsma resigned from the Board of Directors as per
1 December 2006.
Supervisory Board
Servaas L.M. Houtakkers (1959) Chairman Mr. Houtakkers graduated from Nijmegen University and
started his professional career as a corporate lawyer at Hendrix
International, which is better known now as the Euronext
Amsterdam-listed company Nutreco NV, before moving to
MeesPierson NV’s legal department in Amsterdam. In the early
1990s, he pioneered the banking and trust activities of
MeesPierson in Belgium. In 1994, he was appointed Managing
Director of MeesPierson Trust Luxembourg and subsequently
appointed Managing Director of MeesPierson (Luxembourg)
Banquiers. He moved to Brussels in 1997, where he acted as Chief
Operating Officer of EASDAQ NV/SA and subsequently, from late
1998, continued his career at Merrill Lynch NV in Amsterdam.
He was appointed managing partner with a Brussels-based
corporate services company in 2001, which company was sold to
an international trust company in 2003. Mr. Houtakkers has
been active as a corporate consultant since January 2005. He is
a member of the advisory board of Greening International
Partners and was a member of the managing board of Burani
Designer Holding BV until February 2007. He was Chairman of
the Board of Directors of Prolion Holding NV from 2002 until
September 2004 and of Interbanca International Holding SA
from 2003 until March 2005.
Pierre A.M. Pellenaars (1945) Member Mr. Pellenaars
graduated in business economics from Tilburg University. His
(former) positions include membership of the Executive Board
of Gebr. Broere B.V. in Dordrecht and Senior Vice-President
Finance & Administration of Koninklijke Pakhoed N.V.
Mr. Pellenaars was subsequently Chairman of the Board of
Directors of Wilton-Feijenoord Holding B.V. and Chairman of the
Board of Directors of RDM Nederland B.V. Mr. Pellenaars has been
active as corporate advisor and as private investor since January
2000. In addition, Mr. Pellenaars is President of the Supervisory
Board of SLTN Group B.V. and a Supervisory Board member of
Sanadome Holding N.V., Winwind B.V., Indus PS B.V. (holding
company of MPE B.V.) and Thermae 2000 N.V.
Ton Pannekoek (1949) Member Mr. Pannekoek holds a
degree in business economics from the H.E.A.O. in Arnhem and
completed executive courses at Insead-Fontainebleau and the
Harvard Business School in Boston. He held several sales positions
with Burroughs (Unisys) during a nine-year period and was Sales
Director of Apple Computer B.V. before starting Compaq
Computer B.V. in the Netherlands in 1987. He was Managing
Director of Compaq Nederland until 2000, with various European
accreditations. Since then, Mr. Pannekoek has been active as
corporate consultant, private investor and Chairman of the
Supervisory Board of Compu’Train B.V.
Leon P.E.M. van den Boom (1952) Member Mr. Van den
Boom studied at the University of Groningen and the Vrije
Universiteit in Amsterdam and is a business economist and
chartered accountant. He worked for the University of
Washington and for ABN Bank, was a partner at Van de Bunt,
Managing Partner at the Van den Boom Groep, was a member
of the Executive Board of NIB Capital Bank N.V. He has been
working as an independent consultant since 2003.
Mr. Van den Boom specialises in issues in the field of Corporate
Finance and Corporate Governance. He holds supervisory
directorships at ASM International, Vanderlande Industries,
Integrated Engineering and Bijzonder Jeugdwerk Beheer.
He is Chairman of the Stichting Administratiekantoor of
Het Financieele Dagblad Holding and a member of the Board
of Stichting Administratiekantoor Fugro N.V.
4 Composition of the Boards

1312 Report of the Board of Directors
Due to the negative results of recent years, Blue Fox has
carry-forward losses available. To the extent that this deferred
tax asset exceeds the deferred tax liability as a result of losses
carried forward (on balance € 2.9 million), these are not
recognised, as it is not certain that they can be offset with
taxable profit in the near future.
The assets and liabilities related to Carrier to Carrier, the operating
company that was sold on 1 March 2007, are included in the final
balance sheet under ‘assets held for sale’ as required by IFRS 5.
Provisions at year-end 2006 in the balance sheet amounted to
€ 1.3 million (2005: € 0.3 million). These provisions relate to
restructuring costs and costs related to the early termination
or renegotiation of commercial contracts.
Shareholders’ equity decreased from € 9.8 million at the end
of 2005 to € 3.2 million at 31 December 2006. The guarantee
capital amounted to € 5.3 million at 31 December 2006
(2005 year-end: € 11.8 million). Solvency fell to 10.7% compared
to 34.5% at the end of 2005.
Outlook The year 2007 will still be a transition year for Blue
Fox. The guiding principle is to focus on the challenges and
opportunities in the textile and apparel software industries.
While the textile and apparel division did not contribute to the
result in 2006, this division is nevertheless expected to form the
cornerstone for future growth. This will be driven by the enhanced
fundamental position Blue Fox has created through additional
investment, in combination with the slightly improving market
conditions for this activity. Determining factors will be the quality
of the new generation of CAD/CAM software and the future
success of the ERP software brought on the market under the
Microsoft brand. The cooperation with Microsoft is now in a
second phase of development. After completion of this second
phase, Microsoft’s marketing strength will play an important
role in this respect.
Taking the present developments and uncertainties into
account, it is too early to make any statements with respect
to the expectations for 2007.
Staff and organisation
The human resources policy within Blue Fox focuses on skills
and talent development. We have a decentralised approach to
the operating companies based on worldwide HR standards.
The operating companies of Blue Fox mostly hold top positions
within their respective market segments. Entrepreneurship is
stimulated universally throughout the Blue Fox organisation, as
most operating companies are organised in smaller units which
operate with a certain level of autonomy. The directors of the
operating companies are responsible for the commercial and
financial developments with regard to their company and they
report to the Board of Directors. This management approach
creates a mentality of speed, flexibility and leadership with
short communication lines, making the best possible use of the
knowledge and know-how of Blue Fox’s people and the quality
and reputation of its products and services.
In each operating company individual attention is paid to
training and development of the staff members. Both internal
and external training courses are given to groups of staff
members. In addition, individual staff members are encouraged
to follow external training courses that benefit the position they
hold. For this, they are often eligible for a financial contribution
from the company.
The HR policy focuses on a competitive remuneration policy, the
development and introduction of a sound career development and
mobility policy, as well as the implementation of a worldwide
performance management system. Management development
and succession planning are also a focus of attention.
The average number of staff members declined by approximately
5.7% during 2006, from an average of 351 in 2005 to an average
of 331 staff in 2006. At year-end 2006, Blue Fox had 305 staff
members, compared with 337 at year-end 2005. This decline was
mainly the result of the restructuring.
The increase in average wage costs per FTE was mainly related to
redundancy payments.
Approximately 63% of Blue Fox personnel work in the Textile and
Apparel Software division, and 29% in the Engineering and GIS
division. A further 8% is employed throughout the rest of the
organisation, including the holding.
The workforce of Blue Fox is very international and we have
approximately 23 nationalities. Of total staff, 82% work in
Europe, with 59% of these in the Netherlands. The remaining
number of employees is mainly stationed in the USA and China.
Report of the Board of Directors
Operational review 2006
In the first half of 2006, it became apparent that the cost savings
implemented in 2005 were insufficient. In the second half of the
year, we worked hard to bring about the turnaround. During the
year, cost levels were further reduced and these are now more in
line with the size of the organisation. The head office in
Dordrecht was closed in the second half of the year and the size
of the holding company was sharply reduced. In addition, the
sales organisation in the Textile and Apparel Software division
was overhauled.
In 2006, the positive impact of the cost savings was offset by
non-recurring expenses and provisions charged to the result. The
turnaround was paired with significant non-recurring restructuring
costs, including redundancy payments, legal costs, etc. Along
with the other provisions and impairments, non-recurring costs
of € 4.4 million were charged to the result in 2006. The measures
will begin to bear fruit in 2007 and we will benefit from their full
structural impact after 2007.
In addition to the attention given to cost reductions, much
attention was devoted in the past half year to shaping the new
organisation. It has become clear that our strong position in
textile and apparel software justifies investments in a new
generation of CAD/CAM software.
Blue Fox will also increase the focus on its ERP software for the
textile and apparel industry. The ERP software development
within the Microsoft Industry Builder Initiative is going well.
After a small delay, the first release was certified in mid-January
2007 and the first revenue related to the new software is expected
in 2007.
The major turnaround and the debt restructuring could not be
funded from the current cash flow, especially in combination with
the necessary investments in the textile and apparel software
and the Microsoft platform for the ERP software. Therefore, Blue
Fox has started to sell off subsidiaries, as announced when the
first-half 2006 figures were published in August.
In October, Blue Fox sold Reset C&T B.V. - an operating company of
the Engineering and GIS division that seconds CAD specialists - to
the management of the company.
Shortly after the close of the financial year, Blue Fox sold its
subsidiary Carrier to Carrier Telecom to the management of that
operating company. Carrier to Carrier had not fitted in with Blue
Fox’s core activities for some time. The proceeds from the sale of
Carrier to Carrier Telecom will be recognised in the results for the
first half of 2007.
In addition, the company is in an advanced stage of negotiations
on the sale of its CAD/GIS activities. The CAD/GIS activities are
part of the Engineering and GIS division. The sale is the next
small step in the turnaround, which is necessary to shape the
new strategy. On this basis, Blue Fox is setting the stage to be
able to concentrate more on the challenges and opportunities in
the textile and apparel software industry.
Blue Fox recently extended the credit facility, which was agreed
with Fortis in October, until 1 June 2007.
Financial review 2006
Results Blue Fox closed 2006 with an operating loss of € 6.8
million (2005: € 1.5 million loss). Excluding non-recurring costs,
the operating result of the company would have been a loss of
€ 2.4 million (2005: € 0.4 million loss).
In 2006, sales dropped slightly by 6.3% to € 49.1 million
(2005: € 52.4 million). This drop was seen both in the Engineering
and GIS division and in the Textile and Apparel Software division.
Although market conditions improved slightly during the second
half of 2006, the textile industry in Europe was still under enormous
pressure, as a result of which the total sales of the Textile and
Apparel Software division fell. This division’s net sales showed
an 11.1% decrease in 2006 to € 17.1 million (2005: € 19.3 million).
Partly because of the focus on the investment in the Microsoft
project and the costs of non-recurring measures, the operating result
fell from break-even in 2005 to a loss of € 2.9 million in 2006.
The net sales of the Engineering and GIS division fell by
approximately 3.4% to € 27.4 million (2005: € 28.4 million).
In October 2006, Reset C&T B.V. was sold, and was no longer
consolidated in the second half of the year. At the end of 2005,
a successful one-off sale of third-party software was also made,
and this was not repeated in 2006. On balance, this resulted in
only a limited drop in the operating result to € 1.2 million
(2005: € 1.4 million).
Cash flow, investments and funding Despite the
negative result, the operational cash flow in 2006 was positive,
amounting to € 1.6 million (2005: € 5.4 million positive).
In 2006, a long-term loan for € 2.0 million was concluded,
while € 0.6 million in loans was redeemed. The cash flow from
investments remained stable at € 3.6 million negative
(2005: € 3.5 million negative), and total cash flow dropped
to € 0.6 million negative.
Balance sheet Fixed assets fell from € 18.8 million to € 15.0
million as a result of the impairment of intangible fixed assets
amounting to € 0.9 million, the repayment of a loan and the
reclassification of assets held for sale of € 1.7 million.
5 Report of the Board of Directors
Staff members (in average FTE) 331 351
Average contribution per FTE
to gross margin 81 82
Average wage costs per FTE 66 58
amounts in thousands of euros 2006 2005

15Report of the Supervisory Board
We hereby present the financial statements for the financial
year 2006, as prepared by the Board of Directors and adopted
by the Supervisory Board, as well as all other legally required
information concerning Blue Fox Enterprises N.V. The financial
statements for 2006 were audited by KPMG Accountants N.V.,
who issued an unqualified auditor’s report, which can be found
on page 58. The financial statements, the auditor’s report and
the management letter were discussed in the presence of the
external auditor on 14 March 2007.
At the forthcoming Annual General Meeting of Shareholders we
recommend that you approve the financial statements for 2006
in accordance with the documents as presented. Furthermore, we
recommend that the Board of Directors is discharged in respect
of its management and the Supervisory Board is discharged in
respect of its supervision. We propose that you approve the
proposal of the Board of Directors not to pay out a dividend.
Composition of the Supervisory Board There have
been no changes to the Supervisory Board during 2006. The
retirement schedule of the members of the Supervisory Board
is presented below.
Mr. Pellenaars and Mr. Pannekoek have both expressed their
intention to resign from the Supervisory Board during the
Annual General Meeting of Shareholders on 25 May 2007.
A Member of the Supervisory Board will not be available for
(re)appointment if that member has already served three
consecutive periods of three years on the Supervisory Board of
Blue Fox Enterprises N.V.
The Chairman of the Supervisory Board has acted as delegated
supervisor since May 2006. Therefore, he does not comply with
provision III.2.2 of the Code Tabaksblat. All other members are
independent as meant in provision III.2.2 of the Code.
All members of the Supervisory Board fit the profile that has
been drawn up by the Supervisory Board, in consultation with
the Board of Directors. This profile takes account of the nature
and the activities of Blue Fox and the desired expertise and
background of the members of the Supervisory Board.
The profile can be found on the website of the company.
Report on the past year The Supervisory Board and the
Board of Directors met in private sessions nine times during
2006. In addition, there have been formal telephone conferences
and various informal contacts, both between the Supervisory
Board and the Board of Directors and between the Members of
the Supervisory Board.
During these meetings, much attention was paid to the necessary
turnaround of Blue Fox. Other main topics on the agenda of
several meetings were the change of management and the
profile of the new CEO to be appointed. Among other things, we
discussed the market developments and Blue Fox’s competitive
position, a divestment program, and the strategy and performance
of the company. Furthermore, we have discussed Blue Fox’s
involvement in Microsoft’s Industry Builder Initiative on an
ongoing basis. Improvement of the corporate governance
structure and amendments to the articles of association were
also topics of discussion. A more detailed overview of the
progress in Corporate Governance can be found in a separate
section on page 17 of this annual report.
With regard to the company’s strategy, the Supervisory Board
had separate sessions with the Board of Directors. After these
sessions, updates on the progress made with the implementation
of strategic initiatives were discussed in various subsequent
Supervisory Board meetings.
The Supervisory Board has discussed the plenary financial reports
with the Board of Directors in detail. Subjects discussed during
the meetings of the Supervisory Board included the sales and
margins developments, operating expenses and development costs,
as well as results, balance sheet ratios, budgets and outlook.
Further attention was also given to the plans to improve the
financial performance of Blue Fox and the execution of those plans.
The Supervisory Board has met three times in the absence of
a member of the company’s Board of Directors. The company’s
independent auditor, KPMG Accountants NV, has briefed the
Board about the findings of the audit with regard to the
financial year 2006.
The Board convened two General Meetings of Shareholders:
the plenary Annual General Meeting in May and an Extraordinary
General Meeting in August. During the Extraordinary General
Meeting in August, we discussed the interim results, implemented
changes to the corporate governance structure and appointed
Mr. Van Steijn as the new CEO.
6 Report of the Supervisory Board
nationality appointment resignation committee
Composition of the Supervisory Board
S.L.M. Houtakkers Dutch August 2005 2008
P.A.M. Pellenaars Dutch August 2005 2008 Audit Committee
T. Pannekoek Dutch August 2005 2008
L.P.E.M. van den Boom Dutch August 2005 2008 Audit Committee

1716 Corporate governance
General Blue Fox Enterprises attaches great importance to
corporate governance. In recent years, we have discussed in
detail the Dutch Code on Corporate Governance, issued on 9
December 2003 (also commonly referred to as the Tabaksblat
Code) in the Annual Report. The Board of Directors and the
Supervisory Board of Blue Fox endorse the Code. Within the
framework of this Code, a company’s stakeholders include staff
members, shareholders and other providers of capital, financiers,
suppliers, customers, as well as governments, social groups and
factions. The Board of Directors and the Supervisory Board of
Blue Fox are responsible for striking a balance between the
interests of these stakeholders, while taking into account the
continuity of the company. Therefore, best practice principles
with regard to corporate governance are reflected in the
management structure and Articles of Association of the
company, as far as these are deemed applicable and are in the
interest of all stakeholders.
In accordance with the recommendation of the Tabaksblat
Committee to ‘comply or explain’, Blue Fox’s corporate
governance practice was placed on the agenda of the Annual
General Meeting of Shareholders in May 2006, in order to give
shareholders the opportunity to voice their opinion on the way
the company interprets compliance with the Code. A description
of Blue Fox’s corporate governance policy, including the relevant
regulations and reports, can be found on the website. The policy
is reviewed periodically and amended if necessary.
The following changes have been made to the corporate governance
structure, as described in the 2005 Annual Report in full:
• The number of members of the Board of Directors was
decreased from two to one. The appointment of the new
member of the Board of Directors complies with provision
II.1.1 (appointment period of a maximum of four years for
Members of the Board of Directors). Also, Blue Fox no longer
deviates from provisions II.2.1 and II.2.2 (share options for
Members of the Board of Directors), as the current member of
the Board of Directors holds no share options in the company.
• Blue Fox has dissolved one of its protective measures through
the dissolution and discontinuation of the ‘Stichting
Continuïteit Blue Fox Enterprises’.
Deviations from the Code Blue Fox complies with most
of the main recommendations and provisions of the Code. The
main deviations from best practice provisions are listed below.
• provisions II.2.6 and III.7.3: securities held by Members of the
Board of Directors and the Supervisory Board Although Blue
Fox is a listed company, it only operates in a small segment of
the local market, as a result of which insider knowledge with
regard to other Dutch listed companies cannot or hardly occur.
The regulations drawn up by Blue Fox cover transactions in or
holding of those shares with regard to which the directors
concerned could have any specific knowledge.
• provision II.2.7: maximum remuneration in case of dismissal
for Members of the Board of Directors and the Supervisory
Board Regarding to the remuneration in case of dismissal,
it had always been Blue Fox’ policy to make a severance
payment, which is reasonable, based on the contractual
situation, social developments and jurisprudence. As long
as no amendments are made to the statutory regulations
regarding employment conditions of company directors, the
Supervisory Board will continue its current policy.
• provision III.4.3: company secretary The Supervisory Board
believes such organisational and administrative support of its
work is (at the moment) unnecessary.
• provisions III.1.1 and III.5.1: division of tasks by the Supervisory
Board and regulation for the audit committee Due to the size
of Blue Fox, these provisions have not been implemented and,
consequently, the regulations concerned are not disclosed on
the Blue Fox website.
• provision IV.3.1: advance announcements of Investor Relations
Meetings The Blue Fox Investor Relations policy is aimed at
complying with the best practice provisions in the code. However,
the cost associated with the usage of the infrastructure
required for this are deemed to be disproportionate in view of
the size of the company and the limited number of investors
that is expected to actually use these facilities.
7 Corporate governance
Report of the Supervisory Board
Selection and nomination Following the resignation by Mr. Eisma
in May 2006, the Supervisory Board gave much attention to
selecting a successor to the chair of the Board of Directors.
The Chairman of the Supervisory Board acted as a delegated
member of the Board of Directors. In August 2006, the
Supervisory Board proposed to the Extraordinary Annual General
Meeting of Shareholders (EGM) the appointment of Mr. Van
Steijn as the new CEO. His nomination was accepted. At the end
of 2006, Mr. Brolsma resigned. The Board of Directors currently
consists of only one member, and the Supervisory Board will
carefully consider whether extension of the board fits the
current situation of Blue Fox.
Remuneration Mr. Eisma resigned per May 2006 and his
employment contract was terminated after 25 years of service
in November. Mr. Brolsma resigned from the board as per
December 2006 after 16 years of service, and will remain with
the company as an advisor until the termination date of his
employment contract on 1 July 2007. Both former members of the
Board of Directors received a severance payment of approximately
two gross fixed annual salaries.
The current sole member of the Board of Directors has an
employment contract for an initial period of one year with an
option to extend. Details regarding the remuneration can be
found on page 56 of this annual report. As in previous years, the
detailed remuneration criteria used by the Supervisory Board will
not be disclosed, as this may comprise competitive information.
Report from the Audit Committee During 2006 the
Audit Committee consisted of Mr. Pellenaars and Mr. Van den
Boom. The Audit Committee controls and assesses the financial
reporting process of Blue Fox, as well as the expert investigation
carried out by the external auditor. The Audit Committee met
three times during the past year. In these meetings consultations
were held with KPMG and the corporate controller on the
production of the financial reports. In addition, the internal
financial reports were presented to the Supervisory Board, which
were subsequently discussed in great detail with the Board of
Directors. In 2006, the Audit Committee devoted special attention
to the need for additional impairments.
External auditor KPMG, represented by its partner
Mr. Jan Boer, acted as auditor of the company. Its nomination
was approved by the Annual General Meeting of Shareholders
of May 2006.
In conclusion The Supervisory Board would like to express
its gratitude to the management and employees of the company
for their efforts and commitment to Blue Fox Enterprises N.V.
Despite the difficult times we went through and the changes
made to the company this year, we managed to create a better
position for the company during the year under review.
Vianen, 4 April 2007
The Supervisory Board
Servaas L.M. Houtakkers, Chairman
Pierre A.M. Pellenaars
Ton Pannekoek
Leon P.E.M. van den Boom

1918 Shareholders’ information
Investor Relations Blue Fox greatly values a good relationship
with its shareholders. In the interest of fair disclosure, all new
material information is disclosed through the timely and
simultaneous distribution of press releases on relevant issues
concerning Blue Fox to all parties involved. In addition to the
financial results, the company will also furnish broad information
on its strategic choices and objectives. Blue Fox observes a
‘silent’ period during which no road shows or interviews with
potential or current investors take place. For the annual figures,
this period covers the eight-week period prior to the first
publication of full-year results and a three-week period prior to
the publication of half-year results. Relevant information for
potential and current shareholders may be found on the Blue Fox
website under the link ‘Investor Relations’. Direct questions of
investors may be directed by e-mail to [email protected].
The Amsterdams Effecten Kantoor (AEK) acts as liquidity
provider for Blue Fox shares. The liquidity provider publishes
research reports about the company at least twice a year.
Contact details:
Amsterdams Effecten Kantoor (AEK),
Herengracht 208-214, 1016 BS Amsterdam
Telephone: + 31 (0)20 530 63 00
Important dates 25 May 2007
Annual General Meeting of Shareholders 2007
3 September 2007 */**
Presentation first-half results 2007
17 March 2008 */**
Presentation full-year results 2007
23 May 2008 **
Annual General Meeting of Shareholders 2008
1 September 2008 */**
Presentation first-half results 2008
* before trading hours** provisional
issued outstanding exercised exercisedate granted term options options / cancelled price (€)
Staff options
May 2002 2007 42,010 24,450 17,560 9.65
May 2003 2008 33,980 21,590 12,390 5.80
May 2004 2009 27,400 18,580 8,820 6.34
Total 103,390 64,620 38,770
Shareholders’ information
General Blue Fox Enterprises N.V. shares have been listed on
the official market of Euronext Amsterdam N.V. since 21 May
1999. The par value of the shares is € 2 per share. The number of
ordinary Blue Fox shares outstanding at 31 December 2006
totalled 3,512,120. No shares were issued in 2006, nor were any
stock options exercised by staff members. As far as Blue Fox can
ascertain, most of the shares are held by Dutch institutional and
private investors.
Pursuant to the ‘Wet Melding Zeggenschap’ (WMZ, the Act on
Disclosure of Major Holdings in Listed Companies), an interest of
5% or more in the capital of Dutch listed companies must be
reported to the company involved. In addition, the passing of
certain boundaries of percentage ranges in share holdings must
be reported. The following table is a review of the interests as of
31 December 2006.
Staff options The table on the next page presents an overview
of granted option rights and outstanding options at year-end
2006, including options granted to Members of the Board of
Directors and the Supervisory Board. The options were issued to
staff members with permanent contracts, up to a maximum of
2% of the number of shares outstanding. As of 2003, members
of the Supervisory Board of Blue Fox no longer receive stock
options. For 2005 and 2006, the Board of Directors and
Supervisory Board decided not to grant any options to employees.
In chapter 10, the notes to the 2006 company financial statements
state the numbers of outstanding stock options of the Members
of the Board of Directors and the Supervisory Board.
Dividend policy In view of Blue Fox’s situation in 2006, the
company has paid no dividends in the past year. A healthy balance
between the company’s capital and borrowings, in relation to
the assets that can be financed within the company, is of great
importance in this respect. Given the current solvency and
financing structure, for the time being it will be prudent for the
company not to pay out a dividend.
Paying a dividend is at odds with the company’s current ambitions.
In addition, the company will have to repay remaining subordinate
loans in 2007. At year-end 2006, these loans contributed € 2.1
million to the guaranteed capital. The dividend policy will be
reassessed when the company is able to pay a dividend.
Prevention of insider trading Blue Fox has drawn up
Insider Trading Regulations in accordance with the model of the
VEUO (‘Vereniging van Effecten Uitgevende Organisaties’, the
association of share issuing organisations), which has been
approved by the Authority Financial Markets (AFM).
Blue Fox has made a large group of staff members and advisors
sign the Insider Trading Regulations. The Insider Trading
Regulations of Blue Fox include a ban on trading in Blue Fox
shares during an eight-week period prior to the first publication
of full-year results and a three-week period prior to the publication
of half-year results. There is also a ban on reversing a transaction
within six months, in order to reduce or eliminate the risk. An
exemption in writing from this ban can be given by the Compliance
Officer. No exemptions were given during the year 2006.
‘Stichting Continuïteit Blue Fox Enterprises’In December 2006, the board of the foundation (consisting of
three members: Mr. C.J.J. van Steijn, Mr. D.R. Hooft Graafland and
Mr. S.J.B. van der Burg) undertook to dissolve and discontinue
the ‘Stichting Continuïteit Blue Fox Enterprises’.
The aim of ‘Stichting Continuïteit Blue Fox Enterprises’ was to
guard the interests of the company and its associated
companies in such a way that the interests of the company and
its associated companies were guaranteed and that influences
were resisted which could affect the independence and/or the
continuity and/or the identity of the company and these
associated companies, contrary to those interests. The possibility
of placing preference shares in the capital of the company with
the ‘Stichting Continuïteit Blue Fox Enterprises’ was a
protective measure against hostile takeovers. The Board decided
to put an end to this anti-takeover measure. This dissolution is
another improvement in the corporate governance of the company.
Shareholders
interest in %
8 Shareholders’ information
key figures per share 1
Net result -1.87 -0.42
Shareholders’ equity 0.92 2.79
Highest share price 5.12 6.12
Lowest share price 2.33 3.80
Closing price 2.83 4.78
P/E ratio as at 31 December -1.51 -11.38
Market capitalisation as
at 31 December 9,939,300 16,787,934
Number of transactions 4,073 2,532
Average trading volume per day 9,041 5,290
1 Based on average number of outstanding shares.
in euros 2006 2005
Todlin N.V. 15.2
Vereniging Friesland Bank 10.4
F.L.H. van Delft (through Bibiana Beheer B.V.) 7.1
Generali Holding Vienna AG 6.3
J.H. de Groen 6.3
Driessen Beleggingen B.V. 6.2
Beleggingsmij West-End B.V. 5.0

Risk & Control
Entrepreneurship involves risks. Blue Fox operates in a highly
dynamic and international environment. As a consequence,
managing and controlling risks requires that specific characteristics
have to be taken into account. The following section identifies
the main risks which could affect achievement of the business
objectives of Blue Fox.
Market risks Competitive position The company aims for a
top three position in all CAD/CAM/ERP segments in which it
operates. In view of this ambition, the ability of Blue Fox to
distinguish itself from its competitors in the market is of great
importance. That is why Blue Fox focuses on professional markets
and on providing its customers with integrated software solutions.
Reliability, improving productivity, sustainability, user friendliness
and a low cost of ownership are important elements in this
strategy.
Blue Fox is the only company that offers fully integrated software
solutions for the textile and fashion industry on a global scale.
As a global player, Blue Fox is forced to comply with the global
needs and requirements of its customers, which could result in
investments and start-up costs to open new locations worldwide.
Exposure to economic developments A large part of Blue Fox
sales relate to income from selling software licenses, as well as
providing related services such as maintenance, support and
training related to the company’s proprietary software solutions.
Sales of software licenses and related consultancy services are
mostly non-recurring. On the other hand, the income from
maintenance and support contracts is mainly recurring business.
The non-recurring income is in particular strongly exposed to
fluctuations in the economic conditions, while this applies to a
much smaller extent to recurring income.
Software development Software development is a very important
critical success factor for Blue Fox. The innovation-focused policy
comes with specific risks which are inherent in investing in the
development of new technologies and new functionalities. These
new developments must not only meet operating requirements,
but will also have to find a place in the market to result in value
creation. Software development demands specific and continuous
attention to result in successful new product launches.
Seasonal influences Historical data indicate that sales are typically
not spread evenly throughout the year. Blue Fox realises an
important part of its sales and profit in the fourth quarter. If sales
in the fourth quarter do not rise to a level that is significantly
higher than the preceding quarters, this will have a relatively
strong negative impact on the full-year results of Blue Fox.
Spread of sales Blue Fox has an extensive worldwide client base.
As a result of the spread of sales and the related results, the
company’s overall results depend only to a small extent on the
9 Risk & Controlrealisation of (some) major orders. Blue Fox usually records only
a limited number of very large orders per year, which large
orders mainly relate to sales of ERP software solutions. These
relatively large orders have a direct impact on the realised sales
and the result.
The geographical spread of the sales of Blue Fox contributes to
the stability of the total income flow.
Operational risks Illegal copying of software Safeguarding
the authorised use of software solutions is of great importance
to Blue Fox. In practice there is always some danger that the
software developed or distributed by Blue Fox is copied illegally.
With the help of an authorisation code and a hardware key-lock,
Blue Fox has limited the risk as much as possible. Blue Fox
cannot estimate the loss of sales by unauthorised use and illegal
copying of the software developed by Blue Fox or distributed by
Blue Fox for third parties.
Economies of scale Blue Fox is an international organisation
with an extensive worldwide network of sales and distribution
offices. Blue Fox has specialised internationally in supplying the
textile and fashion industry with software solutions in the field
of automation of design, production and resource planning. The
textile and fashion industry represents a relatively small niche
market within the greater market for ICT products and services.
The international structure of Blue Fox, whereby the company
aims to provide the best possible service to its (local) customers,
is sometimes at odds with the actual size of the various sales
and distribution offices. The international operations are generally
complex and demand much attention from the management.
International sales and distribution organisations have a
relatively high cost structure, due to the limited possibilities
that exist for exploiting economies of scale on a global basis.
Third-party software For a number of products, Blue Fox depends
on third-party support software. This support software consists,
amongst other things, of operating systems and specific
programming languages, as well as separate modules which are
being used. The adequate functioning of the software developed
by Blue Fox therefore (partly) depends on the adequate functioning
of third-party software. By applying application and module
tests, Blue Fox aims to obtain the earliest indication of possible
technological problems.
Technological risks Risk of product defects New versions
of Blue Fox’s complex software programs may contain undetected
errors or bugs which, despite testing, will be discovered only
after a product has been installed and used by customers. To
date, Blue Fox’s business has not been materially adversely
affected by the release of new products and releases.
21

2322 Risk & Control
supervision of the process of risk management from the
supervisory responsibility of the Supervisory Board. The Audit
Committee concentrates on the quality of the internal and
external reporting, on the effectiveness of the internal control
measures and on the functioning of the external and internal
auditors.
Internal financial and operational audits In connection with the
monitoring and safeguarding mechanisms, internal audits are
planned and conducted each year, aimed at securing the quality
of the main operating processes and reviewing connected business
risks. These internal audits cover the financial reporting (financial
audits) and the existence and functioning of operating policies
and procedures (operational audits). Due to changes in the
organisation, the internal audits conducted in 2006 were limited.
Protection of intellectual property rights Blue Fox tries to protect
its intellectual property rights as far as the company believes
this to be economically viable. Protection of intellectual property
is done through the registration of trademarks, by using
confidentiality agreements and non-competition clauses in
agreements and by using hardware key-locks and/or embedded
software codes in Blue Fox’s software to protect it against illegal
use.
Directors’ regulations All Statutory Directors of the operating
companies have signed a copy of the Directors’ regulations.
These regulations with regard to their limits of authority identify
in which cases the board of the operating company require prior
approval from the Board of Directors for certain decisions,
depending - amongst other things - on the nature or the size of
certain business.
Code of conduct and whistleblower procedure In compliance
with the Dutch Code on Corporate Governance, a code of conduct
and a whistleblower procedure were implemented in 2005. The
procedure serves to ensure that any alleged infringement of the
existing policies and procedures may be reported without the
person making the report suffering any negative consequences
of his action.
Risk & Control
Software platform The programming languages, techniques and
platforms used by Blue Fox have to match and must continue to
match the technological developments and requirements of its
clients. Blue Fox has made significant investments in recent
years in making its software compatible with Microsoft operating
environments. Blue Fox must continue to invest to keep up with
the latest technological developments.
Financial risks International operations The activities of
Blue Fox are exposed to the risks of operating internationally,
such as currency fluctuations, general economic developments
in certain countries, meeting the requirements of various tax
and legal regimes, organisational aspects, unexpected changes
in local legislation and regulations, limited protection of
intellectual property, varying terms of payment by debtors,
trade restrictions and changes in import and cargo rates.
Blue Fox carries out part of its activities outside the Euro zone.
These activities mainly take place in the United States and the
Asia/Pacific region. The management monitors the currency
positions and follows a restricted hedging policy, which cover
transaction risks, rather than translation risks. The developments
in exchange rates of various foreign currencies, especially the US
dollar, may therefore affect the result and the financial position
of the company.
Working capital management The item trade debtors is relatively
large in size compared to the other current assets of Blue Fox.
Blue Fox gives much attention to debtors’ payment performance
through permanent debtor management. Insolvency of debtors
of the Dutch operating companies is partially covered by a credit
insurance policy from Atradius Credit Insurance N.V., as well as
through the use of letters of credit or down payments upon the
signing of contracts.
Risk management and internal control The Board of
Directors is responsible for the internal control and the
management of risks within the company and for the assessment
of the effectiveness of these control systems. Such control systems
were set up to identify and subsequently manage risks, which
could endanger the realisation of the objectives of the company.
It should be noted that no single (control) system offers an
absolute guarantee against material inaccuracies or losses.
Blue Fox aims to ensure that its risk management activities are
in line with the best practices laid down in the Code Tabaksblat
(the Dutch Corporate Governance Code). The risk management
model developed by Blue Fox is intended to present a practical
framework to support the objectives and the assessment of
risks and anticipated rewards as identified by the company. The
model distinguishes three areas which are subject to particular
attention for analysis purposes, these being:
• external factors (i.e. the company’s operating environment
on both a macroeconomic and industry level) with the
consequential strategic risks;
• organisational structure with the consequential internal risks;
• primary and supporting processes with the consequential
process and reporting risks.
The main aspects of the formulated risk management model are:
• clearly defined responsibilities regarding risk management;
• operational management, together with the various members
of the local management teams, assess main risks affecting
the company concerned and review these main risks;
• continuous assessment of the quality and effectiveness of the
internal controls;
• the Board of Directors monitors the major risks of the group
and sees to it that adequate control measures are taken;
• internal assessment is made of the performance of all
Managing Directors of the operating companies and members
of the local management teams with regard to, among other
things, their responsibilities, the quality and effectiveness of
the internal controls and the process of financial reporting.
The policy of Blue Fox remains aimed at the continuous guarding
and improvement of the internal risk management processes, in
order to further optimise the quality and effectiveness of these
processes and their safeguarding, and adapt these where necessary.
System of internal controls The internal control system
contains all elements of internal control and contributes to
discipline and structure. The following control measures form
part of the internal control system of Blue Fox and serve to
secure reliable financial and reporting processes, while also
securing an adequate risk management.
Planning & control cycle The planning & control cycle starts
with drawing up a budget for each operating company. The main
control variable for Blue Fox is the net result before taxation, the
Earnings Before Tax (EBT). The Managing Directors of the operating
companies have a certain level of autonomy with regard to
achieving the budgeted EBT within the agreed framework.
Other important control variables are net sales, gross margin
and operating result. In addition, Blue Fox controls and manages
its operating companies on the basis of a number of company-
specific key figures, which may vary per operating company.
The operating companies report monthly in accordance with a
fixed reporting format. Meetings of the Board of Directors with
the Managing Directors of the operating companies are held on
a monthly basis. These monthly meetings are used in particular
to discuss the operating developments and the required subsequent
adjustments to the budgets, in addition to the financial
developments.
Blue Fox Accounting & Reporting Manual The Blue Fox
Accounting & Reporting Manual contains guidelines regarding
the accounting principles that have to be adhered to, as well as
instructions regarding the filling out of the reporting forms to
be used within the Blue Fox organisation.
Audit Committee The Audit Committee consists of two Members
of the Supervisory Board and guarantees an independent

10 Financial statements 2006

27Financial statements 2006
Foreign exchange translation differences [15] -20 9
Net income recognised directly in equity -20 9
Result for the period [15] -6,574 -1,478
Total recognised income and expense for the period -6,594 -1,469
Attributable to:
Equity holders of the parent company -6,580 -1,479
Minority interest -14 10
-6,594 -1,469
in thousands of euros notes 2006 2005
Consolidated statement of recognised income and expense for the year ended 31 December 2006
in thousands of euros notes 2006 2005
Consolidated income statement for 2006
26 Financial statements 2006
Net sales 49,120 52,440
Other operating income [ 2 ] 318 168
Total operating income [ 1 ] 49,438 52,608
Raw materials and consumables used 22,199 24,685
Changes in inventories 439 -708
Wages and salaries [ 3 ] 17,914 16,308
Social security charges [ 3 ] 2,766 2,702
Amortisation and depreciation [6,7] 5,605 4,370
Other operating costs [ 4 ] 11,018 9,731
Capitalised production [ 7 ] -3,668 -2,980
Total operating costs 56,273 54,108
Operating result -6,835 -1,500
Financial income 55 61
Financial expenses -446 -395
Result from sale of subsidiaries 119 -
Result before taxation -7,107 -1,834
Corporate income tax [ 5 ] 533 356
Result for the period -6,574 -1,478
Attributable to:
Equity holders of the parent company -6,560 -1,482
Minority interest -14 4
-6,574 -1,478
Basic earnings per share (in euros) -1.87 -0.42

29Financial statements 2006
Operating result -6,835 -1,500
Depreciation and amortisation 5,605 4,370
Change in inventories and work in progress 439 -708
Change in trade and other receivables -2,330 1,332
Change in trade and other payables 4,126 1,382
Changes in provisions/employee benefits 1,107 329
Interest paid -379 -341
Corporate income tax -131 523
Cash flow from operating activities [21] 1,602 5,387
Investments:
Intangible assets -3,668 -2,980
Property, plant and equipment -569 -429
Other investments - -120
Disposals:
Property, plant and equipment 17 3
Other investments 400 50
Sale of participations (including cash and cash equivalents) 209 -
Exchange rate differences -7 -1
Cash flow from investment activities [22] -3,618 -3,477
Granted loans 2,010 -
Redemption loans -625 -660
Cash flow from financing activities [23] 1,385 -660
Change in liquid assets -631 1,250
Cash and cash equivalents 1,674 6,459
Bank overdraft -4,745 -10,780
Balance at 1 January -3,071 -4,321
Cash and cash equivalents 3,156 1,674
Bank overdraft -6,992 -4,745
Balance related to assets held for sale 134 -
Balance at 31 December -3,702 -3,071
Change in liquid assets -631 1,250
28 Financial statements 2006
Non-current assets
Property, plant and equipment [ 6 ] 573 2,848
Intangible assets [ 7 ] 14,370 15,190
Other investments [ 8 ] 90 490
Deferred tax assets [ 9 ] - 305
Total fixed assets 15,033 18,833
Current assets
Inventories [10] 704 943
Work in progress [11] 96 296
Trade and other receivables [12] 8,294 6,567
Corporate income tax 26 68
Cash and cash equivalents [13] 3,156 1,674
Assets held for sale [14] 2,883 -
Total current assets 15,159 9,548
Total assets 30,192 28,381
Equity
Share capital 7,024 7,024
Share premium 22,128 22,128
Legal reserves 8,060 8,678
Translation reserves -52 -32
Accumulated deficit -27,380 -26,516
Current year’s result -6,560 -1,482
Total equity attributable to equity holders of the parent 3,220 9,800
Minority interest 48 62
Total equity [15] 3,268 9,862
Non-current liabilities
Interest-bearing loans and borrowings [16] 1,000 1,130
Employee benefits [17] 756 710
Deferred tax liabilities [ 9 ] - 1,011
Total non-current liabilities 1,756 2,851
Current liabilities
Bank overdraft [19] 6,992 4,745
Interest-bearing loans and borrowings [15] 3,075 1,465
Provisions [18] 1,326 265
Trade and other payables [20] 12,173 9,193
Liabilities related to assets classified as held for sale [14] 1,602 -
Total current liabilities 25,168 15,668
Total liabilities 26,924 18,519
Total equity and liabilities 30,192 28,381
Consolidated balance sheet as at 31 December 2006 before appropriation of result
in thousands of euros notes 31-12-2006 31-12-2005
Consolidated statement of cash flows for 2006
in thousands of euros notes 2006 2005

31Financial statements 2006
period in which the estimate is revised if the revision affects only that period, or in the period of the revision and future periods if the
revision affects both current and future periods.
The accounting policies set out below have been applied consistently to all periods and by all Group entities presented in these consolidated
financial statements.
Judgements made by management in the application of IFRS’s that have significant effect on the financial statements and estimates with
a significant risk of material adjustment in the next year are discussed in the notes to the financial statements. In particular, information
about significant areas of estimation, uncertainty and critical judgements regarding the application of the accounting principles that have
the most significant impact on the amounts recognised in the financial statements are described in note 7 - determination of the recoverable
amount of cash generating units, and note 9 - deferred tax assets and liabilities.
Basis of consolidation Subsidiaries Subsidiaries are entities controlled by the company. Control exists when the company has the
power, directly or indirectly, to govern the financial and operating policies of an entity so as to obtain benefits from its activities. In
assessing control, potential voting rights that presently are exercisable or convertible are taken into account. The financial statements of
subsidiaries are included in the consolidated financial statements from the date that control commences until the date that control ceases.
The consolidation (fully) includes Blue Fox Enterprises N.V. and the following group companies:
Blue Fox Enterprises B.V. the Netherlands (Dordrecht) 100% 100%
Blue Fox IPR B.V. the Netherlands (Dordrecht) 100% 100%
Blue Fox MDP B.V. the Netherlands (Dordrecht) 100% -
TOPCAD B.V. the Netherlands (Dordrecht) 100% 100%
Reset C&T B.V. the Netherlands (Dordrecht) - 100%
Pollux B.V. the Netherlands (Apeldoorn) 100% 100%
Carrier to Carrier Telecom N.V. 1 the Netherlands (Biddinghuizen) 100% 100%
NedGraphics CAD/GIS B.V. the Netherlands (Vianen) 100% 100%
BLUE FOX NedGraphics B.V. the Netherlands (Vianen) 100% 100%
BLUE FOX NedGraphics BvBa Belgium (Deerlijk) 100% 100%
BLUE FOX NedGraphics of Tennessee Inc. USA (Chattanooga) 100% 100%
BLUE FOX NedGraphics Ltd. UK (Dukinfield) 100% 100%
BLUE FOX NedGraphics SA France (Paris) 100% 100%
BLUE FOX NedGraphics Inc. USA (New York) 100% 100%
BLUE FOX Srl Romania (Bucharest) 100% 100%
BLUE FOX Porini Srl Italy (Lomazzo) 100% 100%
BLUE FOX Porini Inc. USA (Los Angeles) 100% 100%
BLUE FOX Porini Ltda Brazil (Sao Paulo) 51% 51%
BLUE FOX Porini Lda Portugal (Matosinhos) 51% 51%
1 The assets and liabilities of Carrier to Carrier Telecom N.V. are classified as assets held for sale in the balance sheet at 31 December 2006.
Transactions eliminated on consolidation Intragroup balances and any unrealised gains and losses or income and expenses arising from
intragroup transactions, are eliminated in preparing the consolidated financial statements.
Foreign currency Foreign currency transactions Transactions in foreign currencies are translated at the foreign exchange rate ruling
at the date of the transaction. Monetary assets and liabilities denominated in foreign currencies at the balance sheet date are translated
to euro at the foreign exchange rate ruling at that date. Foreign exchange differences arising on translation are recognised in the income
statement. Non-monetary assets and liabilities that are measured in terms of historical cost in a foreign currency are translated using the
exchange rate at the date of the transaction. Non-monetary assets and liabilities denominated in foreign currencies that are stated at fair
value are translated to euro at foreign exchange rates ruling at the dates the fair value was determined.
Financial statements of foreign operations The assets and liabilities of foreign operations, including goodwill and fair value adjustments
arising on consolidation, are translated to euro at foreign exchange rates ruling at the balance sheet date. The revenues and expenses of
foreign operations are translated to euro at rates approximating to the foreign exchange rates ruling at the dates of the transactions.
Foreign exchange differences arising on retranslation are recognised directly in a separate component of equity.
30 Financial statements 2006
The company The company was incorporated on 10 May 1999. Founders were the shareholders of Blue Fox Enterprises B.V., who brought
in the share capital of Blue Fox Enterprises B.V. Blue Fox Enterprises N.V. is a holding company, which mostly holds 100% participations in
a number of companies. Blue Fox is a global provider of integrated specialised design, production and planning software for the textile
and apparel industry. Furthermore, Blue Fox is a distributor of design software for engineering applications and a producer of geographic
information systems software in the Benelux.
Share issues The shares of Blue Fox Enterprises N.V. have been listed on the Official Market of Euronext Amsterdam N.V. since 21 May
1999. As at 31 December 2006, the number of outstanding Blue Fox Enterprises N.V. shares was 3,512,120 (2005: 3,512,120). No share issues
took place in 2006.
Changes in group companies 2006 In October 2006, the company signed an agreement for the sale of Reset C&T B.V., a supplier of
internet recruiting- and training services. The sale of Reset C&T B.V. fits in the strategy to focus on CAD/CAM/ERP activities. The sale took
effect from 1 July 2006. The results of Reset C&T B.V. have been excluded from the consolidated result of the group as from 1 July 2006.
Changes in group companies in 2005 Blue Fox has finalised liquidation proceedings for a number of participations, which had no
more (profitable) activities, to further streamline the organisation in the future as well as making it more transparent.
Going concern In October 2006, € 4.6 million of additional funding was obtained in the form of a credit facility to bridge the period
of the planned turnaround. The term of the facility was recently extended from April 2007 until June 2007, and the bank loans have been
significantly reduced in the mean time. In mid-2007, Blue Fox must redeem € 3.1 million in other borrowings.
The far reaching turnaround, the debt reduction and the extensive investment that Blue Fox will make in the new generation of CAD/CAM
software and the ERP software under the Microsoft brand in the course of 2007 cannot be financed from the operational cash flow.
Therefore, Blue Fox has started to sell off several of its operating companies.
With the proceeds generated by the sale of Carrier to Carrier (as announced on 1 March 2007), Blue Fox was able to substantially reduce
the need for credit. The sale of the CAD/GIS activities, for which a letter of intent was recently signed, will also further reduce the credit
requirement upon completion.
Nevertheless, based on the above mentioned facts, material uncertainties currently exist with respect to the going concern assumption.
Despite these uncertainties, the Board of Directors believes that the implemented strategic reorientation, with the support of the banks,
can be concluded successfully. Therefore, the financial statements are prepared on a going concern basis.
Notes to the financial statements: IFRS Accounting principles Blue Fox Enterprises N.V. is a company domiciled in
Dordrecht, the Netherlands. The consolidated financial statements of the company for the year ended 31 December 2006 comprise the
company and its subsidiaries (together referred to as the ‘Group’) and the Group’s interest in associates and jointly controlled entities.
Statement of compliance The consolidated financial statements have been prepared in accordance with International Financial
Reporting Standards (IFRS) as adopted by the European Union.
Basis of preparation The financial statements are presented in Euro’s, which is the company’s functional currency, rounded to the
nearest thousand. They are prepared on the historical cost basis, unless otherwise stated.
The preparation of financial statements in conformity with IFRS requires management to make judgements, estimates and assumptions
that affect the application of policies and reported amounts of assets and liabilities, income and expenses. The estimates and associated
assumptions are based on historical experience and various other factors that are believed to be reasonable under the circumstances, the
results of which form the basis of making the judgements about carrying values of assets and liabilities that are not readily apparent from
other sources. Actual results may differ from these estimates.
The estimates and underlying assumptions are reviewed on an ongoing basis. Revisions to accounting estimates are recognised in the
Notes to the consolidated financial statements 2006
General information
Summary of accounting policies
2006 2005

33Financial statements 2006
Other intangible assets Other intangible assets that are acquired by the Group are stated at cost less accumulated amortisation (see below)
and impairment losses.
Expenditure on internally generated goodwill and brands is recognised in the income statement as expenses are incurred.
Subsequent expenditure Subsequent expenditure on capitalised intangible assets is capitalised only when it increases the future economic
benefits embodied in the specific asset to which it relates. All other expenditure is expensed as incurred.
Amortisation Amortisation is charged to the income statement on a straight-line basis over the estimated useful lives of intangible assets
unless such lives are indefinite. Goodwill and intangible assets with an indefinite useful life are systematically tested for impairment at
each balance sheet date. Other intangible assets are amortised from the date they are available for use. The estimated useful lives are as
follows:
• patents and trademarks 5 years
• capitalised software development costs 5 - 10 years
Work in progress Work in progress is stated at cost plus profit recognised to date less a provision for foreseeable losses and less
progress billings. Cost includes all expenditure related directly to specific projects and an allocation of fixed and variable overheads incurred
in the Group’s contract activities based on normal operating capacity.
The terms billed relating to work in progress are deducted from work in progress. Any possibly resulting negative balance of work in
progress is shown as a liability under short term debts.
Trade and other receivables Trade and other receivables are initially stated at fair value. Subsequently, trade and other receivables
are valued at amortised cost less impairment losses.
Inventories Inventories are stated at the lower of cost and net realisable value. The cost of inventories is based on the first-in first-out
principle and includes expenditure incurred in acquiring the inventories and bringing them to their existing location and condition. Net
realisable value is the estimated selling price in the ordinary course of business, less the estimated costs of completion and selling expenses.
Cash and cash equivalents Cash and cash equivalents comprise cash balances and call deposits. Bank overdrafts that are repayable
on demand and form an integral part of the Group’s cash management are included as a component of cash and cash equivalents for the
purpose of the statement of cash flows.
Impairment The carrying amounts of the Group’s assets, other than inventories and deferred tax assets, are reviewed at each balance sheet
date to determine whether there is any indication of impairment. If any such indication exists, the asset’s recoverable amount is estimated.
For goodwill, assets that have an indefinite useful life and intangible assets that are not yet available for use, the recoverable amount is
estimated at each balance sheet date, or when there is an indication of impairment.
An impairment loss is recognised whenever the carrying amount of an asset or its cash-generating unit exceeds its recoverable amount.
Impairment losses are recognised in the income statement.
Impairment losses recognised in respect of cash-generating units are allocated first to reduce the carrying amount of any goodwill allocated to
cash-generating units (group of units) and then, to reduce the carrying amount of the other assets in the unit (group of units) on a pro rata basis.
When a decline in the fair value of an available-for-sale financial asset has been recognised directly in equity and there is objective evidence
that the asset is impaired, the cumulative loss that had been recognised directly in equity is recognised in profit or loss even though the
financial asset has not been derecognised. The amount of the cumulative loss that is recognised in profit or loss is the difference between
the acquisition cost and current fair value, less any impairment loss on that financial asset previously recognised in profit or loss.
Calculation of recoverable amount The recoverable amount of the Group’s investments in held-to-maturity securities and receivables carried
at amortised cost is calculated as the present value of estimated future cash flows, discounted at the original effective interest rate
(i.e., the effective interest rate computed at initial recognition of these financial assets). Receivables with a short duration are not discounted.
The recoverable amount of other assets is the greater of their fair value less costs to sell and their value in use. In assessing value in use,
the estimated future cash flows are discounted to their present value using a pre-tax discount rate that reflects current market assessments
32 Financial statements 2006
Net investment in foreign operations Exchange differences arising from the translation of the net investment in foreign operations, and
of related hedges are taken to translation reserve. They are released into the income statement upon disposal.
In respect of all foreign operations, any differences that have arisen from 1 January 2004, the date of transition to IFRS, are presented in the
translation reserve, a separate component of equity.
Property, plant and equipment Owned assets Items of property, plant and equipment are stated at cost less accumulated
depreciation (see below) and impairment losses. The cost of self-constructed assets includes the cost of materials, direct labour, the initial
estimate, where relevant, of the costs of dismantling and removing the items and restoring the site on which they are located, and an
appropriate proportion of production overheads.
Where parts of an item of property, plant and equipment have different useful lives, they are accounted for as separate items of property,
plant and equipment.
Leased assets Leased assets terms of which the Group assumes substantially all the risks and rewards of ownership are classified as finance
leases. The owner-occupied property acquired by way of finance lease is stated at an amount equal to the lower of its fair value and the
present value of the minimum lease payments at inception of the lease, less accumulated depreciation (see below) and impairment losses.
The property held under finance leases and leased out under operating lease is classified as investment property and stated at the fair value
model. Lease payments are accounted for as described in accounting policy. Property held under operating leases that would otherwise
meet the definition of investment property may be classified as investment property on a property-by-property basis.
Subsequent costs The Group recognises in the carrying amount of an item of property, plant and equipment the cost of replacing part of
such an item when that cost is incurred if it is probable that the future economic benefits embodied with the item will flow to the Group
and the cost of the item can be measured reliably. All other costs are recognised in the income statement as an expense as incurred.
Depreciation Depreciation is charged to the income statement on a straight-line basis over the estimated useful lives of each part of an
item of property, plant and equipment. Land is not depreciated. The estimated useful lives are as follows:
• equipment and installations 5 - 10 years
• refurbishing 5 - 8 years
• computers and programmes 3 years
• other assets 3 years
The residual value, if not insignificant, is reassessed annually.
Intangible assets Goodwill All business combinations are accounted for by applying the purchase accounting method. Goodwill
represents amounts arising on acquisition of subsidiaries, associates and joint ventures. In respect of business acquisitions that have
occurred since 1 January 2004, goodwill represents the difference between the cost of the acquisition and the fair value of the net
identifiable assets acquired.
In respect of acquisitions prior to this date, goodwill is included on the basis of its deemed cost, which represents the amount recorded
under previous GAAP. The classification and accounting treatment of business combinations that occurred prior to 1 January 2004 has not
been reconsidered in preparing the Group’s opening IFRS balance sheet at 1 January 2004.
Goodwill is stated at cost less any accumulated impairment losses. Goodwill is allocated to cash-generating units and is no longer
amortised but is tested annually for impairment.
Negative goodwill arising on an acquisition is recognised directly in profit or loss.
Research and development Expenditure on research activities, undertaken with the prospect of gaining new scientific or technical
knowledge and understanding, is recognised in the income statement as expenses are incurred.
Expenditure on software development activities, whereby research findings are applied to a plan or design for the production of new or
substantially improved products and processes, is capitalised if the product or process is technically and commercially feasible and the
Group has sufficient resources to complete development. The expenditure capitalised includes the cost of materials, direct labour and an
appropriate proportion of overheads. Other development expenditure is recognised in the income statement as an expense as incurred.
Capitalised software development expenditure is stated at cost less accumulated amortisation (see below) and impairment losses.

35Financial statements 2006
Revenue Net sales include the income from sales and supply of goods and services less discounts, agents’ commissions, bonuses and
sales taxes. Profit on work in progress is taken pro rata to the progress of the project (‘percentage of completion method’). The performance
achieved during the year under review, in this case the costs of supplied raw materials, directly and indirectly attributable wage and
overhead costs as well as a mark-up for profit pro rata to the progress of the project are stated as sales.
A large part of sales concerns income from the selling of software licences, as well as providing related services such as supplying
maintenance, support and training with regard to in-house developed software. In addition, income is generated by performing and
supervising software and hardware implementations as well as tailoring in-house developed software to specific customers’ needs.
Software arrangements range from those that provide a license for a single software product (‘standard software’) to those that, in addition
to the delivery of software or a software system, require a significant production, modification, or customization of the software.
If an arrangement to deliver software or a software system, either alone or together with other products or services, requires significant
production, modification, or customization of the software, the entire arrangement has to be accounted for in conformity with
contract-accounting (for construction contracts).
Sale of software License fee revenue from standard software is recognised in the income statement when the significant risks and rewards
of ownership have been transferred to the buyer. No revenue is recognised if there are significant uncertainties regarding recovery of the
consideration due, associated costs or the possible return of the software.
The license fee income from standard software is recognised when all of the following conditions are met:
• the software licence contract has been signed;
• the software and accompanying documentation have been delivered;
• there are no material uncertainties regarding customer acceptation; and
• there are no material uncertainties regarding payment of the account receivable.
Software services If an arrangement to deliver software or a software system, requires significant production, modification, or customization
of the software, revenue should be recognized using the ‘percentage of completion’-method. The actual delivery of the non-standard
software is therefore not regarded as the realisation moment for software that requires significant production, modification or customization.
Revenue related to the delivery of non-standard software is accounted for pro rata the progress of the project, which comprises the complete
installation, modification and customizing of the software in the client’s environment.
IFRS further prescribes that when the outcome of a project can be estimated reliably, contract revenue and expenses are recognised in the
income statement in proportion to the stage of completion of the contact. The stage of completion is assessed by reference to surveys of
work performed. If such estimates can not be made reliably or surveys regarding the work performed are not available, all contract revenue
is deferred and is accounted for on the basis of completed contract.
No revenue is recognised if there are significant uncertainties regarding recovery of the consideration due, associated costs or the possible
return of the software. An expected loss on a contract is immediately recognised in the income statement.
Maintenance and Support revenue The services with regard to performing maintenance and support are contractually agreed with customers.
The maintenance and support agreements contain the records of support received over the telephone by a helpdesk and of obtained patches
as well as obtained new versions (‘updates’) of licensed software.
The income from the maintenance and support contracts is recognised over and attributed to the period to which the income relates. This
period will generally be a 12-month period. Unrealised income, consisting of the unrealised and therefore deferred part of the income from
these maintenance and support contracts, is stated under short-term debts.
Goods sold and services rendered Revenue from the sale of goods is recognised in the income statement when the significant risks and
rewards of ownership have been transferred to the buyer. Revenue from services rendered is recognised in the income statement in proportion
to the stage of completion of the transaction at the balance sheet date. The stage of completion is assessed by reference to surveys of work
performed. No revenue is recognised if there are significant uncertainties regarding recovery of the consideration due, associated costs or
the possible return of goods also continuing management involvement with the goods.
Capitalised production for own company The income from capitalised production for own company relates to the capitalisation of software
development costs with regard to in-house developed software and is accounted for in operating costs.
34 Financial statements 2006
of the time value of money and the risks specific to the asset. For an asset that does not generate largely independent cash inflows, the
recoverable amount is determined for the cash-generating unit to which the asset belongs.
Reversals of impairment An impairment loss in respect of a held-to-maturity security or receivable carried at amortised cost is reversed if
the subsequent increase in recoverable amount can be related objectively to an event occurring after the impairment loss was recognised.
An impairment loss in respect of an investment in an equity instrument classified as available for sale is not reversed through profit or loss.
If the fair value of a debt instrument classified as available-for-sale increases and the increase can be objectively related to an event occurring
after the impairment loss was recognised in profit or loss, the impairment loss shall be reversed, with the amount of the reversal recognised
in profit or loss.
An impairment loss in respect of goodwill is not reversed.
In respect of other assets, an impairment loss is reversed if there has been a change in the estimates used to determine the recoverable
amount.
An impairment loss is reversed only to the extent that the asset’s carrying amount does not exceed the carrying amount that would have
been determined, net of depreciation or amortisation, if no impairment loss had been recognised.
Share capital Repurchase of share capital When share capital recognised as equity is repurchased, the amount of the consideration
paid, including directly attributable costs, is recognised as a change in equity. Repurchased shares are classified as treasury shares and
presented as a deduction from total equity.
Convertible notes Convertible notes that can be converted to share capital at the option of the holder, where the number of shares
issued does not vary with changes in their fair value, are accounted for as compound financial instruments. Transaction costs that relate to
the issue of a compound financial instrument are allocated to the liability and equity components in proportion to the allocation of proceeds.
The equity component of the convertible notes is calculated as the excess of the issue proceeds over the present value of the future interest
and principal payments, discounted at the market rate of interest applicable to similar liabilities that do not have a conversion option.
The interest expense recognised in the income statement is calculated using the effective interest rate method.
Interest-bearing borrowings Interest-bearing borrowings are recognised initially at fair value less attributable transaction costs.
Subsequent to initial recognition, interest-bearing borrowings are stated at amortised cost with any difference between cost and redemption
value being recognised in the income statement over the period of the borrowings on an effective interest basis.
Employee benefits Defined contribution plans Obligations for contributions to defined contribution pension plans are recognised as
an expense in the income statement as incurred.
Share-based payment transactions Share Appreciation Rights are granted to staff members and management. The fair value of the amount
payable to the employee is recognised as an expense. The fair value is initially measured at grant date and spread over the period during
which the employees become unconditionally entitled to payment. The fair value of the Share Appreciation Rights is measured based on the
Black-Scholes formula, taking into account the terms and conditions upon which the instruments were granted. The liability is remeasured
at each balance sheet date and at settlement date. Any changes in the fair value of the liability are recognised as a finance cost.
Provisions A provision is recognised in the balance sheet when the Group has a present legal or constructive obligation as a result of a
past event, and it is probable that an outflow of economic benefits will be required to settle the obligation. If the effect is material,
provisions are determined by discounting the expected future cash flows at a pre-tax rate that reflects current market assessments of the
time value of money and, where appropriate, the risks specific to the liability.
Restructuring A provision for restructuring is recognised when the Group has approved a detailed and formal restructuring plan, and the
restructuring has either commenced or has been announced publicly. Future operating costs are not provided for.
Onerous contracts A provision for onerous contracts is recognised when the expected benefits to be derived by the Group from a contract
are lower than the unavoidable cost of meeting its obligation under the contract.
Trade and other payables Trade and other payables are stated at amortised cost. The initial recognition is at fair value less attributable
transaction costs.

37Financial statements 2006
Classification as a discontinued operation occurs upon disposal or when the operation meets the criteria to be classified as held for sale,
if earlier. A disposal group that is to be abandoned may also qualify.
New standards and interpretations not yet adopted A number of new standards, amendments to standards and interpretations
were not yet effective in 2006 and have not, therefore, been applied to these consolidated financial statements.
IFRS 7 Financial statements: Disclosures and the Amendment to IAS 1 Presentation of Financial Statements: Capital Disclosures require
extensive disclosures about the significance of financial instruments for entity’s financial position and performance, and qualitative and
quantitative disclosures on the nature and extent of risks. IFRS 7 and amended IAS 1, which become mandatory for the Group’s 2007 financial
statements, will require extensive additional disclosures with respect to Group’s financial instruments and share capital.
IFRS 8 Operating segments concerns segments reporting and replaces IAS 14. As a consequence of this standard the identification of segments
will change. Conditional to its adoption by the EU, this standard will become obligatory in 2009.
IFRIC 8 Scope of IFRS 2 Share-based Payment addresses the accounting for share-based payment transactions in which some or all of goods
or services received cannot be specifically identified. IFRIC 8 will become mandatory for the Group’s 2007 financial statements, with
retrospective applications required. IFRIC 8 is not expected to have any effect on the consolidated financial statements.
IFRIC 9 Reassessment of Embedded Derivatives requires that a reassessment of whether embedded derivative should be separated from the
underlying host contract should be made only when there are changes to the contract. IFRIC 9, which becomes mandatory for the Group’s
2007 financial statements, is not expected to have any impact on de the consolidated financial statements.
IFRIC 10 Interim Financial Reporting and Impairment prohibits the reversal of an impairment loss recognised in a previous interim period in
respect of goodwill, an investment in an equity instrument or a financial asset carried at cost. IFRIC 10 will become mandatory for the
Group’s 2007 financial statements, and will apply to goodwill, investments in equity instruments, and financial assets carried at cost
prospectively from the date that the Group first applied the measurement criteria of IAS 36 and IAS 39 respectively (i.e. 1 January 2004 and
1 January 2005 respectively). The adoption if IFRIC 10 has no effect on impairments that have been recognised during an interim period and
have been reversed before 31 December 2006.
IFRIC 11 Group and Treasure Share Transactions Conditional to its adoption by the EU, this interpretations will become effective in 2007.
This interpretation is not expected to have any effect on the 2007 financial statements.
IFRIC 12 Service Concession Arrangements deals with the manner in which such arrangements should be recognised in the financial
statements. Conditional to its adoption by the EU, this interpretation will become effective in 2008. IFRIC 12 is not expected to have
any effect on the consolidated financial statements.
36 Financial statements 2006
Expenses Operating lease payments Payments made under operating leases are recognised in the income statement on a straight-line basis
over the term of the lease. Lease incentives received are recognised in the income statement as an integral part of the total lease expense.
Finance lease payments Minimum lease payments are apportioned between the finance charge and the reduction of the outstanding
liability. The finance charge is allocated to each period during the lease term so as to produce a constant periodic rate of interest on the
remaining balance of the liability.
Finance income and expenses Finance income comprises interest income on funds invested, dividend income gains on the disposal of
available-for-sale financial assets, changes in the fair value of financial assets at fair value through profit or loss, and foreign currency gains.
Interest income is recognised as it accrues, using the effective interest method. Dividend income is recognised on the date that the right to
receive payment is established, which in the case of quoted securities is the ex-dividend date.
Finance expense comprise interest expense on borrowings, unwinding of the discount on provisions, dividend on preference shares classified
as liabilities, foreign currency losses, changes in the fair value of financial assets at fair value through profit or loss, and impairment losses
recognised on financial assets. All borrowing costs are recognised in profit or loss using the effective interest method.
Income tax Income tax on the profit or loss for the year comprises current and deferred tax. Income tax is recognised in the income
statement except to the extent that it relates to items recognised directly in equity, in which case it is recognised in equity.
Current tax is the expected tax payable on the taxable income for the year, using tax rates enacted or substantially enacted at the balance
sheet date, and any adjustment to tax payable in respect of previous years.
Deferred tax is provided using the balance sheet liability method, providing for temporary differences between the carrying amounts of
assets and liabilities for financial reporting purposes and the amounts used for taxation purposes. The following temporary differences are
not provided for: taxable temporarily differences arising from the initial recognition of goodwill, the initial recognition of assets or liabilities
that affect neither accounting nor taxable profit, and differences relating to investments in subsidiaries to the extent that they will probably
not reverse in the foreseeable future. The amount of deferred tax provided is based on the expected manner of realisation or settlement of
the carrying amount of assets and liabilities, using tax rates enacted or substantively enacted at the balance sheet date.
A deferred tax asset is recognised only to the extent that it is probable that future taxable profits will be available against which the asset
can be utilised. Deferred tax assets are reduced to the extent that it is no longer probable that the related tax benefit will be realised.
Additional income taxes that arise from the distribution of dividends are recognised at the same time as the liability to pay the related dividend.
Minority interests Minority interests are valued at the third party interest in the net asset value, determined in accordance with the
accounting principles of the Group.
Segment reporting A segment is a distinguishable component of the Group that is engaged either in providing products or services
(business segment), or in providing products or services within a particular economic environment (geographical segment), which is subject
to risks and rewards that are different from those of other segments.
Non-current assets held for sale and discontinued operations Assets are classified as assets held for sale and stated at the
lower of the carrying amount and fair value less costs to sell if their carrying amount is recovered principally through a sale transaction
rather than through continuing use.
Immediately before classification as held for sale, the measurement of the assets (and all assets and liabilities in a disposal group) is
brought up-to-date in accordance with applicable IFRSs. Then, on initial classification as held for sale, non-current assets and disposal
groups are recognised at the lower of carrying amount and fair value less costs to sell.
Impairment losses on initial classification as held for sale are included in profit or loss, even when there is a revaluation. The same applies
to gains and losses on subsequent remeasurement.
A discontinued operation is a component of the Group’s business that represents a separate major line of business or geographical area
of operations or is a subsidiary acquired exclusively with a view to resale.

Notes to the consolidated income statement Notes to the consolidated financial statements 2006
39Financial statements 2006
Other operating income Other operating income mainly relates to received compensation for marketing activities.
Wages and salaries and social security charges
Wages and salaries 17,914 16,308
Social security charges 2,137 2,041
Contribution to defined contributionplans 583 597
Increase in liability for defined benefitplans 39 66
Increase in liability for long service benefits 7 -2
Total wages and salaries and social security charges 20,680 19,010
Staff During 2006, the group had an average of 331 staff members (2005: 351). This staff can be divided as follows over the various divisions:
Staff over the various divisions
Management and staff holding company 13 11
Textile and Apparel Software division 208 217
Engineering and Geographic Information Software division 95 110
Other activities 15 13
Total number of staff members 331 351
Other operating costs The other operating costs can be specified as follows:
Sales costs 1,954 2,148
Housing costs 1,781 1,762
Car costs 1,088 1,010
Other staff costs 1,149 1,192
General costs 4,861 3,817
Currency and exchange rate differences 185 -198
Total other operating costs 11,018 9,731
38 Financial statements 2006
Segment reporting Segment information is presented in respect of the Group’s business and geographical segments. The primary
format, business segments, is based on the Group’s management and internal reporting structure.
Inter-segment pricing is determined on an arm’s length basis.
Segment results, assets and liabilities include items directly attributable to a segment as well as those that can be allocated on a
reasonable basis. Unallocated items comprise mainly income-earning assets and revenue, interest-bearing loans, borrowings and expenses,
and corporate assets and expenses.
Segment capital expenditure is the total cost incurred during the period to acquire segment assets that are expected to be used for more
than one period.
Business segments The Group comprises the following main business segments:
• Textile and Apparel Software Division
• Engineering and Geographical Information Software Division
• Other
Geographical segments In presenting information on the basis of geographical segments, segment revenue is based on the
geographical location of customers. Segment assets are based on the geographical location of the assets.
Business segment reporting
Revenue from external customers
Software sales 5,730 6,762 20,995 21,812 - - - - 26,725 28,574
Services 11,249 12,291 6,301 6,552 4,845 5,023 - - 22,395 23,866
Total revenue from external customers 16,979 19,053 27,296 28,364 4,845 5,023 - - 49,120 52,440
Inter segment revenue 138 207 128 34 - - -266 -241 - -
Total Revenue 17,117 19,260 27,424 28,398 4,845 5,023 -266 -241 49,120 52,440
Operating result -2,866 24 1,221 1,373 -5,190 -2,897 - - -6,835 -1,500
Segment assets 16,822 20,797 10,424 11,462 13,058 3,825 -10,112 -7,703 30,192 28,381
Segment Liabilities 11,255 7,538 7,234 6,250 17,591 10,118 -9,156 -5,387 26,924 18,519
Capital expenditure 3,123 2,138 853 1,165 261 103 - - 4,237 3,406
Amortisation and depreciation 2,468 2,253 1,362 1,223 884 894 - - 4,714 4,370
Impairment losses - - 891 - - - - - 891 -
Engineeringand Geographical
Textile and Apparel Informationin thousands of euros Software division Software division Others Eliminations Total
23,404 24,685 10,620 11,610 11,109 11,693 1,346 1,898 2,641 2,554 - - 49,120 52,440
29,170 25,871 6,666 7,687 4,729 4,880 - - - - -10,373 -10,057 30,192 28,381
2,573 2,453 1,620 905 44 48 - - - - - - 4,237 3,406
the Netherlands Europa (other)North and
South America Africa Asia/Pacific Eliminations Total
Geographical segment reporting
Total revenue from
external customers
Segment assets
Capital expenditure
2006 2005 2006 2005 2006 2005 2006 2005 2006 2005 2006 2005 2006 2005
2006 2005 2006 2005 2006 2005 2006 2005 2006 2005
in thousands of euros
in thousands of euros 2006 2005
in average FTE 2006 2005
in thousands of euros 2006 2005
21
3
4

Notes to the consolidated balance sheet
41Financial statements 2006
Property, plant and equipment 2006 Movements were as follows:
Costs 1 January 6,008 5,962 11,970 11,544
Accumulated depreciation
1 January -3,922 -5,200 -9,122 -7,892
Book value as at 1 January 2,086 762 2,848 3,652
Changes:
Investments 244 325 569 429
Disposals -10 -9 -19 -3
Depreciation -630 -487 -1,117 -1,260
Currency influences - -18 -18 30
Other movements -1,690 - -1,690 -
-2,086 -189 -2,275 -804
Costs 31 December - 6,274 6,274 11,970
Accumulated depreciation
31 December - -5,701 -5,701 -9,122
Book value as at 31 December - 573 573 2,848
At 31 December 2006, the carrying amount (€ 1,690,000) of machines and installations has been classified as assets held for sale.
This classification has been presented in other movements.
The following depreciation percentages are used:
Depreciation percentages
Machines and installations 10-20
Refurbishing 10-12
Computer equipment and programmes 33
Other assets 33
40 Financial statements 2006
Corporate income tax The activities of the Blue Fox group are subject to corporate income taxes of various countries, with tax rates
between 4.25% and 40%. We should note that in the case of a relatively low nominal tax rate, not all the costs incurred are tax deductible.
The various tax rates and the presence of unrealised tax loss carry forwards are the cause of a deviation of the actual weighted tax pressure
and the nominal tax rate in the Netherlands (29.6%). For the fiscal unit for corporate income tax with respect to the Dutch entities all years
up until 2004 have been filed. All filings up until 2003 have been accepted.
The reconciliation of the nominal and the effective tax pressure is as follows:
Corporate income tax
Result from ordinary activities before taxation -7,107 -1,834
Result sale of participations -119 -
Taxable income -7,226 -1,834
Weigthed average taxation -2,159 30% -550 30%
Valuation adjustment fiscal losses carry forward 1,001 -
Non deductible items 625 194
Tax for the year -533 -356
Current year tax 173 -73
Deferred tax -706 -283
Total tax for the year -533 -356
Deferred tax assets have been recognised in the annual accounts, as far as they can be reasonably expected to be realised within the
foreseeable future.
in thousands of euros 2006 % 2005 %
machines and other total totalin thousands of euros installations assets 2006 2005
%
6
5

43Financial statements 2006
Other investments Other investments wholly relates to financial assets. Movements were as follows:
Book value as at 1 January 490 420
Changes:
Redemption on loans granted -400 -50
Granted loans - 120
-400 70
Book value as at 31 December 90 490
The loan of € 50,000 to Symbision Holding B.V., the holding company of Deco ICT Solutions B.V., has been repaid in full on 15 March 2005.
The carrying amount of the in 2003 issued subordinated loan to Kenfil Distribution B.V. was € 400,000 as per December 31, 2005.
This amount has been collected in the first quarter of 2006.
In October 2003, the company issued a loan of € 90,000 to Secundo B.V., the holding company of CMedia Productions B.V. The loan is
subordinated to all Secundo’s obligations to its bank. The interest on this loan on an annual basis is 6% and the loan will be repaid in two
equal instalments, on 1 October 2007 and 1 October 2008.
Deferred tax assets and liabilities Recognised deferred tax assets and liabilities Deferred tax assets and liabilities are
attributable to the following:
Recognised deferred tax assets and liabilities
Intangible assets - - -980 -2,944 -980 -2,944
Employee benefits - 74 - - - 74
Interest-bearing loans and borrowings - - -17 -52 -17 -52
Tax value of loss carry forward recognised 997 2,216 - - 997 2,216
Tax assets/liabilities 997 2,290 -997 -2,996 - -706
Netting of tax -997 -1,985 997 1,985 - -
Net tax assets and liabilities - 305 - -1,011 - -706
Unrecognised deferred tax assets Deferred tax assets have not been recognised in respect of the following items:
Unrecognised deferred tax assets
Tax Losses 2,886 666
2,886 666
42 Financial statements 2006
Intangible assets Movements were as follows:
Costs 1 January 21,252 17,849 43 39,144 36,164
Accumulated amortisation
and depreciation 1 January -15,875 -8,036 -43 -23,954 -20,844
Book value as at 1 January 5,377 9,813 0 15,190 15,320
Changes:
Investments - 3,668 - 3,668 2,980
Amortisation and depreciation - -3,597 - -3,597 -3,110
Impairment - -891 - -891 0
- -820 - -820 -130
Costs 31 December 21,252 21,517 43 42,812 39,144
Accumulated amortisation
and depreciation 31 December -15,875 -12,524 -43 -28,442 -23,954
Book value as at 31 December 5,377 8,993 - 14,370 15,190
The following amortisation/depreciation percentages are used:
Amortisation/depreciation percentages
Costs of software development 10-20
Costs of obtaining rights and patents 20
Costs of software development includes an amount of € 2.0 million, relating to the software obtained by the acquisition of NedGraphics.
Contrary to in-house developed software, which is depreciated in five years, this third-party obtained software is depreciated in ten years
(carrying value: € 0.9 million).
Impairment test for intangible assets The recoverable amount of cash-generating units is based on value-in-use calculations.
Those calculations use cash flow projections based on a three year business plan. Cash flows for further periods are extrapolated using a
two per cent growth rate. A pre-tax discount rate of 15.0 per cent has been used in discounting the projected cash flows. The goodwill
relates to the Textile and Apparel Software division. The carrying amount of this cash-generating unit is lower then the recoverable amount.
A ten per cent decrease in future planned revenues from software sales would not result in an impairment loss of significance.
Within the Engineering and Geographical Information Software division some product lines were ceased in the fourth quarter of 2006. As a
result the carrying amount of cost of software development related to these product lines of EUR 0.6 million was impaired. In addition
another EUR 0.3 million impairment charge was recognised based on value-in-use calculations. The impairment charges were recognised in
profit and loss on the line amortisation and depreciation.
costs of software costs of obtained total totalin thousands of euros goodwill development rights and patents 2006 2005
%
in thousands of euros 2006 2005
assets assets liabilities liabilities net netin thousands of euros 2006 2005 2006 2005 2006 2005
in thousands of euros 2006 2005
7 8
9

recognised balancein thousands of euros 01-01-2005 in income 31-12-2005
recognised balancein thousands of euros 01-01-2006 in income 31-12-2006
45Financial statements 2006
The stage of completion of contracts has been determined based on hours worked and realised production.
Trade and other receivables
Trade receivables 6,865 5,106
Amounts to be invoiced 292 421
Prepaid expenses 576 497
Other receivables and accrued income 561 543
8,294 6,567
A credit limit has been agreed with a credit insurance company for most of the Dutch debtors, with the exception of (semi-) government
institutions. Within this limit, 90% of the accounts receivable are covered for insolvency, with an own risk of € 2,269 per debtor.
A provision has been made if deemed necessary for the uncovered part of bad debts.
Cash and cash equivalents
Bank balances 3,145 1,657
Cash 11 17
Cash and cash equivalents 3,156 1,674
Assets held for sale
Property, plant and equipment 1,690 -
Trade and other receivables 603 -
Cash and cash equivalents 590 -
Total assets 2,883 -
Bank overdraft 456 -
Trade and other payables 1,146 -
Total liabilities 1,602 -
On 1 March, 2007 the company announced the sale of its subsidiary Carrier to Carrier Telecom N.V., which has been non-core for Blue Fox for
several years. The intention to sell this activity was already announced in previous periods. As the criteria in IFRS 5 are met at 31 December
2006, the related assets and liabilities have been classified as held for sale. After review of the carrying amount and the fair value less costs
to sell, no impairment losses on initial classification as held for sale were deemed necessary.
44 Financial statements 2006
The tax losses expire in the period from 2011 through 2015. Deferred tax assets have only been recognised to the level of deferred tax liabilities
which are available to offset the deferred tax assets within the same fiscal unity for corporate income tax purposes. The amount of deferred
tax assets that exist in excess of these deferred tax liabilities has not been recognised because it is not probable that taxable profit will be
available in the near future against which the temporary difference can be utilised.
Movement in deferred tax during the year
Intangible assets -2,944 1,964 -980
Employee benefits 74 -74 -
Interest-bearing loans and borrowings -52 35 -17
Tax value of loss carry forward recognised 2,216 -1,219 997
-706 706 -
Intangible assets -3,130 186 -2,944
Employee benefits 75 -1 74
Interest-bearing loans and borrowings -99 47 -52
Tax value of loss carry forward recognised 2,165 51 2,216
-989 283 -706
Inventories
Trade goods 740 984
Provision for obsolescence -36 -41
Total inventories 704 943
The valuation of inventories on the basis of net realisable value is not materially different from the valuation above.
Work in progress
Work in progress 96 296
Net work in progress 96 296
The valuation of work in progress includes losses and possible future losses, as far as these can be foreseen as at balance sheet date.
in thousands of euros 31-12-2006 31-12-2005
in thousands of euros 31-12-2006 31-12-2005
in thousands of euros 31-12-2006 31-12-2005
in thousands of euros 31-12-2006 31-12-2005
in thousands of euros 31-12-2006 31-12-2005
10
12
13
14
11

47Financial statements 2006
Instruments that could potentially dilute earnings per share in the future, but were not included in the calculation of diluted earnings per
share, because they were not dilutive for the periods presented:
Effect of conversion of convertible notes 354,557 173,126
Effect of share options on issue 64,620 162,760
Interest-bearing loans and borrowings This note provides information about the contractual terms of the Group’s
interest-bearing loans and borrowings. For more information about the Group’s exposure to interest rate and foreign currency risk,
see notes on interest risk and foreign currency risk.
Interest-bearing loans and borrowings
Non-current liabilities
Secured Bank loans 1,000 -
Convertible notes - 1,130
1,000 1,130
Current liabilities
Current portion of secured bank loans 1,000 625
Convertible notes 2,075 840
3,075 1,465
Convertible notes
Nominal value 2,142 2,142
Amount classified as equity -395 -395
Accreted interest capitalized 328 223
Carrying amount of liability as at 31 December 2,075 1,970
Terms and debt repayment schedule A long-term subordinated convertible loan with a nominal value of € 1,292,000 was granted
by a number of former shareholders of Carrier to Carrier. The term of this interest-free loan is seven years, as of 1 July 2000. Blue Fox has the
right of early settlement of this loan, if and to the extent that the average closing price of the Blue Fox shares has been at least € 36.43
during a continuous period of 20 trading days. On 1 July 2003, the grantors of the loan had the right to convert the whole loan into Blue Fox
ordinary shares at a fixed price of € 29.14. As this convertible loan will be repaid in 2007, it has been classified in current liabilities.
Mid-2003, an additional long-term convertible subordinated loan of € 850,000 with a term of three years was obtained. Mid-2006, repayment
of this loan was extended to mid-2007 with a zero per cent interest rate. The grantor of the loan may at all times convert the whole loan
into ordinary shares of Blue Fox at a fixed price of € 2.74.
The secured bank loans consist of a medium-term loan for an amount of € 2.0 million, with a 5.45 per cent interest rate. This loan will be
redeemed in two annual instalments amounting to € 1.0 million, of which the first one will be paid on 1 July 2007. The securities for this
loan are disclosed in note 19.
Employee benefits
Liability for employee benefits 504 465
Liability for long service benefits 252 245
756 710
46 Financial statements 2006
Shareholders’ equity Capital and reserves Reconciliation of movement in capital and reserves
Balance as at 31 December 2004 7,024 22,128 8,605 -35 -13,812 -12,631 11,279 52 11,331
Appropriation of result - - - - -12,631 12,631 - - -
Exchange rate differences participating interests - - - 3 - - 3 6 9
Transfer from other reserves - - 73 - -73 - - - -
Result financial year - - - - - -1,482 -1,482 4 -1,478
Balance as at 31 December 2005 7,024 22,128 8,678 -32 -26,516 -1,482 9,800 62 9,862
Appropriation of result - - - - -1,482 1,482 - - -
Exchange rate differences participating interests - - - -20 - - -20 - -20
Transfer from other reserves - - -618 - 618 - - - -
Result financial year - - - - - -6,560 -6,560 -14 -6,574
Balance as at 31 December 2006 7,024 22,128 8,060 -52 -27,380 -6,560 3,220 48 3,268
Share capital and share premium At 31 December 2006, the authorised share capital comprised 3,512,120 ordinary shares
(2005: 3,512,120).
Legal reserves In line with the Netherlands Civil Code, a legal reserve is recognised for the carrying amount of capitalised software
development costs at balance sheet date.
Translation reserves The translation reserve comprises all foreign exchange differences arising from the translation of the financial
statements of foreign operations that are not integral to the operations of the company, as well as from the translation of liabilities that
hedge the company’s net investment in a foreign subsidiary.
Earnings per share The calculation of earnings per share at 31 December 2006 was based on the result attributable to ordinary
shareholders of € -6,560,000 (2005: € -1,482,000) and a weighted average number of ordinary shares outstanding during the year ended
31 December 2006 of 3,512,120 (2005: 3,512,120), calculated as follows:
Result attributable to ordinary shareholders
Result for the period -6,560 -1,482
Result recognised in the income statement -6,560 -1,482
Weighted average number of ordinary shares
Issued ordinary shares at 1 January 3,512,120 3,512,120
Effect of own shares held - -
Effect of issued shares at 31 December - -
Weighted average number of ordinary shares 3,512,120 3,512,120
unallocatedtrans- accu- current
share share legal lation mulated year’s minority totalin thousands of euros capital premium reserves reserves deficit result total interest equity
in thousands of euros 31-12-2006 31-12-2005
31-12-2006 31-12-2005
31-12-2006 31-12-2005
in thousands of euros 31-12-2006 31-12-2005
in thousands of euros 31-12-2006 31-12-2005
15
16
17

49Financial statements 2006
Operating leases Non-cancellable operating lease rentals are payable as follows:
Less than one year 1,578 1,845
Between one and five years 4,528 3,248
More than five years 943 1,006
7,049 6,099
Financial instruments Exposure to credit, interest rate and currency risks arises in the normal course of the Group’s business.
Credit risk Management has a credit policy in place and the exposure to credit risk is monitored on an ongoing basis. Credit evaluations
are performed or advanced down payments are requested on all customers requiring credit over a certain amount. The Group does not
require collateral in respect of financial assets.
At the balance sheet date there were no significant concentrations of credit risk. The maximum exposure to credit risk is represented by the
carrying amount of each financial asset.
Interest rate risk The Group has not entered into interest rate swaps.
Foreign currency risk The Group is exposed to foreign currency risk on sales and purchases that are denominated in a currency other
than the euro. The currencies giving rise to this risk are primarily U.S. Dollars.
In respect of other monetary assets and liabilities held in currencies other than the euro, the Group ensures that the net exposure is kept to
an acceptable level, by buying or selling foreign currencies at spot rates where necessary to address short-term imbalances.
Forecasted transactions The Group has not entered into forward exchange contracts hedging forecasted transactions.
Fair values The fair values of financial instruments are not materially different from the carrying amounts shown in the balance sheet.
Fair values
Other investments 90 490
Trade and other receivables 8,294 6,567
Cash and cash equivalents 3,156 1,674
Interest-bearing loans and borrowings (non-current) -1,000 -1,130
Bank overdraft -6,992 -4,745
Interest bearing loans and borrowings (current) -3,075 -1,465
Trade and other payables -12,173 -9,193
Consolidated cash flow statement for 2006
Cash flow from operating activities The cash flow from operating activities amounted to € 1.6 million (2005: € 5.4 million). The
operating result and depreciation resulted in a cash in-flow of € -1.2 million (2005: € 2.9 million).
Cash flow from investment activities The cash flow from investment activities was, on balance, € -3.6 million against
€ -3.5 million in 2005.
The investments in tangible and intangible fixed assets amounted to € 0.6 million (2005: € 0.4 million) and € 3.7 million
(2005: € 3.0 million), respectively. The investments in intangible fixed assets relate to the in-house developed software.
The carrying amount of the in 2003 issued subordinated loan to Kenfil Distribution B.V. was € 400,000 as per December 31, 2005.
This amount has been collected in the first quarter of 2006.
Cash flow from financing activities The cash flow from financing activities amounted to € 1.4 million (2005: € -0.7 million).
48 Financial statements 2006
Liability for employee benefits Companies’ employees are entitled to a termination payment at the moment of leaving the company.
This termination payment amounts to approximately one month salary per year of service.
Movement in the net liability for employee benefits
Net liability for employee benefits at 1 January 710 646
Expense recognised in the income statement 46 64
Net liability for employee benefits at 31 December 756 710
Provisions
Balance at 1 January 65 200 - 265 -
Provisions made during the year 539 - 787 1,326 265
Provisions used during the year -65 -200 - -265 -
Balance at 31 December 539 0 787 1,326 265
Non-current - - - - -
Current 539 - 787 1,326 265
539 - 787 1,326 265
Restructuring As a result of geographic re-allocation of resources, a provision for restructuring at 31 December 2006 was recognised.
The provision mainly relates to the Textile and Apparel Software division.
Other As a result of the turnaround and downsizing of the holding structure, provisions have been recognised for terminating and
renegotiating contracts with (former) business partners.
Bank overdraft As at 31 December 2006, the Group had current account credit facilities from Fortis Bank of € 4.4 million.
Additionally, Porini Srl had credit facilities with a maximum of € 0.9 million. The following securities were granted for these current
account facilities:
• lien on on property, plant and equipment, trade names and patents, inventories and receivables;
• lien on the shares of all Dutch group companies;
• joint and several liability of all Dutch group companies for debts to Fortis Bank.
Trade and other payables
Trade creditors 5,694 5,450
Tax and social security charges 922 425
Accrued staff expenses 2332 1,525
Accrued sales expenses 336 567
Other debts, accruals and deferred income 2,889 1,226
12,173 9,193
All short-term debts have a term of less than one year.
Off-balance sheet commitments As at 31 December 2006, bank guarantees were issued to third parties to an amount of
€ 0.3 million (year-end 2005: € 0.4 million).
in thousands of euros 2006 2005
onerous total totalin thousands of euros restructuring contracts other 2006 2005
in thousands of euros 31-12-2006 31-12-2005
in thousands of euros 31-12-2006 31-12-2005
in thousands of euros 31-12-2006 31-12-200519
20
21
22
23
18

51Financial statements 2006
Company result -5,067 -2,043
Result from participations -1,493 561
Net result -6,560 -1,482
General The separate financial statements are part of the 2006 financial statements of Blue Fox Enterprises N.V. With reference to the
separate profit and loss account of Blue Fox Enterprises N.V., use has been made of the exemption pursuant to Section 402 of Book 2 of the
Netherlands Civil Code.
Principles for the measurement of assets and liabilities and the determination of the result For setting the principles
for the recognition and measurement of assets and liabilities and determination of the result for its separate financial statements, Blue Fox
Enterprises N.V. makes use of the option provided in section 2:362 (8) of the Netherlands Civil Code. This means that the principles for the
recognition and measurement of assets and liabilities and determination of the result (hereinafter referred to as principles for recognition
and measurement) of the separate financial statements of Blue Fox Enterprises N.V. are the same as those applied for the consolidated EU
GAAP financial statements. Participating interests, over which significant influence is exercised, are stated on the basis of the equity
method. These consolidated EU GAAP financial statements are prepared according to the standards laid down by the International
Accounting Standards Board and adopted by the European Union. Please see pages 30 to 37 for a description of these principles.
The share in the result of participating interests consists of the share of Blue Fox Enterprises N.V. in the result of these participating interests.
Results on transactions, where the transfer of assets and liabilities between Blue Fox Enterprises N.V. and its participating interests and
mutually between participating interests themselves, are not incorporated insofar as they can be deemed to be unrealised.
Company balance sheet as at 31 December 2006
Intangible fixed assets Movements were as follows:
Costs 1 January 2006 20,725 2,265 22,990
Accumulated amortisation and
depreciation 1 January 2006 -15,823 -1,131 -16,954
Book value as at 1 January 2006 4,902 1,134 6,036
Changes:
Amortisation and depreciation - -200 -200
- -200 -200
Costs 31 December 2006 20,725 2,265 22,990
Accumulated amortisation and
depreciation 31 December 2006 -15,823 -1,331 -17,154
Book value as at 31 December 2006 4,902 934 5,836
The cost of software development include an amount of € 2.0 million (market value on acquisition date), relating to the software obtained
by the acquisition of NedGraphics. Contrary to in-house developed software, which is depreciated in five years, this third-party obtained
software is depreciated in ten years.
50 Financial statements 2006
Fixed assets
Intangible fixed assets 5,836 6,036
Tangible fixed assets 48 85
Financial fixed assets 9,019 12,441
Total fixed assets 14,903 18,562
Current assets
Other receivables 2,614 2,842
Cash and cash equivalents 167 -
Total current assets 2,781 2,842
Current liabilities, accruals and deferred income -12,151 -9,191
Current assets less current liabilities -9,370 -6,349
Assets less current liabilities 5,533 12,213
Long-term liabilities -1,000 -1,130
Provisions -1,313 -1,283
Shareholders’ equity 3,220 9,800
Share capital 7,024 7,024
Share premium 22,128 22,128
Legal reserves 8,060 8,678
Translation reserves -52 -32
Accumulated deficit -27,380 -26,516
Unallocated current year’s result -6,560 -1,482
Shareholders’ equity 3,220 9,800
Company balance sheet as at 31 December 2006 before appropriation of result
in thousands of euros 31-12-2006 31-12-2005 in thousands of euros 2006 2005
Company profit and loss account for 2006
Notes to the company annual accounts 2006
costs of softwarein thousands of euros goodwill development total

53Financial statements 2006
The carrying amount of the in 2003 issued subordinated loan to Kenfil Distribution B.V. was € 400,000 as per December 31, 2005.
This amount has been collected in the first quarter of 2006.
In October 2003, the company issued a loan of € 90,000 to Secundo B.V., the holding company of CMedia Productions B.V. The loan is
subordinated to all Secundo’s obligations to its bank. The interest on this loan on an annual basis is 6% and the loan will be repaid in
two equal instalments, on 1 October 2007 and 1 October 2008.
Other receivables
Receivables from group companies 688 875
Deferred taxation 1,672 1,722
Other accounts receivable, prepayments and accrued income 254 245
2,614 2,842
The deferred tax asset of € 1,672,000 (2005: € 1,722,000) concerns the capitalised tax loss carry-forward facilities for the fiscal unity for
corporate income taxes (the Netherlands). This deferred tax assets is off-set by deferred tax liabilities recognised for other companies within
the fiscal unity for corporate income taxes. No deferred tax asset has been recognised for the fiscal unity as a whole as it is not probable
that it will be utilised in the near future.
Current liabilities, accruals and deferred income
Bank overdraft 4,955 3,577
Short term portion of loans 3,075 840
Trade creditors 335 205
Debts to group companies 2,379 4,100
Taxation and social security charges 60 90
Other debts, accruals and deferred income 1,347 379
12,151 9,191
All short-term debts have a term of less than one year.
As at 31 December 2006, the Group had current account credit facilities from Fortis Bank of € 4.4 million. The following securities were
granted for these current account facilities:
• lien on on property, plant and equipment, trade names and patents, inventories and receivables;
• lien on the shares of all Dutch group companies;
• joint and several liability of all Dutch group companies for debts to Fortis Bank.
Long-term liabilities
Secured bank loans 1,000 -
Convertible notes - 1,130
1,000 1,130
Provisions
Provision for negative equity group companies 1,312 1,251
Liability for long service benefits 1 32
1,313 1,283
52 Financial statements 2006
Impairment test for goodwill The goodwill relates to the Textile and Apparel Software division. The recoverable amount of this
cash-generating unit is based on value-in-use calculations. Those calculations use cash flow projections based on a three year business
plan. Cash flows for further periods are extrapolated using a two per cent growth rate. A pre-tax discount rate of 15.0 per cent has been used
in discounting the projected cash flows. The carrying amount of this cash-generating unit is lower then the recoverable amount.
Tangible fixed assets Movements were as follows:
Costs 1 January 648 614
Accumulated depreciation 1 January -563 -459
Book value as at 1 January 85 155
Changes:
Investments 17 34
Depreciation -54 -104
-37 -70
Costs 31 December 665 648
Accumulated depreciation 31 December -617 -563
Book value as at 31 December 48 85
The following amortisation/depreciation percentages are used:
Amortisation/depreciation percentages
Refurbishing 12
Fixtures and fittings 20
Computer equipment 33
Other assets 33
Financial fixed assets The financial fixed assets comprise as follows:
Participations in group companies 8,929 11,951
Granted loans to third party’s 90 490
9,019 12,441
Movements in participations:
Net asset value as at 1 January 11,951 11,090
Capital injections 218 367
Sale/divestment of group companies -68 -
Acquisitions of group companies 659 8
Dividend received -2,378 -1,022
Result from participations -1,493 561
Exchange rate differences -21 2
Change in provisions for negative net asset value 61 945
Net asset value as at 31 December 8,929 11,951
other fixed assets other fixed assetsin thousands of euros 2006 2005
%
in thousands of euros 31-12-2006 31-12-2005
in thousands of euros 31-12-2006 31-12-2005
in thousands of euros 31-12-2006 31-12-2005
in thousands of euros 31-12-2006 31-12-2005
in thousands of euros 31-12-2006 31-12-2005

55Financial statements 2006
Options Members of the Board of Directors and Supervisory Board
S.W. Eisma 1 May 2002 2007 1,980 - 1,980 9,65
May 2003 2008 1,410 - 1,410 5,80
May 2004 2009 1,410 - 1,410 6,34
R.J. Brolsma May 2002 2007 1,480 1,480 - 9,65
May 2003 2008 1,060 1,060 - 5,80
May 2004 2009 1,060 1,060 - 6,34
C.J.J. van Steijn - - - - -
S.L.M. Houtakkers - - - - -
P.A.M. Pellenaars May 2002 2007 150 150 - 9,65
T. Pannekoek - - - - -
L.P.E.M. van den Boom - - - - -
Total 8,550 3,750 4,800
1 S.W. Eisma left the Company as per November 15, 2006. All issued options were cancelled.
54 Financial statements 2006
Shareholders’ equity Movements of the shareholders’ equity can be stated as
Shareholders’ equity Capital and reserves
Balance as at 31 December 2004 7,024 22,128 8,605 -35 -13,812 -12,631 11,279
Appropriation of result - - - - -12,631 12,631 -
Exchange rate differences participations - - - 3 - - 3
Transfer from other reserves - - 73 - -73 - -
Result financial year - - - - - -1,482 -1,482
Balance as at 31 December 2005 7,024 22,128 8,678 -32 -26,516 -1,482 9,800
Appropriation of result - - - - -1,482 1,482 -
Exchange rate differences participations - - - -20 - - -20
Transfer from other reserves - - -618 - 618 - -
Result financial year - - - - - -6,560 -6,560
Balance as at 31 December 2006 7,024 22,128 8,060 -52 -27,380 -6,560 3,220
The authorised share capital consists of 10,000,000 ordinary shares and 5,000,000 preference shares of € 2 nominal value per share.
3,512,120 ordinary shares (2005: 3,512,120) were issued and paid up as at 31 December 2006.
The formed legal reserve is made on account of the capitalisation of costs of in-house developed software.
The share premium reserve includes payments with regard to the issue of shares insofar as these payments exceed the nominal value of
the shares (payment above par). Of the share premium reserve, at least € 11.5 million (2005: € 11.5 million) can be regarded as tax-exempt
share premium in accordance with the ‘Wet inkomstenbelasting 1964’ (Income Tax Act 1964).
The unallocated current year’s loss amounting to € 6,560,000 will be charged to the accumulated deficit.
Off-balance sheet commitments The company has entered into lease agreements whereby the total annual costs amount to
€ 113,000 (year-end 2005: € 100,000). The average remaining term of the lease agreements is 1.6 years.
Blue Fox heads a fiscal entity for corporate income tax purposes, to which all the Dutch 100% participating interests at year-end 2006
belong. On this basis, the company is wholly and severally liable for the tax commitments of the fiscal entity as a whole.
Options No options were exercised in 2006.
May 2002 2007 42,010 24,450 17,560 9,65
May 2003 2008 33,980 21,590 12,390 5,80
May 2004 2009 27,400 18,580 8,820 6,34
Total 103,390 64,620 38,770
A total of 3,750 options has been outstanding to Members (and former Members) of the Board of Directors. It was decided that the
Members of the Supervisory Board of Blue Fox will no longer receive share options as from 2003.
unallocatedtrans- accu- current
share share legal lation mulated year’sin thousands of euros capital premium reserves reserves deficit result total
issued outstanding exercised/ exercisedate granted term options options cancelled price (€)
issued outstanding exercised/ exercisedate granted term options options cancelled price (€)

56 Financial statements 2006
Company profit and loss account for 2006Staff In 2006, the company had an average of 8 staff members (2005: 10 staff members).
Remuneration of the Supervisory Board and Board of Directors The remuneration in 2006 of directors and supervisory
directors was as follows:
Supervisory Board
Ben F.M. Knüppe 0 10,033 - - - - - -
Servaas L.M. Houtakkers 1 90,000 14,645 - - - - - -
Pierre A.M. Pellenaars 19,000 19,000 - - - - - -
Ton Pannekoek 19,000 19,000 - - - - - -
Leon P.M. van den Boom 19,000 8,667 - - - - - -
147,000 71,345 - - - - - -
Board of Directors
Sjoerd W. Eisma 2 3 646,875 225,000 - - 19,688 22,500 - -
Roelof J. Brolsma 4 5 571,478 163,500 - - 27,655 41,128 - -
Cees J.J. van Steijn 6 150,000 - - - - - - -
1,368,353 388,500 - - 47,343 63,628 - -
* Gross salary is exclusive of bonusses, social security charges and pension expenses.
1 Servaas L.M. Houtakkers has acted as delegated supervisory director as of 19 May 2006 and as such received additional compensation
of € 66,0002 Sjoerd W. Eisma left the company as per 15 November, 20063 Gross salary 2006 includes severance payments of € 450,0004 Roelof J. Brolsma will leave the company as per 1 July, 2007. He resigned from the board on 1 December, 20065 Gross salary 2006 includes severance payments of € 328,500, accrued salary 2007 of € 84,000 and pension expenses include accrued pension
premiums 2007 for € 9,0006 Cees J.J. van Steijn joined the company as per 1 August, 2006
Dordrecht, 4 april 2007
The Board of Directors
Cees J.J. van Steijn, Chairman
The Supervisory Board
Servaas L.M. Houtakkers, Chairman
Ton Pannekoek
Pierre A.M. Pellenaars
Leon P.E.M. van den Boom
2006 2005 2006 2005 2006 2005 2006 2005
pension optionsin euros gross salary * bonusses expenses granted

59Other information
Statutory provisions concerning result appropriation
Pursuant to article 28 of the Articles of Association, the profit is at the disposal of the Annual General Meeting of Shareholders.
Proposal result appropriation 2006
The unallocated current year’s loss amounting to € 6,560,000 must be added to the accumulated deficit.
Subsequent events
Carrier to Carrier Telecom N.V. On 1 March 2007, the company announced the sale of its subsidiary Carrier to Carrier Telecom N.V.
(‘Carrier to Carrier’). For this transaction, the buyer has established a new entity, in which the current management of Carrier to Carrier
participates. Carrier to Carrier has been non-core for Blue Fox since several years.
The intention to sell this activity was announced in previous reporting periods. The sale is the result of a long negotiating process and fits
within the framework of the turnaround that was announced during 2006. With the sale of this activity, Blue Fox will realise a book gain
of approximately € 0.8 million. This book gain will be recognised in the results of the first half 2007.
NedGraphics CAD/GIS activities In March 2007, a term sheet was signed by NedGraphics CAD/GIS B.V. to sell its activities to a
buyer, in which current management will participate. The sale of the CAD/GIS activities fits in the strategy to focus on the CAD/CAM
and ERP activities.
58 Other information
To the Supervisory Board and Shareholders of Blue Fox Enterprises N.V.:
Auditor’s report
Report on the financial statements We have audited the accompanying financial statements 2006 of Blue Fox Enterprises N.V.,
Dordrecht. The financial statements consist of the consolidated financial statements and the company financial statements.
The consolidated financial statements comprise the consolidated balance sheet as at 31 December 2006, the profit and loss account,
statement of changes in equity and cash flow statement for the year then ended, and a summary of significant accounting policies and
other explanatory notes. The company financial statements comprise the company balance sheet as at 31 December 2006, the company
profit and loss account for the year then ended and the notes.
Management’s responsibility Management is responsible for the preparation and fair presentation of the financial statements
in accordance with International Financial Reporting Standards as adopted by the European Union and with Part 9 of Book 2 of the
Netherlands Civil Code, and for the preparation of the management board report in accordance with Part 9 of Book 2 of the Netherlands
Civil Code. This responsibility includes: designing, implementing and maintaining internal control relevant to the preparation and fair
presentation of the financial statements that are free from material misstatement, whether due to fraud or error; selecting and applying
appropriate accounting policies; and making accounting estimates that are reasonable in the circumstances.
Auditor’s responsibility Our responsibility is to express an opinion on the financial statements based on our audit. We conducted
our audit in accordance with Dutch law. This law requires that we comply with ethical requirements and plan and perform the audit to
obtain reasonable assurance whether the financial statements are free from material misstatement.
An audit involves performing procedures to obtain audit evidence about the amounts and disclosures in the financial statements.
The procedures selected depend on the auditor’s judgment, including the assessment of the risks of material misstatement of the
financial statements, whether due to fraud or error. In making those risk assessments, the auditor considers internal control relevant
to the entity’s preparation and fair presentation of the financial statements in order to design audit procedures that are appropriate
in the circumstances, but not for the purpose of expressing an opinion on the effectiveness of the entity’s internal control. An audit
also includes evaluating the appropriateness of accounting policies used and the reasonableness of accounting estimates made by
management, as well as evaluating the overall presentation of the financial statements.
We believe that the audit evidence we have obtained is sufficient and appropriate to provide a basis for our audit opinion.
Opinion with respect to the consolidated financial statements In our opinion, the consolidated financial statements give
a true and fair view of the financial position of Blue Fox Enterprises N.V. as at 31 December 2006 and of its result and its cash flow for the
year then ended in accordance with International Financial Reporting Standards as adopted by the European Union and with Part 9 of
Book 2 of the Netherlands Civil Code.
Opinion with respect to the company financial statements In our opinion, the company financial statements give a true
and fair view of the financial position of Blue Fox Enterprises N.V. as at 31 December 2006 and of its result for the year then ended in
accordance with Part 9 of Book 2 of the Netherlands Civil Code.
Emphasis of matter We draw attention to the information on going concern in the note ‘general information’ on page 30 of the
financial statements which indicates that, as of this date, the company has only obtained sufficient funding until June 2007. These
conditions, along with other matters as set forth in the aforementioned note, indicate the existence of a material uncertainty which may
cast significant doubt about the company’s ability to continue as a going concern. Our opinion is not qualified in respect of this matter.
Report on other legal and regulatory requirements Pursuant to the legal requirement under 2:393 sub 5 part e of the
Netherlands Civil Code, we report, to the extent of our competence, that the management board report is consistent with the financial
statements as required by 2:391 sub 4 of the Netherlands Civil Code.
Rotterdam, 4 april 2007
KPMG Accountants N.V.
J. Boer RA
11 Other information
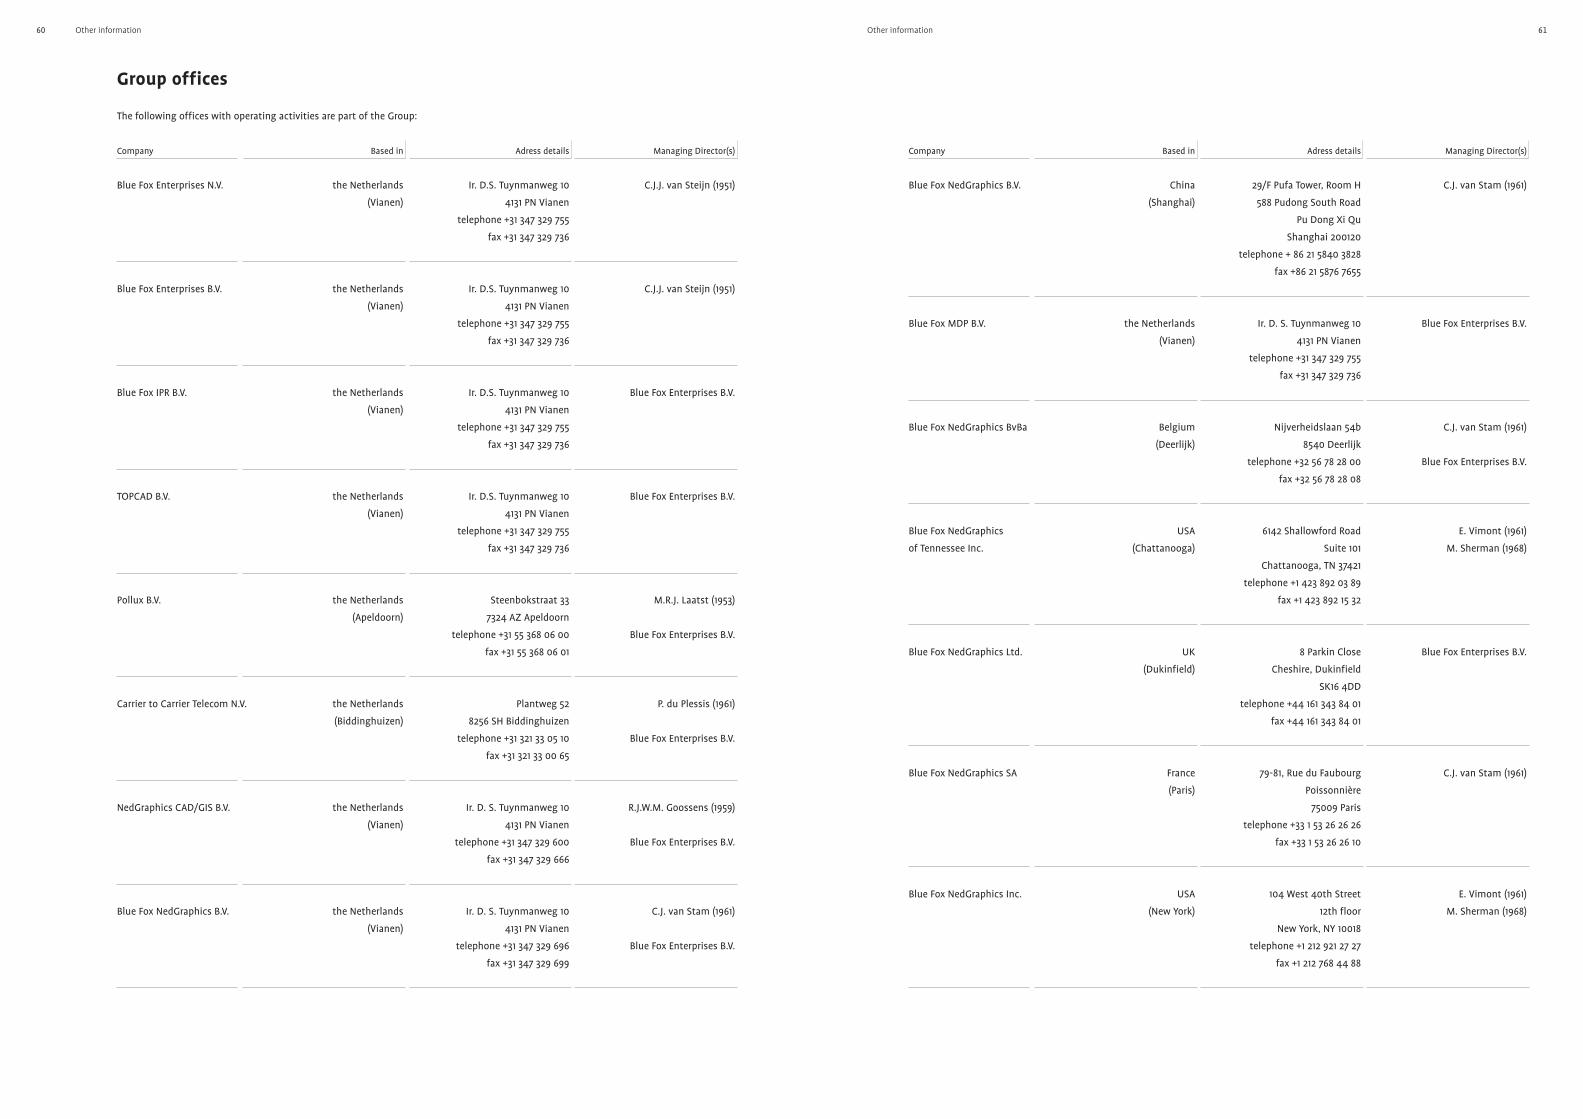
61Other information
Blue Fox NedGraphics B.V. China 29/F Pufa Tower, Room H C.J. van Stam (1961)
(Shanghai) 588 Pudong South Road
Pu Dong Xi Qu
Shanghai 200120
telephone + 86 21 5840 3828
fax +86 21 5876 7655
Blue Fox MDP B.V. the Netherlands Ir. D. S. Tuynmanweg 10 Blue Fox Enterprises B.V.
(Vianen) 4131 PN Vianen
telephone +31 347 329 755
fax +31 347 329 736
Blue Fox NedGraphics BvBa Belgium Nijverheidslaan 54b C.J. van Stam (1961)
(Deerlijk) 8540 Deerlijk
telephone +32 56 78 28 00 Blue Fox Enterprises B.V.
fax +32 56 78 28 08
Blue Fox NedGraphics USA 6142 Shallowford Road E. Vimont (1961)
of Tennessee Inc. (Chattanooga) Suite 101 M. Sherman (1968)
Chattanooga, TN 37421
telephone +1 423 892 03 89
fax +1 423 892 15 32
Blue Fox NedGraphics Ltd. UK 8 Parkin Close Blue Fox Enterprises B.V.
(Dukinfield) Cheshire, Dukinfield
SK16 4DD
telephone +44 161 343 84 01
fax +44 161 343 84 01
Blue Fox NedGraphics SA France 79-81, Rue du Faubourg C.J. van Stam (1961)
(Paris) Poissonnière
75009 Paris
telephone +33 1 53 26 26 26
fax +33 1 53 26 26 10
Blue Fox NedGraphics Inc. USA 104 West 40th Street E. Vimont (1961)
(New York) 12th floor M. Sherman (1968)
New York, NY 10018
telephone +1 212 921 27 27
fax +1 212 768 44 88
60 Other information
Group offices
The following offices with operating activities are part of the Group:
Blue Fox Enterprises N.V. the Netherlands Ir. D.S. Tuynmanweg 10 C.J.J. van Steijn (1951)
(Vianen) 4131 PN Vianen
telephone +31 347 329 755
fax +31 347 329 736
Blue Fox Enterprises B.V. the Netherlands Ir. D.S. Tuynmanweg 10 C.J.J. van Steijn (1951)
(Vianen) 4131 PN Vianen
telephone +31 347 329 755
fax +31 347 329 736
Blue Fox IPR B.V. the Netherlands Ir. D.S. Tuynmanweg 10 Blue Fox Enterprises B.V.
(Vianen) 4131 PN Vianen
telephone +31 347 329 755
fax +31 347 329 736
TOPCAD B.V. the Netherlands Ir. D.S. Tuynmanweg 10 Blue Fox Enterprises B.V.
(Vianen) 4131 PN Vianen
telephone +31 347 329 755
fax +31 347 329 736
Pollux B.V. the Netherlands Steenbokstraat 33 M.R.J. Laatst (1953)
(Apeldoorn) 7324 AZ Apeldoorn
telephone +31 55 368 06 00 Blue Fox Enterprises B.V.
fax +31 55 368 06 01
Carrier to Carrier Telecom N.V. the Netherlands Plantweg 52 P. du Plessis (1961)
(Biddinghuizen) 8256 SH Biddinghuizen
telephone +31 321 33 05 10 Blue Fox Enterprises B.V.
fax +31 321 33 00 65
NedGraphics CAD/GIS B.V. the Netherlands Ir. D. S. Tuynmanweg 10 R.J.W.M. Goossens (1959)
(Vianen) 4131 PN Vianen
telephone +31 347 329 600 Blue Fox Enterprises B.V.
fax +31 347 329 666
Blue Fox NedGraphics B.V. the Netherlands Ir. D. S. Tuynmanweg 10 C.J. van Stam (1961)
(Vianen) 4131 PN Vianen
telephone +31 347 329 696 Blue Fox Enterprises B.V.
fax +31 347 329 699
Company Based in Adress details Managing Director(s) Company Based in Adress details Managing Director(s)

62 Other information
Blue Fox NedGraphics Inc. USA 1801 Cross Beam Drive E. Vimont (1961)
(Charlotte) NC 28217 Charlotte M. Sherman (1968)
telephone +1 704 357 35 80
fax +1 704 357 35 83
Blue Fox Srl Romania Str. Badea Cartan nr. 15 Blue Fox Enterprises B.V.
(Bucharest) Sector 2 020000-024500
Bucharest
telephone +40 21 212 24 17
fax +40 21 212 21 74
Blue Fox Porini Srl Italy Via Trento 7 E. Porini (1934)
(Lomazzo) 22074 Lomazzo CO E. Turconi (1951)
telephone +39 02 96 94 101 R. Sozzi (1961)
fax +39 02 96 77 94 66
Blue Fox Porini Inc. USA 31416 Agoura Road E. Turconi (1951)
(Los Angeles) Suite 150 M. Sherman (1968)
Westlake Village (LA),
CA 91361 Los Angeles
telephone +1 818 887 08 40
fax +1 818 313 79 00
Blue Fox Porini Inc. USA 6142 Shallowford Road E. Turconi (1951)
(Chattanooga) Chattanooga, TN 37421
telephone +1 423 954 30 07
fax +1 423 892 15 32
Blue Fox Porini Inc. USA 104 West 40th Street E. Turconi (1951)
(New York) 12th floor
New York, NY 10018
telephone +1 212 827 79 90
fax +1 212 768 44 88
Blue Fox Porini Ltda Brazil Rua Cacapava 49 L. Garbarino (1929)
(Sao Paulo) Conj. 138-jd.Paulista
01408-010 Sao Paulo/SP
telephone +55 11 3082 82 75
fax +55 11 3088 26 88
Blue Fox Porini Lda Portugal Praceta D. Nuno F.A.M. Perreira (1966)
(Matosinhos) Alvares Pereira,
Nº 20, 4° ES
4450-218 Matosinhos
telephone +351 22 937 15 17
fax +351 22 937 39 63
Company Based in Adress details Managing Director(s)