Enhancing the Security of Corporate Wi-Fi Networks Using DAIR
Upload
truongtuyenCategory
view
220download
0
Blue-Fi: Enhancing Wi-Fi Performance using BluetoothSignals
Ganesh AnanthanarayananUC Berkeley
Berkeley, [email protected]
Ion StoicaUC Berkeley
Berkeley, [email protected]
ABSTRACTMobile devices are increasingly equipped with multiple net-work interfaces with complementary characteristics. In par-ticular, the Wi-Fi interface has high throughput and trans-fer power efficiency, but its idle power consumption is pro-hibitive. In this paper we present, Blue-Fi, a sytem thatpredicts the availability of the Wi-Fi connectivity by usinga combination of bluetooth contact-patterns and cell-towerinformation. This allows the device to intelligently switchthe Wi-Fi interface on only when there is Wi-Fi connectiv-ity available, thus avoiding the long periods in idle state andsignificantly reducing the the number of scans for discovery.
Our prediction results on traces collected from real usersshow an average coverage of 94% and an average accuracyof 84%, a 47% accuracy improvement over pure cell-towerbased prediction, and a 57% coverage improvement over thepure bluetooth based prediction. For our workload, Blue-Fiis up to 62% more energy efficient, which results in increasingour mobile device’s lifetime by more than a day.
Categories and Subject DescriptorsC.2.1 [COMPUTER-COMMUNICATION NETWORKS]: [Network Architecture and Design]
General TermsDesign, Algorithms, Measurement, Performance
KeywordsBluetooth, Wi-Fi, location, context-awareness, energy-efficiency,mobile device
1. INTRODUCTIONToday’s mobile devices, such as smartphones, are increas-
ingly equipped with multiple network interfaces, includingWi-Fi, bluetooth, and, of course, cellular interfaces. Theseinterfaces have widely different, often complementary, char-acteristics in terms of throughput, range, and power [12, 21,
Permission to make digital or hard copies of all or part of this work forpersonal or classroom use is granted without fee provided that copies arenot made or distributed for profit or commercial advantage and that copiesbear this notice and the full citation on the first page. To copy otherwise, torepublish, to post on servers or to redistribute to lists, requires prior specificpermission and/or a fee.MobiSys’09, June 22–25, 2009, Kraków, Poland.Copyright 2009 ACM 978-1-60558-566-6/09/06 ...$5.00.
T’put Transfer Idle Scan Range(J/MB) (W) (W) (m)
Cellular few 100kbps
100 0* 0* 500
Wi-Fi 11-54Mbps
5 0.77 1.29 100
Bluetooth 700 kbps 0.1 0.01 0.12 10( * - The cellular interface is typically always on.)
Table 1: Various interface characteristics
22] (see Table 1). Ideally, one would like to intelligentlyleverage the strengths of these interfaces to optimize the ap-plication performance and minimize the power consumption.
Among the typical network interfaces found in today’s mo-bile devices, Wi-Fi provides arguably the best combinationof throughout, range, and power efficiency for data trans-fers. On the downside, Wi-Fi is the least power efficient inidle state and incurs a high overhead when scanning for newnetworks (e.g., anecdotes with iPhone [2, 4]). Thus, ideally,one should use Wi-Fi whenever it is available, switch it offwhen it is not, and avoid scanning whenever possible. Thisis particularly useful for applications that use the networkperiodically like Microsoft Pocket Outlook [5]. It is easy tosee that implementing such a strategy requires one to effi-ciently detect the Wi-Fi availability without switching it on.
In this paper, we address this challenge by presentingBlue-Fi, a simple scheme that predicts the availability ofWi-Fi by using bluetooth contact-patterns and cell-tower in-formation. The main observation behind our scheme is thatusers tend to repeatedly encounter the same set of bluetoothdevices and cell-towers. Examples of such scenarios includea bluetooth mouse or spouse’s mobile device while at home,colleagues’ devices or printer at work, shop-owner’s mobiledevice at his regular coffee place and even fellow commuters.
Most previous work on context-aware applications has fo-cused on using GPS and cell-tower information. While GPSis highly accurate, it is power hungry (e.g., [24] and [8]),and thus not a good fit for our problem where the focus ison reducing the power consumption. Furthermore, GPS can-not be used indoors, where Wi-Fi connectivity is arguablymost likely to be available. Cell-tower information has beensuccessfully used for inferring contexts [12, 10] but as wedemonstrate in this paper, its inaccuracy reduces its appli-cability to Wi-Fi prediction.
Despite bluetooth’s power efficiency, so far it has beenlargely ignored by the context-aware applications. Thereare several reasons behind this state of affairs. First, blue-
249

tooth has a much lower range compared to other ubiquitousnetwork technologies (see Table 1). Second, the discoveryprocess of bluetooth devices is time-consuming and couldtake as long as 10 seconds [14]. Finally, unlike cell-towersand access points that are stationary, bluetooth devices areprimarily carried by users and hence mobile.
Blue-Fi leverages bluetooth’s low range to its advantageto achieve high prediction accuracy of Wi-Fi network avail-ability. However, the high accuracy comes at a price: cov-erage. The smaller the communication range is, the lesslikely for Blue-Fi to find a nearby bluetooth device. Toincrease the prediction coverage, Blue-Fi complements blue-tooth with cell-tower information. To alleviate bluetooth’shigh discovery time, Blue-Fi implements periodic discoveryand uses the latest discovered list of bluetooth devices. Fi-nally, despite the fact that many bluetooth devices are mo-bile, our results indicate that there is enough repeatability incontact-patterns of bluetooth devices that can be leveragedto provide accurate context information, especially indoors.
In its basic form, Blue-Fi requires no distributed infras-tructure, or running complex distributed protocols. Eachmobile device periodically logs locally the bluetooth devices,cell-towers, and Wi-Fi access points in its proximity, andlater uses this information to predict Wi-Fi connectivity. Tospeed up the learning process, we also propose variants ofBlue-Fi which employ peer-to-peer protocols or centralizedweb services to share the logs.
We make the following contributions. First, we advocatethe use of bluetooth contact patterns for context inference,effectively providing a low-powered location system. In do-ing so, we address the limitations of the bluetooth deviceswith respect to low range, high discovery time and mobil-ity. Second, we leverage the complementary properties ofbluetooth and cell-tower to improve the prediction of Wi-Fiavailability. By combining bluetooth and cell tower basedpredictions we obtain an average coverage of 94% and anaverage accuracy of 84%, a 47% improvement in accuracyover the pure cell-tower based prediction and a 57% improve-ment in coverage over the pure bluetooth based predictionscheme. This translates to an energy efficiency of up to 62%and increase in our mobile device’s lifetime by more than aday. Finally, we analyze the benefits of collaborative predic-tion including security and privacy concerns.
The rest of the paper is organized as follows. Section 2describes the system’s functioning including the predictionschemes. Section 3 deals with the problem of bluetooth dis-covery. Algorithms to infer special bluetooth devices - land-mark devices and mobile accessories - are presented in Sec-tion 4. Collaborative prediction, along with the security andprivacy implications, is addressed in Section 5. Evaluationof the different aspects of the system is done in Section 6.We present improvements to Blue-Fi - identifying browser-authenticated Wi-Fi networks, and multihop bluetooth dis-covery - in Section 7. We discuss an indoor monitoring sys-tem, and enhanced prediction models in Section 8. Section 9presents related work and contrasts it with Blue-Fi, and weconclude in Section 10.
2. PREDICTING WI-FI AVAILABILITYIn a nutshell, Blue-Fi predicts the Wi-Fi network avail-
ability by leveraging existing cell-towers and bluetooth de-vices. Each mobile device periodically logs all the networksignals in a log L, locally. The log entries are of the form
(Timestamp, {Bluetooth devices}, {Cell Towers}, {Wi-Finetworks}). Bluetooth devices are identified by their MACaddresses, cell-towers are identified by the tower identifierand Wi-Fi access points by their SSID/BSSID. The mobiledevice then uses its log to predict Wi-Fi connectivity.
The key question we need to address is: how accuratelycan a bluetooth device or a cell-tower predict the Wi-Fi avail-ability? We first discuss the reliability of bluetooth predic-tion. If all bluetooth devices were fixed, predicting Wi-Fiavailability would be easy. Given a bluetooth device b, justcheck whether there is a log entry containing b and a Wi-Fiaccess point: if yes, then we predict the Wi-Fi availability.Unfortunately, in practice many bluetooth devices are mo-bile (e.g., phones, notebooks), so they cannot straightawaybe used to predict fixed Wi-Fi access points.
To account for the mobile bluetooth devices we considerthe correlation between the observations of the bluetoothdevices and Wi-Fi access points. Intuitively, we considera bluetooth device b to be a reliable predictor for Wi-Ficonnectivity, if most of the log entries in which b appearscontain at least a Wi-Fi access point.
L Log of all network signals over timeτ Threshold for a bluetooth device or
cell-tower to be a reliable predictorpredictcell Cell-towers that are reliable predictorspredictBT Bluetooth devices that are reliable predictors
SBT Set of all bluetooth devices in the logWc Connectable Wi-Fi networks
EDT Threshold of euclidean distance belowwhich a user is considered stationary
Table 2: List of notations.
More precisely, let SBT be the set of bluetooth devices inlog L and Wc be the set of Wi-Fi networks which providesconnectivity to the device (we describe mechanisms to ob-tain Wc in Section 7.1). For each Bluetooth device, BTi εSBT , we compute the predictability of BTi as n(L, BTi, Wc)/n(L, BTi), where n(L, BTi, Wc) is the number of entries inL when BTi was present and at least one of the networksin Wc was present, and n(L, BTi) is the number of entriesin L when BTi was present. Predictability is a confidencemeasure of how much a device’s presence indicates Wi-Ficonnectivity. If predictability is greater than a threshold τ ,we add BTi to predictBT . In Section 2.2, we present a simplealgorithm to set this threshold.
While a single bluetooth discovery or Wi-Fi scan can po-tentially miss some bluetooth devices or access points respec-tively, we believe the errors due such misses are minimizedor negligible when predictBT is calculated over a sufficientlylarge set of log entries over time.
The algorithm to obtain predictcell is exactly the sameas the algorithm described above, with bluetooth devicesreplaced by cell-towers. predictcell contains the list of cell-towers at places where the device has Wi-Fi connectivity.
2.1 Prediction SchemesIn this section, we describe the Wi-Fi prediction schemes
based on bluetooth and cell-tower signals. The Wi-Fi pre-diction schemes predict Wi-Fi availability using predictBT
and predictcell. We evaluate the prediction schemes on twometrics:
250

Figure 1: Hybrid Prediction Scheme
• Coverage: The fraction of existing Wi-Fi access pointsthat are predicted.
• Accuracy: The fraction of the Wi-Fi predictions thatare correct.
Bluetooth based Prediction: We predict that Wi-Fiis available if any of the bluetooth devices in predictBT iscurrently nearby. If none of the nearby devices are presentin predictBT , but there are some present in SBT , then wepredict that there is no Wi-Fi connectivity. If none of thenearby bluetooth devices have been seen before, the predic-tion scheme offers no prediction (we treat this as absence ofWi-Fi connectivity). Bluetooth based prediction is expectedto exhibit high accuracy but low coverage as the range ofbluetooth devices is much smaller than Wi-Fi (see Table 1).For example, a mobile device within Wi-Fi coverage mayfail to predict Wi-Fi availability, if the bluetooth devices inpredictBT are too far to be detected.
Cell-tower based Prediction: Cell-tower based predic-tion is based on the presence of currently visible cell-towersin predictcell. As discussed in Section 1, the ranges of cel-lular signals is much higher than Wi-Fi networks resultingin coarse-grained predictions. As a result, cell-tower basedprediction achieves high coverage but less accuracy.
Hybrid Prediction: This scheme uses a combination ofbluetooth and cell-tower based predictions. More precisely,it uses bluetooth prediction first, and falls back to cell-towerbased prediction when the former fails to predict. This way,hybrid prediction achieves both of best worlds by combiningthe accuracy of bluetooth prediction with the coverage ofthe cell-tower prediction. Figure 1 shows the flow diagramof the hybrid prediction scheme. The scheme starts with dis-covering the bluetooth devices that are currently nearby andchecks whether any of them is present in either predictBT
or SBT . If yes, it uses bluetooth prediction. Otherwise, itresorts to cell-tower based prediction.
In the rest of the paper, we assume that if Blue-Fi doesnot make any prediction, then there is no Wi-Fi connectivity,i.e., “No Prediction” is equivalent to “No Wi-Fi Connectiv-ity” (see Figure 1).
2.2 Prediction Reliability Threshold (τ)In this section, we describe an algorithm to select the
appropriate prediction reliability threshold, τ , to populate
Figure 2: Predict-Signal Matrix
predictcell and predictBT . High values of τ increase accu-racy in prediction but lower coverage. On the other hand,low values of τ result in inaccurate prediction.
We determine the appropriate value of τ using a predict-signal matrix (see Figure 2). The matrix models the caseswhen our scheme predicts the availability or lack of Wi-Ficonnectivity versus reality. The variables s and s̄ indicatethe presence and absence of Wi-Fi availability respectively,and p and p̄ indicate cases when Blue-Fi predicts the avail-ability of Wi-Fi. Cases 2 and 3 correspond to failures sce-narious. In case 2, Blue-Fi predicts the absence of Wi-Ficonnectivity even when it is present resulting in the deviceusing the power-inefficient cellular interface. In case 3, themobile device wastes power probing for Wi-Fi networks.
For a data transfer of size F , the expected wastage inenergy is Ewaste = p3 ∗ Ep + p2 ∗ (F ∗ ec −(Ep + F ∗ ew)) where p2 and p3 are the probabilitiesof cases 2 and 3, Ep is the energy consumed in probing forWi-Fi networks, and ec and ew are the energy consumedper data unit for transferring data using the cellular andWi-Fi interfaces respectively. Ep, ec and ew are constants.Automatically measuring and calibrating the values of Ep,ec and ew is orthogonal to Blue-Fi’s objectives and has beenaddressed in prior work [17].
For a given transfer size F , the energy wastage Ewaste isa function of p2 and p3 only. Next, we show that p2 and p3
can be expressed as functions of τ alone. Note that with thenotations in the predict-signal matrix, Accuracy is P (s | p)and Coverage is P (p | s).
p2 = Pr(s | p̄)= Pr(p̄ | s) (Pr(s)/Pr(p̄))= (1 − Pr(p | s)) (Pr(s)/(1 − Pr(p)))= (1 − Pr(s | p) ∗ Pr(p)/Pr(s)) (Pr(s)/(1 − Pr(p)))= (1 − Accuracy ∗ Pr(p)/Pr(s)) (Pr(s)/(1 − Pr(p)))= (Pr(s) − Accuracy ∗ Pr(p))/(1 − Pr(p))
p3 = Pr(s̄ | p)= 1 − Pr(s | p)= 1 − Accuracy
Pr(s) is the percentage of times when Wi-Fi networksfrom Wc was present in the log L and is a constant (notdependent on τ ). Accuracy and Pr(p) - the percentage oftimes when we found at least one bluetooth device from theset predictBT or one cell-tower from the set predictcell - aredependent only on τ . Therefore p2 and p3 are essentiallyfunctions of only τ . Note that p2 and p3 can also be ex-pressed as functions of coverage instead of accuracy.
Hence, for a given transfer size, Blue-Fi finds the value ofτ that minimizes Ewaste.
251
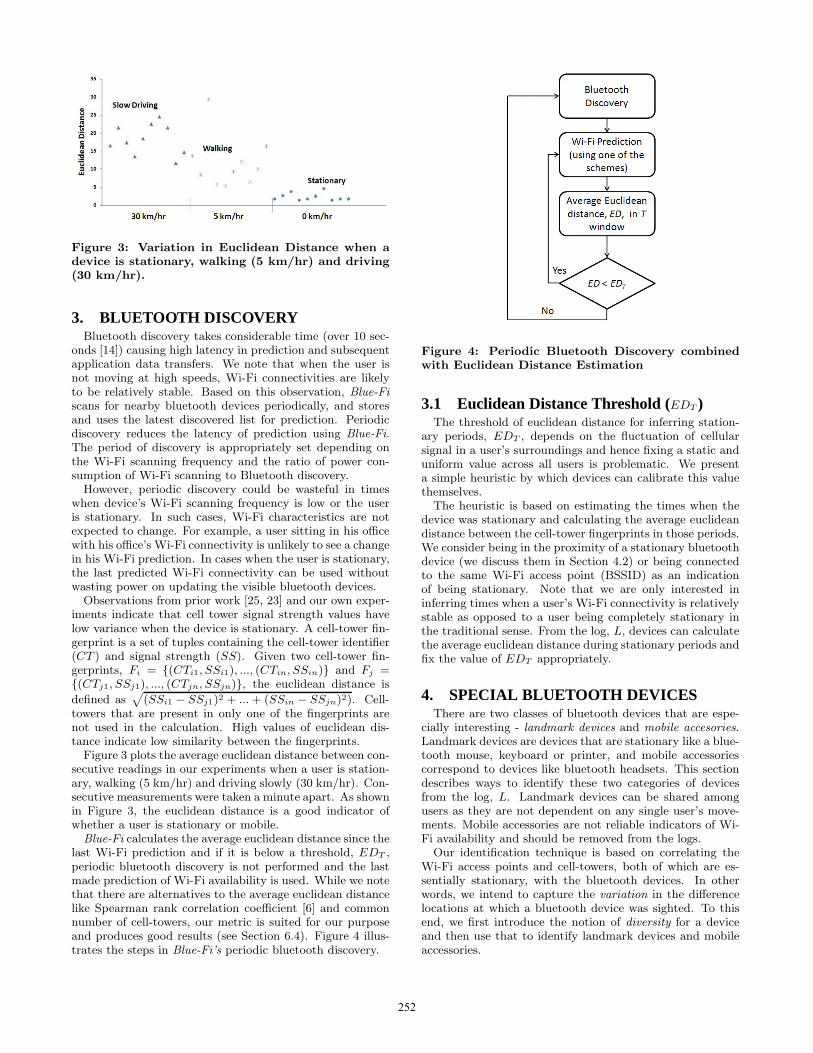
Figure 3: Variation in Euclidean Distance when adevice is stationary, walking (5 km/hr) and driving(30 km/hr).
3. BLUETOOTH DISCOVERYBluetooth discovery takes considerable time (over 10 sec-
onds [14]) causing high latency in prediction and subsequentapplication data transfers. We note that when the user isnot moving at high speeds, Wi-Fi connectivities are likelyto be relatively stable. Based on this observation, Blue-Fiscans for nearby bluetooth devices periodically, and storesand uses the latest discovered list for prediction. Periodicdiscovery reduces the latency of prediction using Blue-Fi.The period of discovery is appropriately set depending onthe Wi-Fi scanning frequency and the ratio of power con-sumption of Wi-Fi scanning to Bluetooth discovery.
However, periodic discovery could be wasteful in timeswhen device’s Wi-Fi scanning frequency is low or the useris stationary. In such cases, Wi-Fi characteristics are notexpected to change. For example, a user sitting in his officewith his office’s Wi-Fi connectivity is unlikely to see a changein his Wi-Fi prediction. In cases when the user is stationary,the last predicted Wi-Fi connectivity can be used withoutwasting power on updating the visible bluetooth devices.
Observations from prior work [25, 23] and our own exper-iments indicate that cell tower signal strength values havelow variance when the device is stationary. A cell-tower fin-gerprint is a set of tuples containing the cell-tower identifier(CT ) and signal strength (SS). Given two cell-tower fin-gerprints, Fi = {(CTi1, SSi1), ..., (CTin, SSin)} and Fj ={(CTj1, SSj1), ..., (CTjn, SSjn)}, the euclidean distance is
defined as√
(SSi1 − SSj1)2 + ... + (SSin − SSjn)2). Cell-towers that are present in only one of the fingerprints arenot used in the calculation. High values of euclidean dis-tance indicate low similarity between the fingerprints.
Figure 3 plots the average euclidean distance between con-secutive readings in our experiments when a user is station-ary, walking (5 km/hr) and driving slowly (30 km/hr). Con-secutive measurements were taken a minute apart. As shownin Figure 3, the euclidean distance is a good indicator ofwhether a user is stationary or mobile.
Blue-Fi calculates the average euclidean distance since thelast Wi-Fi prediction and if it is below a threshold, EDT ,periodic bluetooth discovery is not performed and the lastmade prediction of Wi-Fi availability is used. While we notethat there are alternatives to the average euclidean distancelike Spearman rank correlation coefficient [6] and commonnumber of cell-towers, our metric is suited for our purposeand produces good results (see Section 6.4). Figure 4 illus-trates the steps in Blue-Fi’s periodic bluetooth discovery.
Figure 4: Periodic Bluetooth Discovery combinedwith Euclidean Distance Estimation
3.1 Euclidean Distance Threshold (EDT )The threshold of euclidean distance for inferring station-
ary periods, EDT , depends on the fluctuation of cellularsignal in a user’s surroundings and hence fixing a static anduniform value across all users is problematic. We presenta simple heuristic by which devices can calibrate this valuethemselves.
The heuristic is based on estimating the times when thedevice was stationary and calculating the average euclideandistance between the cell-tower fingerprints in those periods.We consider being in the proximity of a stationary bluetoothdevice (we discuss them in Section 4.2) or being connectedto the same Wi-Fi access point (BSSID) as an indicationof being stationary. Note that we are only interested ininferring times when a user’s Wi-Fi connectivity is relativelystable as opposed to a user being completely stationary inthe traditional sense. From the log, L, devices can calculatethe average euclidean distance during stationary periods andfix the value of EDT appropriately.
4. SPECIAL BLUETOOTH DEVICESThere are two classes of bluetooth devices that are espe-
cially interesting - landmark devices and mobile accesories.Landmark devices are devices that are stationary like a blue-tooth mouse, keyboard or printer, and mobile accessoriescorrespond to devices like bluetooth headsets. This sectiondescribes ways to identify these two categories of devicesfrom the log, L. Landmark devices can be shared amongusers as they are not dependent on any single user’s move-ments. Mobile accessories are not reliable indicators of Wi-Fi availability and should be removed from the logs.
Our identification technique is based on correlating theWi-Fi access points and cell-towers, both of which are es-sentially stationary, with the bluetooth devices. In otherwords, we intend to capture the variation in the differencelocations at which a bluetooth device was sighted. To thisend, we first introduce the notion of diversity for a deviceand then use that to identify landmark devices and mobileaccessories.
252

4.1 DiversityDiversity captures the variance among the list of loca-
tions a device is sighted. For every bluetooth device in SBT ,we extract the list of Wi-Fi and cell-tower signatures thatwere co-sighted along with it. A Wi-Fi signature is a list ofBSSIDs, and a cell signature is a list of cell-tower identifiers.Note that the list of signatures can contain repetitions. Weuse the list of signatures as an indicator of the locations thebluetooth device was present.
We define similarity between two signatures A and B as|(A ∩ B)| / |(A ∪ B)|. Clearly, the higher the number ofintersecting wireless access points or cell-towers, the greaterthe value of similarity.
We use similarity to now calculate diversity for a list ofsignatures. Let W = {Ws} be the list of Wi-Fi signaturesfor a bluetooth device. We identify the median of W us-ing K-Medians clustering [18]. K-Medians is suited for ourpurpose as it can perform clustering even when the “points”to be clustered are not in Euclidean space, as in our casewhere we have to cluster signatures. K-Medians clusteringexhaustively evaluates the suitability of each Ws in W tobe the median and picks the best. Table 3 describes thealgorithm to pick the median and calculate the �diversity ofa given list of signatures. The presence of repetitions in thesignature list, W , ensures that the signatures are automati-cally weighted during the calculation of diversity. Diversityis calculated for every device and varies between 0 and 1.Diversity for a list of cell-tower signatures is exactly similarwith Wi-Fi BSSIDs replaced by cell-tower identifiers.
Input: List of signatures, W = {Ws}Output: Median, Wm and Diversity, D
Variables:Aggregate Similarity, agg simHighest Similarity, best sim ← 0Current Median, Wmc
Algorithm:for each Wsi in W
Wmc ←Wsi
agg sim ← 0for each Wsj in W
agg sim += Similarity(Wsi, Wsj)end forif(agg sim > best sim)
best sim← agg simWm ←Wmc
end for
for each Ws in WD += Similarity(Ws, Wm)
end for
D ← D/|W |
return (D and Wm)
float Similarity (Signature W1, Signature W2)float similarity = |(W1 ∩W2)| / |(W1 ∪W2)|return similarity
Table 3: Diversity of a signature list
4.2 Landmark DevicesIntuitively, a landmark device is one that a user discovers
only at one location (e.g., home) and always discovers thatdevice when he is at that location. Precisely, a device BTis classified as landmark if it satisfies two properties: (1) Itsdiversity is sufficiently low, and (2) Whenever a signaturethat is similar to its median, Wm, occurs in the log, BTshould also be present. Property (1) ensures that BT is seenonly at one location. Property (2) ensures that whenever theuser is at that location, BT is seen.
4.3 Mobile AccessoriesMobile accessories are not reliable indicators of Wi-Fi
availability and should be removed from the logs. We treatdevices that occur in a high fraction of the log entries tobe mobile personal accessories and unreliable indicators ofa user’s location.
5. COLLABORATIVE PREDICTIONThis section explores the scenarios, benefits and issues
if devices were to collaborate and share information aboutWi-Fi availability. An example scenario when such sharingis beneficial is when a user goes to a new place with no priorcontext (improve coverage). Sharing essentially speeds-upthe learning process. We present two sharing approaches −peer-to-peer and global − and also discuss their security andprivacy implications.
5.1 Peer-to-peer SharingDevices query each other over bluetooth for the availabil-
ity for Wi-Fi networks. Any device that is currently usingthe Wi-Fi network can respond with details including thebandwidth and authentication mechanisms. In fact, userscan exchange more useful information like “I performed a 1MB download 30 seconds back and got a 10 Mbps through-put”. Such sharing can be used for collaborative selection ofaccess points. Hence, presence of at least one bluetooth de-vice can potentially result in a device knowing about Wi-Ficonnectivity.
We can extend the hybrid prediction scheme to includepeer-to-peer querying wherein the device queries its neigh-bors when bluetooth prediction is inconclusive and beforeresorting to cell-tower based prediction.
5.2 Global SharingThe alternative to peer-to-peer sharing is global sharing
facilitated through a central service. Devices, when usingthe Wi-Fi network, periodically upload entries − (Times-tamp, {Bluetooth devices}, {Cell Towers}, {Wi-Fi network,{Characteristics}}) − to a centralized server. Characteris-tics specify if a network requires authentication along withperformance parameters like throughput and latency. Whileinformation about security of a network (e.g., WEP encryp-tion) is specified for all Wi-Fi beacons, performance param-eters are provided only for the associated network. Serversindex these entries by bluetooth devices and cell-tower iden-tifiers for efficient retrieval.
Any device that wants to know about its current Wi-Fiavailability can query the central server by supplying the listof currently visible bluetooth devices and cell-towers. Theserver responds by matching the bluetooth devices and cell-towers in its database and returns the Wi-Fi networks alongwith their characteristics. Communication with the server
253

happens over the cellular interface (data channel or simpleroptions like SMS). The details of matching application needswith the best suited Wi-Fi network are beyond the scope ofthis paper.
Matching cell-towers need not involve the timestamp fieldin the entries in the server because they are stationary. Blue-tooth devices are mostly dynamic and should be matchedonly if the time of uploading of the log entry and time ofquerying is within a bounded interval. Note that the servercan process the logs and obtain the set of landmark devicesas described in Section 4. Matches with landmark devicesneed not consider the timestamp.
The ability to leverage landmark devices makes the globalsharing option potentially more useful than peer-to-peer shar-ing; landmark devices are not expected to do peer-to-peercommunication. But on the other hand, peer-to-peer shar-ing does not need any infrastructure support and hence ismore readily deployable.
5.3 Privacy and SecurityIn this section, we discuss the security and privacy con-
cerns related to global and peer-to-peer sharing. A trustedservice model, like the emerging location-based services [1],alleviates these concerns for the case of global sharing. Next,we discuss the security and privacy issues in peer-to-peersharing, and compare it with the global sharing model.
1. Intrusion: Peer-to-peer collaboration requires devicestalking to other devices around them, and users mightbe wary of such communication as it might potentiallylead to intrusions. Without any prior knowledge, thereis no feasible filter that users can apply. Global sharingrequires the device to just talk to a trusted server.
2. Usage Pattern: If devices were to exchange detailsabout their network activity (size of download, time ofdownload), a malicious person can continually querya device in the guise of knowing the Wi-Fi connec-tivity characteristics, and end up obtaining the exactaccess patterns of the device. This can be correlated tomake decisions about a user’s activity like streaming,browsing etc. potentially leading to annoying and tar-geted advertisements. With global sharing, the centralserver is expected to hide the identity of the users whouploaded the data.
3. Industrial Espionage: Assume a scenario where cof-fee shop A has Wi-Fi connectivity for its customers. Acompetitor, B, is looking to set up its store near A’sand expects the same customers to visit B too. NowB can have a person with a device sitting in A’s shop,querying all the users visiting A continuously and ag-gregating information about their Wi-Fi usages. B canuse this information to appropriately provision its net-work, thereby obtaining information that A would nothave provided otherwise. The central server in globalsharing will provide only representative information inresponse to queries.
While it is true that Wi-Fi frames themselves can bepassively scanned to get the required information, peer-to-peer sharing provides yet another way for this in-formation to be leaked.
6. EVALUATIONWe collected logs from twelve volunteers for a period of
two weeks each. In this section, we use the logs to evaluateour prediction schemes for accuracy and coverage, appro-priate threshold selection, effects of periodic discovery andenergy efficiency for our workload. We also evaluate ouralgorithms for identifying landmark devices and mobile ac-cesories. Finally we quantify the benefits of collaborativeprediction. We briefly summarize our results here.
1. Hybrid prediction scheme produces high coverage (93.5%) and accuracy (84.2%), a 47% improvement in ac-curacy over the pure cell-tower based prediction anda 57% improvement in coverage over pure bluetoothbased prediction scheme.
2. Periodic discovery results in negligible reduction in ac-curacy and coverage.
3. Energy consumption reduces by up to 62% for ourworkload using Blue-Fi’s prediction techniques.
4. Collaborative prediction through sharing improves thecoverage by up to 36.2%.
6.1 Log CollectionTwelve volunteers were given i-mate PDAs programmed
to log the Wi-Fi, bluetooth and cell-tower signals as men-tioned in Section 2, every minute. The i-mate runs Win-dows Mobile 5.0 and is equipped with a Class-2 bluetoothinterface. We performed Wi-Fi scanning using a librarythat was built using the Windows Driver Development Kit.Bluetooth scanning happened using the open-source library,InTheHand [3]. GSM tower information was obtained byreading a well-known memory location that has been ob-tained by the community via reverse-engineering [19]. Thevolunteers were a mix of graduate students in Berkeley aswell as working professionals in San Francisco Bay Area.Volunteers carried the PDA along for two weeks in their nor-mal routine. No instance of the PDA’s battery dischargingor any such incident that stopped the logging was reported.
Table 4 lists the details about the log. There are twonoteworthy features from the logs:
1. The fraction of times when there was Wi-Fi connectiv-ity from the preferred networks varies from 32.1% to68%, indicating it is not ubiquitous and hence the needfor a mechanism for predicting Wi-Fi availability.
2. The number of bluetooth devices and the fraction oftimes they are visible (49.6% to 77.2%) are encourag-ing to base a prediction scheme on them.
One half of the data was used for training and the otherhalf for testing.
6.2 Coverage and AccuracyWe measure the accuracy and coverage of using blue-
tooth and cell-tower data individually for prediction, high-light their complementary properties and demonstrate thebenefits of using them in conjunction in the hybrid scheme.
Bluetooth based Prediction: Figures 5 and 6 show theaccuracy and coverage (in %) for bluetooth-based predictionfor the different users, for varying values of the predictionreliability threshold, τ . We observe that accuracy is directly
254

User Duration (weeks) Cell-Towers* Wi-Fi SSIDs* Bluetooth Devices*Preferred All
U1 2 121 (99%) 48.1% 490 (76.1%) 159 (50.1%)U2 2 337 (99%) 56% 1156 (84.5%) 194 (71%)U3 2 191 (98%) 32.1% 731 (68.1%) 181 (51.2%)U4 2 287 (99%) 36% 846 (54.3%) 133 (66.4%)U5 2 101 (99%) 68% 744 (81.2%) 99 (77.2%)U6 2 202 (98%) 44.3% 553 (65.2%) 152 (49.6%)U7 2 221 (99%) 55.8% 701 (77.4%) 201 (55.1%)U8 2 188 (99%) 67.3% 553 (86.1%) 199 (51.8%)U9 2 241 (98%) 58% 552 (71.1%) 288 (59.3%)U10 2 302 (100%) 60.3% 774 (80.8%) 222 (63.7%)U11 2 254 (99%) 53.2% 691 (63.7%) 241 (66.4%)U12 2 198 (98%) 54.1% 801 (70.2%) 201 (62.2%)( * − Fraction of times when at least one signal was observed on that interface)
Table 4: Details of logs collected by users
Figure 5: Accuracy of Bluetooth-based Prediction
proportional to τ while coverage is inversely proportionalwith τ . Due to the limited range of bluetooth, the averageaccuracy of the prediction is high (87.25%), but the aver-age coverage is low (61%). High accuracy but low coverageleads to erroneous conclusions of lack of Wi-Fi availabilityeven in their presence. U4 and U5 have coverage of near80% indicating that if a user visits very few places routinely,bluetooth-based prediction can provide good coverage.
Cell-Tower based Prediction: Cell-tower based pre-diction has complementary properties to bluetooth basedprediction. We see high average coverage of 93.5% but anaverage accuracy of only 59.66% (Figures 7 and 8). Notethat U5 has a high accuracy of close to 80%. If a user’smovements in a given area (when in range of a cell-tower)is limited, then cell-tower based prediction can be sufficient.Again, accuracy is directly proportional to τ while coverageis inversely proportional with τ . High coverage and low ac-curacy lead to wastage of energy in unnecessary scanningfor Wi-Fi networks when there are none.
Hybrid Prediction: The Hybrid Scheme combines theadvantage of both the earlier schemes and shows coverageof 93.5% and an accuracy of 84.2% for τ = 0.8. Figure 9plots the accuracy and coverage of the hybrid predictionscheme. This is a 47% improvement in accuracy over thepure cell-tower based prediction and a 57% improvement incoverage over pure bluetooth based prediction scheme. Webelieve this to be an encouraging validation for the usage
Figure 6: Coverage of Bluetooth-based Prediction
Figure 7: Accuracy of Cell-Tower based Prediction
of bluetooth contact-patterns and cell-tower information intandem for inferring contexts.
6.3 Prediction Reliability Threshold (τ)Picking the right threshold for a given file transfer influ-
ences the expected energy loss due to erroneous predictions.We measured how the energy loss, Ewaste, varies with theprediction reliability threshold, τ , for different transfer sizes.We used the values of ec = 100 J/MB, ew = 5 J/MB and Ep
= 5 J [12]. Figure 10 plots the results for U3. The optimalthreshold for the 100 KB transfer is 0.6 while it is 0.7 forhigher file transfers. Smaller transfer sizes are more sensi-
255

Figure 8: Coverage of Cell-Tower based Prediction
Figure 9: Hybrid Scheme combines the Accuracyand Coverage of Bluetooth and Cellular Contexts
tive to τ . Note the sharp variation in the value of Ewaste oneither side of τ = 0.6 for the 100 KB download. We see aplateau after the value of τ exceeds 0.7 for transfer sizes of1 MB and 10 MB.
Across other users, we note that the optimal value of τvaries between 0.5 and 0.7 for the 100 KB download, andbetween 0.7 and 0.8 for the 1 Mb and 10 MB transfer. In-terestingly, for users U2 and U8, the optimal value of τ is0.7 for all download sizes.
6.4 Periodic DiscoveryRecall that Blue-Fi deals with bluetooth’s high discov-
ery time by periodic discovery and using the latest discov-ered list. It uses euclidean distance between cell tower fin-gerprints to avoid bluetooth scans if a device is stationary.Threshold for variation in euclidean distance, EDT , was cal-culated from the readings in L when the user was continu-ously in the presence of the same Wi-Fi BSSID providedby one of his preferred networks, and landmark devices (wefixed a minimum of five readings). Table 5 lists the EDT
values calibrated by the different devices using Wp BSSIDsand landmark devices. True to intuition, we observe thatEDT values obtained using landmark bluetooth devices issmaller than those obtained using Wi-Fi BSSIDs as refer-ence, as the range of bluetooth signals is significantly lowerthan Wi-Fi networks. Also, the diversity in values of EDT
across different users indicates that individual devices cali-brating themselves is better than fixing a uniform value.
We evaluate change in accuracy and coverage of bluetoothbased prediction when periodic discovery is performed forperiods of 10 minutes, 15 minutes and 30 minutes. We seenegligible reduction in accuracy and coverage because of us-ing the last discovered list compared to on-demand discov-ery.(see Figures 11 and 12).
Figure 10: Expected Energy Wastage per KB fordifferent file transfers
User Preferred Networks Landmark DevicesU1 4.1 1.2U2 5.6 1.6U3 2.5 2.2U4 6.7 1.1U5 6.6 1.9U6 3.2 0.9U7 2.1 2.2U8 4.4 1.8U9 3.1 2.7U10 4.9 1.2U11 4.1 2.2U12 2.2 2.4
Table 5: Calibrated value of threshold for EuclideanDistance, EDT , using BSSIDs of preferred Wi-Finetworks (Wp) and landmark bluetooth devices
6.5 Energy ConsumptionWe evaluated the energy consumption of our schemes and
compared it to other schemes using a workload that modelscommonly used background applications like email synchro-nizers and RSS feed readers. Background applications use a“pull” model by periodically polling the server for new dataand synchronizing the copy on the mobile device with theserver. Our workload consists of periodic synchronizationactivities of 100 to 200 KB. Using the full battery capacityof the phone, we measure the number of such synchroniza-tions performed before the phone runs out of power (totalcapacity of 16200 J).
We compare our hybrid prediction scheme with two com-monly used modes of network usage in practice: (a) use thecellular interface always (Ecellular), and (b) scan and checkfor Wi-Fi availability always − use Wi-Fi if available, cellu-lar connectivity otherwise (EWi−F i).
For our twelve users, we report encouraging improvementsof 19-62% compared to Ecellular and 20-40% compared toEWi−F i. In addition, we make the following observations:
• Preferred Networks: The overall fraction of timeswhen a user has Wi-Fi connectivity also affects thegains compared to Ecellular and EWi−F i. The overallcoverage of Wi-Fi networks vary from 32.1% to 68% ofthe time for our twelve users. Figure 14 plots the gains
256

Figure 11: Reduction in Accuracy because of peri-odic Bluetooth discovery
Figure 12: Reduction in Coverage because of peri-odic Bluetooth discovery
compared to Ecellular and EWi−F i. When the fractionof Wi-Fi coverage is low, the device ends up using thecellular interface most times and hence the gains com-pared to Ecellular are limited. Low fraction of Wi-Ficoverage potentially leads to many wasteful scans andhence the utility of prediction is high (compared toEWi−F i). For a high fraction of Wi-Fi coverage, theprobability of a scan finding Wi-Fi connectivity is highand hence the value of prediction is limited.
• Download Size: The performance of Wi-Fi predic-tion schemes vary depending on the amount of datadownloaded in every round. Figure 13 plots the gainfor varying data sizes. The gains compared to Ecellular
reduces for small downloads. For small downloads,the energy difference between using the cellular inter-face and Wi-Fi (when available) is limited. The gainscompared to EWi−F i on the other hand, decreases forlarge downloads. Large downloads amortize the energywastage due to incorrect Wi-Fi scanning (i.e., scanningwhen there is no Wi-Fi connectivity) and the advan-tage of using prediction schemes is limited.
• Lifetime: The percentage increase in the device’s bat-tery lifetime is the same as the percentage increase inthe number of synchronizations; the actual increase inlifetime is a function of the synchronization frequency.For downloads of 100 KB, and synchronization fre-quencies of 1 minute and 5 minutes, we see that thelifetime of the device compared to Ecellular increasesby 1.05 to 5.23 hours, and 5.25 to 26.15 hours respec-tively for our users. The corresponding numbers com-pared to EWi−F i are 5.51 to 7.78 hours, and 27.5 to38.9 hours. We make the assumption that the mobiledevice is not expending power on any other activity.
Figure 13: Gains compared to Ecellular and EWi−F i
vary with download size for U3
Figure 14: Savings compared to Ecellular and EWi−F i
vary with overall Wi-Fi coverage
6.6 Landmark and Personal DevicesNow we evaluate the clustering techniques for identifying
landmark and personal devices.Landmark Devices: Users were given a bluetooth mouse
to be kept at their house during the log collection process.This is the landmark device we aim to identify. Figure 15plots the diversity of the devices in our log for user U2. Evenif a device is sighted only at the same location, the require-ment that it has to be sighted every time the user is at thatlocation ensures that we correctly identify the landmark de-vices without false positives or false negatives.
Note that the majority of the devices have a very low valueof diversity. This implies that users have a spatial corelationwith the bluetooth devices they encounter − users see mostbluetooth devices only at select locations. We consider thisas a validation of our technique for using bluetooth contact-patterns for providing context.
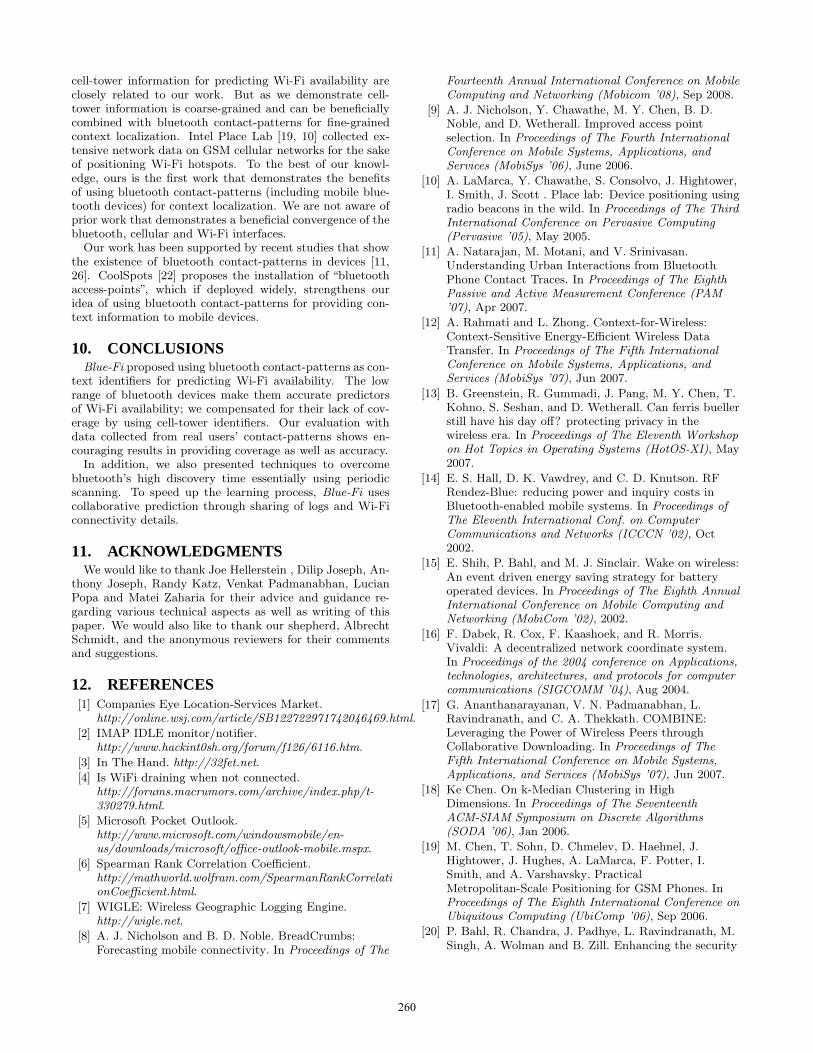
Personal Devices: Along with our i-mate PDA, userscarried a bluetooth headset with them most of the time andalso their personal phones with bluetooth on always. Fig-ure 16 plots the fraction of entries in which a device occursin the log for user U2. The two devices at the top correspondto the user’s phone and bluetooth headset.
6.7 Collaborative PredictionSharing of Wi-Fi information among devices helps im-
prove the coverage of Blue-Fi. In our logs, we calculatedthe fraction of times when at least one bluetooth device
257
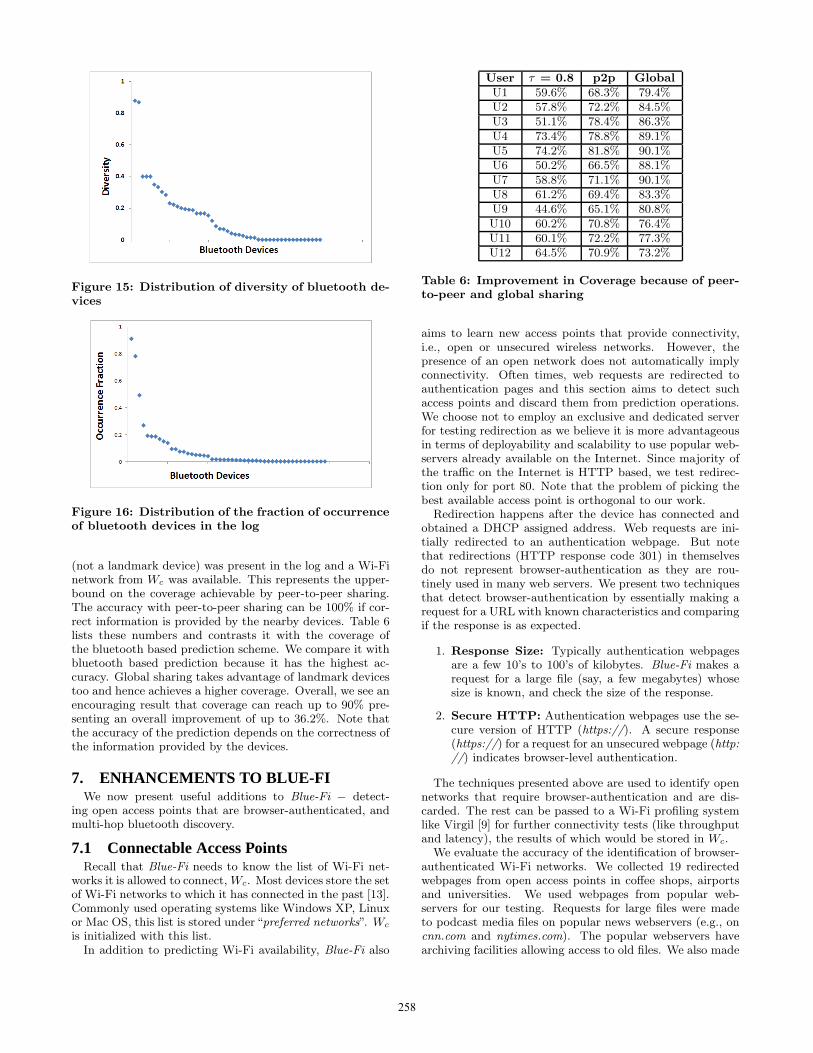
Figure 15: Distribution of diversity of bluetooth de-vices
Figure 16: Distribution of the fraction of occurrenceof bluetooth devices in the log
(not a landmark device) was present in the log and a Wi-Finetwork from Wc was available. This represents the upper-bound on the coverage achievable by peer-to-peer sharing.The accuracy with peer-to-peer sharing can be 100% if cor-rect information is provided by the nearby devices. Table 6lists these numbers and contrasts it with the coverage ofthe bluetooth based prediction scheme. We compare it withbluetooth based prediction because it has the highest ac-curacy. Global sharing takes advantage of landmark devicestoo and hence achieves a higher coverage. Overall, we see anencouraging result that coverage can reach up to 90% pre-senting an overall improvement of up to 36.2%. Note thatthe accuracy of the prediction depends on the correctness ofthe information provided by the devices.
7. ENHANCEMENTS TO BLUE-FIWe now present useful additions to Blue-Fi − detect-
ing open access points that are browser-authenticated, andmulti-hop bluetooth discovery.
7.1 Connectable Access PointsRecall that Blue-Fi needs to know the list of Wi-Fi net-
works it is allowed to connect, Wc. Most devices store the setof Wi-Fi networks to which it has connected in the past [13].Commonly used operating systems like Windows XP, Linuxor Mac OS, this list is stored under“preferred networks”. Wc
is initialized with this list.In addition to predicting Wi-Fi availability, Blue-Fi also
User τ = 0.8 p2p GlobalU1 59.6% 68.3% 79.4%U2 57.8% 72.2% 84.5%U3 51.1% 78.4% 86.3%U4 73.4% 78.8% 89.1%U5 74.2% 81.8% 90.1%U6 50.2% 66.5% 88.1%U7 58.8% 71.1% 90.1%U8 61.2% 69.4% 83.3%U9 44.6% 65.1% 80.8%U10 60.2% 70.8% 76.4%U11 60.1% 72.2% 77.3%U12 64.5% 70.9% 73.2%
Table 6: Improvement in Coverage because of peer-to-peer and global sharing
aims to learn new access points that provide connectivity,i.e., open or unsecured wireless networks. However, thepresence of an open network does not automatically implyconnectivity. Often times, web requests are redirected toauthentication pages and this section aims to detect suchaccess points and discard them from prediction operations.We choose not to employ an exclusive and dedicated serverfor testing redirection as we believe it is more advantageousin terms of deployability and scalability to use popular web-servers already available on the Internet. Since majority ofthe traffic on the Internet is HTTP based, we test redirec-tion only for port 80. Note that the problem of picking thebest available access point is orthogonal to our work.
Redirection happens after the device has connected andobtained a DHCP assigned address. Web requests are ini-tially redirected to an authentication webpage. But notethat redirections (HTTP response code 301) in themselvesdo not represent browser-authentication as they are rou-tinely used in many web servers. We present two techniquesthat detect browser-authentication by essentially making arequest for a URL with known characteristics and comparingif the response is as expected.
1. Response Size: Typically authentication webpagesare a few 10’s to 100’s of kilobytes. Blue-Fi makes arequest for a large file (say, a few megabytes) whosesize is known, and check the size of the response.
2. Secure HTTP: Authentication webpages use the se-cure version of HTTP (https://). A secure response(https://) for a request for an unsecured webpage (http://) indicates browser-level authentication.
The techniques presented above are used to identify opennetworks that require browser-authentication and are dis-carded. The rest can be passed to a Wi-Fi profiling systemlike Virgil [9] for further connectivity tests (like throughputand latency), the results of which would be stored in Wc.
We evaluate the accuracy of the identification of browser-authenticated Wi-Fi networks. We collected 19 redirectedwebpages from open access points in coffee shops, airportsand universities. We used webpages from popular web-servers for our testing. Requests for large files were madeto podcast media files on popular news webservers (e.g., oncnn.com and nytimes.com). The popular webservers havearchiving facilities allowing access to old files. We also made
258

requests to popular webservers that did not require commu-nication over secure HTTP (google.com and live.com).
Checking using the size of the response is most accurateidentifying all the pages in our redirected pages dataset.The dataset had an average size of 62 KB and a mini-mum and maximum of 13 KB and 132 KB respectively.Secure HTTP identifies only 68.4% of the authenticationpages. This is because splash screens and end-user-license-agreement (EULA) notices are also served over unsecureHTTP. Differentiating between authentication webpages, andEULA and splash screens is part of future work.
7.2 Multi-hop Bluetooth DiscoveryThe discrepancy between the Wi-Fi and the bluetooth
ranges (i.e., 100m vs 10m) is the main reason behind thehigh accuracy of bluetooth prediction. On the downside,this discrepancy leads to low coverage, as a bluetooth de-vice may not be able to discover other nearby devices, eventhough all devices are in the same Wi-Fi coverage.
One possible solution to reduce the discrepancy betweenthe Wi-Fi and bluetooth ranges is to use multi-hop bluetoothdiscovery. A device establishes a connection with each devicepresent in its immediate range, and queries for devices thatare in its range, recursively, for a preset number of hops.This way, a mobile device will discover bluetooth devicesbeyond its bluetooth range. This technique allows one totrade accuracy for coverage: the higher the number of hopsthe higher the coverage and the lower the accuracy. Theoverhead of multi-hop bluetooth discovery can be reducedusing the technique described in Section 3.
We performed an initial evaluation of the multi-hop dis-covery protocol by placing bluetooth monitoring devices ina large lab area where the bluetooth devices tend to be clus-tered in two groups. We were able to see an increase of upto 234% in the number of discovered bluetooth devices byusing multi-hop discovery.
8. DISCUSSIONIn this section, we discuss extensions to Blue-Fi along with
fugure work: deploy “reference” devices to increase predic-tion coverage, and use correlated observation of bluetoothdevices to improve accuracy.
8.1 Reference Bluetooth DevicesBlue-Fi depends fundamentally of the existence of land-
mark bluetooth devices. However, as the coverage resultssuggest, in a non-trivial number of cases, the mobile deviceis not able to identify such bluetooth devices. To addressthis issue, we propose BlueDust, a pervasive deployment ofreference bluetooth devices spatially distributed in a givenarea. These devices are stationary and serve as means ofproviding contexts to the user. We envisage reference de-vices to be simple and inexpensive, for example bluetoothUSB dongles or bluetooth mice. In contrast to Wi-Fi basedindoor monitoring systems [20, 16], BlueDust’s advantage ispower efficiency. Also, a clear benefit of such a system wouldbe increase in coverage for Blue-Fi.
A simple and practical deployment mechanism, especiallyfor enterprise environments, is to plug in bluetooth donglesinto desktops [20]. Reference devices can also be placed us-ing systematic techniques. A database contains the locationsof the reference devices.
BlueDust can be used for monitoring the spatial variation
of resouces like cooling (e.g., conference room A is uncom-fortably cold) and Wi-Fi performance (e.g., Connectivity inoffice B is spotty). Users log their sensed data (like Wi-Fi performance) along with the visible reference bluetoothdevices. The database of the locations of the reference blue-tooth devices can be used to find the location of the pointat which the data was collected and appropriate analysiscan be conducted. We plan an extensive deployment andevaluation of BlueDust.
8.2 Prediction ModelsBlue-Fi assumes that the sensing of each bluetooth device
is an independent event. But clearly, there is a rich opportu-nity to incorporate mobility patterns and correlation acrossmultiple bluetooth devices in our prediction models. Mo-bility patterns can be used for predicting Wi-Fi availability— e.g., “Wi-Fi connectivity will be available ten minutes af-ter you spot the bluetooth device b”. Such predictions areuseful for delay-tolerant applications to appropriately plantheir network activities in future.
Also, predictBT can be augmented to include sets of blue-tooth devices. This is useful in scenarios when, say, blue-tooth devices b1 and b2 are not sufficiently reliable on theirown, but whenever sensed together turn out to be reliableindicators of Wi-Fi availability. Understanding the benefitsof such a correlated predictions on Blue-Fi’s coverage andaccuracy is part of future work.
9. RELATED WORKImproving energy efficiency of Wi-Fi networks is a long-
standing problem in wireless networks and has been ap-proached from different directions. Techniques range fromprotocol optimizations in the various layers of the network-ing stack for a single Wi-Fi radio to techniques that leveragemultiple radios on the same device that often involve spe-cialized infrastructure elements.
The key idea of using a separate low-powered radio towake up a high-powered radio was proposed in Wake-on-Wireless [15]. Wake-on-Wireless proposes the use of a sec-ond special-purpose radio that serves as a wake-up chan-nel for a Wi-Fi radio. However the short range custom ra-dio necessitates multiple intermediate proxies and presenceservers. Also, it requires significant modifications to exist-ing mobile devices. While On-Demand-Paging [27] builds onthis idea to use the widely available Bluetooth radio as thelow-powered channel, it still needs substantial infrastructuresupport in the form of specialized access points that haveboth Wi-Fi and bluetooth interfaces. Cell2Notify [28] usesthe cellular interface to wake up the Wi-Fi interfaces on anincoming VOIP call using specialized servers. In contrast,Blue-Fi does not require any modification to the existing in-frastructure and can be deployed readily on mobile devices.
War-driving has been performed in prior work that col-lects and maps the Wi-Fi access points [7, 10, 24]. War-driving is an expensive operation requiring investment oftime and money. While a few major cities have good war-driving data, the majority of them have scarce or no map-ping. In contrast, Blue-Fi adopts the approach of users auto-matically learning their own sorroundings and Wi-Fi avail-ability. Also, war-driving data tend to become unreliableand out-dated over time.
Context-for-Wireless [12] aims to provide energy-efficientubiquitous wireless connectivity, and their ideas of using
259
cell-tower information for predicting Wi-Fi availability areclosely related to our work. But as we demonstrate cell-tower information is coarse-grained and can be beneficiallycombined with bluetooth contact-patterns for fine-grainedcontext localization. Intel Place Lab [19, 10] collected ex-tensive network data on GSM cellular networks for the sakeof positioning Wi-Fi hotspots. To the best of our knowl-edge, ours is the first work that demonstrates the benefitsof using bluetooth contact-patterns (including mobile blue-tooth devices) for context localization. We are not aware ofprior work that demonstrates a beneficial convergence of thebluetooth, cellular and Wi-Fi interfaces.
Our work has been supported by recent studies that showthe existence of bluetooth contact-patterns in devices [11,26]. CoolSpots [22] proposes the installation of “bluetoothaccess-points”, which if deployed widely, strengthens ouridea of using bluetooth contact-patterns for providing con-text information to mobile devices.
10. CONCLUSIONSBlue-Fi proposed using bluetooth contact-patterns as con-
text identifiers for predicting Wi-Fi availability. The lowrange of bluetooth devices make them accurate predictorsof Wi-Fi availability; we compensated for their lack of cov-erage by using cell-tower identifiers. Our evaluation withdata collected from real users’ contact-patterns shows en-couraging results in providing coverage as well as accuracy.
In addition, we also presented techniques to overcomebluetooth’s high discovery time essentially using periodicscanning. To speed up the learning process, Blue-Fi usescollaborative prediction through sharing of logs and Wi-Ficonnectivity details.
11. ACKNOWLEDGMENTSWe would like to thank Joe Hellerstein , Dilip Joseph, An-
thony Joseph, Randy Katz, Venkat Padmanabhan, LucianPopa and Matei Zaharia for their advice and guidance re-garding various technical aspects as well as writing of thispaper. We would also like to thank our shepherd, AlbrechtSchmidt, and the anonymous reviewers for their commentsand suggestions.
12. REFERENCES[1] Companies Eye Location-Services Market.
http://online.wsj.com/article/SB122722971742046469.html.
[2] IMAP IDLE monitor/notifier.http://www.hackint0sh.org/forum/f126/6116.htm.
[3] In The Hand. http://32fet.net.
[4] Is WiFi draining when not connected.http://forums.macrumors.com/archive/index.php/t-330279.html.
[5] Microsoft Pocket Outlook.http://www.microsoft.com/windowsmobile/en-us/downloads/microsoft/office-outlook-mobile.mspx.
[6] Spearman Rank Correlation Coefficient.http://mathworld.wolfram.com/SpearmanRankCorrelationCoefficient.html.
[7] WIGLE: Wireless Geographic Logging Engine.http://wigle.net.
[8] A. J. Nicholson and B. D. Noble. BreadCrumbs:Forecasting mobile connectivity. In Proceedings of The
Fourteenth Annual International Conference on MobileComputing and Networking (Mobicom ’08), Sep 2008.
[9] A. J. Nicholson, Y. Chawathe, M. Y. Chen, B. D.Noble, and D. Wetherall. Improved access pointselection. In Proceedings of The Fourth InternationalConference on Mobile Systems, Applications, andServices (MobiSys ’06), June 2006.
[10] A. LaMarca, Y. Chawathe, S. Consolvo, J. Hightower,I. Smith, J. Scott . Place lab: Device positioning usingradio beacons in the wild. In Proceedings of The ThirdInternational Conference on Pervasive Computing(Pervasive ’05), May 2005.
[11] A. Natarajan, M. Motani, and V. Srinivasan.Understanding Urban Interactions from BluetoothPhone Contact Traces. In Proceedings of The EighthPassive and Active Measurement Conference (PAM’07), Apr 2007.
[12] A. Rahmati and L. Zhong. Context-for-Wireless:Context-Sensitive Energy-Efficient Wireless DataTransfer. In Proceedings of The Fifth InternationalConference on Mobile Systems, Applications, andServices (MobiSys ’07), Jun 2007.
[13] B. Greenstein, R. Gummadi, J. Pang, M. Y. Chen, T.Kohno, S. Seshan, and D. Wetherall. Can ferris buellerstill have his day off? protecting privacy in thewireless era. In Proceedings of The Eleventh Workshopon Hot Topics in Operating Systems (HotOS-XI), May2007.
[14] E. S. Hall, D. K. Vawdrey, and C. D. Knutson. RFRendez-Blue: reducing power and inquiry costs inBluetooth-enabled mobile systems. In Proceedings ofThe Eleventh International Conf. on ComputerCommunications and Networks (ICCCN ’02), Oct2002.
[15] E. Shih, P. Bahl, and M. J. Sinclair. Wake on wireless:An event driven energy saving strategy for batteryoperated devices. In Proceedings of The Eighth AnnualInternational Conference on Mobile Computing andNetworking (MobiCom ’02), 2002.
[16] F. Dabek, R. Cox, F. Kaashoek, and R. Morris.Vivaldi: A decentralized network coordinate system.In Proceedings of the 2004 conference on Applications,technologies, architectures, and protocols for computercommunications (SIGCOMM ’04), Aug 2004.
[17] G. Ananthanarayanan, V. N. Padmanabhan, L.Ravindranath, and C. A. Thekkath. COMBINE:Leveraging the Power of Wireless Peers throughCollaborative Downloading. In Proceedings of TheFifth International Conference on Mobile Systems,Applications, and Services (MobiSys ’07), Jun 2007.
[18] Ke Chen. On k-Median Clustering in HighDimensions. In Proceedings of The SeventeenthACM-SIAM Symposium on Discrete Algorithms(SODA ’06), Jan 2006.
[19] M. Chen, T. Sohn, D. Chmelev, D. Haehnel, J.Hightower, J. Hughes, A. LaMarca, F. Potter, I.Smith, and A. Varshavsky. PracticalMetropolitan-Scale Positioning for GSM Phones. InProceedings of The Eighth International Conference onUbiquitous Computing (UbiComp ’06), Sep 2006.
[20] P. Bahl, R. Chandra, J. Padhye, L. Ravindranath, M.Singh, A. Wolman and B. Zill. Enhancing the security
260

of corporate wi-fi networks using dair. In Proceedingsof The Fourth International Conference on MobileSystems, Applications, and Services (MobiSys ’06),Jun 2006.
[21] P. Mohan, V. N. Padmanabhan, and R. Ramjee.TrafficSense: Rich Monitoring of Road and TrafficConditions using Mobile Smartphones. In MicrosoftTechnical Report, MSR-TR-2008-59, Apr 2008.
[22] T. Pering, Y. Agarwal, R. Gupta, and R. Want.Coolspots: Reducing the power consumption ofwireless mobile devices with multiple radio interfaces.In Proceedings of The Fourth International Conferenceon Mobile Systems, Applications, and Services(MobiSys ’06), Jun 2006.
[23] T. Sohn, A. Varshavsky, A. Lamarca, M. Chen, T.Choudhury, I. Smith, S. Consolvo, J. Hightower, W.Griswold, and E. de Lara. Mobility detection usingeveryday gsm traces. In Proceedings of The EighthInternational Conference on Ubiquitous Computing(UbiComp ’06), Sep 2006.
[24] V. Bychkovsky, B. Hull, A. Miu, H. Balakrishnan, andS. Madden. A measurement study of vehicularinternet access using in situ wi-fi networks. InProceedings of The Twelfth Annual InternationalConference on Mobile Computing and Networking(MobiCom ’06), 2006.
[25] V. Otsason, A. Varshavsky, A. LaMarca, and E. deLara. Accurate GSM Indoor Localization. In TheSeventh International Conference on UbiquitousComputing (Ubicomp ’05), Sep 2005.
[26] V. S. W. Wang and M. Motani. Adaptive contactprobing mechanisms for delay tolerant applications. InProceedings of The Thirteenth Annual InternationalConference on Mobile Computing and Networking(MobiCom ’07), Sep 2007.
[27] Y. Agarwal, C. Schurgers, and R. Gupta. DynamicPower Management Using On Demand Paging forNetworked Embedded Systems. In Proceedings of The2005 Conference on Asia South Pacific DesignAutomation (ASP-DAC ’05), Jan 2005.
[28] Y. Agarwal, R. Chandra, A. Wolman, P. Bahl, and R.Gupta. Wireless wakeups revisited: Energymanagement for voip over wi-fi smartphones. InProceedings of The Fifth International Conference onMobile Systems, Applications, and Services (MobiSys’07), Jun 2007.
261