
Resumen PDF Resumen PDF Resumen PDF Resumen PDF Resumen PDF Resumen PDF Resumen PDF

/ V <sxr / O /
<3L0/Union Wages and Hours: Building Trades July 1, 1977U.S. Department of Labor Bureau of Labor Statistics 1979
Bulletin 2012
Digitized for FRASER http://fraser.stlouisfed.org/ Federal Reserve Bank of St. Louis

Union Wages and Hours Building Trades July 1,1977U.S. Department of Labor Ray Marshall, Secretary
Bureau of Labor Statistics Janet L. Norwood Acting Commissioner January 1979
Bulletin 2012
For sale by the Superintendent of Documents, U.S. Government Printing Office Washington, D .C. 20402- Price $3.75
Stock Number 029-001-02278-6
Digitized for FRASER http://fraser.stlouisfed.org/ Federal Reserve Bank of St. Louis

Digitized for FRASER http://fraser.stlouisfed.org/ Federal Reserve Bank of St. Louis

Preface
The Bureau of Labor Statistics conducts annual surveys of wage rates and weekly straight-time hours for specified crafts or jobs as provided in labor-management agreements in the construction and local transit industries and biennial surveys of grocery stores, printing, and local trucking industries. Wage rates and hours presented are those in effect the first workday in July, as reported to the Bureau by the appropriate labor organization officials in each of the surveyed cities.
Preliminary listings of union wage rates and hours for construction employees in each city were issued earlier. Copies of these are available from the Bureau of Labor Statistics, Washington, D.C. 20212, or from any of its regional offices listed on the inside back cover of this bulletin.
This study of construction wage rates was conducted in the Bureau’s Office of Wages and Industrial Relations. This bulletin was prepared by Mark Sieling in the Division of Occupational Wage Structures. It provides a comprehensive account of the current study and includes indexes of union wage rates for building trades employees for 1907-77. Field work for the survey was conducted by the Bureau’s Assistant Regional Commissioners for Operations.
Material in this publication is in the public domain and may be reproduced without permission of the Federal Government. Please credit the Bureau of Labor Statistics and cite Union Wages and Hours: Building Trades, July 1, 1977, Bulletin 2012.
Digitized for FRASER http://fraser.stlouisfed.org/ Federal Reserve Bank of St. Louis

Digitized for FRASER http://fraser.stlouisfed.org/ Federal Reserve Bank of St. Louis

Contents
Page
Summary.......................................................................................................................................................................... 1Industry characteristics.................................................................................................................................................. 1Wage trends.................................................................................................................................................................... 1Trade averages.................................................................................................................................................................... 2Regional and city averages............................................................................................................................................ 3Employee benefits................................................................................... 3Wage rates by type of construction.................................................................................................................................. 4Weekly hours...................................................................................................................................................................... 4
Chart: Average hourly wage rates for journeymen as a percent of rates for helpers and laborers, all building trades, 1907-77 ........................................................................................................................................ 4
Text tables:1. Annual percent increases in average union hourly wage rates, building trades, 1967-77.............. 22. Wage rates, benefits, attd benefits as a proportion of total hourly wages and benefits, building trades,
1967-77 .............................................................................................................................................................. 3
Reference tables:1. Wage rate indexes: United States.............................................................................................................. 52. Wage rate indexes by trade: United States.............................. . ............................................................. 63. Weekly hours indexes: United States........................................................................................................ 84. Weekly hours indexes by trade: United States................................. 95. Average wage rates and employer contributions for selected benefits by trade: United States.. . . 116. Cents-per-hour and percent changes in average wage rates by trade: United States...................... 117. Cents-per-hour changes in wage rates by trade: United States............................................................ 128. Percent changes in wage rates by trade: United States....................... 139. Wage rate distribution by trade: United S tates...................................................................................... 14
10. Weekly hours: United States...................................................................................................................... 1511. Average wage rates by trade: Regions......... ........................................................................................... 1612. Average wage rates plus employer contributions for selected benefits: Regions.............................. 1713. Cents-per-hour and percent changes in average wage rates by trade: Regions................................ 1814. Average wage rates and employer contributions for selected benefits: Selected cities by population
group................................................................................................................................................................ 2015. Average wage rates and employer contributions for selected benefits: Selected cities by region .. 2116. Average wage rates and employer contributions for selected benefits, journeymen, and laborers:
Selected cities by population group .......................................................................................................... 2217. Average wage rates and employer contributions for selected benefits, journeymen, and laborers:
Selected cities by region.............................................................................................................................. 2418. Cents-per-hour and percent changes in average wage rates: Selected cities by
population group........................................................................................................................................... 2619. Cents-per-hour and percent changes in average wage rates: Selected cities by region.................... 2820. Wage rates, hours, and employer contributions for selected benefits: Selected cities...................... 30
Appendixes:A. A note on new benefit tabulations................................................................................................................. 172B. Scope and method of survey.................................................................................................. 180
vDigitized for FRASER http://fraser.stlouisfed.org/ Federal Reserve Bank of St. Louis

Digitized for FRASER http://fraser.stlouisfed.org/ Federal Reserve Bank of St. Louis

Building Trades, July 1,1977
SummaryUnion wage rates in the building trades increased by
an average of 5.9 percent between July 1, 1976, and July 1, 1977, in cities of 100,000 inhabitants or more. Excluding the 1972-73 increase of 5 percent, which occurred during a period of wage controls, the 1976- 77 increase was the smallest reported over the past decade. By comparison, a 6.9 percent increase was reported for the same 12 months in the Bureau’s Employment Cost Index—a new measure that covers total compensation for all workers in private nonfarm industries.
The July 1976-77 national average increase for journeymen was 5.8 percent, compared to 6.4 percent for helpers and laborers. Wage rates for journeymen averaged $10.44 an hour on July 1, 1977; helpers and laborers, $8.03 an hour.
Regionally, increases were highest in the Mountain States (8.3 percent) and lowest in New England (3.2 percent). When cities were grouped by population size, the 1976-77 increase was highest (6.8 percent) for the size group containing cities with half a million to a million inhabitants and lowest (5.1 percent) in cities with a million or more. Increases varied considerably however, among individual cities and trades within regional and city size groupings.
Average employer contributions to insurance, pension, and vacation funds totaled $2.18 an hour on July 1, 1977—about 18 percent of the basic wage plus benefit package. The addition of employer payments for holidays, savings funds, and supplemental unemployment benefits raised the benefit average to $2.26 an hour — still about 18 percent of the total compensation package, as measured by the survey.
Industry characteristicsUnion members covered by this survey were pri
marily engaged in the construction of commercial and residential buildings.1 These workers were usually employed by either general contractors involved in multiple building activities, including site management; or by special trades contractors typically engaged
’Wage rates for workers in heavy and highway construction are shown in table 20. These rates, however, were not used in calculating any of the indexes or averages in other tables in this bulletin. Also excluded from the survey indexes and averages are wage rates for operating engineers shown in the building construction section of table 20.
in one type of construction activity, such as carpentry, painting, or plumbing, on a subcontract basis for general contractors. Both types of contractors generally employed workers in only a few of the building trades, the number depending, in large part, on the level of building activity.
Of the 25 journeymen trades studied, carpenters were the largest group, constituting just under three - tenths of all journeymen. Other numerically important journeyman crafts were electricians, painters, pipefitters, plumbers, and sheet-metal workers. Among the nine helper-labor classifications, building laborers accounted for just over seven-tenths of the union membership.2
Union workers in the construction industry are organized by craft unions with local jurisdiction over their specific type of work, such as carpentry or tile laying. Although usually highly localized and specialized, some union bargaining contains multitrade, national, and regional elements. The same union, for example, often represents two or more allied trades, such as bricklayers and stonemasons, or painters, paper- hangers, and drywall tapers. Some unions, such as the International Brotherhood of Electrical Workers, include nationwide provisions in local contracts; others like elevator constructors, tie their wage rates to an average of several key trades within an area. Multiarea or regional bargaining encompassing several trades also occurs in various parts of the country.
Wage trendsThe overall wage rate increase of 5.9 percent be
tween July 1, 1976, and July 1, 1977, raised the Bureau’s wage rate index (1967 =100) for the 34 construction job classifications studied to 212.3 (table 1) Although wage rates have more than doubled since 1967, average annual increases were substantially higher in the 1967-72 period (8.9 percent per year) than during the 1972-77 span (6.7 percent). As a further indication of dampened wage gains, increases during 1975-77 were the lowest of the past decade, excluding the 1971-73 period of wage controls (text table
2For a more detailed account of the characteristics of the construction industry, see Industry Wage Survey: Contract Construction, September 1973, Bulletin 1911 (Bureau of Labor Statistics, 1975), pp. 1-11, and Contract Clauses in Construction Agreements, Bulletin 1864 (Bureau of Labor Statistics, 1975).
1Digitized for FRASER http://fraser.stlouisfed.org/ Federal Reserve Bank of St. Louis

Text table 1. Annual percent increases in average union hourly wage rates, building trades, 1967-77
Y ear
A llb u i ld in g
tra d e sJ o u rn e y m e n
tra d e s
H e lp e ra nd
la b o re rc la s s if ic a t io n s
J u ly to J u ly :1967-68 .............................. 6.6 6.7 6.41968-69 .............................. 8 .3 8.4 7.61969-70 .............................. 11.6 11.4 12.51970-71 .............................. 11.8 11.6 12.71971-72 .............................. 6 .4 6.6 5.41972-73 .............................. 5.0 4.8 5.71973-74 .............................. 7.8 7.6 9.11974-75 .............................. 8 .6 8.7 8.01975-76 .............................. 6.5 6.5 6.61976-77 .............................. 5.9 5.8 6.4
l) .3 A similar pattern is evident over the last 10 years for both the journeyman and the helper and laborer groups.
Wage rates increased for slightly over nine-tenths of the union building trades workers over the year ended July 1, 1977. Just over one-fourth of the work force had increases between 2 and 5 percent; one third, 5 to 8 percent; and one-fourth, 8 percent or more (table 8). Expressed in money terms, increases amounted to 20 to 50 cents an hour for about one-fourth of the membership; to 50 to 80 cents for about two-fifths; and 80 cents or more for the remaining one-fourth (table 7).
Among the 34 trades studied, the largest percentage increase in wages between July 1, 1976, and July 1, 1977, was reported for slate and tile roofers— 10.2 percent—and the lowest for composition roofers’ helpers—2.6 percent (table 6). Average wage rates for carpenters, the largest journeyman trade studied, increased by 5.3 percent while rates for building laborers, the predominant helper-laborer classification, increased by 6.4 percent. Most other trades reported increases of 5 to 7 percent. Over the past decade, slate and tile roofers also had the largest percentage increase in wage rates — averaging 8.7 percent per year ; raising their wage rate index (1967=100) to 229.7 in 1977 (table 2). The smallest total increase over the same period was for mosaic and terrazzo workers—averaging 7 percent per year; making their 1977 wage rate index 196.0
Regionally, building trades in the Mountain States reported the largest average wage rate increase between July 1, 1976, and July 1, 1977—8.3 percent (table 13). The smallest increase was reported for New England—3.2 percent. Since July 1, 1972, when
information on a somewhat more limited scale indicates that the pace of construction increases has remained fairly constant during the year following the July 1, 1977, annual study. The Bureau’s quarterly survey of seven major building trades showed an average increase of 5.9 percent over the year ended July 1, 1978. The trades included in the survey account for almost two-thirds of the union membership in the 34 trades within the scope of the annual study.
regional increases were first computed, average wage rates for all trades combined have increased 44 to 50 percent in the Mountain States, Pacific, and Southwest regions; 33 to 39 percent in the Border States, Great Lakes, Middle Atlantic, Middle West, and Southwest regions; and 26 percent in New England. Annual and cumulative increases by trade, however, varied considerably within each region.
Among the 66 cities studied separately, Miami reported the smallest average wage rate increase between July 1, 1976, and July 1, 1977—0.6 percent,4 and Honolulu the largest— 13.6 percent (table 18). The 1976-77 increase was mghest tor cities witn nan a million to a million inhabitants (6.8 percent) and lowest for those with a million or more (5.1 percent). Reflecting the localized nature of most bargaining agreements, however, increases varied widely within regions, States, and city size groups (table 19). For example, increases among California cities ranged from 2.9 percent in Los Angeles to 9.8 percent in San Diego.
Trade averagesUnion wage rates in the building trades averaged
$10.02 an hour on July 1, 1977 (table 5). Journeymen averaged $10.44 and helpers and laborers, $8.03. The difference in average wage rates between these two skill levels declined slightly between July 1976 and July 1977—from 32 to 31 percent.5 Since 1960, the wage advantage of skilled workers over unskilled workers has remained basically unchanged at about 33 percent, after declining fairly steadily from about 90 percent in the 1930’s (chart).
Among the 25 journeymen trades studied in the 1977 survey, average wage rates were highest for elevator constructors ($11.22) and pipefitters ($11.15) and lowest for drywall tapers ($9.70). Carpenters, accounting for about three-tenths of all journeymen, averaged $10.25. Average hourly rates for the nine helper- laborer classifications ranged from $8.58 for tile layers’ helpers to $6.41 for composition roofers’ helpers. Building laborers, the largest helper-laborer trade studied, averaged $7.96.
All but about 6 percent of the union members in the
4Only two-thirds of Miami’s building trades workers received wage rate increases between surveys. Other cities also reported no increases, or small increases, for significant proportions of union building trades workers. Albany, New Bedford, and St. Petersburg, for example, had wage gains of 2 percent or less in 1976-77.
5To minimize the effects of changes in membership composition of the two major groups, journeymen’s wages and helpers’ and laborers’ wages were “standardized” by weighting the 1967 average wage rates for these 2 groups by levels of their wage indexes (1967=100) in the years being studied. For example, the standardized wage rate for journeymen in 1977 was computed as follows: $5.09 (wage in 1967) weighted by 211.9 (index for 1977) yields $10.79. The comparable figure for helpers and laborers, $3.83, weighted by 214.8 yields $8.23. The differential is thus 31 percent.
2
Digitized for FRASER http://fraser.stlouisfed.org/ Federal Reserve Bank of St. Louis
building trades were under labor-management agreements providing wage rates ranging from $6.70 to $12.40 an hour; the middle 50 percent of the array fell between $9.25 and $11.03. The distribution of workers by various earnings intervals, however, varied by trade (table 9). For example, carpenters and lathers had almost identical averages—$10.25 and $10.26—but 34 percent of the carpenters, compared to 25 percent of the lathers, had rates of at least $11 per hour.
Regional and city averagesAmong the nine regions studied, average wage rates
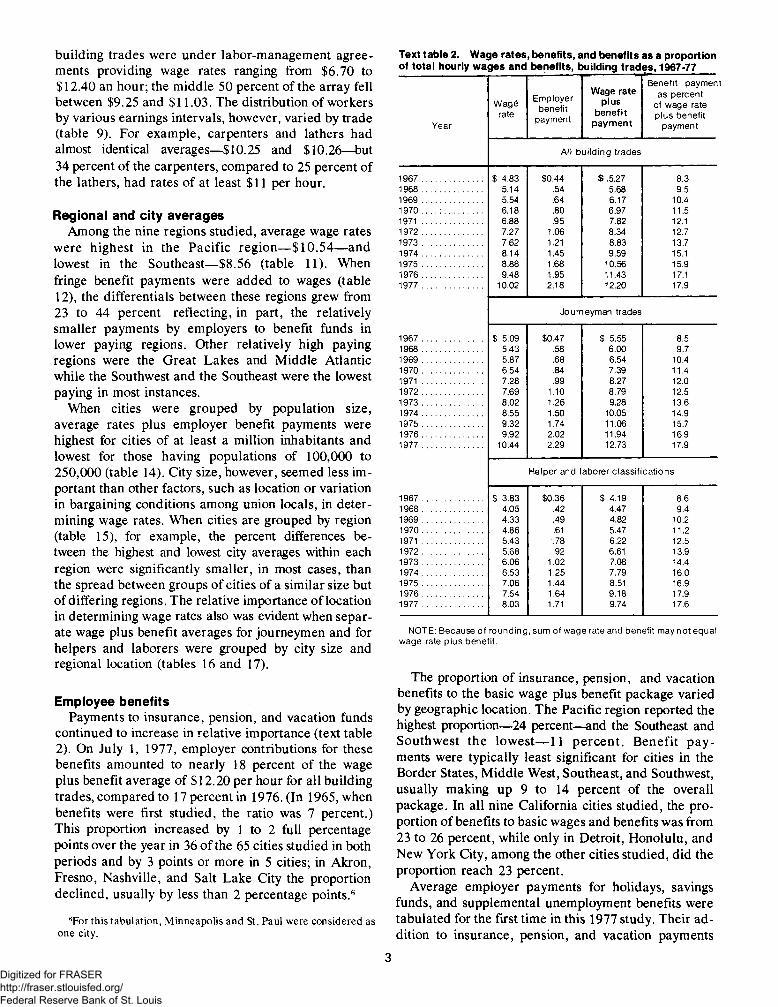
were highest in the Pacific region—$10.54—and lowest in the Southeast—$8.56 (table 11). When fringe benefit payments were added to wages (table 12), the differentials between these regions grew from 23 to 44 percent reflecting, in part, the relatively smaller payments by employers to benefit funds in lower paying regions. Other relatively high paying regions were the Great Lakes and Middle Atlantic while the Southwest and the Southeast were the lowest paying in most instances.
When cities were grouped by population size, average rates plus employer benefit payments were highest for cities of at least a million inhabitants and lowest for those having populations of 100,000 to 250,000 (table 14). City size, however, seemed less important than other factors, such as location or variation in bargaining conditions among union locals, in determining wage rates. When cities are grouped by region (table 15), for example, the percent differences between the highest and lowest city averages within each region were significantly smaller, in most cases, than the spread between groups of cities of a similar size but of differing regions. The relative importance of location in determining wage rates also was evident when separate wage plus benefit averages for journeymen and for helpers and laborers were grouped by city size and regional location (tables 16 and 17).
Employee benefitsPayments to insurance, pension, and vacation funds
continued to increase in relative importance (text table 2). On July 1, 1977, employer contributions for these benefits amounted to nearly 18 percent of the wage plus benefit average of $12.20 per hour for all building trades, compared to 17 percent in 1976. (In 1965, when benefits were first studied, the ratio was 7 percent.) This proportion increased by 1 to 2 full percentage points over the year in 36 of the 65 cities studied in both periods and by 3 points or more in 5 cities; in Akron, Fresno, Nashville, and Salt Lake City the proportion declined, usually by less than 2 percentage points.6
6For this tabulation, Minneapolis and St. Paul were considered as one city.
Text table 2. Wage rates, benefits, and benefits as a proportionof total hourly wages and benefits, building trades, 1967-77
Year
Wagerate
Employerbenefit
payment
Wage rate plus
b e nefit paym en t
Benefit paymen as percent
of wage rate plus benefit
payment
All building trades
1967 .............................. $ 4.83 $0.44 $ .5.27 8.31968 .............................. 5.14 .54 5.68 9.51969 .............................. 5.54 .64 6.17 10.41 9 7 0 . . . . : ................... 6.18 .80 6.97 11.51 9 7 1 .............................. 6.88 .95 7.82 12.11972 .............................. 7.27 1.06 8.34 12.71973 .............................. 7.62 1.21 8.83 13.71974 .............................. 8.14 1.45 9.59 15.11975 .............................. 8.88 1.68 10.56 15.91976 .............................. 9.48 1.95 11.43 17.11977 .............................. 10.02 2.18 12.20 17.9
Journeyman trades
1967 .............................. $ 5.09 $0.47 $ 5.55 8.51968 .............................. 5.43 .58 6.00 9.71969 .............................. 5.87 .68 6.54 10.41970 .............................. 6.54 .84 7.39 11.41 9 7 1 .............................. 7.28 .99 8.27 12.01972 .............................. 7.69 1.10 8.79 12.51973 .............................. 8.02 1.26 9.28 13.61974 .............................. 8.55 1.50 10.05 14.91975 .............................. 9.32 1.74 11.06 15.71976 .............................. 9.92 2.02 11.94 16.91977 .............................. 10.44 2.29 12.73 17.9
Helper and laborer classifications
1967 .............................. $ 3.83 $0.36 $ 4.19 8.61968 .............................. 4.05 .42 4.47 9.41969 .............................. 4.33 .49 4.82 10.21970 .............................. 4.86 .61 5.47 11.21 9 7 1 .............................. 5.43 .78 6.22 12.51972 .............................. 5.68 .92 6.61 13.91973 .............................. 6.06 1.02 7.08 14.41974 ........... .............. 6.53 1.25 7.79 16.01975 .............................. 7.06 1.44 8.51 16.91976 .............................. 7.54 1.64 9.18 17.91977 .............................. 8.03 1.71 9.74 17.6
NOTE: Because of rounding, sum of wage rate and benefit may not equal wage rate plus benefit.
The proportion of insurance, pension, and vacation benefits to the basic wage plus benefit package varied by geographic location. The Pacific region reported the highest proportion—24 percent—and the Southeast and Southwest the lowest— 11 percent. Benefit payments were typically least significant for cities in the Border States, Middle West, Southeast, and Southwest, usually making up 9 to 14 percent of the overall package. In all nine California cities studied, the proportion of benefits to basic wages and benefits was from 23 to 26 percent, while only in Detroit, Honolulu, and New York City, among the other cities studied, did the proportion reach 23 percent.
Average employer payments for holidays, savings funds, and supplemental unemployment benefits were tabulated for the first time in this 1977 study. Their addition to insurance, pension, and vacation payments
3Digitized for FRASER http://fraser.stlouisfed.org/ Federal Reserve Bank of St. Louis

Average hourly wage rates for journeymen as a percent of rates for helpers and laborers, all building trades, 1907-77
Percent
raised the average employer contribution to benefits by 3.7 percent to $2.26 an hour. (See appendix A.) The relationship of benefits to basic wages plus benefits, however, remained at 18 percent.
Wage rates by type of constructionWage rates, hours, and selected benefit payments for
unionized workers in each of the 66 cities studied are presented by type of construction in table 20. Rates for street and highway and other heavy construction were usually the same as, or slightly lower than, rates for the same trade in the building sector; most workers were completely mobile among these three types of construc
tion. Differentials by types of construction, when they occurred, were more common for carpenters, cement finishers, operating engineers, and laborers than for structural-iron workers.
Weekly hoursStraight-time hours averaged 39.3 per week on July
1, 1977, the same as in 1976 (table 10). Overall, 85 percent of the union members within the scope of the survey had straight-time weekly work schedules of 40 hours, while most of the remainder were scheduled for 35 hours. The number of weekly hours required before overtime premiums were paid had changed very little since 1967, as shown in tables 3 and 4.
4Digitized for FRASER http://fraser.stlouisfed.org/ Federal Reserve Bank of St. Louis

Table 1. Wage rate indexes: United States(Indexes of union hourly wage rates in the building trades, 1907-77)
(1967=100)
Date All trades Journeymen Helpers and laborers
1907 May 15 ......................................................................................................................................................... 7.7 8.2 5.61908 May 15 ......................................................................................................................................................... 8.2 8.8 5.81909 May 15 ......................................................................................................................................................... 8.6 9.2 G.O1910 May 15 ......................................................................................................................................................... 9.0 9.6 6.2
1911 May 15 ....................................... .................................................................................................................. 9.1 9.7 6.21912 May 15 ..................................................., .................................................................................................... 9.3 9.9 6.21913 May 15 ......................................................................................................................................................... 9.5 10.2 6.41914 May 1 ......................................................................................................................................................... 9.8 10.4 6.51915 May 1 ......................................................................................................................................................... 9.9 10.5 6.6
1916 May 15 ......................................................................................................................................................... 10.2 10.8 6.81917 May 15 ......................................................................................................................................................... 10.8 11.5 7.51918 May 15 ................................ ......................................................................................................................... 12.0 12.7 8.61919 May 15 ......................................................................................................................................................... 13.8 14.5 10.01920 May 15 ......................................................................................................................................................... 18.5 19.3 14.5
1921 May 15 ......................................................................................................................................................... 18.9 19.7 14.61922 May 15 ......................................................................................................................................................... 17.7 18.6 13.31923 May 15 ......................................................................................................................................................... 19.6 20.5 14.11924 May 15 ......................................................................................................................................................... 21.1 22.1 15.31925 May 15 ......................................................................................................................................................... 21.9 22.9 15.8
1926 May 15 ......................................................................................................................................................... 23.4 24.5 17.21927 May 15 ......................................................................................................................................................... 24.2 25.3 17.51928 May 15 ......................................................................................................................................................... 24.3 25.5 17.71929 May 15 ......................................................................................................................................................... 24.6 25.8 18.01930 May 15 ......................................................................................................................................................... 25.7 26.9 18.9
1931 May 15 ......................................................................................................................................................... 25.7 27.0 18.81932 May 15 ......................................................................................................................................................... 22.0 23.1 16.11933 May 15 ......................................................................................................................................................... 21.4 22.5 15.31934 May 15 ......................................................................................................................................................... 21:6 22.6 15.81935 May 15 ......................................................................................................................................................... 21.8 22.9 15.9
1936 May 15 . . . . . ......................................................................... 22.5 23.6 >6.81937 May 1 5 ......................................................................................................................................................... 24.1 25.2 18.31938 May 1 5 ......................................................................................................................................................... 26.3 27.5 20.11939 July 1 ......................................................................................................................................................... 26.5 27.6 20.3
1940 July 1 ......................................................................................................................................................... 26.9 28.0 20.7
1941 June 1 ......................................................................................................................................................... 27.9 29.0 21.71942 July 1 ......................................................................................................................................................... 29.6 30.7 23.81943 July 1 ......................................................................................................................................................... 29.8 30.8 24.11944 July 1 ......................................................................................................................................................... 30.1 31.0 24.31945 July i ......................................................................................................................................................... 30.7 31.6 25.5
1946 July 1 ......................................................................................................................................................... 34.2 35.0 29.61947 July 1 ......................................................................................................................................................... 39.1 39.9 34.61948 July 1 .......................................................................................................................................................... 43.3 44.0 39.11949 July 1 ......................................................................................................................................................... 45.1 45.9 40.51950 July 1 ......................................................................................................................................................... 47.0 47.8 42.7
1951 July 1 ......................................................................................................................................................... 50.1 50.8 45.61952 July 1 ......................................................................................................................................................... 53.2 53.9 48.61953 July 1 ......................................................................................................................................................... 55.9 56.5 52.01954 July 1 ......................................................................................................................................................... 58.0 58.6 54.21955 July 1 ......................................................................................................................................................... 60.0 60.6 56.5
1956 July 1 ......................................................................................................................................................... 62.8 63.3 59.91957 July 1 ......................................................................................................................................................... 66.0 66.5 33.41958 July 1 ......................................................................................................................................................... 69.0 69.5 66.51959 July 1 ......................................................................................................................................................... 72.4 72.7 70.71960 July 1 ......................................................................................................................................................... 75.4 75.5 74.0
1961 July 1 ......................................................................................................................................................... 78.4 78.4 77.51962 July 1 ......................................................................................................................................................... 81.3 81.4 80.31963 July 1 ......................................................................................................................................................... 84.2 84.4 83.21964 July 1 ......................................................................................................................................................... 87.3 87.4 86.81965 July 1 ......................................................................................................................................................... 90.9 90.9 90.8
1966 July 1 ......................................................................................................................................................... 94.7 94.7 94.61967 July 1 ......................................................................................................................................................... 100.0 100.0 100.01968 July 1 ......................................................................................................................................................... 106.6 100.7 105.91969 July 1 ......................................................................................................................................................... 115.4 115.7 113.91970 July 1 ................................................................................................................................ ......................... 128.8 128.9 128.11971 July 1 ......................................................................................................................................................... 144.0 143.9 144.4
1972 ju ly 1 ......................................................................................................................................................... 153.2 153.4 152.2
1973 July 1 ......................................................................................................................................................... 160.8 160.8 160.8
1974 July 1 ........................................................................................................................................................ 173.4 173.0 175.41975 July 1 ........................................................................................................................................................ 188.3 188.1 189.4
1976 Ju ly 1 ..................................................................................................................... .................................... 200.5 200.3 201.9
1977 - J u ly 1 ............................. ..................... .......... .......... .................. “ 2 12 .3 ' 211.9 214.8
5
Digitized for FRASER http://fraser.stlouisfed.org/ Federal Reserve Bank of St. Louis

Table 2. Wage rate indexes by trade: United States(Indexes.of union hourly wage rates in the building trades, 1907-77)
(1967=100)
DateAsbestosworkers
Boilermakers
Bricklayers
Carpenters
Cementfinishers
Electricians
(insidewirers)
Elevatorcon
structorGlaziers Lathers
Machinists
Marblesetters
Mosaicand
terrazzoworkers
Painters
Paper-hangers
Pipefitters
1907 May 1 5 ......... _ _ 11.0 7.9 9.7 7.8 _ . _ _ _ 11.0 _ 7.5 _ 8.51908 May 1 5 ......... - - 11.3 8.4 9.6 8.5 - - - - 11.1 - 8.3 - 8.51909 May 1 5 ......... - - 11.6 8.8 9.9 8.9 - - - - 11.2 - 8.9 - 9.81910 May 1 5 ......... - - 11.8 9.2 10.0 91 - - - - 11.3 - 9.4 - 9.0
1911 May 1 5 ......... _ _ 11.8 9.4 10.4 9.2 _ _ _ _ 11.5 _ 9.6 _ 9.31912 May 1 5 ......... - - 11.9 9.6 10.4 9.3 - 10.3 - 11.5 - 9.7 - 9.51913 May 1 5 ......... - - 12.2 9.7 10.7 9.5 - 10.5 - 12.2 - 10.1 - 9.81914 May 1 ......... - - 12.4 9.9 10.7 9.8 11.3 - 10.7 - 12.3 - 10.4 - 10.11915 May 1 ......... - - 12.5 10.0 10.9 10.0 11.4 - 10.9 - 12.5 - 10.5 - 10.3
1916 May 1 5 ......... 9.8 _ 12.6 10.3 10.9 10.2 11.7 _ 11.2 _ 12.5 9.9 11.5 _ 10.41917 May 1 5 ......... 10.3 - 13.0 11.2 11.6 10.9 12.5 - 11.6 - 12.5 10.5 11.8 - 10.91918 May 1 5 ......... 11.6 - 14.1 12.4 12.8 12.0 13.3 11.2 12.5 - 13.2 11.4 13.0 - 11.91919 May 1 5 ......... 14.1 - 15.6 14.3 11.5 13.8 15.5 12.0 13.9 - 14.7 12.2 15.2 - 13.31920 May 1 5 ......... 18.3 - 21.3 19.2 19.4 18.3 19.9 17.3 19.9 - 19.4 18.0 20.8 - 17.6
1921 May 1 5 ......... 18.6 _ 21.1 19.3 20.1 18.9 20.9 17.7 20.2 _ 19.7 18.3 21.4 _ 17.81922 May 1 5 ......... 17.2 - 20.5 17.9 18.7 17.8 19.5 17.7 19.0 - 19.3 17.8 20.0 - 17.31923 May 1 5 ......... 17.9 - 23.3 20.0 20.4 18.5 20.8 18.8 21.0 - 21.8 18.2 21.9 - 18.21924 May 1 5 ......... 20.0 - 24.6 21.3 22.6 20.6 23.3 19.8 22.6 - 22.8 21.5 23.1 - 20.91925 May 1 5 ......... 20.8 - 26.0 21.8 22.7 21.7 24.4 22.0 24.6 - 23.2 22.6 24.4 - 22.0
1926 May 1 5 ......... 22.2 _ 27.6 23.4 24.2 22.9 25.6 22.3 25.3 _ 26.1 23.1 25.9 _ 23.91927 May 1 5 ......... 23.3 - 28.3 24.1 25.3 23.8 26.6 23.8 26.3 - 26.6 24.0 26.7 - 24.51928 May 1 5 ......... 23.5 - 28.5 24.3 25.0 24.1 26.9 24.1 26.4 - 26.7 25.2 27.2 - 24.91929 May 1 5 ......... 24.6 - 29.1 24.6 25.0 24.5 27.0 24.5 26.2 - 28.6 26.4 27.1 - 25-01930 May 1 5 ......... 26.0 - 29.9 25.6 26.6 25.5 28.3 25.6 27.3 - 28.7 27.6 28.7 - 26.3
1931 May 1 5 ......... 26.2 _ 29.8 25.7 26.8 25.9 28.4 25.8 27.1 _ 28.8 27.9 28.7 _ 26.41932 May 1 5 ......... 21.9 - 25.5 21.0 23.4 24.7 26.4 21.6 24.4 - 26.4 25.9 24.3 - 22.71933 May 1 5 ......... 21.8 24.9 21.0 22.9 22.6 24.5 21.5 23.5 - 25.6 23.6 23.8 - 22.11934 May 1 5 ......... 21.8 - 24.9 21.3 23.1 22.6 24.7 22.8 24.1 - 25.4 24.0 23.5 - 22.31935 May 1 5 ......... 22.1 . - 24.6 21.7 23.2 23.7 24.7 23.0 24.4 - 25.6 24.0 23.5 - 22.7
1936:: May 1 5 ......... 23.0 _ 24.7 22.8 23.8 24.3 24.9 23.4 24.9 _ 25.7 24.0 24.7 __ 23.41937:: May 1 5 ......... 24.7 25.7 26.5 24.2 25.5 25.4 25.9 25.6 27.4 24.8 27.2 25.2 26.5 27.3 24.81938;: June 1 ......... 27.1 28.3 29.2 26.4 27.8 28.0 29.1 27.5 29.5 26.4 29.5 28.0 28.2 27.8 27.91939:: June 1 ......... 27.3 28.6 29.4 26.5 28.0 28.0 29.5 27.6 30.5 26.5 29.6 28.4 28.5 27.9 28.11940:: June 1 ......... 27.6 29.0 29.9 27.1 28.2 28.5 30.0 27.9 30.7 26.7 30.1 28.5 28.1 28.1 28.2
1941:: June 1 ......... 28.5 29.5 30.7 27.7 29.2 29.9 30.7 28.8 31.9 27.3 30.2 28.7 30.4 30.0 29.11942 : July 1 ......... 30.6 31.4 31.8 29.6 30.9 31.9 32.4 30.1 33.3 28.7 30.7 29.7 31.4 31.3 30.71943 : July 1 ......... 30.7 31.4 31.9 29.7 31.3 32.0 32.7 30.3 33.3 29.4 30.9 30.2 32.0 31.4 30.91944 : July 1 ......... 30.9 31.4 32.3 30.0 31.6 32.2 32.9 30.4 33.6 29.6 31.2 30.6 32.3 31.8 31.11945 : July 1 ......... 31.2 31.7 33.0 30.5 31.9 32.9 33.1 31.0 34.0 29.6 32.4 31.2 32.7 32.0 32.1
1946 : July 1 ......... 34.3 34.2 36.9 34.3 35.8 35.1 35.3 34.1 37.8 33.0 36.0 35.3 36.3 35.6 35.01947 : July 1 ......... 38.0 38.3 42.6 39.5 40.3 39.6 40.4 39.2 44.0 38.1 41.0 41.4 40.6 40.6 39.11948 : July 1 ......... 42.0 42.9 48.6 43.5 45.0 43.4 44.4 43.0 48.1 42:1 45.8 46.1 43.9 42.9 43.31949 : July 1 ......... 45.0 45.3 51.1 44.7 46.4 47.2 47.3 44.4 50.0 44.4 47.5 47.5 46.2 45.2 45.31950 : July 1 ......... 47.2 47.4 52.9 46.9 48.3 48.4 49.5 46.8 54.7 45.1 49.2 50.0 47.8 47.0 47.2
1951 : July 1 ......... 49.9 49.9 55.1 50.0 51.4 52.0 52.3 49.1 57.2 47.9 50.8 53.2 50.9 50.1 50.11952 : July 1 ......... 52.2 53.0 59.8 53.1 53.7 55.0 54.3 51.4 59.2 50.0 54.5 54.9 54.2 53.1 53.11953 : July 1 ......... 56.0 56.4 61.7 55.8 57.0 57.3 57.9 55.0 61.9 54.3 58.2 57.6 56.8 56.4 55.61954 : July 1 ......... 58.7 58.8 63.6 57.6 58.7 59.0 60.1 56.6 63.6 56.5 60.1 59.9 58.5 58.3 58.61955 : July 1 ......... 60.4 60.5 65.3 59.8 60.9 60.3 62.3 59.2 65.2 59.1 61.5 61.7 60.9 60.7 60.0
1956 : July 1 ......... 62.8 63.1 68.3 62.3 63.9 63.6 64.7 62.2 68.0 61.4 64.4 64.9 63.4 63.1 62.81957 : July 1 ......... 65.6 66.9 70.9 65.6 67.1 - 66.8 67.3 65.4 70.9 63.7 68.2 68.0 66.7 67.1 66.11958 : July 1 ......... 69.6 70.4 73.3 68.6 69.9 70.3 70.7 68.7 73.9 67.8 70.8 70.8 69.1 69.9 69.51959 : July 1 ......... 72.5 73.8 76.5 72.1 73.4 72.7 73.9 72.0 76.5 71.1 73.4 74.1 71.8 72.9 72.51960: July 1 ......... 75.0 76.9 78.8 75.0 76.2 76.4 76.3 75.3 79.1 73.8 76.2 76.7 74.9 75.8 75.2
1961 : July 1 ......... 77.3 80.0 81.8 77.9 79.1 79.4 79.9 78.1 81.4 76.8 78.9 79.5 77.7 78.5 78.01962 : July 1 ......... 80.6 82.8 84.3 80.7 81.6 83.6 82.3 80.5 84.1 79.9 81.2 82.4 80.6 81.2 80.91963: July 1 ......... 83.6 85.4 86.7 83.6 84.2 86.2 86.4 83.6 86.2 83.3 84.3 85.2 84.3 83.7 83.61964 : July 1 ......... 86.7 88.9 89.3 86.6 86.9 89.2 89.1 86.9 89.2 86.9 87.0 88.1 87.3 87.1 86.81965 : July 1 ......... 90.5 92.3 91.8 90.7 90.9 91.5 92.4 90.4 92.4 90.6 90.2 91.8 90.9 90.5 90.4
1966: July 1 ......... 94.3 95.8 95.0 94.6 94.6 94.9 95.6 95.6 95.2 95.1 94.6 95.8 94.6 94.4 94.61967 : July 1 ......... 100.0 100.0 100.0 100.0 100.0 100.0 100.0 100.0 100.0 100.0 100.0 100.0 100.0 100.0 100.01968 : July 1 ......... 107.0 106.2 106.8 107.0 106.3 106.5 104.1 107.2 106.3 105.7 106.1 105.8 106.3 107.5 106.61969: July 1 ......... 116.6 114.1 115.0 115.8 114.6 117.1 110.4 115.8 115.4 111.8 113.4 112.9 115.1 117.3 115.71970 : July 1 ......... 129.5 125.7 127.7 128.9 127.0 130.4 124.9 130.7 128.6 121.1 124.6 124.0 126.6 131.0 129.51971 : July 1 ......... 145.9 139.9 144.9 141.5 143.8 148.4 141.4 145.9 147.0 135.6 138.2 136.4 139.5 145.4 145.8
1972 : July 1 ......... 155.8 148.4 153.4 150.9 154.7 158.8 152.4 156.6 155.9 148.7 148.3 143.9 152.1 155.9 154.01973 : July 1 ......... 161.9 156.4 159.5 160.1 161.4 164.9 159.5 165.7 165.4 156.0 154.8 150.5 160.6 • 164.1 159.5
1974 : July 1 ___ 173.5 166.7 172.3 172.1 176.6 175.1 166.0 178.1 179.7 165.6 167.4 161.1 172.8 176.6 172.91975: July 1 ___ 187.2 184.4 184.0 187.0 189.6 193.8 183.6 192.5 193.3 182.0 178.9 173.3 187.9 190.4 188.91976 : J u ly 1 ........ 203.1 201.5 ' 194.1 198.2 201.9 206.8 200.5 205.6 202.0 194.2 187.0 185.3 202.0 202.8 202.51977: J u ly 1 . . . . 216.9 217.0 204.2 208.7 212.2 220.4 213.3 217.9 214.5 207.0 198.6 196.0 214.5 215.6 216.3
6
Digitized for FRASER http://fraser.stlouisfed.org/ Federal Reserve Bank of St. Louis

(Indexes of union hourly wage rates in the building trades, 1907-77)
Table 2. Wage rate indexes by trade: United States—Continued
(1967=100)
DatePlas
terersPlumb
ers
Reinforcing
ironw ork
ers
Roofers,compo
sition
Roofers,slateandtile
Sheet-metal
workers
Stonemasons
Structural-iron
workers
Tilelayers
Brick
layers'tenders
Buildinglaborers
Composition
roofers'helpers
Plasterers'
laborers
Plumbers'
laborers
Tilelayers'helpers
1907 May 1 5 ......... 12.1 9.6 _ _ _ 7.8 9.9 8.1 _ 6.4 5.9 _ 7.9 _ _
1908 May 1 5 ......... 12.1 9.7 - - - 8.0 10.1 8.9 - 6.4 5.9 - 8.2 - -1909 May 1 5 ......... 12.2 9.8 - - - 8.0 10.1 9.5 - 6.4 5.9 - 8.3 - -1910 May 1 5 ......... 12.4 9.9 - - 8.3 10.2 10.1 - 6.6 6.1 - 8.4 - -
1911 May 1 5 ......... 12.4 10.5 _ _ _ 8.6 10.3 10.3 _ 6.6 6.2 _ 8.4 _ _
1912 May 1 5 ......... 12.7 10.6 - - - 8.8 10.4 10.5 11.1 6.6 6.2 - 8.5 - 7.31913 May 1 5 ......... 12.8 10.9 - - - 9.1 10.7 10.8 11.7 6.8 6.5 - 8.7 - 7.41914 May 1 ......... 12.8 11.1 - 7.8 9.9 9.5 11.1 11.1 11.8 6.8 6.5 - 8.9 - 7.51915 May 1 ......... 12.9 11.1 - 8.1 10.3 9.6 11.2 11.1 11.8 6.9 6.6 - 8.9 - 7.7
1916 May 1 5 ......... 13.4 11.2 _ 8.2 10.6 9.7 11.4 11.2 12.0 7.1 6.9 _ 9.2 _ 8.01917 May 1 5 ......... 13.8 11.6 - 8.6 11.3 10.2 11.8 11.9 12.5 7.9 7.7 - 9.7 - 8.21918 May 1 5 ......... 14.5 12.8 - 9.7 12.4 11.9 12.9 13.6 12.9 9.2 8.9 - 11.2 - 8.51919 May 1 5 ......... 16.7 15.2 - 10.8 14.2 13.2 14.5 15.3 14.1 10.7 10.1 - 12.8 - 10.31920 May 1 5 ......... 21.9 18.8 - 15.4 18.3 17.7 20.2 19.4 18.9 15.6 14.6 - 18.5 - 16.9
1921 May 1 5 ......... 23.0 19.6 _ 16.2 19.9 18.3 20.7 19.8 18.8 15.7 14.8 _ 19.2 _ 17.01922 May 1 5 ......... 22.1 18.2 - 15.5 19.0 17.0 19.3 17.9 18.5 13.1 13.8 - . 16.8 - 16.01923 May 1 5 ......... 24.7 20.2 - 15.6 21.2 18.3 22.8 19.2 20.3 14.3 14.1 - 18.5 - 16.41924 May 15 . . . . . 27.6 21.9 - 18.1 23.5 20.1 24.2 21.7 22.9 14.9 15.7 - 19.9 - 17.81925 May 1 5 ......... 28.1 22.4 - 18.7 24.6 20.7 24.6 22.0 23.5 16.6 15.0 - 21.2 - 18.3
1926 May 1 5 ......... 30.1 24.1 _ 20.3 25.4 22.2 27.1 23.6 24.6 18.2 16.5 _ 22.5 _ 19.81927 May 1 5 ......... 30.7 24.6 - 20.9 26.6 22.8 27.5 25.2 25.8 18.6 16.6 - 22.7 - 20.11928 May 1 5 ......... 30.9 25.1 - 21.3 26.6 22.4 27.8 25.3 25.7 18.6 16.6 - 23.0 - 20.51929 May 1 5 ......... 30.4 25.4 - 21.7 26.9 23.2 28.6 25.5 26.0 19.4 16.7 - 23.2 - 20.21930 May 1 5 ......... 32.0 26.4 - 23.0 27.8 20.2 29.0 26.9 27.2 20.2 17.6 - 24.5 - 21.9
1931 May 1 5 ......... 31.9 26.6 _ 23.2 27.8 24.7 29.2 27.2 27.5 20.0 17.4 _ 24.4 _ 21.91932 May 1 5 ......... 26.5 23.2 - 20.3 24.2 21.4 25.9 23.6 23.7 16.6 15.0 - 20.3 - 19.41933: May 1 5 ......... 25.5 22.9 - 19.8 23.6 20.8 24.2 23.3 23.0 16.4 14.1 - 19.1 - 18.41934 May 1 5 ......... 25.8 23.2 - 20.2 23.4 20.9 24.1 23.6 23.0 17.5 14.6 - 19.6 - 18.41935 May 1 5 ......... 26.1 23.5 - 20.8 24.1 21.1 24.1 23.8 23.2 17.0 14.8 - 20.0 - 19.1
1936 : May 1 5 ......... 26.2 24.1 _ 20.9 24.3 21.5 24.3 24.4 23.6 17.8 16.1 _ 20.3 _ 19.41937 : May 1 5 ......... 28.9 25.4 24.1 22.6 26.1 23.0 26.9 26.7 25.3 19.2 17.6 20.0 22.2 - 20.41938 : June 1 ......... 32.3 28.5 26.4 25.0 27.8 25.3 29.2 28.8 27.7 21.2 18.9 21.3 25.0 20.2 22.51939 : June 1 ......... 32.6 28.8 26.7 25.1 28.1 25.7 29.3 29.1 27.8 21.2 19.0 21.4 25.3 20.8 22.61940: June 1 ......... 32.7 29.2 27.0 25.6 28.5 26.1 29.1 29.2 27.8 22.0 19.3 22.0 25.3 21.7 22.6
1941 June 1 ......... 33.3 30.5 28.4 26.7 29.2 27.4 29.9 30.6 28.2 22.7 20.4 23.0 25.8 22.9 23.21942 July 1 ......... 34.2 31.8 29.6 29.1 31.8 29.8 31.6 31.6 29.6 24.5 22.7 25.4 27.8 24.5 24.71943 July 1 ......... 34.3 31.9 29.8 29.2 32.0 29.9 31.7 31.7 30.0 24.7 23.0 25.5 28.0 24.7 25.01944 July 1 ......... 34.5 32.1 29.9 29.4 32.2 30.1 31.9 31.9 30.3 24.9 21.4 26.2 28.1 25.2 25.11945 July 1 ......... 35.0 32.8 30.6 29.8 32.9 30.4 32.7 32.4 31.3 25.8 24.7 26.2 29.2 25.9 25.4
1946 : July 1 ......... 38.7 35.5 33.7 33.2 35.7 34.2 37.1 35.3 35.4 30.0 28.9 29.7 32.8 29.5 29.51947 : July 1 ......... 45.4 41.1 37.9 38.6 39.7 37.7 42.4 39.6 41.4 35.1 33.8 32.8 38.8 33.8 36.31948:: July 1 ......... 48.3 45.5 42.1 42.7 44.1 42.3 48.6 44.2 46.3 39.3 38.1 37.7 43.7 37.8 41.11949 : July 1 ......... 52.8 46.9 44.0 44.7 46.5 43.6 51.5 45.8 48.4 40.4 39.6 39.8 45.4 40.3 42.91950:: July 1 ......... 55.2 48.0 45.8 46.6 47.6 45.7 54.7 48.0 49.4 43.2 41.8 41.8 46.9 42.1 44.4
1951 : July 1 ......... 57.9 50.8 48.8 49.4 51.3 48.3 56.6 51.1 52.8 45.4 44.8 44.7 51.4 45.0 47.41952:: July 1 ......... 61.2 53.8 51.4 52.0 54.2 51.9 60.7 53.5 54.9 48.3 47.8 48.6 54.6 47.1 49.71953 : July 1 ......... 63.6 55.8 54.3 55.1 57.1 54.3 61.7 56.5 58.0 50.9 51.4 51.0 57.7 50.3 52.21954 : July 1 ......... 64.7 58.8 56.3 57.1 59.1 56.9 63.1 58.6 59.6 53.1 53.7 52.6 59.7 52.9 55.01955: July 1 ......... 66.7 60.3 58.7 59.2 61.3 59.1 65.0 60.7 61.7 55.3 56.1 55.1 62.1 55.2 56.9
1956 : July 1 ......... 69.2 62.9 61.4 62.2 64.5 61.8 67.9 63.3 64.1 59.6 59.3 58.3 65.4 58.1 59.71957 : July 1 ......... 71.7 66.4 64.8 65.4 67.7 64.7 69.9 66.6 67.6 62.8 63.0 62.3 68.6 61.4 62.21958 : July 1 ......... 74.0 69.3 67.4 67.8 70.9 68.3 72.5 68.8 69.5 65.8 66.1 65.1 71.5 64.7 64.91959 : July 1 ......... 76.4 72.9 71.0 71.3 73.9 71.6 74.9 72.6 73.2 70.4 70.5 68.7 74.5 68.4 69.21960 : July 1 ......... 79.6 75.3 74.2 74.6 76.8 74.8 77.4 75.1 76.2 73.2 73.8 71.6 77.8 72.4 73.8
1961 : July 1 ......... 81.4 78.1 77.0 77.6 79.5 77.4 80.7 78.0 80.0 76.7 77.4 74.8 80.7 75.9 76.81962 : July 1 ......... 84.0 81.1 80.5 80.7 81.7 80.4 82.7 81.4 81.7 80.4 80.0 77.2 83.3 79.4 80.41963 : July 1 ......... 86.0 84.4 83.2 83.8 85.3 83.9 85.2 84.1 85.4 82.8 82.9 80.8 85.7 81.9 84.21964 : July 1 ......... 89.7 87.8 86.6 87.0 89.0 86.7 87.5 87.2 88.2 86.7 86.4 84.6 89.8 86.1 87.71965: July 1 ......... 92.1 91.4 89.4 90.6 92.1 90.3 90.0 90.2 92.7 91.5 90.5 89.3 91.6 90.2 91.9
1966: July 1 ......... 95.6 94.6 93.8 94.6 95.4 94.5 94.6 94.8 95.8 94.5 94.5 94.0 94.6 94.1 95.41967 : July 1 ......... 100.0 100.0 100.0 100.0 100.0 100.0 100.0 100.0 100.0 100.0 100.0 100.0 100.0 100.0 100.01968: July 1 ......... 105.1 106.8 107.3 107.7 106.4 106.8 105.7 106.8 106.2 105.1 106.5 107.2 106.1 107.0 107.31969 : July 1 ......... 113.3 115.9 118.0 116.4 114.3 115.7 114.0 117.1 113.5 111.7 114.8 116.7 116.4 115.1 114.4
1970: July 1 ......... 126.0 130.5 130.4 130.0 125.4 131.8 128.6 129.5 123.8 125.0 129.3 128.6 131.6 130.1 128.51971 : July 1 ......... 140.9 145.8 145.7 147.4 142.1 149.9 142.0 144.7 138.3 145.6 144.4 148.5 148.2 148.8 149.1
1972: July 1 ......... 150.9 152.8 154.9 156.1 151.7 160.1 151.0 152.2 149.3 152.3 152.2 159.5 156.2 157.5 159.61973: July 1 ......... 157.5 158.8 160.8 164.3 160.4 166.7 157.5 158.6 156.6 162.5 160.5 169.7 166.5 166.1 167.5
1974:: July 1 170.5 172.7 173.1. 177.6 172.9 179.6 171.8 169.9 167.0 175.3 176.1 185.6 179.8 180.2 180.71975 : July 1 182.7 186.7 189.3 191.8 189.6 193.9 184.2 184.7 183.7 187.2 190.7 202.5 193.1 192.4 193.9
1976 : Ju ly 1 195.9 199.6 202.4 203.3 * 208.4 205.3 194.1 195.8 196.6 197.9 203.3 213.0 208.4 204.5 206.9
1977: July 1 .............. 207.5 211.8 209.9 215.7 229.7 218.0 203.2 206.2 209.0 210.8 I[ 216.3 218.5 220.9 219.2 217.9
7
Digitized for FRASER http://fraser.stlouisfed.org/ Federal Reserve Bank of St. Louis

Table 3. Weekly hours indexes: United States(Indexes of union hourly wage rates in the building trades, 1907-77)
(1967=100)
Date All trades Journeymen Helpers and laborers
1907 May 15 ......................................................................................................................................................... 125.1 123.8 129.81908 May 15 ......................................................................................................................................................... 123.2 122.0 127.11909 May 15 ......................................................................................................................................................... 121.5 120.5 124.41910 May 15 ......................................................................................................................................................... 120.0 119.1 122.21911 May 15 ......................................................................................................................................................... 119.6 118.7 122.01912 May 15 ......................................................................................................................................................... 119.2 118.3 121.61913 May 15 ......................................................................................................................................................... 119.0 118.0 121.61914 May 1 ......................................................................................................................................................... 118.4 117.7 120.91915 May 1 ......................................................................................................................................................... 118.3 117.6 120.81916 May 15 ......................................................................................................................................................... 117.9 117.1 120.51917 May 15 ......................................................................................................................................................... 117.6 116.9 120.01918 May 15 ......................................................................................................................................................... 117.0 116.2 119.61919 May 15 ......................................................................................................................................................... 116.4 115.8 118.51920 May 15 ......................................................................................................................................................... 115.9 115.3 117.7
1921 May 15 ......................................................................................................................................................... 115.8 115.2 117.71922 May 1 5 ___ .................................................................................................................................................. 115.8 115.3 117.41923 May 15 ......................................................................................................................................................... 115.9 115.4 117.61924 May 15 ......................................................................................................................................................... 115.9 115.4 117.61925 May 15 ......................................................................................................................................................... 115.9 115.4 117.4
1926 May 15 ......................................................................................................................................................... 115.7 115.2 117.11927 May 15 ......................................................................................................................................................... 115.5 114.8 117.11928 May 15 ......................................................................................................................................................... 114.8 114.0 117.01929 May 15 ......................................................................................................................................................... 113.8 113.3 114.71930 May 15 ......................................................................................................................................................... 110.6 110.0 112.11931 May 15 ......................................................................................................................................................... 109.3 108.5 111.21932 May 15 ......................................................................................................................................................... 107.3 106.6 108.71933 May 15 ......................................................................................................................................................... 107.0 106.2 108.21934 May 15 ......................................................................................................................................................... 103.0 102.3 104.81935 May 15 ......................................................................................................................................................... 102.2 101.5 104.1
1936 May 15 ......................................................................................................................................................... 102.2 101.5 104.31937 May 15 ......................................................................................................................................................... 102.6 101.9 104.71938 June 1 ......................................................................................................................................................... 100.9 100.1 103.01939 June 1 ......................................................................................................................................................... 100.7 100.0 102.81940 June 1 ......................................................................................................................................................... 100.6 100.0 102.21941 June 1 ......................................................................................................................................................... 101.0 100.5 102.51942 July 1 ......................................................................................................................................................... 101.8 101.8 101.61943 July 1 ......................................................................................................................................................... 101.7 102.0 100.91944 July 1 ......................................................................................................................................................... 101.9 102.2 100.91945 July 1 ......................................................................................................................................................... 101.9 102.2 100.9
1946 July 1 ......................................................................................................................................................... 100.9 101.1 100.21947 July 1 ......................................................................................................................................................... 100.8 100.9 100.21948 July 1 ......................................................................................................................................................... 100.8 101.0 100.11949 July 1 ......................................................................................................................................................... 100.9 101.1 100.11950 July 1 ......................................................................................................................................................... 101.0 101.2 100.11951 July 1 ......................................................................................................................................................... 100.9 101.1 100.01952 July 1 ......................................................................................................................................................... 100.9 101.1 100.21953 July 1 ......................................................................................................................................................... 100.9 101.1 100.21954 July 1 ......................................................................................................................................................... 100.9 101.1 100.21955 July 1 ......................................................................................................................................................... 100.9 101.1 100.21956 July 1 ......................................................................................................................................................... 100.9 101.1 100.21957 July 1 ......................................................................................................................................................... 100.9 101.1 100.21958 July 1 ......................................................................................................................................................... 100.8 101.0 100.21959 July 1 ......................................................................................................................................................... 100.8 101.0 100.21960 July 1 ......................................................................................................................................................... 100.7 100.9 100.21961 July 1 ......................................................................................................................................................... 100.6 100.8 100.21962 July 1 ......................................................................................................................................................... 100.5 100.7 100.21963 July 1 ......................................................................................................................................................... 100.3 100.5 100.11964 July 1 ......................................................................................................................................................... 100.3 100.5 100.11965 July 1 ......................................................................................................................................................... 100.2 100.4 100.11966 July 1 ......................................................................................................................................................... 100.1 100.2 100.11967 July 1 ......................................................................................................................................................... 100.0 100.0 100.01968 July 1 ......................................................................................................................................................... 100.0 100.0 100.01969 July 1 ......................................................................................................................................................... 100.1 100.1 100.01970 July 1 ......................................................................................................................................................... 99.9 99.9 99.91971 July 1 ......................................................................................................................................................... 99.8 99.8 99.9
1972 : July 1 ......................................................................................................................................................... 99.8 99.8 99.91973: July 1 ......................................................................................................................................................... 99.6 99.8 99.01974 : July 1 ......................................................................................................................................................... 99.6 99.8 99.01975 : July 1 ......................................................................................................................................................... 99.8 100.0 99.01976 : Ju ly 1 .......................................................................................................................................................... 99.8 100.0 99.0
1977: J u ly 1 .................................................................................................................................... : .......... : • 99.8 100.0 99.0
8
Digitized for FRASER http://fraser.stlouisfed.org/ Federal Reserve Bank of St. Louis

Table 4. Weekly hours indexes by trade: United States(Indexes of union hourly wage rates in the building trades, 1907-77)(1967=100)
DateAsbestosworkers
Boilermakers
Bricklayers
Carpenters
Cementfinishers
Electricians
(insidewirers)
Elevatorcon
structorsGlaziers Lathers
Machinists
Marblesetters
Mosaicand
terrazzoworkers
Painters
Paper-hangers
Pipefitters
1907 May 1 5 ......... _ _ 124.3 121.8 122.7 128.8 _ _ _ _ 120.4 _ 127.3 _ 119.01908: May 1 5 ......... - - 121.7 120.0 121.6 127.9 - - - - 120.4 - 125.4 - 119.01909 May 1 5 ......... - - 119.1 118.5 122.5 127.0 - - - - 119.2 - 123.7 - 118.71910: May 1 5 ......... - - 116.9 117.1 122.3 126.3 - - ~ - 118.9 - 122.1 118.0
1911 May 1 5 ......... _ _ 116.5 116.5 121.1 126.1 _ _ _ _ 118.4 _ 121.2 _ 117.91912 May 1 5 ......... - - 116.5 116.4 121.1 125.7 - - 122.7 - 118.4 - 121.1 - 117.11913 May 1 5 ......... - - 116.3 116.3 119.8 125.2 - - 122.7 - 118.4 - 120.4 - 116.71914 May 1 ......... - - 115.8 115.8 119.0 124.7 118.1 - 122.7 - 118.2 - 120.2 - 115.21915 May 1 ......... - - 115.7 115.8 119.0 124.0 117.6 - 122.1 - 118.2 - 120.2 - 115.2
1916 May 1 5 ......... 113.4 _ 115.8 115.8 117.2 123.0 117.5 _ 122.1 _ 118.0 120.1 119.3 _ 114.81917 May 1 5 ......... 112.9 - 115.1 115.8 115.9 122.4 116.8 - 121.5 - 117.9 120.1 119.2 - 114.71918 May 1 5 ......... 112.3 - 115.1 114.6 115.3 121.6 116.8 114.0 121.5 - 117.9 115.7 118.7 - 113.61919 May 1 5 ......... 111.1 - 114.9 113.9 114.4 120.6 116.0 114.0 121.2 - 117.3 115.7 118.5 - 113.51920 May 1 5 ......... 111.0 - 114.8 114.0 113.8 120.3 115.9 113.5 120.4 - 117.3 115.7 115.1 - 113.4
1921 May 1 5 ......... 114.3 _ 114.8 113.9 113.8 120.3 115.8 114.0 120.1 _ 117.4 115.7 115.2 _ 113.31922: May 1 5 ......... 111.3 - 114.8 114.0 113.7 120.3 115.5 114.1 120.2 - 116.4 115.7 116.0 - 113.31923 May 1 5 ......... 111.0 - 114.8 114.4 113.7 120.3 115.6 113.5 120.7 — 117.4 115.7 115.7 - 113.31924 May 1 5 ......... 111.1 - 114.7 114.2 113.7 120.2 115.6 113.5 120.4 - 117.4 115.8 115.6 - 113.31925: May 1 5 ......... 111.1 - 114.6 114.2 113.4 120.2 115.5 113.1 120.0 - 117.4 115.7 115.9 - 113.3
1926 May 1 5 ......... 111.1 _ 114.7 114.2 113.4 120.2 115.5 113.5 119.7 _ 117.4 115.7 115.6 _ 113.11927 May 1 5 ......... 111.0 - 114.1 114.2 113.0 120.2 115.5 113.9 119.1 - 117.3 115.3 115.1 - 112.91928: May 1 5 ......... 111.0 - 114.1 113.6 112.4 119.5 115.5 113.4 118.5 - 117.3 115.3 111.9 - 112.91929 May 1 5 ......... 110.1 - 111.1 113.6 112.5 116.7 115.0 112.2 117.9 - 117.3 115.4 111.6 - 112.31930 May 1 5 ......... 106.1 - 108.4 110.1 108.1 113.9 111.4 108.6 111.3 111.1 109.1 110.4 - 107.3
1931 May 1 5 ......... 103.5 _ 106.8 108.4 106.9 112.9 109.3 106.7 110.7 _ 109.1 108.0 109.4 _ 106.21932 May 1 5 ......... 102.2 - 104.4 105.6 105.6 110.1 109.3 104.3 110.2 - 108.0 103.7 109.2 - 105.21933 May 1 5 ......... 101.1 - 105.5 104.0 107.6 110.1 106.9 104.3 109.6 - 107.9 105.2 109.0 - 104.61934 May 1 5 ......... 101.0 - 103.6 103.1 103.7 103.6 106.0 98.8 103.3 - 106.6 105.1 95.7 - 104.01935: May 1 5 ......... 100.2 103.5 102.6 103.5 99.4 105.7 98.2 103.1 - 106.6 104.4 95.5 - 103.7
1936 : May 1 5 ......... 100.5 _ 103.5 102.7 103.0 99.8 106.5 98.6 102.1 _ 106.5 103.2 95.9 _ 103.91937:: May 1 5 ......... 100.2 106.3 104.6 103.5 103.1 104.6 106.2 98.6 103.5 101.4 108.7 104.0 95.9 93.4 104.01938: June 1 ......... 98.5 101.0 101.1 100.6 100.0 104.0 101.9 96.8 101.5 100.8 106.5 101.3 96.0 92.8 98.51939 : June 1 ......... 98.5 101.0 101.2 100.6 100.0 103.7 103.0 96.6 100.7 100.7 106.5 101.3 95.7 92.9 98.91940 : June 1 ......... 97.9 101.0 100.9 100.6 100.2 103.7 102.5 96.6 100.5 100.7 101.7 101.3 96.1 93.2 98.9
1941 June 1 ......... 98.5 101.5 101.1 101.2 100.7 104.3 102.2 97.2 101.4 100.5 101.9 101.6 96.4 93.7 99.51942 July 1 ......... 98.6 101.6 102.0 101.4 100.6 108.4 101.9 98.6 103.3 100.5 101.9 101.6 101.9 100.4 101.11943 July 1 ......... 98.6 101.6 102.0 101.4 100.6 108.4 101.9 98.6 104.2 100.5 101.9 101.6 101.9 100.4 101.11944 July 1 ......... 98.6 101.6 102.0 101.7 100.6 108.4 101.9 98.6 103.8 100.5 101.9 101.6 102.2 101.2 101.11945 July 1 ......... 98.6 101.6 102.0 101.7 100.6 108.4 101.9 98.6 104.4 100.5 101.9 101.6 102.2 101.2 101.11946:: July 1 ......... 99.7 99.6 101.5 100.9 100.4 104.2 101.9 98.6 103.0 100.0 101.9 101.6 101.5 101.0 100.21947:: July 1 ......... 99.7 99.6 101.0 100.8 100.0 104.2 101.9 100.0 103.0 100.8 101.9 100.6 101.6 101.3 100.21948: July 1 ......... 100.0 101.0 101.7 100.8 100.0 104.2 101.9 100.0 98.8 100.8 102.0 102.3 101.6 101.3 100.21949:: July 1 ......... 100.0 101.0 101.3 100.8 100.0 105.9 101.9 100.0 98.8 100.8 102.0 102.3 101.6 101.3 100.21950:: July 1 ......... 100.0 101.0 101.3 100.8 100.0 105.9 101.9 100.0 101.9 100.8 102.0 102.3 101.6 101.3 100.21951:: July 1 ......... 100.0 101.0 101.4 100.8 100.0 105.9 101.9 100.0 101.9 100.8 102.0 102.3 100.4 100.1 100.21952:: July 1 ......... 100.0 101.0 101.4 100.8 100.0 104.9 101.9 100.0 100.9 100.8 102.0 102.3 100.4 100.1 100.21953:: July 1 ......... 100.0 101.0 101.4 100.8 100.0 104.9 101.9 100.0 101.0 100.8 102.0 102.3 100.4 100.1 100.21954: July 1 ......... 100.0 101.0 101.4 100.8 100.0 104.9 101.9 100.0 100.5 100.0 102.0 102.3 100.4 100.1 100.21955: July 1 ......... 100.0 101.0 101.4 100.8 100.0 104.9 101.9 100.0 100.5 100.0 102.0 102.3 100.4 100.1 100.21956:: July 1 ......... 100.0 101.0 101.4 100.8 100.0 104.9 101.9 100.0 100.5 100.0 102.0 100.3 100.4 100.1 100.21957:: July 1 ......... 100.0 100.3 101.4 100.8 100.0 104.9 101.9 100.0 100.5 100.0 102.0 100.3 100.4 100.1 100.21958:: July 1 ......... 100.0 100.3 101.3 100.8 100.0 103.4 101.9 100.0 100.5 100.0 102.0 100.3 100.4 100.1 100.21959 : July 1 ......... 100.0 100.3 101.3 100.8 100.0 103.4 101.9 100.0 100.5 99.9 102.0 100.3 100.4 100.1 100.21960: July 1 ......... 100.0 100.3 101.3 100.8 100.0 103.4 101.9 100.0 100.5 99.9 102.0 100.3 100.3 100.1 100.21961:: July 1 ......... 100.0 100.3 101.3 100.8 100.0 103.4 101.9 100.0 100.5 100.1 102.0 100.3 100.2 100.1 100.21962 : July 1 ......... 100.0 100.3 101.3 100.8 100.0 102.1 101.9 100.0 100.5 100.1 102.1 100.3 100.2 100.1 100.21963: July 1 ......... 100.0 100.1 100.0 100.8 100.0 100.9 100.0 100.0 100.5 100.0 102.0 100.3 100.2 100.1 100.21964: July 1 ......... 100.0 100.1 100.0 100.8 100.0 100.9 100.0 100.0 100.5 100.0 102.0 100.3 100.2 100.1 100.21965: July 1 ......... 100.0 100.2 100.0 100.6 100.0 100.3 100.0 100.0 100.5 100.0 102.0 100.3 100.2 100.1 100.11966: July 1 .......... 100.0 100.0 100.0 100.3 100.0 100.1 100.0 100.0 100.3 100.0 101.0 100.1 100.1 100.0 100.01967: July 1 ......... 100.0 100.0 100.0 100.0 100.0 100.0 100.0 100.0 100.0 100.0 100.0 100.0 100.0 100.0 100.01968 : July 1 ......... 100.0 100.0 100.0 100.0 100.0 99.8 100.0 100.0 100.6 100.0 100.0 100.0 100.0 100.0 100.01969 : July 1 ......... 99.7 100.0 100.0 100.0 100.0 100.8 100.0 100.0 100.4 100.0 100.0 100.0 100.0 100.0 99.71970: July 1 ......... 99.7 100.0 99.9 99.9 100.0 100.7 100.0 100.0 100.0 100.0 100.0 100.0 100.0 100.0 98.91971:: July 1 ......... 99.7 100.0 99.8 99.9 100.0 100.7 100.0 100.0 100.0 100.0 100.0 99.9 100.0 100.0 98.8
1972 : July 1 ......... 99.5 100.0 99.8 99.9 100.0 100.7 100.0 100.0 100.0 100.0 100.0 99.9 100.0 100.0 98.81973: July 1 ......... 99.5 100.0 99.8 99.9 100.0 100.7 99.4 100.0 100.0 100.0 100.0 99.7 100.4 102.0 98.81974: July 1 99.5 100.0 99.8 99.9 100.0 100.7 99.4 100.0 100.0 100.0 100.0 99.7 100.3 101.8 98.8
1975: July 1 ___ 99.5 100.0 99.8 99.9 100.0 102.6 99.4 100.0 100.0 100.0 100.0 99.7 100.3 101.8 98.7
1976 : Ju ly 1 ------ 99.5 100.0 99.8 100.0 100.0 102.6 99.4 100.0- 100.0 100.0 100.0 99.7 100.3 101.8 98.7
1977 : J u ly 1 ......... 99.5 100 .0 99.8 100.0 100.0 102 .5 99.4 99.8 100.0 100.0 100.0 99.7 100.3 101.8 98.6
9Digitized for FRASER http://fraser.stlouisfed.org/ Federal Reserve Bank of St. Louis

Table 4. Weekly hours indexes by trade: United States—Continued(Indexes of union hourly wage rates in the building trades, 1907-77)
(1967=100)
DatePlas
terersPlumb
ers
Reinforcing
ironw ork
ers
Roofers,compo
sition
Roofers,slateandtile
Sheetmetal
workers
Stonemasons
Structural-iron
workers
Tilelayers
Bricklayers'tenders
Buildinglaborers
Composition
roofers'helpers
Plasterers'
laborers
Plumbers'
laborers
Tilelayers'helpers
1907: May 1 5 ......... 119.3 123.4 _ _ _ 118.0 118.3 120.0 _ 123.6 125.2 126.01908: May 1 5 ......... 118.7 123.5 - - - 117.9 118.3 117.6 - 123.6 125.2 - 125.5 - _1909: May 1 5 ......... 118.7 123.5 - - - 117.9 118.3 116.0 - 123.2 124.8 - 125.2 - _1910: May 1 5 ......... 118.6 123.3 - - - 117.9 116.5 114.7 - 122.2 121.8 - 125.2 - -
1911: May 1 5 ......... 119.3 123.0 _ _ _ 117.6 115.7 114.5 _ 121.6 121.8 _ 125.11912: May 1 5 ......... 117.8 122.0 - - - 116.1 115.7 113.4 110.7 120.6 121.8 - 124.4 _ 125.71913: May 1 5 ......... 117.8 122.0 - - - 115.9 115.6 1T2.9 113.1 120.6 121.8 - 124.4 - 125.11914: May 1 ......... 117.7 121.5 - 115.2 112.4 115.8 115.6 112.7 113.1 119.1 121.4 - 124.5 - 125.11915: May 1 ......... 117.1 121.5 - 115.2 112.4 115.6 115.5 112.7 112.7 119.1 121.4 - 124.5 - 123.2
1916: May 1 5 ......... 115.9 120.9 _ 115.2 112.0 115.1 115.3 112.4 112.1 119.1 120.8 _ 123.3 122.81917: May 1 5 ......... 115.8 120.8 - 114.4 110.0 115.0 115.2 112.2 111.8 119.0 119.4 - 123.1 _ 121.81918: May 1 5 ......... 115.6 119.8 - 113.9 110.0 113.8 115.2 111.8 111.8 119.0 118.9 - 123.1 - 121.81919: • May 1 5 ......... 115.6 119.4 - 113.9 109.7 113.3 114.5 111.6 111.3 118.6 116.7 _ 122.6 - 121.41920: May 1 5 ......... 115.3 119.4 113.9 109.7 112.9 114.5 111.6 111.0 118.3 115.4 - 122.6 - 121.4
1921: May 1 5 ......... 115.0 119.3 _ 111.7 109.6 112.9 114.6 111.6 111.1 118.3 115.4 _ 122.1 _ 121.61922: May 1 5 ......... 115.1 119.3 - 111.7 109.5 112.8 114.5 111.6 110.9 118.6 114.6 _ 122.1 _ 121.61923: May 1 5 ......... 115.7 119.3 - 111.7 109.8 112.8 114.5 111.6 111.2 118.6 115.4 - 122.2 - 122.71924: May 1 5 ......... 115.7 119.3 - 111.7 109.4 112.8 114.2 111.6 111.2 118.5 115.1 - 122.1 _ 122.71925: May 1 5 ......... 114.5 119.3 - 111.7 109.4 112.8 114.2 111.3 111.2 118.3 115.2 - 122.0 - 122.7
1926: May 1 5 ......... 112.0 119.3 _ 111.7 109.4 112.8 114.4 111.6 111.2 118.5 115.4 _ 118.0 _ 122.71927: May 1 5 ......... 115.0 119.0 - 111.7 109.4 112.4 114.2 111.6 111.1 118.5 115.6 _ 117.9 _ 122.71928: May 1 5 ......... 110.6 119.0 - 111.6 109.4 112.1 114.1 111.5 110.8 118.5 115.5 - 118.2 _ 122.71929: May 1 5 ......... 109.5 118.0 - 111.0 108.1 112.0 110.8 111.0 110.6 111.9 115.4 _ 118.1 _ 122.11930: May 1 5 ......... 107.1 112.5 - 106.6 103.4 107.9 106.9 107.6 104.9 112.0 113.3 - 115.0 - 114.2
1931: May 1 5 ......... 106.2 111.0 _ 105.3 101.7 106.0 105.0 106.3 103.5 110.6 111.9 _ 114.1 _ 113.01932: May 1 5 ......... 104.4 110.6 - 104.2 101.7 104.5 104.6 103.7 102.4 108.2 108.0 _ 113.8 - 111.61933: May 1 5 ......... 106.5 110.1 - 105.5 101.7 104.4 103.8 103.4 102.2 107.6 107.6 _ 111.9 _ 111.71934: May 1 5 ......... 101.9 109.0 - 102.8 101.3 102.9 103.3 101.9 95.3 105.6 102.9 _ 108.5 _ 107.01935: May 1 5 ......... 100.4 108.2 - 102.7 100.0 103.0 103.2 100.7 95.3 105.5 102.8 - 107.2 - 93.1
1936: May 1 5 ......... 98.7 106.8 _ 103.3 100.9 102.9 103.2 100.6 95.2 105.3 103.3 _ ■ 105.4 _ 93.11937: May 1 5 ......... 98.8 107.4 100.3 103.4 100.8 103.0 103.2 100.1 99.3 105.6 103.6 99.9 105.4 _ 99.61938: June 1 ......... 94.8 102.1 100.3 101.6 99.6 100.9 99.8 99.0 99.3 104.3 103.1 99.9 100.5 103.2 99.61939: June 1 ......... 94.8 102.4 100.2 101.7 99.6 100.9 99.8 98.9 99.3 104.0 103.0 99.9 100.2 103.2 99.61940: June 1 ......... 94.6 101.3 100.2 101.3 99.5 100.9 99.7 98.9 99.3 103.9 102.4 99.6 99.8 100.0 99.6
1941: June 1 ......... 94.9 101.7 101.1 102.0 99.5 101.7 99.8 99.3 99.7 103.8 102.7 100.2 100.2 100.0 100.01942: July 1 ......... 96.7 102.3 101.1 102.1 100.9 101.8 100.0 100.0 101.0 102.6 101.7 100.5 100.3 99.7 100.01943: July 1 ......... 100.5 104.2 101.2 102.0 100.7 101.8 100.0 100.0 100.0 102.4 100.3 100.0 100.9 103.0 100.01944: July 1 ......... 100.6 104.2 101.2 101.9 100.7 101.8 100.0 100.0 100.0 102.4 100.3 100.0 100.9 102.9 100.01945: July 1 ......... 100.6 104.2 101.2 101.9 100.7 101.8 100.0 100.0 100.0 102.4 100.3 100.0 100.9 102.9 100.01946: July 1 ......... 98.6 100.6 100.6 101.6 100.7 101.7 99.8 100.0 100.0 100.8 100.1 100.0 100.2 100.0 100.01947: July 1 ......... 97.6 99.6 100.0 101.6 100.7 101.0 99.1 100.0 100.0 100.3 101.1 100.0 99.4 100.0 100.01948: July 1 ......... 97.5 99.9 100.0 101.6 100.7 101.0 100.8 100.0 100.0 100.3. 100.1 100.0 98.1 100.0 100.01949: July 1 ......... 98.1 99.9 100.0 100.4 100.7 100.8 100.6 100.0 100.0 100.3 100.1 100.0 98.1 100.0 100.01950: July 1 ......... 100.4 100.6 100.0 100.4 100.7 100.8 100.6 100.0 100.0 100.3 100.1 100.0 98.1 100.0 100.01951: July 1 ......... 100.4 100.6 100.0 100.4 100.7 100.8 100.7 100.0 100.0 100.1 99.9 100.0 99.3 100.0 100.01952: July 1 ......... 100.4 100.6 100.0 100.4 100.7 100.8 100.7 100.0 100.0 101.2 100.0 100.0 99.8 100.0 100.01953: July 1 ......... 100.4 100.6 100.0 100.4 100.7 100.8 100.7 100.0 100.0 101.2 100.0 100.0 99.8 100.0 100.01954: July 1 ......... 100.4 100.6 100.0 100.4 100.7 100.8 100.7 100.0 100.0 101.2 100.0 100.0 99.9 100.0 100.01955: July 1 ......... 100.4 100.6 100.0 100.4 100.7 100.8 100.7 100.0 100.0 101.2 100.0 100.0 100.2 100.0 100.01956: July 1 ......... 100.4 100.6 100.0 100.4 100.7 100.8 100.7 100.0 100.0 100.1 100.0 100.0 100.2 100.0 100.01957: July 1 ......... 100.4 100.6 100.0 100.4 100.7 100.8 100.7 100.0 100.0 100.1 100.0 100.0 100.2 100.0 100.01958: July 1 ......... 100.4 100.6 100.0 100.4 100.7 100.8 100.5 100.0 100.0 100.1 100.0 100.0 100.2 100.0 100.01959: July 1 ......... 100.6 100.6 100.0 100.4 100.7 100.8 100.5 100.0 100.0 100.1 100.0 100.0 100.2 100.0 100.01960: July 1 ......... 100.4 100.6 100.0 100.4 100.7 100.8 100.5 100.0 100.0 100.1 100.0 100.0 100.2 100.0 100.01961: July 1 ......... 100.4 100.6 100.0 100.4 100.7 100.8 100.5 100.0 100.0 100.1 100.0 100.0 100.2 100.0 100.01962: July 1 ......... 100.4 100.6 100.0 100.4 100.7 100.8 100.5 100.0 100.0 100.1 100.0 100.0 100.2 100.0 100.01963: July 1 ......... 100.4 100.6 100.0 100.4 100.5 100.8 100.4 100.0 100.0 100.0 100.0 100.0 100.0 100.0 100.01964: July 1 ......... 100.4 100.6 100.0 100.4 100.4 100.8 100.4 100.0 100.0 100.0 100.0 100.0 100.0 100.0 100.01965: July 1 ......... 100.4 100.2 100.0 100.4 100.3 100.7 100.2 100.0 100.0 100.0 100.0 100.0 100.0 100.0 100.01966: July 1 ......... 100.2 100.1 100.0 100.4 100.3 100.3 100.0 100.0 100.0 100.0 100.0 100.0 100.0 100.0 100.01967: July 1 ......... 100.0 100.0 100.0 100.0 100.0 100.0 100.0 100.0 100.0 100.0 100.0 100.0 100.0 100.0 100.01968: July 1 ......... 100.1 100.0 100.0 99.6 99.7 100.0 100.0 100.0 100.0 100.1 100.0 100.0 100.2 100.0 100.11969: July 1 ......... 100.1 99.9 100.0 99.5 99.7 100.0 100.0 100.0 100.0 100.1 100.0 100.0 100.2 100.0 100.11970: July 1 ......... 99.9 98.7 100.0 99.4 99.6 100.0 100.0 100.0 100.0 100.1 100.0 100.0 100.3 100.0 99.81971: July 1 ......... 99.9 98.3 100.0 99.4 99.6 99.9 99.6 100.0 99.9 100.1 100.0 100.0 100.3 100.0 99.8
1972: July 1 ......... 99.9 98.3 100.0 99.4 99.6 99.9 99.6 100.0 99.9 100.1 100.0 100.0 100.3 100.0 99.81973: July 1 ......... 100.5 97.7 100.0 99.4 99.6 99.9 99.6 100.0 99.9 99.0 99.2 100.0 98.5 100.0 99.81974: July 1 ___ 100.5 98~3 100.0 99.7 99.6 99.9 99.6 100.0 99.9 99.0 99.2 100.0 98.9 100.0 99.81975: July 1 . . . . 100.5 98.3 100.0 99.5 99.6 99.9 99.6 100.0 99.9 99.0 99.2 100.0 98.9 100.0 99.81976: Ju ly 1 . . . . 100.5 98.3 100.0 I 99.5 99.6 99.8 99.6 100.0 99.9 99.0 99.2 100.0 98.9 100.0 99.81977: July 1 100.5 98.3 100.0 99.5 99.6 99.8 99.6 100.0 99.9 99.0 99.2 100.0 98.9 100.0 99.8
10Digitized for FRASER http://fraser.stlouisfed.org/ Federal Reserve Bank of St. Louis

Table 5. Average wage rates and employer contributions for Table 6. Cents-per-hour and percent changes inselected benefits by trade: United States average wage rates by trade: United States
(Average union hourly wage rates and employer contributions1 in the building (Changes in union hourly wage rates in the building trades,trades, July 1, 1977) July 1, 1976-July 1, 1977)
Trade Average rate per hour
Average employer
contribution per hour1
Average rate plus employer contribution per hour1
All building trades.............. $10.02 $2.18 $12.20
Journeymen........................... 10.44 2.28 12.73Asbestos workers................. 10.29 2.43 12.73Boilermakers........................ 10.89 2.13 13.02Bricklayers.......................... 10.39 2.07 12.46Carpenters.......................... 10.25 2.25 12.50Cement finishers.................. 9.92 2.28 12.20Drywall tapers..................... 9.70 1.09 10.78Electricians (inside wirers)..... 11.02 2.36 13.38Elevator constructors.... ....... 11.22 1.75 12.97Glaziers.............................. 9.77 1.85 11.63Lathers............................... 10.26 1.73 11.99Machinists........................... 10.60 1.04 11.64Marble setters..................... 10.03 2.01 12.03Mosaic and terrazzo workers .. 9.80 1.60 11.39Painters.............................. 9.87 1.65 11.52Paperhangers...................... 9.78 1.47 11.25Pipefitters............................ 11.15 2.80 13.95Plasterers............................ 10.08 1.89 11.97Plumbers.................... ......... 10.75 2.64 13.39Reinforcing iron workers....... 10.07 2.57 12.63Roofers, composition........... 9.98 1.84 11.82Roofers, slate and tile ........... 9.93 1.82 11.75Sheet-metal workers............ 10.61 2.39 13.00Stonemasons ...................... 10.33 2.16 12.49Structural-iron workers.......... 10.41 2.86 13.28Tile layers........................... 9.84 1.94 11.78
Helpers and laborers.... ......... 8.03 1.71 9.74Bricklayers’ tenders.............. 8.33 1.55 9.88Building laborers.................. 7.96 1.79 9.75Composition roofers’ helpers .. 6.41 1.35 7.76Elevator constructors’ helpers 7.93 1.52 9.45Marble setters’ helpers......... 8.43 1.51 9.94Plasterers’ laborers............... 8.25 1.66 9.91Plumbers’ laborers................ 7.64 1.18 8.82Terrazzo workers’ laborers.... 8.39 1.28 9.67Tile layers' helpers............... 8.58 1.61 10.20
TradeAmount of change
Cents per hour Percent
All building trades.............. 56 5.9
Journeymen........................... 58 5.8Asbestos workers................ 66 6.8Boilermakers........................ 78 7.7Bricklayers.......................... 51 5.2Carpenters.......................... 51 5.3Cement finishers.................. 48 5.1Drywall tapers ..................... 58 6.4Electricians (inside wirers)..... 68 6.6Elevator constructors........... 67 6.4Glaziers.............................. 56 6.0Lathers............................... 60 6.2Machinists........................... 66 6.6Marble setters..................... 59 6.2Mosaic and terrazzo workers .. 54 5.8Painters............................... 58 6.2Paperhangers...................... 58 6.3Pipefitters............ ............... 71 6.8Plasterers............................ 56 5.9Plumbers............................. 62 6.1Reinforcing iron workers....... 36 3.7Roofers, composition............ 57 6.1Roofers, slate and tile ........... 92 10.2Sheet-metal workers ............ 62 6.2Stonemasons ...................... 46 4.7Structural-iron workers.......... 52 5.3Tile layers........................... 58 6.3
Helpers and laborers.............. 48 6.4Bricklayers’ tenders.............. 51 6.5Building laborers.................. 48 6.4Composition roofers’ helpers .. 16 2.6Elevator constructors’ helpers 46 6.2Marble setters’ helpers......... 32 3.9Plasterers’ laborers............... 47 6.0Plumbers’ laborers................ 51 7.2Terrazzo workers’ laborers.... 45 5.6Tile layers’ helpers............... 44 5.3
1 Includes employer contributions to insurance (life insurance, hospitalization, medical, surgical, and other similar types of health and welfare programs) and pension funds and vacation payments to a fund or to the workers as provided in labor-management contracts. Averages presented are for a straight-time hour; in actual practice, however, some employer payments are calculated for total hours worked or gross payroll.
Average refers to all workers in the classification, including those for whom employer contributions were not specified in their particular contracts. Such situations were included in the average computation as zero contributions.
Some contracts also provide additional payments to other funds such as apprenticeship and unemployment benefits. Information on payments to these funds was not collected.
NOTE: Variations in the size of annual increases from survey to survey may reflect, in part, timing of negotiations in relation to the July 1 survey reference date. Increases indicated reflect rates available and payable on the survey date, and do not include increases made later that are retroactive to July 1 or before. Such retroactive increases are included in the wage rates reported in the following year’s survey.
NOTE: Because of rounding, sums of individual items may not equal totals.
11Digitized for FRASER http://fraser.stlouisfed.org/ Federal Reserve Bank of St. Louis

(Cents-per-hour changes in union hourly wage rates and percent of building tradesworkers affected, July 1, 1976-July 1, 1977)
Table 7. Cents-per-hour changes in wage rates by trade: United States
Trade
Percentof
workersaffected
bychange
Percentof
workershaving
nochange
Percent of workers affected by change of—
Under$0.20
$0.20and
under$0.30
$0.30
$0.40
$0.40
$0.50
$0.50
$0.60
$0.60
$0.70
$0.70
$0.80
$0.80
$0.90
$0.90
$1.00
$1.00
$1.20
$1.20
$1.40
$1.40
$1.60
$1.60andover
All building trades.............. 90.4 9.6 3.9 6.5 7.3 9.7 17.0 13.3 9.0 8.9 3.7 6.6 1.5 1.3 1.0
Journeymen........................... 90.6 9.4 3.2 6.3 6.9 8.8 16.5 14.4 8.6 9.2 4.2 7.6 1.7 1.2 1.2Asbestos workers ................. 93.9 6.1 11.5 1.3 5.5 3.8 18.8 13.8 8.1 7.5 3.3 15.5 1.4 .4 2.9Boilermakers........................ 98.6 1.4 - 4.9 4.8 - 19.7 4.4 8.0 18.6 8.0 26.4 2.8 - .9Bricklayers.......................... 90.6 9.4 2.5 8.3 15.0 6.8 10.4 18.7 5.8 11.8 1.1 7.1 - .9 -Carpenters.......................... 88.8 11.2 3.6 6.9 6.2 10.7 20.8 13.4 4.1 12.7 3.6 2.3 .4 2.7 _Cement finishers.................. 85.7 14.3 6.6 7.4 .7 16.0 12.7 18.2 10.0 4.7 2.8 3.6 2.6 _ _Drywall tapers ..................... 99.6 .4 - 3.9 1.2 2.5 63.7 6.6 .8 15.1 - 5.8 _ - _Electricians (inside wirers)..... 86.5 13.5 .4 9.3 4.1 3.5 5.5 23.3 5.9 4.2 3.2 20.3 2.0 _ 4.8Elevator constructors............ 94.1 5.9 1.3 6.1 11.3 6.7 22.6 2.8 10.6 9.0 4.2 10.0 5.7 3.9 -Glaziers.............................. 89.0 11.0 3.6 7.4 .9 9.4 17.5 19.5 7.0 7.5 5.7 9.8 _ _ .7Lathers............................... 89.7 10.3 1.8 .9 17.5 5.2 8.5 19.5 8.9 10.3 4.5 4.1 2.3 .8 4.8Machinists........................... 87.7 12.3 - 3.4 - 16.3 13.8 - 24.6 - _ 27.1 2.5 _ _Marble setters..................... 86.2 13.8 12.7 2.7 1.0 12.4 5.8 4.0 18.0 4.0 2.7 22.0 _ 1.0 _Mosaic and terrazzo workers .. 80.4 19.6 12.9 2.5 7.0 3.1 3.6 7.3 18.1 1.7 3.2 16.1 1.7 3.1 _Painters.............................. 98.3 1.7 0 5.9 5.2 10.5 28.2 23.6 11.6 6.2 1.3 5.7 - _ 0Paperhangers...................... 96.7 3.3 - 8.5 5.0 6.7 24.0 18.3 20.2 2.6 1.2 10.2 -Pipefitters............................ 99.2 .8 2.8 3.1 2.4 14.3 9.8 6.4 22.3 4.4 16.5 10.8 4.9 .4 .3Plasterers............................ 89.6 10.4 5.2 7.2 5.0 10.2 12.8 12.2 8.1 4.3 _ 13.8 _ 1.4 5.1Plumbers............................. 94.0 6.0 4.1 5.1 3.8 2.8 21.1 10.4 23.7 9.1 3.3 5.3 4.0 _ .8Reinforcing iron workers....... 68.8 31.2 - 9.1 17.3 5.2 12.2 12.3 3.3 2.6 1.2 3.8 .9 _ .3Roofers, composition ........... 96.0 4.0 1.6 .4 17.6 16.1 14.9 9.5 9.9 13.1 4.1 3.8 2.1 1.0 .7Roofers, slate and tile ........... 97.8 2.2 1.1 2.6 - 2.9 23.0 7.6 8.5 28.7 .9 1.5 1.9 _ 18.4Sheet-metal workers............ 95.7 4.3 6.1 3.0 14.0 11.8 11.9 9.6 6.9 11.6 2.2 10.3 3.3 2.1 2.3Stonemasons ...................... 82.0 18.0 .4 3.9 6.3 24.7 14.7 10.8 6.3 6.9 _ 4.2 - 2.2 _Structural-iron workers.......... 85.9 14.1 7.2 8.5 5.8 6.1 15.1 16.0 2.9 8.5 9.1 .6 4.0 _ 2.0Tile layers ........................... 94.0 6.0 10.1 5.8 5.1 18.1 15.1 5.8 14.7 .5 4.0 7.6 - 4.0 3.1
Helpers and laborers .............. 89.1 10.9 7.1 7.4 9.5 14.0 19.3 7.7 10.9 7.6 1.6 1.9 .3 1.7 .1Bricklayers’ tenders.............. 97.5 2.5 3.4 7.9 8.1 32.7 22.1 4.7 3.7 10.0 _ .4 1.6 3.0 _Building laborers.................. 87.0 13.0 6.9 7.7 9.3 10.1 19.0 7.3 13.4 7.9 1.7 2.2 - 1.5 _Composition roofers’ helpers .. 82.5 17.5 20.4 9.2 14.0 6.3 3.5 3.9 1.4 5.6 - _ - - -Elevator constructors’ helpers 94.6 5.4 16.0 3.2 19.2 11.9 17.0 8.2 6.1 5.4 3.9 3.6 _ _ _Marble setters’ helpers......... 72.5 27.5 14.3 12.0 2.1 9.8 3.6 13.6 6.3 4.2 _ _ _ _ 1.9Plasterers’ laborers............... 92.3 7.7 16.4 9.4 4.9 10.4 17.8 13.5 6.8 3.3 4.8 3.4 _ 1.6 _Plumbers’ laborers................ 94.8 5.2 5.3 1.2 6.5 31.3 20.0 19.4 5.0 _ _ - - 6.0 _Terrazzo workers’ laborers.... 84.5 15.5 2.1 .4 22.9 9.0 9.3 26.8 5.1 3.1 1.7 1.0 .6 1.1 .4Tile layers’ helpers............... 87.4 12.6 9.7 5.7 12.1 6.6 28.0 7.8 7.8 4.1 2.0 - - - 2.1
1 Less than 0.05 percent.
NOTE: Because of rounding, sums of individual items may not
equal totals. Dash indicates no changes reported for specified interval.
12Digitized for FRASER http://fraser.stlouisfed.org/ Federal Reserve Bank of St. Louis

(Percent change in union hourly wage rates and percent of building tradesworkers affected, July 1, 1976-July 1, 1977)
Table 8. Percent change in wage rates by trade: United States
Trade
Percentof
workersaffected
bychange
Percentof
workershaving
nochange
Percent of workers affected by change of-
Lessthan
2percent
2and
under3
3
4
4
5
5
6
6
7
7
8
8
10
10
12
12
14
14
16
16
18
18
20
20andover
All building trades.............. 90.4 9.6 3.9 5.0 8.9 11.6 11.0 13.0 10.3 13.9 6.4 2.2 1.4 1.1 0.4 0.6
Journeymen........................... 90.6 9.4 3.4 5.9 8.8 12.1 12.3 11.8 10.6 14.3 5.5 2.1 1.2 1.1 O .7Asbestos workers................ 93.9 6.1 11.5 1.3 3.2 8.3 17.9 12.4 7.9 9.5 9.2 6.0 3.2 .4 - 2.9Boilermakers........................ 98.6 1.4 - 4.9 4.8 .3 23.2 2.1 18.2 22.9 21.2 - .7 - - .3Bricklayers.......................... 90.6 9.4 2.5 5.3 20.8 5.9 12.6 13.6 13.6 7.2 2.5 3.5 - .9 - -Carpenters.......................... 88.8 11.2 3.5 6.6 9.6 19.0 4.6 11.4 10.3 15.4 3.9 .1 1.1 1.9 - -Cement finishers.................. 85.7 14.3 6.6 6.9 1.2 14.0 14.4 15.2 10.9 7.9 5.6 - 2.6 - - -Drywall tapers..................... 99.6 .4 - 3.9 .1 3.7 53.5 15.3 2.0 14.1 7.1 - - - - -Electricians (inside wirers)..... 86.5 13.5 .4 9.2 3.6 3.9 17.5 13.8 4.6 16.0 10.7 2.0 - 1.1 - 3.7Elevator constructors........... 94.1 5.9 4.2 3.2 13.1 10.3 13.2 12.4 9.1 13.8 6.6 5.6 - 2.6 - -Glaziers.............................. 89.0 11.0 3.6 7.4 .9 7.1 14.8 16.6 9.2 17.9 6.9 3.8 - .7 - -Lathers............................... 89.7 10.3 1.8 .9 17.5 5.2 17.8 7.0 10.0 17.4 3.5 2.3 - - 3.2 2.3Machinists........................... 87.7 12.3 3.4 - - 16.3 13.8 - - 47.2 2.2 2.5 2.3 - - -Marble setters..................... 86.2 13.8 12.7 .8 6.1 3.6 11.6 4.6 14.5 5.6 8.4 17.1 - 1.0 - -Mosaic and terrazzo workers .. 80.4 19.6 12.9 2.5 6.9 1.0 6.3 17.3 3.0 6.4 15.3 4.5 - 4.3 - -Painters.............................. 98.3 1.7 1.3 3.8 6.3 8.7 26.2 14.5 17.8 13.8 4.7 1.3 - (1) - -Paperhangers...................... 96.7 3.3 - 4.4 8.7 4.7 27.1 14.7 10.0 22.6 2.7 1.8 - - - -Pipefitters............................ 99.2 .8 2.8 4.1 13.3 8.5 5.8 15.9 13.7 19.8 5.2 4.5 4.5 .1 - .3Plasterers............................ 89.6 10.4 5.2 7.2 5.0 8.5 13.5 12.3 5.2 16.2 4.9 .8 1.4 3.1 - 2.0Plumbers............................. 94.0 6.0 4.0 5.8 4.0 10.8 17.0 13.9 17.4 12.3 2.6 4.9 - - - .8Reinforcing iron workers....... 68.8 31.2 .9 7.5 8.4 21.6 7.4 8.4 5.1 1.4 6.3 - .9 - .3 -Roofers, composition ........... 96.0 4.0 1.6 6.9 10.6 11.0 14.5 14.6 6.5 22.1 1.8 3.5 1.0 - - 2 1Roofers, slate and tile ........... 97.8 2.2 1.1 .7 - 2.9 10.7 16.4 7.1 34.2 3.9 1.9 - - - i8.4Sheet-metal workers............ 95.7 4.3 6.1 3.0 16.5 11.9 11.3 5.3 11.6 11.5 6.9 6.6 2.1 1.9 - .4Stonemasons ...................... 82.0 18.0 .4 2.3 18.6 18.1 16.2 5.2 6.8 6.4 3.2 1.0 - 2.2 - -Structural-iron workers.......... 85.9 14.1 8.6 6.5 6.2 14.3 13.8 7.7 4.5 16.0 2.2 - 4.0 2.0 - -
Tile layers........................... 94.0 6.0 10.1 4.8 4.0 14.0 23.0 5.4 4.9 14.8 4.8 1.0 - 4.0 - 3.1
Helpers and laborers.............. 89.1 10.9 6.2 1.1 9.3 9.4 5.1 18.5 8.9 12.1 10.6 2.7 2.3 .8 1.9 .1Bricklayers’ tenders.............. 97.5 2.5 2.6 1.5 7.9 32.4 1.5 12.7 15.7 3.3 14.6 .6 .3 - 4.3 -Building laborers.................. 87.0 13.0 6.3 .7 10.2 4.7 4.8 19.6 7.7 14.4 10.6 2.9 2.7 1.1 1.5 -
Composition roofers’ helpers .. 82.5 17.5 16.9 3.5 - - 20.4 3.5 5.9 8.7 3.9 1.4 - - - -Elevator constructors’ helpers 94.6 5.4 14.8 2.3 2.1 12.7 13.7 10.5 13.5 12.1 6.9 4.1 - 1.9 - -Marble setters’ helpers......... 72.5 27.5 1.6 12.7 13.7 6.7 2.0 14.2 3.2 5.3 4.4 2.0 - - - 1.9Plasterers’ laborers............... 92.3 7.7 15.6 .8 9.9 7.1 7.2 13.8 1.9 14.0 5.3 8.0 6.9 - 1.6 -Plumbers’ laborers................ 94.8 5.2 4.4 .9 1.2 3.0 10.3 38.0 18.0 5.6 4.1 3.2 - - 6.0 -Terrazzo workers’ laborers.. . 84.5 15.5 2.1 .1 10.8 13.8 3.9 26.6 2.3 6.0 13.1 1.0 2.7 - .6 .4Tile layers’ helpers............... 87.4 12.6 3.0 7.6 6.2 10.7 18.1 18.7 3.8 6.3 5.4 2.0 2.0 - - 2.1
1 Less than 0.05 percent. NOTE: Because of rounding, sums of individual items may not equal2 18.4 percent of workers were affected by change of between 23 to totals. Dash indicates no changes reported for specified interval.
26 percent.
13Digitized for FRASER http://fraser.stlouisfed.org/ Federal Reserve Bank of St. Louis

Table 9. Wage rate distribution by trade: United States
(Percent distribution of building tradesworkers by union hourly wage rates, July 1, 1977)
Percent of journeymen whose rates per hour were—
Tradeaverage rate per
hour Under$7.40
$7.40
$7.80
$7.80
$8.20
$8.20
$8.60
$8.60
$9.00
$9.00
$9.40
$9.40
$9.80
$9.80
$10.20
$10.20
$10.60
$10.60
$11.00
$11.00
$11.40
$11.40
$11.80
$11.80
$12.20
$12.20andover
Journeymen........................... $10.44 0.8 1.1 0.6 1.3 4.1 5.3 13.5 15.3 12.0 12.2 14.0 11.0 3.8 5.0Asbestos workers................ 10.29 - - - 1.5 2.7 9.7 22.3 13.9 9.0 16.9 13.3 5.6 3.3 1.9Boilermakers........................ 10.89 - - - - - 8.2 5.6 23.3 14.4 1.5 12.2 19.1 .4 1 15.2Bricklayers.......................... 10.39 .1 - - 4.8 2.6 5.8 5.4 S 18.0 17.1 18.1 18.1 7.2 1.7 1.1Carpenters.......................... 10.25 .1 2.2 .5 .7 5.1 4.7 21.8 16.2 10.2 4.5 17.6 14.5 1.8 .2Cement finishers.................. 9.92 .2 1.4 1.6 2.4 4.6 11.9 20.4 20.0 25.1 5.5 2.5 1.7 - 2.7Drywall tapers ..................... 9.70 - - 1.0 4.3 1.0 2.8 58.1 11.3 9.1 11.1 .4 .8 -
Electricians ......................... 11.02 .2 - - .6 3.9 1.8 3.5 13.3 10.2 14.7 14.5 19.9 2.9 2 14.6Elevator constructors............ 11.22 - - - - 1.8 2.8 6.0 12.0 4.3 10.9 21.3 14.3 4.5 3 22.1Glaziers.............................. 9.77 .9 2.1 2.0 7.0 9.6 6.4 22.8 14.9 16.2 11.9 5.3 - - .9Lathers............................... 10.26 - - .7 8.0 2.8 1.7 12.3 20.7 21.9 6.9 5.9 17.8 1.3 ...Machinists........................... 10.60 - - - - 27.0 - 1.5 18.2 2.3 10.0 3.8 14.5 - 4 22.6Marble setters..................... 10.03 2.3 1.3 2.3 1.8 1.4 16.0 8.6 18.3 5.3 29.0 10.9 .6 .6 1.6Mosaic and terrazzo workers .. 9.80 1.1 1.4 11.9 1.4 - 18.9 7.5 16.4 6.6 22.4 .2 11.3 .8 ...
Painters.............................. 9.87 1.4 3.4 1.3 2.8 5.2 15.7 21.1 17.1 6.2 7.0 14.0 4.4 .6 .1Paperhangers...................... 9.78 - 3.2 4.5 2.7 8.2 18.6 20.7 13.3 5.8 6.7 .5 10.6 5.2 -Pipefitters............................ 11.15 - - .1 - .5 .6 3.2 12.7 15.0 16.9 15.4 4.6 14.3 5 16.8Plasterers............................ 10.08 .9 - .5 1.8 6.8 14.8 15.1 19.8 14.6 3.9 6.6 9.0 3.1 2.9Plumbers............................. 10.75 .1 - .4 - 6.9 .6 4.7 22.6 12.5 12.2 11.5 12.0 1.0 6 15.5Reinforcing iron workers....... 10.07 11.1 - .7 .3 2.7 7.6 10.8 6.3 13.0 19.0 21.4 6.3 - .9Roofers, composition ............ 9.98 4.8 .7 4.9 3.2 5.2 6.1 12.7 12.3 11.7 16.1 10.3 8.5 3.6Roofers, slate and tile ........... 9.93 3.8 .5 1.5 1.4 3.4 13.6 17.5 12.4 17.6 15.7 1.4 10.4 .7Sheet-metal workers............ 10.61 O 1.3 .1 1.7 1.9 2.4 11.3 12.9 16.7 19.4 10.7 2.3 18.9 .4Stonemasons ...................... 10.33 - - 2.0 .9 11.1 8.0 13.1 18.6 31.5 9.4 5.4 .1Structural-iron workers.......... 10.41 2.9 - .5 .5 3.9 5.2 10.1 5.3 9.7 37.3 8.0 16.0 - .6Tile layers ........................... 9.84 1.2 2.9 4.1 5.1 2.8 20.5 8.0 17.5 6.4 20.0 2.2 1.2 7.0 1.1
Percent of helpers and laborers whose rates per hour were—Average rate per
hour Under$4.40
$4.40and
under$4.80
$4.80
$5.20
$5.20
$5.60
$5.60
$6.00
$6.00
$6.40
$6.40
$6.80
$6.80
$7.20
$7.20
$7.60
$7.60"
$8.00
^8.00
$8.40
$8.40
$8.80
$8.80
$9.20
$9.20
$9.60
$9.60andover
Helpers and laborers .............. $8.03 0.1 0.2 2.0 2.4 0.1 5.4 3.6 4.4 6.0 19.9 15.1 19.4 9.7 6.4 5.3Bricklayers’ tenders.............. 8.33 - - .9 4.8 - 4.5 6.7 .2 1.1 10.7 19.9 9.0 7.3 28.5 6.3Building laborers.................. 7.96 - - 2.5 1.8 0 4.9 2.5 4.8 6.8 24.2 14.7 23.7 9.9 .2 4.0Composition roofers’ helpers .. 6.41 10.0 18.1 1.3 - 4.8 6.4 21.3 17.4 6.5 - 2.2 .4 2.6 3.5 5.6Elevator constructors’ helpers 7.93 - - - .1 .1 3.8 3.0 15.1 10.8 16.0 20.5 20.1 4.1 5.4 1.0Marble setters’ helpers......... 8.43 - - 1.5 - - - 3.2 10.8 - 6.1 28.5 6.4 19.2 21.6 2.5Plasterers’ laborers............... 8.25 - - .5 8.2 .3 5.0 5.8 4.4 7.5 8.9 12.1 5.1 9.5 8.7 8 24.0Plumbers’ laborers................ 7.64 .9 2.4 2.3 1.0 .6 32.3 4.4 1.2 5.6 1.8 ■8.4 4.9 8.2 15.6 9 10.3Terrazzo workers’ laborers.... 8.39 - - .5 5.8 1.6 3.7 12.5 3.1 6.4 3.6 .7 5.2 11.1 30.1 10 15.6Tile layers’ helpers............... 8.58 - - .1 .4 - 3.2 3.0 2.4 8.1 4.5 12.5 9.9 28.8 24.9 2.1
1 Workers were distributed as follows: 4.1 percent between $12.30 and $12.45; 7.6 percent at $13.18; and 3.5 percent at $13.20 and over.
2 Workers were distributed as follows: 11.1 percent at $12.20 to $12.60; 3.5 at $12.80 and over.
3 Workers were distributed as follows: 11.8 percent at $12.20 to $12.60; 4.6 at $12.60 to $13.00; and 5.6 at $13.00 and over.
4 Workers were distributed as follows: 20.8 percent at $12.20 to $12.60 and 1.8 percent at $12.60 and over.
5 Workers were distributed as follows: 13.0 percent at $12.20 to $12.60 and 3.8 percent at $12.60 and over.
6 Workers were distributed as follows: 13.0 percent at $12.20 to
$12.60 and 2.5 percent at $12.60 and over.7 Less than 0.05 percent.8 Workers were distributed as follows: 17.3 percent at $9.90 to
$10.30 and 6.7 percent at $10.30 and over.9 Workers were distributed as follows: 10.3 percent at $9.60 to
$10.00.10 Workers were distributed as follows: 12.6 percent at $9.60 to
$10.00 and 3.0 percent at $10.00 and over.
NOTE: Because of rounding, sums of individual items may not equal totals. Dash indicates no rates reported for specified interval.
14Digitized for FRASER http://fraser.stlouisfed.org/ Federal Reserve Bank of St. Louis

(Percent distribution of union building tradesworkers by standard weekly hours, July 1, 1977)
Table 10. Weekly hours: United States
TradeAverageweeklyhours
Percent of members having a workweek of—
Under 35 hours 35 hours 36 hours 37.5 hours
Over 37.5 and under 40 hours
40 hours
All building trades.............. 39.3 0.1 11.8 2.3 0.8 O 85.0
Journeymen........................... 39.2 .1 12.6 2.8 .9 0 83.5Asbestos workers................ 39.3 - 14.7 - - - 85.3Boilermakers........................ 39.6 - 6.7 - 3.1 - 90.3Bricklayers.......................... 39.2 - 15.1 - 1.1 - 83.8Carpenters.......................... 39.2 - 14.1 2.3 - - 83.5Cement finishers.................. 39.6 - 8.1 - - - 91.9Drywall tapers ..................... 39.9 - 1.8 - - - 98.2Electricians (inside wirers)..... 39.1 - 14.2 2.5 2.5 - 80.8Elevator constructors........... 39.4 - 11.3 - - - 88.7Glaziers.............................. 39.6 - 6.3 .8 - 2.0 90.9Lathers............................... 39.0 - 17.5 3.2 - - 79.3Machinists........................... 40.0 - - - - - 100.0Marble setters..................... 39.2 - 16.2 - - - 83.8Mosaic and terrazzo workers .. 38.9 - 22.6 - - - 77.4Painters.............................. 38.5 - 28.3 1.0 - - 70.7Paperhangers...................... 39.4 - 8.2 5.6 - - 86.2Pipefitters............................ 39.0 1.6 8.3 11.9 .3 - 77.9Plasterers............................ 39.3 1.1 10.8 2.0 - - 86.1Plumbers............................. 38.9 - 12.2 10.9 2.0 - 74.9Reinforcing iron workers....... 39.9 - 2.6 - - - 97.4Roofers, composition ........... 39.2 - 14.1 1.2 - - 84.6Roofers, slate and tile ........... 38.9 - 21.1 .2 - - 78.7Sheet-metal workers ............ 39.5 - 8.5 - 4.6 - 86.9Stonemasons ...................... 39.0 - 18.8 - 2.4 - 78.8Structural-iron workers.......... 39.9 - 2.7 - - - 97.3Tile layers........................... 40.0 - - - - - 100.0
Helpers and laborers .............. 39.6 _ 7.9 .2 _ _ 91.9Bricklayers’ tenders.............. 38.6 - 26.9 .6 - - 72.6Building laborers.................. 39.8 - 4.5 - - - 95.5Composition roofers’ helpers .. 40.0 - .3 - - - 99.7Elevator constructors’ helpers 39.6 - 9.0 - - - 91.0Marble setters’ helpers......... 39.5 - 10.7 - - - 89.3Plasterers’ laborers............... 39.7 - 3.9 2.3 - - 93.8Plumbers’ laborers................ 40.0 - - - - - 100.0Terrazzo workers’ laborers.... 39.4 - 11.0 - - - 89.0Tile layers’ helpers............... 39.9 - 1.2 - - - 98.8
1 Less than 0.05 percent. may not equal totals. Dash indicates no hours reportedfor specified interval.
NOTE: Because of rounding, sums of individual items
15Digitized for FRASER http://fraser.stlouisfed.org/ Federal Reserve Bank of St. Louis
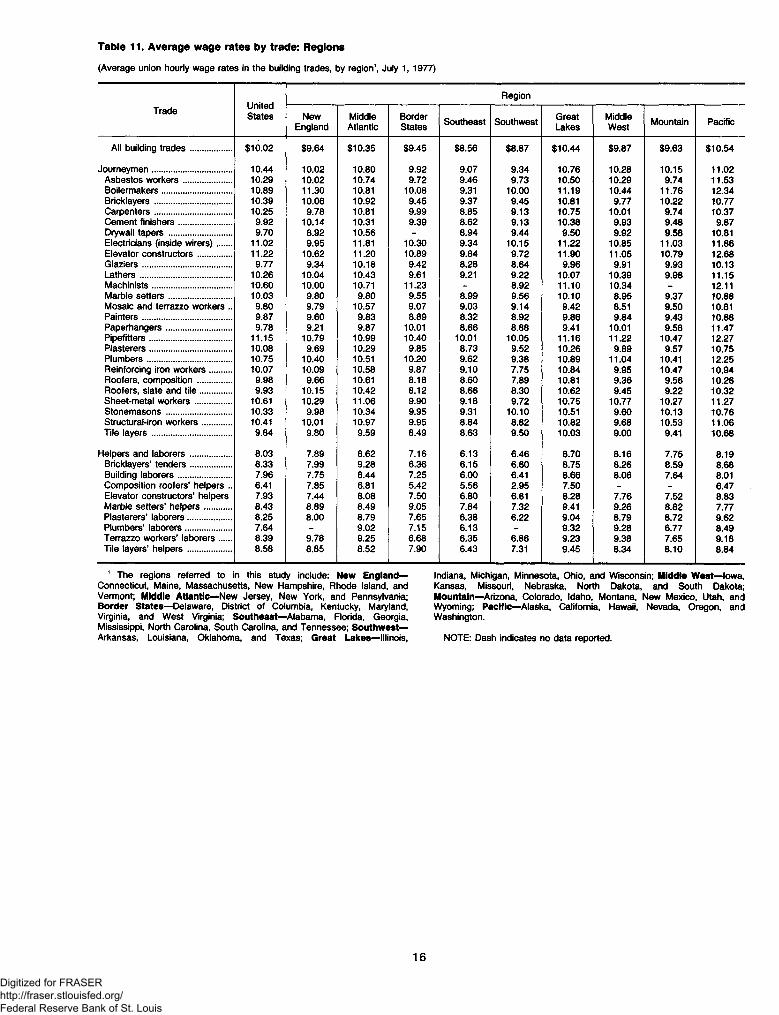
Table 11. Average wage rates by trade: Regions
(Average union hourly wage rates in the building trades, by region1, July 1, 1977)
Trade UnitedStates
Region
NewEngland
MiddleAtlantic
BorderStates Southeast Southwest Great
LakesMiddleWest Mountain Pacific
All building trades.............. $10.02 $9.64 $10.35 $9.45 $8.56 $8.87 $10.44 $9.87 $9.63 $10.54
Journeymen........................... 10.44 10.02 10.80 9.92 9.07 9.34 10.76 10.28 10.15 11.02Asbestos workers................ 10.29 10.02 10.74 9.72 9.46 9.73 10.50 10.29 9.74 11.53Boilermakers........................ 10.89 11.30 10.81 10.08 9.31 10.00 11.19 10.44 11.76 12.34Bricklayers.......................... 10.39 10.06 10.92 9.45 9.37 9.45 10.81 9.77 10.22 10.77Carpenters.......................... 10.25 9.78 10.81 9.99 8.85 9.13 10.75 10.01 9.74 10.37Cement finishers.................. 9.92 10.14 10.31 9.39 8.62 9.13 10.38 9.93 9.48 9.87Drywall tapers..................... 9.70 8.92 10.56 - 8.94 9.44 9.50 9.92 9.58 10.81Electricians (inside wirers)..... 11.02 9.95 11.81 10.30 9.34 10.15 11.22 10.85 11.03 11.86Elevator constructors........... 11.22 10.62 11.20 10.89 9.84 9.72 11.90 11.05 10.79 12.68Glaziers.............................. 9.77 9.34 10.18 9.42 8.28 8.64 9.96 9.91 9.93 10.13Lathers............................... 10.26 10.04 10.43 9.61 9.21 9.22 10.07 10.39 9.98 11.15Machinists........................... 10.60 10.00 10.71 11.23 - 8.92 11.10 10.34 - 12.11Marble setters..................... 10.03 9.80 9.80 9.55 8.99 9.56 10.10 8.95 9.37 10.88Mosaic and terrazzo workers .. 9.80 9.79 10.57 9.07 9.03 9.14 9.42 8.51 9.50 10.81Painters.............................. 9.87 9.60 9.83 8.89 8.32 8.92 9.86 9.84 9.43 10.88Paperhangers...................... 9.78 9.21 9.87 10.01 8.66 8.88 9.41 10.01 9.58 11.47Pipefitters............................ 11.15 10.79 10.99 10.40 10.01 10.05 11.16 11.22 10.47 12.27Plasterers............................ 10.08 9.69 10.29 9.85 8.73 9.52 10.26 9.89 9.57 10.75Plumbers............................. 10.75 10.40 10.51 10.20 9.62 9.38 10.89 11.04 10.41 12.25Reinforcing iron workers....... 10.07 10.09 10.58 9.87 9.10 7.75 10.84 9.95 10.47 10.94Roofers, composition ........... 9.98 9.66 10.61 8.18 8.60 7.89 10.81 9.36 9.56 10.26Roofers, slate and tile ........... 9.93 10.15 10.42 8.12 8.66 8.30 10.62 9.45 9.22 10.32Sheet-metal workers............ 10.61 10.29 11.06 9.90 9.18 9.72 10.75 10.77 10.27 11.27Stonemasons ...................... 10.33 9.98 10.34 9.95 9.31 10.10 10.51 9.60 10.13 10.76Structural-iron workers.......... 10.41 10.01 10.97 9.95 8.84 8.82 10.82 9.68 10.53 11.06Tile layers ........................... 9.84 9.80 9.59 8.49 8.63 9.50 10.03 9.00 9.41 10.68
Helpers and laborers .............. 8.03 7.89 8.62 7.16 6.13 6.46 8.70 8.16 7.75 8.19Bricklayers’ tenders.............. 8.33 7.99 9.28 6.36 6.15 6.60 8.75 8.26 8.59 8.68Building laborers.................. 7.96 7.75 8.44 7.25 6.00 6.41 8.66 8.06 7.64 8.01Composition roofers’ helpers .. 6.41 7.85 6.81 5.42 5.56 2.95 7.50 - - 6.47Elevator constructors’ helpers 7.93 7.44 8.08 7.50 6.80 6.81 8.28 7.76 7.52 8.83Marble setters’ helpers......... 8.43 8.89 8.49 9.05 7.84 7.32 9.41 9.26 8.82 7.77Plasterers’ laborers............... 8.25 8.00 8.79 7.65 6.38 6.22 9.04 8.79 8.72 9.62Plumbers’ laborers................ 7.64 - 9.02 7.15 6.13 - 9.32 9.28 6.77 8.49Terrazzo workers’ laborers.... 8.39 9.78 9.25 6.68 6.35 6.86 9.23 9.38 7.65 9.18Tile layers’ helpers............... 8.58 8.85 8.52 7.90 6.43 7.31 9.45 8.34 8.10 8.84
1 The regions referred to in this study include: New England— Connecticut, Maine, Massachusetts, New Hampshire, Rhode Island, and Vermont; Middle Atlantic^New Jersey, New York, and Pennsylvania; Border States— Delaware, District of Columbia, Kentucky, Maryland, Virginia, and West Virginia; Southeast—Alabama, Florida, Georgia, Mississippi, North Carolina, South Carolina, and Tennessee; Southwest— Arkansas, Louisiana, Oklahoma, and Texas; Great Lakes—Illinois,
Indiana, Michigan, Minnesota, Ohio, and Wisconsin; Middle West—Iowa, Kansas, Missouri, Nebraska, North Dakota, and South Dakota; Mountain—Arizona, Colorado, Idaho, Montana, New Mexico, Utah, and Wyoming; Pacific—Alaska, California, Hawaii, Nevada, Oregon, and Washington.
NOTE: Dash indicates no data reported.
16
Digitized for FRASER http://fraser.stlouisfed.org/ Federal Reserve Bank of St. Louis

(Average union hourly wage rates plus employer contributions1 in the building trades by region2, July 1, 1977)
Table 12. Average wage rates plus employer contributions for selected benefits: Regions
Trade UnitedStates
Region
NewEngland
MiddleAtlantic
BorderStates Southeast Southwest Great
LakesMiddleWest Mountain Pacific
All building trades.............. $12.20 $11.47 $12.97 $10.82 $9.60 $9.94 $12.58 $11.53 $11.39 $13.85
Journeymen........................... 12.73 11.98 13.55 11.41 10.20 10.50 13.01 12.05 12.07 14.37Asbestos workers................ 12.73 12.74 13.47 11.30 11.10 11.24 13.65 12.73 11.83 14.18Boilermakers........................ 13.02 13.38 13.50 11.89 11.26 11.50 13.58 12.29 13.92 14.59Bricklayers.......................... 12.46 11.82 14.15 10.64 10.26 10.31 12.88 11.66 11.69 13.53Carpenters.......................... 12.50 11.29 13.80 11.26 9.73 9.98 12.94 11.47 11.65 13.72Cement finishers.................. 12.20 11.63 13.50 10.21 9.23 9.91 12.32 11.81 11.51 13.31Drywall tapers ..................... 10.78 10.26 12.42 - 9.94 10.04 10.51 10.70 11.11 12.23Electricians (inside wirers)..... 13.38 12.12 14.22 12.00 11.12 11.67 13.60 13.02 13.18 15.40Elevator constructors............ 12.97 12.33 13.44 12.45 11.33 11.20 13.58 12.61 12.41 14.34Glaziers.............................. 11.63 11.05 12.44 10.34 9.28 9.76 11.42 11.82 . 10.93 12.80Lathers............................... 11.99 11.23 12.88 10.28 9.69 10.18 11.83 11.12 11.28 13.44Machinists........................... 11.64 10.70 12.41 12.56 - 9.42 12.63 11.57 - 13.18Marble setters..................... 12.03 11.69 11.87 11.07 10.01 9.87 11.85 10.16 10.35 13.91Mosaic and terrazzo workers .. 11.39 11.66 12.56 10.14 9.82 9.43 10.93 9.16 10.44 13.57Painters.............................. 11.52 11.24 11.80 9.91 9.08 9.64 11.34 10.77 11.11 13.24Paperhangers...................... 11.25 10.53 11.12 11.78 9.42 9.71 10.85 11.08 10.99 13.90Pipefitters............................ 13.95 13.03 13.58 12.34 11.36 11.83 13.67 14.29 12.52 16.74Plasterers............................ 11.97 10.82 12.38 10.25 9.59 10.23 12.15 11.05 11.23 13.95Plumbers............................. 13.39 12.64 13.42 11.95 11.10 10.55 13.37 13.00 12.40 16.76Reinforcing iron workers....... 12.63 12.78 13.71 11.82 10.30 9.32 13.57 11.70 13.02 14.39Roofers, composition ............ 11.82 11.68 13.49 8.97 9.08 8.28 12.70 10.78 10.63 12.73Roofers, slate and tile ........... 11.75 “ 12.00 12.45 8.59 8.97 8.64 12.34 11.37 10.64 12.90Sheet-metal workers............ 13.00 12.69 13.69 11.81 10.63 10.90 13.05 12.58 12.42 14.97Stonemasons ...................... 12.49 11.89 12.41 11.54 10.18 10.96 12.56 11.43 12.05 13.88Structural-iron workers.......... 13.28 12.78 14.64 12.04 9.96 10.37 14.08 11.87 12.91 14.38Tile layers........................... 11.78 11.68 11.94 9.44 9.47 9.86 11.84 10.76 10.45 13.43
Helpers and laborers .............. 9.74 9.13 10.73 7.95 6.76 7.03 10.27 9.38 8.96 11.25Bricklayers’ tenders.............. 9.88 9.25 11.38 6.90 6.75 7.20 10.19 9.45 9.70 11.91Building laborers.................. 9.75 8.96 10.60 8.05 6.54 6.97 10.27 9.25 8.87 11.13Composition roofers’ helpers .. 7.76 9.75 9.04 6.03 6.29 3.20 9.10 - - 8.43Elevator constructors’ helpers 9.45 8.92 10.05 8.86 8.11 8.11 9.73 9.12 8.93 10.25Marble setters’ helpers......... 9.94 10.22 10.81 9.99 9.29 7.62 10.70 9.61 9.04 10.37Plasterers’ laborers............... 9.91 9.21 10.68 8.47 7.23 6.73 10.63 10.11 9.97 12.91Plumbers’ laborers................ 8.82 - 11.34 7.91 6.73 - 10.93 10.97 7.91 11.04Terrazzo workers’ laborers.... 9.67 10.57 10.90 7.06 6.94 7.42 10.06 9.62 8.45 11.84Tile layers’ helpers........ ...... 10.20 10.14 10.05 8.69 7.06 7.53 10.73 9.72 9.50 11.41
1 Includes employer contributions to insurance (life insurance, hospitalization, medical, surgical, and other similar types of health and welfare programs) and pension funds and vacation payments to a fund or to the workers as provided in labor-management contracts. Averages presented are for a straight-time hour; in actual practice, however, some employer payments are calculated for total hours worked or gross payroll.
Average refers to all workers in the classification, including those for whom employer contributions were not specified in their particular
contracts. Such situations were included in the average computation as zero contributions.
Some contracts also provide additional payments to other funds such as apprenticeship and unemployment benefits. Information on payments to these funds was not collected.
2 See table 11, footnote 1, for definition of regions.
NOTE: Dash indicates no data reported.
17Digitized for FRASER http://fraser.stlouisfed.org/ Federal Reserve Bank of St. Louis

(Changes in union hourly wage rates in the building trades by region1, July 1, 1976-July 1, 1977)
Table 13. Cents-per-hour and percent changes in average wage rates by trade: Regions
Trade
United StatesRegion
New England Middle Atlantic Border States Southeast
Centsperhour
PercentCents
perhour
PercentCentsperhour
PercentCentsperhour
PercentCentsperhour
Percent
All building trades.............. 56 5.9 30 3.2 48 4.8 53 5.9 38 4.7
Journeymen........................... 58 5.8 31 3.2 50 4.9 55 5.8 40 4.6Asbestos workers................ 66 6.8 70 7.5 85 8.6 49 5.4 88 10.3Boilermakers........................ 78 7.7 62 5.8 65 6.4 57 6.0 50 5.7Bricklayers .......................... 51 5.2 16 1.6 41 3.9 53 5.9 36 4.0Carpenters.......................... 51 5.3 27 2.8 45 4.3 43 4.5 37 4.4Cement finishers.................. 48 5.1 27 2.7 32 3.2 49 5.5 34 4.1Drywall tapers ..................... 58 6.4 32 3.7 62 6.5 - - 35 4.0Electricians (inside wirers)..... 68 6.6 25 2.6 34 3.0 62 6.4 50 5.6Elevator constructors........... 67 6.4 39 3.8 49 4.5 65 6.3 55 5.9Glaziers.............................. 56 6.0 21 2.3 49 5.1 56 6.3 23 2.9Lathers............................... 60 6.2 48 5.1 41 4.1 64 7.2 29 3.3Machinists........................... 66 6.6 50 5.3 16 1.5 85 8.2 - -Marble setters..................... 59 6.2 6 .7 59 6.4 76 8.6 13 1.5Mosaic and terrazzo workers .. 54 5.8 7 .7 72 7.3 77 9.2 13 1.4Painters.............................. 58 6.2 31 3.4 60 6.5 51 6.1 35 4.4Paperhangers...................... 58 6.3 31 3.5 49 5.2 64 6.8 31 3.7Pipefitters............................ 71 6.8 69 6.8 81 8.0 82 8.6 62 6.6Plasterers............................ 56 5.9 30 3.2 33 3.3 75 8.2 14 1.6Plumbers............................. 62 6.1 20 2.0 40 3.9 76 8.1 42 4.6Reinforcing iron workers....... 36 3.7 21 2.1 44 4.3 38 4.0 21 2.3Roofers, composition ........... 57 6.1 39 4.2 55 5.5 46 5.9 44 5.4Roofers, slate and tile ........... 92 10.2 51 5.3 70 7.1 41 5.3 62 7.8Sheet-metal workers ............ 62 6.2 35 3.5 59 5.6 57 6.1 41 4.6Stonemasons ...................... 46 4.7 3 .3 43 4.4 66 7.1 26 2.8Structural-iron workers.......... 52 5.3 24 2.4 73 7.1 38 4.0 18 2.1Tile layers........................... 58 6.3 7 .7 39 4.3 68 8.7 20 2.4
Helpers and laborers .............. 48 6.4 24 3.1 38 4.6 43 6.4 32 5.5Bricklayers’ tenders.............. 51 6.5 25 3.2 41 4.6 54 9.3 36 6.2Building laborers.................. 48 6.4 25 3.3 36 4.5 42 6.2 33 5.8Composition roofers’ helpers .. 16 2.6 -2 -.2 21 3.1 6 1.0 17 3.1Elevator constructors’ helpers 46 6.2 28 4.0 36 4.6 47 6.7 28 4.4Marble setters’ helpers......... 32 3.9 18 2.1 31 3.8 56 6.6 - -Plasterers’ laborers............... 47 6.0 25 3.2 45 5.4 41 5.7 24 3.8Plumbers’ laborers................ 51 7.2 ' - - 60 7.1 35 5.1 38 6.6Terrazzo workers’ laborers.... 45 5.6 1 .2 38 4.3 49 8.0 21 3.4Tile layers’ helpers............... 44 5.3 18 2.0 41 5.0 32 4.2 27 4.4
See footnotes at end of table.
18Digitized for FRASER http://fraser.stlouisfed.org/ Federal Reserve Bank of St. Louis

Table 13. Cents-per-hour and percent changes in average wage rates by trade:Regions —Continued
(Changes in union hourly wage rates in the building trades by region1, July 1, 1976-July 1, 1977)
Region
TradeSouthwest Great Lakes Middle West Mountain Pacific
Centsperhour
PercentCentsperhour
PercentCentsperhour
PercentCentsperhour
PercentCentsperhour
Percent
All building trades.............. 59 7.2 64 6.6 54 5.7 74 8.3 60 6.1
Journeymen........................... 62 7.1 64 6.3 54 5.5 71 7.6 65 6.3Asbestos workers................ 43 4.6 51 5.1 74 7.8 62 6.8 71 6.6Boilermakers........................ 100 11.1 57 5.4 85 8.9 94 8.7 107 9.5Bricklayers.......................... 47 5.2 59 5.8 32 3.4 53 5.4 83 8.4Carpenters.......................... 63 7.4 70 7.0 37 3.9 67 7.4 43 4.4Cement finishers.................. 60 7.0 59 6.1 45 4.8 79 9.1 40 4.3Drywall tapers..................... 63 7.1 51 5.7 86 9.5 56 6.2 55 5.5Electricians (inside wirers)..... 69 7.3 66 6.2 64 6.3 90 8.8 118 11.0Elevator constructors........... 66 7.3 80 7.3 71 6.9 91 9.2 94 8.0Glaziers.............................. 64 8.0 60 6.4 65 7.0 75 8.2 64 6.7Lathers............................... 66 7.7 61 6.4 113 12.1 142 16.5 61 5.8Machinists........................... 76 9.4 51 4.8 9 .9 - - 101 9.1Marble setters..................... 53 5.8 46 4.8 20 2.3 76 8.8 95 9.6Mosaic and terrazzo workers .. 66 7.8 42 4.7 7 .8 59 6.6 92 9.3Painters.............................. 52 6.2 57 6.1 72 7.9 72 8.3 63 6.2Paperhangers...................... 49 5.8 58 6.5 64 6.8 86 9.9 79 7.4Pipefitters......................... 70 7.5 62 5.8 89 8.6 49 4.9 74 6.4Plasterers............................ 57 6.4 57 5.9 47 5.0 46 5.0 91 9.3Plumbers............................. 57 6.5 70 6.9 69 6.7 63 6.4 85 7.4Reinforcing iron workers....... 43 5.9 48 4.7 48 5.1 59 6.0 17 1.6Roofers, composition ........... 51 6.9 56 5.5 61 6.9 64 7.2 83 8.8Roofers, slate and tile ........... 47 6.0 71 7.1 80 9.2 75 8.8 159 18.2Sheet-metal workers............ 76 8.5 62 6.1 44 4.2 87 9.2 76 7.2Stonemasons ...................... 49 5.0 47 4.7 13 1.4 30 3.1 63 6.2Structural-iron workers.......... 44 5.2 63 6.2 48 5.2 67 6.7 34 3.1Tile layers ............................ 50 5.6 52 5.5 27 3.1 76 8.7 96 9.9
Helpers and laborers .............. 47 7.8 66 8.2 53 7.0 82 11.8 38 4.9Bricklayers’ tenders.............. 44 7.1 70 8.7 74 9.8 95 12.5 29 3.4Building laborers.................. 48 8.0 67 8.4 50 6.6 82 12.1 37 4.8Composition roofers’ helpers .. 25 9.3 18 2.5 - - - - 34 5.6Elevator constructors’ helpers 41 6.3 53 6.8 52 7.1 65 9.4 63 7.7Marble setters’ helpers......... 59 8.7 45 5.0 62 7.2 4 .5 56 7.7Plasterers’ laborers............... 52 9.2 54 6.4 44 5.3 103 13.5 44 4.8Plumbers’ laborers................ - - 79 9.3 46 5.2 50 8.0 52 6.5Terrazzo workers’ laborers.... 41 6.3 56 6.4 64 7.3 58 8.1 59 6.8Tile layers’ helpers............... 46 6.6 50 5.6 49 6.2 26 3.3 54 6.4
1 See table 11, footnote 1, for definition of regions.
NOTE: Cents-per-hour and percent changes were calculated by averaging year-to-year increases with year-to-year decreases and no-change situations, weighted by current-year membership. Thus, relatively small increases may reflect the inclusion of cities where rates declined or remained unchanged for a trade.
Variations in the size of annual increases from survey to survey may be due, in part, to the timing of negotiations in relation to the July 1 survey reference date, and do not include increases made later that are retroactive to July 1 or before. Such retroactive increases are included in the wage rates reported in the following year’s survey.
Dash indicates no data reported.
19
Digitized for FRASER http://fraser.stlouisfed.org/ Federal Reserve Bank of St. Louis

(Average union hourly wage rates and employer contributions1 in the building trades by city, July 1, 1977)
Table 14. Average wage rates and employer contributions for selected benefits: Selected cities by population group
City by population groupAverage rate per
hour
Average employer
contribution per hour1
Average rate plus employer
contribution per hour1
City by population groupAverage rate per
hour
Average employer
contribution per hour1
Average rate plus employer
contribution per hour1
All cities................................... $10.02 $2.18 $12.20 Cincinnati, Ohio........................... $10.83 $1.70 $12.52Fort Worth, Tex............. ) ............ 8.95 .93 9.88
Population group I Honolulu, Hawaii .......................... 9.30 3.27 12.57(1,000,000 and over) ..................... 10.50 2.85 13.35 Long Beach, Calif........................ 10.54 3.79 14.33Chicago, III.................................. 10.72 1.79 12.51 Louisville, Ky............................... 9.77 1.53 11.30Detroit, Mich ............................ 10.68 3.27 13.95 Miami, Fla ................................... 8.67 1.43 10.09Houston, Tex.............................. 9.70 1.39 11.08 Minneapolis-St. Paul, Minn............ 9.78 1.70 11.48Los Angeles, Calif........................ 10.48 3.69 14.17 Nashville-Davidson, Tenn............. 8.71 .80 9.51New York, N.Y ............................ 10.57 3.38 13.96 Newark, N.J................................ 10.74 2.39 13.13Philadelphia, Pa........................... 10.15 2.56 12.72 Norfolk, Va.................................. 8.34 .84 9.19
Omaha, Nebr............................... 9.46 1.46 10.92Population group II Portland, Oreg............................. 10.87 2.44 13.31(500 000 to 1 000,000) ....... 10.11 2.03 12.15 Rochester, N.Y............................ 10.05 2.02 12.07Baltimore, Md .............................. 9.21 1.55 10.76 Sacramento, Calif........................ 10.71 3.79 14.50Boston, Mass .......... ....... 10.06 2.09 12.15 Toledo, Ohio............................... 11.47 2.25 13.72Cleveland, Ohio......... ....... 11.04 2.64 13.68 Wichita, Kans............................... 9.46 1.09 10.55Columbus, Ohio........................... 9.94 1.47 11.41Dallas, Tex.................................. 9.12 1.03 10.15 Population group IVDenver, Colo............................... 9.50 1.97 11.47 (100,000 to 250,000) ..................... 9.49 1.81 11.30Indianapolis, Ind.......................... 10.21 1.59 11.80 Albany, N.Y................................. 9.58 1.83 11.42Jacksonville, Fla.......................... 8.47 1.34 9.80 Chattanooga, Tenn...................... 8.33 .85 9.18Kansas City, Mo.......................... 10.26 1.66 11.92 Corpus Christi, Tex...................... 8.30 .95 9.26Memphis, Tenn ........................... 9.39 1.05 10.44 Flint, Mich ................................... 9.86 2.49 12.35Milwaukee, Wis ........................... 10.21 2.35 12.55 Fremont, Calif.............................. 11.28 3.78 15.07New Orleans, La......................... 9.24 1.01 10.26 Fresno, Calif............................... 10.84 3.30 14.14Phoenix, Ariz............................... 10.01 2.19 12.20 Grand Rapids, Mich..................... 9.08 1.89 10.97Pittsburgh, Pa............................. 10.29 1.80 12.09 Hammond, Ind............................. 10.36 1.70 12.06St. Louis, Mo .............................. 10.12 2.04 12.16 Huntsville, Ala.............................. 8.48 .77 9.26San Antonio, Tex......... ....... 8.25 1.24 9.49 New Bedford, Mass..................... 9.31 1.87 11.17San Diego, Calif.......................... 10.52 3.33 13.84 New Haven, Conn........................ 9.46 1.42 10.87San Francisco, Calif ..................... 11.50 3.65 15.15 Providence, R .l............................ 9.17 1.92 11.09Seattle, Wash............................. 10.96 2.23 13.19 Riverside, Calif............................ 10.26 3.73 13.99Washington, D.C......................... 10.16 1.53 11.69 Rockford, ill ................................ 10.70 1.37 12.07
Population group III St. Petersburg, Fla....................... 8.45 1.11 9.57(250 000 to 500,000) .................... 9.91 1.97 11.88 Salt Lake City, Utah ..................... 9.46 1.34 10.80Akron, Ohio................................. 10.41 1.88 12.30 Santa Ana, Calif.......................... 9.94 3.51 13.46Atlanta, Ga.................................. 8.63 1.34 9.97 Scranton, Pa............................... 10.00 1.76 11.76Buffalo, N.Y ................................ 10.83 2.23 13.06 Spokane, Wash........................... 10.30 1.84 12.14
Stamford, Conn........................... 9.71 1.68 11.39
1 Includes employer contributions to insurance (life insurance, hospitalization, medical, surgical, and other similar types of health and welfare programs) and pension funds and vacation payments to a fund or to the workers as provided in labor-management contracts. Averages presented are for a straight-time hour; in actual practice, however, some employer payments are calculated for total hours worked or gross payroll.
Average refers to all workers in the classification, including those for whom employer contributions were not specified in their particular
contracts. Such situations were included in the average computation as zero contributions.
Some contracts also provide additional payments to other funds such as apprenticeship and unemployment benefits. Information on payments to these funds was not collected.
NOTE: Because of rounding, sums of individual items may not equal totals.
20
Digitized for FRASER http://fraser.stlouisfed.org/ Federal Reserve Bank of St. Louis

(Average union hourly wage rates and employer contributions1 in the building trades by city, July 1, 1977)
Table 15. Average wage rates and employer contributions for selected benefits: Selected cities by region
City by region2Average rate per
hour
Average employer
contribution per hour1
Average rate plus employer
contribution per hour1
City by region2Average rate per
hour
Average employer
contribution per hour1
Average rate plus employer
contribution per hour1
All cities................................... $10.02 $2.18 $12.20 Great Lakes.................................. $10.44 $2.14 $12.58Akron, Ohio (III)........................... 10.41 1.88 12.30
New England................................. 9.64 1.83 11.47 Chicago, III. (I)............................. 10.72 1.79 12.51Boston, Mass. (II)......................... 10.06 2.09 12.15 Cincinnati, Ohio (III)..................... 10.83 1.70 12.52New Bedford, Mass. (IV)............... 9.31 1.87 11.17 Cleveland, Ohio (II)...................... 11.04 2.64 13.68New Haven, Conn. (IV)................ 9.46 1.42 10.87 Columbus, Ohio (II)...................... 9.94 1.47 11.41Providence, R.l. (IV) ..................... 9.17 1.92 11.09 Detroit, Mich. (I) .......................... 10.68 3.27 13.95Stamford, Conn. (IV)..................... 9.71 1.68 11.39 Flint, Mich. (IV)............................ 9.86 2.49 12.35
Grand Rapids, Mich. (IV).............. 9.08 1.89 10.97Middle Atlantic.............................. 10.35 2.62 12.97 Hammond, Ind. (IV) ..................... 10.36 1.70 12.06
Albany, N.Y. (IV) ......................... 9.58 1.83 11.42 Indianapolis, Ind. (II)..................... 10.21 1.59 11.80Buffalo, N.Y. (Ill) ......................... 10.83 2.23 13.06 Milwaukee, Wis. (II)...................... 10.21 2.35 12.55New York, N.Y. (I)........................ 10.57 3.38 13.96 Minneapolis-St. Paul, Minn. (Ill)..... 9.78 1.70 11.48Newark, N J (III) .......................... 10.74 2.39 13.13 Rockford, III. (IV)......................... 10.70 1.37 12.07Philadelphia, Pa. (I)...................... 10.15 2.56 12.72 Toledo, Ohio (III)......................... 11.47 2.25 13.72Pittsburgh, Pa. (II)........................ 10.29 1.80 12.09Rochester, N.Y. (Ill)..................... 10.05 2.02 12.07 Middle West .................................. 9.87 1.66 11.53Scranton, Pa. (IV) ........................ 10.00 1.76 11.76 Kansas City, Mo. (II)..................... 10.26 1.66 11.92
Omaha, Nebr. (Ill)........................ 9.46 1.46 10.92Border States................................ 9.45 1.37 10.82 St. Louis, Mo. (II) ......................... 10.12 2.04 12.16
Baltimore, Md. (II) ........................ 9.21 1.55 10.76 Wichita, Kans. (Ill)........................ 9.46 1.09 10.55Louisville, Ky. (Ill)......................... 9.77 1.53 11.30Norfolk, Va. (Ill)........................... 8.34 .84 9.19 Mountain....................................... 9.63 1.77 11.39Washington DC (II) .................... 10.16 1.53 11.69 Denver, Colo. (II)......................... 9.50 1.97 11.47
Phoenix, Ariz. (II).......................... 10.01 2.19 12.20Southeast...................................... 8.56 1.05 9.60 Salt Lake City, Utah (IV)............... 9.46 1.34 10.80
Atlanta, Ga. (Ill)........................... 8.63 1.34 9.97Chattanooga, Tenn. (IV)................ 8.33 .85 9.18 Pacific........................................... 10.54 3.30 13.85Huntsville, Ala. (IV)...................... 8.48 .77 9.26 Fremont, Calif. (IV) ...................... 11.28 3.78 15.07Jacksonville, Fla. (II)..................... 8.47 1.34 9.80 Fresno, Calif. (IV)......................... 10.84 3.30 14.14Memphis, Tenn. (II)...................... 9.39 1.05 10.44 Honolulu, Hawaii (III) .................... 9.30 3.27 12.57Miami, Fla. (Ill) ............................ 8.67 1.43 10.09 Long Beach, Calif. (Ill) ................. 10.54 3.79 14.33Nashville-Davidson, Tenn (III) ....... 8.71 .80 9.51 Los Angeles, Calif. (I)................... 10.48 3.69 14.17St Petersburg Fla (IV) ........... 8.45 1.11 9.57 Portland, Oreg. (Ill)...................... 10.87 2.44 13.31
Riverside, Calif. (IV)..................... 10.26 3.73 13.99Southwest..................................... 8.87 1.06 9.94 Sacramento, Calif. (Ill) ................. 10.71 3.79 14.50
Corpus Christi Tex. (IV)................ 8.30 .95 9.26 San Diego, Calif. (II).................... 10.52 3.33 13.84Dallas, Tex. (II)............................ 9.12 1.03 10.15 San Francisco, Calif. (II) ............... 11.50 3.65 15.15Fort Worth, Tex. (Ill)..................... 8.95 .93 9.88 Santa Ana, Calif. (IV).................... 9.94 3.51 13.46Houston, Tex. (I)......................... 9.70 1.39 11.08 Seattle, Wash. (II)........................ 10.96 2.23 13.19New Orleans, La. (II).................... 9.24 1.01 10.26 Spokane, Wash. (IV)..................... 10.30 1.84 12.14San Antonio, Tex. (II)................... 8.25 1.24 9.49
1 Includes employer contributions to insurance (life insurance, hospitalization, medical, surgical, and other similar types of health and welfare programs) and pension funds and vacation payments to a fund or to the workers as provided in labor-management contracts. Averages presented are for a straight-time hour; in actual practice, however, some employer payments are calculated for total hours worked or gross payroll.
Average refers to all workers in the classification, including those for whom employer contributions were not specified in their particular contracts. Such situations were included in the average computation as zero contributions.
Some contracts also provide additional payments to other funds such as apprenticeship and unemployment benefits. Information on payments to these funds was not collected.
2 See table 11, footnote 1, for definitions of regions. Population size is shown in parentheses as follows: Group I = 1,000,000 or more; Group II = 500,000 to 1,000,000; Group III = 250,000 to 500,000; and Group IV = 100,000 to 250,000.
NOTE: Because of rounding, sums of individual items may not equal totals.
21Digitized for FRASER http://fraser.stlouisfed.org/ Federal Reserve Bank of St. Louis

(Average union hourly wage rates and employer contributions1 in the building trades, July 1, 1977)
Table 16. Average wage rates and employer contributions for selected benefits, Journeymen and laborers: Selected cities bypopulation group
City by population groupAverage rate per
hour
Average employer
contribution per hour1
Average rate plus employer
contribution per hour1
City by population groupAverage rate per
hour
Average employer
contribution per hour1
Average rate plus employer
contribution per hour1
Journeymen
All cities................................... $10.44 $2.28 $12.73 Cincinnati, Ohio........................... $10.99 $1.81 $12.81Fort Worth, Tex........................... 9.75 1.02 10.76Honolulu, Hawaii......................... 9.74 3.58 13.32
Population group I Long Beach, Calif........................ 11.19 3.91 15.10(1,000,000 and over) .................... 10.88 2.97 13.85 I nuisville Ky 10.11 1.64 11.76Chicago, III................................. 11.08 1.82 12.89 Miami Fla 9.15 1.44 10.59Detroit, Mich............................... 10.90 3.39 14.29 M inneapnlis-St Paul Minn 10.12 1.85 11.97Houston, Tex.............................. 10.10 1.52 11.63 Nashville-Davidann Tenn 9.05 .83 9.88Los Angeles, Calif........................ 10.74 3.73 14.47 Newark N J 10.97 2.47 13.44New York, N Y ............................ 11.05 3.58 14.64 Norfolk Va 8.94 .94 9.88Philadelphia, Pa........................... 10.77 2.90 13.67 O m aha Nehr 10.10 1.68 11.78
Portland, Oreg............................. 11.11 2.45 13.55Population group II Rochester, N.Y............................ 10.73 2.02 12.76(500,000 to 1,000,000) .................. 10.55 2.13 12.67 Sacra m entn Oalif 11.62 3.73 15.35Baltimore, Md............................. 9.82 1.76 11.58 Toledo Ohio 11.67 2.39 14.06Boston, Mass.............................. 10.46 2.23 12.70 W ichita Kans 9.99 1.17 11.16Cleveland, Ohio........................... 11.23 2.74 13.98Columbus, Ohio........................... 10.58 1.64 12.21 Population group IVDallas, Tex.................................. 9.74 1.14 10.87 (100 000 to 950 000) 9.91 1.89 11.80Denver, Colo............................... 10.07 2.18 12.25 Alhany N Y 10.01 1.86 11.87Indianapolis, Ind.......................... 10.80 1.72 12.53 Chattanooga Tenn 8.95 .96 9.91Jacksonville, Fla.......................... 8.89 1.46 10.34 Corpus Christi Tay 8.66 1.02 9.68Kansas City, Mo.......................... 10.55 1.70 12.25 Flint Mich 10.14 2.62 12.76Memphis, Tenn ........................... 9.79 1.11 10.90 Frem ont Calif 11.83 3.81 15.65Milwaukee, Wis ........................... 10.50 2.43 12.93 Fresno Calif 11.06 3.26 14.32New Orleans, La......................... 9.72 1.15 10.87 Crand Rapids Mich 9.52 1.97 11.49Phoenix, Ariz............................... 10.58 2.28 12.86 Ham m ond Ind 11.13 1.93 13.06Pittsburgh, Pa............................. 10.50 1.85 12.35 Huntsville Ala 9.26 .80 10.06St. Louis, M o.............................. 10.34 2.11 12.45 New Redford M ass 9.63 2.02 11.65San Antonio, Tex......................... 8.87 1.37 10.24 N ew Haven Conn 9.88 1.50 11.38San Diego, Calif.......................... 11.43 3.38 14.81 Providence R I 9.53 2.07 11.60San Francisco, Calif.................... 11.97 3.67 15.64 Riverside Calif 11.20 3.80 15.00Seattle, Wash............................. 11.28 2.27 13.55 Rockford III 10.82 1.41 12.23Washington, D.C......................... 10.53 1.64 12.17 St Petershi irg Fla 8.67 1.14 9.81
Population group III Salt Lake City, Utah ..................... 9.95 1.50 11.45(250,000 to 500,000) .................... 10.38 2.06 12.44 Santa Ana Calif 10.73 3.57 14.30Akron, Ohio................................. 10.50 1.95 12.44 Scranton Pa 10.15 1.88 12.03Atlanta, Ga................................. 9.15 1.51 10.66 Spokane W ash 10.94 1.93 12.87 .Buffalo, N.Y ................................ 11.62 2.17 13.79 Stam ford Conn io!oo 177 11.77
See footnotes at end of table.
22
Digitized for FRASER http://fraser.stlouisfed.org/ Federal Reserve Bank of St. Louis

(Average union hourly wage rates and employer contributions1 in the building trades, July 1, 1977)
Table 16. Average wage rates and employer contributions for selected benefits, journeymen and laborers: Selected cities bypopulation group—Continued
City by population groupAverage rate per
hour
Average employer
contribution per hour1
Average rate plus employer
contribution per hour1
City by population groupAverage rate per
hour
Average employer
contribution per hour1
Average rate plus employer
contribution per hour1
Helpers and laborers
All cities................................... $8.03 $1.71 $9.74 Cincinnati, Ohio........................... $9.98 $1.09 $11.07Fort Worth, Tex........................... 6.44 .68 7.12
Population group I Honolulu, Hawaii ......................... 7.62 2.08 9.70(1,000,000 and over) ..................... 8.56 2.22 10.77 Long Beach, Calif........................ 8.08 3.33 11.41Chicago, III.................................. 8.59 1.63 10.22 Louisville, Ky............................... 7.49 .81 8.31Detroit, Mich............................... 9.00 2.41 11.41 Miami, F la................................... 6.80 1.39 8.19Houston, Tex.............................. 7.63 .71 8.34 Minneapolis-St. Paul, Minn........... 8.37 1.10 9.46Los Angeles, Calif........................ 7.89 3.33 11.22 Nashville-Davidson, Tenn............. 6.20 .58 6.78New York, N.Y ........................... 8.89 2.69 11.58 Newark, N.J................................ 8.33 1.54 9.87Philadelphia, Pa........................... 8.34 1.59 9.93 Norfolk, Va.................................. 5.37 .38 5.75
Omaha, Nebr.............................. 7.80 .90 8.70Population group II Portland, Oreg............................. 8.39 2.42 10.80(500,000 to 1,000,000)............ 8.15 1.62 9.76 Rochester, N.Y............................ 8.02 2.02 10.03Baltimore, Md ... ............ 7.09 .81 7.91 Sacramento, Calif ........................ 8.58 3.94 12.53Boston, Mass............................... 7.90 1.32 9.22 Toledo, Ohio............................... 10.44 1.55 11.99Cleveland, Ohio........................... 10.00 2.13 12.14 Wichita, Kans.............................. 7.10 .75 7.85Columbus, Ohio........................... 8.02 .95 8.97Dallas, Tex.................................. 6.52 .59 7.12 Population group IVDenver, Colo............................... 7.11 1.07 8.18 (100,000 to 250,000) ..................... 7.54 1.44 8.99Indianapolis, Ind.......................... 7.69 1.00 8.70 Albany, N.Y................................. 8.57 1.77 10.34Jacksonville, Fla.......................... 5.36 .45 5.80 Chattanooga, Tenn...................... 6.23 .46 6.69Kansas City, Mo.......................... 8.16 1.33 9.49 Corpus Christi, Tex...................... 5.23 .39 5.62Memphis, Tenn ........................... 6.49 .57 7.06 Flint, Mich ................................... 7.86 1.58 9.43Milwaukee, Wis ........................... 9.08 2.03 11.11 Fremont, Calif.............................. 8.72 3.64 12.36New Orleans, La .................. 7.25 .46 7.70 Fresno, Calif............................... 8.47 3.73 12.20Phoenix Ariz . .................. 8.34 1.91 10.25 Grand Rapids, Mich..................... 6.49 1.41 7.90Pittsburgh, Pa.............................. 8.73 1.41 10.14 Hammond, Ind............................. 8.29 1.08 9.38St. Louis, Mo .............................. 9.05 1.74 10.79 Huntsville, Ala.............................. 4.87 .65 5.52San Antonio, Tex......................... 5.37 .63 6.00 New Bedford, Mass..................... 8.10 1.30 9.40San Diego, Calif.......................... 8.15 3.18 11.33 New Haven, Conn........................ 7.75 1.07 8.82San Francisco, Calif .................. 8.91 3.51 12.41 Providence, R .l............................ 7.80 1.34 9.14Seattle, Wash.............................. 8.70 1.94 10.64 Riverside, Calif............................ 8.51 3.61 12.12Washington, D.C .. .................. 8.31 1.03 9.34 Rockford, III ................................ 9.12 .92 10.05
Population group III St. Petersburg, Fla....................... 6.34 .80 7.15(250 000 to 500,000) .................. 7.86 1.58 9.44 Salt Lake City, Utah .................... 7.70 .76 * 8.46Akron, Ohio............................... . 9.50 1.19 10.69 Santa Ana, Calif.......................... 7.90 3.37 11.27Atlanta Ga ................................. 6.03 .50 6.53 Scranton, Pa............................... 8.96 .90 9.86Buffalo NY ................................ 8.29 2.44 10.73 Spokane, Wash........................... 7.82 1.52 9.34
Stamford, Conn........................... 7.79 1.05 8.84
1 Includes employer contributions to insurance (life insurance, hospitalization, medical, surgical, and other similar types of health and welfare programs) and pension funds and vacation payments to a. fund or to the workers as provided in labor-management contracts. Averages presented are for a straight-time hour; in actual practice, however, some employer payments are calculated for total hours worked or gross payroll.
Average refers to all workers in the classification, including those for whom employer contributions were not specified in their particular
contracts. Such situations were included in the average computation as zero contributions.
Some contracts also provide additional payments to other funds such as apprenticeship and unemployment benefits. Information on payments to these funds was not collected.
NOTE: Because of rounding, sums of individual items may not equal totals.
23
Digitized for FRASER http://fraser.stlouisfed.org/ Federal Reserve Bank of St. Louis

Table 17. Average wage rates and employer contributions for selected benefits, Journeymen and laborers: Selected cities byregion
(Average union hourly wage rates and employer contributions1 in the building trades by city, July 1, 1977)
City by region2
Journeymen
All cities...........................
New England........................Boston, Mass. (II)................New Bedford, Mass. (IV).......New Haven, Conn. (IV)........Providence, R.l. (IV) ............Stamford, Conn. (IV)............
Middle Atlantic ......................Albany, N.Y. (IV) ..................Buffalo, N.Y. (Ill) .................New York, N.Y. (I)................Newark, N.J. (Ill).................Philadelphia, Pa. (I)..............Pittsburgh, Pa. (II) ...............Rochester, N.Y. (Ill).............Scranton, Pa. (IV) ...............
Border States........................Baltimore, Md. (II)...............Louisville, Ky. (Ill)................Norfolk, Va. (Ill)...................Washington, D.C. (II) ...........
Southeast.............................Atlanta, Ga. (Ill)...................Chattanooga, Tenn. (IV).......Huntsville, Ala. (IV)..............Jacksonville, Fla. (II)............Memphis, Tenn. (II)..............Miami, Fla. (Ill) ....................Nashville-Davidson, Tenn. (Ill) St. Petersburg, Fla. (IV) .......
Southwest.............................Corpus Christi, Tex. (IV).......Dallas, Tex. (II)....................Fort Worth, Tex. (Ill)............Houston, Tex. (I) .................New Orleans, La. (II)...........San Antonio, Tex. (II)...........
See footnotes at end of table.
Average rate per
hour
Average employer
contribution per hour1
Average rate plus employer
contribution per hour1
City by region2Average rate per
hour
Average employer
contribution per hour1
Average rate plus employer
contribution per hour1
$10.44 $2.28 $12.73 Great Lakes................................... $10.76 $2.25 $13.01Akron, Ohio (III)........................... 10.50 1.95 12.44
10.02 1.96 11.98 Chicago, III. (I)............................. 11.08 1.82 12.8910.46 2.23 12.70 Cincinnati, Ohio (III)..................... 10.99 1.81 12.819.63 2.02 11.65 Cleveland, Ohio (II)...................... 11.23 2.74 13.989.88 1.50 11.38 Columbus, Ohio (II)...................... 10.58 1.64 12.219.53 2.07 11.60 Detroit, Mich. (I) .......................... 10.90 3.39 14.29
10.00 1.77 11.77 Flint, Mich. (IV)............................ 10.14 2.62 12.76Grand Rapids, Mich. (IV) .............. 9.52 1.97 11.49
10.80 2.75 13.55 Hammond, Ind. (IV) ..................... 11.13 1.93 13.0610.01 1.86 11.87 Indianapolis, Ind. (II)..................... 10.80 1.72 12.5311.62 2.17 13.79 Milwaukee, Wis. (II)...................... 10.50 2.43 12.9311.05 3.58 14.64 Minneapolis-St. Paul, Minn. (Ill) ..... 10.12 1.85 11.9710.97 2.47 13.44 Rockford, III. (IV)......................... 10.82 1.41 12.2310.77 2.90 13.67 Toledo, Ohio (III).......................... 11.67 2.39 14.0610.50 1.85 12.3510.73 2.02 12.76 Middle West .................................. 10.28 1.77 12.0510.15 1.88 12.03 Kansas City, Mo. (II)..................... 10.55 1.70 12.25
Omaha, Nebr. (Ill)........................ 10.10 1.68 11.789.92 1.49 11.41 St. Louis, Mo. (II) ......................... 10.34 2.11 12.459.82 1.76 11.58 Wichita, Kans. (Ill)........................ 9.99 1.17 11.16
10.11 1.64 11.768.94 .94 9.88 Mountain....................................... 10.15 1.92 12.07
10.53 1.64 12.17 Denver, Colo. (II)......................... 10.07 2.18 12.25Phoenix, Ariz. (II)......................... 10.58 2.28 12.86
9.07 1.13 10.20 Salt Lake City, Utah (IV)............... 9.95 1.50 11.459.15 1.51 10.668.95 .96 9.91 Pacific........................................... 11.02 3.35 14.379.26 .80 10.06 Fremont, Calif. (IV) ...................... 11.83 3.81 15.658.89 1.46 10.34 Fresno, Calif. (IV)......................... 11.06 3.26 14.329.79 1.11 10.90 Honolulu, Hawaii (III) .................... 9.74 3.58 13.329.15 1.44 10.59 Long Beach, Calif. (Ill) ................. 11.19 3.91 15.109.05 .83 9.88 Los Angeles, Calif. (I)................... 10.74 3.73 14.478.67 1.14 9.81 Portland, Oreg. (Ill)...................... 11.11 2.45 13.55
Riverside, Calif. (IV)..................... 11.20 3.80 15.009.34 1.16 10.50 Sacramento, Calif. (Ill) ................. 11.62 3.73 15.358.66 1.02 9.68 San Diego, Calif. (II)..................... 11.43 3.38 14.819.74 1.14 10.87 San Francisco, Calif. (II) ............... 11.97 3.67 15.649.75 1.02 10.76 Santa Ana, Calif. (IV).................... 10.73 3.57 14.30
10.10 1.52 11.63 Seattle, Wash. (II)........................ 11.28 2.27 13.559.72 1.15 10.87 Spokane, Wash. (IV)..................... 10.94 1.93 12.878.87 1.37 10.24
24
Digitized for FRASER http://fraser.stlouisfed.org/ Federal Reserve Bank of St. Louis

(Average union hourly wage rates and employer contributions1 in the building trades by city, July 1, 1977)
Table 17. Average wage rates and employer contributions for selected benefits, journeymen and laborers: Selected cities byregion—Continued
City by region2Average rate per
hour
Average employer
contribution per hour1
Average rate plus employer
contribution per hour1
City by region2Average rate per
hour
Average employer
contribution per hour1
Average rate plus employer
contribution per hour1
Helpers and laborers
All cities................................... $8.03 $1.71 $9.74 Great Lakes.................................. $8.70 $1.57 $10.27Akron, Ohio (III)........................... 9.50 1.19 10.69
New England................................. 7.89 1.24 9.13 Chicago, III. (I)............................. 8.59 1.63 10.22Boston, Mass. (II)......................... 7.90 1.32 9.22 Cincinnati, Ohio (III)..................... 9.98 1.09 11.07New Bedford, Mass. (IV)............... 8.10 1.30 9.40 Cleveland, Ohio (II)...................... 10.00 2.13 12.14New Haven, Conn. (IV) ................ 7.75 1.07 8.82 Columbus, Ohio (II)...................... 8.02 .95 8.97Providence, R.l. (IV) .................. 7.80 1.34 9.14 Detroit, Mich. (I) .......................... 9.00 2.41 11.41Stamford Conn. (IV)..................... 7.79 1.05 8.84 Flint, Mich. (IV)............................ 7.86 1.58 9.43
Grand Rapids, Mich. (IV) .............. 6.49 1.41 7.90Middle Atlantic.............................. 8.62 2.11 10.73 Hammond, Ind. (IV) ..................... 8.29 1.08 9.38
Albany, N.Y. (IV) ......................... 8.57 1.77 10.34 Indianapolis, Ind. (II).................... 7.69 1.00 8.70Buffalo, N.Y. (Ill) ......................... 8.29 2.44 10.73 Milwaukee, Wis. (II)...................... 9.08 2.03 11.11New York, N.Y. (I)........................ 8.89 2.69 11.58 Minneapolis-St. Paul, Minn. (Ill) ..... 8.37 1.10 9.46Newark, N.J. (Ill)...................... 8.33 1.54 9.87 Rockford, III. (IV)......................... 9.12 .92 10.05Philadelphia, Pa. (I)...................... 8.34 1.59 9.93 Toledo, Ohio (III)......................... 10.44 1.55 11.99Pittsburgh, Pa. (II)........................ 8.73 1.41 10.14Rochester, N.Y. (Ill)..................... 8.02 2.02 10.03 Middle West .................................. 8.16 1.22 9.38Scranton, Pa. (IV) ........................ 8.96 .90 9.86 Kansas City, Mo. (II).................... 8.16 1.33 9.49
Omaha, Nebr. (Ill)........................ 7.80 .90 8.70Border States .. . .................. 7.16 .78 7.95 St. Louis, Mo. (II) ......................... 9.05 1.74 10.79
Baltimore Md (II) ...... 7.09 .81 7.91 Wichita, Kans. (Ill)........................ 7.10 .75 7.85Louisville, Ky. (Ill)......................... 7.49 .81 8.31Norfolk, Va. (Ill)........................... 5.37 .38 575 Mountain....................................... 7.75 1.21 8.96Washington D C (II) 8.31 1.03 9.34 Denver, Colo. (II)......................... 7.11 1.07 8.18
Phoenix, Ariz. (II)......................... 8.34 1.91 10.25Southeast...................................... 6.13 .63 6.76 Salt Lake City, Utah (IV)............... 7.70 .76 8.46
Atlanta, Ga. (Ill)........................... 6.03 .50 6.53Chattanooga, Tenn (IV).... 6.23 .46 6.69 Pacific............................... ........... 8.19 3.06 11.25Huntsville, Ala. (IV)...................... 4.87 .65 5.52 Fremont, Calif. (IV) ...................... 8.72 3.64 12.36Jacksonville, Fla. (II).................... 5.36 .45 5.80 Fresno, Calif. (IV)......................... 8.47 3.73 12.20Memphis, Tenn. (II)...................... 6.49 .57 7.06 Honolulu, Hawaii (III) .................... 7.62 2.08 9.70Miami, Fla. (Ill) ............................ 6.80 1.39 8.19 Long Beach, Calif. (Ill) ................. 8.08 3.33 11.41Nashville-Davidson Tenn. (Ill)...... 6.20 .58 6.78 Los Angeles, Calif. (I)................... 7.89 3.33 11.22St Petersburg, Fla (IV) 6.34 .80 7.15 Portland, Oreg. (Ill)...................... 8.39 2.42 10.80
Riverside, Calif. (IV)..................... 8.51 3.61 12.12Southwest..................................... 6.46 .57 7.03 Sacramento, Calif. (Ill) ................. 8.58 3.94 12.53
Corpus Christi, Tex. (IV)................ 5.23 .39 5.62 San Diego, Calif. (II).................... 8.15 3.18 11.33Dallas, Tex. (II)............................ 6.52 .59 7.12 San Francisco, Calif. (II) ............... 8.91 3.51 12.41Fort Worth, Tex. (Ill)..................... 6.44 .68 7.12 Santa Ana, Calif. (IV).................... 7.90 3.37 11.27Houston, Tex. (I)......................... 7.63 .71 8.34 Seattle, Wash. (II)........................ 8.70 1.94 10.64New Orleans, La. (II) .................... 7.25 .46 7.70 Spokane, Wash. (IV).................... 7.82 1.52 9.34San Antonio, Tex. (II)................... 5.37 .63 6.00
1 Includes employer contributions to insurance (life insurance, hospitalization, medical, surgical, and other similar types of health and welfare programs) and pension funds and vacation payments to a fund or to the workers as provided in labor-management contracts. Averages presented are for a straight-time hour; in actual practice, however, some employer payments are calculated for total hours worked or gross payroll.
Average refers to all workers in the classification, including those for whom employer contributions were not specified in their particular contracts. Such situations were included in the average computation as zero contributions.
Some contracts also provide additional payments to other funds such as apprenticeship and unemployment benefits. Information on payments to these funds was not collected.
2 See table 11, footnote 1, for definitions of regions. Population size is shown in parentheses as follows: Group I = 1,000,000 or more; Group II = 500,000 to 1,000,000; Group III = 250,000 to 500,000; and Group IV = 100,000 to 250,000.
NOTE: Because of rounding, sums of individual items may not equal totals.
25
Digitized for FRASER http://fraser.stlouisfed.org/ Federal Reserve Bank of St. Louis

Table 18. Cents-per-hour and percent changes in average wage rates: Selected cities bypopulation group
(Changes in union hourly wage rates in the building trades by city, July 1, 1976-July 1, 1977)
Amount of change
City by population group Cents per hour changes Percent
All trades Journeymen Helpers and laborers All trades Journeymen Helpers and
laborers
All cities................................... 56 58 48 5.9 5.8 6.4
Population group I(1,000,000 and over) .................... 51 52 51 5.1 5.0 6.3Chicago, III.................................. 67 66 72 6.7 6.4 9.2Detroit, Mich............................... 74 75 68 7.4 7.3 8.2Houston, Tex.............................. 56 54 66 6.1 5.6 9.5Los Angeles, Calif........................ 30 32 4 2.9 3.1 .5New York, N.Y ............................ 43 42 46 4.2 4.0 5.4Philadelphia, Pa........................... 48 48 51 5.0 4.6 6.5
Population group II(500,000 to 1,000,000) .................. 64 64 64 6.8 6.5 8.5Baltimore, M d.............................. 56 62 37 6.5 6.7 5.5Boston, Mass.............................. 43 46 27 4.5 4.6 3.5Cleveland, Ohio........................... 77 63 151 7.5 5.9 17.7Columbus, Ohio........................... 57 48 84 6.1 4.8 11.7Dallas, Tex.................................. 63 69 39 7.5 7.6 6.4Denver, Colo............................... 58 55 70 6.5 5.8 10.9Indianapolis, Ind.......................... 69 73 53 7.3 7.3 7.5Jacksonville, Fla.......................... 29 31 21 3.6 3.6 4.2Kansas City, Mo.......................... 58 65 9 6.0 6.6 1.1Memphis, Tenn ........................... 57 57 58 6.4 6.1 9.7Milwaukee, Wis ........................... 63 59 79 6.6 5.9 9.6New Orleans, La......................... 55 56 50 6.3 6.1 7.4Phoenix, Ariz............................... 93 88 109 10.2 9.0 15.0Pittsburgh, Pa.............................. 77 78 70 8.1 8.1 8.7St. Louis, M o............................ . 46 47 44 4.8 4.8 5.1San Antonio, Tex......................... 51 56 28 6.6 6.7 5.5San Diego, Calif.......................... 94 98 83 9.8 9.4 11.3San Francisco, Calif.................... 77 81 53 7.1 7.3 6.3Seattle, Wash............................. 64 69 33 6.2 6.4 4.0Washington, D.C......................... 57 60 38 5.9 6.1 4.8
See note at end of table.
26
Digitized for FRASER http://fraser.stlouisfed.org/ Federal Reserve Bank of St. Louis

Table 18. Cents-per-hour and percent changes In average wage rates: Selected cities bypopulation group—Continued
(Changes in union hourly wage rates in the building trades by city, July 1, 1976-July 1, 1977)
Amount of change
City by population group Cents per hour changes Percent
All trades Journeymen Helpers and laborers All trades Journeymen Helpers and
laborers
Population group III (250,000 to 500,000) .................... 57 60 45 6.1 6.1 6.0Akron, Ohio................................. 77 81 43 8.0 8.3 4.8Atlanta, Ga.................................. 36 40 21 4.4 4.5 3.6Buffalo' N.Y................................ 53 63 18 5.1 5.8 2.3Cincinnati, Ohio........................... 70 70 70 6.9 6.8 7.5Fort Worth, Tex........................... 59 68 30 7.0 7.5 4.9Honolulu, Hawaii......................... 112 116 90 13.6 13.6 13.5Long Beach, Calif........................ 47 57 8 4.7 5.4 1.0Louisville, Ky............................... 36 34 47 3.8 3.5 6.7Miami, F la .................................. 5 4 7 .6 .5 1.0Minneapolis-St. Paul, Minn............ 59 61 50 6.4 6.4 6.4Nashville-Davidson, Tenn............. 64 63 67 7.9 7.5 12.2Newark, N.J................................ 51 51 46 5.0 4.9 5.8Norfolk, Va.................................. 60 61 54 7.7 7.3 11.2Omaha, Nebr.............................. 57 48 83 6.5 4.9 11.9Portland, Oreg............................. 81 84 51 8.1 8.2 6.4Rochester, N.Y............................ 30 39 O
513.0 3.8 O
Sacramento, Calif........................ 62 67 6.1 6.1 6.3Toledo, Ohio............................... 42 43 35 3.8 3.9 3.5Wichita, Kans.............................. 58 62 40 6.5 6.6 6.0
Population group IV (100,000 to 250,000) ..................... 52 56 32 5.8 6.0 4.5Albany, N.Y................................. 13 18 1 1.4 1.9 .1Chattanooga, Tenn...................... 47 49 40 5.9 5.8 6.8Corpus Christi, Tex...................... 63 64 56 8.2 8.0 12.0Flint, Mich ................................... 57 62 16 6.1 6.5 2.1Fremont, Calif.............................. 96 108 40 9.3 10.0 4.8Fresno, Calif............................... 63 64 49 6.2 6.2 6.1Grand Rapids, Mich..................... 54 57 39 6.4 6.4 6.4Hammond, Ind............................. 48 45 55 4.8 4.2 7.1Huntsville, Ala.............................. 46 48 35 5.7 5.5 7.7New Bedford, Mass..................... 18 17 22 2.0 1.8 2.8New Haven, Conn........................ 22 22 22 2.4 2.3 2.9Providence, R .l............................ 30 31 24 3.4 3.4 3.2Riverside, Calif............................ 57 70 30 5.8 6.7 3.7Rockford, III ................................ 59 58 62 5.8 5.7 7.2St. Petersburg, Fla....................... 12 13 5 1.5 1.5 .9Salt Lake City, Utah ..................... 72 73 69 8.3 7.9 9.9Santa Ana, Calif.......................... 45 62 1 4.7 6.1 .1Scranton, Pa............................... 89 93 63 9.8 10.0 7.5Spokane, Wash........................... 57 71 5 5.9 6.9 .7Stamford, Conn........................... 27 27 25 2.8 2.7 3.3
1 Less than 0.05 percent.
NOTE: Cents-per-hour and percent changes were calculated by averaging year-to-year increases with year-to-year decreases and no-change situations, weighted by current-year membership. Thus, relatively small increases may reflect the inclusion of cities where rates declined or remained unchanged for a trade.
Variations in the size of annual increases from survey to survey may be due, in part, to the timing of negotiations in relation to the July 1 survey reference date, and do not include increases made later that are retroactive to July 1 or before. Such retroactive increases are included in the wage rates reported in the following year’s survey.
Dash indicates no data reported.
27
Digitized for FRASER http://fraser.stlouisfed.org/ Federal Reserve Bank of St. Louis

Table 19. Cents-per-hour and percent changes In average wage rates: Selected cities byregion
(Changes in union hourly wage rates in the building trades by city, July 1, 1976-July 1, 1977)
Amount of change
City by region1 Cents per hour changes Percent
All trades Journeymen Helpers and laborers All trades Journeymen Helpers and
laborers
All cities................................... 56 58 48 5.9 5.8 6.4
New England................................. 30 31 24 3.2 3.2 3.1Boston, Mass. (II)......................... 43 46 27 4.5 4.6 3.5New Bedford, Mass. (IV)............... 18 17 22 2.0 1.8 2.8New Haven, Conn. (IVO................ 22 22 22 2.4 2.3 2.9Providence, R.l. (IV) ..................... 30 31 24 3.4 3.4 3.2Stamford, Conn. (IV).................... 27 27 25 2.8 2.7 3.3
Middle Atlantic .............................. 48 50 38 4.8 4.9 4.6Albany, N.Y. (IV) ......................... 13 18 1 1.4 1.9 .1Buffalo, N.Y. (Ill) ......................... 53 63 18 5.1 5.8 2.3New York, N.Y. (I)........................ 43 42 46 4.2 4.0 5.4Newark, N.J. (Ill)......................... 51 51 46 5.0 4.9 5.8Philadelphia, Pa. (I)...................... 48 48 51 5.0 4.6 6.5Pittsburgh, Pa. (II)........................ 77 78 70 8.1 8.1 8.7Rochester, N.Y. (Ill)..................... 30 39 (2) 3.0 3.8 (2)Scranton, Pa. (IV) ........................ 89 93 63 9.8 10.0 7.5
Border States................................ 53 55 43 5.9 5.8 6.4Baltimore, Md. (II)........................ 56 62 37 6.5 6.7 5.5Louisville, Ky. (Ill)......................... 36 34 47 3.8 3.5 6.7Norfolk, Va. (Ill)........................... 60 61 54 7.7 7.3 11.2Washington, D.C. (II).................... 57 60 38 5.9 6.1 4.8
Southeast...................................... 38 40 32 4.7 4.6 5.5Atlanta, Ga. (Ill)........................... 36 40 21 4.4 4.5 3.6Chattanooga, Tenn. (IV)................ 47 49 40 5.9 5.8 6.8Huntsville, Ala. (IV) ...................... 46 48 35 5.7 5.5 7.7Jacksonville, Fla. (II)..................... 29 31 21 3.6 3.6 4.2Memphis, Tenn. (II)...................... 57 57 58 6.4 6.1 9.7Miami, Fla. (Ill) ............................ 5 4 7 .6 .5 1.0Nashville-Davidson, Tenn. (Ill)....... 64 63 67 7.9 7.5 12.2St. Petersburg, Fla. (IV) ............... 12 13 5 1.5 1.5 .9
Southwest..................................... 59 62 47 7.2 7.1 7.8Corpus Christi, Tex. (IV)................ 63 64 56 8.2 8.0 12.0Dallas, Tex. (II)............................ 63 69 39 7.5 7.6 6.4Fort Worth, Tex. (Ill)..................... 59 68 30 7.0 7.5 4.9Houston, Tex. (I)......................... 56 54 66 6.1 5.6 *9.5New Orleans, La. (II).................... 55 56 50 6.3 6.1 7.4San Antonio, Tex. (II)................... 51 56 28 6.6 6.7 5.5
See footnotes at end of table.
28Digitized for FRASER http://fraser.stlouisfed.org/ Federal Reserve Bank of St. Louis

Table 19. Cents-per-hour and percent changes in average wage rates: Selected cities byregion—Continued
(Changes in union hourly wage rates in the building trades by city, July 1, 1976-July 1, 1977)
Amount of change
City by region1 Cents per hour changes Percent
All trades Journeymen Helpers and laborers All trades Journeymen Helpers and
laborers
Great Lakes................................... 64 64 66 6.6 6.3 8.2Akron, Ohio (III)........................... 77 81 43 8.0 8.3 4.8Chicago, III. (I)............................. 67 66 72 6.7 6.4 9.2Cincinnati, Ohio (III)..................... 70 70 70 6.9 6.8 7.5Cleveland, Ohio (II)...................... 77 63 151 7.5 5.9 17.7Columbus, Ohio (II)...................... 57 48 84 6.1 4.8 11.7Detroit, Mich. ( I) .......................... 74 75 68 7.4 7.3 8.2Flint, Mich. (IV)............................ 57 62 16 6.1 6.5 2.1Grand Rapids, Mich. (IV ).............. 54 57 39 6.4 6.4 6.4Hammond, Ind. (IV) ..................... 48 45 55 4.8 4.2 7.1Indianapolis, Ind. (II)..................... 69 73 53 7.3 7.3 7.5Milwaukee, Wis. (II)...................... 63 59 79 6.6 5.9 9.6Minneapolis-St. Paul, Minn. (Ill)..... 59 61 50 6.4 6.4 6.4Rockford, III. (IV)......................... 59 58 62 5.8 5.7 7.2Toledo, Ohio (III)......................... 42 43 35 3.8 3.9 3.5
Middle West .................................. 54 54 53 5.7 5.5 7.0Kansas City, Mo. (II)..................... 58 65 9 6.0 6.6 1.1Omaha, Nebr. (Ill)........................ 57 48 83 6.5 4.9 11.9St. Louis, Mo. (II) ......................... 46 47 44 4.8 4.8 5.1Wichita, Kans. (Ill)................ ....... 58 62 40 6.5 6.6 6.0
Mountain....................................... 74 71 82 8.3 7.6 11.8Denver, Colo. (II)......................... 58 55 70 6.5 5.8 10.9Phoenix, Ariz. (II)......................... 93 88 109 10.2 9.0 15.0Salt Lake City, Utah (IV)............... 72 73 69 8.3 7.9 9.9
Pacific........................................... 60 65 38 6.1 6.3 4.9Fremont, Calif. (IV) ...................... 96 108 40 9.3 10.0 4.8Fresno, Calif. (I\0 ......................... 63 64 49 6.2 6.2 6.1Honolulu, Hawaii (III).................... 112 116 90 13.6 13.6 13.5Long Beach, Calif. (Ill)................. 47 57 8 4.7 5.4 1.0Los Angeles, Calif. (I)................... 30 32 4 2.9 3.1 .5Portland, Oreg. (Ill)...................... 81 84 51 8.1 8.2 6.4Riverside, Calif. (IV)..................... 57 70 30 5.8 6.7 3.7Sacramento, Calif. (Ill) ................. 62 67 51 6.1 6.1 6.3San Diego, Calif. (II)..................... 94 98 83 9.8 9.4 11.3San Francisco, Calif. (II) ............... 77 81 53 7.1 7.3 6.3Santa Ana, Calif. (IV).................... 45 62 1 4.7 6.1 .1Seattle, Wash. (II)........................ 64 69 33 6.2 6.4 4.0Spokane, Wash. (IV)..................... 57 71 5 5.9 6.9 .7
1 See table 11, footnote 1, for definitions of regions. Population size is shown in parentheses as follows: Group I = 1,000,000 or more; Group II =
500,000 to 1,000,000; Group III = 250,000 to 500,000; and Group IV = 100,000 to 250,000.
2 Less than 0.05 percent.
29Digitized for FRASER http://fraser.stlouisfed.org/ Federal Reserve Bank of St. Louis

Table 20. Wage rates, hours, and employer contributions for selected benefits: Selected cities
(Union hourly wage rates, July 1, 1976, and wage rates, straight-time weekly hours, and employer insurance, pension, vacation, and othercontributions to funds in the building trades, July 1, 1977)
July 1, 1976 July 1, 1977
City and job classification Hoursper
week2
Employer contributions for selected benefits3Rate per
hour1Rate per
hour1 Insurance4 Pension Vacation Other5
Dollars Percent Dollars Percent Dollars Percent Dollars Percent
Akron, Ohio
Building construction
Journeymen
Asbestos workers................. $9,835 $10,685 40.00 0.550 0.800 6 1.500 0.030Boilermakers......................... 10.480 11.030 40.00 .800 - 1.100 - 6 1.000 - - -Bricklayers............................ 10.070 10.610 40.00 .730 - .550 - 6 1.000 - .080 -
Residential........................ 8.200 8.610 40.00 .730 - .550 - 6 1.000 - .080 -Carpenters........................... 10.000 11.550 40.00 .500 - .700 - - - .060 -Cement masons.................... 10.090 10.690 40.00 .600 - .750 - - - .080 -
Residential........................ 9.020 9.620 40.00 .600 - .750 - - - .080 -Electricians (inside
wirers:Industrial........................... 10.107 10.773 40.00 .680 .650 3.00 .040 6 10.00Residential........................ 6.525 6.786 40.00 .680 - - 3.00 - - .040 6 10.00
Elevator constructors............. 11.305 11.525 40.00 .545 - .350 - - 7 6.00 - 2.31Engineers— Power equip
ment operators:Master mechanics.............. 11.910 12.660 40.00 .560 1.000 .130Group A— Air compressors on steel erection, cranes, derricks, hoes, power shovels............................ 11.390 12.140 40.00 .560 1.000 .130
Group B— Asphalt pavers, scrapers, bulldozers, end-loaders, power graders, scoops...... 11.230 11.980 40.00 .560 1.000 .130
Group C— Asphalt rollers, forklifts,hoists.............................. 10.880 11.630 40.00 .560 1.000 .130
Group D— Compressors on building construction, conveyors, mixers, welder operators........ 10.070 10.820 40.00 .560 1.000 .130
Group E— Backfillers and tampers, bull floats, concrete spreading machines, tractors............................ 9.740 10.490 40.00 .560 1.000 .130
Group F— Oilers, helpers, signalmen, pumps....... 8.280 8.780 40.00 .560 _ 1.000 _ _ _ .130 .
Glaziers ............................... 9.490 10.090 40.00 .740 - .860 - - - .170 -Lathers ................................ 9.190 9.630 40.00 .730 - .500 - 1.000 - - -Marble setters ...................... 8.760 9.050 40.00 .680 - .500 - 6 1.500 - - -
Mosaic and terrazzo workers.............................. 8.760 9.050 40.00 .680 _ .500 . 6 1.500
Painters, brush ..................... 9.400 10.090 40.00 .780 - .600 - - - - -Swing stage, structural steel......................... 9.800 10.590 40.00 .780 _ .600 _ . .
Spray gun......................... 9.900 10.690 40.00 .780 - .600 - - - - -Paperhangers....................... 9.400 10.090 40.00 .780 - .600 - - - - -Pipefitters............................. 9.360 10.210 40.00 .790 - .900 - 6 1.250 - .150 -
Plasterers............................. 9.960 9.560 40.00 .600 - .750 - 6 1.000 - - -
Plumbers.............................. 9.360 10.210 40.00 .790 - .900 - 6 1.250 - .150 -Reinforcing iron workers........ 10.870 11.220 40.00 .800 - 1.100 - 6 1.000 - .030 -Roofers, composition............. 10.490 10.062 40.00 .730 - .550 - - 6 10.00 - -Roofers, slate and tile ............ 10.490 10.062 40.00 .730 - .550 - - 6 10.00 - -Sheet-metal workers.............. 9.105 9.819 40.00 .610 .840 ~ 6 10.00 .020 -
See footnotes at end of table.
30
Digitized for FRASER http://fraser.stlouisfed.org/ Federal Reserve Bank of St. Louis

Table 20. Wage rates, hours, and employer contributions for selected benefits: Selected cities—Continued
(Union hourly wage rates, July 1, 1976, and wage rates, straight-time weekly hours, and employer insurance, pension, vacation, and othercontributions to funds in the building trades, July 1, 1977)
City and job classification
Akron, Ohio —Continued
Building construction —Continued
Journeymen— Continued
Stonemasons..................Structural-iron workers.....Tile layers.......................
Helpers and laborers
Bricklayers’ tenders........Building laborers............Composition roofers’
helpers:First year...................Second year..............Third year...................
Elevator constructors’helpers........................
Marble setters’ helpers...Plasterers’ laborers.........Plumbers’ laborers......Terrazzo workers’
helpers........................Tile layers’ helpers..........
Highway and street construction
Journeymen
Carpenters...................Cement finishers...........Engineers— Power equip
ment operators:Master mechanics......Class A— Air compressors on steel erection, power shovels,cranes, derricks.......
Class B— Asphalt pavers, bulldozers, end- loaders, power graders, power scrapers ...
Class C— Mixers, concrete rollers (asphalt), asphalt plantengineers................
Class D— Backfillers, compressors (portable, sewer), concrete saws...............
July 1, 1976 July 1, 1977
Rate per hour1
Rate per hour1
Hoursper
week2
Employer contributions for selected benefits3
Insurance4 Pension Vacation Other5
Dollars Percent Dollars Percent Dollars Percent Dollars Percent
$10,070 $10,610 40.00 0.730 0.550 81.000 0.08010.870 11.220 40.00 .800 - 1.100 - 6 1.000 - .030 -
8.760 9.050 40.00 .680 .500 6 1.500
9.250 9.770 40.00 .650 .400 .1609.250 9.770 40.00 .650 - .400 - - - .160 -
5.661 6.039 40.00 .730 .550 8 10.006.606 7.047 40.00 .730 - .550 - - 6 10.00 - -
7.551 8.046 40.00 .730 - .550 - - 8 10.00 - -
7.914 8.068 40.00 .545 .350 _ _ 6.00 _ 2.318.260 8.550 40.00 .680 - .500 - 6 1.500 - - -9.450 9.970 40.00 .650 - .400 - - - .160 -9.450 9.970 40.00 .650 - .400 - - - .160 -
8.260 8.550 40.00 .680 _ .500 _ 8 1.500 _ _8.260 8.550 40.00 .680 .500 8 1.500
10.000 11.550 40.00 .500 .700 .0609.980 10.680 40.00 .600 - .150 - -
11.280 12.280 40.00 .560 - 1.000 - - - .040 -
11.030 12.030 40.00 .560 - 1.000 - - - .040 -
10.930 11.930 40.00 .560 - 1.000 - - - .040 -
9.890 10.890 40.00 .560 - 1.000 - - - .040 -
9.420 10.420 40.00 .560 - 1.000 - - - .040 -
See footnotes at end of table.
31
Digitized for FRASER http://fraser.stlouisfed.org/ Federal Reserve Bank of St. Louis

Table 20. Wage rates, hours, and employer contributions for selected benefits: Selected cities—Continued
(Union hourly wage rates, July 1,1976, and wage rates, straight-time weekly hours, and employer insurance, pension, vacation, and other contributions to funds in the building trades, July 1, 1977)
July 1, 1976 July 1, 1977
City and job classification Hoursper
week2
Employer contributions for selected benefits3Rate per
hour1Rate per
hour1 Insurance4 Pension Vacation Other5
Dollars Percent Dollars Percent Dollars Percent Dollars Percent
Akron, Ohio —Continued
Highway and street construction —Continued
Journeymen— Continued
Class E— Drum firemen, helpers, oilers, signalmen ............................ $8,030 $8,730 40.00 0.560 1.000 0.040
Structural iron workers........... 10.870 11.220 40.00 .800 - 1.100 - 6 1.000 - .030 -
Helpers and laborers
Laborers.............................. 8.150 8.700 40.00 .650 - .400 - - - .100 -
Other heavy construction
Journeymen
Carpenters........................... 9.940 11.550 40.00 .500 _ .700 _ _ _ .060 _Cement finishers................... 9.980 10.680 40.00 .600 - .150 - - - - -
Engineers— Power equipment operators:Master mechanics.............. 11.280 12.280 40.00 .560 1.000 .040Class A— Air compressors on steel erection, power shovels, cranes, derricks................ 11.030 12.030 40.00 .560 1.000 .040
Class B— Asphalt pavers, bulldozers, end- loaders, power graders, power scrapers.......... 10.930 11.930 40.00 .560 1.000 .040
Class C— Mixers, concrete rollers (asphalt), asphalt plant engineers......................... 9.890 10.890 40.00 .560 1.000 .040
Class D— Backfillers, compressors (portable, sewer), concrete saws....................... 9.420 10.420 40.00 .560 1.000 .040
Class E— Drum firemen, helpers, oilers, signalmen ............................ 8.030 8.730 40.00 .560 1.000
'.040
Structural iron workers........... 10.870 11.220 40.00 .800 - 1.100 - 6 1.000 - .030 -
Helpers and laborers
Laborers.............................. 8.150 8.700 40.00 .650 - .400 - - - .100 -
See footnotes at end of table.
32Digitized for FRASER http://fraser.stlouisfed.org/ Federal Reserve Bank of St. Louis

(Union hourly wage rates, July 1, 1976, and wage rates, straight-time weekly hours, and employer insurance, pension, vacation, and other contributions to funds in the building trades, July 1, 1977)
Table 20. Wage rates, hours, and employer contributions for selected benefits: Selected cities—Continued
July 1, 1976 July 1, 1977
City and job classification Hoursper
week2
Employer contributions for selected benefits3Rate per
hour1Rate per
hour1 Insurance4 Pension Vacation Other5
Dollars Percent Dollars Percent Dollars Percent Dollars Percent
Albany, N.Y.
Building construction
Journeymen
Asbestos workers................. $ 10.280 $11,420 35.00 0.630 0.280Boilermakers......................... 10.680 11.300 40.00 .950 - - 10.00 - - - -Bricklayers............................ 10.490 8 10.490 35.00 .700 - .350 - - - 0.080 -Carpenters........................... 9.400 9.200 35.00 .700 - .700 - 8 0.750 - .120 -
Millwrights......................... 9.900 9.700 35.00 .700 - .700 - 8 .750 - .120 -Residential........................ 7.200 6.713 35.00 .700 - .700 - 6.750 - .120 -
Cement finishers................... 10.490 10.490 35.00 .700 - .350 - - - .080 -Electricians (inside
wirers)............................... + 11.350 11.600 35.00 .700 . .550 3.00 _ .045 .Elevator constructors............. 10.040 10.620 40.00 .545 - .350 - - 6.00 .265 -Engineers— Power equip
ment operators:Guaranteed workweek:Heavy equipment:Shovels........................... 8 9.930 8 10.560 35.00 .550 .600 .400 2.31Cranes............................. 8 9.930 8 10.560 35.00 .550 - .600 - - - .400 2.31Derricks........................... 8 9.930 8 10.560 35.00 .550 - .600 - - - .400 2.31
Medium equipment: Letourneau graders........... 8 9.863 8 10.493 35.00 .550 _ .600 _ _ .400 2.31Trenching machines.......... 8 9.863 8 10.493 35.00 .550 - .600 - - - .400 2.31One-drum hoists............... 8 9.664 8 10.294 35.00 .550 - .600 - - - .400 2.31Bulldozers........................ 8 9.497 8 10.127 35.00 .550 - .600 - - - .400 2.31
Light equipment: Compressors.................... 8 9.264 8 9.895 35.00 .550 .600 _ .400 2.31Mechanical heaters........... 8 9.264 8 9.895 35.00 .550 - .600 - - - .400 2.31Pumps............................. 8 9.264 8 9.895 35.00 .550 - .600 - - - .400 2.31
Broken time:Heavy equipment:Shovels........................... 8 10.390 8 11.020 35.00 .550 .600 .400 2.31Cranes............................. 8 10.390 8 11.020 35.00 .550 - .600 - - - .400 2.31Derricks........................... 8 10.390 8 11.020 35.00 .550 - .600 - - - .400 2.31
Medium equipment: Letourneau graders........... 8 10.210 8 10.840 35.00 .550 . .600 . _ .400 2.31Trenching machines.......... 8 10.210 8 10.840 35.00 .550 - .600 - - - .400 2.31One-drum hoists............... 8 10.060 8 10.690 35.00 .550 - .600 - - - .400 2.31Bulldozers........................ 8 9.730 8 10.360 35.00 .550 - .600 - - - .400 2.31
Light equipment: Compressors.................... 8 9.540 8 10.170 35.00 .550 _ .600 _ _ _ .400 2.31Mechanical heaters........... 8 9.540 8 10.170 35.00 .550 - .600 - - - .400 2.31Pumps............................. 8 9.540 8 10.170 35.00 .550 - .600 - - - .400 2.31
Glaziers............................... 8.660 8.660 39.00 .780 - .300 - - - .010 -Lathers................................ 9.560 10.010 35.00 .700 - .300 - - - .130 -Marble setters...................... 8 8.950 10.050 40.00 .700 - .350 - - - - -Mosaic and terrazzo
workers.............................. 8 8.950 10.050 40.00 .700 _ .350 _ _ _ _
Painters, general................... 9.210 9.780 35.00 - - .350 * '.250 - .020 -
Bridge............................... 9.960 10.530 35.00 - - .350 - ‘ .250 - .020 -
Open steel structure........... 9.960 10.530 35.00 - - .350 - ‘ .250 - .020 -Swinging scaffold............... 9.710 10.280 35.00 - - .350 - 6.250 - .020 -
Sand blasting..................... 10.310 10.880 35.00 - - .350 - ' .250 - .020 -Spray gun........................ 10.310 10.880 35.00 - - .350 - ‘ .250 - .020 -
Paperhangers....................... 9.210 9.780 35.00 - - .350 - .250 - .020 -Plasterers............................. 10.490 10.490 35.00 .700 - .350 - - - .080 -
Plumbers.............................. 9.919 10.129 35.00 .800 - 1.020 - • .571 - .170 -
Reinforcing iron workers........ 9.600 9.600 40.00 .750 ~ 1.040 ~ '.500 .140 -
See footnotes at end of table.
33Digitized for FRASER http://fraser.stlouisfed.org/ Federal Reserve Bank of St. Louis

Table 20. Wage rates, hours, and employer contributions for selected benefits: Selected cities—Continued
(Union hourly wage rates, July 1, 1976, and wage rates, straight-time weekly hours, and employer insurance, pension, vacation, and othercontributions to funds in the building trades, July 1, 1977)
City and job classification
July 1, 1976 July 1, 1977
Employer contributions for selected benefits3Rate per
hour1Rate per
hour1
noursper
week2Insurance4 Pension Vacation Other5
Dollars Percent Dollars Percent Dollars Percent Dollars Percent
Albany, N.Y.— Continued
Building construction —Continued
Journeymen— Continued
Roofers, composition............. $9,100 $9,650 35.00 0.770 0.400 8 1.000 0.070Roofers, slate and tile ............ 9.100 9.650 35.00 .770 - .400 - 8 1.000 - .070 _Sheet-metal workers.............. 8 9.460 10.120 35.00 .950 - .900 - 8 .500 - .490 _
Residential........................ 6.120 6.120 40.00 0 .110 - 8.100 - .060 -Stonemasons........................ 10.490 10.490 35.00 .700 - .350 - - - .080 _Tile layers............................. 8.950 10.050 40.00 .700 - .350 - - - - -
Helpers and laborers
Building laborers................... 8.600 8.600 40.00 .800 1.000 .220Elevator constructors’
helpers.............................. 7.030 10 7.430 40.00 .545 _ .350 _ . 6.00 .265Marble setters’ helpers.......... 8.810 10 8.570 40.00 - - .590 - - - - -
Terrazzo workers’ helpers.............................. 8.810 10 8.570 40.00 _ _ .590 _ . .
Tile layers’ helpers................ 8.810 8.570 40.00 - - .590 - - - - -
Highway and street construction
Journeymen
Carpenters........................... 9.120 9.320 40.00 .700 .700 .097Cement finishers................... 9.150 9.550 40.00 .700 - .350 - - - .140 . -Engineers— Power equip
ment operators:Class A— Backhoes, cranes draglines, piledrivers........................ 9.690 10.150 40.00 .600 .600 .450 2.31
Class B— Concrete pumps, one-drum hoists, rollers,trenchers.......................... 9.370 9.820 40.00 .600 .600 .450 2.31
Class C— Forklifts, hydraulic hammers, concrete pavement spreaders and finishers .............................. 8.690 9.100 40.00 .600 .600 .450 2.31
Class D— Concrete mixers (16S and under), form tampers, tractors ................................. 7.900 8.270 40.00 .600 .600 .450 2.31
Helpers and laborers
General laborers, drill helpers, flagmen................. 7.440 7.640 40.00 .800 .950 .246
Bull floats, chain saws, concrete aggregate, bin handlers of steel mesh........ 7.640 7.840 40.00 .800 - .950 - - - .246 -
See footnotes at end of table.
34
Digitized for FRASER http://fraser.stlouisfed.org/ Federal Reserve Bank of St. Louis

Table 20. Wage rates, hours, and employer contributions for selected benefits: Selected cities—Continued
(Union hourly wage rates, July 1, 1976, and wage rates, straight-time weekly hours, and employer insurance, pension, vacation, and other contributions to funds in the building trades, July 1, 1977)
July 1, 1976 July 1, 1977
City and job classification Hoursper
week2
Employer contributions for selected benefits3Rate per
hour1Rate per
hour1 Insurance4 Pension Vacation Other5
Dollars Percent Dollars Percent Dollars Percent Dollars Percent
Albany, N.Y. —Continued
Highway and street construction —Continued
Helpers and laborers — Continued
Acetylene torches, asphalt rakers, rock or drillingmachines........................... $7,840 $8,040 40.00 0.800 0.950 0.246
Blasters, form setters, stone or granite curb setters............................... 8.040 8.240 40.00 .800 _ .950 _ _ _ .246 _
Other heavy construction
Journeymen
Carpenters........................... 9.120 9.320 40.00 .700 .700 .097Cement finishers................... 9.150 9.550 40.00 .700 - .350 - - - .140 -
Engineers— Power equipment operators:Class A— Backhoes, cranes, draglines, piledrivers........................ 9.690 10.150 40.00 .600 .600 .450 2.31
Class B— Concrete pumps, one-drum hoists, rollers,trenchers.......................... 9.370 9.820 40.00 .600 .600 .450 2.31
Class C— Forklifts, hydraulic hammers, concrete pavement spreaders and finishers ............... ............... 8.690 9.100 40.00 .600 .600 .450 2.31
Class D— Concrete mixers (165 and under), form tampers, tractors ................................. 7.900 8.270 40.00 .600 .600 .450 2.31
Helpers and laborers
General laborers, drill helpers, flagmen................. 7.440 7.640 40.00 .800 .950 .246
Bull floats, chain saws, concrete aggregate, bin handlers of steel mesh........ 7.640 7.840 40.00 .800 .950 .246
Acetylene torches, asphalt rakers, rock or drilling machines................. 7.840 8.040 40.00 .800 .950 .246
Blasters, form setters, stone or granite curb setters............................... 8.040 8.240 40.00 .800 - .950 - - - .246 -
See footnotes at end of table.
35
Digitized for FRASER http://fraser.stlouisfed.org/ Federal Reserve Bank of St. Louis

(Union hourly wage rates, July 1, 1976, and wage rates, straight-time weekly hours, and employer insurance, pension, vacation, and other contributions to funds in the building trades, July 1, 1977)
Table 20. Wage rates, hours, and employer contributions for selected benefits: Selected cities—Continued
July 1, 1976 July 1, 1977
City and job classification Hoursper
week2
Employer contributions for selected benefits3Rate per
hour1Rate per
hour1 Insurance4 Pension Vacation Other5
Dollars Percent Dollars Percent Dollars Percent Dollars Percent
Atlanta, Ga.
Building construction
Journeymen
Asbestos workers................. $8,650 $8,850 40.00 0.450 0.500 0.500Boilermakers......................... 8.800 9.300 40.00 .950 - 1.000 - - - - ■ -Bricklayers............................ 8.200 8.600 40.00 .550 - .500 - .650 - 0.080 -Carpenters........................... 8.750 9.100 40.00 .400 - .450 - - - - -
Millwrights......................... 8.850 8.850 40.00 .450 - .500 - - - - -Piledrivers......................... 8.900 9.250 40.00 .400 - .450 - - - - -
Cement finishers................... 8.350 8.750 40.00 .400 - .550 - - - - -T roweling-machine operators......................... 8.480 8.880 40.00 .400 _ .550 _ _ _ _ .
Drywall tapers(finishers)............................ 8.700 9.100 40.00 .450 _ .550 _ _ _ _ _
Electricans (inside wirers)............................... 8.970 9.292 40.00 _ 9.00 _ 11.00 _ 6 8.00 . .
Elevator constructors............. 8.920 9.430 40.00 .545 - .350 - - 6.00 .020 2.30Engineers— Power equip
ment operators:Group A— Air compressors, cranes, derricks, draglines, hoists, shovels, trenching machines (over 6 ft. depth) .............. 8.500 8.500 40.00 .500 .750
Group B— Trenching machines (to 6 ft.), scrapers, bulldozers, tractors, special equipment........................ 8.150 8.150 40.00 .500 .750
Group C— Air compressors (600 cu. ft. or batteries of two, 300 cu. ft. and over)................ 6.480 6.480 40.00 .500 .750
Group D— Pumps (over 4 in. up to batteries of 4 )................................. 5.930 5.930 40.00 .500 .750
Group E— Mixers (skip type), except paving, rollers.............................. 6.280 6.280 40.00 .500 .750
Group F— Air compressors (up to and including 300 cu. ft.), pumps (4 in. or less)......... 5.260 5.260 40.00 .500 .750
Glaziers............................... 7.950 8.450 40.00 .600 - .380 - 6.700 - - 2.30Lathers................................ 7.900 8.450 40.00 .400 - .350 - 6 .500 - .100 -
Marble setters...................... 8.000 8.250 40.00 .550 - .500 - 6 .700 - .100 -
Mosaic and terrazzo workers.............................. 8.000 8.250 40.00 .550 _ .500 _ 6.700 _ .100
Painters............................... 8.700 9.100 40.00 .450 - .550 - - - - -Steel and swing stage........ 9.200 9.600 40.00 .450 - .550 - - - - -Spray............................... 9.700 10.100 40.00 .450 - .550 - - - - -
Paperhangers....................... 8.950 9.350 40.00 .450 - .550 - - - - -Pipefitters............................. 9.250 9.650 40.00 .650 - .500 - 6.500 - .060 -Plasterers............................. 8.570 9.020 40.00 .400 - .550 - - - .100 -Plumbers.............................. 9.250 9.650 40.00 .650 - .500 - 6 .500 - .060 -Reinforcing iron workers........ 8.600 9.250 40.00 .650 - .570 - - - - -Roofers, composition............. 6.750 6.750 40.00 .300 ~ .200 “
See footnotes at end of table.
36
Digitized for FRASER http://fraser.stlouisfed.org/ Federal Reserve Bank of St. Louis

Table 20. Wage rates, hours, and employer contributions for selected benefits: Selected citlee—Continued
(Union hourly wage rates, July 1, 1976, and wage rates, straight-time weekly hours, and employer insurance, pension, vacation, and other contributions to funds in the building trades, July 1, 1977)
July 1, 1976 July 1, 1977
City and job classification Hoursper
week2
Employer contributions for selected benefits3Rate per
hour1Rate per
hour1 Insurance4 Pension Vacation Other5
Dollars Percent Dollars Percent Dollars Percent Dollars Percent
Atlanta, Qa. — Continued
Building construction — Continued
Journeymen— Continued
Roofers, slate and tile ............ $7,000 $7,000 40.00 0.300 0.200Sheet-metal workers.............. 8.600 9.100 40.00 .500 - .810 - 6 0.500 - - -
Stonemasons........................ 8.200 8.600 40.00 .550 - .500 - 6 .650 - 0.080 -
Structural-iron workers........... 8.600 9.250 40.00 .650 - .570 - - - - -Sheeters........................... 8.850 9.500 40.00 .650 - .570 - - - - -
Tile layers............................. 8.000 8.250 40.00 .550 - .500 - 6.700 - .100 -
Helpers and laborers
Bricklayers’ tenders............... 5.800 6.000 40.00 .200 .250 .050Mortar mixers.................... 5.920 6.120 40.00 .200 - .250 - - - .050 -
Building laborers ................... 5.800 6.000 40.00 .200 - .250 - - - .050 -Elevator constructors’
helpers.............................. 6.240 6.600 40.00 .545 _ .350 _ 6.00 .020 2.30Plasterers’ laborers................ 5.800 6.000 40.00 .200 - .250 - - - .050 -
Plumbers’ laborers................. 5.800 6.000 40.00 .200 - .250 - - - .050 -
Roofers’ helpers.................... 5.000 5.000 40.00 .300 - .200 - - - - -
Other heavy construction
Journeymen
Engineers— Power equipment operators:Group A— Concrete pumps, cranes, pile- drivers ............................. 8.500 8.500 40.00 .450 .500 4.22
Group B— Firemen (stationary or portable)............ 7.700 7.700 40.00 .450 _ .500 _ _ _ 4.22
Group C— Air compressors, 600 cu. ft. and over................................ 6.480 6.480 40.00 .450 .500 4.22
Group D— Oilers— Truck and locomotive................ 7.030 7.030 40.00 .450 _ .500 _ _ _ 4.22
Group E— Concrete pumps (boom type), water pumps (over 4 in. and battery of 4) .......... 5.930 5.930 40.00 .450 .500 4.22
Group F— Air compressors (up to and including 300 cu. ft.), water pumps (4 in. or less), sand blasting machines......................... 5.260 5.260 40.00 .450 .500 4.22
See footnotes at end of table.
37
Digitized for FRASER http://fraser.stlouisfed.org/ Federal Reserve Bank of St. Louis

Table 20. Wage rates, hours, and employer contributions for selected benefits: Selected cities—Continued
(Union hourly wag© rates, July 1, 1976, and wag© rates, straight-time weekly hours, and employer insurance, pension, vacation, and othercontributions to funds in the building trades, July 1, 1977)
City and job classification
July 1, 1976 July 1, 1977
Employer contributions for selected benefits3Rate per
hour1Rate per
hour1i-ioursper
week2Insurance4 Pension Vacation Other5
Dollars Percent Dollars Percent Dollars Percent Dollars Percent
Baltimore, Md.
Building construction
Journeymen
Asbestos workers................. +$8,570 $8,870 40.00 0.850 _ 0.950 . . 0.600Boilermakers......................... + 10.200 10.950 40.00 .900 - 1.000 - - _ 6.000 _Bricklayers............................ 9.350 9.950 40.00 .700 - .500 - - - .100 -Carpenters........................... 9.300 9.550 40.00 .750 - .690 - 6 0.250 - .030 -
Millwrights......................... 9.400 9.850 40.00 .750 - .690 - 6 .250 - .030 -Residential........................ 7.340 6.250 40.00 .750 - .690 - 6 .250 - .030 -
Cement finishers................... + 10.000 + 10.000 40.00 .600 . - .550 - - - .060 -Electricians (inside
wirers)............................... 9.200 10.200 40.00 .700 - .400 3.00 6 .400 - .400 -Elevator constructors............. 10.415 10.710 40.00 .745 - .350 - - 5.00 .020 2.30Engineers— Power equip
ment operators:Heavy equipment— Derricks, power cranes, shovels, elevatinggraders............................ +9.650 9.660 40.00 .850 - .850 - 6 .200 - - 2.30
Medium equipment— Temporary elevators,concrete pumps, single drum hoists................ +9.110 9.110 40.00 .850 _ .850 _ 6.200 . 2.30
Light equipment:Compressors, pumps........ +8.650 8.660 40.00 .850 - .850 - 6.200 - - 2.30
Bulldozers......................... 8.900 9.110 40.00 .850 - .850 - 6.200 - - 2.30Glaziers ............................... +9.770 9.970 40.00 .800 - 1.530 - - - .020 -Lathers ................................ 7.590 9.090 40.00 - - .350 - - - 1.000 -Machinists............................ 10.000 11.250 40.00 .900 - .550 - .462 - 6 .000 -Marble masons..................... 8.850 9.950 40.00 .700 - .500 - - - .100 -Mosaic and terrazzo
workers.............................. 7.510 8.210 40.00 .700 - .500 - - - .100 -Painters ............................... 8.200 8.700 40.00 .850 - .500 - 6 .500 - - -
Structural steel.................. 8.700 9.200 40.00 .850 - .500 - 6 .500 - - _Spray............................... 8.450 8.950 40.00 .850 - .500 - 6 .500 - - -
Paperhangers....................... 8.350 8.850 40.00 .850 - .500 - 6 .500 - - -Pipefitters............................. 9.480 10.230 40.00 .720 - .800 - .500 - .070 -Plasterers............................. 7.950 8.950 40.00 .600 - .400 - .500 - .291 -Plumbers.............................. 9.700 10.300 40.00 .790 - .830 - - - .070 -Reinforcing iron workers........ +9.770 9.970 40.00 .800 - 1.530 - - .020 -Roofers, composition............. 7.750 8.150 40.00 .350 - .400 - - - - -
Mopmen........................... 8.200 8.600 40.00 .350 - .400 - - - - -Roofers, slate and tile ........... 8.200 8.600 40.00 .350 - .400 - - - - -
Precast slab...................... 8.750 9.150 40.00 .350 - .400 - - - - -Sheet-metal workers.............. 9.120 9.620 40.00 .750 - .700 - 6 .500 - .070 -Stonemasons........................ 8.850 9.950 40.00 .700 - .500 - - - .100 -Structural-iron workers........... +9.770 9.970 40.00 .800 - 1.530 - - - .020 -Tile setters........................... 7.510 8.210 40.00 .700 - .500 - - - .100 -
Helpers and laborers
Building laborers................... + 7.000 7.050 40.00 .300 _ .500 _ _ .105 _Elevator constructors’
helpers.............................. 7.290 7.500 40.00 .745 - .350 - - 5.00 .020 2.30Marble setters’ helpers.......... 6.625 6.675 40.00 .400 - .200 - - - - -Plasters’ laborers.................. +6.850 +7.200 40.00 .300 - .500 - - - .105 -
Hod carriers....................... + 7.100 + 7.450 40.00 .300 ~ .500 ~ - .105 -
See footnotes at end of table.
38
Digitized for FRASER http://fraser.stlouisfed.org/ Federal Reserve Bank of St. Louis

Table 20. Wage rates, hours, and employer contributions for selected benefits: Selected cities—Continued
(Union hourly wage rates, July 1, 1976, and wage rates, straight-time weekly hours, and employer insurance, pension, vacation, and other contributions to funds in the building trades, July 1, 1977)
July 1, 1976 July 1, 1977
City and job classification Hoursper
week2
Employer contributions for selected benefits3Rate per
hour1Rate per
hour1 Insurance4 Pension Vacation Other5
Dollars Percent Dollars Percent Dollars Percent Dollars Percent
Baltimore, Md. —Continued
Building construction —Continued
Helpers and laborers — Continued
Mason tenders.................... +$6,750 +$7,300 40.00 0.300 0.500 0.105Mortar mixers..................... +6.750 + 7.300 40.00 .300 - .500 - - - .105 -
Plumbing laborers................. +7.000 7.050 40.00 .300 - .500 - - - .105 -
Terrazzo workers’ helpers.............................. 6.625 6.675 40.00 .400 _ .200 _ _ _ .
Tile layers’ helpers................ 6.625 6.675 40.00 .400 - .200 - - - - -
Highway and street construction
Journeymen
Engineers— Power equipment operators:Heavy equipment— Derricks, power cranes, shovels, elevating graders............................ 8.670 8.880 40.00 .850 .850 6 0.200 2.30
Light equipment— Tractors with attachments....... 8.170 8.380 40.00 .850 _ .850 _ 6.200 _ _ 2.30
Compressors, fuel trucks, grease .................. 7.670 7.880 40.00 .850 _ .850 _ 6 .200 _ _ 2.30
Structural iron workers........... 9.770 11 9.770 40.00 .800 - 1.530 - - - .020 -
Helpers and laborers
Construction laborers............ 5.550 6.100 40.00 .300 .500 .105
Other heavy construction
Journeymen
Structural iron workers........... +9.770 8 9.770 40.00 .800 1.530
Birmingham, Ala.
Building construction
Journeymen
Asbestos workers ................. 8.910 9.560 40.00 .450 .400 6 .600 .050Boilermakers......................... 8.800 9.300 40.00 .950 - 1.000 - - - - -Bricklayers............................ 8.750 9.350 40.00 .250 - .250 - - - .050 -Carpenters........................... 7.750 8.350 40.00 .500 - .250 - - - .030 -
Floorlayers........................ 7.750 8.350 40.00 .500 - .250 - - - .030 -Millwrights......................... 9.150 9.850 40.00 - - - - - - .030 -Piledrivers......................... 7.950 8.550 40.00 .500
'.250
‘.030 _
See footnotes at end of table.
39
Digitized for FRASER http://fraser.stlouisfed.org/ Federal Reserve Bank of St. Louis

Table 20. Wage rates, hours, and employer contributions for selected benefits: Selected cities—Continued
(Union hourly wage rates, July 1, 1976, and wage rates, straight-time weekly hours, and employer insurance, pension, vacation, and othercontributions to funds in the building trades, July 1, 1977)
City and job classification
Birmingham, Ala. —Continued
Building construction —Continued
Journeymen— Continued
Cement finishers.............Drywall tapers(finishers)......................
Electricians (insidewirers)...........................Elevator constructors.......Engineers— Power equipment operators:Building construction:
Group A— Motor graders and bulldozers ......................
Group B— Air compressors (over 125)pumps (over 4 in.)......
Group C— Air compressors (125 andunder), oilers.............
Steel construction:Group A— Cranes, derricks, draglines, hoists,piledrivers................
Group B— Tractors,air compressors.......
Group C— Air compressors (125 and under 2 or less),oilers.......................
Glaziers .........................Lathers..........................Mosaic and terrazzoworkers.........................
Painters.........................Residential..................Spray.........................
Paperhangers.................Pipefitters.......................Plasterers.......................Plumbers........................Reinforcing iron workers ....Roofers, composition.......Roofers, slate and tile ......Sheet-metal workers........Stonemasons..................Structural-iron workers.....
Sheeters.....................Tile layers.......................
Helpers and laborers
Bricklayers’ tendersMortar mixers...
Building laborers ....
July 1, 1976 July 1, 1977
Rate per hour1
Rate per hour1
Hoursper
week2
Employer contributions for selected benefits3
Insurance4 Pension Vacation Other5
Dollars Percent Dollars Percent Dollars Percent Dollars Percent
$7,530 $7,980 40.00 0.500 0.030
7.800 8.650 40.00 - - 0.600 - - - .050 -
9.600 10.100 40.00 .300 _ .400 3.00 _ _ _9.140 9.740 40.00 .545 .350 6.00 .020 2.30
8.140 8.640 40.00 .400 - .300 - - - .030 -
7.910 8.310 40.00 .400 - .300 - - - .030 -
7.140 7.440 40.00 .400 - .300 - - - .030 -
8.840 9.340 40.00 .400 _ .300 _ _ .030 _
8.430 8.830 40.00 .400 - .300 - - - .030 -
7.270 7.570 40.00 .400 .300 .0307.230 7.980 40.00 .500 - .500 - 6 0.250 - - 2.307.580 8.130 40.00 - - .100 - 6.500 - .030 -
8.200 8.700 40.00 _ _ .400 _ _ _ _ _7.800 8.650 40.00 - - .600 - - - .050 -7.750 8.300 40.00 - - .600 - - - .050 _8.300 9.150 40.00 - - .600 - - - .050 _7.950 8.800 40.00 - - .600 - - - .050 _
10.250 10.250 40.00 .580 - .650 - 6.500 - .040 -7.670 8.120 40.00 .500 - - - - - .030 _
10.250 10.250 40.00 .580 - .650 - 6.500 - .040 _8.500 9.250 40.00 .600 - .815 - - - .030 _
7.500 8.350 40.00 - - .200 - - - _ _
7.750 8.600 40.00 - - .200 - - - - _
9.850 10.150 40.00 .690 - .820 - - - .030 -
8.750 9.350 40.00 .250 - .250 - - - .050 _
8.500 9.250 40.00 .600 - .815 - - - .030 _
8.500 9.250 40.00 .600 - .815 - - - .030 _8.200 8.700 40.00 .400
'
5.400 5.850 40.00 .250 .300 .0605.500 5.950 40.00 .250 - .300 - - - .060 _
5.400 5.850 40.00 .250 - .300 - - - .060 -
See footnotes at end of table.
40
Digitized for FRASER http://fraser.stlouisfed.org/ Federal Reserve Bank of St. Louis

Table 20. Wage rates, hours, and employer contributions for selected benefits: Selected cities—Continued
(Union hourly wage rates, July 1, 1976, and wage rates, straight-time weekly hours, and employer insurance, pension, vacation, and other contributions to funds in the building trades, July 1, 1977)
July 1, 1976 July 1, 1977
City and job classification Hoursper
week2
Employer contributions for selected benefits3Rate per
hour1Rate per
hour1 Insurance4 Pension Vacation Other5
Dollars Percent Dollars Percent Dollars Percent Dollars Percent
Birmingham, Ala. —Continued
Building construction —Continued
Helpers and laborers — Continued
Air or electric tool operators........................ $5,550 $6,000 40.00 0.250 0.300 0.060
Elevator constructors’ helpers............................... 6.400 6.820 40.00 .545 _ .350 _ _ 6.00 .020 2.30
Plasterers’ laborers (hod carriers)....................... 5.450 5.900 40.00 .250 - .300 - - - .060 -
Highway and street construction
Journeymen
Engineers— Power equipment operators:Group A— Piledrivers hoists, mixers,shovels, dozers................. 5.600 6.000 40.00 .400 .300
Group B— Crushers, breakers, finishing machines, winch trucks....... 5.500 5.900 40.00 .400 .300
•
Group C— Air compressors, pumps, hoists, front-end loaders.............................. 5.000 5.400 40.00 .400 .300
Helpers and laborers
Building laborers................... 3.750 4.000 40.00 .200 .300 .030Batch truck dumpers............. 3.750 4.000 40.00 .200 - .300 - - - .030 -
Air tool operators............... 3.900 4.150 40.00 .200 - .300 - - - .030 -
Mortar mixers.................... 4.000 4.250 40.00 .200 - .300 - - - .030 -
Pipe layers........................ 3.850 4.100 40.00 .200 - .300 - - - .030 -
Other heavy construction
Journeymen
Carpenters........................... 7.350 8.100 40.00 .450 .300 .030Piledrivers ......................... 7.550 8.300 40.00 .450 - .300 - - - .030 -
Cement finishers................... 7.380 7.680 40.00 .300 ~ “ - .030 -
See footnotes at end of table.
41
Digitized for FRASER http://fraser.stlouisfed.org/ Federal Reserve Bank of St. Louis

Table 20. Wage rates, hours, and employer contributions for selected benefits: Selected cities—Continued
(Union hourly wage rates, July 1, 1976, and wage rates, straight-time weekly hours, and employer insurance, pension, vacation, and othercontributions to funds in the building trades, July 1, 1977)
July 1,
City and job classification
1976
Rate per Rate per hour1 hour1
Hoursper
week2Insurance4
July 1, 1977
Employer contributions for selected benefits3
Pension Vacation Other5
Dollars Percent Dollars Percent Dollars Percent Dollars Percent
Birmingham, Ala. —Continued
Other heavy construction —Continued
Journeymen— Continued
Engineers— Power equipment operators:Group A— Bulldozers, boom tractors, cranes, derricks, draglines, concrete pumps, push tractors, compressors (2 or more within 200 ft. radius), hoists (2 drums or more), mixers (5 bags or over), rollers (asphalt), motor graders, pile- drivers, scrapers, shovels, trenchingmachines...................
Group B— Hoists (1 drum), rollers (other than asphalt), pumps (2 or more 4 in. and over, within 200 ft.radius).......................
Group C— Air compressors, blade graders (pull type), mixers (under 5 bags).....
Group D— Air compressors (125 and under), pumps 3 or less, (under 4 in.), oilers........................
$8,410
7.970
7.720
7.160
$9,110
8.570
8.220
7.610
40.00
40.00
40.00
40.00
0.400
.400
.400
.400
0.300
.300
.300
.300
0.030
.030
.030
.030
Boston, Mass.
Building construction
Journeymen
Asbestos workers .........Boilermakers................Bricklayers....................Carpenters...................Cement finishers...........Electricians (inside
wirers).......................Elevator constructors.....Engineers— Power equip
ment operators:Heavy equipment: Power shovels, pile- drivers, hoisting engines..................
9.26010.6809.900
10.00010.200
9.86011.30010.10010.40010.450
40.0040.0040.0040.0040.00
.900
.950
.850
.600
.950
.900
1.1001.000.500
10.001.000
.090
.020
10.000 10.25010.665 11.445
40.0040.00
.750
.545 3.501.550.350
3.006.00
12 1.050 .284
10.610 11.050 40.00 1.100 1.000 .400
See footnotes at end of table.
42
Digitized for FRASER http://fraser.stlouisfed.org/ Federal Reserve Bank of St. Louis

Table 20. Wage rates, hours, and employer contributions for selected benefits: Selected cities—Continued
(Union hourly wage rates, July 1, 1976, and wage rates, straight-time weekly hours, and employer insurance, pension, vacation, and othercontributions to funds in the building trades, July 1, 1977)
City and job classification
July 1, 1976 July 1, 1977
Rate per hour1
Rate per hour1
Hoursper
week2
Employer contributions for selected benefits3
Insurance4 Pension Vacation Other5
Dollars Percent Dollars Percent Dollars Percent Dollars Percent
$10,490 $10,930 40.00 1.100 1.000 0.400
8.860 9.210 40.00 1.100 1.000 .400+9.100 9.700 40.00 .570 - .640 - 6 0.700 - - -
9.750 10.550 40.00 .650 - .550 - - - .030 -
9.750 9.800 40.00 .850 - 1.100 - - - .050 -
9.750 9.800 40.00 .850 _ 1.100 _ _ _ .050 _9.760 10.060 40.00 .820 - 1.150 - - - .050 -
10.760 11.060 40.00 .820 - 1.150 - - - .050 -
11.880 12.180 40.00 .820 - 1.150 - - - .050 -
10.260 11.260 40.00 .940 - 1.200 - 6 .500 - .120 -
10.980 11.510 40.00 .600 - .900 - 6.500 - - -
10.260 11.260 40.00 .940 . 1.200 6.500 .1209.250 9.700 40.00 .550 - - - - - 1.650 -
10.800 10.800 40.00 1.020 - 1.280 - 6 .400 - .050 -
9.740 10.340 40.00 1.000 - 1.500 - 6 .250 - .060 -
9.500 9.950 40.00 .700 - 1.450 - 6 .250 - .120 -
9.500 9.950 40.00 .700 _ 1.450 _ 6.250 _ .120 _
9.500 10.200 40.00 .700 - 1.450 - 6 .250 - .120 -
9.830 10.680 40.00 1.160 - 1.100 - 6 .300 - .100 -
9.900 10.100 40.00 .850 - 1.100 - - - .090 -
9.740 10.340 40.00 1.000 - 1.500 - 6.250 - .060 -
9.740 10.340 40.00 1.000 - 1.500 - 6 .250 - .060 _
9.750 9.800 40.00 .850 1.100
7.750 8.000 40.00 .600 .700 .1707.750 8.000 40.00 .600 - .700 - - - .170 -
7.500 7.750 40.00 .600 _ .700 _ _ _ .170 _7.500 7.750 40.00 .600 - .700 - - - .170 -
7.500 7.750 40.00 .600 - .700 - - - .170 -
7.465 8.010 40.00 .545 3.50 .350 _ _ 6.00 .284 _8.710 8.900 40.00 .850 - .500 - - - - -
7.750 8.000 40.00 .600 _ .700 - _ _ .170 _7.750 8.000 40.00 .600 - .700 - - - .170 -
9.950 9.950 40.00 _ _ .750 - _ .050 _8.710 8.900 40.00 .850 .500 - -
Boston, Mass. —Continued
Building construction —Continued
Journeymen— Continued
Medium equipment: Bulldozers, graders, scrapers (21 yardsstruck or less)...........
Light equipment:Pumps, compressors,welding machines.......
Glaziers ...........................Lathers ............................Marble setters..................Mosaic and terrazzo
workers.........................Painters...........................
Spray...........................Structural steel..............
Pipefitters.........................Sprinkler fitters..............Refrigeration and air conditioning mechanics ..............................
Plasterers.........................Plumbers.........................Reinforcing iron workers....Roofers, composition.........
Waterproof and damp-proof ...........................
Roofers, slate and tile .......Sheet-metal workers..........Stonemasons....................Structural-iron workers.......
Electric welders.............Tile layers.........................
Helpers and laborers
Bricklayers’ tendersAgreement A .....................Agreement B .....................
Building laborers:Agreement A .....................Agreement B .....................Agreement C .....................
Elevator constructors’helpers..............................
Marble setters’ helpers..........Plasterers’ tenders:
Agreement A ....................Agreement B .....................
Terrazzo workers’helpers.............................
Tile layers’ helpers................
See footnotes at end of table.
43
Digitized for FRASER http://fraser.stlouisfed.org/ Federal Reserve Bank of St. Louis

Table 20. Wage rates, hours, and employer contributions for selected benefits: Selected cities—Continued
(Union hourly wage rates, July 1, 1976, and wage rates, straight-time weekly hours, and employer insurance, pension, vacation, and other contributions to funds in the building trades, July 1, 1977)
July 1, 1976 July 1, 1977
City and job classification Hoursper
week2
Employer contributions for selected benefits3
Rate per hour1
Rate per hour1 Insurance4 Pension Vacation Other5
Dollars Percent Dollars Percent Dollars Percent Dollars Percent
Boston, Mass. —Continued
Highway and street construction
Journeymen
Engineers— Power equipment operators:Heavy equipment:
Power shovels, pile- drivers, lighters............... $10,610 $11,050 40.00 1.100 1.000 0.400
Medium equipment: Bulldozers, cement mixers, steam boilers........................... 10.490 10.930 40.00 1.100 1.000 .400
Light equipment:Pumps, compressors, welding machines, concrete mixers............. 8.860 9.210 40.00 1.100 1.000 .400
Helpers and laborers
General laborers................... 7.500 7.750 40.00 .600 .700 .180
Other heavy construction
Journeymen
Engineers— Power equipment operators:Heavy equipment:
Power shovels, pile drivers,lighters.......................... 10.610 11.050 40.00 1.100 1.000 .400
Medium equipment: Bulldozers,cement mixers, steam boilers........................... 10.490 10.930 40.00 1.100 1.000 .400
Light equipment:Pumps, compressors, welding machines, concrete mixers............... 8.860 9.210 40.00 1.100 1.000 .400
Buffalo, N.Y.
Building construction
Journeymen
Asbestos workers................. 10.410 10.910 40.00 1.170 .800Boilermakers......................... 10.600 11.150 40.00 .900 - 1.250 - - - - -
Bricklayers............................ 11.490 12.390 40.00 - - 1.400 - - - .630 -
Carpenters........................... 10.430 11.330 40.00 13 1.250 - 1.550 - - - .070 -Millwrights......................... 10.430 11.330 40.00 13 1.250 — 1.550 - ~ .070 "
See footnotes at end of table.
44
Digitized for FRASER http://fraser.stlouisfed.org/ Federal Reserve Bank of St. Louis
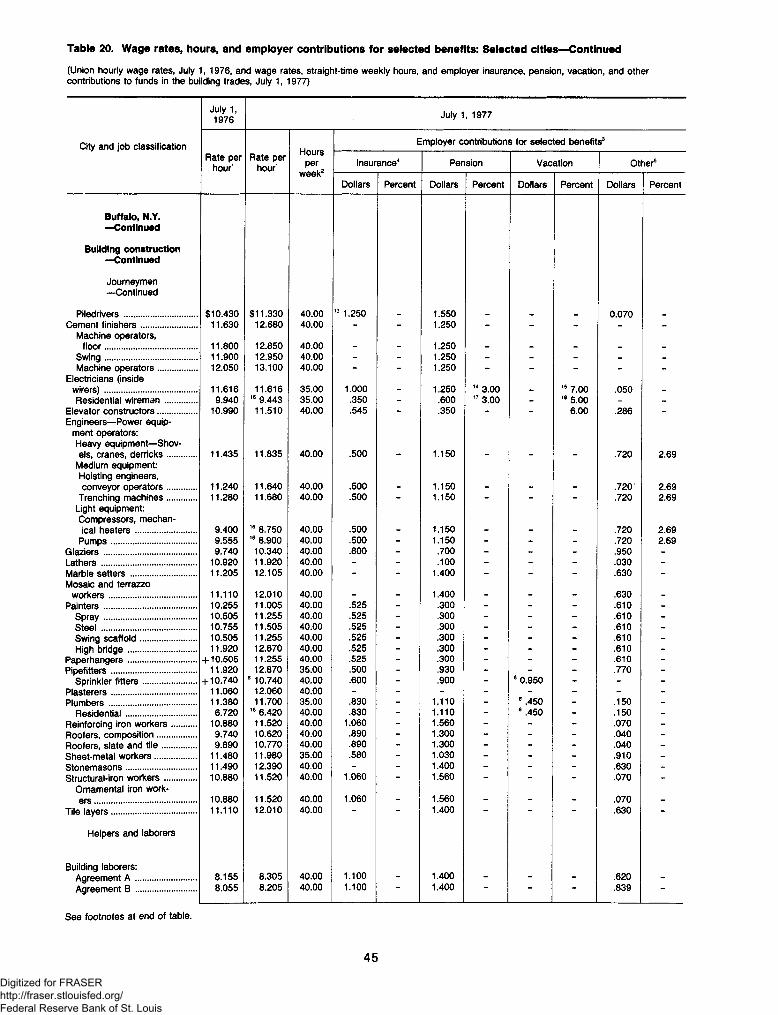
Table 20. Wage rates, hours, and employer contributions for selected benefits: Selected cities—Continued
(Union hourly wage rates, July 1, 1976, and wage rates, straight-time weekly hours, and employer insurance, pension, vacation, and other contributions to funds in the building trades, July 1, 1977)
July 1, 1976 July 1, 1977
City and job classification Hoursper
week2
Employer contributions for selected benefits3Rate per
hour1Rate per
hour1 Insurance4 Pension Vacation Other5
Dollars Percent Dollars Percent Dollars Percent Dollars Percent
Buffalo, N.Y. — Continued
Building construction — Continued
Journeymen—•Continued
Piledrivers ......................... $10,430 $11,330 40.00 13 1.250 1.550 0.070Cement finishers................... 11.630 12.680 40.00 - - 1.250 - - - - -
Machine operators, floor............................... 11.800 12.850 40.00 1.250
Swing............................... 11.900 12.950 40.00 - - 1.250 - - - - -Machine operators............. 12.050 13.100 40.00 - - 1.250 - - - - -
Electricians (inside wirers)............................... 11.616 11.616 35.00 1.000 1.250 14 3.00 . 15 7.00 .050Residential wiremen........... 9.940 16 9.443 35.00 .350 - .600 17 3.00 - 18 5.00 - -
Elevator constructors............. 10.990 11.510 40.00 .545 - .350 - - 6.00 .286 -Engineers— Power equip
ment operators:Heavy equipment— Shovels, cranes, derricks.......... 11.435 11.835 40.00 .500 1.150 .720 2.69
Medium equipment:Hoisting engineers, conveyor operators.......... 11.240 11.640 40.00 .500 1.150 .720 2.69
Trenching machines.......... 11.280 11.680 40.00 .500 - 1.150 - - - .720 2.69Light equipment: Compressors, mechanical heaters..................... 9.400 16 8.750 40.00 .500 1.150 .720 2.69
Pumps............................. 9.555 16 8.900 40.00 .500 - 1.150 - - - .720 2.69Glaziers ............................... 9.740 10.340 40.00 .800 - .700 - - - .950 -Lathers................................ 10.920 11.920 40.00 - - .100 - - - .030 -Marble setters ...................... 11.205 12.105 40.00 - - 1.400 - - - .630 -Mosaic and terrazzo
workers.............................. 11.110 12.010 40.00 . . 1.400 . . _ .630Painters............................... 10.255 11.005 40.00 .525 - .300 - - - .610 -
Spray............................... 10.505 11.255 40.00 .525 - .300 - - - .610 -Steel ................................ 10.755 11.505 40.00 .525 - .300 - - - .610 -
Swing scaffold................... 10.505 11.255 40.00 .525 - .300 - - - .610 -
High bridge....................... 11.920 12.670 40.00 .525 - .300 - - - .610 -
Paperhangers ....................... + 10.505 11.255 40.00 .525 - .300 - - - .610 -Pipefitters............................. 11.920 12.870 35.00 .500 - .930 - - - .770 -
Sprinkler fitters.................. + 10.740 8 10.740 40.00 .600 - .900 - 6 0.950 - - -Plasterers............................. 11.060 12.060 40.00 - - - - - - - -Plumbers.............................. 11.380 11.700 35.00 .830 - 1.110 - 6.450 - .150 -
Residential........................ 6.720 16 6.420 40.00 .830 - 1.110 - 6.450 - .150 -Reinforcing iron workers........ 10.880 11.520 40.00 1.060 - 1.560 - - - .070 -Roofers, composition............. 9.740 10.620 40.00 .890 - 1.300 - - - .040 -Roofers, slate and tile ............ 9.890 10.770 40.00 .890 - 1.300 - - - .040 -Sheet-metal workers.............. 11.480 11.980 35.00 .580 - 1.030 - - - .910 -Stonemasons........................ 11.490 12.390 40.00 - - 1.400 - - - .630 -Structural-iron workers........... 10.880 11.520 40.00 1.060 - 1.560 - - - .070 -
Ornamental iron workers ................................... 10.880 11.520 40.00 1.060 . 1.560 . . . .070
Tile layers............................. 11.110 12.010 40.00 - - 1.400 - - - .630 -
Helpers and laborers
Building laborers:Agreement A ..................... 8.155 8.305 40.00 1.100 1.400 .620Agreement B ..................... 8.055 8.205 40.00 1.100
'1.400 — — — .839
See footnotes at end of table.
45
Digitized for FRASER http://fraser.stlouisfed.org/ Federal Reserve Bank of St. Louis

Table 20. Wage rates, hours, and employer contributions for selected benefits: Selected cities—Continued
(Union hourly wage rates, July 1, 1976, and wage rates, straight-time weekly hours, and employer insurance, pension, vacation, and other contributions to funds in the building trades, July 1, 1977)
July 1, 1976 July 1, 1977
City and job classification Hoursper
week2
Employer contributions for selected benefits3
Rate per hour1
Rate per hour1 Insurance4 Pension Vacation Other5
Dollars Percent Dollars Percent Dollars Percent Dollars Percent
Buffalo, N.Y. —Continued
Building construction —Continued
Helpers and laborers — Continued
Elevator constructors’ helpers.............................. $7,690 $8,760 40.00 0.545 0.350 6.00 0.286
Marble setters’ helpers.......... 8.910 9.510 40.00 .550 - .400 - - - 1.000 -
Terrazzo workers’ helpers.............................. 8.910 9.510 40.00 .550 _ .400 . . 1.000Grinders............................ 9.010 9.610 40.00 .550 - .400 - - - 1.000 -
Tile layers’ helpers................ 8.910 9.510 40.00 .550 - .400 - - - 1.000 -
Highway and street construction
Journeymen
Engineers— Power equipment operators:Heavy equipment— Shovels, cranes, back- hoes, pavers..................... 11.120 11.370 40.00 .500 1.150 .670
i
2.31Medium equipment— Rollers, hoisting engineers .............................. 10.980 11.230 40.00 .500 1.150 .670 2.31
Light equipment— Compressors, heating boilers ............................. 9.240 16 8.590 40.00 .500 1.150 .670 2.31
Structural iron workers........... 10.880 11.520 40.00 1.060 - 1.560 - - - .070 -
Helpers and laborers
General laborers................... 8.055 8.055 40.00 1.100 1.400 .786
Other heavy construction
Journeymen
Engineers— Power equipment operators:
Heavy equipment- shovels, cranes, backhoes ........................ 11.120 11.370 40.00 .500 1.150 .670 2.31
Medium equipment— Rollers, hoisting engine operators ......................... 10.980 11.230 40.00 .500 1.150 .670 2.31
Light equipment— Compressor operators, heating boilers................. 9.240 8.590 40.00 .500 1.150 .670 2.31
Structural iron workers........... 10.880 11.520 40.00 1.060 - 1.560 - - - .070 -Ornamental iron workers........................... 10.880 11.520 40.00 1.060 - 1.560 - - - .070 -
See footnotes at end of table.
46
Digitized for FRASER http://fraser.stlouisfed.org/ Federal Reserve Bank of St. Louis

Table 20. Wage rates, hours, and employer contributions for selected benefits: Selected cities—Continued
(Union hourly wage rates, July 1, 1976, and wage rates, straight-time weekly hours, and employer insurance, pension, vacation, and other contributions to funds in the building trades, July 1, 1977)
July 1, 1976 July 1, 1977
City and job classification Hoursper
week2
Employer contributions for selected benefits3Rate per
hour1Rate per
hour1 Insurance4 Pension Vacation Other5
Dollars Percent Dollars Percent Dollars Percent Dollars Percent
Buffalo, N.Y. — Continued
Other heavy construction — Continued
Helpers and laborers
Miner-laborers....................... $8,455 $8,605 40.00 1.100 1.400 0.849General laborers................... 8.055 8.055 40.00 1.100 - 1.400 - - - .786 -
Chattanooga, Tenn.
Building construction
Journeymen
Asbestos workers................. 7.880 9.000 40.00 .450 .200 6 1.000Boilermakers......................... 8.800 9.300 40.00 .950 - 1.000 - - - - _Bricklayers............................ 9.250 9.850 40.00 .450 - .300 - - - .020 -Carpenters........................... 8.180 8.680 40.00 .450 - .400 - - - .020 -
Millwrights......................... 8.630 9.130 40.00 .450 - .400 - - - .020 -
Cement finishers................... 8.100 8.700 40.00 - - - - - - .020 -Electricians (inside
wirers)............................... +8.314 8.884 40.00 .650 _ .400 3.00 . 6 2.50 . 19 3.50Elevator constructors............. 8.660 9.095 40.00 .545 - .350 - - 6.00 .020 2.30Engineers— Power equip
ment operators:Group A— Bulldozers, cranes, draglines, hoists, shovels, scrapers, trenching machines......................... 7.950 8.550 40.00 .300 .300 .020
Group B— Central compressor plants, paving machines, tractors, concrete pumps, earth augers, forklifts .................................. 7.150 7.750 40.00 .300 .300 .020
Group C— Portable compressors, pumps (2, not more than 3), welding machines, oilers (combination)........... 6.550 7.150 40.00 .300 .300 .020
Group D— Air compressors (1 portable), firemen, portable crushers.......................... 6.250 6.850 40.00 .300 .300 .020
Glaziers ............................... 7.460 8.140 40.00 - - - - - 4.00 - -Lathers................................ 8.350 8.950 40.00 - - - - - - - -Marble setters ...................... 9.250 9.850 40.00 .450 - .300 - - - .020 -
Mosaic and terrazzo workers.............................. 9.250 9.850 40.00 .450 _ .300 _ _ _ .020 .
Painters, residential and commercial................. ....... 7.500 7.750 40.00 .150 _ .300 _ _ _ _
Paperhangers....................... 7.750 8.000 40.00 .t50 - .300 - - - - -Pipefitters............................. 9.000 10.060 40.00 .450 - .500 - - - .108 -Plasterers............................. 8.450 9.050 40.00 - - - - - - - -Plumbers.............................. 9.000 10.060 40.00 .450 - .500 - - - .108 -Reinforcing iron workers........ 8.610 8.610 40.00 .550 .500 ~ .020 -
See footnotes at end of table.
47
Digitized for FRASER http://fraser.stlouisfed.org/ Federal Reserve Bank of St. Louis

Table 20. Wage rates, hours, and employer contributions for selected benefits: Selected cities—Continued
(Union hourly wage rates, July 1, 1976, and wage rates, straight-time weekly hours, and employer insurance, pension, vacation, and other contributions to funds in the building trades, July 1, 1977)
July 1, 1976 July 1, 1977
City and job classification Hoursper
week2
Employer contributions for selected benefits3Rate per
hour1Rate per
hour1 Insurance4 Pension Vacation Other5
Dollars Percent Dollars Percent Dollars Percent Dollars Percent
Chattanooga, Tenn. — Continued
Building construction — Continued
Journeymen— Continued
Roofers, composition............. $8,200 $8,800 40.00 - - 0.100 - _ _ - _Roofers, slate and tile ............ 8.400 9.000 40.00 - - .100 - - - - -
Sheet-metal workers.............. 9.340 9.720 40.00 0.580 - .660 - - - 0.090 _Stonemasons........................ 9.250 9.850 40.00 .450 - .300 - - - .020 _Structural-iron workers........... 8.610 8.610 40.00 .550 - .500 - - - .020 _Tile layers............................. 9.250 9.850 40.00 .450 - .300 - - - .020 -
Helpers and laborers
Bricklayers’ tenders............... 5.900 6.300 40.00 .250 _ .200 _ . . .020Building laborers................... 5.800 6.200 40.00 .250 - .200 - - - .020 -Elevator constructors’
helpers.............................. 6.062 6.367 40.00 .545 - .350 - - 6.00 .020 2.30Marble setters’ helpers.......... 5.900 6.300 40.00 .250 - .200 - - - .020 -
Plasterers’ laborers................ 5.800 6.200 40.00 .250 - .200 - - - .020 -Plumbers’ laborers................ 5.800 6.200 40.00 .250 - .200 - - - .020 -Terrazzo workers’laborers.............................. 5.900 6.300 40.00 .250 - .200 - - - .020 -
Tile layers’ helpers................ 5.900 6.300 40.00 .250 - .200 - - .020 -
Chicago, III.
Building construction
Journeymen
Asbestos workers................. 10.510 11.110 40.00 .810 _ .990 6 1.000 . .050 _Boilermakers......................... 11.550 8 11.550 37.50 .750 - 1.000 - - - .470 5.00Bricklayers............................ 10.410 11.210 40.00 .800 - .750 - - - .070 -Carpenters........................... 10.150 11.000 40.00 .880 - .980 - - - - -Cement finishers................... 9.750 10.350 40.00 1.150 - 1.050 - - - 6 .410 -
Swing scaffold................... 10.000 10.600 40.00 1.150 - 1.050 - - - 6 .410 -Drywall tapers(finishers)............................ 8.950 9.450 40.00 .575 - .450 - - - 6.200 -
Electricians (insidewirers)............................... 10.750 11.750 40.00 .968 - .779 3.00 6 .800 - .059 -
Elevator constructors............. 11.910 12.455 40.00 .545 - .350 - - 6.00 .020 3.20Engineers— Power equipment operators:
Class 1:Cranes .............................
Class 2:10.550 11.850 40.00 .750 .850 ~ .400 - - -
Tractors........................... 9.250 10.550 40.00 .750 - .850 - .400 - - -
Class 3:Air compressors................ 8.100 9.400 40.00 .750 - .850 - .400 - - -
Class 4:Oilers.............................. 6.850 8.150 40.00 .750 - .850 - .400 - - -
Glaziers............................... 9.830 10.230 40.00 .280 - .790 - - - 6 1.000 -Lathers ................................ 9.310 10.120 40.00 .580 - .445 - 6.900 - .075 -Machinists............................ 11.020 11.510 40.00 .660 .450 - 6.10 - -
See footnotes at end of table.
48
Digitized for FRASER http://fraser.stlouisfed.org/ Federal Reserve Bank of St. Louis

Table 20. Wage rates, hours, and employer contributions for selected benefits: Selected cities—-Continued
(Union hourly wage rates, July 1, 1976, and wage rates, straight-time weekly hours, and employer insurance, pension, vacation, and other contributions to funds in the building trades, July 1, 1977)
July 1, 1976 July 1, 1977
City and job classification Hoursper
week2
Employer contributions for selected benefits3
Rate per hour1
Rate per hour1 Insurance4 Pension Vacation Other5
Dollars Percent Dollars Percent Dollars Percent Dollars Percent
Chicago, III. —Continued
Building construction —Continued
Journeymen— Continued
Marble setters and cutters............................... $9,900 $10,050 40.00 0.800 61.000
Mosaic and terrazzo workers.......................... i... 9.850 10.200 40.00 .700 0.250 .196
Painters............................... 8.950 9.450 40.00 .575 - .450 - - - 6.200 -
Paperhangers....................... 8.950 9.450 40.00 .575 - .450 - - - 6.200 -
Pipefitters............................. 11.500 11.900 40.00 .800 - 1.000 - - - .020 -Sprinkler fitters.................. 10.100 10.750 40.00 .850 - .950 - - - 6 1.000 -
Plasterers............................. 9.600 10.370 40.00 .675 - .920 - - - .150 -Plumbers.............................. 10.920 11.420 40.00 .750 - .750 - - - 6.550 -Reinforcing iron workers........ 11.050 11.600 40.00 1.400 - 1.680 - - - 6 .310 -Roofers, composition............. 10.700 11.000 40.00 1.060 - .850 - 6 0.500 - .020 -Roofers, slate and tile ............ 11.090 11.690 40.00 1.060 - .500 - - - - -Sheet-metal workers.............. 11.450 11.800 40.00 .800 - .590 - - - .550 -Stonemasons........................ 10.410 11.210 40.00 .800 - .750 - - - .070 -Structural-iron workers........... 11.050 11.600 40.00 1.400 - 1.680 - - - .310 -
Architectural iron finishers........................... 10.500 11.100 40.00 .650 _ .805 . . . .500Fence erectors................. 7.450 8.120 40.00 .650 - .805 - - - 6.500 -
Tile layers............................. 10.300 10.850 40.00 .406 - .525 - - - .075 -
Helpers and laborers
Bricklayers’ tenders............... 7.800 8.550 40.00 .570 1.100Building laborers................... 7.800 8.550 40.00 .570 - 1.100 - - - - -
Elevator constructors’ helpers............................... 8.340 8.720 40.00 .545 _ .350 _ 6.00 .020 3.20
Marble setters’ helpers.......... 9.000 9.400 40.00 .870 - - - .330 - - -Plasterers’ laborers................ 7.800 8.550 40.00 .570 - 1.100 - - - - -Terrazzo workers’ helpers:Floor machines................... 9.000 9.450 40.00 .450 .450 1.90Base machine operators...... 9.250 9.700 40.00 .450 - .450 - - - - 1.90
Tile layers’ helpers................ 9.050 9.550 40.00 .406 - .525 - - - .075 -
Highway and street construction
Journeymen
Carpenters........................... 10.150 11.000 40.00 .880 .980Cement finishers................... 9.750 10.350 40.00 1.150 - 1.050 - - - 6 .410 -
Swing scaffold................... 10.000 10.600 40.00 1.150 - 1.050 - - - 6 .410 -Engineers— Power equip
ment operators:Heavy equipment— Derricks, cranes, Koeh- ring scoopers, power shovels............................ 10.200 11.500 40.00 .750 .850 .400
See footnotes at end of table.
49
Digitized for FRASER http://fraser.stlouisfed.org/ Federal Reserve Bank of St. Louis
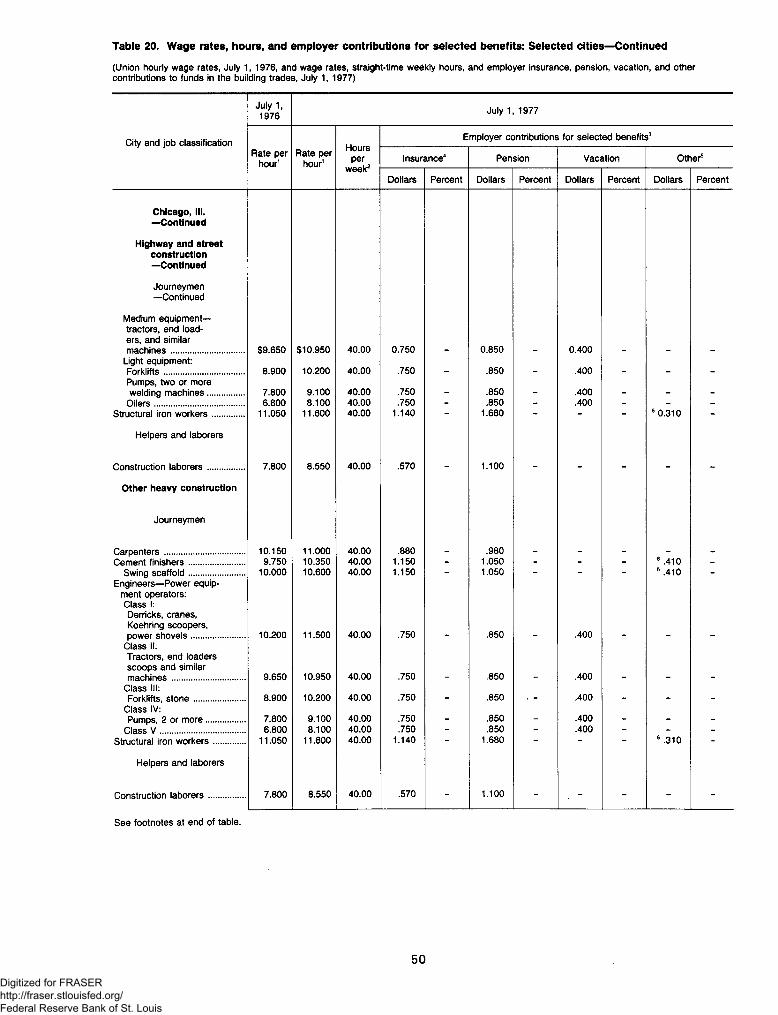
Table 20. Wage rates, hours, and employer contributions for selected benefits: Selected cities—Continued
(Union hourly wage rates, July 1, 1976, and wage rates, straight-time weekly hours, and employer insurance, pension, vacation, and other contributions to funds in the building trades, July 1, 1977)
July 1, 1976 July 1, 1977
City and job classification Hoursper
week2
Employer contributions for selected benefits3Rate per
hour1Rate per
hour1 Insurance4 Pension Vacation Other5
Dollars Percent Dollars Percent Dollars Percent Dollars Percent
Chicago, III. —Continued
Highway and street construction —Continued
Journeymen— Continued
Medium equipment- tractors, end loaders, and similar machines......................... $9,650 $10,950 40.00 0.750 0.850 0.400
Light equipment:Forklifts........................... 8.900 10.200 40.00 .750 _ .850 _ .400 _ . .Pumps, two or more welding machines............ 7.800 9.100 40.00 .750 _ .850 _ .400 . . .
Oilers.............................. 6.800 8.100 40.00 .750 - .850 - .400 - - -Structural iron workers........... 11.050 11.600 40.00 1.140 - 1.680 - - - 6 0.310 -
Helpers and laborers
Construction laborers............ 7.800 8.550 40.00 .570 1.100
Other heavy construction
Journeymen
Carpenters........................... 10.150 11.000 40.00 .880 .980Cement finishers................... 9.750 10.350 40.00 1.150 - 1.050 - - - 6.410 -
Swing scaffold................... 10.000 10.600 40.00 1.150 - 1.050 - - - 6.410 -Engineers— Power equip
ment operators:Class I:Derricks, cranes,Koehring scoopers, power shovels.................. 10.200 11.500 40.00 .750 .850 .400
Class II:Tractors, end loaders scoops and similar machines......................... 9.650 10.950 40.00 .750 .850 .400
Class III:Forklifts, stone................. 8.900 10.200 40.00 .750 _ .850 _ .400 _ _ _
Class IV:Pumps, 2 or more....... ..... 7.800 9.100 40.00 .750 _ .850 _ .400 _ _
Class V ............................. 6.800 8.100 40.00 .750 - .850 - .400 - - -Structural iron workers........... 11.050 11.600 40.00 1.140 - 1.680 - - - 6 .310 -
Helpers and laborers
Construction laborers............ 7.800 8.550 40.00 .570 _ 1.100 - - _ _ _
50
Digitized for FRASER http://fraser.stlouisfed.org/ Federal Reserve Bank of St. Louis

Table 20. Wage rates, hours, and employer contributions for selected benefits: Selected cities—Continued
(Union hourly wage rates, July 1, 1976, and wage rates, straight-time weekly hours, and employer insurance, pension, vacation, and othercontributions to funds in the building trades, July 1, 1977)
City and job classification
Cincinnati, Ohio
Building construction
Journeymen
Asbestos workers.........Boilermakers................Bricklayers....................
Cleaners, pointers,and caulkers............
Carpenters...................Millwrights.................
Cement finishers...........Drywall tapers (fin
ishers):Commercial...............Industrial...................Residential................
Electrician (insidewirers).......................
Elevator constructors.....Engineers— Power equipment operators:
Group A:Cranes, derricks,power shovels.......
Group B:Bulldozers, powergraders.................
Group C:Air compressors, asphalt rollers,pumps...................
Group D:Compressors, mixers,rollers....................
Group E:Backfillers, concrete spreaders......
Group F:Oilers, pumps..........
Glaziers.......................Lathers ........................Machinists, construction
and erection...............Marble setters ..............Mosaic and terrazzoworkers ......................Painters:
Commercial...............Industrial...................Residential................
Paperhangers:Commercial...............Industrial...................Residential................
Pipefitters.....................Plasterers.....................Plumbers.....................Reinforcing iron workers .
July 1, 1976 July 1, 1977
Rate per hour1
Rate per hour1
Hoursper
week2
Employer contributions for selected benefits3
Insurance4 Pension Vacation Other5
Dollars Percent Dollars Percent Dollars Percent Dollars Percent
$10,510 $11,060 40.00 0.750 1.000 61.1009.050 9.400 40.00 .750 - 1.000 - - - 1.400 -
10.795 11.645 40.00 .550 - .350 - 6.450 - .185 -
10.795 11.645 40.00 .550 _ .350 _ 6 .450 _ .185 _10.550 11.400 40.00 .600 - .650 - - - .110 -9.690 10.890 40.00 .500 - .850 - 6.750 - .135 -9.670 10.430 40.00 .750 - .700 - 6 1.000 - .035 -
9.900 10.500 40.00 .250 6 .50010.050 10.650 40.00 - - .250 - 6.500 - - -9.580 10.180 40.00 - - .250 - 6.500 - - -
9.936 10.902 40.00 .500 _ .400 3.00 _ 8.00 .200 _, 10.635 11.780 40.00 .545 .350 6.00 .020 2.31
. 11.110 11.610 40.00 .560 - 1.000 - - - .085 -
. 10.950 11.450 40.00 .560 - 1.000 - - - .085 -
, 10.590 11.090 40.00 .560 - 1.000 - - - .085 -
9.810 10.310 40.00 .560 - 1.000 - - - .085 -
9.480 9.980 40.00 .560 - 1.000 - - - .085 -
8.030 8.330 40.00 .560 1.000 _ _ .085 _9.450 10.050 40.00 - - .500 - 6 1.250 - - -
, 10.670 11.520 40.00 - - .250 - 6 1.000 - .235 -
9.750 9.750 40.00 .500 _ .300 _ .449 _ .375 _10.235 10.535 40.00 .550 - .350 - 6 .450 - .025 -
10.185 10.485 40.00 .550 - .350 - 6 .450 - .025 -
9.900 10.500 40.00 _ _ .250 6 .500 _ _ _10.050 10.650 40.00 - - .250 - 6.500 - - -
9.580 10.180 40.00 - - .250 - 6.500 - - -
9.900 10.500 40.00 - _ .250 _ 6.500 _ _ _, 10.050 10.650 40.00 - - .250 - 6 .500 - - -
9.580 10.180 40.00 - - .250 - 6 .500 - - -, 10.669 11.450 40.00 .650 - 1.225 - 6.750 - .390 -
10.195 10.695 40.00 - - .500 - 6 1.500 - .235 -, 10.640 10.970 40.00 .550 - 1.150 - 6 .850 - .500 -, 10.430 10.630 40.00 .900 - 1.850 - -
See footnotes at end of table.
51Digitized for FRASER http://fraser.stlouisfed.org/ Federal Reserve Bank of St. Louis

Table 20. Wage rates, hours, and employer contributions for selected benefits: Selected cities—Continued
(Union hourly wage rates, July 1, 1976, and wage rates, straight-time weekly hours, and employer insurance, pension, vacation, and othercontributions to funds in the building trades, July 1, 1977)
City and job classification
Cincinnati, Ohio —Continued
Building construction —Continued
Journeymen— Continued
Roofers, composition.......Sheet-metal workers........Stonemasons..................Structural and ornamental
ironworkers......... ..........Tile layers.......................
Helpers and laborers
Bricklayers’ tenders........Building laborers ............Elevator constructors’
helpers........................Marble setters’ helpers...
Marble polishers..........Terrazzo workers’
helpers........................Base grinders.............
Tile layers’ helpers..........
Highway and street construction
Journeymen
Carpenters ....................Piledrivers ..................
Cement finishers............Engineers— Power equip
ment operators:Class A— Concrete pumps, cranes, derricks, draglines, pile driving machines ...
Class B— Asphalt pavers, bulldozers, power graders.................
Class C— Concrete mixers, ashpalt rollers,welding machines......
Class D— Compressors, concrete saws, crushers, drills...................
Class E— Oilers, signalmen .....................
Structural iron workers....
Helpers and laborers
Construction laborers
July 1, 1976 July 1, 1977
Rate per hour1
Rate per hour1
Hoursper
week2
Employer contributions for selected benefits3
Insurance4 Pension Vacation Other5
Dollars Percent Dollars Percent Dollars Percent Dollars Percent
$10,480 $10,820 40.00 0.850 61.5009.935 10.435 40.00 0.600 - .810 - 6.500 - 0.470 -
10.795 11.645 40.00 .550 - .350 - 6.450 - .185 -
11.080 11.480 40.00 .900 _ 1.050 _ _ _ .035 _10.185 10.485 40.00 .550 .350 6.450 .025
9.500 10.200 40.00 .600 .500 .0509.300 10.000 40.00 .600 - .500 - - - .050 -
7.440 8.250 40.00 .545 _ .350 _ _ 6.00 .020 2.318.935 9.535 40.00 - - - - 6.500 - - -
9.100 9.700 40.00 - - - - 6.500 - - -
8.885 9.485 40.00 _ _ _ 6 .500 « _9.305 9.905 40.00 - - - - 6.500 - - -
8.835 9.435 40.00 6.500
10.550 11.400 40.00 .600 .650 .03510.550 11.400 40.00 .600 - .650 - - - .035 -
8.980 10.680 40.00 .600 .150 1.000 .050
. 10.290 11.040 40.00 .560 - 1.000 - - - .040 -
. 10.170 10.920 40.00 .560 - 1.000 - - - .040 -
9.130 9.880 40.00 .560 - 1.000 - - - .040 -
8.700 9.450 40.00 .560 - 1.000 - - - .040 -
7.140 7.640 40.00 .560 _ 1.000 _ _ - .040 _. 11.080 11.480 40.00 .900 1.050 .035
7.720 8.270 40.00 .650 - .400 - - - .100 -
See footnotes at end of table.
52Digitized for FRASER http://fraser.stlouisfed.org/ Federal Reserve Bank of St. Louis

Table 20. Wage rates, hours, and employer contributions for selected benefits: Selected cities—Continued
(Union hourly wage rates, July 1, 1976, and wage rates, straight-time weekly hours, and employer insurance, pension, vacation, and othercontributions to funds in the building trades, July 1, 1977)
City and job classification
Cincinnati, Ohio —Continued
Other heavy construction
Journeymen
Carpenters....................Piledrivers..................
Cement finishers............Engineers— Power equip
ment operators:Class A— Concrete pumps, cranes, derricks, draglines, pile driving machines ...
Class B— Asphalt pavers, bulldozers, power graders.................
Class C— Concrete mixers, asphalt rollers,welding machines.......
Class D— Compressors, concrete saws, crushers, drills....................
Class E— Oilers, signalmen .....................
Structural iron workers....
Helpers and laborers
Laborers.....................
Cleveland, Ohio
Building construction
Journeymen
Asbestos workers.........Boilermakers................Bricklayers, general.......
Caisson and sewer....Carpenters...................
Millwrights................Piledrivers................
Cement finishers...........Electricians
(inside wirers).............Elevator constructors.....Engineers— Power equipment operators:
Heavy equipment: Cranes (all types).....
July 1, 1976 July 1, 1977
Rate per hour1
Rate per hour1
Hoursper
week2
Employer contributions for selected benefits3
Insurance4 Pension Vacation Other5
Dollars Percent Dollars Percent Dollars Percent Dollars Percent
$10,550 $11,400 40.00 0.600 0.650
•
0.03510.550 11.400 40.00 .600 - .650 - - - .035 -
8.980 10.680 40.00 .600 .150 1.000 .050
10.290 11.040 40.00 .560 - 1.000 - - - .040 -
10.170 10.920 40.00 .560 - 1.000 - - - .040 -
9.130 9.880 40.00 .560 - 1.000 - - - .040 -
8.700 9.450 40.00 .560 - 1.000 - - - .040 -
7.140 7.640 40.00 .560 _ 1.000 _ _ _ .040 _11.080 11.480 40.00 .900 1.050 .035
7.720 8.270 40.00 .650 - .400 - - - .100 -
10.590 10.590 40.00 6 3.300 .06010.480 11.030 40.00 .800 - 1.100 - 6 1.000 - - -
9.900 10.700 40.00 1.000 - 1.000 - 1.250 - .070 -
10.400 11.200 40.00 1.000 - 1.000 - 1.250 - .070 -
10.600 11.100 40.00 .770 - 1.250 - 6 1.000 - .040 -
10.200 10.450 40.00 .770 - 1.400 - 6 1.500 - .040 -
10.600 11.100 40.00 .770 - 1.250 - 6 1.000 - .070 -
10.880 11.730 40.00 - - - - 6 2.000 - .040 -
10.910 11.670 40.00 .550 _ .460 3.00 6 1.000 _ 6 .250 _11.955 12.790 40.00 .745
"
.350'
6.00 .020 2.31
11.670 12.420 40.00 .560 - 1.000 - - - .090 -
See footnotes at end of table.
53Digitized for FRASER http://fraser.stlouisfed.org/ Federal Reserve Bank of St. Louis

Table 20. Wage rates, hours, and employer contributions for selected benefits: Selected cities—Continued
(Union hourly wage rates, July 1, 1976, and wage rates, straight-time weekly hours, and employer insurance, pension, vacation, and other contributions to funds in the building trades, July 1, 1977)
July 1, 1976 July 1, 1977
City and job classification Hoursper
week2
Employer contributions for selected benefits3Rate per
hour1Rate per
hour1 Insurance4 Pension Vacation Other5
Dollars Percent Dollars Percent Dollars Percent Dollars Percent
Cleveland, Ohio —Continued
Building construction —Continued
Journeymen— Continued
Power shovels,derricks.......................... $11,670 $12,420 40.00 0.560 - 1.000 - - - 0.090 -
Medium equipment: Bulldozers and powergraders .......................... 11.520 12.270 40.00 .560 - 1.000 - - - .090 -
Trench machines(under 24 in .).................. 11.170 11.920 40.00 .560 - 1.000 - - - .090 -
Light equipment: Pumps (4 in. andover)............................... 11.170 11.920 40.00 .560 - 1.000 - - - .090 -
Compressors, portable....... 10.070 10.820 40.00 .560 - 1.000 - - - .090 -Rollers, asphalt................ 11.170 11.920 40.00 .560 - 1.000 - - - .090 -Oilers, small pumps........... 8.640 9.140 40.00 .560 - 1.000 - - - .090 -
Glaziers ............................... 9.780 10.480 40.00 .550 - .650 - 6 1.500 - .010 -Lathers ................................ 10.680 11.530 40.00 - - 1.000 - - - 6 1.500 -Machinists............................ 9.500 10.000 40.00 - - - - .385 - .308 -Marble setters ...................... 9.900 10.700 40.00 1.000 - 1.000 - 1.250 - .070 -Mosaic and terrazzo
workers.............................. 9.900 10.700 40.00 1.000 - 1.000 - 1.250 .070 -Painters ............................... 10.310 11.160 40.00 .630 - .740 - .500 - .050 -
Structural steel.................. 11.010 11.860 40.00 .630 - .740 - .500 - .050 -Spray gun......................... 10.710 11.560 40.00 .630 - .740 - .500 - .050 -Swing stage...................... 10.610 11.460 40.00 .630 - .740 - .500 - .050 -Tapers.............................. 11.010 11.860 40.00 .630 - .740 - .500 - .050 -
Paperhangers....................... 10.310 11.160 40.00 .630 - .740 - .500 - .050 -Pipefitters............................. 11.420 11.970 40.00 .800 - 1.100 - 1.000 - .300 -
Refrigeration fitters............ 11.420 11.970 40.00 .800 - 1.100 - 1.000 - .300 -Plasterers............................. 11.150 12.000 40.00 - - - - 2.000 - .130 -Plumbers.............................. 10.430 11.230 40.00 .750 - 1.000 - 1.000 - .080 -Reinforcing iron workers........ 10.870 11.220 40.00 .800 - 1.100 - 1.000 - .030 -Roofers, composition............. 10.310 11.160 40.00 .250 - .500 - - - 6 2.040 -Roofers, slate and tile ........... 10.310 11.160 40.00 .250 - .500 - - - 6 2.040 -
Sheet-metal workers.............. 10.360 11.180 40.00 .600 - 1.130 - 6 1.000 - .100 -
Stonemasons........................ 9.900 10.700 40.00 1.000 - 1.000 - 6 1.250 - .070 -Structural-iron workers........... 10.870 11.220 40.00 .800 - 1.100 - 6 1.000 - .030 -Tile layers............................. 10.345 11.055 40.00 - - 6 1.500 - 6 1.000 - - -
Helpers and laborers
Bricklayers’ tenders............... 8.420 9.970 40.00 .970 _ 1.200 _ _ _ .340 _Building laborers ................... 8.420 9.970 40.00 .970 - 1.200 - - - .340 -Elevator constructors’
helpers.............................. 8.370 8.950 40.00 .745 - .350 - - 6.00 .020 2.31Marble setters' helpers.......... 11.060 11.410 40.00 - - 1.000 - - - - -Plasterers’ laborers................ 8.420 9.970 40.00 .970 - 1.200 - - - .340 -
Plumbers’ laborers................ 8.420 9.970 40.00 .970 - 1.200 - - - .340 -Terrazzo workers’helpers............................... 11.570 12.120 40.00 - - .850 - - - .050 -
Base machine operators..... 11.570 12.120 40.00 - - .850 - - - .050 -Tile layers’ helpers................ 11.590 11.940 40.00 — 1.000 — - "
See footnotes at end of table.
54Digitized for FRASER http://fraser.stlouisfed.org/ Federal Reserve Bank of St. Louis

(Union hourly wag© rates, July t, 1976, and wage rates, straight-time weekly hours, and employer insurance, pension, vacation, and other contributions to funds in the building trades, July 1, 1977)
Table 20. Wage rates, hours, and employer contributions for selected benefits: Selected cities—Continued
July 1, 1976 July 1, 1977
City and job classification Hoursper
week2
Employer contributions for selected benefits3Rate per
hour1Rate per
hour1 Insurance4 Pension Vacation Other5
Dollars Percent Dollars Percent Dollars Percent Dollars Percent
Cleveland, Ohio — Continued
Highway and street construction
Journeymen
Carpenters........................... $10,600 $11,100 40.00 0.770 1.250 61.000 0.040Piledrivers ......................... 10.600 11.100 40.00 .770 - 1.250 - 6 1.000 - .040 -
Cement finishers................... 10.530 11.330 40.00 .600 - .150 - - - - -
Engineers— Power equipment operators:Heavy equipment:Cranes, power shovels, derricks..................... 11.030 12.030 40.00 .560 1.000 .040
Medium equipment: Bulldozers, power graders, trench machines under 24 in............. 10.930 11.930 40.00 .560 1.000 .040
Light equipment:Pumps 4 in. and over, asphalt rollers................. 9.890 10.890 40.00 .560 1.000 .040
Portable compressors....... 9.420 10.420 40.00 .560 - 1.000 - - - .040 -Structural iron workers........... 10.870 11.220 40.00 .800 - 1.100 - 6 1.000 - .030 -
Helpers and laborers
Common laborers:Group I ............................. 8.830 9.530 40.00 .650 .400 .100Group I I ............................ 8.955 9.655 40.00 .650 - .400 - - - * .100 -Group III........................... 9.030 9.730 40.00 .650 - .400 - - - .100 -
Group IV........................... 9.180 9.880 40.00 .650 - .400 - - - .100 -
Group V ............................ 9.480 10.180 40.00 .650 - .400 - - - .100 -
Other heavy construction
Journeymen
Carpenters........................... 10.600 11.100 40.00 .770 1.250 6 1.000 .040Millwrights......................... 10.200 10.700 40.00 .770 - 1.400 - 6 1.250 - .040 -Piledrivers......................... 10.600 11.100 40.00 .770 - 1.250 - 6 1.000 - .040 -
Cement finishers................... 10.530 11.330 40.00 .600 - .150 - - - - -Sewage treatment plants .............................. 11.960 12.650 40.00 .600 _ .150 - _ _ _ _
Engineers— Power equipment operators:Heavy equipment:Cranes, power shovels, derricks..................... 11.030 12.030 40.00 .560 1.000 .040
Medium equipment: Bulldozers, power graders, trench machines under 24 in............. 10.930 11.930 40.00 .560 - 1.000 - - - .040 -
See footnotes at end of table.
55Digitized for FRASER http://fraser.stlouisfed.org/ Federal Reserve Bank of St. Louis

Table 20. Wage rates, hours, and employer contributions for selected benefits: Selected cities—Continued
(Union hourly wage rates, July 1, 1976, and wage rates, straight-time weekly hours, and employer insurance, pension, vacation, and other contributions to funds in the building trades, July 1, 1977)
July 1, 1976 July 1,, 1977
City and job classification Hoursper
week2
Employer contributions for selected benefits3Rate per
hour1Rate per
hour1 Insurance4 Pension Vacation Other5
Dollars Percent Dollars Percent Dollars Percent Dollars Percent
Cleveland, Ohio — Continued
Other heavy construction — Continued
Journeymen— Continued
Light equipment:Pumps 4 in. and over, asphalt rollers................. $9,890 $10,890 40.00 0.560 1.000 0.040
Portable compressors....... 9.420 10.420 40.00 .560 - 1.000 - - - .040 -
Structural iron workers........... 10.870 11.220 40.00 .800 - 1.100 - 6 1.000 - .030 -
Helpers and laborers
Common laborers:Group I ............................. 8.830 9.530 40.00 .650 .400 .100Group I I ............................ 8.956 9.655 40.00 .650 - .400 - - - .100 -Group III........................... 9.030 9.730 40.00 .650 - .400 - - - .100 -Group IV........................... 9.180 9.880 40.00 .650 - .400 - - - .100 -Group V ............................ 9.480 10.180 40.00 .650 - .400 - - - .100 -
Columbus, Ohio
Building construction
Journeymen
Asbestos workers................. 9.820 10.770 40.00 .450 1.000 6 . 9 5 0 .060Boilermakers......................... 9.050 9.400 40.00 .750 - 1.000 - - - 1.400 -Bricklayers............................ 10.390 10.640 40.00 .800 - .800 - - - .010 -
Carpenters........................... 9.370 9.870 40.00 .400 - .700 - - - .030 -Resilient floor layers........... 9.370 9.870 40.00 .400 - .700 - - - .030 -
Cement finishers................... 9.350 9.800 40.00 .600 - .200 - - - .020 -Drywall tapers(finishers)............................ 9.850 10.390 40.00 .550 _ .550 _ _ _ _ _
Electricians (inside wirers)............................... 10.980 11.480 40.00 .400 _ .870 3.00 _ _ .060 1.00
Elevator constructors............. 10.285 11.160 40.00 .545 - .350 - - 6.00 .020 2.31Engineers— Power equipment operators:
Heavy equipment:Cranes (all types)............. 11.110 11.610 40.00 .560 1.000 .070Power shovels.................. 11.110 11.610 40.00 .560 - 1.000 - - - .070 -Derricks........................... 11.110 11.610 40.00 .560 - 1.000 - - - .070 -
Medium equipment:Power graders, bulldozers ............................ 10.950 11.450 40.00 .560 1.000 .070
Trench machines ( 24 in. and under)................. 10.590 11.090 40.00 .560 _ 1.000 _ _ .070 .
Roller brick, grade............ 9.810 10.310 40.00 .560 - ■' 1.000 - - - .070 -Light equipment:Pumps, 4 in. and over....... 10.590 11.090 40.00 .560 _ 1.000 _ _ _ .070 _Portable compressors....... 9.480 9.980 40.00 .560 - 1.000 - - - .070 -
Asphalt rollers.................. 10.590 11.090 40.00 .560 - 1.000 - - - .070 -Backfillers, concrete spreaders....................... 9.480 9.980 40.00 .560 - 1.000 - - - .070 -
See footnotes at end of table.
56
Digitized for FRASER http://fraser.stlouisfed.org/ Federal Reserve Bank of St. Louis

Table 20. Wage rates, hours, and employer contributions for selected benefits: Selected cities—Continued
(Union hourly wage rates, July 1, 1976, and wage rates, straight-time weekly hours, and employer insurance, pension, vacation, and othercontributions to funds in the building trades, July 1, 1977)
City and job classification
July 1,1976 July 1, 1977
Employer contributions for selected benefits3Rate per
hour1Rate per
hour1
noursper
week2Insurance4 Pension Vacation Other5
Dollars Percent Dollars Percent Dollars Percent Dollars Percent
Columbus, Ohio — Continued
Building construction — Continued
Journeymen— Continued
Oilers, small pumps........... $8,030 $8,330 40.00 0.560 _ 1.000 _ _ _ 0.070 _Glaziers......... ...................... 9.570 10.320 40.00 - - .570 - 6 0.200 - - -Lathers ................................ 8.400 9.100 40.00 - - .400 - - - 6 1.250 -Marble setters...................... 10.000 10.650 40.00 - - - - - - - -Mosaic and terrazzoworkers .............................. 10.000 10.650 40.00 - - - - - - - -
Painters............................... 9.450 9.990 40.00 .550 - .550 - - - - _Spray............................... 9.950 10.490 40.00 .550 - .550 - - - - -Structural steel.................. 9.750 10.290 40.00 .550 - .550 - - - - -Swing stage...................... 9.750 10.290 40.00 .550 - .550 - - - - -
Paperhangers....................... 9.450 9.990 40.00 .550 - .550 - - - - -Pipefitters............................. 10.670 11.070 40.00 .650 - .800 - Ooo - .220 -Plasterers............................. 8.740 9.340 40.00 .600 - .300 - - - .500 -Plumbers.............................. 10.670 11.070 40.00 .650 - .800 - 6 1.000 - .220 -Reinforcing iron workers........ 10.350 10.850 40.00 .900 - 1.550 - - - .010 -
Riggers and machinerymovers............................ 10.350 10.850 40.00 .900 - 1.550 - - - .010 -
Welders............................ 10.350 10.850 40.00 .900 - 1.550 - - - .010 -Fence erectors.................. 10.350 10.850 40.00 .900 - 1.550 - - - .010 _Sheeters........................... 10.350 10.850 40.00 .900 - 1.550 - - - .010 -
Roofers, composition............. 9.445 10.195 40.00 .600 - .650 - 6 1.000 - - -Roofers, slate and tile ............ 9.445 10.195 40.00 .600 - .650 - 6 1.000 - - -Sheet-metal workers.............. 10.420 10.820 40.00 .450 - 1.050 - - - (9) (9)Stonemasons............. .......... 10.390 10.640 40.00 .800 - .800 - - - .010 -Structural-iron workers........... 10.350 10.850 40.00 .900 - 1.550 - - - .010 -
Ornamental iron workers...... 10.350 10.850 40.00 .900 - 1.550 - - - .010 -Tile layers............................. 10.000 10.650 40.00 - - - - - - - -
Helpers and laborers
Bricklayers’ tenders............... 7.290 8.140 40.00 .550 _ .400 _ _ _ 6 .470 .Building laborers................... 7.090 7.940 40.00 .550 - .400 - - - 6 .470 -
Elevator constructors’ helpers:After 6 months.................. 7.200 7.810 40.00 .545 - .350 - - 6.00 .020 2.31
Marble setters’ helpers.......... 8.000 8.650 40.00 - - - - - - - -
Plasterers’ laborers................ 7.290 8.140 40.00 .550 - .400 - - - 6 .470 -Terrazzo workers’helpers............................... 8.000 8.650 40.00 - - - - - - - -
Base grinders.................... 8.350 9.000 40.00 - - - - - - - -Floor grinders.................... 8.150 8.800 40.00 - - - - - - - -
Tile layers’ helpers................ 8.000 8.650 40.00 - - - - ” - - -
Highway and street construction
Journeymen
Carpenters........................... 9.370 9.870 40.00 .400 _ .700 _ _ _ .030Cement finishers................... 9.430 9.880 40.00 .600 - .150 " - - - -
See footnotes at end of table.
57Digitized for FRASER http://fraser.stlouisfed.org/ Federal Reserve Bank of St. Louis

Table 20. Wage rates, hours, and employer contributions for selected benefits: Selected cities—Continued
(Union hourly wage rates, July 1, 1976, and wage rates, straight-time weekly hours, and employer insurance, pension, vacation, and other contributions to funds in the building trades, July 1, 1977)
July 1, 1976 July 1, 1977
City and job classification Hoursper
week2
Employer contributions for selected benefits3
Rate per hour1
Rate per hour1 Insurance4 Pension Vacation Other5
Dollars Percent Dollars Percent Dollars Percent Dollars Percent
Columbus, Ohio —Continued
Highway and street construction —Continued
Journeymen— Continued
Engineers— Power equipment operators:Heavy equipment............... $10,290 $11,040 40.00 0.560 1.000 0.040Power graders, bulldozers, trench machines....... 10.170 10.920 40.00 .560 _ 1.000 _ _ .040 .
Asphalt rollers, pumps (4 in. and over)................. 9.130 9.880 40.00 .560 _ 1.000 _ _ _ .040 .
Rollers, brick grade, portable compressors....... 8.700 9.450 40.00 .560 _ 1.000 _ _ _ .040 _
Structural iron workers........... 10.350 10.850 40.00 .900 - 1.550 - - - .010 -
Helpers and laborers
Common laborers ................. 7.720 8.270 40.00 .650 .400 .100
Other heavy construction
Journeymen
Carpenters........................... 9.370 9.870 40.00 .400 .700 .030Cement finishers................... 9.430 9.880 40.00 .600 - .150 - - - - -Engineers— Power equip
ment operators heavy equipment................ 10.290 11.040 40.00 .560 1.000 .040Power graders, bulldozers, trench machines....... 10.170 10.920 40.00 .560 1.000 _ _ _ .040 _
Asphalt rollers, pumps (4 in. and over).... ............ 9.130 9.880 40.00 .560 _ 1.000 _ _ _ .040 _
Rollers, brick grade, portable compressors....... 8.700 9.450 40.00 .560 _ 1.000 _ _ _ .040 _
Structural iron workers........... 10.350 10.850 40.00 .900 - 1.550 - - - .010 -
Helpers and laborers
Common laborers................. 7.720 8.270 40.00 .650 .400 .100
Corpus Christi, Texas
Building construction
Journeymen
Asbestos workers ................. 9.290 9.790 40.00 .500 .500Boilermakers......................... 9.000 10.000 40.00 .500 - 1.000 - - - - -Bricklayers............................ 7.910 8.560 40.00 .280 - .300 - - - .120 -Carpenters........................... 7.090 7.590 40.00 .460 - .300 - - - - -
Millwrights......................... 8.550 9.800 40.00" " " "
~'
—
58Digitized for FRASER http://fraser.stlouisfed.org/ Federal Reserve Bank of St. Louis

Table 20. Wage rates, hours, and employer contributions for selected benefits: Selected cities—Continued
(Union hourly wage rates, July 1, 1976, and wage rates, straight-time weekly hours, and employer insurance, pension, vacation, and other contributions to funds in the building trades, July 1, 1977)
July 1, 1976 July 1, 1977
City and job classification Hoursper
week2
Employer contributions for selected benefits3Rate per
hour1Rate per
hour1 Insurance4 Pension Vacation Other5
Dollars Percent Dollars Percent Dollars Percent Dollars Percent
Corpus Christ!, Texas —Continued
Building construction —Continued
Journeymen — Continued
Cement finishers................... $7,650 $8,250 40.00 _ _ _ _ _ - _ _Drywall tapers(finishers)............................
Electricians (inside8.130 8.330 40.00 0.400 — 0.250 _ —
wirers)............................... 9.072 10.128 40.00 .600 - - 3.00 - 6 4.00 - 1.00Elevator constructors............. 9.070 9.270 40.00 .545 - .350 - - 6.00 0.020 2.30Engineers— Power equipment operators:
Heavy equipment............... 7.350 8.150 40.00 .280 - .450 - - - - -Light equipment ................ 6.425 7.025 40.00 .280 - .450 - - - - -
Glaziers............................... 6.340 6.850 40.00 - - .200 - - - - -Lathers ................................ 7.750 8.450 40.00 .300 - .200 - 1.000 - .050 -Mosaic and terrazzoworkers .............................. 7.280 7.930 40.00 - - .150 - - - - -
Painters:Commercial........................ 7.180 7.380 40.00 .400 - .250 - - - - -
Spray.............................. 7.580 7.780 40.00 .400 - .250 - - - - -Industrial:
Brush.............................. 7.430 7.630 40.00 .400 - .250 - - - - -Spray.............................. 7.680 7.880 40.00 .400 - .250 - - - - -
Paperhangers....................... 7.580 7.780 40.00 .400 - .250 - - - - -Plasterers............................. 9.050 9.600 40.00 - - - - - - .080 -Plumbers.............................. 8.400 8.900 40.00 .335 - .350 - - - - -Reinforcing iron workers........ 6.640 6.940 40.00 .550 - 1.000 - - - - -Roofers, composition............. 5.925 6.325 40.00 - - .250 - - - - -Roofers, slate and tile ............ 5.925 6.325 40.00 - - .250 - - - - -Sheet-metal workers.............. 8.280 8.480 40.00 .350 - .275 - 6.140 - - -Structural-iron workers........... 6.640 6.940 40.00 .550 - 1.000 - - - - -
Helpers and laborers
Bricklayers’ tenders............... 4.800 5.350 40.00 .280 _ .100 - _ _ _ _Construction laborers............ 4.600 5.150 40.00 .280 - .100 - - - - -Elevator constructors’helpers............................... 6.350 6.490 40.00 .545 - .350 - - 6.00 .020 2.30
Plasterers’ laborers................ 4.800 5.450 40.00 .280 - .100 - - - - -
Dallas, Texas
Building construction
Journeymen
Asbestos workers ................. 9.380 10.030 40.00 .400 _ .760 _ _ _ _ _Boilermakers......................... 9.000 10.000 40.00 .500 - 1.000 - - - - -Bricklayers............................ 8.880 9.170 40.00 .450 - .500 - - - .040 -Carpenters........................... 9.010 9.810 40.00 .300 - .300 - - - - -
Millwrights.......................... 9.640 10.440 40.00 .300 - - - - - - -Cement finishers................... 8.435 9.350 40.00 .550 - .550 - - - - -Drywall tapers
40.00 .350 .400(finishers)............................ 8.650 9.450"
See footnotes at end of table.
59Digitized for FRASER http://fraser.stlouisfed.org/ Federal Reserve Bank of St. Louis

Table 20. Wage rates, hours, and employer contributions for selected benefits: Selected cities—Continued
(Union hourly wage rates, July 1, 1976, and wage rates, straight-time weekly hours, and employer insurance, pension, vacation, and othercontributions to funds in the building trades, July 1, 1977)
City and job classification
July 1,1976 July 1, 1977
Employer contributions for selected benefits3Rate per
hour1Rate per
hour1
noursper
week2Insurance4 Pension Vacation Other5
Dollars Percent Dollars Percent Dollars Percent Dollars Percent
Dallas, Texas — Continued
Building construction — Continued
Journeymen— Continued
Electricians (inside w irers).................................... $9,744 $10,013 40.00 6.00 7.00 4.00
Elevator constructors............... 9.330 9.910 40.00 0.545 - 0.350 - _ 6.00 .020 2.31Engineers— Power equip
ment operators:Heavy equipment— Bulldozers and cats, carryalls, mixers (14 cu. ft.), cranes, derricks, draglines, hoists (2 drums or ove r).................................... 8.653 9.253 40.00 .400 .700
Light equipm ent- hoists (single drum), mixers (less than 14 cu. ft.), rollers (10 tons or less), scrapers (3 cu. yds. or less), single air compressors........................ 8.253 8.853 40.00 .400 .700
G laziers.................................... 7.940 8.440 40.00 .400 - .550 - 6 0.500 - - -Lathers..................................... 9.280 9.880 40.00 - - - - 6 .500 - 0.080 _M achinists................................ 11.100 11.100 40.00 - - - - - - - _Marble se tte rs .......................... 9.200 9.200 40.00 - - - - - - - -Mosaic and terrazzo
w orkers.................................. 8.700 9.200 40.00 . . _ . .050Painters.................................... 8.525 9.325 40.00 .350 - .400 - - - - -
Residential............................ 7.650 8.450 40.00 .350 - .400 - - - _ _Spray painters...................... 8.900 9.700 40.00 .350 - .400 - - - - -
Structural steel swing sta g e ................................... 8.900 9.700 40.00 .350 . .400 _
Paperhangers........................... 8.775 9.575 40.00 .350 - .400 - - - - -P ipefitters................................. 9.280 9.980 40.00 .430 - 1.000 - 6 .250 - .050 -Plasterers................................. 8.940 9.440 40.00 .450 - - - .500 - .080 -Plum bers.................................. 9.280 9.980 40.00 .430 - 1.000 - 6 .250 - .050 _Reinforcing iron workers.......... 8.390 9.250 40.00 .550 - 1.000 - - - - -Roofers, composition............... 8.180 8.780 40.00 - - .250 - - . - - -Roofers, slate and tile ............. 8.330 8.930 40.00 - - .250 - - - - -Sheet-metal workers................ 9.135 10.275 40.00 .450 - .660 - - - .075 -Stonemasons............................ 8.880 9.170 40.00 .450 - .500 - - - .040 -Structural-iron w orkers............ 8.390 9.250 40.00 .550 - 1.000 - - - - -Tile layers................................. 9.100 9.400 40.00 - - .300 - - - - -Marble setters’
helpers................................... 7.200 7.200 40.00 - - - - - . - - -
Helpers and laborers
Bricklayers’ tenders................. 6.270 6.670 40.00 .275 .300 .020Mortar m ixers....................... 6.270 6.670 40.00 .275 - .300 - - - .020 _
Building laborers...................... 6.020 6.420 40.00 .275 - .300 - - - .020 -
Elevator constructors’ helpers.................................... 6.530 6.940 40.00 .545 _ .350 _ _ 6.00 (9) 2.31
Plasterers’ laborers.................. 6.270 6.670 40.00 .275 .300 - .020 -
See footnotes at end of table.
6 0Digitized for FRASER http://fraser.stlouisfed.org/ Federal Reserve Bank of St. Louis

Table 20. Wage rates, hours, and employer contributions for selected benefits: Selected cities—Continued
(Union hourly wage rates, July 1, 1976, and wage rates, straight-time weekly hours, and employer insurance, pension, vacation, and other contributions to funds in the building trades, July 1, 1977)
July 1, 1976 July 1, 1977
City and job classification Hoursper
week2
Employer contributions for selected benefits3
Rate per hour1
Rate per hour1 Insurance4 Pension Vacation Other5
Dollars Percent Dollars Percent Dollars Percent Dollars Percent
Dallas, Texas — Continued
Building construction — Continued
Helpers and laborers — Continued
Terrazzo workers’ helpers............................... $6,270 $6,670 40.00 0.275 0.300 0.020
Tile layers’ helpers................. 7.400 7.400 40.00 - - - - - - - -
Denver, Colo.
Building construction
Journeymen
Asbestos workers................. 8.810 9.560 40.00 .380 1.170 6 1.200Boilermakers......................... 9.450 10.300 40.00 .850 - 1.000 - - - - -Bricklayers............................ 9.600 9.600 40.00 .850 - .950 - .500 - .300 -
Sewer workers.................. 9.850 9.850 40.00 .850 - .950 - .500 - .300 -Carpenters........................... 9.085 9.485 40.00 .780 - .850 - .650 - - -
Residential........................ 9.085 9.485 40.00 .780 - .850 - .650 - - -Millwrights......................... 8.912 9.335 40.00 .780 - .850 - - 6 6.00 - -
Cement finishers................... 8.440 9.220 40.00 .490 - 1.150 - .600 - 6.250 -Composition floor layers and machine operators......................... 8.940 9.720 40.00 .490 1.150 .600 # 6.250
Drywall tapers (finishers):Hand................................ 8.910 9.480 40.00 .700 .850 6.750 6.150Machine............................ 9.390 10.080 40.00 .700 - .850 - 6.750 - 6 .150 -
Electricians (inside wirers)............................... + 10.240 10.943 40.00 .700 _ .750 3.00 _ 6 4.00 _ 3.40Cable splicers.................... + 10.470 11.177 40.00 .700 - .750 3.00 - 6 4.00 - 3.40Residential wirers............... +6.634 7.248 40.00 .620 - - 3.00 - 6 4.00 - -
Elevator constructors............. 9.810 11.140 40.00 +.745 - .350 - - 6.00 +.020 2.30Engineers— Power equip
ment operators:Group 1:Tractor under 70 h.p.......... ’ 7.150 7.900 40.00 .490 .750 .300 + .130
Group 2:Conveyor, forklift............... 7.500 8.250 40.00 .490 .750 _ .300 _ + .130 _
Group 3:Tractor 70 h.p. and over............................... 7.850 8.600 40.00 .490 .750 .300 +.130
Group 4:Crane 50 tons and under.............................. 8.000 8.750 40.00 .490 .750 .300 + .130
Group 5:Crane over 50 tons........... 8.150 8.900 40.00 .490 _ .750 _ .300 _ + .130 _
Group 6:Wheel excavator............... 8.300 9.050 40.00 .490 _ .750 _ .300 _ + .130 .
Glaziers............................... 9.658 10.760 40.00 - - - - - 6 4.00 - -Lathers................................ 9.140 10.340 40.00 - - 6.500 - 6 .500 - .200 -
Marble setters...................... 9.350 9.860 40.00 .900 - .850 - .400 - .050 -Mosaic and terrazzo
workers.............................. 9.350 9.860 40.00 .900 - .850 - .400 - .050 -
See footnotes at end of table.
61Digitized for FRASER http://fraser.stlouisfed.org/ Federal Reserve Bank of St. Louis
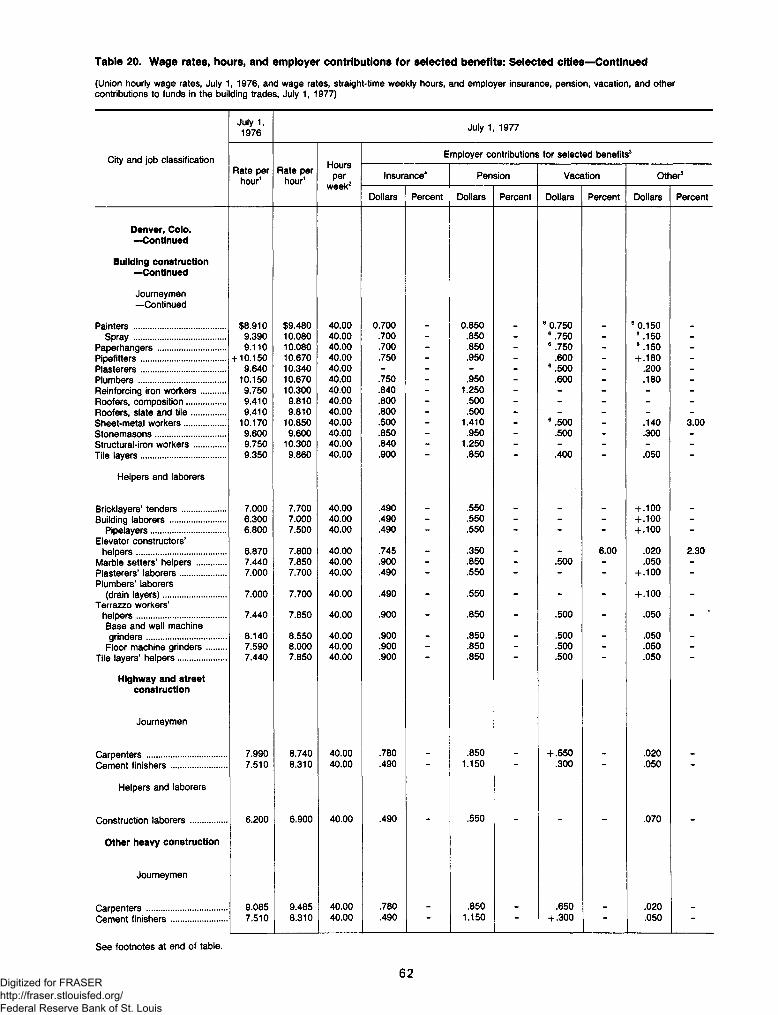
Table 20. Wage rates, hours, and employer contributions for selected benefits: Selected cities—Continued
(Union hourly wage rates, July 1, 1976, and wage rates, straight-time weekly hours, and employer insurance, pension, vacation, and othercontributions to funds in the building trades, July 1, 1977)
City and job classification
Denver, Colo. —Continued
Building construction —Continued
Journeymen— Continued
Painters........................Spray........................
Paperhangers................Pipefitters......................Plasterers......................Plumbers.......................Reinforcing iron workers ...Roofers, composition......Roofers, slate and tile .....Sheet-metal workers.......Stonemasons.................Structural-iron workers....Tile layers......................
Helpers and laborers
Bricklayers’ tenders........Building laborers ............
Pipelayers...................Elevator constructors’
helpers........................Marble setters’ helpers...Plasterers’ laborers.........Plumbers’ laborers
(drain layers)...............Terrazzo workers’
helpers........................Base and wall machinegrinders....................
Floor machine grinders . Tile layers’ helpers..........
Highway and street construction
Journeymen
Carpenters.........................Cement finishers................
Helpers and laborers
Construction laborers..........
Other heavy construction
Journeymen
Carpenters.......Cement finishers
July 1,1976
July 1, 1977
Employer contributions for selected benefits3Rate per
hour1Rate per
hour1noursper
week2Insurance4 Pension Vacation Other5
Dollars Percent Dollars Percent Dollars Percent Dollars Percent
$8,910 $9,480 40.00 0.700 0.850 6 0.750 6 0.1509.390 10.080 40.00 .700 - .850 - 6.750 - 6.150 -
9.110 10.080 40.00 .700 - .850 - 6 .750 - 6 .150 -
+ 10.150 10.670 40.00 .750 - .950 - .600 - + .180 -
9.640 10.340 40.00 - - - - 6.500 - .200 -
10.150 10.670 40.00 .750 - .950 - .600 - .180 -
9.750 10.300 40.00 .840 - 1.250 - - - - -
9.410 9.810 40.00 .800 - .500 - - - - -
9.410 9.810 40.00 .800 - .500 - - - - -
10.170 10.850 40.00 .500 - 1.410 - 6.500 - .140 3.009.600 9.600 40.00 .850 - .950 - .500 - .300 -
9.750 10.300 40.00 .840 - 1.250 - - - - -
9.350 9.860 40.00 .900 .850 .400 .050
7.000 7.700 40.00 .490 .550 + .1006.300 7.000 40.00 .490 - .550 - - - + .100 -
6.800 7.500 40.00 .490 - .550 - - - + .100 -
6.870 7.800 40.00 .745 _ .350 _ 6.00 .020 2.307.440 7.850 40.00 .900 - .850 - .500 - .050 -
7.000 7.700 40.00 .490 - .550 - - - + .100 -
7.000 7.700 40.00 .490 - .550 - - - + .100 -
7.440 7.850 40.00 .900 - .850 - .500 - .050 - ‘
8.140 8.550 40.00 .900 _ .850 _ .500 _ .050 _7.590 8.000 40.00 .900 - .850 - .500 - .050 -
7.440 7.850 40.00 .900 .850 .500 .050
7.990 8.740 40.00 .780 .850 + .650 .0207.510 8.310 40.00 .490 1.150 .300 .050
6.200 6.900 40.00 .490 - .550 - - - .070 -
9.085 9.485 40.00 .780 .850 .650 .0207.510 8.310 40.00 .490 - 1.150 - + .300 - .050 -
See footnotes at end of table.
62Digitized for FRASER http://fraser.stlouisfed.org/ Federal Reserve Bank of St. Louis

(Union hourly wage rates, July 1, 1976, and wage rates, straight-time weekly hours, and employer insurance, pension, vacation, and other contributions to funds in the building trades, July 1, 1977)
Table 20. Wage rates, hours, and employer contributions for selected benefits: Selected cities—Continued
July 1, 1976 July 1, 1977
City and job classification Hoursper
week2
Employer contributions for selected benefits3Rate per
hour1Rate per
hour1 Insurance4 Pension Vacation Other5
Dollars Percent Dollars Percent Dollars Percent Dollars Percent
Denver, Colo. —Continued
Other heavy construction —Continued
Helpers and laborers
Construction laborers............ $6,200 $6,900 40.00 0.490 - 0.550 - - - 0.070 -
Detroit, Mich.
Building construction
Journeymen
Asbestos workers................. 10.140 10.900 40.00 .950 _ 1.390 _ 6 1.250 _ .420Boilermakers......................... 10.900 11.170 40.00 1.000 - 1.200 - 1.750 - - -Bricklayers............................ 10.780 11.560 40.00 .800 - - 8.00 - 11.00 .240 -
Cleaners, caulkers andpointers........................... 10.780 11.560 40.00 .800 - - 8.00 - 11.00 .240 -
Cement block layers........... 10.780 11.560 40.00 .800 - - 8.00 - 11.00 .240 -Carpenters........................... 10.480 11.110 35.00 .750 - - 10.00 - 11.00 .030 -
Millwrights.......................... 10.100 10.800 40.00 .800 - - 11.00 2.592 - - -Cement masons.................... 9.500 10.550 40.00 .800 - - 10.00 - 11.00 - -Electricians (inside
wirers)............................... 10.302 10.920 35.00 1.200 - 1.060 3.00 - 6 9.00 .780 -Elevator constructors............. 11.170 12.475 40.00 .545 - .350 - - 6.00 .020 2.31Engineers— Power equip
ment operators:Boom and jib or leads220 ft. or longer................ 11.270 12.040 40.00 .800 - 1.000 - - 10.00 .030 -
Boom and jib or leads140 ft. or longer................ 11.050 11.810 40.00 .800 - 1.000 - - 10.00 .030 -
Crane operators................. 10.820 11.580 40.00 .800 - 1.000 - - 10.00 .030 -Regular engineers.............. 10.520 11.200 40.00 .800 - 1.000 - - 10.00 .030 -Compressors ..................... 9.510 10.050 40.00 .800 - 1.000 - - 10.00 .030 -
Firemen and oilers............. 8.750 9.160 40.00 .800 - 1.000 - - 10.00 .030 -
Glaziers (outside).................. 9.150 10.310 40.00 .550 - .750 - - - 6 .350 1.20Lathers ................................ 9.920 10.650 35.00 1.020 - .970 - 6.760 - .440 -Marble setters...................... 10.490 11.320 40.00 .600 - 1.000 - .800 - - -Mosaic and terrazzo
workers.............................. 9.740 10.490 40.00 .600 - 1.000 - .800 - .100 -Painters............................... 10.000 10.700 40.00 .820 - 1.000 - 1.050 - - -
Spray or swing (under40 feet) ........................... 10.500 11.200 40.00 .820 - 1.000 - 1.050 - - -
Paperhangers....................... 10.000 10.700 40.00 .820 - 1.000 - 1.050 - - -Drywall tapers.................... 10.250 10.950 40.00 .820 - 1.000 - 1.050 - - -
Pipefitters............................. 9.600 10.550 40.00 1.250 - 1.300 - 1.500 - .420 -Sprinkler fitters.................. 10.400 11.500 40.00 .650 - .950 - 6 1.300 - .500 -
Plasterers............................. 10.390 12.250 40.00 .850 - .750 - 1.000 - .070 -Plumbers.............................. 9.470 10.750 40.00 1.250 - 1.300 - 1.250 - .470 -Reinforcing iron workers........ 9.063 10.100 40.00 .980 - - 15.00 - 15.00 .300 -Roofers, composition............. 9.910 10.810 40.00 .800 - .800 - 1.000 - .160 -Roofers, slate and tile ............ 10.910 11.810 40.00 .800 - .800 - 1.000 - .160 -
Precast tile ........................ 9.910 10.810 40.00 .800 - .800 - 1.000 - .160 -Sheet-metal workers:
Agreement A ..................... 10.135 10.550 40.00 .961 - 1.522 - 1.160 - .870 -Agreement B ..................... 9.410 10.120 40.00 1.490 - 1.430 - 1.270 - .730 -
Stonemasons........................ 10.780 11.560 40.00 .800 — — 8.00 11.00 .240
See footnotes at end of table.
63Digitized for FRASER http://fraser.stlouisfed.org/ Federal Reserve Bank of St. Louis

Table 20. Wage rates, hours, and employer contributions for selected benefits: Selected cities—Continued
(Union hourly wage rates, July 1, 1976, and wage rates, straight-tim e weekly hours, and em ployer insurance, pension, vacation, and othercontributions to funds in the building trades, July 1, 1977)
City and job classification
July 1,1976
Rate per hour1
July 1, 1977
Rate per hour1
Hoursper
week2
Employer contributions for selected benefits3
Insurance4
Dollars Percent
Pension
Dollars Percent
Vacation
Dollars Percent
Other5
Dollars Percent
—Continued
Building construction —Continued
Journeymen— Continued
Structual-iron workersRiggers................
Tile layers................
$9,7509.500
10.100$10,647
10.00010.880
40.0040.0040.00
1.100.600
8.000.9701.000
15.001.600.800
18.00 0.020.020.050
Helpers and laborers
Bricklayers’ tenders.........Mortar mixers..............
Building laborers.............Elevator constructors’
helpers.........................Marble setters’ helpers....Plasterers’ tenders...........Mosaic and terrazzo
workers’ helpers...........Base machine operatorsor base grinders.........
Tile layers’ helpers..........
8.3708.3008.220
8.930 9.0108.930
40.0040.0040.00
7.8208.660
10.0108.7309.270
10.180
40.0040.0040.00
9.120 10.550 40.00
9.520 10.5508.660 9.270
40.0040.00
.800
.800
.800
.545
.600
.800
.600
.600
.600
.800
.800
.800
.850
.850
.850
.070
.070
.070
.350
.800
.7406 .900 1.000
6.00 .020.300.070
2.31
.400 .650 .100
.400
.800.650.900
.100
.300
construction
Journeymen
Carpenters...................Cement m asons.............Engineers— Power equip
ment operators:Class I— Asphalt rollers, cranes, pavers (5 bags or more), gradeaHs, bulldozers, trenchingmachines................
Class II— Backhoes, sweepers, crushers ....
Class III— Air compressors, concretebreakers..................
Class IV— Oilers, finishing machines, end- loaders (under 1 yd)...
Structural iron workers ....
10.480 11.11010.400 10.900
35.0040.00
8.850
8.630
9.450 40.00
9.220 40.00
8.170 8.760 40.00
8.040 8.6309.750 10.647
40.0040.00
.750
.500
.800
.800
.800
.8008.00
.25010.00
.850
.850
.850
.85015.00
Helpers and laborers
11.00 .030
10.00 .030
10.00 .030
10.00 .030
10.00 .03018.00 .040
Highway laborers 7.900 8.150 40.00 .550 .350 .650 .070
See footnotes at end of table.
64Digitized for FRASER http://fraser.stlouisfed.org/ Federal Reserve Bank of St. Louis

(Union hourly wage rates, July 1, 1976, and wage rates, straight-time weekly hours, and employer insurance, pension, vacation, and other contributions to funds in the building trades, July 1, 1977)
Table 20. Wage rates, hours, and employer contributions for selected benefits: Selected cities—Continued
July 1, 1976 July 1, 1977
City and job classification Hoursper
week2
Employer contributions for selected benefits3Rate per
hour1Rate per
hour1 Insurance4 Pension Vacation Other5
Dollars Percent Dollars Percent Dollars Percent Dollars Percent
Detroit, Mich. — Continued
Other heavy construction
Journeymen
Carpenters........................... $10,480 $11,110 35.00 0.750 10.00 11.00 0.030Cement masons.................... 10.400 10.900 40.00 .500 - 0.250 - - - - -
Engineers— Power equipment operators:
Underground:Class I .............................. 8.900 9.730 40.00 .800 1.000 10.00 .010Class I I ............................. 8.780 9.610 40.00 .800 - 1.000 - - 10.00 .010 -
Class II I............................ 8.120 8.950 40.00 .800 - 1.000 - - 10.00 ,010 -Class IV ............................ 7.600 8.430 40.00 .800 - 1.000 - - 10.00 .010 -
Structural iron workers........... 9.750 10.647 40.00 - 8.00 - 15.00 - 18.00 .040 -
Helpers and laborers
Distribution laborers............... 7.260 7.470 40.00 .550 .350 6 0.550 .040Underground laborers............ 7.450 7.770 40.00 .750 - .650 - .750 - .070 -
Flint, Mich.
Building construction
Journeymen
Asbestos workers................. 9.350 9.460 40.00 .840 1.480 1.650Boilermakers......................... 10.900 11.170 40.00 1.000 - 1.200 - 1.750 - - -
Bricklayers............................ 10.050 10.550 40.00 .600 - 1.000 - 6.500 - .060 -Carpenters........................... 8.940 9.630 40.00 .600 - .600 - 6.610 - .020 -
Millwrights......................... 10.100 10.800 40.00 .800 - - 11.00 2.592 - - -Cement finishers ................... 9.480 9.900 40.00 .480 - .450 - 6 1.150 - - -Electricians (inside
wirers)............................... 10.750 10.750 40.00 .400 _ .750 _ 6.500 _Elevator constructors............. 10.420 11.000 40.00 .545 - .350 - - 6 6.00 .020 2.31Engineers— Power equip
ment operators:Cranes with boom and jib 220 feet or Longer (class A )............... 10.215 10.710 40.00 .800 1.000 8 10.00 .020
Cranes with main boom and jib 140 feet or Longer (class B )............... 9.990 10.485 40.00 .800 1.000 8 10.00 .020
Graders, dozers, and Hoists (class C )................ 9.765 10.260 40.00 .800 - 1.000 - _ 8 10.00 .020 _
Air tuggers, winch Trucks (class D )............... 9.360 9.765 40.00 .800 - 1.000 - - 8 10.00 .020 _
Pumps over 6 in.(class E).......................... 9.180 9.585 40.00 .800 - 1.000 - - 8 10.00 .020 -
Air compressors, pumps Under 6 in. (class F )................................... 8.190 8.505 40.00 .800 1.000 8 10.00 .020
Oilers............................... 7.560 7.875 40.00 .800 - 1.000 - - 8 10.00 .020 -Glaziers............................... 8.790 9.290 40.00 .550 - .700 - - 6.00 .155 -Lathers................................ 8.150 8.470 40.00 .920 “ .300 6.500 .100
See footnotes a t end of table.
65Digitized for FRASER http://fraser.stlouisfed.org/ Federal Reserve Bank of St. Louis

Table 20. Wage rates, hours, and employer contributions for selected benefits: Selected cities—Continued
(Union hourly wage rates, July 1, 1976, and wage rates, straight-time weekly hours, and employer insurance, pension, vacation, and other contributions to funds in the building trades, July 1, 1977)
July 1, 1976 July 1, 1977
City and job classification Hoursper
week2
Employer contributions for selected benefits3
Rate per hour1
Rate per hour1 Insurance4 Pension Vacation Other5
Dollars Percent Dollars Percent Dollars Percent Dollars Percent
Flint, Mich. —Continued
Building construction —Continued
Journeymen— Continued
Marble masons..................... $10,050 $10,550 40.00 0.600 1.000 6 0.500 0.060Mosaic and terrazzo
workers.............................. 9.140 9.490 40.00 .600 . 1.000 6.500 .005Painters............................... 8.000 8.700 40.00 .500 - .700 - 6.600 - .010 _
Spray............................... 8.300 9.000 40.00 .500 - .700 - 6 .600 - .010 -Swing stage...................... 8.300 9.000 40.00 .500 - .700 - 6 .600 - .010 -Drywall tapers.................... 8.000 8.700 40.00 .500 - .700 - 6.600 - .010 -
Paperhangers....................... 8.300 9.000 40.00 .500 - .700 - 6 .600 - .010 -Pipefitters............................. 9.740 10.470 40.00 1.000 - 1.100 - 6 1.000 - .100 -Plasterers............................. 8.820 9.070 40.00 .500 - .500 - 6 1.010 - .050 -
Plumbers.............................. 9.740 10.470 40.00 1.000 - 1.100 - 6 1.000 - .100 -Reinforcing iron workers........ 9.063 10.100 40.00 .980 - - 15.00 - 15.00 .300 -Roofers, composition............. 10.850 11.450 40.00 .600 - .600 - - - - -Roofers, slate and tile ............ 11.200 11.800 40.00 .600 - .600 - - - - -Sheet-metal workers.............. 8.690 9.690 40.00 .790 - 1.200 - 1.000 - .100 _Stonemasons........................ 10.050 10.550 40.00 .600 - 1.000 - 6 .500 - .060 -Structural-iron workers........... 9.750 10.650 40.00 - 8.00 - 15.00 - 18.00 .040 -Tile layers............................. 9.140 9.490 40.00 .600 - 1.000 - 6.500 - .005 -
Helpers and laborers
Bricklayers’ tenders............... 7.740 7.890 40.00 .550 .550 6.500 .040Building laborers ................... 7.740 7.890 40.00 .550 - .550 - 6.500 - .040 -Composition roofers’
helpers.............................. 7.080 7.180 40.00 .600 _ .600 _ . .Elevator constructors’
helpers.............................. 7.290 7.700 40.00 .545 _ .350 _ . 6.00 .020 2.31Plasterers’ laborers................ 7.740 7.890 40.00 .550 - .550 - 6.500 - .040 -
Highway and street construction
Journeymen
Carpenters........................... 9.480 16 9.230 40.00 .600 .500 6.650Cement finishers................... 10.500 10.900 40.00 .500 - .500 - - - - -Engineers— Power equip
ment operators:Class I— Cranes, shovels, pavers....................... 8.850 9.450 40.00 .800 .850 10.00 .030
Class II— Crushers, backhoes with less than 3/8 yd. bucket......... 8.630 9.220 40.00 .800 .850 10.00 .030
Class III— Air compressors .......................... 8.170 8.760 40.00 .800 _ .850 _ _ 10.00 .030
Class IV— Boom or winch hoists, roller operators ......................... 8.040 8.630 40.00 .800 .850 10.00 .030
Structural iron workers........... 9.750 10.650 40.00 8.00 15.00 - 18.00 .040 -
See footnotes at end of table.
6 6Digitized for FRASER http://fraser.stlouisfed.org/ Federal Reserve Bank of St. Louis

Table 20. Wage rates, hours, and employer contributions for selected benefits: Selected cities—Continued
(Union hourly wage rates, July 1, 1976, and wage rates, straight-time weekly hours, and employer insurance, pension, vacation, and other contributions to funds in the building trades, July 1, 1977)
July 1, 1976 July 1, 1977
City and job classification Hoursper
week2
Employer contributions for selected benefits3Rate per
hour1Rate per
hour1 Insurance4 Pension Vacation Other5
Dollars Percent Dollars Percent Dollars Percent Dollars Percent
Flint, Mich. —Continued
Highway and street construction —Continued
Helpers and laborers
Laborers............................... $8,050 $8,050 40.00 0.400 0.300 0.550 0.040
Other heavy construction
Journeymen
Carpenters........................... 9.480 16 9.230 40.00 .600 .500 .650Cement finishers................... 10.500 10.900 40.00 .500 - .500 - - - - -
Engineers— Power equipment operators:Agreement A:Class A— Cranes with boom and jib 220 ft. or longer......................... 10.215 10.710 40.00 .800 1.000 6 10.00 .020
Class B— Cranes with boom and jib 140 ft. or longer......................... 9.990 10.485 40.00 .800 1.000 6 10.00 .020
Class C— Graders, dozers, hoists................. 9.765 10.260 40.00 .800 _ 1.000 _ _ 6 10.00 .020 _
Class D— Air tuggers, winch trucks.................... 9.360 9.765 40.00 .800 _ 1.000 _ _ 6 10.00 # .020 _
Class E— Pumps over 6 in................................. 9.180 9.585 40.00 .800 _ 1.000 _ _ 6 10.00 .020 _
Class F— Air compressors, pumps under 6 in................................. 8.190 8.505 40.00 .800 1.000 6 10.00 .020
Agreement B:Class I ............................. 8.150 8.900 40.00 .800 . 1.000 _ _ 10.00 .010 .Class 11-A......................... 8.050 8.810 40.00 .800 - 1.000 - - 10.00 .010 -
Class ll-B ......................... 7.850 8.610 40.00 .800 - 1.000 - - 10.00 .010 -Class III........................... 7.510 8.260 40.00 .800 - 1.000 - - 10.00 .010 -Class IV .......................... 7.050 7.810 40.00 .800 - 1.000 - - 10.00 .010 -
Agreement C (underground):Class I— Cranes, backhoes ........................ 9.270 9.880 40.00 .800 .850 10.00 .030
Class II— Dozers, trenchers........................ 9.150 9.770 40.00 .800 _ .850 _ _ 10.00 .030 _
Class III— Compressors .......................... 8.480 9.100 40.00 .800 _ .850 _ _ 10.00 .030 _
Class IV— Rollers.............. 7.960 8.580 40.00 .800 - .850 - - 10.00 .030 -Structural iron workers........... 9.750 10.650 40.00 - 8.00 - 15.00 - 18.00 .040 -
Helpers and laborers
Laborers............................... 6.860 7.090 40.00 .650 - .550 - .550 - .070 -
67
Digitized for FRASER http://fraser.stlouisfed.org/ Federal Reserve Bank of St. Louis

Table 20. Wage rates, hours, and employer contributions for selected benefits: Selected cities—Continued
(Union hourly wage rates, July 1, 1976, and wage rates, straight-time weekly hours, and employer insurance, pension, vacation, and other contributions to funds in the building trades, July 1, 1977)
July 1, 1976 July 1, 1977
City and job classification Hoursper
week2
Employer contributions for selected benefits3Rate per
hour1Rate per
hour1 Insurance4 Pension Vacation Other4
Dollars Percent Dollars Percent Dollars Percent Dollars Percent
Fort Worth, Texas
Building construction
Journeymen
Asbestos workers................. $9,380 $10,030 40.00 0.400 _ 0.760 _ . _Boilermakers......................... 9.000 10.000 40.00 .500 - 1.000 - - _ _ .Bricklayers............................ 8.880 9.170 40.00 .450 - .500 - - - 0.040 -Carpenters........................... 9.010 9.810 40.00 .300 - .300 - - - - -
Millwrights......................... 9.640 10.440 40.00 .300 - - - - - - -Cement masons .................... 8.745 9.245 40.00 .400 - .600 - - - - -Drywall tapers(finishers)............................ 9.345 10.145 40.00 - - .200 - - - - -
Electricians (insidewirers)............................... 9.532 9.805 40.00 .600 - - 7.00 - 6 6.00 - -
Elevator constructors............. 9.330 9.910 40.00 .545 - .350 - - 6.00 .020 2.31Engineers— Power equip
ment operators:Heavy equipment............... 8.425 8.975 40.00 .400 - .875 - - - - -Light equipment................ 8.025 8.575 40.00 .400 - .875 - - - - -
Glaziers............................... 7.940 8.440 40.00 .400 - .550 - 0.500 - - -Lathers................................ 9.780 10.380 40.00 - - - - - - .080 -Mosaic and terrazzo
workers.............................. 9.100 9.400 40.00 - - .300 - - - - -Painters............................... 9.095 9.895 40.00 - - .200 - - - - -
Spray, swing stage,structural steel................. 9.345 10.145 40.00 - - .200 - - - - -
Plasterers............................. 9.810 10.410 40.00 - - - - - - .080 -Plumbers.............................. 9.280 9.980 40.00 .430 - 1.000 - 6 .250 - .040 -Reinforcing iron workers........ 8.290 9.250 40.00 .550 - 1.000 - - - - -Roofers, composition............. 8.415 9.015 40.00 - - - - - - - -Roofers, slate and tile ............ 8.565 9.165 40.00 - - - - - - - -Sheet-metal workers.............. 9.205 10.175 40.00 .450 - .330 - 6.200 - .100 -Structural-iron workers........... 8.290 9.250 40.00 .550 - 1.000 - - - - -Tile layers............................. 9.100 9.400 40.00 - - .300 - - - - -
Helpers and laborers
Bricklayers’ tenders............... 6.270 6.570 40.00 .275 _ .400 _ _ _ .020Building laborers................... 6.020 6.320 40.00 .275 - .400 - - - .020 2.31Elevator constructors’
helpers.............................. 6.530 6.940 40.00 .545 - .350 - - 6.00 .020 OPlasterers’ laborers................ 6.270 6.570 40.00 .275 - .400 - - - .020Terrazzo workers’
helpers.............................. 6.270 6.570 40.00 .275 - .400 - - - .020 -Tile layers’ helpers................ 7.400 7.400 40.00 - - - - - - - -
Fremont, Calif.
Building construction
Journeymen
Asbestos workers................. 11.990 12.410 40.00 .970 _ 1.100 _ 1.520 _ .040Boilermakers......................... 12.000 13.715 40.00 .775 - 1.000 - .500 - - - -Bricklayers............................ 10.950 11.550 35.00 1.350 - , 1.250 “ 6 1.000 - .200 -
See footnotes at end of table.
68
Digitized for FRASER http://fraser.stlouisfed.org/ Federal Reserve Bank of St. Louis

Table 20. Wage rates, hours, and employer contributions for selected benefits: Selected cities—Continued
(Union hourly wage rates, July 1, 1976, and wage rates, straight-tim e weekly hours, and em ployer insurance, pension, vacation, and othercontributions to funds in the building trades, July 1, 1977)
City and job classification
July 1,1976 July 1, 1977
Employer contributions for selected benefits3Rate per
hour1Rate per
hour1noursper
week2Insurance4 Pension Vacation Other5
Dollars Percent Dollars Percent Dollars Percent Dollars Percent
Fremont, Calif. — Continued
Building construction — Continued
Journeymen— Continued
Carpenters........................... $10,500 $11,650 36.00 1.220 1.710 8 0.850 0.120Floor layers....................... 10.650 11.800 36.00 1.220 - 1.710 - 8.850 - .120 -Millwrights......................... 11.000 12.150 36.00 1.220 - 1.710 - 6 .850 - .120 -Shinglers.......................... 10.650 11.800 36.00 1.220 - 1.710 - 6 .850 - .120 -Power saw operators......... 10.653 11.800 36.00 1.220 - 1.710 - 8 .850 - .120 -
Cement finishers................... 10.000 10.500 40.00 1.150 - 1.430 - 1.650 - - -Electricians (inside
wirers)............................... 10.372 12.645 36.00 1.300 _ 1.650 3.00 10.00 1.70Elevator constructors............. 12.390 13.930 40.00 .545 - .350 - - 6.00 .020 2.31Engineers— Power equip—
ment operators:Compressors..................... 9.050 8 9.050 40.00 1.120 2.000 .900 .240Ross carriers..................... +9.260 8 9.260 40.00 1.120 - 2.000 - .900 - .240 -Material hoists (1 drum)............................... 9.810 8 9.810 40.00 1.120 _ 2.000 . .900 . .240
Compressors (over 2) ........ 10.020 8 10.020 40.00 1.120 - 2.000 - .900 - .240 -Small rubber-tired tractors............................ 10.170 8 10.170 40.00 1.120 . 2.000 _ .900 _ .240
Material hoists (2 or more drums)..................... + 10.320 8 10.320 40.00 1.120 _ 2.000 .900 .240 .
Dozers, tractors, eu- clids, t-pulls..................... 10.720 8 10.720 40.00 1.120 _ 2.000 _ .900 .240
Tractors (with boom)D6 or larger..................... 10.940 8 10.940 40.00 1.120 2.000 _ .900 .240 .
Multiple engine earth- moving machines.............. + 11.140 8 11.140 40.00 1.120 _ 2.000 _ .900 .240 _
Backhoes (hydraulic), power shovels, clamshells, draglines (up to 1 cu. yd. mrc)............... 11.250 8 11.250 40.00 1.120 2.000 .900 .240
Power shovels, clamshells, draglines, backhoes, gradealls (over 1 and up to 7 cu. yds. mrc) .................... 11.420 8 11.420 40.00 1.120 2.000 .900 .240
Power shovels and draglines (over 7 cu. yds. mrc).......................... + 12.490 8 12.490 40.00 1.120 2.000 .900 .240Loaders (over 18 cu. yds.)................................ + 12.770 8 12.770 40.00 1.120 _ 2.000 _ .900 .240 _
Remote-controlled earthmoving equipment..... + 13.070 8 13.070 40.00 1.120 _ 2.000 _ .900 _ .240 _
Glaziers ............................... 9.450 10.610 36.00 1.000 - 1.410 - 6 1.180 - .390 -Lathers ................................ 9.360 11.050 36.00 1.100 - 1.710 - 6 1.000 - .210 -
Machinists............................ 11.400 12.400 40.00 .749 - .900 - - - - -Marble masons..................... 10.640 11.390 35.00 1.100 - 1.000 - 1.030 - .010 -
Painters............................... 10.920 11.920 36.00 .990 - 1.300 - .400 - .400 -
Paperhangers....................... 10.920 11.920 36.00 .990 - 1.300 - .400 - .400 -
Pipefitters............................. + 11.890 13.100 36.00 1.250 - 2.290 - 1.450 - - -Plasterers............................. 9.400 10.490 32.00 1.050 - 1.050 - 8.700 - .210 -Plumbers.............................. 11.890 13.100 36.00 1.250 - 2.290 - 8 1.300 - .190 -Roofers, slate and
tile, and composition............ 10.190 10.940 20 40.00 1.170 _ 1.100 .600 .100Sheet-metal workers.............. 10.950 11.940 40.00 .730 - 2.110 - - 8.00 .100 4.00Stonemasons........................ 11.000 11.550 35.00 1.350 1.250 6 1.000 - .200 -
See footnotes at end of table.
69
Digitized for FRASER http://fraser.stlouisfed.org/ Federal Reserve Bank of St. Louis

Table 20. Wage rates, hours, and employer contributions for selected benefits: Selected cities—Continued
(Union hourly wage rates, July 1, 1976, and wage rates, straight-tim e weekly hours, and em ployer insurance, pension, vacation, and othercontributions to funds in the building trades, July 1, 1977)
City and job classification
July 1,1976
July 1, 1977
Employer contributions for selected benefits3
Rate per hour1
Rate per hour1
noursper
week2Insurance4 Pension Vacation Other5
Dollars Percent Dollars Percent Dollars Percent Dollars Percent
Fremont, Calif. — Continued
Building construction — Continued
Journeymen— Continued
Structural and reinforcing ironworkers.............. $11,030 $11,550 40.00 1.240 2.220 1.460 0.040
Terrazzo workers.................. 10.320 11.420 35.00 1.100 - 1.000 - 1.000 - .200 -
Tile layers............................. 11.000 12.000 40.00 .980 - 1.200 - 1.400 - .245 -
Helpers and laborers
Bricklayers’ tenders............... 8.140 9.340 40.00 1.200 2.000 .850Building laborers................... 8.350 8.525 40.00 1.250 0 1.750 0 1.000 0 .210 0Elevator constructors’
helpers............................... 8.670 9.750 40.00 .545 _ .350 _ _ 6.00 .020 2.31Marble setters’ helpers.......... 7.220 7.790 40.00 .655 - .250 - 1.500 - - -Plasterers’ laborers................ 8.470 9.370 40.00 1.200 - 2.000 - 6 .850 - - -Roofers’ helpers.................... 6.110 6.560 20 40.00 1.170 - 1.100 - .600 - .100 -
Terrazzo workers’ helpers.............................. 9.460 10.160 35.00 .750 _ .600 _ 1.000 . . 2 ( ~
Base machines.................. 9.860 10.560 35.00 .750 - .600 - 1.000 - .200 -
Wet machines ................... 9.460 10.160 35.00 .750 - .600 - 1.000 - .200 -Terrazzo polishers............. 9.460 10.160 35.00 .750 - .600 - 1.000 - .200 -
Tile setters’ helpers............... 8.550 9.270 40.00 .690 - .510 - - 10.00 .150 -
Other heavy construction
Journeymen
Cement finishers................... 10.000 10.500 40.00 1.150 1.430 1.500
Fresno, Calif.
Building construction
Journeymen
Asbestos workers................. 11.990 12.410 40.00 .970 1.100 1.520 .040Boilermakers......................... 12.000 13.175 40.00 .775 - 1.000 - .500 - - -Bricklayers............................ 9.350 10.500 40.00 1.100 - 1.000 - 6 1.000 - .150 -
Carpenters......................... 11.250 11.650 40.00 1.220 - 1.710 - .850 - .120 -Floor layers, patent scaffold erectors, shinglers.......................... 11.400 11.800 40.00 1.220 1.710 .850 .120
Millwrights, saw operators........................ 11.750 12.150 40.00 1.220 _ 1.710 _ .850 _ .120 .
Dry w all............................ 10.970 11.520 40.00 .720 - 1.230 - .750 - .215 -Cement masons.................... 10.460 10.500 40.00 .900 - 1.250 - 1.250 - .140 -Electricians (inside
wirers)............................... 10.760 11.760 40.00 .800 _ .950 3.00 6 1.000 _ .180 1.00Elevator constructors............. 12.390 13.930 40.00 .545 .350 6.00 .020 2.31
See footnotes at end of table.
70
Digitized for FRASER http://fraser.stlouisfed.org/ Federal Reserve Bank of St. Louis
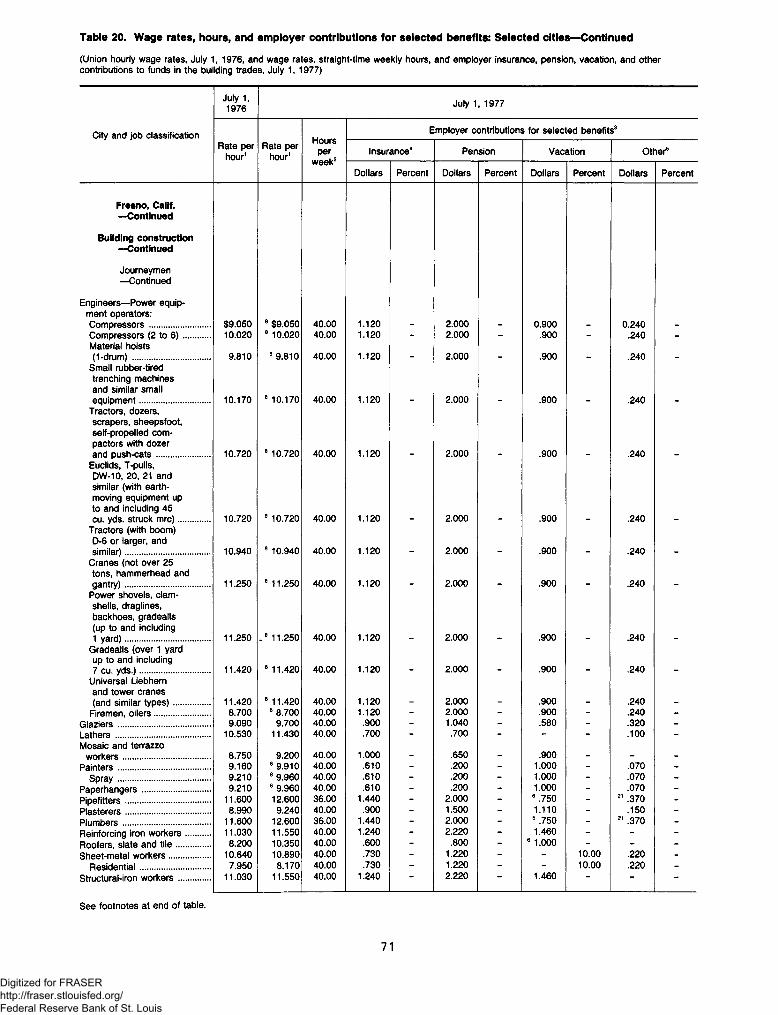
Table 20. Wage rates, hours, and employer contributions for selected benefits: Selected cities—Continued
(Union hourly wage rates, July 1, 1976, and wage rates, straight-tim e weekly hours, and em ployer insurance, pension, vacation, and othercontributions to funds in the building trades, July 1, 1977)
City and job classification
July 1,1976 July 1, 1977
Employer contributions for selected benefits3Rate per
hour1Rate per
hour1noursper
week2Insurance4 Pension Vacation Other5
Dollars Percent Dollars Percent Dollars Percent Dollars Percent
Fresno, Calif. —Continued
Building construction —Continued
Journeymen— Continued
Engineers— Power equipment operators:Compressors..................... $9,050 8 $9,050 40.00 1.120 2.000 0.900 0.240Compressors (2 to 6 )......... 10.020 8 10.020 40.00 1.120 - 2.000 - .900 - .240 -Material hoists (1-drum).......................... 9.810 8 9.810 40.00 1.120 _ 2.000 . .900 . .240
Small rubber-tired trenching machines and similar small equipment........................ 10.170 8 10.170 40.00 1.120 2.000 .900 .240
Tractors, dozers, scrapers, sheepsfoot, self-propelled compactors with dozer and push-cats.................. 10.720 8 10.720 40.00 1.120 2.000 .900 .240
Euclids, T-pulls,DW-10, 20, 21 and similar (with earth- moving equipment up to and including 45 cu. yds. struck mrc)........... 10.720 8 10.720 40.00 1.120 2.000 .900 .240
Tractors (with boom)D-6 or larger, and similar)............................. 10.940 8 10.940 40.00 1.120 2.000 .900 .240
Cranes (not over 25 tons, hammerhead and gantry)............................. 11.250 8 11.250 40.00 1.120 2.000 .900 .240
Power shovels, clamshells, draglines, backhoes, gradealls (up to and including 1 yard)............................. 11.250 . 8 11.250 40.00 1.120 2.000 .900 .240
Gradealls (over 1 yard up to and including 7 cu. yds.)........................ 11.420 8 11.420 40.00 1.120 2.000 .900 .240
Universal Liebhern and tower cranes (and similar types)............ 11.420 8 11.420 40.00 1.120 2.000 .900 .240
Firemen, oilers................... 8.700 8 8.700 40.00 1.120 - 2.000 - .900 - .240 -
Glaziers ............................... 9.090 9.700 40.00 .900 - 1.040 - .580 - .320 -Lathers ................................ 10.530 11.430 40.00 .700 - .700 - - - .100 -Mosaic and terrazzo
workers.............................. 8.750 9.200 40.00 1.000 _ .650 _ .900 . _Painters ............................... 9.160 8 9.910 40.00 .610 - .200 - 1.000 - .070 -
Spray............................... 9.210 8 9.960 40.00 .610 - .200 - 1.000 - .070 -Paperhangers....................... 9.210 8 9.960 40.00 .610 - .200 - 1.000 - .070 -Pipefitters............................. 11.600 12.600 36.00 1.440 - 2.000 - 6 .750 - 21 .370 -Plasterers............................. 8.990 9.240 40.00 .900 - 1.500 - 1.110 - .150 -
Plumbers.............................. 11.600 12.600 36.00 1.440 - 2.000 - 6 .750 - 21 .370 -Reinforcing iron workers........ 11.030 11.550 40.00 1.240 - 2.220 - 1.460 - - -Roofers, slate and tile ............ 8.200 10.350 40.00 .600 - .800 - 6 1.000 - - -Sheet-metal workers.............. 10.640 10.890 40.00 .730 - 1.220 - - 10.00 .220 -
Residential........................ 7.950 8.170 40.00 .730 - 1.220 - - 10.00 .220 -Structural-iron workers........... 11.030 11.550 40.00 1.240 - 2.220 1.460 “ -
See footnotes at end of table.
71
Digitized for FRASER http://fraser.stlouisfed.org/ Federal Reserve Bank of St. Louis

Table 20. Wage rates, hours, and employer contributions for selected benefits: Selected cities—Continued
(Union hourly wage rates, July 1, 1976, and wage rates, straight-time weekly hours, and employer insurance, pension, vacation, and other contributions to funds in the building trades, July 1, 1977)
July 1, 1976 July 1, 1977
City and job classification Hoursper
week2
Employer contributions for selected benefits3Rate per
hour1Rate per
hour1 Insurance4 Pension Vacation Other®
Dollars Percent Dollars Percent Dollars Percent Dollars Percent
Fresno, Calif. —Continued
Building construction —Continued
Journeymen— Continued
Ornamental iron workers ................................... $11,030 $11,550 40.00 1.240 2.220 1.460
Fence erectors.................. 10.140 10.660 40.00 1.240 - 2.220 - 1.460 - - -
Tile layers............................. 8.750 9.200 40.00 1.000 - .650 - .900 - - -
Helpers and laborers
Bricklayers’ tenders............... 8.400 8.600 40.00 1.250 1.700 6 1.000Building laborers................... 8.043 8.525 40.00 1.250 - 1.700 - 1.000 - 0.210 -Elevator constructors’
helpers............................... 8.670 9.750 40.00 .545 _ .350 _ _ 6.00 .020 2.31Plasterer’s tenders................ 8.500 9.020 40.00 1.250 - 1.700 - 1.100 - .150 -Terrazzo workers’
helpers.............................. 6.460 7.430 40.00 .800 _ _ 1.000 _ .500 .Base machine operators..... 6.460 7.430 40.00 .800 - - - 1.000 - .500 -
Tile layers’ helpers................. 6.460 7.430 40.00 .800 - - - 1.000 - .500 -
Grand Rapids, Mich.
Building construction
Journeymen
Asbestos workers................. 9.350 9.460 40.00 .840 1.480 1.650Bricklayers............................ 8.300 8.550 40.00 .550 - .250 - .400 - - -
Homebuilders..................... 6.640 6.760 40.00 .550 - .250 - .400 - - -Carpenters........................... 8.550 8.950 40.00 .600 - .600 - 6 .300 - .020 -
Millwrights......................... 10.300 11.050 40.00 .600 - .600 - .300 - - -Cement finishers................... 7.490 7.740 40.00 .500 - .500 - 6.960 - - -Drywall tapers(finishers)............................ 7.450 7.950 40.00 .500 _ .250 _ 6.100 _ _ _
Electricians (inside wirers)............................... 9.120 9.750 40.00 .400 _ .350 3.00 _ .510 _
Elevator constructors............. 9.440 9.900 40.00 .545 - .350 - - 8.00 .020 1.60Engineers— Power equip
ment operators:Cranes with main boom and jib 220’ or more......... 10.215 10.710 40.00 .800 1.000 10.00 .020
Cranes with main boom and jib 140’ or more......... 9.990 10.485 40.00 .800 - 1.000 - _ 10.00 .020 _
Cranes, scrapers, dozers, graders, hoists, front end loaders............................ 9.765 10.260 40.00 .800 - 1.000 - - 10.00 .020 -
See footnotes at end of table.
72
Digitized for FRASER http://fraser.stlouisfed.org/ Federal Reserve Bank of St. Louis

Table 20. Wage rates, hours, and employer contributions for selected benefits: Selected cities—Continued
(Union hourly wage rates, July 1, 1976, and wage rates, straight-tim e weekly hours, and em ployer insurance, pension, vacation, and othercontributions to funds in the building trades, July 1, 1977)
July 1, 1976 July 1, 1977
Rate per hour1
Rate per hour1
Hoursper
week2
Employer contributions for selected benefits3
Insurance4 Pension Vacation Other5
Dollars Percent Dollars Percent Dollars Percent Dollars Percent
$9,360 $9,765 40.00 0.800 1.000 10.00 0.0209.180 9.585 40.00 .800 - 1.000 - - 10.00 .020 -
8.190 8.505 40.00 .800 . 1.000 . 10.00 .0207.560 7.875 40.00 .800 - 1.000 - - 10.00 .020 _
7.950 8.350 40.00 .500 - .300 - - 2.50 - _
8.190 8.200 40.00 .370 - .150 - 6 0.500 - .010 -
7.700 7.850 40.00 .550 - .250 - 6 .400 - - -
7.700 7.850 40.00 .550 _ .250 6 .400 _ _ _7.450 7.950 40.00 .500 - .250 - 6.100 - - -
7.950 8.450 40.00 .500 - .250 - MOO - - -
7.700 8.200 40.00 .500 - .250 - 6 .100 - - -
7.700 8.200 40.00 .500 - .250 - MOO - - -
7.950 8.450 40.00 .500 - .250 - 6.100 - - -
7.700 8.200 40.00 .500 - .250 - MOO - - , -
9.170 10.320 40.00 .600 - .750 - 6 .920 - .200 -
8.830 9.080 40.00 .500 - .500 - 6 1.000 - .050 -
9.170 10.320 40.00 .600 - .750 - 6 .920 - .200 -
9.450 9.700 40.00 .600 - 1.000 - 6 1.000 - .020 -
6.850 7.250 40.00 .450 - .350 - .450 - - -
7.100 7.500 40.00 .450 - .350 - .450 - - -
8.450 9.550 40.00 .670 - .650 - 6 .670 - .020 -
9.450 9.700 40.00 .600 - 1.000 - 6 1.000 - .020 -
8.300 8.550 40.00 .550 - .250 - .400 - - -
7.700 7.850 40.00 .550 .250 .400
6.010 6.410 40.00 .550 .350 6.550 .0406.160 6.560 40.00 .550 - .350 - 6.550 - .040 -
6.010 6.410 40.00 .550 - .350 - 6 .550 - .040 -
6.610 6.930 40.00 .545 _ .350 _ 8.00 .020 1.606.160 6.560 40.00 .550 - .350 - .550 - .040 -
6.760 7.060 40.00 .500 _ .300 6.000 _ _ _7.310 7.610 40.00 .500 - .300 - - - - -
6.960 7.260 40.00 .500 - .300 - - - - -
6.760 7.060 40.00 .500 .300
9.050 9.100 40.00 .600 _ .500 _ 6.650 _ _ _
City and job classification
Grand Rapids, Mich. —Continued
Building construction —Continued
Journeymen— Continued
Air tuggers (single drum), forks, material hoists, winches (nonswinging),bobcats.......................
Pumps 6 in. or over.......Air compressors, welders, pumps under6 in..............................
Oilers, firemen...............Glaziers...........................Lathers............................Marble setters..................Mozaic and terrazzo
workers..........................Painters...........................
Spray and swing stage...Swing stage..................Bridges over highways...Bridges over water........
Paperhangers...................Pipefitters.........................Plasterers.........................Plumbers..........................Reinforcing iron workers....Roofers, composition.........Roofers, slate and tile .......Sheet-metal workers..........Structural-iron workers.......Stonemasons....................Tile layers.........................
Helpers and laborers
Bricklayers’ tenders.........Mortar mixers..............
Building laborers.............Elevator constructors’
helpers.........................Plasterers’ laborers..........Terrazzo workers’
helpers.........................Base machine..............Floor machines............
Tile layers’ helpers...........
Highway and street construction
Journeymen
Carpenters...........................
See footnotes at end of table.
73
Digitized for FRASER http://fraser.stlouisfed.org/ Federal Reserve Bank of St. Louis

Table 20. Wage rates, hours, and employer contributions for selected benefits: Selected cities—-Continued
(Union hourly wage rates, July 1, 1976, and wage rates, straight-time weekly hours, and employer insurance, pension, vacation, and other contributions to funds in the building trades, July 1, 1977)
July 1, 1976 July 1, 1977
City and job classification Hoursper
week2
Employer contributions for selected benefits3Rate per
hour1Rate per
hour1 Insurance4 Pension Vacation Other5
Dollars Percent Dollars Percent Dollars Percent Dollars Percent
Grand Rapids, Mich. —Continued
Highway and street construction —Continued
Journeymen — Continued
Cement finishers................... $10,150 $10,450 40.00 0.500 0.500Engineers— Power equipment operators (zone 2):Class I— Asphalt plants and pavers, cranes, shovels, paver operators (5 bags or more)....... 8.770 9.360 40.00 .800 .850 10.00 0.030
Class II— Backhoe (with 3/8 yd. bucket or less), crushers, sweeper screening plants............................... 8.510 9.100 40.00 .800 .850 10.00 .030
Class III— Air compressors, concrete breakers, tractors with attachments...................... 8.050 8.650 40.00 .800 .850 10.00 .030
Class IV— Oilers, finishing machines, boom or winch hoists.................. 7.800 8.390 40.00 .800 .850 10.00 .030
Structural iron workers........... 9.450 9.700 40.00 .600 - 1.000 - 6 1.000 - .020 -
Helpers and laborers
General laborers................... 7.220 8 7.220 40.00 .400 .300 .550 .040
Other heavy construction
Journeymen
Carpenters ........................... 8.550 9.220 40.00 .600 .600 6.300 .020Engineers-Power equipment operators—Distribution:Class I ............................... 8.150 8.900 40.00 .800 .750 10.00 .010Class ll-A ........................... 8.050 8.810 40.00 .800 - .750 - - 10.00 .010 -Class ll-B ............................ 7.850 8.610 40.00 .800 - ' .750 - - 10.00 .010 -
Class III.............................. 7.510 8.260 40.00 .800 - .750 - - 10.00 .010 -Class IV ............................. 7.050 7.810 40.00 .800 - .750 - - 10.00 .010 -
Cement finishers................... 10.150 10.450 40.00 .500 - .500 - - - - -Engineers— Power equipment operators: Steel
Cranes with main boom and jib 220’ or more......... 12.160 12.940 40.00 .800 1.000 10.00 .040
Cranes with main boom and jib 140’ or more......... 11.920 12.690 40.00 .800 _ 1.000 _ 10.00 .040
Cranes, scrapers, dozers, graders, hoists, front end loaders.............. 11.440 12.210 40.00 .800 - 1.000 - - 10.00 .040 -
See footnotes at end of table.
74
Digitized for FRASER http://fraser.stlouisfed.org/ Federal Reserve Bank of St. Louis

Table 20. Wage rates, hours, and employer contributions for selected benefits: Selected cities—Continued
(Union hourly wage rates, July 1, 1976, and wage rates, straight-time weekly hours, and employer insurance, pension, vacation, and other contributions to funds in the building trades, July 1, 1977)
July 1, 1976 July 1, 1977
City and job classification Hoursper
week2
Employer contributions for selected benefits3Rate per
hour1Rate per
hour1 Insurance4 Pension Vacation Other5
Dollars Percent Dollars Percent Dollars Percent Dollars Percent
Grand Rapids, Mich. — Continued
Other heavy construction — Continued
Journeymen— Continued
Air tuggers (single drum), forks, material hoists, winches (nonswinging), bobcats.... $11,230 $12,000 40.00 0.800 1.000 10.00 0.040
Air compressors, welders, pumps under 6 in..... 9.980 10.520 40.00 .800 _ 1.000 . _ 10.00 .040
Oilers, firemen................... 8.880 9.280 40.00 .800 - 1.000 - - 10.00 .040 _Engineers— Power equipment operators: underground:Class I ............................... 8.510 40.00 .800 .850 10.00 .030Class II.............................. - 8.250 40.00 .800 - .850 - - 10.00 .030 _Class III.............................. - 7.790 40.00 .800 - .850 - - 10.00 .030 _Class IV ............................. - 7.540 40.00 .800 - .850 - - 10.00 .030 -
Structural iron workers........... 9.450 9.700 40.00 .600 - 1.000 -
ooo
- .020 -
Helpers and laborers
General laborers................... 6.010 6.410 40.00 .550 .350 6 .550 .040
Hammond, Ind.
Building construction
Journeymen
Asbestos workers ................. 10.510 11.110 40.00 .810 .990 6 1.000 .050Boilermakers......................... 10.850 11.700 40.00 .800 - 1.000 - - - - -Bricklayers............................ 10.800 11.350 40.00 .750 - .550 - 6 .500 - .060 -Carpenters ........................... 10.910 11.610 40.00 .500 - .570 - 6 .420 - .010 -Cement finishers................... 10.290 10.670 40.00 .900 - .600 - 6 .750 - .010 -Electricians........................... 10.944 11.280 40.00 - 6.50 - 8.30 - 6 4.00 - -Elevator constructors............. 13.277 13.873 40.00 .745 - .350 - - 6.00 - 3.20Engineers— Power equip
ment operators:Class I— Cranes................ 10.100 11.400 40.00 .750 .850 6 .200 .010Class II— Tractors and bulldozers........................ 9.600 10.900 40.00 .750 _ .850 _ 6 .200 _ .010 _
Class III— Air com- pressors.......................... 8.050 9.350 40.00 .750 . .850 _ 6 .200 .010
Class IV— Oilers................ 7.050 8.350 40.00 .750 - .850 - 6 .200 - .010 -
Glaziers............................... 9.550 10.000 40.00 .650 - .300 - .550 - - -Lathers................................ 10.440 11.190 40.00 - - .400 - - - - -Machinists............................ 11.020 11.510 40.00 .660 - .450 - - 6.10 - -Marble setters ...................... 10.800 11.350 40.00 .750 - .550 - 6.500 - .060 -Painters:
Residential and commercial ............................ 9.000 8 9.000 40.00 .490 .350
Industrial........................... 10.800 8 10.800 40.00 .490 - .350 - - - - -
Paperhangers....................... 9.250 8 9.250 40.00 .490 - .350 - - - - -Pipefitters............................. 11.500 11.900 40.00 .800
'1.000
"~
See footnotes at end of table.
75
Digitized for FRASER http://fraser.stlouisfed.org/ Federal Reserve Bank of St. Louis

Table 20. Wage rates, hours, and employer contributions for selected benefits: Selected cities—Continued
(Union hourly wage rates, July 1, 1976, and wage rates, straight-tim e weekly hours, and em ployer insurance, pension, vacation, and othercontributions to funds in the building trades, July 1, 1977)
City and job classification
Hammond, Ind. —Continued
Building construction —Continued
Journeymen— Continued
Plasterers.......................Plumbers........................Reinforcing iron workers ....Roofers, composition.......Roofers, slate and tile ......Sheet-metal workers........Stonemasons..................Stuctural iron workers......Terrazzo workers............Tile layers.......................
Helpers and laborers
Bricklayers’ tenders.........Building laborers ..............Elevator constructors’
helpers.........................Marble setters’ helpers....Plasterers’ laborers..........Plumbers’ laborers...........Terrazzo workers’
helpers.........................Base machine operators
Tile layers’ helpers...........
Highway and street construction
Journeymen
Carpenters.....................Cement finishers............Engineers— Power equip
ment operators:Class I— Cranes..........Class II— Tractors.......Class III— Forklifts,end loaders...............
Class IV— Air compressors and conveyors....
Class V— Oilers...........Structural iron workers....
Helpers and laborers
Laborers
July 1, 1976 July 1, 1977
Rate per hour1
Rate per hour1
Hoursper
week2
Employer contributions for selected benefits3
Insurance4 Pension Vacation Other5
Dollars Percent Dollars Percent Dollars Percent Dollars Percent
$8,940 $9,460 40.00 0.900 0.600 6 0.750 0.01010.420 11.520 40.00 .900 - 1.050 - - - .100 -10.480 10.870 40.00 .800 - 1.360 - 6 1.250 - .020 _11.160 11.510 40.00 .700 - .500 - 6.700 - .080 _11.160 11.510 40.00 .700 - .500 - 8 .700 - .080 _10.510 10.900 40.00 .750 - 1.160 - - - .680 _10.800 11.350 40.00 .750 - .550 - 6.500 - .060 -10.480 10.870 40.00 .800 - 1.360 - 6 1.250 - .020 _10.800 11.350 40.00 .750 - .550 - 6 .500 - .060 _10.700 11.250 40.00 .750 .550 8.500 .060
7.700 8.250 40.00 .600 .500 .1207.700 8.250 40.00 .600 - .500 - - - .120 -
9.372 9.788 40.00 .745 - .350 _ 6.00 _ 3.209.360 9.960 40.00 - - - - - - - 1.908.000 8.550 40.00 .600 - .500 - - - .120 -7.700 8.250 40.00 .600 - .500 - - - .120 -
9.360 9.960 40.00 _ _ _ _ _ 1.909.610 10.210 40.00 - - - - - - - 1.909.360 9.960 40.00 1.90
10.910 11.610 40.00 .500 .570 6 .420 .0109.600 9.880 40.00 .900 “ .600 - 8.750 - .040 -
9.950 10.650 40.00 .650 .850 8.4009.500 10.200 40.00 .650 - .850 - 6.400 - - -
9.050 9.750 40.00 .650 - .850 - 8.400 - - -
7.950 8.650 40.00 .650 - .850 _ 6 .400 _ _ _7.000 7.700 40.00 .650 - .850 - 6.400 - _ _
. 10.480 10.870 40.00 .800 1.360 8 1.250 .020'
7.300 7.850 40.00 .600 - .450 - - - .120 -
See footnotes at end of table.
76
Digitized for FRASER http://fraser.stlouisfed.org/ Federal Reserve Bank of St. Louis

(Union hourly wage rates, July 1, 1976, and wage rates, straight-time weekly hours, and employer insurance, pension, vacation, and other contributions to funds in the building trades, July 1, 1977)
Table 20. Wage rates, hours, and employer contributions for selected benefits: Selected cities—Continued
July 1, 1976 July 1, 1977
City and job classification Hoursper
week2
Employer contributions for selected benefits3Rate per
hour1Rate per
hour1 Insurance4 Pension Vacation Other5
Dollars Percent Dollars Percent Dollars Percent Dollars Percent
Hammond, Ind. — Continued
Other heavy construction
Journeymen
Carpenters........................... $10,910 $11,610 40.00 0.500 0.570 ' 0.420 0.010Cement finishers................... 9.600 9.880 40.00 .900 - .600 - ‘ .750 - .040 -
Engineers— Power equipment operators:Class I— Cranes................ 9.950 10.650 40.00 .650 .850 '.400Class II— Tractors.............. 9.500 10.200 40.00 .650 - .850 - • .400 - - -Class III— Forklift trucks, end loaders........... 9.050 9.750 40.00 .650 .850 _ 6 .400 . _
Class IV— Air compressors and conveyors........... 7.950 8.650 40.00 .650 _ .850 '.400 . . .
Class V— Oilers .................. 7.000 7.700 40.00 .650 - .850 - '.400 - - -
Structural iron workers........... 10.480 10.870 40.00 .800 - 1.360 - ' 1.250 - .020 -
Helpers and laborers
Laborers............................... 7.300 7.850 40.00 .600 .450 .120
Honolulu, Hawaii
Building construction
Journeymen
Asbestos workers................. 8.530 10.040 40.00 .650 2.000 .700 .060Boilermakers......................... 9.150 9.730 40.00 .650 - 1.000 - - - - -
Bricklayers............................ 8.410 9.900 40.00 1.100 ■ - 1.450 - .600 - .090 -Carpenters........................... 8.240 9.650 40.00 .940 - 1.700 - 1.000 - .020 -Cement finishers................... 8.100 9.330 40.00 1.100 - 1.450 - .600 - .070 -Electricians (inside
wirers)............................... 9.000 10.040 40.00 .670 . 1.740 13.00 11.20 .290 4.00Elevator constructors............. 10.680 8 10.680 40.00 .495 - .320 - - 6.00 .308 -Engineers— Power equip
ment operators:Locomotives (up to 30 tons)............................... 6.930 7.930 40.00 .900 2.000 .750 .170
Boom trucks..................... 7.200 8.200 40.00 .900 - 2.000 - .750 - .170 -Agri-cats........................... 7.510 8.510 40.00 .900 - 2.000 - .750 - .170 -Trenchers.......................... 8.160 9.160 40.00 .900 - 2.000 - .750 - .170 -Mixermobiles..................... 8.480 9.480 40.00 .900 - 2.000 - .750 - .170 -Locomotives (to 100 tons)............................... 8.590 9.590 40.00 .900 _ 2.000 _ .750 .170 .
Wheel trenchers................ 8.700 9.700 40.00 .900 - 2.000 - .750 - .170 -Bulldozers......................... 8.930 9.930 40.00 .900 - 2.000 - .750 - .170 -Locomotives (over 100 tons)............................... 8.990 9.990 40.00 .900 _ 2.000 .750 _ .170 _
Cranes (under 25 tons)....... 9.140 10.140 40.00 .900 - 2.000 - .750 - .170 -Cranes (over 25 tons)........ 9.290 10.290 40.00 .900 - 2.000 - .750 - .170 -Derricks................. .......... 9.650 10.650 40.00 .900 - 2.000 - .750 - .170 -
Glaziers............................... 8.920 9.640 40.00 1.010 - .850 - .970 - .463 -
Lathers................................ 9.860 10.090 40.00 .850 - 1.250 - 1.000 - .120 -Machinist-mechanic............... 7.820 8.950 40.00 - ~ .700 ~ ~ - “ -
See footnotes at end of table.
77
Digitized for FRASER http://fraser.stlouisfed.org/ Federal Reserve Bank of St. Louis

Table 20. Wage rates, hours, and employer contributions for selected benefits: Selected cities—Continued
(Union hourly wage rates, July 1, 1976, and wage rates, straight-time weekly hours, and employer insurance, pension, vacation, and othercontributions to funds in the building trades, July 1, 1977)
July 1,
City and job classification
1976
Rate per Rate per hour1 hour1
Hoursper
week2Insurance4
July 1, 1977
Employer contributions for selected benefits3
Pension Vacation Other5
Dollars Percent Dollars Percent Dollars Percent Dollars Percent
Honolulu, Hawaii — Continued
Building construction — Continued
Journeymen— Continued
Marble setters ............Mosaic and terrazzo
workers...................Painters .....................
Spray.....................Paperhangers .............Pipefitters...................Plasterers...................Plumbers....................Reinforcing iron workersRoofers, composition...Roofers, slate and tile ...Sheet-metal workers....Stonemasons..............Structural-iron workers ..Tapers, drywall...........
Drywall applicators...Tile layers...................
Carpet, linoleum and soft tile layers ........
$8,400
8.4008.370 8.8458.3709.300 8.9509.3009.1508.1488.148 9.200 8.4109.150 9.263 8.2408.400
8.310
$9,870
9.8709.0009.5009.0009.800 9.7409.800
10.1509.8009.800
10.8309.900
10.1509.500 9.7509.870
10.290
40.00
40.0040.0040.0040.0040.0040.0040.0040.0040.0040.0040.0040.0040.0040.0040.0040.00
40.00
1.100
1.100.790.790.790
1.090 1.1001.090 .850 .850 .850 .760
1.100.850.840.940
1.100
.600
1.450
1.4503.0003.0003.0001.700 1.7501.7001.270 .750 .750
1.7201.4501.270 2.5001.7001.450
.500
0.600 0.090
.600
.750
.750
.750
.675
.600
.675
.950
.250
.250
.880
.600
.950
1.000.600
.090
.100
.100
.100
.775
.120
.775
.110
.350
.350
.780
.090
.1101.500.180.090
.150 .020
Helpers and laborers
Building laborers .......Building laborers I ......Building laborers I I .....Composition roofers’
helpers...................Elevator constructors’helpers....................
Marble setters’ helpersPlasterers’ laborers....Terrazzo workers’
helpers...................Tile layers’ helpers.....
6.660 7.6108.0607.860
40.0040.0040.00
.640
.640
.640
6.063 8 6.500 40.00 .850
7.4806.3406.710
7.4807.1707.660
40.0040.0040.00
.4951.100.640
6.3406.340
7.1707.170
40.0040.00
1.1001.100
1.0601.0601.060
.750
.3201.450 1.060
1.4501.450
.380
.380
.380
.150
.150
.150
.250 .350
.600
.380
6.00 .308.090.150
.600
.600.090.090
Houston, Texas
Building construction
Journeymen
Asbestos workersBoilermakers......Bricklayers.........Carpenters........
Millwrights......Piledrivers ......
Cement finishers . Drywall tapers (finishers).........
10.0009.000
10.1309.400 9.7609.400 9.120
10.00010.00010.53010.00010.36010.0009.680
40.0040.0040.0040.0040.0040.0040.00
.700
.500
.630
.750
.750
.750
.520
.7001.000.600.700.700.700.550
.500 .060
9.420 9.920 40.00 .565 .450 .400
See footnotes at end of table.
78
Digitized for FRASER http://fraser.stlouisfed.org/ Federal Reserve Bank of St. Louis

(Union hourly wage rates, July 1, 1976, and wage rates, straight-time weekly hours, and employer insurance, pension, vacation, and other contributions to funds in the building trades, July 1, 1977)
Table 20. Wage rates, hours, and employer contributions for selected benefits: Selected cities—Continued
July 1, 1976 July 1, 1977
City and job classification Hoursper
week2
Employer contributions for selected benefits3Rate per
hour1Rate per
hour1 Insurance4 Pension Vacation Other5
Dollars Percent Dollars Percent Dollars Percent Dollars Percent
Houston, Texas — Continued
Building construction — Continued
Journeymen— Continued
Electricians (inside wirers)................................ $10,387 $10,387 40.00 0.550 5.00 6 6.00 1.00
Elevator constructors............. 8.600 9.760 40.00 .545 - 0.350 - - 6.00 0.020 2.30Engineers— Power equip
ment operators:Heavy equipment— Cat tractors, scrapers (heavy type, over 3 cu. yds.), bulldozers, cranes, derricks, draglines, hoists (2 or more drums), mixers (14 cu. ft. or more), piledrivers, shovels............ 9.870 10.370 40.00 .450 .850
Light equipment— Air compressors, mixers (less than 14 cu. ft.), scrapers (3 cu. yds. or less), pumps, single-drum hoists............ 8.380 8.780 40.00 .450 .850
Glaziers............................... 8.920 9.920 40.00 .600 - .425 - 6 0.150 - - -Lathers................................ 9.020 10.020 40.00 .500 - .350 - 6.500 - .080 -Machinists............................ 10.100 10.100 40.00 - - - - - - -Marble setters ...................... 9.260 10.210 40.00 - - - - .250 - .150 -Mosaic and terrazzo
workers.............................. 9.260 10.210 40.00 _ _ _ _ .250 .150 _Painters:
Commercial brush work...... 9.295 9.795 40.00 .565 _ .450 . .400 . . .Commercial spray work....... 9.670 10.170 40.00 .565 - .450 - .400 - - -Industrial brush work.......... 9.395 9.895 40.00 .565 - .450 - .400 - - -
Industrial spray work.......... 9.720 10.220 40.00 .565 - .450 - .400 - - -All painting over 60 fee t................................. 9.920 10.420 40.00 .565 _ .450 .400
Paperhangers....................... 9.545 10.045 40.00 .565 - .450 - .400 - - -Pipefitters............................. 9.100 10.050 40.00 .450 - .650 - 6 .800 - - -Plasterers............................. 9.175 9.975 40.00 .770 - .300 - 6 .525 - .080 -Plumbers.............................. 9.290 9.840 40.00 .550 - .700 - .750 - .165 -
Reinforcing iron workers........ 9.630 10.280 40.00 .550 - 1.000 - - - - -Roofers, flat roof and
composition........................ 8.140 8.890 40.00 .200 _ .250 _ .250 _ .100 _Roofers, slate and tile ............ 9.040 9.640 40.00 .200 - .250 - .250 - .100 -Sheet-metal workers.............. 9.465 10.220 40.00 .275 - .595 - .320 - .080 -Stonemasons........................ 10.130 10.530 40.00 .630 - .600 - - - .160 -Structural-iron workers........... 9.630 10.280 40.00 .550 - 1.000 - - - - -
Sheeters and buckers- up.................................... 9.630 10.280 40.00 .550 _ 1.000 _ _ _ _ .
Tile layers............................. 9.260 10.210 40.00 - - - - .250 - .150 -
Helpers and laborers
Bricklayers’ tenders............... 7.105 7.755 40.00 .330 .400Mortar mixers.................... 7.205 7.855 40.00 .330 - .400 - - - - -
Building laborers................... 6.930 7.580 40.00 .330 - .400 ~
See footnotes at end of table.
79
Digitized for FRASER http://fraser.stlouisfed.org/ Federal Reserve Bank of St. Louis

Table 20. Wage rates, hours, and employer contributions for selected benefits: Selected cities—Continued
(Union hourly wage rates, July 1, 1976, and wage rates, straight-time weekly hours, and employer insurance, pension, vacation, and othercontributions to funds in the building trades, July 1, 1977)
City and job classification
Houston, Texas —Continued
Building construction —Continued
Helpers and laborers — Continued
Air tool operators............Elevator constructors’
helpers............................Marble setters’ helpers.......Plasterers’ laborers.............Terrazzo workers’
helpers............................Base machines................Floor machines ...............
Tile layers’ helpers..............
Other heavy construction
Journeymen
Engineers— Power equipment operators:Heavy pipeline:Group I— Heavy.......Group II— Light.........Group III— Oilers......
Huntsville, Ala.
Building construction
Journeymen
Asbestos workers.........Boilermakers................Bricklayers....................Carpenters...................
Millwrights................Cement finishers...........Electricians (inside-
wirers).......................Elevator constructors.....Engineers— Power equip
ment operators:Group A— Bulldozers, cranes, derricks, draglines, hoists, shovels, scrapers, trenching machines ....
July 1, 1976 July 1, 1977
Rate per hour1
Rate per hour1
Hoursper
week2
Employer contributions for selected benefits3
Insurance4 Pension Vacation Other5
Dollars Percent Dollars Percent Dollars Percent Dollars Percent
$7,105 $7,755 40.00 0.330 0.400
6.020 6.832 40.00 .545 _ .350 _ _ 6.00 0.020 2.306.900 7.650 40.00 - - - - 0.250 - .150 -
7.205 7.855 40.00 .330 - .400 - - - - -
6.900 7.650 40.00 _ _ _ .250 .1507.200 7.950 40.00 - - - - .250 - .150 -
7.050 7.800 40.00 - - - - .250 - .150 -
6.900 7.650 40.00 .250 .150
9.330 10.170 40.00 .600 .6007.040 7.760 40.00 .600 - .600 - - - - -
4.750 5.360 40.00 .600 .600
8.910 9.560 40.00 .450 .400 6.600 .0508.800 9.300 40.00 .950 - 1.000 - - - - _
9.400 9.400 40.00 - - - - - - - _
7.860 8.400 40.00 - - - - - - - _
8.270 8.900 40.00 - - - - - - - -
8.650 8.650 40.00 - - - - - - - -
9.050 10.050 40.00 .400 _ .300 3.00 _ _ _ _9.140 9.740 40.00 .545 .350 6.00 .020 2.30
8.780 9.380 40.00 .350 - .350 - - - - -
See footnotes at end of table.
80
Digitized for FRASER http://fraser.stlouisfed.org/ Federal Reserve Bank of St. Louis

Table 20. Wage rates, hours, and employer contributions for selected benefits: Selected cities—Continued
(Union hourly wage rates, July 1, 1976, and wage rates, straight-time weekly hours, and employer insurance, pension, vacation, and other contributions to funds in the building trades, July 1, 1977)
July 1, 1976 July 1, 1977
City and job classification Hoursper
week2
Employer contributions for selected benefits3Rate per
hour1Rate per
hour1 Insurance4 Pension Vacation Other5
Dollars Percent Dollars Percent Dollars Percent Dollars Percent
Huntsville, Ala. — Continued
Building construction — Continued
Journeymen— Continued
Group B— Central compressors, front end loaders, paving machines, portable hoists, walk-behind trenching machines, yard masters.................... $7,440 $8,040 40.00 0.350 0.350
Group C— Portable air compressors, conveyors, pumps, welding machines, oilers................ 6.730 7.340 40.00 .350 .350
Marble setters ...................... 9.400 9.400 40.00 - - - - - - - -Mosaic and terrazzo work
ers .................................... 9.150 9.150 40.00 _ . _ . . .Painters............................... 7.500 8.000 40.00 - - .250 - - - - -
Residential........................ 5.250 5.350 40.00 - - .250 - - - - -Industrial........................... 8.250 8.750 40.00 - - .250 - - - - -
Pipefitters............................. 9.450 9.700 40.00 .500 - .500 - 6 0.250 - - -Plasterers............................. 8.900 8.900 40.00 - - - - - - - -Plumbers.............................. 9.450 9.700 40.00 .500 - .500 - 6 .250 - - -
Reinforcing iron workers........ 8.405 8.855 40.00 .500 - .500 - - - - -Roofers, composition............. 7.500 8.350 40.00 - - .200 - - - - -Roofers, slate and tile ........... 7.750 8.600 40.00 - - .200 - - - - -Sheet-metal workers.............. 9.750 10.150 40.00 .690 - .820 - - - 0.030 -Stonemasons........................ 9.400 9.400 40.00 - - - - - - - -Structural-iron workers........... 8.405 8.855 40.00 .500 - .500 - - - - -Tile layers............................. 9.150 9.150 40.00 - - - - - - - -
Helpers and laborers
Bricklayers’ tenders............... 4.520 4.870 40.00 .250 .400Building laborers ................... 4.520 4.870 40.00 .250 - .400 - - - - -Elevator constructors’
helpers.............................. 6.400 6.820 40.00 .545 _ .350 _ _ 6.00 .020 2.30Marble setters’ helpers .......... 4.520 4.870 40.00 .250 - .400 - - - - -Plasterers’ laborers................ 4.520 4.870 40.00 .250 - .400 - - - - -Plumbers’ laborers................ 4.520 4.870 40.00 .250 - .400 - - - - -Terrazzo workers’
laborers.............................. 4.520 4.870 40.00 .250 _ .400 _ _ _ _
Tile layers’ helpers................ 4.520 4.870 40.00 .250 - .400 - - - - -
Indianapolis, Ind.
Building construction
Journeymen
Asbestos workers................. 10.430 11.000 40.00 .500 .550 6 1.000Boilermakers......................... 10.850 11.700 40.00 .800 - 1.000 - - - - -
Bricklayers............................ 10.100 10.640 40.00 .400 — .350 — 6 .500 “ .020
See footnotes at end of table.
81
Digitized for FRASER http://fraser.stlouisfed.org/ Federal Reserve Bank of St. Louis

Table 20. Wage rates, hours, and employer contributions for selected benefits: Selected cities—Continued
(Union hourly wage rates, July 1, 1976, and wage rates, straight-time weekly hours, and employer insurance, pension, vacation, and othercontributions to funds in the building trades, July 1, 1977)
City and job classification
July 1, 1976 July 1, 1977
Employer contributions for selected benefits3Rate per
hour1Rate per
hour1noursper
week2Insurance4 Pension Vacation Other5
Dollars Percent Dollars Percent Dollars Percent Dollars Percent
Indianapolis, Ind. — Continued
Building construction — Continued
Journeymen— Continued
Pointers, cleaners and caulkers .......................... $10,040 $10,640 40.00 0.400 0.350 6 0.500 0.020
Carpenters........................... 10.150 10.950 40.00 .700 - .600 - 6.500 - .100 -Millwrights......................... 10.150 10.950 40.00 .700 - .600 - 6.500 - .100 -Piledrivers......................... 10.150 10.950 40.00 .700 - .600 - 6.500 - .100 -
Cement finishers................... 8.560 8.560 40.00 .650 - .750 - 6 1.000 - .030 -Drywall tapers(finishers)............................ 8.910 9.580 40.00 .470 _ .200 6.400 _ _ _
Electricians (inside wirers)............................... 9.613 10.925 40.00 _ 4.00 _ 7.00 _ 6 5.00 . .
Elevator constructors............. 10.680 11.285 40.00 .745 - .350 - - 4.00 .020 1.60Engineers— Power equip
ment operators:Heavy equipment:Cranes ............................. 10.550 11.000 40.00 .400 .550Hoists.............................. 10.550 11.000 40.00 .400 - .550 - - - - -Derrick-bull wheel............. 10.550 11.000 40.00 .400 - .550 - - - - -
Medium equipment:Concrete mixers(21 cu. ft.)........................ 9.700 10.150 40.00 .400 .550Concrete pumps............... 10.550 11.000 40.00 .400 - .550 - - - - -Tractor shovels................ 10.550 11.000 40.00 .400 - .550 - - - - -Light equipment:Welding machines............ 7.550 7.900 40.00 .400 . .550 _ _ _Air compressors................ 7.550 7.900 40.00 .400 - .550 - - - - -Pumps (water).................. 7.550 7.900 40.00 .400 - .550 - - - - -
Glaziers ............................... 11.590 12.390 40.00 - - - - - - - -Lathers................................ 9.790 10.380 40.00 .610 - .450 - 6 .500 - .070 -Marble setters ...................... 9.460 10.310 40.00 .400 - .350 - 6 .500 - - -Mosaic and terrazzo work
ers .................................... 9.150 8 9.150 40.00 .400 . .300 _ 6 .500Painters ............................... 8.910 9.580 40.00 .470 - .200 - 6 .400 - - -
Spray............................... 9.910 10.580 40.00 .470 - .200 - 6 .400 - - -Handroller......................... 8.910 9.580 40.00 .470 - .200 - 6 .400 - - -Sandblasting..................... 9.910 10.580 40.00 .470 - .200 - 6 .400 - - -
Paperhangers ....................... 8.910 9.580 40.00 .470 - .200 - 6 .400 - - -
Pipefitters............................. 9.800 10.400 40.00 .500 - .750 - 6 1.000 - .060 -Plasterers............................. 9.500 9.900 40.00 .800 - - - 6 1.000 - .070 -
Plumbers.............................. 9.800 10.400 40.00 .500 - .750 - 6 1.000 - .060 -Reinforcing iron workers........ 10.500 11.000 40.00 .900 - 1.350 - - - .050 -Roofers, composition............. 10.230 10.780 40.00 .500 - .500 - - - 1.000 -Roofers, slate and tile ............ 10.480 11.030 40.00 .500 - .500 - - - 1.000 -Sheet-metal workers.............. 10.800 11.650 40.00 .600 - .600 - - - .140 -Stonemasons........................ 10.100 10.640 40.00 .400 - .350 - 6 .500 - .020 -Structural-iron-workers
(erectors)........................... 10.500 11.000 40.00 .900 _ 1.350 _ _ _ .050Finishers........................... 10.500 11.000 40.00 .900 - 1.350 - - - .050 -Machine movers and riggers............................. 10.500 11.000 40.00 .900 1.350 _ _ _ .050
Sheeters........................... 10.500 11.000 40.00 .900 - 1.350 - - - .050 -Tile layers............................. 9.460 10.310 40.00 .400 - .350 6 .500 - -
See footnotes at end of table.
8 2
Digitized for FRASER http://fraser.stlouisfed.org/ Federal Reserve Bank of St. Louis

(Union hourly wage rates, July 1, 1976, and wage rates, straight-time weekly hours, and employer insurance, pension, vacation, and other contributions to funds in the building trades, July 1, 1977)
Table 20. Wage rates, hours, and employer contributions for selected benefits: Selected cities—Continued
July 1, 1976 July 1, 1977
City and job classification Hoursper
week2
Employer contributions for selected benefits3Rate per
hour1Rate per
hour1 Insurance4 Pension Vacation Other5
Dollars Percent Dollars Percent Dollars Percent Dollars Percent
Indianapolis, Ind. —Continued
Building construction —Continued
Helpers and laborers
Bricklayers’ tenders............... $7,250 $7,800 40.00 0.600 0.450 0.120Building laborers................... 6.950 7.500 40.00 .600 - .450 - - - .120 -
Composition roofers' helpers.............................. 8.730 9.280 40.00 .500 _ .500 _ . _ 1.000 .
Elevator constructors’ helpers.............................. 7.480 7.900 40.00 .745 _ .350 _ _ 4.00 .020 1.60
Marble setters’ helpers.......... 8.550 8.900 40.00 - - - - - - - -Plasterers’ laborers................ 7.250 7.800 40.00 .600 - .450 - - - .120 -Terazzo workers’ helpers............................... 8.600 8.950 40.00 _ _ _ _ _ _Base machine helpers......... 8.900 9.300 40.00 - - - - - - - -Floor machine and edging.............................. 8.600 8.950 40.00 _ _ _ _ _ _ _ _
Tile layers’ helpers................ 8.550 8.900 40.00 - - - - - - - -
Highway and street construction
Journeymen
Carpenters........................... 9.850 10.450 40.00 .600 .500 .020Cement finishers................... 8.560 8.560 40.00 .650 - .750 - 6 1.000 - .030 -Engineers— Power equip
ment operators:Heavy equipment:Cranes, scoops (keystone), auto patrol............ 9.700 10.300 40.00 .400 .400 6 .000
Medium equipment:Trench machines (under 24 in.)....................... 8.700 9.200 40.00 .400 .400 6 .000
Bulldozers........................ 9.700 10.300 40.00 .400 - .400 - 6.000 - - -Light equipment:Tractors........................... 8.270 8.770 40.00 .400 _ .400 _ 6 .000 _ _ _Compressors, pumps........ 7.460 7.960 40.00 .400 - .400 - 6.000 - - -
Structural iron workers........... 10.500 11.000 40.00 .900 - 1.350 - 6 .000 - .050 -
Helpers and laborers
Construction laborers............ 6.700 7.150 40.00 .600 .450 6 .000 .030
Other heavy construction
Journeymen
Carpenters........................... 9.850 10.450 40.00 .600 .500 6 .000 .020Cement finishers................... 8.560 8.560 40.00 .650 - .750 - 6 1.000 - .030 -Engineers— Power equipment operators— Utility:
Group I: Cranes, scoops, auto patrols .......... 10.350 10.800 40.00 .400 - .400 - - - - -
See footnotes at end of table.
83Digitized for FRASER http://fraser.stlouisfed.org/ Federal Reserve Bank of St. Louis
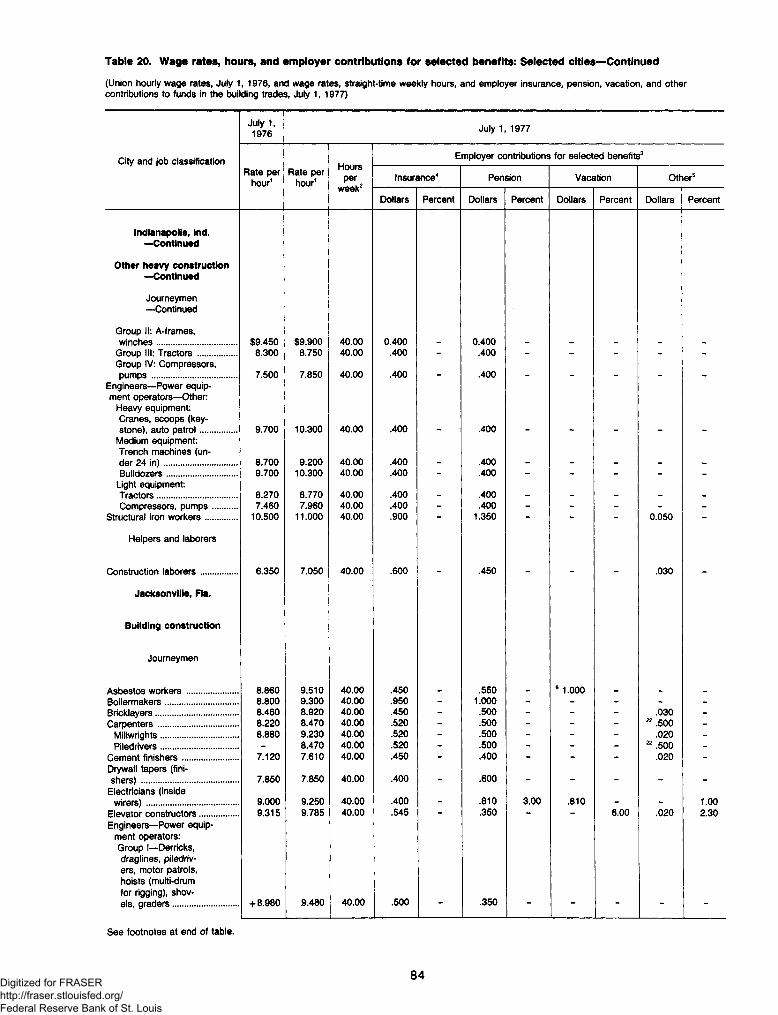
Table 20. Wage rates, hours, and employer contributions for selected benefits: Selected cities—Continued
(Union hourly wage rates, July 1, 1976, and wage rates, straight-time weekly hours, and employer insurance, pension, vacation, and other contributions to funds in the building trades, July 1, 1977)
July 1, 1976 July 1, 1977
City and job classification Hoursper
week2
Employer contributions for selected benefits3
Rate per hour1
Rate per hour1 Insurance4 Pension Vacation Other5
Dollars Percent Dollars Percent Dollars Percent Dollars Percent
Indianapolis, Ind. —Continued
Other heavy construction —Continued
Journeymen— Continued
Group II: A-frames, winches........................... $9,450 $9,900 40.00 0.400 0.400
Group III: Tractors............. 8.300 8.750 40.00 .400 - .400 - - - - -
Group IV: Compressors, pumps............................. 7.500 7.850 40.00 .400 _ .400 . .
Engineers— Power equipment operators— Other:
Heavy equipment:Cranes, scoops (keystone), auto patrol............ 9.700 10.300 40.00 .400 .400
Medium equipment:Trench machines (under 24 in )......................... 8.700 9.200 40.00 .400 .400Bulldozers........................ 9.700 10.300 40.00 .400 - .400 - - - - -
Light equipment:Tractors........................... 8.270 8.770 40.00 .400 . .400 . .Compressors, pumps........ 7.460 7.960 40.00 .400 - .400 - - - - -
Structural iron workers........... 10.500 11.000 40.00 .900 - 1.350 - - - 0.050 -
Helpers and laborers
Construction laborers............ 6.350 7.050 40.00 .600 .450 .030
Jacksonville, Fla.
Building construction
Journeymen
Asbestos workers ................. 8.860 9.510 40.00 .450 .550 6 1.000Boilermakers......................... 8.800 9.300 40.00 .950 - 1.000 - - - - -
Bricklayers............................ 8.460 8.920 40.00 .450 - .500 - - - .030 -
Carpenters........................... 8.220 8.470 40.00 .520 - .500 - - - 22 .500 -Millwrights.......................... 8.880 9.230 40.00 .520 - .500 - - - .020 -Piledrivers.......................... - 8.470 40.00 .520 - .500 - - - 22.500 -
Cement finishers................... 7.120 7.610 40.00 .450 - .400 - - - .020 -
Drywall tapers (finishers) ................................. 7.850 7.850 40.00 .400 _ .600 * _ _
Electricians (inside wirers)............................... 9.000 9.250 40.00 .400 _ .810 3.00 .810 . . 1.00
Elevator constructors............. 9.315 9.785 40.00 .545 - .350 - - 6.00 .020 2.30Engineers— Power equip
ment operators:Group I— Derricks, drag lines, p i l e d r i v
e r s , motor patrols, hoists (multi-drum for rigging), shovels, graders...................... +8.980 9.480 40.00 .500 .350
See footnotes at end of table.
84Digitized for FRASER http://fraser.stlouisfed.org/ Federal Reserve Bank of St. Louis

Table 20. Wage rates, hours, and employer contributions for selected benefits: Selected cities—Continued
(Union hourly wage rates, July 1, 1976, and wage rates, straight-time weekly hours, and employer insurance, pension, vacation, and other contributions to funds in the building trades, July 1, 1977)
July 1, 1976 July 1, 1977
City and job classification Hoursper
week2
Employer contributions for selected benefits3Rate per
hour1Rate per
hour1 Insurance4 Pension Vacation Other5
Dollars Percent Dollars Percent Dollars Percent Dollars Percent
Jacksonville, Fla. — Continued
Building construction— Continued
Journeymen— Continued
Group II— Bulldozers, scrapers, hoists(other than rigging)............
Group III— Tractors,$7,860 $8,300 40.00 0.500 “ 0.350 ~ - -
air compressors (2 ormore)............................... 6.920 7.320 40.00 .500 - .350 - - - - -
Group IV— Air compressors (1), pumps, rol-lers.................................. 5.870 6.210 40.00 .500 - .350 • - - - - -
Glaziers............................... 8.000 8.000 40.00 - - .200 - - - - -Lathers................................ 7.330 7.850 40.00 .250 - .100 - - - - -Marble setters...................... 7.290 7.290 40.00 .400 - .500 - - - 0.010 -Mosaic and terrazzo
workers.............................. 7.290 7.290 40.00 .400 - .500 - - - .010 -Painters:
Brush............................... 7.650 7.900 40.00 .400 - .600 - - - - -
Spray, steel....................... 8.170 8.420 40.00 .400 - .600 - - - - -Roller................................ 8.060 8.310 40.00 .400 - .600 - - - - -
Paperhangers....................... 8.050 8.300 40.00 .400 - .600 - - - - -Furnish own tools.............. 8.570 8.820 40.00 .400 - .600 - - - - -
Pipefitters............................. 9.350 9.950 40.00 .500 - .500 - 6 0.750 - .050 -Air conditioning andrefrigeration fitters............ 9.350 9.950 40.00 .500 - .500 - 6.750 - .050 -
Plasterers............................. 7.660 7.330 40.00 .400 - .300 - - - - -Plumbers.............................. 9.350 9.950 40.00 .500 - .500 - 6.750 - • .050 -Reinforcing iron workers........ 8.550 8.550 40.00 .650 - .850 - - - .050 -
Roofers, composition............. 8.280 8.710 40.00 .500 - .250 - - - .025 -
Kettlemen.......................... 6.210 6.530 40.00 .500 - .250 - - - .025 -Sheet-metal workers.............. +8.580 8.580 40.00 .800 - .440 - 6.500 - .055 3.00Stonemasons........................ 8.460 8.920 40.00 .450 - .500 - - - .030 -Structural and ornamental
iron workers....................... 8.550 8.550 40.00 .650 - .850 - - - .050 -Tile layers.............................
Helpers and laborers
7.290 7.290 40.00 .400 .500 .010
Building laborers................... 5.100 5.320 40.00 .200 _ .200 _ _ _ _ _Composition roofers’
helpers............................... 4.550 4.790 40.00 .500 - .250 - - - .025 -Elevator constructors’
helpers............................... 6.520 6.850 40.00 .545 - .350 - - 6.00 .020 2.30Marble setters’ helpers.......... 4.930 4.930 40.00 - - - - - - - -Terrazzo workers’helpers............................... 4.930 4.930 40.00 - - - - - - - -
Grinders............................. 5.300 5.300 40.00 - - - - - - - -
Tile layers’ helpers................. 4.930 4.930 40.00 - - - - - - -
Highway and streetconstruction
Journeymen
Carpenters and pile-drivers............................... 6.000 6.000 40.00 .240
'.200
■ "2.00 ~ —
See footnotes at end of table.
85Digitized for FRASER http://fraser.stlouisfed.org/ Federal Reserve Bank of St. Louis

Table 20. Wage rates, hours, and employer contributions for selected benefits: Selected cities—Continued
(Union hourly wage rates, July 1, 1976, and wage rates, straight-time weekly hours, and employer insurance, pension, vacation, and other contributions to funds in the building trades, July 1, 1977)
July 1, 1976 July 1, 1977
City and job classification Hoursper
week2
Employer contributions for selected benefits3Rate per
hour1Rate per
hour1 Insurance4 Pension Vacation Other5
Dollars Percent Dollars Percent Dollars Percent Dollars Percent
Jacksonville, Fla. — Continued
Highway and street construction — Continued
Helpers and laborers
Building laborers ................... $3,150 $3,350 40.00 2.00 2.30Finishers, asphalt.................. 3.300 3.500 40.00 - - - - - 2.00 - 2.30Pipe layers........................... 3.560 3.760 40.00 - - - - - 2.00 - 2.30Rakers, asphalt..................... 3.250 3.450 40.00 - - - - - 2.00 - 2.30Screed operators, ashpalt...... 3.410 3.610 40.00 - - - - - 2.00 - 2.30Truckdrivers, labor crew......... +3.150 3.350 40.00 - - - - - 2.00 - 2.30
Other heavy construction
Journeymen
Carpenters and piledriv- ers.................................... 8.220 8.470 40.00 0.520 0.500 0.500
Building laborers ................... 3.150 3.350 40.00 - - - - - 2.00 - 2.30Finishers, asphalt.................. 3.300 3.500 40.00 - - - - - 2.00 - 2.30Pipe layers........................... 3.560 3.760 40.00 - - - - - 2.00 - 2.30Rakers, asphalt.................... 3.250 3.450 40.00 - - - - - 2.00 - 2.30Screed operators, asphalt...... 3.410 3.610 40.00 - - - - - 2.00 - 2.30Truckdrivers, labor crew......... 3.150 3.350 40.00 - - - - - 2.00 - 2.30
Kansas City, Mo.
Building construction
Journeymen
Asbestos workers ................. 9.648 10.368 40.00 .500 .800 6 10.00 .050Boilermakers......................... 9.450 10.300 40.00 .850 - 1.000 - - - - _Bricklayers............................ 9.725 9.725 40.00 .550 - .350 - 1.000 - - -Carpenters ........................... 9.800 10.600 40.00 .500 - .300 - .400 - .050 -
Millwrights.......................... 9.800 10.600 40.00 .500 - .300 - .400 - .050 -Piledrivers, wharf and bridge............................... 9.800 10.600 40.00 .500 _ .300 _ .400 .050 .
Cement finishers................... 9.475 10.025 40.00 .400 - .500 - .500 - - -Composition....................... 9.725 10.275 40.00 .400 - .500 - .500 - - -
Electricians (inside wirers)................................. 10.620 11.220 40.00 .390 _ .510 3.00 .600 _ .200 1.00Residential......................... 8.010 8.310 40.00 .390 - .510 3.00 .600 - .200 1.00
Elevator constructors............. 10.560 11.480 40.00 .545 - .350 - - +6.00 .020 +2.31Engineers— Power equipment operators:Heavy equipment:Cranes (power operators) .............................. 10.000 10.400 40.00 .750 1.000 .750 + .300
Hoists (3 drums) ................ 10.250 10.650 40.00 .750 - 1.000 - .750 - + .300 -
Shovels, power................. . 10.000 10.400 40.00 .750 - 1.000 - .750 - + .300 -
Medium equipment:Bulldozers......................... 10.000 10.400 40.00 .750 - '1.000 - .750 - + .300 -
See footnotes at end of table.
86Digitized for FRASER http://fraser.stlouisfed.org/ Federal Reserve Bank of St. Louis

Table 20. Wage rates, hours, and employer contributions for selected benefits: Selected cities—Continued
(Union hourly wage rates, July 1, 1976, and wage rates, straight-time weekly hours, and employer insurance, pension, vacation, and othercontributions to funds in the building trades, July 1, 1977)
July 1, 1976 July 1, 1977
Employer contributions for selected benefits3Rate per
hour1Rate per
hour1
noursper
week2Insurance4 Pension Vacation Other5
Dollars Percent Dollars Percent Dollars Percent Dollars Percent
Kansas City, Mo. — Continued
Building construction — Continued
Journeymen— Continued
Forklifts (all types)............. $9,750 $10,150 40.00 0.750 _ 1.000 _ 0.750 _ +0.300 _Hoists (single drum)............ 10.000 10.400 40.00 .750 - 1.000 - .750 - + .300 -
Light equipment:Finishing machines............ 9.750 10.150 40.00 .750 - 1.000 - .750 - + .300 -Oil drivers (alltypes) .............................. 9.000 9.400 40.00 .750 - 1.000 - .750 - + .300 -
Tractors (less than50 hp).............................. 9.250 9.650 40.00 .750 - 1.000 - .750 - + .300 -
Glaziers............................... 9.470 9.870 40.00 .570 - .590 - - 9.62 .080 6.86Lathers ................................ 9.600 11.350 40.00 .400 - - - - - .100 -Marble setters ...................... 10.320 10.750 40.00 - 5.00 - 4.25 6.500 - - 2.00Terrazzo workers .................. 9.980 10.410 40.00 - 5.00 - 4.25 6.500 - .050 -Painters............................... +8.740 9.440 40.00 .550 - .700 - - - 23 .770 -
Tapers............................... +8.740 9.440 40.00 .550 - .700 - - - 23 .770 -Paperhangers....................... +9.240 9.940 40.00 .550 - .700 - - - 23 .770 -Pipefitters............................. 10.233 10.998 40.00 .620 - 1.350 - - 10.00 .100 -
Sprinkler fitters ................... 10.630 11.630 40.00 .650 - .950 - 6 1.000 - - -Plasterers............................. 11.150 11.900 40.00 - - - - - - + .100 -Plumbers.............................. 10.640 11.590 40.00 .750 - .850 - - - 1.170 -Reinforcing iron workers........ 9.600 9.600 40.00 .700 - 1.000 - 6 1.000 - - -Roofers, composition............. 9.300 9.600 40.00 .650 - .600 - 6.500 - - -Sheet-metal workers.............. 10.355 10.855 40.00 .500 - .825 - .750 - .570 _Stonemasons........................ 9.725 9.725 40.00 .550 - .350 - 1.000 - - -Structural-iron workers........... 9.600 9.600 40.00 .700 - 1.000 - 6 1.000 - - -
Ornamental iron workers ................................... 9.600 9.600 40.00 .700 - 1.000 - 6 1.000 - - -
Tile layers............................. 10.320 10.750 40.00 - 5.00 - 4.25 .500 - - 2.00
Helpers and laborers
Bricklayers’ tenders............... 8.855 9.000 40.00 .450 _ .400 _ 6 .500 _ .210 _Hod carriers (brick) ............. 8.855 9.000 40.00 .450 - .400 - 6 .500 - .210 -
Building laborers ................... 8.000 8.000 40.00 .450 - .400 - 6 .500 - .260 -Elevator constructors’helpers............................... 7.390 8.040 40.00 .545 - .350 - - +6.00 .020 +2.31
Marble setters’ helpers .......... 8.000 8.650 40.00 - - - - 6 1.000 - - -Plasterers’ laborers................ 8.855 8 9.000 40.00 .450 - .400 - 6 .500 — .210 -Plumbers’ laborers................ 8.195 8.195 40.00 .450 - .400 - 6.500 - .260 -Terrazzo workers’helpers............................... 7.500 9.650 40.00 - - - - - - - -Base grinders..................... 7.850 10.000 40.00 - - - - - - - -
Tile layers’ helpers................ 8.000 8.650 40.00 - - - - 1.000 - - -
Highway and street construction
Journeymen
Cement finishers................... 9.655 10.200 40.00 .400 - .500 - 1.250 - - -
See footnotes at end of table.
87Digitized for FRASER http://fraser.stlouisfed.org/ Federal Reserve Bank of St. Louis

Table 20. Wage rates, hours, and employer contributions for selected benefits: Selected cities—Continued
(Union hourly wage rates, July 1, 1976, and wage rates, straight-time weekly hours, and employer insurance, pension, vacation, and other contributions to funds in the building trades, July 1, 1977)
July 1, 1976 July 1, 1977
City and job classification Hoursper
week2
Employer contributions for selected benefits3Rate per
hour1Rate per
hour1 Insurance4 Pension Vacation Other5
Dollars Percent Dollars Percent Dollars Percent Dollars Percent
Kansas City, Mo. —Continued
Highway and street construction —Continued
Journeymen— Continued
Engineers— Power equipment operators:Group I— Draglines, shovels, piledrivers, dredges (steam, gas, or diesel), bulldozers ................ ............ $10,000 $10,000 40.00 0.500 1.000 0.750 0.150
Group II— Hoists (single drum), tractors (over 50 hp) ..................... 9.750 8 9.750 40.00 .500 1.000 .750 .150
Group III— Sub-grading machines, siphons and jets, tractors (less than 50 hp)...................... 9.500 8 9.500 40.00 .500 1.000 .750 .150
Helpers and laborers
Laborers.............................. 8.200 8.700 40.00 .500 - .500 - .750 - .150 -
Other heavy construction
Journeymen
Cement finishers................... 9.655 10.200 40.00 .400 _ .500 _ 1.250 .Engineers— Power equip
ment operators:Group I— Draglines, shovels, pile drivers, dredges (steam, gas, or diesel), bulldozers........................ 10.000 10.000 40.00 .500 1.000 .750 .150
Group II— Hoists (single drum), tractors (over 50 hp) ..................... 9.750 9.750 40.00 .500 1.000 .750 .150
Group III— Sub-grading machines, siphons and jets, tractors (less than 50 hp)...................... 9.500 9.500 40.00 .500 1.000 .750 .150
Helpers and laborers
Laborers.............................. 8.200 8.700 40.00 .500 - .500 - .750 - .150 -
88Digitized for FRASER http://fraser.stlouisfed.org/ Federal Reserve Bank of St. Louis

(Union hourly wage rates, July 1, 1976, and wage rates, straight-time weekly hours, and employer insurance, pension, vacation, and other contributions to funds in the building trades, July 1, 1977)
Table 20. Wage rates, hours, and employer contributions for selected benefits: Selected cities—Continued
July 1, 1976 July 1, 1977
City and job classification Hoursper
week2
Employer contributions for selected benefits3Rate per
hour1Rate per
hour1 Insurance4 Pension Vacation Other5
Dollars Percent Dollars Percent Dollars Percent Dollars Percent
Long Beach, Calif.
Building construction
Journeymen
Abestos workers................... $11,350 $12,100 40.00 0.870 1.100 1.000Boilermakers......................... 12.000 13.175 40.00 .775 - 1.000 - .500 - - -Bricklayers............................ 10.251 10.700 40.00 - 10.27 - 12.95 6.500 - 0.250 -Carpenters........................... 9.540 10.050 40.00 1.490 - 1.950 - 1.000 - .020 -Cement finishers................... 9.410 9.810 40.00 1.300 - 1.750 - 1.000 - - -Drywall tapers(finishers)............................ . 11.790 40.00 .710 _ .750 . .600 .120
Electricians (inside wirers)............................... + 10.840 11.700 40.00 1.050 _ 1.950 3.00 6.950 . 1.00
Elevator constructors............. 12.000 12.950 40.00 .545 - .350 - - 6.00 .020 2.31Engineers— Power equip
ment operators:Shovels, backhoes, draglines, clamshells (#6)................................. 10.290 11.740 40.00 1.000 2.000 .500 .100
Tractors to 100 h.p.(#5)................................. 10.180 11.630 40.00 1.000 _ 2.000 . .500 . .100 .
A-frames or winch trucks (#3)....................... 9.820 11.270 40.00 1.000 . 2.000 . .500 . .100
Motor patrol, single engine (#7)...................... 10.410 11.860 40.00 1.000 _ 2.000 _ .500 _ .100 _
Motor patrol, multi- engine (#8)...................... 10.580 12.030 40.00 1.000 _ 2.000 . .500 . .100 .
Compressors (#1).............. 9.250 10.700 40.00 1.000 - 2.000 - .500 - .100 -Concrete mixers, skip- type (#2).......................... 9.530 10.980 40.00 1.000 _ 2.000 _ .500 _ .100 _
Tractors over 100 h.p.(#6)................................. 10.290 11.740 40.00 1.000 _ 2.000 _ .500 _ .100 _
Concrete mixers, pavers............................. 10.290 11.740 40.00 1.000 _ 2.000 _ .500 _ .100
Skip loader operators (3/4 to 1-1/2 yards).......... 10.180 11.630 40.00 1.000 _ 2.000 _ .500 _ .100 _
Skip loaders (1-1/2 to 6-1 /2 yards) ..................... 10.290 11.740 40.00 1.000 _ 2.000 _ .500 _ .100 _
Tractor loaders (over 6-1 /2 yards)..................... 10.410 11.860 40.00 1.000 _ 2.000 .500 _ .100 _
Trenching machines— up to 6 fee t..................... 9.960 11.410 40.00 1.000 _ 2.000 _ .500 _ .100 .
Canal tiner operators.......... 10.710 12.160 40.00 1.000 - 2.000 - .500 - .100 -Glaziers ............................... 9.522 9.736 40.00 .670 - 1.450 - - 8.00 .100 5.00Lathers ................................ 10.900 11.500 40.00 .700 - .900 - .500 - .120 -Machinists............................ 11.400 12.400 40.00 .472 - .600 - - - - -Marble setters...................... 9.529 10.701 40.00 - 10.27 - 12.95 - 6 4.46 - 6.69Painters............................... 10.720 11.270 35.00 .710 - .750 - .600 - .120 -
Swing stage...................... 10.970 11.520 35.00 .710 - .750 - .600 - .120 -13 or more stories........... 11.090 11.640 35.00 .710 - .750 - .600 - .120 -
Structural steel or bridge swing..................... 10.840 11.390 35.00 .710 _ .750 _ .600 _ .12013 stories or less............ 11.120 11.670 35.00 .710 - .750 - .600 - .120 -More than 13 stories....... 11.240 11.790 35.00 .710 - .750 - .600
oo
.120 -
Spray............................... 10.970 11.520 35.00 .710 - .750 - .600 - .120 -13 stories or less............ 11.220 11.770 35.00 .710 - .750 - .600 - .120 -
Paperhangers....................... 10.970 11.520 35.00 .710 - .750 - .600 - .120 -Pipefitters............................. 11.660 12.410 36.00 - 10.00 - 16.00 - 13.00 - 2.00Plasterers............................. 9.835 11.485 40.00 .830 1.850 - 6.650 - .200 -
See footnotes at end of table.
89Digitized for FRASER http://fraser.stlouisfed.org/ Federal Reserve Bank of St. Louis
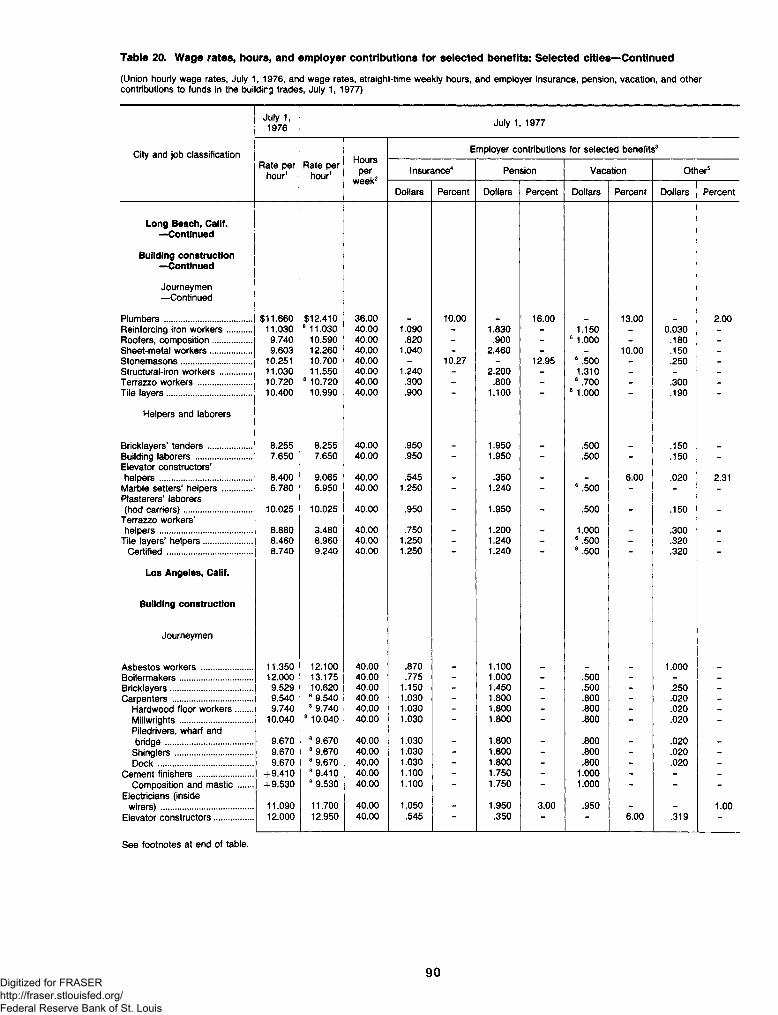
Table 20. Wage rates, hours, and employer contributions for selected benefits: Selected cities—Continued
(Union hourly wage rates, July 1, 1976, and wage rates, straight-time weekly hours, and employer insurance, pension, vacation, and other contributions to funds in the building trades, July 1, 1977)
July 1, 1976 July 1, 1977
City and job classification Hoursper
week2
Employer contributions for selected benefits3Rate per
hour1Rate per
hour1 Insurance4 Pension Vacation Other5
Dollars Percent Dollars Percent Dollars Percent Dollars Percent
Long Beach, Calif. — Continued
Building construction — Continued
Journeymen— Continued
Plumbers.............................. $11,660 $12,410 36.00 _ 10.00 _ 16.00 13.00 _ 2.00Reinforcing iron workers........ 11.030 8 11.030 40.00 1.090 - 1.830 - 1.150 - 0.030 -Roofers, composition............. 9.740 10.590 40.00 .820 - .900 - 6 1.000 - .180 -Sheet-metal workers.............. 9.603 12.260 40.00 1.040 - 2.460 - - 10.00 .150 -Stonemasons........................ 10.251 10.700 40.00 - 10.27 - 12.95 6 .500 - .250 -Structural-iron workers........... 11.030 11.550 40.00 1.240 - 2.200 - 1.310 - - -
Terrazzo workers.................. 10.720 8 10.720 40.00 .300 - .800 - 6.700 - .300 -Tile layers............................. 10.400 10.990 40.00 .900 - 1.100 - 6 1.000 - .190 -
Helpers and laborers
Bricklayers’ tenders............... 8.255 8.255 40.00 .950 _ 1.950 .500 .150Building laborers................... 7.650 7.650 40.00 .950 - 1.950 - .500 - .150 -Elevator constructors’helpers............................... 8.400 9.065 40.00 .545 - .350 - - 6.00 .020 2.31
Marble setters’ helpers .......... 6.780 6.950 40.00 1.250 - 1.240 - 6 .500 - - -Plasterers’ laborers(hod carriers)....................... 10.025 10.025 40.00 .950 - 1.950 - .500 - .150 -
Terrazzo workers’helpers............................... 8.880 3.480 40.00 .750 - 1.200 - 1.000 - .300 -
Tile layers’ helpers................ 8.460 8.960 40.00 1.250 - 1.240 - 6 .500 - .320 -Certified ............................. 8.740 9.240 40.00 1.250 - 1.240 - 6 .500 - .320 -
Los Angeles, Calif.
Building construction
Journeymen
Asbestos workers ................. 11.350 12.100 40.00 .870 _ 1.100 . . 1.000Boilermakers......................... 12.000 13.175 40.00 .775 - 1.000 - .500 - - -
Bricklayers............................ 9.529 10.620 40.00 1.150 - 1.450 - .500 - .250 -
Carpenters ........................... 9.540 8 9.540 40.00 1.030 - 1.800 - .800 - .020 -Hardwood floor workers...... 9.740 8 9.740 40.00 1.030 - 1.800 - .800 - .020 -
Millwrights......................... 10.040 8 10.040 40.00 1.030 - 1.800 - .800 - .020 -Piledrivers, wharf andbridge.............................. 9.670 8 9.670 40.00 1.030 - 1.800 - .800 - .020 -
Shinglers.......................... 9.670 8 9.670 40.00 1.030 - 1.800 - .800 - .020 -Dock................................ 9.670 8 9.670 40.00 1.030 - 1.800 - .800 - .020 -
Cement finishers................... +9.410 8 9.410 40.00 1.100 - 1.750 - 1.000 - - -Composition and mastic..... +9.530 8 9.530 40.00 1.100 - 1.750 - 1.000 - - -
Electricians (insidewirers)............................... 11.090 11.700 40.00 1.050 - 1.950 3.00 .950 - - 1.00
Elevator constructors............. 12.000 12.950 40.00 .545 .350 - 6.00 .319 -
See footnotes at end of table.
90Digitized for FRASER http://fraser.stlouisfed.org/ Federal Reserve Bank of St. Louis

Table 20. Wage rates, hours, and employer contributions for selected benefits: Selected cities—Continued
(Union hourly wage rates, July 1, 1976, and wage rates, straight-time weekly hours, and employer insurance, pension, vacation, and other contributions to funds in the building trades, July 1, 1977)
July 1, 1976 July 1, 1977
City and job classification Hoursper
week2
Employer contributions for selected benefits3Rate per
hour1Rate per
hour1 Insurance4 Pension Vacation Other5
Dollars Percent Dollars Percent Dollars Percent Dollars Percent
Los Angeles, Calif. —Continued
Building construction —Continued
Journeymen — Continued
Engineers— Power equipment operators:Heavy equipment:Universal equipment (shovels, draglines, clamshell operators over 3/4 yard), tractors (over 100 hp), concrete mixer operators (paving), skip loaders (crawler 1-1/2 to 6-1/2 yards)............................. $10,290 $11,740 40.00 1.000 2.000 0.500 0.100Tractors (up to,100 horse power), .......... 10.180 11.630 40.00 1.000 _ 2.000 . .500 .100
Medium equipment:A-frame or winch truck operators............. 9.820 11.270 40.00 1.000 2.000 .500 .100Motor patrol blade operators:
Single— No. 7 .............. 10.410 11.860 40.00 1.000 2.000 .500 .100Multi-engine- No. 8 ......................... 10.580 12.030 40.00 1.000 _ 2.000 . .500 _ .100
Light equipment:Air compressors................ 9.250 10.700 40.00 1.000 _ 2.000 _ .500 _ .100 .Concrete mixers (skip type) ...................... 9.530 10.980 40.00 1.000 _ 2.000 . .500 . .100
Skip loaders (3/4 to 1-1/2 yds.).................. 10.180 11.630 40.00 1.000 _ 2.000 . .500 . .100
Trenching machines.......... 9.960 11.410 40.00 1.000 - 2.000 - .500 - .100 -
Canal tiner operators........ 10.710 12.160 40.00 1.000 - 2.000 - .500 - .100 -Glaziers............................... 9.522 9.736 40.00 .670 - 1.150 - - 8.00 .100 5.00Lathers ................................ 10.900 11.500 40.00 .700 - .900 - .500 - .120 -
Machinists............................ 11.400 12.400 40.00 .472 - .600 - - - - -Marble setters ...................... 9.529 10.700 40.00 1.150 - 1.450 - .500 - .250 -Mosaic and terrazzo workers .. 10.720 8 10.720 40.00 .300 - .800 - .700 - .300 -Painters............................... 10.720 11.270 35.00 .710 - .750 - .600 - .020 -
Swing stage...................... 10.970 11.520 35.00 .710 - .750 - .600 - .020 -
Swing stage over 13 stories ............................. 11.090 11.640 35.00 .710 _ .750 . .600 . .020
Spray................................. 10.970 11.520 35.00 .710 - .750 - .600 - .020 -Swing stage.......... ......... 11.220 11.770 35.00 .710 - .750 - .600 - .020 -Swing stage over 13 stories............................. 11.340 11.890 35.00 .710 _ .750 _ .600 _ .020 _
Structural steel and bridge............................... 10.840 11.390 35.00 .710 _ .750 _ .600 . .020Structural steel swing......... 11.120 11.670 35.00 .710 - .750 - .600 - .020 -Structural steel over 13 stories......................... 11.240 11.790 35.00 .710 _ .750 _ .600 . .020
Paperhangers....................... 10.970 11.520 35.00 .710 - .750 - .600 - .020 -Pipefitters............................. 11.660 12.410 36.00 - 10.00 - 16.00 - 13.00 - 2.00
Refrigeration fitters............ 11.450 11.935 36.00 1.530 - 1.700 - 1.420 - .265 -
Sprinkler fitters.................. 12.460 12.760 32.00 .660 - .800 - 1.400 - - -
Plasterers............................. + 10.485 11.485 40.00 .830 - 1.850 - .650 - .200 -
Plumbers.............................. 11.660 12.410 36.00 10.00 16.00 - 13.00 - 2.00
See footnotes at end of table.
91Digitized for FRASER http://fraser.stlouisfed.org/ Federal Reserve Bank of St. Louis

Table 20. Wage rates, hours, and employer contributions for selected benefits: Selected cities—Continued
(Union hourly wage rates, July 1, 1976, and wage rates, straight-time weekly hours, and employer insurance, pension, vacation, and othercontributions to funds in the building trades, July 1, 1977)
City and job classification
July 1, 1976 July 1, 1977
Employer contributions for selected benefits3
Rate per hour1
Rate per hour1
noursper
week2Insurance4 Pension Vacation Other5
Dollars Percent Dollars Percent Dollars Percent Dollars Percent
Los Angeles, Calif. — Continued
Building construction — Continued
Journeymen— Continued
Reinforcing iron workers........ $11,030 $11,030 40.00 1.030 1.830 1.150 0.030Roofers................................ 9.740 10.590 40.00 .820 - 1.080 - 1.000 - .020 -Sheet-metal workers.............. + 10.674 8 10.674 40.00 1.040 - 2.100 - - 10.00 .110 -Stonemasons........................ 9.529 10.700 40.00 1.150 - 1.450 - .500 - .250 -Structural-iron workers........... 11.030 11.550 40.00 1.240 - 2.220 - 1.310 - f t f tTile layers............................. 10.400 10.990 40.00 .900 - 1.100 - 1.000 - .190
Helpers and laborers
Bricklayers’ tenders............... 8.255 8 8.255 40.00 .950 1.950 .550 .100Building laborers................... 7.650 8 7.650 40.00 .950 - 1.950 - .500 - .150 -Elevator constructors’
helpers......... .................... 8.400 9.065 40.00 .545 _ .350 _ _ 6.00 .319Marble setters’ helpers.......... 6.780 6.950 40.00 1.250 - 1.240 - .500 - - -Plasterers’ laborers................ 10.025 10.175 40.00 .950 - 1.950 - .800 - .020 -
Terrazzo workers’ helpers (and floor machine operators).............. 8.880 8.880 40.00 .350 .800 1.000 .300
Base machine operators..... 9.150 9.150 40.00 .350 - .800 - 1.000 - .300 -Tile layers’ helpers................ 8.460 8.960 40.00 1.250 - 1.240 - .500 - .320 -
Certified helpers................ 8.740 9.240 40.00 1.250 - 1.240 - .500 - .320 -
Louslvllle, Ky.
Building construction
Journeymen
Asbestos workers................. 9.210 9.660 40.00 .500 1.000 6 1.000 .020Boilermakers......................... 9.050 9.400 40.00 .750 - 1.000 - - - 1.400 -Bricklayers............................ 9.330 9.330 40.00 .400 - .400 - 6.500 - .050 -
Cleaners, pointers, and caulkers.................... 9.330 9.330 40.00 .400 .400 _ 6.500 .050
Carpenters........................... 9.650 9.950 40.00 .450 - .450 - - - .020 -Millwrights......................... 9.400 10.050 40.00 .450 - .650 - 6 1.000 - -- -Piledrivers......................... 9.900 10.200 40.00 .450 - .450 - - - .020 -
Cement finishers................... 9.280 9.280 40.00 .600 - .300 - - - - -Electricians (inside
wirers)............................... 10.880 11.100 40.00 .500 _ .400 3.00 8 .500 _ 1.00Elevator constructors............. 11.000 11.410 40.00 .545 - .350 - - 6.00 .020 2.30Engineers— Power equip
ment operators:Heavy equipment— Mixers (21 cu. ft. or over), cranes, derricks, draglines, shovels, bulldozers, hoists (2 drums or more)............................... 9.800 10.450 40.00 .400 .450 .020
See footnotes at end of table.
92Digitized for FRASER http://fraser.stlouisfed.org/ Federal Reserve Bank of St. Louis

Table 20. Wage rates, hours, and employer contributions for selected benefits: Selected cities—Continued
(Union hourly wage rates, July 1, 1976, and wage rates, straight-time weekly hours, and employer insurance, pension, vacation, and othercontributions to funds in the building trades, July 1, 1977)
City and job classification
July 1, 1976 July 1, 1977
Rate per hour1
Rate per hour1
Hoursper
week2
Employer contributions for selected benefits3
Insurance4 Pension Vacation Other5
Dollars Percent Dollars Percent Dollars Percent Dollars Percent
$7,510 $8,010 40.00 0.400 0.450 0.020
6.890 7.340 40.00 .400 .450 .0208.900 8.900 40.00 .350 - .450 - - - - _9.990 10.490 40.00 - - .200 - 6 0.300 - .100 _
. 11.200 11.200 40.00 - - - - - 5.00 .344 -8.700 9.200 40.00 .400 - .400 - 6.500 - .050 -
8.700 9.200 40.00 .400 _ .400 _ 6 .500 _ .050 _8.220 8.620 40.00 .350 - .200 - - - - _8.670 9.070 40.00 .350 - .200 - - - - _
. 10.440 10.840 40.00 .500 - .800 - 6 1.000 - .060 _
. +9.100 9.600 40.00 - - - - - - .850 -
. 10.270 11.150 40.00 .600 - .900 - 6.750 - .080 -6.680 7.250 40.00 .600 - .900 - 6.750 - .080 _
. 10.000 10.000 40.00 .900 - 1.150 - 6.950 - - -7.400 7.850 40.00 .600 - .250 - - - .100 -7.800 8.250 40.00 .600 - .250 - - - .100 _
. +10.010 10.480 40.00 .700 - .800 - 6.600 - .497 _9.330 9.330 40.00 .400 - .400 - 6.500 - .050 _
, 10.000 10.000 40.00 .900 - 1.150 - 6.950 - - -
8.700 9.200 40.00 .400 .400 6.500 .050
7.250 7.780 40.00 .350 .470 .0206.900 7.430 40.00 .350 - .470 - - - .020 -
7.700 7.990 40.00 .545 _ .350 _ 6.00 .020 2.308.300 8.600 40.00 - - - - - - .050 _7.100 7.630 40.00 .350 - .470 - - - .020 -5.780 5.780 40.00 .600 - - - - - - -4.800 24 3.950 40.00 .600
'.250 — — .100 —
8.300 8.600 40.00 .0508.300 8.600 40.00 “ - - ~ - - .050 -
Lousiville, Ky. —Continued
Building construction —Continued
Journeymen— Continued
Medium equipment— Mixers (under 21 cu. ft.), compressors (over 600 cu. ft.) tractors (50 hp. andover)...........................
Light equipment— Oilers, pumps, earth rollers, tractors (under 50 hp.), compressors (under 600cu. ft.)..........................
Glaziers...........................Lathers............................Machinists........................Marble setters ..................Mosaic and terrazzo
workers..........................Painters, brush .................
Spray...........................Pipefitters.........................Plasterers.........................Plumbers..........................
Residential....................Reinforcing iron workers....Roofers, composition.........Roofers, slate and tile .......Sheet-metal workers..........Stonemasons....................Structural-iron workers.......Tile layers.........................
Helpers and laborers
Bricklayers’ tenders..............Building laborers ..................Elevator constructors’
helpers..............................Marble setters’ helpers.........Pipe layers’ helpers..............Plumbers’ laborers................Roofers’ helpers...................Terrazzo workers’ laborers, base grinders, floor machines— Flatgrinders..............................
Tile layers’ helpers................
See footnotes at end of table.
93
Digitized for FRASER http://fraser.stlouisfed.org/ Federal Reserve Bank of St. Louis

Table 20. Wage rates, hours, and employer contributions for selected benefits: Selected cities—Continued
(Union hourly wage rates, July 1, 1976, and wage rates, straight-time weekly hours, and employer insurance, pension, vacation, and other contributions to funds in the building trades, July 1, 1977)
July 1, 1976 July 1, 1977
City and job classification Hoursper
week2
Employer contributions for selected benefits3Rate per
hour1Rate per
hour1 Insurance4 Pension Vacation Other5
Dollars Percent Dollars Percent Dollars Percent Dollars Percent
Louslvilie, Ky. —Continued
Highway and street construction
Journeymen
Carpenters........................... $8,010 $8,410 40.00 0.450 0.450 0.020Piledrivers.......................... 8.260 8.660 40.00 .450 - .450 - - - .020 -
Helpers and laborers
Construction laborers:Group I— General laborers, concrete and asphalt laborers, carpenters’ tenders drill helpers...................... 6.790 7.370 40.00 .350 .470 .020
Group II— Jackhammer operators, concrete saw operators, sand blasters, welders............... 7.040 7.620 40.00 .350 .470 .020
Group III— Powdermen, blasters, tunnel laborers (free air)................ 7.090 7.670 40.00 .350 .470 .020
Group IV— Miners, drillers (free air), tunnel blasters................. 7.690 8.270 40.00 .350 _ .470 _ - _ .020 _
Other heavy construction
Journeymen
Carpenters........................... 8.010 8.410 40.00 .450 .450 .020Millwrights......................... 8.510 8.910 40.00 .450 - .450 - - - .020 -Piledrivers......................... +8.260 8.660 40.00 .450 - .450 - - - .020 -
Engineers— Power equipment operators:Heavy equipment— Mixers (21 cu. ft. or over), cranes, derricks, draglines, shovels, bulldozers, hoists (2 drums or more).............................. 9.650 10.400 40.00 .350 .350
See footnotes at end of table.
94
Digitized for FRASER http://fraser.stlouisfed.org/ Federal Reserve Bank of St. Louis

Table 20. Wage rates, hours, and employer contributions for selected benefits: Selected cities—Continued
(Union hourly wage rates, July 1, 1976, and wage rates, straight-time weekly hours, and employer insurance, pension, vacation, and other contributions to funds in the building trades, July 1. 1977)
July 1, 1976 July 1, 1977
City and job classification Hoursper
week2
Employer contributions for selected benefits3Rate per
hour1Rate per
hour1 Insurance4 Pension Vacation Other5
Dollars Percent Dollars Percent Dollars Percent Dollars Percent
Lousiville, Ky. —Continued
Other heavy construction —Continued
Journeymen— Continued
Medium equipment— Mixers (under 21 cu. ft.), compressors (over 600 cu. ft.), tractors (50 hp. and over)............................... $7,510 $8,100 40.00 0.350 0.350
Light equipment— Oilers, pumps, earth rollers, tractors (under 50 hp.), compressors (under 600 cu. ft.).............................. 6.890 7.440 40.00 .350 .350
Helpers and laborers
Construction laborers:Group I— General laborers, concrete and asphalt laborers, carpenters’ tenders drill helpers...................... 6.790 7.370 40.00 .350 .470 0.020
Group II— Jackhammer operators, concrete saw operators, sand blasters, welders............... 7.040 7.620 40.00 .350 .470 .020
Group III— Powdermen, blasters, tunnel laborers (free air)................ 7.090 7.670 40.00 .350 .470 .020
Group IV— Miners, drillers (free air), tunnel blasters ................. 7.690 8.270 40.00 .350 - .470 - - - .020 -
Memphis, Tenn.
Building construction
Journeymen
Asbestos workers................. 9.300 11.200 40.00 .450 .500 6 0.800Boilermakers......................... 8.800 9.300 40.00 .950 - 1.000 - - - - -Bricklayers............................ 9.600 9.850 40.00 .530 - .300 - 6.250 - .150 -
Pointers and caulkers......... 9.350 9.600 40.00 .530 - .300 - 6.250 - .150 -Carpenters........................... 9.000 9.150 40.00 .600 - .400 - - - - -
Floor layers........................ 9.000 9.150 40.00 .600 - .400 - - - - -Piledrivers.......................... 9.000 9.150 40.00 .600 - .400 - - - - -
Cement finishers................... 8.600 9.125 40.00 .450 - .550 - - - - -Machine operators............. 8.850 9.375 40.00 .450 - .550 - - - - -
Drywall tapers(finishers)............................ - 9.000 40.00 .500 - .450 - - - - -
See footnotes at end of table.
95
Digitized for FRASER http://fraser.stlouisfed.org/ Federal Reserve Bank of St. Louis

Table * ye rates, hours, and employer contributions for selected benefits: Selected cities—Continued
(Union hourly wage rates, July 1, 1976, and wage rates, straight-time weekly hours, and employer insurance, pension, vacation, and other contributions to funds in the building trades, July 1, 1977)
July 1, 1976 July 1, 1977
City and job classification Hoursper
week2
Employer contributions for selected benefits3Rate per
hour1Rate per
hour1 Insurance4 Pension Vacation Other5
Dollars Percent Dollars Percent Dollars Percent Dollars Percent
Memphis, Term. — Continued
Building construction — Continued
Journeymen— Continued
Electricians (inside wirers)............................... $9,530 $10,480 40.00 0.750 0.400 3.00 1.00
Elevator constructors............. 9.430 11.020 40.00 .545 - .350 - - 6.00 0.020 2.30Engineers— Power equip
ment operators:Class A— Cranes, derricks, draglines, trenching machines (18 in. and over), piledrivers, hoists (3 drums), shovels, bulldozers........................ 8.650 9.175 40.00 .400 .500
Class B— Trenching machines (18 in. and smaller), elevating or blade graders, hoists (1 or 2 drum), mixers.............................. 8.220 8.745 40.00 .400 .500
Class C— Air compressors (stationary), pumps,(larger than 4 in.), tractors (40 hp or less)................................ 7.520 8.045 40.00 .400 .500
Class D— Air compressor operators (portable)......................... 7.120 7.645 40.00 .400 .500
Glaziers ............................... 9.000 9.000 40.00 .650 - .400 - - - - -Lathers................................ 9.300 9.850 40.00 .450 - - - - - .030 -Marble setters...................... 7.750 8.200 40.00 .450 - .200 - - - - -Mosaic and terrazzo
workers.............................. 7.750 8.200 40.00 .450 _ .200 _ _ _ .
Painters:Residential......................... 8.600 9.000 40.00 .500 _ .450 _ . .
Commercial:Brush, roller applicator ............................... 8.600 9.000 40.00 .500 .450
Spray, steel....................... 8.850 9.250 40.00 .500 - .450 - - - - -
Paperhangers....................... 8.600 9.000 40.00 .500 - .450 - - - - -Pipefitters.............................Plasterers.............................
+9.7209.400
10.9709.900
40.0040.00
.550 .300:
25.800 .280
-
Plumbers.............................. 9.870 11.020 40.00 .750 - .300 - 6 0.500 - - -Reinforcing iron workers........ 9.150 9.600 40.00 .650 - .700 - - - - -Roofers, composition............. 8.700 9.400 40.00 - - .250 - - - .030 -Roofers, slate and tile ............ 8.950 9.650 40.00 - - .250 - - - .030 -
Sheet-metal workers.............. 9.610 10.040 40.00 .650 - .250 - 6 .550 - .440Stonemasons........................ 9.600 9.850 40.00 .530 - .300 - 6 .250 - .150 -
Structural-iron workers........... 9.150 9.600 40.00 .650 - .700 - - - -
Sheeters........................... 9.400 9.850 40.00 .650 - .700 - - - - -
Tile layers............................. 7.750 8.200 40.00 .450 - .200 - - - - -
Helpers and laborers
Bricklayers’ tenders............... 6.700 7.050 40.00 .250 _ .300 - _ _ .050 _
See footnotes at end of table.
96Digitized for FRASER http://fraser.stlouisfed.org/ Federal Reserve Bank of St. Louis

(Union hourly wage rates, July 1, 1976, and wage rates, straight-time weekly hours, and employer insurance, pension, vacation, and other contributions to funds in the building trades, July 1, 1977)
Table 20. Wage rates, hours, and employer contributions for selected benefits: Selected cities—Continued
July 1, 1976 July 1, 1977
City and job classification Hoursper
week2
Employer contributions for selected benefits3Rate per
hour1Rate per
hour1 Insurance4 Pension Vacation Other5
Dollars Percent Dollars Percent Dollars Percent Dollars Percent
Memphis, Tenn. — Continued
Building construction — Continued
Helpers and laborers — Continued
Mortar mixer operators....... $6,800 $7,150 40.00 0.250 0.300 0.050Building laborers................... 5.750 6.375 40.00 .250 - .300 - - - .070 -Composition roofers'
helpers............................... 5.750 6.375 40.00 .250 _ .300 _ _ _ .070 .Elevator constructors’
helpers............................... 6.600 6.860 40.00 .545 . .350 . . 6.00 .020 2.30Plasterers’ tenders................. 6.700 7.050 40.00 .250 - .300 - - - .050 -Plumbers’ laborers................. 5.750 6.375 40.00 .250 - .300 - - - .070 -
Miami, Fla.
Building construction
Journeymen
Asbestos workers................. 9.700 9.650 40.00 .600 .650 6 1.500Boilermakers......................... +9.800 10.300 40.00 .950 - 1.000 - - - - -Bricklayers............................ 9.450 9.550 40.00 .600 - .540 - 6.250 - .010 -
Carpenters........................... 8.700 8.950 40.00 .700 - .550 - - - - -
Millwrights......................... 9.420 9.420 40.00 .550 - .700 - - - • .020 -Piledrivers......................... 8.700 9.000 40.00 .550 - .700 - - - .020 -Residential........................ 6.500 6.500 40.00 .700 - .550 - - - - -
Cement finishers................... 9.450 9.550 40.00 .600 - .540 - 6.250 - .010 -Drywall tapers(finishers)............................ 9.050 40.00 .550 _ .500 _ _ _ .020 _
Electricians (inside wirers)............................... 11.250 11.250 40.00 _ 4.50 5.00 _ 8.50 _ 1.50
Elevator constructors............. 10.730 10.910 40.00 .545 - .350 - - 6.00 .020 2.30Engineers— Power equipment operators:
Group A— Cranes, derricks, hoists (2 drums or more)................. 9.500 9.750 40.00 .500 .450
Group B— Draglines, backhoes, forklifts, hoists (1 drum), finish grader operators ............................... 8.860 9.060 40.00 .500 .450
Group C— Bulldozers, scrapers, motor graders, trenching machines, front-end loaders, winches, air compressors (above 125 cfm ).......................... 8.010 8.260 40.00 .500 .450
See footnotes at end of table.
97
Digitized for FRASER http://fraser.stlouisfed.org/ Federal Reserve Bank of St. Louis

Table 20. Wage rates, hours, and employer contributions for selected benefits: Selected cities—Continued
(Union hourly wage rates, July 1, 1976, and wage rates, straight-time weekly hours, and employer insurance, pension, vacation, and othercontributions to funds in the building trades, July 1, 1977)
City and job classification
July 1, 1976 July 1, 1977
Employer contributions for selected benefits3Rate per
hour1Rate per
hour1noursper
week2Insurance4 Pension Vacation Other5
Dollars Percent Dollars Percent Dollars Percent Dollars Percent
Miami, Fla. —Continued
Building construction —Continued
Journeymen— Continued
Group D— Rollers, finishing machines, tractors, mixers,oilers-drivers..................... $7,460 $7,660 40.00 0.500 - 0.450 - - - - -
Group E— Drivers, oilers, crawlers,cranes............................. 6.460 6.660 40.00 .500 - .450 - - - - -
Glaziers ............................... +8.900 8.900 40.00 .550 - .350 - 6 0.500 - - -Lathers ................................ 9.100 9.400 40.00 .550 - .250 - - - - -Marble setters ...................... 9.450 9.550 40.00 .600 - .540 - 6.250 - 0.010 -
Marble polishers................ 9.100 9.100 40.00 .500 - .400 - .750 - - -Surfacing machineoperators ......................... 9.100 9.100 40.00 .500 - .400 - .750 - - -
Floor surfacing (5 hpand under)....................... 8.600 8.600 40.00 .500 - .400 - .750 - - -
Floor surfacing (over5 hp)............................... 9.600 9.600 40.00 .500 - .400 - .750 - - -
Mosaic and terrazzoworkers............................. 9.450 9.550 40.00 .600 - .540 - 6.250 - .010 -
Painters ............................... 8.800 8.800 40.00 .550 - .500 - - - .020 -Scaffold............................ 9.200 9.200 40.00 .550 - .500 - - - .020 -Spray ............................... 9.300 9.300 40.00 .550 - .500 - - - .020 -Residential (repaint)........... 6.300 6.300 40.00 .550 - .500 - - - .020 -
Paperhangers ....................... 9.050 9.050 40.00 .550 - .500 - - - .020 -Pipefitters, commercial........... +9.730 9.730 40.00 1.080 - 1.000 - 6.500 - .070 -Pipefitters, residential............ 5.626 5.790 40.00 1.080 - 1.000 - - - .070 -Plasterers............................. 9.450 9.550 40.00 .600 - .540 - 6.250 - .010 -Plumbers ............................. + 9.740 26 7.820 40.00 .920 - 1.050 - 6.600 - .080 -Reinforcing iron workers........ 9.750 9.750 40.00 .750 - .580 - - - .040 -Roofers, composition............. 9.270 9.270 40.00 .830 - .350 - - - 6 .500 -Roofers, slate and tile ........... +9.520 9.520 40.00 .830 - .350 - - - 6 .500 -Sheet-metal workers:
Commercial........................ + 9.950 9.950 40.00 .750 - .500 - 6.600 - .100 -Residential:Agreement A ..................... 5.550 5.550 40.00 .750 - .500 - - - .100 -Agreement B .................... 4.200 4.200 40.00 .750 - .500 - - - .100 -
Stonemasons........................ 9.450 9.550 40.00 .600 - .540 - 6.250 - .010 -Structural-iron workers........... 9.750 9.750 40.00 .750 - .580 - - - .040 -
Tile layers............................. 9.450 9.550 40.00 .600 - .540 - 6.250 - .010 -
Helpers and laborers
Bricklayers’ tenders............... 6.620 6.700 40.00 1.000 _ .370 _ _ _ .200 .Building laborers, .................. 6.520 6.600 40.00 1.000 - .370 - - - .200 -Elevator constructors’
helpers..............................Marble, tile, and ter
7.510 7.640 40.00 .545 ~ .350 6.00 .020 2.30
razzo workers’ laborers ........ 8.250 8.250 40.00 .500 - .400 - .750 - - -Pipefitters’ helpers................ 4.092 4.210 40.00 1.080 - 1.000 - - - .070 -Plasterers’ laborers................ 6.800 6.880 40.00 .950 - • .450 - - - .050 -Plumbers’ laborers................ 6.520 6.600 40.00 1.000 - .370 - - - .200 -Roofers’ helpers.................... 5.620 5.620 40.00 .300 - .150 - 6.500 - - -
Kettlemen and mortar-men ............................... 6.520 6.520 40.00 .300 .150 _ 6.500 - - -
See footnotes at end of table.
98
Digitized for FRASER http://fraser.stlouisfed.org/ Federal Reserve Bank of St. Louis

Table 20. Wage rates, hours, and employer contributions for selected benefits: Selected cities—Continued
(Union hourly wage rates, July 1, 1976, and wage rates, straight-time weekly hours, and employer insurance, pension, vacation, and othercontributions to funds in the building trades, July 1, 1977)
City and job classification
Miami, Fla. —Continued
Highway and street construction
Journeymen
Piledrivers..........................
Other heavy construction
Journeymen
Engineers— Power equipment operators:Class A— Cranes, derricks, hoists (2drums).....................
Class B— Draglines, backhoes, hoists (1 drum), gradealls,graders ...................
Class C— Bulldozers, forklifts, winch trucks, front-end loaders, pumps (3 inor larger)..................
Class D— Compressors, (above 125 cfm), (scrapers, trenchers ....
Class E— Finishing machines, tractors,oilers........................
Piledrivers.....................
Milwaukee, Wise.
Building construction
Journeymen
Asbestos workers .........Boilermakers................Bricklayers....................
Sewer tunnel, caisson .Truck pointers...........
Carpenters...................Cement finishers...........Electricians (inside
wirers).......................Elevator constructors.....Engineers— Power equip
ment operators:Heavy equipment: Cranes, derricks, shovels....................
July 1, 1976 July 1, 1977
Rate per hour1
Rate per hour1
Hoursper
week2
Employer contributions for selected benefits3
Insurance4 Pension Vacation Other5
Dollars Percent Dollars Percent Dollars Percent Dollars Percent
$7,400 $8,100 40.00 0.550 - 0.700 - - - 0.020 -
8.300 8.550 40.00 .500 .450 . . .
7.310 7.510 40.00 .500 - .450 - - - - -
7.060 7.310 40.00 .500 - .450 - - - - -
6.660 6.860 40.00 .500 - .450 - - - - -
6.360 6.560 40.00 .500 .450 . _ _ .7.400 8.100 40.00 .550 .700 .020
10.220 11.150 40.00 .700 .800 1.000 .0409.450 10.300 40.00 .850 - 1.000 - - - - -
10.240 10.610 40.00 1.070 - .900 - .550 - .160 -10.240 10.610 40.00 1.070 - .900 - .550 - .160 -10.240 10.610 40.00 1.070 - .900 - .550 - .160 -9.760 10.370 40.00 .800 - .800 - .500 - .070 -
9.340 9.830 40.00 1.000 - .800 - .500 - .070 -
10.580 11.130 40.00 .920 _ .350 3.00 _ 7.00 _ 4.0010.520 11.715 40.00 .545 .350 6.00 .020 2.31
10.020 10.670 40.00 .750 - .900 - - - .100 -
See footnotes at end of table.
99
Digitized for FRASER http://fraser.stlouisfed.org/ Federal Reserve Bank of St. Louis

Table 20. Wage rates, hours, and employer contributions for selected benefits: Selected cities—Continued
(Union hourly wage rates, July 1, 1976, and wage rates, straight-time weekly hours, and employer insurance, pension, vacation, and othercontributions to funds in the building trades, July 1, 1977)
City and job classification
Milwaukee, Wise. —Continued
Building construction —Continued
Journeymen— Continued
Medium equipment:Mixers.........................Tractors or bulldozersover 40 horsepower....
Light equipment:Firemen (piledriverand derrick)................
Pumps........................Hoists, forklifts,boats.........................
Glaziers.........................Lathers..........................Marble setters................Mosaic and terrazzo
workers........................Painters.................... .....
Swing stage:To 80 fee t................80 feet and over.......
Spray.........................Structural steel............Drywall........................
Paperhangers.................Pipefitters and
steamfitters ..................Sprinkler fitters............
Plasterers.......................Plumbers........................Reinforcing iron workers ....Roofers, composition.......
Damp and waterproofroofers.......................
Kettlemen....................Mastic spreaders..........
Roofers, slate and tile ......Sheet-metal workers........Stonemasons..................Structural-iron workers.....
Machinery movers riggers, stonederrick men................
Tile layers.......................
Helpers and laborers
Bricklayers’ tenders....Hod carriers and mortar mixers..............
Building laborers........Composition roofers’
helpers....................Elevator constructors’
helpers....................
July 1, 1976 July 1, 1977
Rate per hour1
Rate per hour1
Hoursper
week2
Employer contributions for selected benefits3
Insurance4 Pension Vacation Other5
Dollars Percent Dollars Percent Dollars Percent Dollars Percent
$9,470 $10,120 40.00 0.750 0.900
-
0.100
9.770 10.420 40.00 .750 - .900 - - - .100 -
9.160 9.810 40.00 .750 .900 .1008.920 9.570 40.00 .750 - .900 - - - .100 -
9.370 10.020 40.00 .750 « .900 _ _ .100 _9.590 10.190 40.00 .920 - .700 - 6 0.500 - - -9.060 9.560 40.00 .850 - .800 ? .910 - .050 _8.810 9.580 40.00 1.070 - .900 - .550 - .11“ -
9.070 10.310 40.00 1.070 _ .900 _ .470 _ .090 _8.850 9.450 40.00 .960 - .800 - .500 - .040 -
9.000 9.600 40.00 .960 _ .800 _ .500 _ .040 _9.100 9.700 40.00 .960 - .800 - .500 - .040 _9.200 9.800 40.00 .960 - .800 - .500 _ .040 _9.200 9.800 40.00 .960 - .800 - .500 - .040 _9.200 9.800 40.00 .960 - .800 - .500 - .040 _8.950 9.550 40.00 .960 - .800 - .500 - .040 -
10.160 10.660 40.00 1.100 _ .800 _ 6 .500 _ .120 _10.050 10.450 40.00 .650 - .950 - 1.700 - _ _9.060 9.560 40.00 1.000 - .800 - .750 _ .060 -
10.330 10.430 40.00 1.000 - 1.000 - 6.550 - .150 _
10.060 10.660 40.00 1.100 - .800 - 1.150 - .040 _
9.710 10.250 40.00 .900 - .800 - .500 - .070 -
9.710 10.250 40.00 .900 _ .800 _ .500 _ .070 _
9.710 10.250 40.00 .900 - .800 - .500 - .070 -
9.910 10.450 40.00 .900 - .800 - .500 - .070 _
9.860 10.400 40.00 .900 - .800 - .500 - .070 -
9.410 10.610 40.00 .910 - 1.070 - .750 - .110 _
10.240 10.610 40.00 1.070 - .900 - .550 - .160 _
10.060 10.660 40.00 1.100 - .800 - 1.150 - .040 -
10.060 10.660 40.00 1.100 .800 1.150 .0409.350 9.800 40.00 .600 .800 .550
■
8.290 9.140 40.00 .750 _ .800 _ .500 _ .070 .
8.400 9.250 40.00 .750 _ .800 - .500 _ .070 _
8.290 9.140 40.00 .750 - .800 - .500 - .070 -
6.800 7.180 40.00 .900 - .800 - .500 - .070 -
7.370 8.200 40.00 .545 - .350 - - 6.00 .020 2.31
See footnotes at end of table.
100
Digitized for FRASER http://fraser.stlouisfed.org/ Federal Reserve Bank of St. Louis

(Union hourly wage rates, July 1, 1976, and wage rates, straight-time weekly hours, and employer insurance, pension, vacation, and other contributions to funds in the building trades, July 1, 1977)
Table 20. Wage rates, hours, and employer contributions for selected benefits: Selected cities—Continued
July 1, 1976 July 1, 1977
City and job classification Hoursper
week2
Employer contributions for selected benefits3Rate per
hour1Rate per
hour1 Insurance4 Pension Vacation Other5
Dollars Percent Dollars Percent Dollars Percent Dollars Percent
Milwaukee, Wise. —Continued
Building construction —Continued
Helpers and laborers — Continued
Marble setters’ helpers.......... $8,420 $8,920 40.00 0.300 0.800 0.550Plasterers’ laborers................ 8.530 9.250 40.00 .750 - .800 - .500 - 0.070 -Plumbers’ laborers:
First.................................. 8.960 9.410 40.00 .800 . .800 . .500 _ .050 .Second ............................. 8.850 9.300 40.00 .800 - .800 - .500 - .050 -
Terrazzo workers’ helpers.............................. 8.600 9.650 40.00 .300 _ .800 _ .550 . .Base machine operators..... 8.820 9.870 40.00 .300 - .800 - .550 - - -Floor machine operators......................... 8.600 9.650 40.00 .300 _ .800 _ .550 _ _
Tile layers’ helpers................ 8.500 9.000 40.00 .300 - .800 - .550 - - -
Highway and street construction
Journeymen
Carpenters........................... 9.760 10.370 40.00 .800 .800 .500 .010Millwrights......................... 10.190 10.890 40.00 .800 - .800 - .500 - .010 -Piledrivers ......................... 9.760 10.910 40.00 .800 - .800 - .500 - .010 -
Cement finishers................... 9.340 9.830 40.00 1.000 - .800 - .500 - .070 -Engineers— Power equip
ment operators:Heavy— Bituminous paver .............................. 9.770 10.420 40.00 .750 .650 .100
Medium equipment:Concrete mixers................ 9.510 10.160 40.00 .750 _ .650 _ _ - .100
Light equipment: Compressors (300 cfm or more).......................... 9.220 9.870 40.00 .750 .650 .100
Concrete breaker and tamper, concrete speader.......................... 9.340 9.990 40.00 .750 .650 .100
Crusher or screening plant, automatic belt conveyor.................. 9.130 9.780 40.00 .750 .650 .100
Pumps, oiler..................... 9.010 9.660 40.00 .750 - .650 - - - .100 -Screed (bituminous paver), shouldering machine.......................... 9.420 10.070 40.00 .750 .650 .100
Firemen........................... 9.260 9.910 40.00 .750 - .650 - - - .100 -
Structural iron workers........... 10.060 10.660 40.00 1.100 - .800 - 1.150 - .190 -
Helpers and laborers
General laborers................... 8.340 8.940 40.00 .750 .800 .500 .070Asphalt laborers................ 7.860 8.210 40.00 .750 - .800 - .250 - .020 -Laborers (state work)......... 7.860 8.210 40.00 .750 ~ .800 _ .250 .020
See footnotes at end of table.
101
Digitized for FRASER http://fraser.stlouisfed.org/ Federal Reserve Bank of St. Louis

Table 20. Wage rates, hours, and employer contributions for selected benefits: Selected cities~Continued
(Union hourly wage rates, July 1, 1976, and wage rates, straight-time weekly hours, and employer insurance, pension, vacation, and other contributions to funds in the building trades, July 1, 1977)
July 1, 1976 July 1, 1977
City and job classification Hoursper
week2
Employer contributions for selected benefits3Rate per
hour1Rate per
hour1 Insurance4 Pension Vacation Other5
Dollars Percent Dollars Percent Dollars Percent Dollars Percent
Milwaukee, Wise. — Continued
Other heavy construction
Journeymen
Carpenters........................... $9,760 $10,370 40.00 0.800 0.800 0.500 0.010Millwrights......................... 10.190 10.890 40.00 .800 - .800 - .500 - .010 -
Piledrivers, wharf and bridge.............................. 9.760 10.910 40.00 .800 _ .800 . .500 .010
Cement finishers................... 9.490 10.080 40.00 1.000 - .800 - .500 - .070 -
Engineers— Power equipment operators:Heavy equipment:Cranes, derricks, shovels.......................... 10.020 10.670 40.00 .750 .900 .100
Medium equipment:Mixers.............................. 9.470 10.120 40.00 .750 _ .900 . . .100
Light equipment: Compressors (300 cfm or more).......................... 9.160 9.810 40.00 .750 .900 .100
Pumps, oilers................... 8.920 9.570 40.00 .750 - .900 - - - .100 -Crushers or screening plants............................. 9.160 9.810 40.00 .750 _ .900 _ . . .100
Bulldozer, material hoists............................. 9.770 10.420 40.00 .750 . .900 .100
A-frames and winch trucks............................. 9.370 10.020 40.00 .750 . .900 . .100
Structural iron workers........... 10.060 10.660 40.00 1.100 - .800 - 1.150 - .190 -
Helpers and laborers
General laborers ................... 8.820 9.270 40.00 .800 .800 .500 .050Utility laborers....................... 7.700 8.000 40.00 .800 - .800 - .500 - .050 -
Minneapolis-St. Paul, Minn.
Building construction
Journeymen
Minneapolis-St. Paul:Asbestos workers.............. 9.480 10.230 40.00 .600 .650 6 1.000Boilermakers..................... 9.450 10.300 40.00 .850 - 1.000 - - - - -
Elevator constructors......... 9.350 10.870 40.00 .545 - .350 - .560 6.00 .020 2.31Engineers— Power equipment operators:Heavy equipment:
Cranes, shovels, derricks....................... 10.250 10.900 40.00 .450 .400
Pumpcrete operators ............................. 10.130 10.780 40.00 .450 _ .400 _ . .
Medium equipment:Hoists, 1-drum; concrete mixers .............................. 10.050 10.700 40.00 .450 - .400 - - - - -
See footnotes at end of table.
102
Digitized for FRASER http://fraser.stlouisfed.org/ Federal Reserve Bank of St. Louis

Table 20. Wage rates, hours, and employer contributions for selected benefits: Selected cities—Continued
(Union hourly wage rates, July 1, 1976, and wage rates, straight-time weekly hours, and employer insurance, pension, vacation, and other contributions to funds in the building trades, July 1, 1977)
July 1, 1976 July 1, 1977
City and job classification Hoursper
week2
Employer contributions for selected benefits3Rate per
hour1Rate per
hour1 Insurance4 Pension Vacation Other5
Dollars Percent Dollars Percent Dollars Percent Dollars Percent
Minneapolis-St. Paul, Minn. — Continued
Building construction — Continued
Journeymen— Continued
Mechanics or welders....................... $10,130 $10,780 40.00 0.450 0.400
Light equipment: Compressors................. 9.500 10.150 40.00 .450 _ .400 _ _ _ _ .Firemen, 1stClass license............... 9.786 10.430 40.00 .450 . .400 .
Oilers........................... 9.050 9.700 40.00 .450 - .400 - - - - _Glaziers............................ 9.100 9.750 40.00 .460 - .500 - 0.350 - 0.030 _Machinists......................... 9.600 10.600 40.00 - - - - - 10.00 .245 -Mosaic and terr- azzo workers.................... 9.690 10.710 40.00 .640 _ .250 . .
Reinforcing iron workers... 10.350 10.850 40.00 .750 - .600 - - - - -Roofers, composition ......... 9.060 10.310 40.00 .690 - .350 - - - .040 -
Roofers, slate andtile ................................... 9.060 10.310 40.00 .690 _ .350 _ . .040
Structural-ironworkers........................... 10.350 10.850 40.00 .750 . .600 . .Finishers......................... 10.350 10.850 40.00 .750 - .600 - - - - -
Tile layers ......................... 7.908 8.340 40.00 .620 7.50 .500 6.00 6 .410 10.00 6.330 1.50Minneapolis:
Bricklayers........................ 9.660 10.010 40.00 .655 _ .530 .560 . .050Cement block layers............................ 9.660 10.010 40.00 .655 _ .530 _ .560 _ ■P50 .
Blocklayers,pointers,swing stage ................... 9.960 10.010 40.00 .655 .530 .560 .050
Carpenters:Outside.......................... 9.210 9.860 40.00 .500 _ .500 _ .500 6.00 .030 2.31Millwrights ...................... 9.210 9.860 40.00 .500 - .500 - .500 6.00 .030 2.31Piledrivers....................... 9.210 9.860 40.00 .500 - .500 - .500 6.00 .030 2.31
Cement finishers................ 9.680 10.130 40.00 .600 - .600 - - - - -Compositionfloor finishers................. 9.930 10.380 40.00 .600 _ .600 _ _ _ _ .
Electricans (inside wirers)...................... 10.030 10.600 40.00 _ 7.50 . 6.00 _ 10.00 . 1.50
Lathers............................. 9.080 9.710 40.00 .450 - .350 - .400 - .450 -Marble setters..... .............. 9.315 9.795 40.00 .655 - .530 - 6.560 - .100 -Painters:
Brush ............................. 9.130 9.680 40.00 .550 _ .250 6 .300 _ 6 .190 .Steel and swing stage— Spray................. 9.630 11.280 40.00 .550 _ .250 _ 6 .300 _ 6 .190 .
Pipefitters.......................... 9.640 10.240 40.00 .530 - .500 - 1.250 - .030 -
Sprinkler fitters................ 9.480 10.880 40.00 .650 - .900 - 6 .500 - .220 -Plasterers.......................... 9.500 10.150 40.00 .450 - .200 - .700 - .150 -Plumbers.......................... 9.640 10.240 40.00 .530 - .500 - 1.350 - .220 -Sheet-metalworkers........................... 9.980 10.520 40.00 .520 _ .710 1.000 _ .100
Stonemasons..................... 9.660 10.010 40.00 .655 - .530 - .560 - .050 -Bricklayers........................ 9.660 10.010 40.00 .655 - .530 - .560 - .050 -
Blocklayers...................... 9.660 10.010 40.00 .655 - .530 - .560 - .050 -Pointers, caulkers, when done on swing stage............... 9.960 10.310 40.00 .655 - .530 - .560 - .050 -
See footnotes at end of table.
103
Digitized for FRASER http://fraser.stlouisfed.org/ Federal Reserve Bank of St. Louis

Table 20. Wage rates, hours, and employer contributions for selected benefits: Selected cities—Continued
(Union hourly wage rates, July 1, 1976, and wage rates, straight-time weekly hours, and employer insurance, pension, vacation, and othercontributions to funds in the building trades, July 1, 1977)
City and job classification
July 1, 1976
Rate per hour1
July 1, 1977
Rate per hour1
Hoursper
week2
Employer contributions for selected benefits3
Insurance4
Dollars Percent
Pension
Dollars Percent
Vacation
Dollars Percent
Other5
Dollars Percent
Minneapolis-St. Paul, Minn. —Continued
Building construction —Continued
Journeymen— Continued
Carpenters:Outside..........Millwrights ......Piledrivers.......
Cement finishers . Electricans (inside wirers)......
Lathers.............Marble masons.... Pipefitters andsteamfitters......
Paperhangers....Painters:
Brush .............Steel and swing stage - spray ...
Plasterers..........Plumbers..........Sheet-metalworkers...........
Stonemasons.....
$9,2109.2109.210 9.680
$9,8609.8609.860
10.130
40.0040.0040.0040.00
0.500.500.500.600
0.500.500.500.600
0.500.500.500
0.030
10.0508.9309.315
10.6509.5809.495
40.0040.0040.00
.500
.655
5.75.500.530
6.00.910
6.560
7.50.080.100
5.12
9.470 10.0709.050 9.600
40.0040.00
.530
.550.500.250
1.520 6.500
.020
.100
9.050 9.600 40.00 .550 .250 6.500 .100
9.5509.2409.470
10.2009.890
10.070
40.0040.0040.00
.550
.700
.530
.250
.250
.500
6.500 .650 .670
.100
.070
.930
9.710 10.2109.660 10.010
40.0040.00
.690
.655.800.530
1.050.560
.080
.050
Helpers and laborers
Minneapolis-St. Paul: Elevator constructors’ helpers:First 6 months......After 6 months......
Marble setters’helpers..................
Plumber laborers:First man..............Second man .........
Terrazzo workers’ helpers:1 year seniority......2 years seniority....Base machine:
1 year seniority...2 years seniority ...
Tile layers’helpers..................
Minneapolis:Bricklayers’tenders.................Mortar mixers........
Building laborers.....Plasterers’ tenders....
St. Paul:Bricklayers’ tenders..................
4.6756.545
5.435 40.007.610 40,00
.545
.545.350.350
.560 6.006.560 6.00
.020
.0202.312.31
8.010 8.490 40.00 .620 .500 .380 6.310
8.1007.900
8.700 40.008.500 40.00
.450
.450.450.450
.450 6.450
.030
.030
8.8308.900
9.360 40.009.430 40.00
.640
.6406.3406.340
6 .100 6 .100
9.1609.230
9.690 40.009.760 40.00
.640
.6406 .340 6.340
6 .100 6 .100
8.010 8.490 40.00 .620 .500 .380 6.310
7.9007.9507.800
10.060
8.4008.4508.300
10.060
40.0040.0040.0040.00
.450
.450
.450
.450
.450
.450
.450
.350
.400
.400
.400
.650 .150
7.900 8.400 40.00 .450 .400
See footnotes at end of table.
104
Digitized for FRASER http://fraser.stlouisfed.org/ Federal Reserve Bank of St. Louis

Table 20. Wage rates, hours, and employer contributions for selected benefits: Selected cities—Continued
(Union hourly wage rates, July 1, 1976, and wage rates, straight-time weekly hours, and employer insurance, pension, vacation, and other contributions to funds in the building trades, July 1, 1977)
July 1, 1976 July 1, 1977
City and job classification Hoursper
week2
Employer contributions for selected benefits3Rate per
hour1Rate per
hour1 Insurance4 Pension Vacation Other5
Dollars Percent Dollars Percent Dollars Percent Dollars Percent
Minneapolis-St. Paul, Minn. —Continued
Building construction —Continued
Helpers and laborers — Continued
Mortar mixers.................. $7,950 $8,450 40.00 0.450 0.400Building laborers ................ 8.610 8.300 40.00 .450 - - - .400 - - -Plasterers’ tenders............ - 9.210 40.00 .450 - 0.450 - .400 - 0.070 -
Highway and street construction
Journeymen
Carpenters........................... 9.210 10.160 40.00 .400 .300 .500Cement finshers.................... 9.680 10.330 40.00 .500 - .500 - - - - -Engineers— Power equip
ment operators:Heavy equipment:Shovels to 3 cu. yds. dredge operators and engineers, derrick operators......................... 10.000 10.650 40.00 .450 .400
Medium equipment: Mechanics, welders........... 9.780 10.430 40.00 .450 _ .400 _ _ _ _Scrappers........................ 9.870 9.870 40.00 .450 - .400 - - - - -
Light equipment:Pumps, compressors, loaders or Barber Greene patrol ................. 9.100 9.750 40.00 .450 .400
Structural iron workers........... 10.350 10.850 40.00 .750 - .600 - - - - -
Helpers and laborers
Construction laborers............ 7.750 8.250 40.00 .450 .450 .400
Other heavy construction
Journeymen
Carpenters........................... 9.210 10.160 40.00 .400 .300 .500Cement finishers................... 9.680 10.330 40.00 .500 - .500 - - - - -Engineers— Power equip
ment operators:Heavy equipment:Shovels to 3 cu. yds., dredge operators, engineers, derrick operators................... 10.000 10.650 40.00 .400 .450
See footnotes at end of table.
105
Digitized for FRASER http://fraser.stlouisfed.org/ Federal Reserve Bank of St. Louis

Table 20. Wage rater, hours, and employer contributions for selected benefits: Selected cities—Continued
(Union hourly wage rates, July 1, 1976, and wage rates, straight-time weekly hours, and employer insurance, pension, vacation, and other contributions to funds in the building trades, July 1, 1977)
July 1, 1976 July 1, 1977
City and job classification Hoursper
week2
Employer contributions for selected benefits3
Rate per hour1
Rate per hour1 Insurance4 Pension Vacation Other5
Dollars Percent Dollars Percent Dollars Percent Dollars Percent
Minneapolis-St. Paul, Minn. —Continued
Other heavy construction —Continued
Journeymen— Continued
Medium equipment: Mechanics, welders.............. $9,780 $10,430 40.00 0.400 0.450Scrapers .................................. 9.870 10.520 40.00 .400 - .450 - - - - -
Finishing graders or motor p a tro l.......................... 10.000 10.650 40.00 .400 _ .450 _ _ . .
Light equipment:Pumps, compressors, loaders or Barber Greene operators.................. 9.100 9.750 40.00 .400 .450
Helpers and laborers
Construction laborers................. 7.750 8.250 40.00 .450 .450 0.400
Nashville-Davidson, Tenn.
Building construction
Journeymen
Asbestos workers ....................... 9.100 10.250 40.00 .450 .350 6 .850Boilermakers................................. 8.800 9.300 40.00 .950 - 1.000 - - - - -Bricklayers..................................... 8.200 9.000 40.00 - - .250 - - - - -Carpenters.................................... 8.650 9.300 40.00 - - .250 - - - 0.020 -
Millwrights ................................. 9.150 9.950 40.00 - - .250 - - - .020 -Cement finishers......................... 7.050 7.550 40.00 .250 - - - - - .020 -Drywall tapers(finishers)..................................... 7.200 8.300 40.00 _ _ .400 _ _ _ _ .
Electricians (inside w irers............................................. 8.600 8.950 40.00 .450 _ _ 3.00 6 .250 . 1.00
Elevator constructors.................. 8.460 8.945 40.00 .545 - .350 - - 6.00 .020 2.30Engineers— Power equipment operators:Class A— Central compressors, cranes, derricks, draglines, hoists (more than 1 drum), piledrivers, shovels, trench machines (18 in. or ov er)........... 8.300 8.850 40.00 .400 .400 .020
See footnotes at end of table.
106
Digitized for FRASER http://fraser.stlouisfed.org/ Federal Reserve Bank of St. Louis

(Union hourly wage rates, July 1, 1976, and wage rates, straight-time weekly hours, and employer insurance, pension, vacation, and other contributions to funds in the building trades, July 1, 1977)
Table 20. Wage rates, hours, and employer contributions for selected benefits: Selected cities—Continued
July 1, 1976 July 1, 1977
City and job classification Hoursper
week2
Employer contributions for selected benefits3
Rate per hour1
Rate per hour1 Insurance4 Pension Vacation Other5
Dollars Percent Dollars Percent Dollars Percent Dollars Percent
Nashville-Davidson, Tenn. —Continued
Building construction —Continued
Journeymen— Continued
Class B— Blade graders, conveyors, hoists (1 drum), pavers, tandem rollers, tractors, trench machines (18 in. or smaller) .......................... $7,840 $8,350 40.00 0.400 0.400 0.020
Class C— Air compressors (stationary), earth drills, motor crane drivers, oilers, pumps (4 in and larger) ................................................ 7.380 7.860 40.00 .400 .400 .020
Class D— Air compressors, oilers, welding machine operators, deckhands .................... 7.010 7.460 40.00 .400 .400 .020
Glaziers .......................................... 7.650 7.750 40.00 .600 - .500 - 6 0.500 - - 2.30Lathers ........................................... 7.850 8.150 40.00 - - .200 - .400 - .070 -
Marble s e tte rs .............................. 5.750 5.750 40.00 - - - - - - - -Mosaic and terrazzo
workers...................................... 5.750 5.750 40.00 _ _ _ _ _ _ _ _
P ain ters .......................................... 7.450 8.050 40.00 - - .400 - - - - -Paperhangers............................... 7.950 8.550 40.00 - - .400 - - - - -P lasterers...................................... 7.400 7.900 40.00 .400 - .200 - 6 .250 - .070 -Plumbers and pipefitters........... 8.840 9.640 40.00 .550 - .550 - - - .070 -Reinforcing iron w orkers........... 8.900 9.450 40.00 .550 - .600 - - - .020 -Roofers, composition.................. + 7.150 7.550 40.00 .450 - .300 - .150 - - -Roofers, slate and t i le ............... + 7 .4 00 7.800 40.00 .450 - .300 - .150 - - -Sheet-metal workers................... 8.300 9.000 40.00 .440 - .310 - 6 .150 - .150 -Stonemasons................................ 8.200 9.000 40.00 - - .250 - - - - -Structural-iron w orkers.............. 8.900 9.450 40.00 .550 - .600 - - - .020 -Tile layers....................................... 5.750 5.750 40.00 - - - - - - - -
Helpers and laborers
Bricklayers’ te nde rs .................... 5.500 6.200 40.00 .250 .270 .020Building laborers ......................... 5.500 6.200 40.00 .250 - .270 - - - .020 -Composition roofers’
helpers........................................ 5.500 6.200 40.00 .250 - .270 - _ _ .020 _
Elevator constructors’ helpers......................................... 5.920 6.260 40.00 .545 _ .350 _ _ 6.00 .020 2.30
Marble setters’ helpers ............. 5.500 6.200 40.00 .250 - .270 - - - .020 -Plasterers’ laborers..................... 5.500 6.200 40.00 .250 - .270 - - - .020 -Plumbers’ laborers...................... 5.500 6.200 40.00 .250 - .270 - - - .020 -Terrazzo workers’ laborers......................................... 5.500 6.200 40.00 .250 _ .270 _ _ _ .020 _
Tile layers’ helpers...................... 5.500 6.200 40.00 .250 _ .270 ~ ~ .020 -
See footnotes at end of table.
107Digitized for FRASER http://fraser.stlouisfed.org/ Federal Reserve Bank of St. Louis

Table 20. Wage rates, hours, and employer contributions for selected benefits: Selected cities—Continued
(Union hourly wage rates, July 1, 1976, and wage rates, straight-time weekly hours, and employer insurance, pension, vacation, and othercontributions to funds in the building trades, July 1, 1977)
City and job classification
Newark, N.J.
Building construction
Journeymen
Asbestos workers ..............Boilermakers........................Bricklayers.............................Carpenters............................
Millwrights........................Piledrivers, dock builders, house movers, and foundation workers....................
Cement finishers.................Electricians (inside
w irers).................................Elevator constructors.........Engineers— Power equip
ment operators:Heavy equipment:Power shovels, cranes. Power cranes on steelerection...........................
Trench machines, paving m ixers....................
Medium equipment: Hoists, more than onegenerator.......................
Central power plants.... Concrete tower hoists..
Light equipment:Air compressors,single pumps.................
Small m ixers...................Concrete pu m p s...........
Glaziers .................................Lathers ..................................Machinists.............................Mosaic and terrazzo
w orkers...............................P a in ters.................................
Above 3 stories.............Drywall tapers..................
Pipefitters..............................Sprinkler fitte rs ...............
P lasterers..............................P lum bers...............................Reinforcing iron workers ...Roofers, composition.........Sheet-metal workers..........Stonemasons.......................Structural-iron w orkers.....Tile layers.............................
Helpers and laborers
Bricklayers’ tenders
July 1, 1976 July 1, 1977
Rate per hour1
Rate per hour1
Hoursper
week2
Employer contributions for selected benefits3
Insurance4 Pension Vacation Other5
Dollars Percent Dollars Percent Dollars Percent Dollars Percent
$10,110 $10,250 40.00 9.00 10.00 17.00 0.08010.060 10.570 35.00 - 8.00 - 20.00 - 10.00 _ _10.350 11.000 35.00 0.920 - 0.750 - 6 0.500 _ .02010.750 11.260 35.00 - 8.00 - 7.00 - - _ -
11.000 11.510 35.00 — 8.00 — 7.00 - -
10.920 11.450 40.00 1.400 1.780 .760 .04010.350 11.000 35.00 .920 - .750 - 6 .500 - .020 -
11.220 12.040 40.00 _ 7.00 _ 10.00 _ 10.0010.760 11.110 35.00 .745 — 1.703 - ~ 4.00 .490
12.680 13.490 40.00 - 7.00 - 10.00 - - - 10.69
14.390 15.310 40.00 - 7.00 - 10.00 - - - 10.69
12.680 13.490 40.00 - 7.00 - 10.00 - - - 10.69
11.530 12.270 40.00 7.00 10.00 10.6912.680 13.490 40.00 - 7.00 - 10.00 - - _ 10.6911.530 12.270 40.00 - 7.00 - 10.00 - - - 10.69
9.830 10.460 40.00 7.00 10.00 10.699.670 10.290 40.00 - 7.00 - 10.00 - - - 10.69
11.750 12.500 40.00 - 7.00 - 10.00 - - -■ 10.6910.250 10.350 40.00 .850 - 1.250 - 6 1.000 - .050 _10.000 10.900 40.00 .150 - .400 - - _ .170 _10.850 10.850 40.00 .750 - .100 - - 10.00 .417 -
, 10.030 10.730 35.00 .760 _ 1.500 _ _ _ .6209.400 9.850 35.00 .700 - .550 - .300 - _ _
10.000 10.450 35.00 .700 - .550 - .300 - - _- 10.600 40.00 .800 - 1.200 - - - .050 _
. 10.490 11.250 40.00 - 7.00 - 9.00 - 10.00 _ 1.5010.703 11.550 40.00 .650 - .950 - 6 1.000 - .070 -
. 10.350 11.000 35.00 .920 - .750 - 6 .500 - .020 _
. 10.625 11.575 40.00 .650 - 1.000 - .850 - .225 -
. 10.820 8 10.820 40.00 - 7.00 - 23.00 - 10.00 .020 1.00
. 11.070 11.820 35.00 .800 - 1.000 - - - - _
. 11.000 8 11.000 35.00 .290 4.00 .060 4.00 - 8.00 .090 _
. 10.350 11.000 35.00 .920 - .750 - 6 .500 - .020 -
. 10.820 8 10.820 40.00 - 7.00 - 23.00 - 10.00 .020 1.008.750 $9,150 40.00 .850 2.100 .050
7.500 8.000 35.00 .600 - .600 - - - .020 -
See footnotes at end of table.
1 0 8
Digitized for FRASER http://fraser.stlouisfed.org/ Federal Reserve Bank of St. Louis

(Union hourly wage rates, July 1, 1976, and wage rates, straight-time weekly hours, and employer insurance, pension, vacation, and other contributions to funds in the building trades, July 1, 1977)
Table 20. Wage rates, hours, and employer contributions for selected benefits: Selected cities—Continued
July 1, 1976 July 1, 1977
City and job classificationHours
perweek2
Employer contributions for selected benefits3
Rate per hour1
Rate per hour1 Insurance4 Pension Vacation Other5
Dollars Percent Dollars Percent Dollars Percent Dollars Percent
Newark, N.J. — Continued
Building construction — Continued
Helpers and laborers — Continued
Building laborers:Agreement A ............................ $7,500 $8,000 35.00 0.700 0.700 0.020Agreement B ............................ 7.500 8.000 35.00 .600 - .600 - - - .020 -Agreement C ............................ 7.500 8.000 35.00 .550 - .850 - - - .020 -
Elevator constructors’ helpers........................................ 8.070 8.230 35.00 .745 1.703 _ _ 4.00 .490 .
Mosaic and terrazzo workers’ he lpers ................................ 8.840 9.140 35.00 .760 _ 1.500 _ . . .610Grinders...................................... 8.990 9.290 35.00 .760 - 1.500 - - - .610 -
Agreement B ............................ 7.500 8.000 35.00 .600 - .600 - - - .020 -Tile layers’ helpers...................... 8.450 9.000 40.00 .840 - .510 - - - .070 -
Highway and street construction
Journeymen
C arpenters..................................... 10.750 11.260 40.00 8.00 7.00M illw rights............................. 11.000 11.510 40.00 - 8.00 - 7.00 - - - -
Cement fin ishers...................... 8.600 8.950 40.00 .700 - 1.000 - - - .363 -Engineers— Power equip
ment operators:Heavy equipment:Shovels, cranes, draglines............................. 12.680 13.490 40.00 7.00 10.00
•
8.00Pile driving machines.......... 12.680 13.490 40.00 - 7.00 - 10.00 - - - 8.00Backhoes, concrete pavers................................. 12.680 13.490 40.00 _ 7.00 _ 10.00 _ _ 8.00
Medium equipment:Caisson hoists..................... 11.530 12.270 40.00 7.00 _ 10.00 _ _ 8.00Shaft ho ists......................... 11.530 12.270 40.00 - 7.00 - 10.00 - - - 8.00Excavating, carryall, Letourneau......................... 11.750 12.’500 40.00 _ 7.00 _ 10.00 _ _ _ 8.00
Light equipment:Small mixers, pumps........... 11.750 12.500 40.00 _ 7.00 _ 10.00 _ _ 8.00Front end loaders............... 10.800 11.490 40.00 - 7.00 - 10.00 - - - 8.00Conveyors, 125 and ove r.................................... 11.750 12.500 40.00 _ 7.00 _ 10.00 _ _ 8.00
Concrete pum ps................. 10.800 11.490 40.00 - 7.00 - 10.00 - - - 8.00
Helpers and laborers
Jack hammers, chipping hammers, pavement breakers, power buggies....... 8.200 8.550 40.00 .700 1.000 .363
Construction laborers, dumpmen, pitmen, flag- m en........................................ 7.650 8.000 40.00 .700 - 1.000 - - - .363 -
See footnotes at end of table.
109Digitized for FRASER http://fraser.stlouisfed.org/ Federal Reserve Bank of St. Louis

Table 20. Wage rates, hours, and employer contributions for selected benefits: Selected cities—Continued
(Union hourly wage rates, July 1, 1976, and wage rates, straight-time weekly hours, and employer insurance, pension, vacation, and other contributions to funds in the building trades, July 1, 1977)
July 1, 1976
July 1, 1977
City and job classification Hoursper
week2
Employer contributions for selected benefits3
Rate per hour1
Rate per hour1 Insurance4 Pension Vacation Other5
Dollars Percent Dollars Percent Dollars Percent Dollars Percent
Newark, N.J. —•Continued
Other heavy construction
Journeymen
Carpenters .................................... $10,750 $11,260 40.00 8.00 7.00Millwrights................................. 11.000 11.510 40.00 - 8.00 - 7.00 - - - -
Dock builders, pier carpenters, shorers, house movers, pile drivers and foundation workers............................ 10.920 11.450 40.00 1.400 1.780 0.760 0.040
Cement finishers......................... 8.600 8.950 40.00 .700 - 1.000 - - - .363 -Engineer— Power equip
ment operators:Heavy equipment:Power shovels, cranes......... 12.680 13.490 40.00 7.00 10.00 8.00Power cranes, 140 ft............. 14.390 15.310 40.00 - 7.00 - 10.00 - - - 8.00Trenching machines, paving m ixers........................ 12.680 13.490 40.00 _ 7.00 _ 10.00 _ _ 8.00
Medium equipment:Hoists (1 or 2 drum with more than one generator)............................... 11.530 12.270 40.00 7.00 10.00 8.00
Central power plants (steel erection) ..................... 12.680 13.490 40.00 _ 7.00 _ 10.00 _ _ _ 8.00
Concrete power hoists......... 11.530 12.270 40.00 - 7.00 - 10.00 - - - 8.00Light equipment:Air compressors, single pumps......................... 10.800 11.490 40.00 7.00 10.00 8.00
Small m ixers........................... 9.670 10.290 40.00 - 7.00 - 10.00 - - - 8.00Concrete pum ps.................... 11.750 12.500 40.00 - 7.00 - 10.00 - - - 8.00
Helpers and laborers
Jackhammers, chipping hammers, pavement breakers, power buggies........ 8.200 8.550 40.00 .700 1.000 .363
Construction laborers, dumpmen, pitmen, flagmen .............................................. 7.650 8.000 40.00 .700 - 1.000 _ _ _ .363 -
New Bedford, Mass.
Building construction
Journeymen
Asbestos workers ....................... 8.920 9.280 35.00 1.000 1.180 6 1.000Boilermakers................................. 10.680 11.300 40.00 .950 - - 10.00 - - - -
Bricklayers..................................... 10.250 10.150 40.00 1.000 - .900 - - - .090 -Carpenters .................................... 9.300 9.600 40.00 .600 - 1.000 - - - - -Cement finishers......................... 10.250 10.150 40.00 1.000 - .900 - - - .090 -
Electricians.................................... 9.600 9.600 40.00 .090 - .085 3.00 - 6 4.00 - 1.00Elevator constructors.................. 10.665 11.445 40.00 .545 .350 ” 6.00 .284 -
See footnotes at end of table.
110
Digitized for FRASER http://fraser.stlouisfed.org/ Federal Reserve Bank of St. Louis
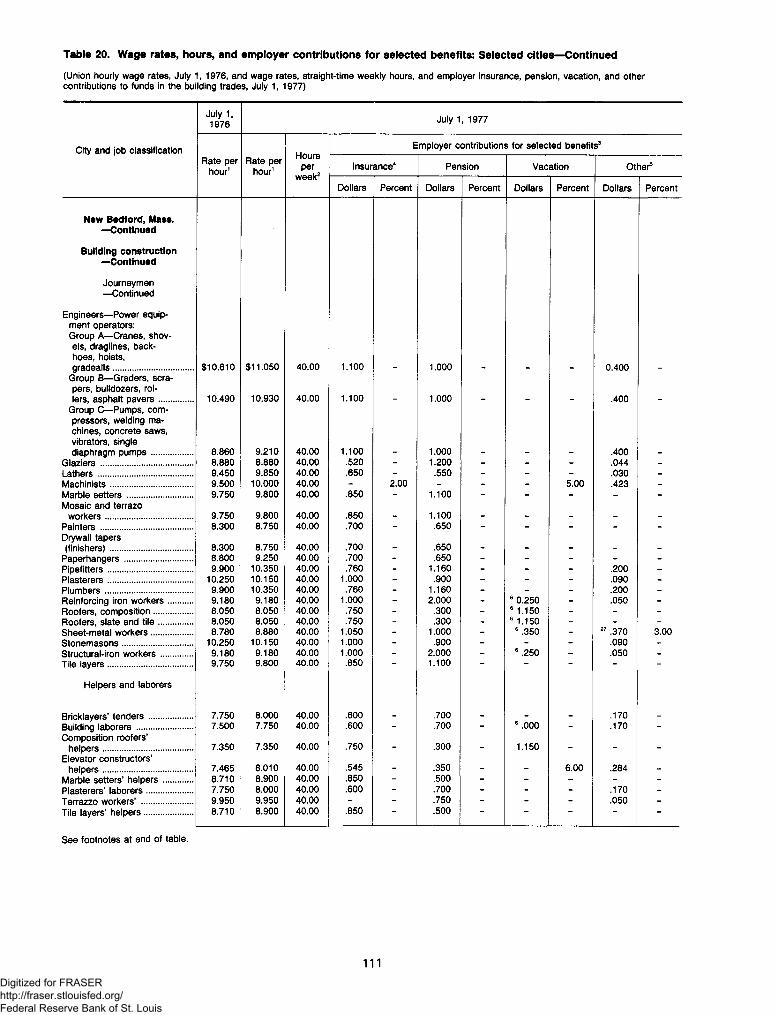
Table 20. Wage rates, hours, and employer contributions for selected benefits: Selected cities—Continued
(Union hourly wage rates, July 1, 1976, and wage rates, straight-time weekly hours, and employer insurance, pension, vacation, and othercontributions to funds in the building trades, July 1, 1977)
July 1, 1976 July 1, 1977
Rate per hour1
Rate per hour1
Hoursper
week2
Employer contributions for selected benefits3
Insurance4 Pension Vacation Other5
Dollars Percent Dollars Percent Dollars Percent Dollars Percent
$10,610 $11,050 40.00 1.100 1.000 0.400
10.490 10.930 40.00 1.100 - 1.000 - - - .400 -
8.860 9.210 40.00 1.100 1.000 .4008.880 8.880 40.00 .520 - 1.200 - - - .044 -9.450 9.850 40.00 .650 - .550 - - - .030 -9.500 10.000 40.00 - 2.00 - - - 5.00 .423 -9.750 9.800 40.00 .850 - 1.100 - - - - -
9.750 9.800 40.00 .850 _ 1.100 _ _ _ _ _8.300 8.750 40.00 .700 - .650 - - - - -
8.300 8.750 40.00 .700 _ .650 _ _ _ _8.800 9.250 40.00 .700 - .650 - - - - -9.900 10.350 40.00 .760 - 1.160 - - - .200
. 10.250 10.150 40.00 1.000 - .900 - - - .090 -9.900 10.350 40.00 .760 - 1.160 - - - .200 -9.180 9.180 40.00 1.000 - 2.000 - 6 0.250 - .050 -8.050 8.050 40.00 .750 - .300 - 6 1.150 - - -8.050 8.050 40.00 .750 - .300 - 6 1.150 - - -8.780 8.880 40.00 1.050 - 1.000 - 6 .350 - 27 .370 3.00
. 10.250 10.150 40.00 1.000 - .900 - - - .090 -9.180 9.180 40.00 1.000 - 2.000 - 6 .250 - .050 _
9.750 9.800 40.00 .850 1.100
7.750 8.000 40.00 .600 .700 .1707.500 7.750 40.00 .600 - .700 - 6 .000 - .170 -
7.350 7.350 40.00 .750 - .300 - 1.150 - - -
7.465 8.010 40.00 .545 _ .350 _ _ 6.00 .284 _8.710 8.900 40.00 .850 - .500 - - - - -
7.750 8.000 40.00 .600 - .700 - - - .170 -
9.950 9.950 40.00 - - .750 - - - .050 -
8.710 8.900 40.00 .850 - .500 - - - - -
City and job classification
New Bedford, Mass. —Continued
Building construction —Continued
Journeymen— Continued
Engineers— Power equipment operators:Group A— Cranes, shovels, draglines, back- hoes, hoists,gradealls...............................
Group B— Graders, scrapers, bulldozers, rollers, asphalt p a vers ..........
Group C— Pumps, compressors, welding machines, concrete saws, vibrators, singlediaphragm pu m p s.............
G la z ie rs ....................................Lathers .....................................Machinists................................Marble setters ........................Mosaic and terrazo
w orkers..................................P ain ters ....................................Drywall tapers(finishers)................................
Paperhangers.........................P ipefitters.................................P lasterers.................................P lum bers..................................Reinforcing iron w orkers......Roofers, composition............Roofers, slate and t i le ..........Sheet-metal workers.............Stonem asons...........................Structural-iron w orkers .........Tile layers.................................
Helpers and laborers
Bricklayers’ te n d e rs ...................Building laborers ........................Composition roofers’
helpers........................................Elevator constructors’
helpers........................................Marble setters’ h e lp e rs ............Plasterers’ laborers....................Terrazzo workers’ ......................Tile layers’ helpers.....................
See footnotes at end of table.
111
Digitized for FRASER http://fraser.stlouisfed.org/ Federal Reserve Bank of St. Louis

(Union hourly wage rates, July 1, 1976, and wage rates, straight-time weekly hours, and employer insurance, pension, vacation, and other contributions to funds in the building trades, July 1, 1977)
Table 20. Wage rates, hours, and employer contributions for selected benefits: Selected cities—Continued
July 1, 1976 July 1, 1977
City and job classification Hoursper
week2
Employer contributions for selected benefits3
Rate per hour1
Rate per hour1 Insurance4 Pension Vacation Other5
Dollars Percent Dollars Percent Dollars Percent Dollars Percent
New Bedford, Mass. —Continued
Highway and street construction
Journeymen
Engineers— Power equipment operators:Group A— Cranes, power shovels, draglines, backhoes, shaft hoists, gradealls...................... $10,610 $11,050 40.00 1.100 1.000 0.400
Group B— Graders, scrapers, bulldozers, rollers, asphalt pavers......................................... 10.490 10.930 40.00 1.100 1.000 .400
Group C— Pumps, compressors, welding machines, concrete m ixers......................................... 8.860 9.210 40.00 1.100 1.000 .400
Helpers and laborers
Construction laborers................. 7.500 7.750 40.00 .600 .700 .180
Other heavy construction
Journeymen
Engineers— Power equipment operators:Group A— Cranes, power shovels, draglines, backhoes, shaft hoists, gradealls...................... 10.610 11.050 40.00 1.100 1.000 .400
Group B— Graders, scrapers, bulldozers, rollers, asphalt pavers......................................... 10.490 10.930 40.00 1.100 1.000 .400
Group C— Pumps, compressors, welding machines, concrete m ixers......................................... 8.860 9.210 40.00 1.100 - 1.000 - - - .400 -
See footnotes at end of table.
112
Digitized for FRASER http://fraser.stlouisfed.org/ Federal Reserve Bank of St. Louis

(Union hourly wage rates, July 1, 1976, and wage rates, straight-time weekly hours, and employer insurance, pension, vacation, and other contributions to funds in the building trades, July 1, 1977)
Table 20. Wage rates, hours, and employer contributions for selected benefits: Selected cities—Continued
July 1, 1976 July 1, 1977
City and job classificationHours
perweek2
Employer contributions for selected benefits3
Rate per hour1
Rate per hour1 Insurance4 Pension Vacation Other5
Dollars Percent Dollars Percent Dollars Percent Dollars Percent
New Haven, Conn.
Building construction
Journeymen
Asbestos workers(m echanics).............................. $9,740 $10,840 35.00 0.650 - 0.960 - 6 0.600 - - -
Bricklayers..................................... 9.550 9.750 40.00 .750 - .500 - - - - -Pointers, caulkers andc leaners................................... 9.550 9.750 40.00 .750 - .500 - - - - _
Carpenters.................................... 9.650 9.800 “ 40.00 .700 - .450 - - - .112 -Dock builders............................ 9.400 9.550 28 40.00 .700 - .450 - - - .112 -Floor layers............................... 9.650 9.800 28 40.00 .700 - .450 - - - .112 -
Cement finshers........................... 9.550 9.750 40.00 .750 - .500 - - - - -Electricians (inside
w irers).......................................... 9.457 9.739 36.00 1.000 - .400 3.00 - - - 29 7.25Elevator constructors.................. 9.845 9.845 40.00 .545 - .350 - - 6.00 0.247 -Engineers— Power equip
ment operators:Heavy equipment:
Cranes, s te e l.......................... 10.900 8 10.900 40.00 .450 - .700 - - - .574 -S hovels .................................... 10.800 8 10.800 40.00 .450 - .700 - - - .574 -Derricks.................................... 10.900 8 10.900 40.00 .450 - .700 - - - .574 -
Medium equipment:Pitman m achines................... 10.450 8 10.450 40.00 .450 - .700 - - - .574 -Compressors.......................... 9.350 8 9.350 40.00 .450 - .700 - - - .574 -Bulldozers................................ 10.200 8 10.200 40.00 .450 - .700 - - - .574 -
Light equipment:Wells points system s........... 9.350 8 9.350 40.00 .450 - .700 - - - .574 -Welding machines,s te e l......................................... 9.350 8 9.350 40.00 .450 - .700 - - - .574 -
Small concrete mixers(5 bags and o v e r).................. 10.150 10.150 40.00 .450 - .700 - - - .574 -
Lathers ........................................... 9.570 9.570 35.00 .650 - .450 - - - .030 -Marble s e tte rs .............................. 9.550 9.750 40.00 .750 - .500 - - - - -Mosaic and terrazzo
w orkers........................................ 9.550 9.750 40.00 .750 - .500 - - - - -Painters, ge n era l......................... 8.800 9.050 36.00 .500 - .600 - - - .020 -
Structural s te e l........................ 9.050 9.300 36.00 .500 - .600 - - - .020 -Bridges....................................... 12.000 12.450 40.00 .500 - .600 - - - .020 -H eig h t......................................... 9.800 10.050 36.00 .500 - .600 - - - .020 -Spraying .................................... 11.550 11.700 36.00 .500 - .600 - - - .020 -T a p e rs ........................................ 9.150 9.400 36.00 .500 - .600 - - - .020 -
Paperhangers............................... 9.300 9.550 36.00 .500 - .600 - - - .020 -Pipefitters...................................... 9.100 9.350 36.00 .750 - .700 - 6 .500 - 30.599 -P lasterers...................................... 9.550 9.750 40.00 .750 - .500 - - - - -P lum bers........................................ 9.100 9.350 36.00 .750 - .700 - 8 .500 - 30 .599 -Reinforcing iron w orkers........... 10.700 8 10.700 40.00 .750 - .950 - 6 .400 - .021 -Roofers, composition.................. 9.400 9.900 35.00 1.050 - .500 - 6 .250 - .119 -
Roofers, t i l e .................................. 9.650 10.150 35.00 1.050 - .500 - 6 .250 - .119 -
Pre-cast slabbers.................... 9.650 10.150 35.00 1.050 - .500 - 6 .250 - .119 -Sheet-metal workers................... 10.400 10.000 35.00 .700 - .860 - 6 .550 - .140 -Stonemasons................................ 9.550 9.750 40.00 .750 - .500 - - - - -Structural-iron workers:
Erectors and riggers.............. 10.700 8 10.700 40.00 .750 - .950 - 6 .400 - .021 -Finishers.................................... 10.700 8 10.700 40.00 .750 - .950 - 6 .400 - .021 -
Tile layers...................................... 9.550 9.750 40.00 .750 .500 ~ - - - -
See footnotes at end of table.
113Digitized for FRASER http://fraser.stlouisfed.org/ Federal Reserve Bank of St. Louis

Table 20. Wage rates, hours, and employer contributions for selected benefits: Selected cities—Continued
(Union hourly wage rates, July 1, 1976, and wage rates, straight-time weekly hours, and employer insurance, pension, vacation, and othercontributions to funds in the building trades, July 1, 1977)
City and job classification
July 1, 1976 July 1, 1977
Employer contributions for selected benefits3
Rate per hour1
Rate per hour1
noursper
week2Insurance4 Pension Vacation Other5
Dollars Percent Dollars Percent Dollars Percent Dollars Percent
New Haven, Conn. — Continued
Building construction — Continued
Helpers and laborers
Bricklayers’ te n d e rs .................... $7,750 $8,000 40.00 0.500 _ 0.550 _ _ . 0.150 .
Building laborers .........................Elevator constructors’
7.500 7.750 40.00 .500 ~ .550 - - .150 -
helpers........................................ 6.890 6.890 40.00 .545 - .350 - - 6.00 .247 -Marble setters’ helpers ............. 8.650 8.750 35.00 .500 - .500 - - - - -
Plasterers’ laborers.....................Terrazzo workers’
7.750 8.000 40.00 .500 ~ .550 - - - .150 -
helpers........................................Terrazzo machine oper
8.650 8.750 35.00 .500 .500 - - - - -
ators .......................................... 8.900 9.000 35.00 .500 - .500 - - - - -Tile layers’ helpers......................
Highway and street construction
8.650 8.750 35.00 .500 .500
Journeymen
Carpenters .................................... 9.150 9.300 40.00 .700 _ .450 _ 6 0.250 _ .110 _Cement finishers.........................
New Orleans, La.
Building construction
8.750 9.000 40.00 .500 .500
Journeymen
Asbestos workers ....................... 7.600 8.550 40.00 .500 _ 1.100 _ 6 .900 . _ .
Boilermaker................................... 9.000 10.000 40.00 .500 - 1.000 - - - - -Bricklayers.....................................
Cleaners, pointers,9.840 10.420 40.00 .350 .200 ~ .035
caulkers.................................. 9.840 10.420 40.00 .350 - .200 - - - .035 -Carpenters, ge n era l.................... 9.220 9.770 40.00 .450 - .300 - 6 .150 - - -
Millwrights................................. 9.560 10.150 40.00 .450 - .300 - 6 .160 - - -Piledrivers ................................. 9.320 9.860 40.00 .450 - .300 - 6 .160 - - -
Cement finishers.........................Drywall tapers
8.915 9.495 40.00 .450 .300 ~ 6 .150 ~
(finishers) .....................................Electricians (inside
7.775 8.575 40.00 .275‘ ' ‘ " — -
w irers ).......................................... 9.785 10.403 40.00 .350 - .300 3.00 - 6 5.00 - -Elevator constructors.................. 9.285 9.760 40.00 .545 _ .350 “ 6.00 .020 2.30
See footnotes at end of table.
114
Digitized for FRASER http://fraser.stlouisfed.org/ Federal Reserve Bank of St. Louis

Table 20. Wage rates, hours, and employer contributions for selected benefits: Selected cities—Continued
(Union hourly wage rates, July 1, 1976, and wage rates, straight-time weekly hours, and employer insurance, pension, vacation, and other contributions to funds in the building trades, July 1, 1977)
July 1, 1976 July 1, 1977
City and job classificationHours
perweek2
Employer contributions for selected benefits3
Rate per hour1
Rate per hour1 Insurance4 Pension Vacation Other5
Dollars Percent Dollars Percent Dollars Percent Dollars Percent
New Orleans, La. —Continued
Building construction —Continued
Journeymen— Continued
Engineers— Power equipment operators:Heavy equipment—Cranes, derricks, draglines, scrapers, hoists (2 drums), bulldozers (d-6 and larger), mixers (over 16 S), Shovels, trenching machines, piledrivers................................ $9,360 $9,650 40.00 0.650 0.480
Light equipment— Air compressors, pumps (over 3 in.), mixers (16S and smaller), finishing machines, bulldozers (smaller than D -6 ................................... 7.990 8.220 40.00 .650 .480Oilers (drivers)........................ 7.400 7.560 40.00 .650 - .480 - - - - -O ile rs ......................................... 7.020 7.170 40.00 .650 - .480 - - - - -
G la z iers .......................................... 8.750 9.500 40.00 .170 - .300 - 6 0.125 - - -La th e rs ........................................... 8.230 8.830 40.00 .200 - .300 - 6 .250 - 0.080 -Machinists...................................... 8.080 8.870 40.00 .370 - .150 - - - - -Marble s e tte rs .............................. 9.840 10.420 40.00 .350 - .200 - - - .035 -Mosaic and terrazzo
w orkers........................................ 8.600 9.650 40.00 .250 M O OPainters, com m ercial.................. 7.775 8.575 40.00 .275 - - - - - - -
Steel or swing spray............... 8.150 8.950 40.00 .275 - - - - - - -S p ra y .......................................... 8.150 8.950 40.00 .275 - - - - - - -Residential................................ 7.775 8.575 40.00 .275 - - - - - - -Industrial..................................... 9.025 9.825 40.00 .275 - - - - - - -
Paperhangers............................... 7.750 8.575 40.00 .275 - - - - - - -Pipefitters....................................... 9.800 10.100 40.00 .450 - .750 - 6 .500 - .140 -P lasterers....................................... 8.100 8.530 40.00 .400 - .200 - 6 .550 - .080 -P lum bers........................................ 9.800 10.100 40.00 .450 - .750 - 6 .500 - .140 -Roofers, composition.................. 7.960 8.060 40.00 .550 - .650 - .200 - .850 -Roofers, slate and tile,
damp and waterproofers........ 7.960 8.060 40.00 .550 _ .650 .200 _ .850 _
Sheet-metal workers................... 8.810 9.660 40.00 .400 - .700 - 6 .500 - .650 3.00Stonemasons................................ 9.840 10.420 40.00 .350 - .200 - - - .035 -Structural-iron w o rkers .............. 9.610 9.710 40.00 .630 - .350 - 6 .450 - .040 -Tile layers....................................... 8.600 9.650 40.00 .250 - - - 6 .100 - - -
Helpers and laborers
Bricklayers’ te n d e rs .................... 6.890 7.410 40.00 .150 .270 .050Mortar m ixers ........................... 6.990 7.510 40.00 .150 - .270 - - - .050 -
Building laborers......................... 6.740 7.250 40.00 .150 - .270 - - - .050 -Elevator constructors’
helpers......................................... 6.500 6.830 40.00 .545 _ .350 _ _ 6.00 .020 2.30Marble setters’ h e lpers ............. 6.550 6.950 40.00 .250 - - - .100 - .150 -Plasterers’ laborers..................... 6.880 7.370 40.00 .150 - .270 - - - .050 -
Mortar mixers (machine or h a n d )................................... 6.980 7.470 40.00 .150 - .270 - - - .050 -
See footnotes at end of table.
115Digitized for FRASER http://fraser.stlouisfed.org/ Federal Reserve Bank of St. Louis

Table 20. Wage rates, hours, and employer contributions for selected benefits: Selected cities—Continued
(Union hourly wage rates, July 1, 1976, and wage rates, straight-time weekly hours, and employer insurance, pension, vacation, and other contributions to funds in the building trades, July 1, 1977)
July 1, 1976 July 1, 1977
City and job classification Hoursper
week2
Employer contributions for selected benefits3
Rate per hour1
Rate per hour1 Insurance4 Pension Vacation Other5
Dollars Percent Dollars Percent Dollars Percent Dollars Percent
New Orleans, La. — Continued
Building construction — Continued
Helpers and laborers — Continued
Terrazzo workers’helpers......................................... $6,550 $6,950 40.00 0.250 - - - 0.100 - 0.150 -
Base m achines........................ 6.950 7.300 40.00 .250 - - - .100 - .150 -Floor machines ....................... 6.700 7.150 40.00 .250 - - - .100 - .150 -Buffers........................................ 6.600 7.000 40.00 .250 - - - .100 - .150 -
Tile layers’ helpers......................
Highway and street construction
6.550 6.950 40.00 .250 .100 .150
Journeymen
Carpenters .................................... 9.220 9.760 40.00 .450 _ 0.300 _ 6 .160 _ _ _
Cement finishers.........................Engineers— Power equip
ment operators:
8.450 9.550 40.00 .450 .300 6 .150
Cranes over 60 tons.............. 9.130 9.410 40.00 .650 - .480 - - - - -Cranes, 125 ft. b o o m ............ 9.130 9.410 40.00 .650 - .480 - - - - -Cranes, 175 ft. b o o m ............ 9.380 9.660 40.00 .650 - .480 - - - - -Heavy duty operators............ 8.880 9.160 40.00 .650 - .480 - - - - -Medium duty operators......... 7.790 8.030 40.00 .650 - .480 - - - - -Light duty operators ..............Mechanic helpers,
7.450 7.680 40.00 .650 .480 — - •
batch plant operators........... 6.780 6.930 40.00 .650 - .480 - - - - -Oilers .......................................... 6.480 6.620 40.00 .650 - .480 - - - - -F irem en.....................................Operating steam
7.790 8.030 40.00 .650 ~ .480 “ ~ ~ -
valves......................................Oilers on cranes using
8.040 8.230 40.00 .650 ” .480 - ~
steam to drive piles.............. 6.730 6.870 40.00 .650 - .480 - - - - -
Structural iron w orkers.............. 9.270 9.270 40.00 6 .300 - 6 .350 - - - - -
Helpers and laborers
Construction laborers................. 5.450 5.450 40.00 .150 _ .200 _ _ _ .050 _
R ake rs ........................................ 5.550 5.550 40.00 .150 - .200 - - - .050 -Formsetters............................... 5.730 5.730 40.00 .150 - .200 - - - .050 -
Powdermen...............................
O ther heavy construction
Journeymen
6.250 6.250 40.00 .150 .200 .050
Carpenters.................................... 9.220 9.760 40.00 .450 _ , .300 _ 6 .160 _ _ _
Cement finishers.........................Engineers— Power equip
ment operators:
8.450 9.550 40.00 .450 .300 6 .150
Cranes over 60 to ns.............. 9.430 9.720 40.00 .650 .480 ~ — —
See footnotes at end of table.
116Digitized for FRASER http://fraser.stlouisfed.org/ Federal Reserve Bank of St. Louis

Table 20. Wage rates, hours, and employer contributions for selected benefits: Selected cities—Continued
(Union hourly wage rates, July 1, 1976, and wage rates, straight-time weekly hours, and employer insurance, pension, vacation, and other contributions to funds in the building trades, July 1, 1977)
July 1, 1976 July 1, 1977
City and job classificationHours
perweek2
Employer contributions for selected benefits3
Rate per hour1
Rate per hour1 Insurance4 Pension Vacation Other5
Dollars Percent Dollars Percent Dollars Percent Dollars Percent
New Orleans, La.— Continued
Other heavy construction — Continued
Journeymen— Continued
Cranes, 125 ft. b o o m ............ $9,430 $9,720 40.00 0.650 _ 0.480 _ _ _ _ _Cranes, 175 ft. b o o m ............ 9.680 9.970 40.00 .650 - .480 - _ _ _ _Heavy duty operators............ 9.180 9.470 40.00 .650 - .480 - - - - -Medium duty operators......... 8.120 8.370 40.00 .650 - .480 - - - - -Light duty operators.............. 7.750 7.990 40.00 .650 - .480 - - - - -Mechanic helpers,batch plant operators........... 7.080 7.240 40.00 .650 - .480 - - - - -
O ile rs .......................................... 6.780 6.930 40.00 .650 - .480 - - - - _F irem en...................................... 8.150 8.290 40.00 .650 - .480 - - _ _ _Operating steamvalves....................................... 8.400 8.540 40.00 .650 - .480 - - - - -
Oilers on cranes usingsteam to drive piles.............. 7.030 7.180 40.00 .650 - .480 - - - - _
Structural iron w orkers.............. 9.520 9.520 40.00 6 .300 - 6 .350 - - - - -
Helpers and laborers
Construction laborers................. 6.050 6.050 40.00 .150 . .200 . 0.050R ake rs ........................................ 6.250 6.250 40.00 .150 - .200 - - - .050 -Formsetters............................... 6.665 6.665 40.00 .150 - .200 - - - .050 _Powdermen............................... 7.000 7.000 40.00 .150 - .200 - - - .050 -
New York, N.Y.
Building construction
Journeymen
Asbestos workers ....................... 10.450 11.300 35.00 _ 6.20 _ 16.50 _ 12.00 .020 .
Boilermakers................................. 11.520 12.330 35.00 - 5.00 - 15.00 - 7.00 - -Bricklayers..................................... 10.690 11.040 35.00 1.480 - 3.380 - 0.300 - .060 -Carpenters.................................... 10.920 11.450 35.00 1.400 - 1.780 - .700 - .040 -
Millwrights................................. 10.920 11.450 35.00 1.400 - 1.780 - .700 - .040 -
Wharf and bridge.................... 10.920 11.450 40.00 1.400 - 1.780 - .760 - .040 -Cement finishers......................... 9.500 9.700 35.00 1.740 - 1.190 - 2.000 - .030 -Electricians (inside
w irers)......................................... 12.250 8 12.250 35.00 - 4.60 .571 5.40 - 5.70 .853 0.50Elevator constructors.................. 10.760 11.110 35.00 .745 - 1.703 - - 4.00 .490 -Engineers— Power equipment operators:
Agreement A:Cranes and 2-drumderricks (s te e l)....................... 11.660 12.640 35.00 .930 - 1.950 - .700 - .020 4.23
Double drum h o is ts ................ 10.360 11.120 35.00 .930 - 1.950 - .700 - .020 4.23Cranes (structurals te e l) ......................................... 11.740 12.640 35.00 .930 - 1.950 - .700 - .020 4.23
Shovels...................................... 11.660 12.490 35.00 .930 - 1.950 - .700 - .020 4.23Piledrivers................................. 11.110 11.910 35.00 .930 - 1.950 - .700 - .020 4.23H o is ts ......................................... 11.010 11.740 35.00 .930 - 1.950 - .700 - .020 4.23Welding machines................... 11.010 11.740 35.00 .930 - 1.950 - .700 - .020 4.23Com pressors........................... 11.010 11.740 35.00 .930 — 1.950 .700 .020 4.23
See footnotes at end of table.
117Digitized for FRASER http://fraser.stlouisfed.org/ Federal Reserve Bank of St. Louis

Table 20. Wage rates, hours, and employer contributions for selected benefits: Selected cities—Continued
(Union hourly wage rates, July 1, 1976, and wage rates, straight-time weekly hours, and employer insurance, pension, vacation, and other contributions to funds in the building trades, July 1, 1977)
July 1, 1976
July 1,, 1977
City and job classificationHours
perweek2
Employer contributions for selected benefits3
Rate per hour1
Rate per hour1
Insurance4 Pension Vacation Other5
Dollars Percent Dollars Percent Dollars Percent Dollars Percent
New York, N.Y.—Continued
Building construction —Continued
Journeymen— Continued
Concrete buckets (stone derrick)........................ $11,440 $12,170 35.00 0.930 1.950 0.700 .020 4.23
Cranes (digging bucket)...................................... 11.330 12.140 35.00 .930 _ 1.950 . .700 .020 4.23
Concrete mixers, power houses ..................................... 10.590 11.120 35.00 .930 _ 1.950 . .700 .020 4.23
Portable compressors,3 or more in ba tte ry ............. 10.360 11.120 35.00 .930 . 1.950 . .700 .020 4.23
Concrete pum ps...................... + 10.360 11.120 35.00 .930 - 1.950 - .700 - .020 4.23Agreement B:Scrapers, tournapulls, motor patrols, bulldozers ....................................... 11.780 12.070 40.00 .900 .750 .700 .020 4.23
Tractors, locomotives (10 tons and under), road finishing machines, mixers under 21e ............................................ 11.580 11.860 40.00 .900 .750 .700 .020 4.23
O ile rs .......................................... 11.130 11.380 40.00 .900 - .750 - .700 - .020 4.23Oilers (steel e re c .) .................. 11.270 11.590 40.00 .900 - .750 - .700 - .020 4.23F irem en..................................... 11.580 11.860 40.00 .900 - .750 - .700 - .020 4.23Maintenance engineers......... 11.780 12.070 40.00 .900 - .750 - .700 - .020 4.23
Steel e rection ....................... 11.900 12.250 40.00 .900 - .750 - .700 - .020 4.23Cherrypickers 20 tons and over, loaders 6 cu yds and o v e r..................... 12.070 12.370 40.00 .900 .750 .700 .020 4.23
Party ch ie f................................. 10.630 10.860 35.00 .900 - .750 - .700 - .020 4.23Transitm en................................ 9.210 9.360 35.00 .900 - .750 - .700 - .020 4.23Rodm en..................................... 6.880 6.910 35.00 .900 - .750 - .700 - .020 4.23
Glaziers .......................................... 10.300 11.200 35.00 .660 - 1.660 - .670 - - -Lathers:
Wood:Bronx, Manhattan, and Staten Island......................... 9.400 9.400 35.00 .250 0.050 8.00
Brooklyn................................... 10.100 10.410 35.00 1.325 - 1.985 - .750 - .070 -
Wood, wire and metal: Nassau-Suffolk....................... 11.340 11.340 35.00 .940 _ .200 _ . .100
M e ta l........................................... 10.100 10.410 35.00 1.325 - 1.985 - .750 - .070 -Marble setters and cu tte rs ........................................... 8.550 8 9.000 35.00 .610 _ 1.260 _ 1.000 _ .790
Mosaic and terrazzo w orkers........................................ 10.030 10.730 35.00 .760 1.500 _ . .620
P ain ters .......................................... 8.730 9.370 35.00 - 9.00 .714 7.00 - 3.00 - -Swing s ta g e .............................. 10.600 11.380 35.00 - 9.00 .714 7.00 - 3.00 - -Decorators and grain- e rs .............................................. 10.780 11.370 35.00 _ 9.00 .714 7.00 3.00
Structural s te e l........................ 10.460 11.300 35.00 - 9.00 - 14.00 - - .350 -Pipefitters....................................... 10.070 10.970 35.00 .750 - 1.120 - .860 - 2.020 -
Plasterers:Astoria, Brooklyn,Great Neck, Jamaica,Long Island.............................. 9.550 9.850 35.00 1.450 - - 1.450 - - -
See footnotes at end of table.
118
Digitized for FRASER http://fraser.stlouisfed.org/ Federal Reserve Bank of St. Louis

(Union hourly wage rates, July 1, 1976, and wage rates, straight-time weekly hours, and employer insurance, pension, vacation, and other contributions to funds in the building trades, July 1, 1977)
Table 20. Wage rates, hours, and employer contributions for selected benefits: Selected cities—Continued
July 1, 1976 July 1, 1977
City and job classificationHours
perweek2
Employer contributions for selected benefits3
Rate per hour1
Rate per hour1 Insurance4 Pension Vacation Other5
Dollars Percent Dollars Percent Dollars Percent Dollars Percent
New York, N.Y.—Continued
Building construction —Continued
Journeymen— Continued
Bronx, Manhattan and Richmond ................................ $9,250 $9,300 35.00 1.100 1.540 0.900 0.140
Flushing..................................... 9.100 9.850 35.00 1.400 - - - 1.400 - .140 -Plum bers........................................ 10.100 10.100 35.00 2.970 - 0 0 .720 - 2.040 -
Richmond.................................. 8 9.950 10.630 35.00 1.100 - 1.580 - 1.050 - .899 -Brooklyn.................................... 9.910 10.100 35.00 1.040 - 1.790 - .890 - 1.407 -
Reinforcing iron w orkers........... 10.100 10.410 35.00 1.325 - 1.985 - .750 - .070 -Roofers, composition.................. 9.350 9.650 35.00 1.290 - 2.650 - 1.150 - - -Roofers, slate and t i le ............... 8 9.700 10.700 35.00 .500 - 1.400 - 1.600 - - -
Brooklyn, Queens and Long Island.............................. 10.820 11.070 35.00 .550 . 2.000 1.400
Sheet-metal workers................... 11.670 12.070 35.00 1.410 3.00 .890 3.00 .050 3.00 .350 -Stonemasons................................ 10.250 11.000 35.00 .500 - 1.000 - - - - -
Stonesetters (New York and Long Island).................... 10.520 11.370 35.00 1.090 _ 1.960 _ 1.500 _ .600 _
Structural-iron workers: ManhattanS.I., W estchester..................... 11.400 11.500 40.00 1.450 2.700 1.350 .170Brooklyn, Queens Nassau and Suffolk.............. 10.900 11.500 40.00 1.450 . 2.700 1.500 .110
Finishers..................................... 10.240 10.330 35.00 1.110 - 2.530 - .780 - .150 -Tile layers.....:................................ 8.750 9.150 40.00 .850 - 2.100 - - - .050 -
Helpers and laborers
Bricklayers’ te nde rs .................... 9.000 9.400 35.00 .687 1.495 .010Building laborers ......................... 8.450 9.050 40.00 1.350 - 1.480 - - - .040 -Concrete laborers....................... 7.700 8.200 35.00 .802 - 1.352 - 1.200 - .040 -
Elevator constructors,, helpers......................................... 8.070 8.230 35.00 .745 _ 1.703 _ _ 4.00 .490 _
Marble setters’ h e lpers ............. 8.030 8 8.300 35.00 .610 - 1.290 - 1.000 - .550 -Plasterers’ laborers..................... 8.250 8.350 35.00 .900 - 1.400 - .350 - - -
Brooklyn.................................... 8.200 8.700 40.00 2.000 - - - .800 - .800 -Queens, Nassau and Suffolk C ounties.................... 8.750 9.350 40.00 1.400 _ 1.150 _ .150 _
Roofers’ helpers.......................... 8 7.900 8.300 35.00 .500 - 1.000 - 1.200 - - -Plumbers’ laborers...................... 8.450 9.050 40.00 1.350 - 1.480 - - - .040 -Terrazzo workers’ ....................... 8.840 9.140 35.00 .760 - 1.500 - - - .610 -
Grinders..................................... 8.990 9.290 35.00 .760 - 1.500 - - - .610 -
Tile layers’ helpers...................... 7.860 8.210 40.00 .680 - .770 - .500 - .050 -
Highway and street construction
Journeymen
Carpenters.................................... 10.920 11.450 40.00 1.400 1.780 .700 .040Piledrivers ................................. 10.920 11.450 40.00 1.400 - 1.780 - .760 - .040 4.23Tim berm en................................ 9.930 10.410 40.00 1.400 1.780 ~ .700 ~ .040 4.23
See footnotes at end of table.
119
Digitized for FRASER http://fraser.stlouisfed.org/ Federal Reserve Bank of St. Louis
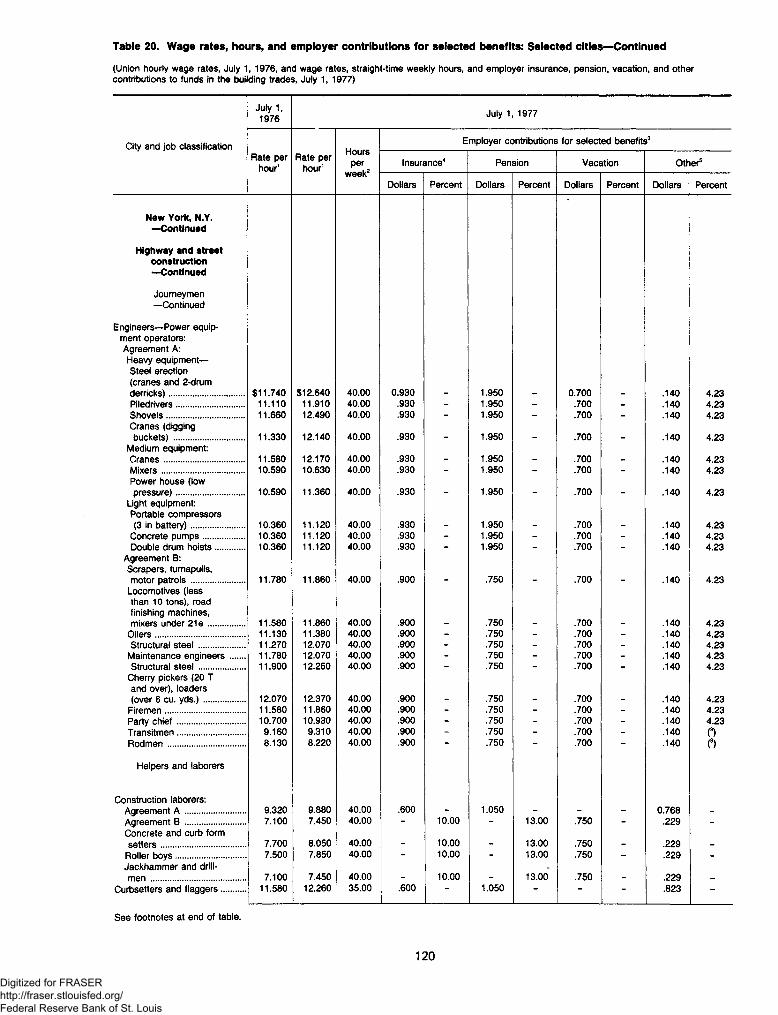
Table 20. Wage rates, hours, and employer contributions for selected benefits: Selected cities—Continued
(Union hourly wage rates, July 1, 1976, and wage rates, straight-time weekly hours, and employer insurance, pension, vacation, and other contributions to funds in the building trades, July 1, 1977)
July 1, 1976 July 1, 1977
City and job classification Hoursper
week2
Employer contributions for selected benefits3
Rate per hour1
Rate per hour1 Insurance4 Pension Vacation Other5
Dollars Percent Dollars Percent Dollars Percent Dollars Percent
New York, N.Y. —Continued
Highway and street construction —Continued
Journeymen— Continued
Engineers— Power equipment operators:Agreement A:Heavy equipment—Steel erection (cranes and 2-drum derricks).......................... $11,740 $12,640 40.00 0.930 1.950 0.700 .140 4.23Piledrivers...................... 11.110 11.910 40.00 .930 - 1.950 - .700 - .140 4.23Shovels.......................... 11.660 12.490 40.00 .930 - 1.950 - .700 - .140 4.23Cranes (digging buckets) ........................ 11.330 12.140 40.00 .930 _ 1.950 . .700 .140 4.23
Medium equipment:Cranes........................... 11.580 12.170 40.00 .930 _ 1.950 . .700 . .140 4.23Mixers............................ 10.590 10.630 40.00 .930 - 1.950 - .700 - .140 4.23Power house (low pressure)....................... 10.590 11.360 40.00 .930 _ 1.950 _ .700 . .140 4.23
Light equipment:Portable compressors (3 in battery).................. 10.360 11.120 40.00 .930 1.950 .700 .140 4.23
Concrete pumps.............. 10.360 11.120 40.00 .930 - 1.950 - .700 - .140 4.23Double drum hoists.......... 10.360 11.120 40.00 .930 - 1.950 - .700 - .140 4.23
Agreement B:Scrapers, turnapulls, motor patrols.................. 11.780 11.860 40.00 .900 .750 .700 .140 4.23
Locomotives (less than 10 tons), road finishing machines, mixers under 21 e ............ 11.580 11.860 40.00 .900 .750 .700 .140 4.23
Oilers.............................. 11.130 11.380 40.00 .900 - .750 - .700 - .140 4.23Structural steel................ 11.270 12.070 40.00 .900 - .750 - .700 - .140 4.23
Maintenance engineers..... 11.780 12.070 40.00 .900 - .750 - .700 - .140 4.23Structural steel ................ 11.900 12.250 40.00 .900 - .750 - .700 - .140 4.23
Cherry pickers (20 T and over), loaders (over 6 cu. yds.).............. 12.070 12.370 40.00 .900 .750 .700 .140 4.23
Firemen........................... 11.580 11.860 40.00 .900 - .750 - .700 - .140 4.23Party chief....................... 10.700 10.930 40.00 .900 - .750 - .700 - .140 4.23Transitmen....................... 9.160 9.310 40.00 .900 - .750 - .700 - .140 ORodmen.......................... 8.130 8.220 40.00 .900 - .750 - .700 - .140 (9)
Helpers and laborers
Construction laborers: Agreement A ..................... 9.320 9.880 40.00 .600 1.050 0.768Agreement B ..................... 7.100 7.450 40.00 - 10.00 - 13.00 .750 - .229 -Concrete and curb form setters............................. 7.700 8.050 40.00 _ 10.00 _ 13.00 .750 . .229
Roller boys........................ 7.500 7.850 40.00 - 10.00 - 13.00 .750 - .229 -Jackhammer and drill- men ................................ 7.100 7.450 40.00 _ 10.00 _ 13.00 .750 . .229
Curbsetters and flaggers........ 11.580 12.260 35.00 .600 - 1.050 - - - .823 -
See footnotes at end of table.
120
Digitized for FRASER http://fraser.stlouisfed.org/ Federal Reserve Bank of St. Louis

Table 20. Wage rates, hours, and employer contributions for selected benefits: Selected cities—Continued
(Union hourly wage rates, July 1, 1976, and wage rates, straight-time weekly hours, and employer insurance, pension, vacation, and other contributions to funds in the building trades, July 1, 1977)
July 1, 1976 July 1, 1977
City and job classification Hoursper
week2
Employer contributions for selected benefits3Rate per
hour1Rate per
hour1 Insurance4 Pension Vacation Other5
Dollars Percent Dollars Percent Dollars Percent Dollars Percent
New York, N.Y. — Continued
Other heavy construction
Journeymen
Carpenters........................... $10,920 $11,450 40.00 1.400 1.780 0.700 0.040 4.23Dock builders, pier carpenters, shavers, house movers, pile- drivers, and foundation workers...................... 10.920 11.450 40.00 1.400 1.780 .760 .040 4.23Timbermen........................ 9.930 10.410 40.00 1.400 - 1.780 - .700 - .040 4.23
Engineers— Power equipment operators:Agreement A:Heavy equipment:Cranes and 2-drum derricks (steel)................. 11.740 12.640 40.00 .930 1.950 .700 .020 4.23
Piledrivers......................... 11.110 11.910 40.00 .930 - 1.950 - .700 - .020 4.23Shovels............................. 11.660 12.490 40.00 .930 - 1.950 - .700 - .020 4.23Cranes (digging buckets).......................... 11.330 12.140 40.00 .930 _ 1.950 _ .700 _ .020 4.23
Medium equipment:Cranes.............................. 11.580 12.120 40.00 .930 . 1.950 .700 .020 4.23Mixers............................... 10.590 10.630 40.00 .930 - 1.950 - .700 - .020 4.23Power houses (low pressure).......................... 10.590 11.360 40.00 .930 _ 1.950 .700 _ .020 4.23
Light equipment:Portable compressors (3 in battery..................... 10.360 11.120 40.00 .930 1.950 .700 .020 4.23
Concrete pumps................. 10.360 11.120 40.00 .930 - 1.950 - .700 - .020 4.23Double drum hoists............ 10.360 11.120 40.00 .930 - 1.950 - .700 - .020 4.23
Agreement B:Scrapers, tournapulls, motor patrols, bulldozers ............................. 11.780 11.860 40.00 .900 .750 .700 .020 4.23
Locomotives (less than 10 tons), road finishing machines, mixers under 21 e .................. 11.580 11.860 40.00 .900 .750 .700 .020 4.23
Oilers............................... 11.130 11.380 40.00 .900 - .750 - .700 - .020 4.23Structural steel................ 11.270 12.070 40.00 .900 - .750 - .700 - .020 4.23
Maintenance engineers....... 11.780 12.070 40.00 .900 - .750 - .700 - .020 4.23Structural steel............... 11.900 12.250 40.00 .900 - .750 - .700 - .020 4.23
Cherrypickers (20 tons and over), loaders (over 6 cu yds.)................. 12.070 12.370 40.00 .900 .750 .700 .020 4.23
Firemen............................ 11.580 11.860 40.00 .900 - .750 - .700 - .020 0Party chief......................... 10.700 10.930 40.00 .900 - .750 - .700 - .020 0Transitmen........................ 9.160 9.310 40.00 .900 - .750 - .700 - .020 0Rodmen....... .................... 8.130 8.220 40.00 .900 - .750 - .700 - .020 (9)
Helpers and laborers
General laborers:.................. 7.100 7.450 40.00 10.00 13.00 .750 .229Drill runners.......................... 8.810 9.250 40.00 1.020 - 1.740 - 6 1.750 - .040 -Drill runners’ helpers
and nippers........................ 7.290 7.640 40.00 1.020 - 1.740 - 6 1.750 - .040 -
See footnotes at end of table.
121Digitized for FRASER http://fraser.stlouisfed.org/ Federal Reserve Bank of St. Louis

Table 20. Wage rates, hours, and employer contributions for selected benefits: Selected cities—Continued
(Union hourly wage rates, July 1, 1976, and wage rates, straight-time weekly hours, and employer insurance, pension, vacation, and othercontributions to funds in the building trades, July 1, 1977)
July 1,1976 July 1, 1977
City and job classification
New York, N.Y. —Continued
Other heavy construction —Continued
Helpers and laborers — Continued
Jackhammer operators........Powder carriers..................Tunnel workers:
Compressed a ir...............Free a ir..........................
Top laborers......................
Norfolk, Va.
Building construction
Journeymen
Asbestos workers .........Boilermakers................Bricklayers....................Carpenters ...................
Millwrights................Cement finishers...........Electricians (inside
wirers)......................Elevator constructors.....Engineers— Power equip
ment operators:Air compressors over 125 cu. ft., one-drum hoists, mixers (165 or smaller), pumps,rollers.....................
Bulldozers, mixers (larger than 165),trench machines......
Cranes, derricks, piledrivers, hoists (2 drums or more),motor graders..........
Glaziers.......................Lathers ........................Marble setters ..............Mosaic and terrazzo
workers.....................Painters.......................
Steel ........................Over 74 fee t..........
Spray.......................Swing stage:
Under 75 fee t.........Over 40 feet ..........
Sand blasting of steel . Hand rollers 6 feet or over........................
Employer contributions for selected benefits3Rate per
hour1Rate per
hour1
noursper
week2Insurance4 Pension Vacation Other5
Dollars Percent Dollars Percent Dollars Percent Dollars Percent
$8,590 $9,020 40.00 1.020 1.740 6 1.750 0.0407.740 8.120 40.00 1.020 - 1.740 - 6 1.750 - .040 -
11.604 12.541 37.50 _ 6.00 .400 5.00 _ 10.00 1.020 _10.907 11.793 37.50 - 6.00 .400 5.00 - 10.00 1.020 _9.979 10.798 37.50 6.00 .400 5.00 10.00 1.020
8.600 9.200 40.00 .450 .400 .0109.750 10.300 40.00 .900 - .900 - - - - _7.990 8.380 40.00 .600 - .200 - - - .020 _8.000 8.600 40.00 .350 - .300 - - - - -8.950 9.900 40.00 .350 - .300 - - - .010 -7.300 8.000 40.00 - - - - - - - -
8.295 8.976 40.00 _ 8.00 _ 8.00 _ _ _ 5.008.020 8.800 40.00 .545 .350 6.00 .020 2.31
5.860 6.150 40.00 .425 - .300 - - - .010 -
7.040 7.450 40.00 .425 - .300 - - - .010 -
8.650 9.300 40.00 .425 .300 .0107.800 8.500 40.00 .350 - .100 - - - - -8.490 8 8.490 40.00 - - .250 - .400 - - _
6.700 7.400 40.00 .600 - .200 - - - - -
6.700 7.400 40.00 .600 _ .200 _ _ _ _
7.250 7.700 40.00 - - .350 - - - - -
7.750 8.200 40.00 - - .350 - - - - _
- 9.000 40.00 - - .350 - - - - _7.600 8.050 40.00 - - .350 - - - - -
7.750 7.950 40.00 - _ .350 _ _ - _ _
8.000 8.200 40.00 - - .350 - - - - -8.000 8.450 40.00 - - .350 - - - - -
7.500 7.950 40.00 - - .350 - - - - -
See footnotes at end of table.
122
Digitized for FRASER http://fraser.stlouisfed.org/ Federal Reserve Bank of St. Louis

(Union hourly wage rates, July 1, 1976, and wage rates, straight-time weekly hours, and employer insurance, pension, vacation, and other contributions to funds in the building trades, July 1, 1977)
Table 20. Wage rates, hours, and employer contributions for selected benefits: Selected cities—Continued
July 1, 1976 July 1, 1977
City and job classification Hoursper
week2
Employer contributions for selected benefits3Rate per
hour1Rate per
hour1 Insurance4 Pension Vacation Other5
Dollars Percent Dollars Percent Dollars Percent Dollars Percent
Norfolk, Va. —Continued
Building construction —Continued
Journeymen— Continued
Paperhangers....................... $7,600 $8,050 40.00 0.350Pipefitters............................. 8.700 9.400 40.00 0.550 - .550 - - - 0.010 -Plasterers:
Agreement A ..................... 9.360 10.010 40.00 _ _ _ _ _ _ _ .Agreement B ..................... 9.360 10.010 40.00 - - - - - - - -
Plumbers.............................. 8.700 9.400 40.00 .550 - .550 - - - .010 -Reinforcing iron workers........ 9.050 9.300 40.00 .550 - .700 - - - .010 -Roofers, composition............. 5.700 5.950 40.00 - - - - - - - -Roofers, slate and tile ............ 5.700 5.950 40.00 - - - - - - - -Sheet-metal workers.............. 8.250 8.800 40.00 .450 - .550 - - - - -Stonemasons........................ 7.990 8.380 40.00 .600 - .200 - - - .020 -Structural-iron workers........... 8.800 9.300 40.00 .550 - .700 - - - .010 -Tile layers............................. 6.700 7.400 40.00 .600 - .200 - - - - -
Helpers and laborers
Bricklayers’ tenders............... 4.850 5.400 40.00 .200 .150 .070Air tool vibrator operators......................... 4.850 5.400 40.00 .200 .150 _ _ _ .070 .
Hod carriers...................... 5.000 5.550 40.00 .200 - .150 - - - .070 -Mortar mixers.................... 5.000 5.550 40.00 .200 - .150 - - - .070 -
Construction laborers............ 4.750 5.300 40.00 .200 - .150 - - - .070 -Concrete saw operators...... 4.850 5.400 40.00 .200 - .150 - - - .070 -Pipelayers.......................... 5.000 5.550 40.00 .200 - .150 - - - .070 -Motorized Georgia buggy operators..................... 4.850 5.400 40.00 .200 _ .150 _ _ .070 _Nozzlemen (gunnite) or landblasting..................... 4.850 5.400 40.00 .200 .150 _ _ _ .070 _
Burner (wrecking)............... 5.100 5.650 40.00 .200 - .150 - - - .070 -Composition roofers’
helpers.............................. 3.950 4.150 40.00 _ _ _ _ _ _ - _Elevator constructors’
helpers.............................. 5.610 6.160 40.00 .545 . .350 . _ 6.00 .020 2.31Plumbers’ laborers................ 4.750 5.300 40.00 .200 - .150 - - - .070 -Terrazzo workers’
helpers.............................. 5.000 5.550 40.00 .200 _ .150 _ _ _ .070 _Base grinders.................... 5.150 5.700 40.00 .200 - .150 - - - .070 -Floor grinders.................... 5.150 5.700 40.00 .200 - .150 - - - .070 -
Tile layers’ helpers................ 5.000 5.550 40.00 .200 - .150 - - - .070 -
Highway and street construction
Journeymen
Carpenters........................... 7.750 8.350 40.00 .350 .300
See footnotes at end of table.
123
Digitized for FRASER http://fraser.stlouisfed.org/ Federal Reserve Bank of St. Louis

Table 20. Wage rates, hours, and employer contributions for selected benefits: Selected cities—Continued
(Union hourly wage rates, July 1, 1976, and wage rates, straight-time weekly hours, and employer insurance, pension, vacation, and othercontributions to funds in the building trades, July 1, 1977)
City and job classification
July 1,1976
Rate per hour1
July 1, 1977
Rate per hour1
Hoursper
week2
Employer contributions for selected benefits3
Insurance4
Dollars Percent
Pension
Dollars Percent
Vacation
Dollars Percent
Other5
Dollars Percent
Norfolk, Va. —Continued
Highway and street construction —Continued
Journeymen— Continued
Engineers— Power equipment operators:Heavy equipment— Compressors (4 or more), cranemen, hoists (2 drums or more), finish graders................
Medium equipment— Bulldozers, forklifts, mixers (over 165), pans, trenchers...
Light equipment— Compressors (less than 4), hoists (1-drum), mixers, tractors (without attachments) ..
$8,250 $8,900
6.690 7.100
40.00
40.00
5.560 5.850 40.00
0.425
.425
.425
Other heavy construction
0.300
.300
.300
0.010
.010
.010
Journeymen
Engineers— Power equipment operators:Heavy equipment— Compressors (4 or more), cranemen, hoists (2 drums or more), finish graders................
Medium equipment— Bulldozers, forklifts, mixers (over 16S), pans, trenchers ..
Light equipment— Compressors (less than 4), hoists (1-drum), mixers, tractors (without attachments) ..
Omaha, Nebr.
8.650
7.040
9.300 40.00
7.450 40.00
5.860 6.150 40.00
.425
.425
.425
.300
.300
.300
.010
.010
.010
Building construction
Journeymen
Asbestos workersBricklayers.........Carpenters........
Floor layers....Piledrivers......
10.6209.4309.1609.1609.160
11.240 8 9.430
9.2309.230 9.355
40.0040.0040.0040.0040.00
.500
.500
.500
.500
.500
.400
.400
.500
.500
.500
4.50 23
0.750.600.600.600
.800
.050
.050
.050
See footnotes at end of table.
124
Digitized for FRASER http://fraser.stlouisfed.org/ Federal Reserve Bank of St. Louis

(Union hourly wage rates, July 1, 1976, and wage rates, straight-time weekly hours, and employer insurance, pension, vacation, and other contributions to funds in the building trades, July 1, 1977)
Table 20. Wage rates, hours, and employer contributions for selected benefits: Selected cities—Continued
July 1, 1976 July 1, 1977
City and job classification Hoursper
week2
Employer contributions for selected benefits3Rate per
hour1Rate per
hour1 Insurance4 Pension Vacation Other5
Dollars Percent Dollars Percent Dollars Percent Dollars Percent
Omaha, Nebr. — Continued
Building construction — Continued
Journeymen— Continued
Millwrights......................... $9,410 $10,080 40.00 0.500 0.500 0.600 0.050Cement finishers................... 9.820 10.590 40.00 .500 - .400 - - - - -Drywall tapers(finishers)............................ 9.490 10.340 40.00 .550 _ _ .500 .040 _
Electricians (inside wirers)............................... 10.516 11.390 40.00 .680 . .650 3.00 _ 6 8.00 1.50
Elevator constructors............. 10.410 10.990 40.00 .545 - .350 - - 6.00 .280 2.30Engineers— Power equip
ment operators:Heavy equipment:Cranes, derricks, shovels, 2-drum hoists............................. 9.850 10.450 40.00 .500 .570
Medium equipment:Blade graders, motor grade and traxdozers....... 9.600 10.200 40.00 .500 .570
Bulldozers, concrete pumps, forklifts, tractors, 1-drum hoists............................. 9.500 10.100 40.00 .500 .570
Light equipment:Air compressors and wheel tractors................. 8.360 8.630 40.00 .500 .570
Glaziers............................... 9.250 10.050 40.00 .550 - .350 - 6 .500 - - -Lathers................................ 8.350 8 8.350 40.00 .500 - .400 - 6 1.000 - .200 -Machinists............................ 10.000 8 10.000 40.00 .366 - .250 - - 8 6.00 - -Marble setters...................... 7.950 8 7.950 40.00 .200 - .400 - - - .200 -Mosaic and terrazzo
workers.............................. 7.950 8 7.950 40.00 .200 . .400 _ _ _ .200 _Painters............................... 8.800 9.400 40.00 - - .450 - 6.500 - - -
Spray............................... 9.350 10.000 40.00 - - .450 - 6 .500 - - -Structural steel.................. 9.350 10.000 40.00 - - .450 - 6.500 - - -Swing stage.............. ........ 9.350 10.000 40.00 - - .450 - 6 .500 - - -
Paperhangers....................... 9.150 9.750 40.00 - - .450 - 6.500 - - -Pipefitters............................. 10.280 11.270 40.00 .600 - .750 - 6.720 - 23 .250 -Plasterers............................. 9.680 10.200 40.00 .500 - .400 - 6 .500 - .200 -Plumbers.............................. 10.230 11.020 40.00 .700 - .850 - 6 .720 - .300 -Reinforcing iron workers........ 9.180 9.650 40.00 .500 - .550 - 6 1.000 - .050 -Roofers, composition............. 8.180 9.180 40.00 .150 - .200 - 6.500 - - -Sheet-metal workers.............. 10.472 11.036 40.00 .500 - - - - 6 6.00 .180 -Stonemasons........................ 9.430 8 9.430 40.00 .500 - .400 - .750 - - -Structural and ornamental
iron workers....................... 9.180 9.650 40.00 .500 _ .550 _ 6 1.000 _ .050 _Tile layers............................. 7.950 7.950 40.00 .200 - .400 - - - .200 -
Helpers and laborers
Bricklayers’ tenders............... 7.065 7.905 40.00 .500 .400 23 .300Mortar mixers.................... 7.065 7.905 40.00 .500 - .400 - - - .300 -
Building laborers................... 6.920 7.760 40.00 .500 - .400 - - - 23 .300 -Elevator constructors’
helpers............................. 7.290 7.690 40.00 .545 _ .350 _ _ 6.00 .280 2.30Marble setters’ helpers.......... 8.110 8 8.110 40.00 - - - - - - - -Plasterers’ laborers............... 7.185 8.025 40.00 .500 — .400 — 23.300 “
See footnotes at end of table.
125
Digitized for FRASER http://fraser.stlouisfed.org/ Federal Reserve Bank of St. Louis

Table 20. Wage rates, hours, and employer contributions for selected benefits: Selected cities—Continued
(Union hourly wage rates, July 1, 1976, and wage rates, straight-time weekly hours, and employer insurance, pension, vacation, and other contributions to funds in the building trades, July 1, 1977)
July 1, 1976 July 1, 1977
City and job classification Hoursper
week2
Employer contributions for selected benefits3Rate per
hour1Rate per
hour1 Insurance4 Pension Vacation Other5
Dollars Percent Dollars Percent Dollars Percent Dollars Percent
Omaha, Nebr. — Continued
Building construction — Continued
Helpers and laborers — Continued
Terrazzo workers’ helpers.............................. $8,110 8 $8,110 40.00Base machine.................... 8.260 8 8.260 40.00 - - - - - - - -
Tile layers’ helpers................ 8.110 8 8.110 40.00 - - - - - - - -
Highway and street construction
Journeymen
Carpenters........................... 9.110 8 9.110 40.00 0.500 0.500 0.600 0.050Cement masons.................... 9.280 9.880 40.00 .500 - .400 - - - - -Engineers— Power equip
ment operators:Oiler drivers...................... 7.030 7.450 40.00 .500 .400 .020Tractors (under 35 hp.), form trenchers, belt machines................... 7.410 7.850 40.00 .500 .400 .020
Spread oilers (after 1 yr.)............................... 8.510 9.110 40.00 .500 _ .400 _ . _ .020 .
Concrete spreaders, traxcavators, one- drum hoists, and winch trucks..................... 8.730 9.330 40.00 .500 .400 .020
Hydro hammers................. 7.630 8.230 40.00 .500 - .400 - - - .020 -
Scrapers and turna- pulls (over 35 hp.) ............ 8.900 9.500 40.00 .500 _ .400 _ _ _ .020 _
Trenching machines, piledrivers, locomotives, side boom cats, rotary welldrilling operators............... 9.070 9.670 40.00 .500 .400 .020
Helpers and laborers
Form setters and precast manhole setters.................. 7.030 7.430 40.00 .500 .400 6 .200
Pipelayers and concrete saw operators..................... 6.650 7.050 40.00 .500 _ .400 _ _ _ 6 .200 _
Rakers and screedmen on asphalt, mortar mixers......... 6.580 6.980 40.00 .500 _ .400 _ _ _ 6 .200 .
Form setter helpers............... 6.600 7.000 40.00 .500 - .400 - - - 6.200 -General laborers................... 6.400 6.800 40.00 .500 - .400 - - - 6 .200 -
Laborer-welders..................... 6.570 6.970 40.00 .500 - .400 - - - 6 .200 -
Tunnelers, free air................. 6.900 7.300 40.00 .500 _ .400 - - - 6 .200 -
See footnotes at end of table.
126
Digitized for FRASER http://fraser.stlouisfed.org/ Federal Reserve Bank of St. Louis

Table 20. Wage rates, hours, and employer contributions for selected benefits: Selected cities—Continued
(Union hourly wage rates, July 1, 1976, and wage rates, straight-time weekly hours, and employer insurance, pension, vacation, and othercontributions to funds in the building trades, July 1, 1977)
July 1,1976 July 1, 1977
Employer contributions for selected benefits3Rate per
hour1Rate per
hour1noursper
week2Insurance4 Pension Vacation Other5
Dollars Percent Dollars Percent Dollars Percent Dollars Percent
Omaha, Nebr. — Continued
Other heavy construction
Journeymen
Carpenters........................... $9,110 8$9.110 40.00 0.500 0.400 0.600 0.050Cement masons.................... 9.280 9.880 40.00 .500 - .400 - - - - -Engineers— Power equip
ment operators:Oiler drivers...................... 7.030 7.450 40.00 .500 .400 .020Tractors (under 35 hp.), form trenchers, belt machines................... 7.410 7.850 40.00 .500 .400 .020
Spread oilers (after 1 yr.)............................... 8.510 9.110 40.00 .500 . .400 . . .020
Concrete spreaders, traxcavators, one- drum hoists, and winch trucks..................... 8.730 9.330 40.00 .500 .400 .020
Hydro hammers................. 7.630 8.230 40.00 .500 - .400 - - - .020 -
Scrapers and turna- pulls (over 35 hp.)............ 8.900 9.500 40.00 .500 „ .400 _ _ _ .020 _
Trenching machines, pile drivers, locomotives, side boom cats, rotary welldrilling operators............... 9.070 9.670 40.00 .500 .400 .020
Helpers and laborers
Form setters and precast manhole setters.................. 7.030 7.430 40.00 .500 .400 6 .200
Pipelayers and concrete saw operators..................... 6.650 7.050 40.00 .500 _ .400 _ _ _ 6 .200
Rakers and screedmen on asphalt, mortar mixers......... 6.580 6.980 40.00 .500 _ .400 _ _ _ 6 .200 _
Form setter helpers............... 6.600 7̂ 000 40.00 .500 - .400 - - - 6.200 -General laborers................... 6.400 6.800 40.00 .500 - .400 - - - 6.200 -
Laborer-welders..................... 6.570 6.970 40.00 .500 - .400 - - - 6 .200 -Tunnelers, free air................. 6.900 7.300 40.00 .500 - .400 - - - 6 .200 -
Philadelphia, Pa.
Building construction
Journeymen
Asbestos workers................. 10.170 10.720 40.00 .700 .750 6 1.000 .040Boilermakers......................... 11.050 12.050 40.00 .750 - 1.000 - - - - -
Bricklayers............................ 10.300 10.430 35.00 1.100 - 1.000 - 6.450 - .090 -Residential........................ 10.450 10.380 40.00 .770 - .800 - 6 .350 - .020 -
Carpenters........................... 9.770 10.120 40.00 2.130 - 1.300 - - - .200 -Millwrights......................... 10.270 10.620 40.00 2.130 - 1.300 - - - .200 -Wharf and dock builders ................................... 10.420 10.770 40.00 2.130 - 1.300 - - - .200 -
See footnotes at end of table.
127
Digitized for FRASER http://fraser.stlouisfed.org/ Federal Reserve Bank of St. Louis
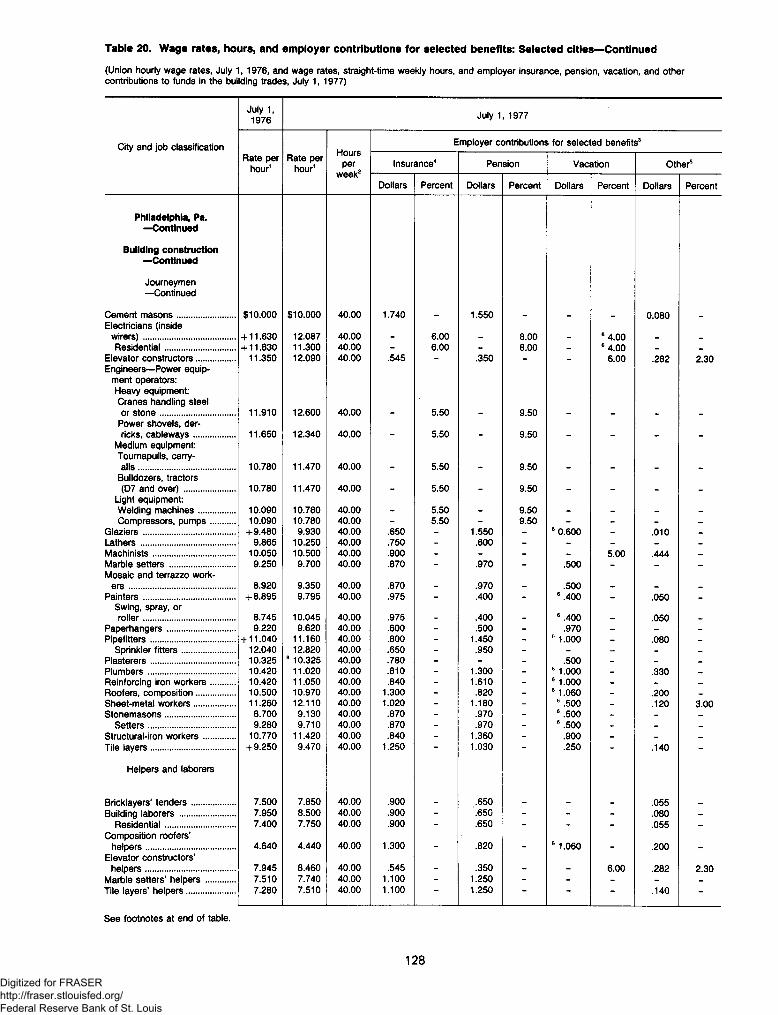
Table 20. Wage rates, hours, and employer contributions for selected benefits: Selected cities—Continued
(Union hourly wage rates, July 1, 1976, and wage rates, straight-time weekly hours, and employer insurance, pension, vacation, and other contributions to funds in the building trades, July 1, 1977)
July 1, 1976 July 1, 1977
City and job classification Hoursper
week2
Employer contributions for selected benefits3Rate per
hour1Rate per
hour1 Insurance4 Pension Vacation Other5
Dollars Percent Dollars Percent Dollars Percent Dollars Percent
Philadelphia, Pa. — Continued
Building construction — Continued
Journeymen— Continued
Cement masons.................... $10,000 $10,000 40.00 1.740 _ 1.550 _ _ _ 0.080Electricians (inside
wirers)............................... + 11.630 12.087 40.00 - 6.00 - 8.00 - 6 4.00 _ _Residential........................ + 11.630 11.300 40.00 - 6.00 - 8.00 - 6 4.00 _ _
Elevator constructors............. 11.350 12.090 40.00 .545 - .350 - - 6.00 .282 2.30Engineers— Power equip
ment operators:Heavy equipment:Cranes handling steel or stone......................... 11.910 12.600 40.00 _ 5.50 9.50
Power shovels, der-ricks, cableways.............. 11.650 12.340 40.00 - 5.50 - 9.50 - - _ _
Medium equipment: Tournapulls, carry-alls ................................. 10.780 11.470 40.00 - 5.50 - 9.50 - - - _
Bulldozers, tractors(D7 and over) ................. 10.780 11.470 40.00 - 5.50 - 9.50 - - - _
Light equipment:Welding machines............ 10.090 10.780 40.00 - 5.50 - 9.50 - - - -Compressors, pumps........ 10.090 10.780 40.00 - 5.50 - 9.50 - - - -
Glaziers............................... +9.480 9.930 40.00 .650 - 1.550 - 6 0.600 - .010 _Lathers................................ 9.865 10.250 40.00 .750 - .600 - - - _ _Machinists............................ 10.050 10.500 40.00 .900 - - - - 5.00 .444 _Marble setters...................... 9.250 9.700 40.00 .870 - .970 - .500 - _ _Mosaic and terrazzo work
ers .................................... 8.920 9.350 40.00 .870 - .970 - .500 - _ _Painters............................... +8.895 9.795 40.00 .975 - .400 - 6.400 - .050 -
Swing, spray, orroller............................... 8.745 10.045 40.00 .975 - .400 - 6 .400 - .050 -
Paperhangers....................... 9.220 9.620 40.00 .600 - .500 - .970 - - -Pipefitters............................. + 11.040 11.160 40.00 .800 - 1.450 - 6 1.000 - .080 -
Sprinkler fitters.................. 12.040 12.820 40.00 .650 - .950 - - - _ _Plasterers............................. 10.325 8 10.325 40.00 .780 - - - .500 _ _ _Plumbers.............................. 10.420 11.020 40.00 .810 - 1.300 - 6 1.000 - .330 _Reinforcing iron workers........ 10.420 11.050 40.00 .840 - 1.610 - 6 1.000 - - -Roofers, composition............. 10.500 10.970 40.00 1.300 - .820 - 6 1.060 - .200 -Sheet-metal workers.............. 11.260 12.110 40.00 1.020 - 1.180 - 6 .500 - .120 3.00Stonemasons........................ 8.700 9.130 40.00 .870 - .970 - 6 .500 - _ -
Setters.............................. 9.280 9.710 40.00 .870 - .970 - 6 .500 - - _Structural-iron workers........... 10.770 11.420 40.00 .840 - 1.360 - .900 - _ -Tile layers............................. +9.250 9.470 40.00 1.250 - 1.030 - .250 - .140 -
Helpers and laborers
Bricklayers’ tenders............... 7.500 7.850 40.00 .900 _ .650 _ _ . .055Building laborers................... 7.950 8.500 40.00 .900 - .650 - - - .080 _
Residential........................ 7.400 7.750 40.00 .900 - .650 - - - .055 _Composition roofers’
helpers.............................. 4.640 4.440 40.00 1.300 - .820 - 6 1.060 - .200 -Elevator constructors’
helpers.............................. 7.945 8.460 40.00 .545 - .350 - - 6.00 .282 2.30Marble setters’ helpers.......... 7.510 7.740 40.00 1.100 - 1.250 - - - - -Tile layers’ helpers................ 7.280 7.510 40.00 1.100 ~ 1.250 - - .140 -
See footnotes at end of table.
128
Digitized for FRASER http://fraser.stlouisfed.org/ Federal Reserve Bank of St. Louis
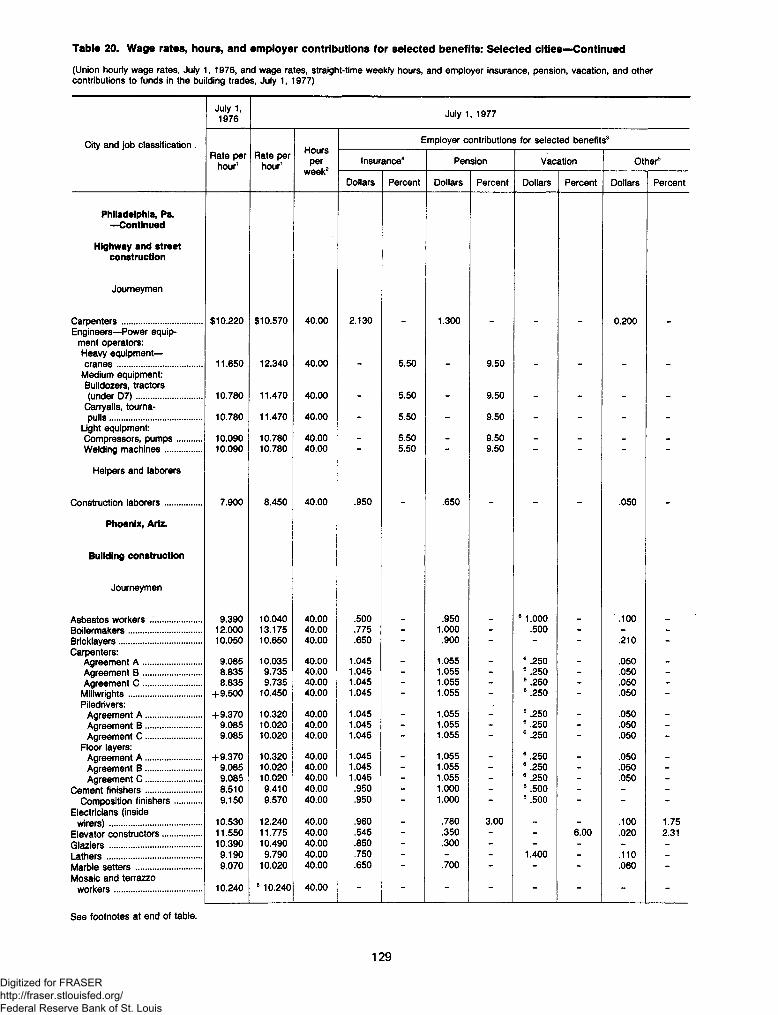
(Union hourly wage rates, July 1, 1976, and wage rates, straight-time weekly hours, and employer insurance, pension, vacation, and other contributions to funds in the building trades, July 1, 1977)
Table 20. Wage rates, hours, and employer contributions for selected benefits: Selected cities—Continued
July 1, 1976 July 1, 1977
City and job classification . Hoursper
week2
Employer contributions for selected benefits3Rate per
hour1Rate per
hour1 Insurance4 Pension Vacation Other5
Dollars Percent Dollars Percent Dollars Percent Dollars Percent
Philadelphia, Pa. — Continued
Highway and street construction
Journeymen
Carpenters........................... $10,220 $10,570 40.00 2.130 1.300 0.200Engineers— Power equip
ment operators:Heavy equipment- cranes ............................. 11.650 12.340 40.00 5.50 9.50
Medium equipment: Bulldozers, tractors (under D7)...................... 10.780 11.470 40.00 5.50 9.50
Carryalls, tourna- pulls............................... 10.780 11.470 40.00 5.50 _ 9.50 _ _ . .
Light equipment: Compressors, pumps........ 10.090 10.780 40.00 _ 5.50 _ 9.50 _ _ _ _Welding machines............ 10.090 10.780 40.00 - 5.50 - 9.50 - - -
Helpers and laborers
Construction laborers............ 7.900 8.450 40.00 .950 .650 .050
Phoenix, Ariz.
Building construction
Journeymen
Asbestos workers .;................ 9.390 10.040 40.00 .500 .950 8 1.000 .100Boilermakers......................... 12.000 13.175 40.00 .775 - 1.000 - .500 - - -
Bricklayers............................ 10.050 10.650 40.00 .650 - .900 - - - .210 -Carpenters:
Agreement A .................... 9.085 10.035 40.00 1.045 1.055 _ 6 .250 _ .050 _Agreement B .................... 8.835 9.735 40.00 1.045 - 1.055 - 8 .250 - .050 -Agreement C .................... 8.835 9.735 40.00 1.045 - 1.055 - 6 .250 - .050 -
Millwrights......................... +9.500 10.450 40.00 1.045 - 1.055 - 6.250 - .050 -Piledrivers:
Agreement A ................... +9.370 10.320 40.00 1.045 _ 1.055 _ 6 .250 _ .050 _Agreement B ................... 9.085 10.020 40.00 1.045 - 1.055 - 6 .250 - .050 -Agreement C ................... 9.085 10.020 40.00 1.045 ~ 1.055 - 6.250 - .050 -
Floor layers:Agreement A ................... +9.370 10.320 40.00 1.045 _ 1.055 _ 8.250 _ .050 .Agreement B ................... 9.085 10.020 40.00 1.045 - 1.055 - 8 .250 - .050 -
Agreement C ................... 9.085 10.020 40.00 1.045 - 1.055 - 8 .250 - .050 -
Cement finishers................... 8.510 9.410 40.00 .950 - 1.000 - 8.500 - - -
Composition finishers......... 9.150 9.570 40.00 .950 - 1.000 - 8 .500 - - -Electricians (inside
wirers)............................... 10.530 12.240 40.00 .960 _ .780 3.00 _ _ .100 1.75Elevator constructors............. 11.550 11.775 40.00 .545 - .350 - - 6.00 .020 2.31Glaziers............................... 10.390 10.490 40.00 .850 - .300 - - - - -Lathers................................ 9.190 9.790 40.00 .750 - - - 1.400 - .110 -Marble setters...................... 9.070 10.020 40.00 .650 - .700 - - - .060 -Mosaic and terrazzo
workers.............................. 10.240 8 10.240 40.00 - - - - - - - -
See footnotes at end of table.
129
Digitized for FRASER http://fraser.stlouisfed.org/ Federal Reserve Bank of St. Louis
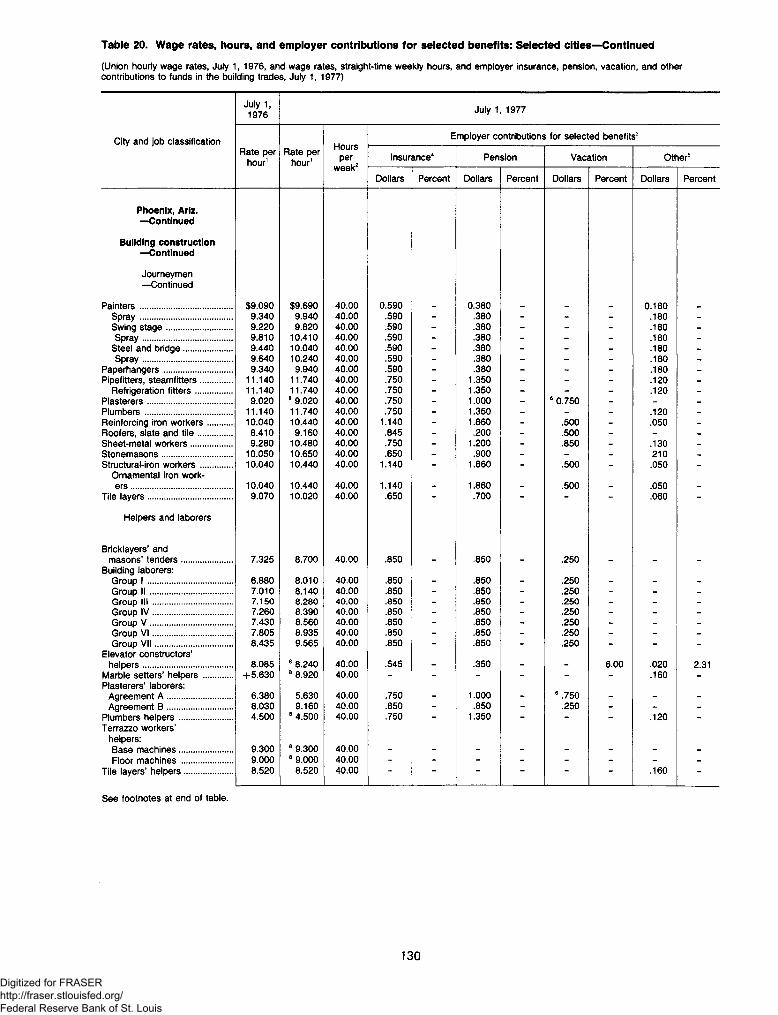
Table 20. Wage rates, hours, and employer contributions for selected benefits: Selected cities—Continued
(Union hourly wage rates, July 1, 1976, and wage rates, straight-time weekly hours, and employer insurance, pension, vacation, and othercontributions to funds in the building trades, July 1, 1977)
City and job classification
Phoenix, Ariz. —Continued
Building construction —Continued
Journeymen— Continued
Painters........................Spray........................Swing stage...............Spray........................
Steel and bridge..........Spray........................
Paperhangers................Pipefitters, steamfitters....
Refrigeration fitters......Plasterers......................Plumbers.......................Reinforcing iron workers ...Roofers, slate and tile .....Sheet-metal workers.......Stonemasons.................Structural-iron workers....
Ornamental iron workers ............................
Tile layers......................
Helpers and laborers
Bricklayers’ andmasons’ tenders......
Building laborers:Group I .................Group I I ................Group III ..................Group IV................Group V ................Group V I................Group VII...............
Elevator constructors’helpers...................
Marble setters’ helpers Plasterers’ laborers:
Agreement A ...........Agreement B ...........
Plumbers helpers......Terrazzo workers’
helpers:Base machines.......Floor machines ......
Tile layers’ helpers.....
July 1, 1976 July 1, 1977
Rate per hour1
Rate per hour1
Hoursper
week2
Employer contributions for selected benefits3
Insurance4 Pension Vacation Other5
Dollars Percent Dollars Percent Dollars Percent Dollars Percent
$9,090 $9,690 40.00 0.590 0.380 0.1809.340 9.940 40.00 .590 - .380 - - - .180 _
9.220 9.820 40.00 .590 - .380 - - - .180 _
9.810 10.410 40.00 .590 - .380 - - - .180 _
9.440 10.040 40.00 .590 - .380 - - _ .180 -
9.640 10.240 40.00 .590 - .380 - - - .180 -
9.340 9.940 40.00 .590 - .380 - - - .180 _
11.140 11.740 40.00 .750 - 1.350 - - - .120 _
11.140 11.740 40.00 .750 - 1.350 - - - .120 _
9.020 8 9.020 40.00 .750 - 1.000 - 6 0.750 - - _
11.140 11.740 40.00 .750 - 1.350 - - _ .12010.040 10.440 40.00 1.140 - 1.860 - .500 - .050 -
8.410 9.160 40.00 .845 - .200 - .500 - - _
9.280 10.480 40.00 .750 - 1.200 - .850 - .130 _
10.050 10.650 40.00 .650 - .900 - - - 210 -
10.040 10.440 40.00 1.140 - 1.860 - .500 - .050 -
10.040 10.440 40.00 1.140 _ 1.860 _ .500 _ .050 _9.070 10.020 40.00 .650 .700 .060
7.325 8.700 40.00 .850 .850 .250
6.880 8.010 40.00 .850 _ .850 .250 _ _7.010 8.140 40.00 .850 - .850 - .250 - - _
7 .150 8.280 40 .00 .850 - .850 - .250 - - -
7.260 8.390 40.00 .850 - .850 - .250 - - -
7.430 8.560 40.00 .850 - .850 - .250 - _ _
7.805 8.935 40.00 .850 - .850 - .250 - - _
8.435 9.565 40.00 .850 - .850 - .250 - - -
8.085 8 8.240 40.00 .545 _ .350 _ _ 6.00 .020 2.31+5.630 8 8.920 40.00 - - - - - - .160 -
6.380 5.630 40.00 .750 _ 1.000 _ 6 .750 _ _ _
8.030 9.160 40.00 .850 - .850 - .250 - - _
4.500 8 4.500 40.00 .750 - 1.350 - - - .120 -
9.300 8 9.300 40.009.000 8 9.000 40.00 - - - - - - - _
8.520 8.520 40.00 - - - - .160 -
See footnotes at end of table.
130
Digitized for FRASER http://fraser.stlouisfed.org/ Federal Reserve Bank of St. Louis
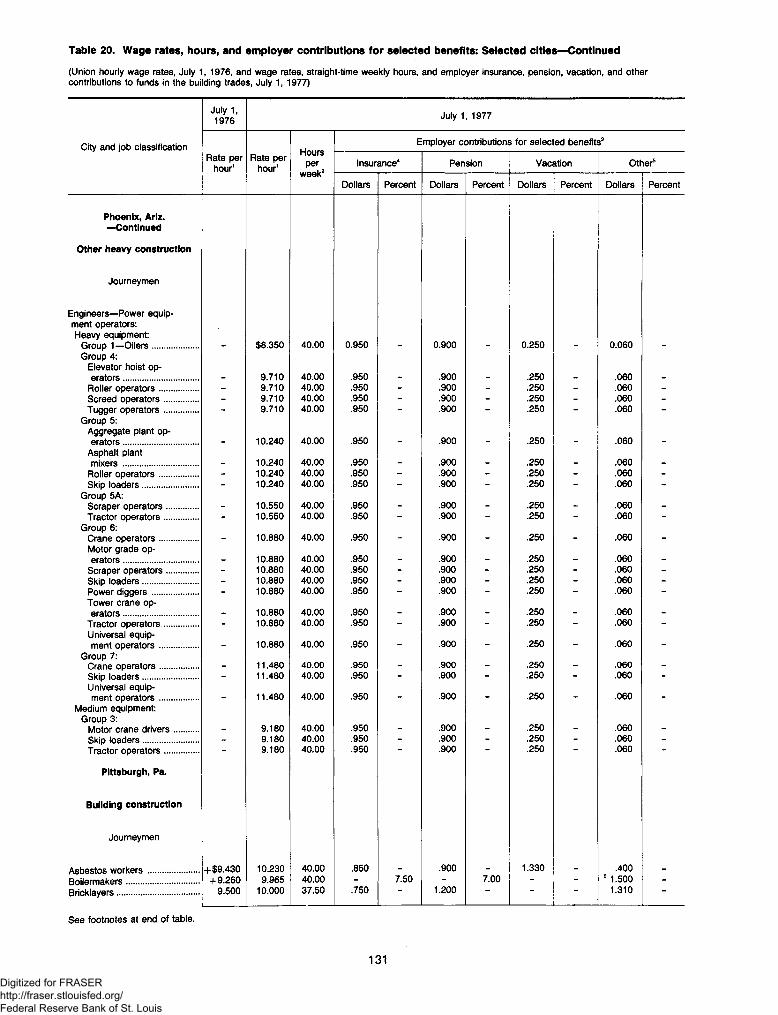
(Union hourly wage rates, July 1, 1976, and wage rates, straight-time weekly hours, and employer insurance, pension, vacation, and other contributions to funds in the building trades, July 1, 1977)
Table 20. Wage rates, hours, and employer contributions for selected benefits: Selected cities—Continued
July 1, 1976 July 1, 1977
City and job classification Hoursper
week2
Employer contributions for selected benefits3Rate per
hour1Rate per
hour1 Insurance4 Pension Vacation Other5
Dollars Percent Dollars Percent Dollars Percent Dollars Percent
Phoenix, Ariz. —Continued
Other heavy construction
Journeymen
Engineers— Power equipment operators:Heavy equipment:
Group 1— Oilers................ $8,350 40.00 0.950 0.900 0.250 0.060Group 4:
Elevator hoist operators ......................... 9.710 40.00 .950 .900 .250 .060
Roller operators............. - 9.710 40.00 .950 - .900 - .250 - .060 -
Screed operators........... - 9.710 40.00 .950 - .900 - .250 - .060 -Tugger operators........... - 9.710 40.00 .950 - .900 - .250 - .060 -
Group 5:Aggregate plant operators ......................... 10.240 40.00 .950 .900 .250 .060
Asphalt plant mixers ......................... 10.240 40.00 .950 . .900 . .250 .060
Roller operators............. - 10.240 40.00 .950 - .900 - .250 - .060 -
Skip loaders................... - 10.240 40.00 .950 - .900 - .250 - .060 -
Group 5A:Scraper operators........... _ 10.550 40.00 .950 _ .900 _ .250 _ .060 _Tractor operators........... - 10.550 40.00 .950 - .900 - .250 - .060 -
Group 6:Crane operators............. _ 10.880 40.00 .950 .900 _ .250 _ .060 _Motor grade operators ......................... 10.880 40.00 .950 _ .900 _ .250 .060 _
Scraper operators........... - 10.880 40.00 .950 - .900 - .250 - .060 -Skip loaders................... - 10.880 40.00 .950 - .900 - .250 - .060 -Power diggers................ - 10.880 40.00 .950 - .900 - .250 - .060 -Tower crane operators ......................... . 10.880 40.00 .950 _ .900 _ .250 _ .060 _
Tractor operators............ - 10.880 40.00 .950 - .900 - .250 - .060 -Universal equipment operators............. _ 10.880 40.00 .950 _ .900 _ .250 _ .060 _
Group 7:Crane operators............. _ 11.480 40.00 .950 _ .900 _ .250 _ .060 _Skip loaders................... - 11.480 40.00 .950 - .900 - .250 - .060 -Universal equipment operators............. _ 11.480 40.00 .950 _ .900 _ .250 _ .060 -
Medium equipment:Group 3:
Motor crane drivers........ 9.180 40.00 .950 .900 .250 .060Skip loaders................... - 9.180 40.00 .950 - .900 - .250 - .060 -Tractor operators........... - 9.180 40.00 .950 - .900 - .250 - .060 -
Pittsburgh, Pa.
Building construction
Journeymen
Asbestos workers................. +$9,430 10.230 40.00 .850 .900 1.330 .400Boilermakers......................... +9.260 9.965 40.00 - 7.50 - 7.00 - - 6 1.500 -Bricklayers............................ 9.500 10.000 37.50 .750 1.200 — 1.310
See footnotes at end of table.
131
Digitized for FRASER http://fraser.stlouisfed.org/ Federal Reserve Bank of St. Louis

Table 20. Wage rates, hours, and employer contributions for selected benefits: Selected cities—Continued
(Union hourly wage rates, July 1, 1976, and wage rates, straight-time weekly hours, and employer insurance, pension, vacation, and other contributions to funds in the building trades, July 1, 1977)
July 1, 1976 July 1, 1977
City and job classification Hoursper
week2
Employer contributions for selected benefits3Rate per
hour1Rate per
hour1 Insurance4 Pension Vacation Other5
Dollars Percent Dollars Percent Dollars Percent Dollars Percent
Pittsburgh, Pa. — Continued
Building construction — Continued
Journeymen— Continued
Carpenters........................... $9,730 $10,450 40.00 _ 6.00 _ 8.00 _ _ 0.250 7.00Millwrights......................... 9.190 9.640 40.00 - 6.00 - 6.00 - - - 25.00Piledrivers......................... 10.240 10.550 40.00 - 5.50 - 10.00 - - - 1.00
Cement finishers................... 9.930 10.620 40.00 - 6.00 - 10.00 - - - 6.50Electricians (inside
wirers)............................... 10.600 11.350 40.00 0.350 - 0.200 3.00 0.600 - - -Elevator constructors............. 9.830 10.580 40.00 .545 - .350 - - 6.00 .020 2.30Engineers— Power equip
ment operators:Heavy equipment:Shovels, cranes................ 10.775 11.625 40.00 .650 - .800 - - - .025 -Carryall scoops................ 10.625 11.475 40.00 .650 - .800 - - - .025 -
Medium equipment: Bulldozers, compressors, hoists..................... 10.625 11.475 40.00 .650 - .800 - - - .025 -
Light equipment: Pumps, rollers,welders.......................... 9.800 10.400 40.00 .650 - .800 - - - .025 -
Glaziers............................... 9.390 9.740 40.00 .620 - .720 - .580 - .262 -Lathers................................ 9.330 10.030 40.00 .850 - 1.200 - - - .090 -Machinists............................ 10.050 10.500 40.00 .900 - - - - 5.00 - -Marble setters ...................... + 9.280 9.480 40.00 .750 - 1.300 - - - 6 .520 -Mosaic and terrazzo work
ers ................................... 10.370 10.060 40.00 .750 - .950 - - - .620 -Painters............................... 9.980 10.630 40.00 .700 - .400 - - - - -
Spray............................... 10.505 11.130 40.00 .700 - .400 - - - - -Industrial........................... 10.280 11.330 40.00 .700 - .400 - - - - -Spray, industrial................. 10.780 11.130 40.00 .700 - .400 - - - - -
Paperhangers ....................... 9.980 10.630 40.00 .700 - .400 - - - - -Pipefitters............................. 10.540 11.290 40.00 .750 - 1.100 - - - .080 -
Sprinkler fitters.................. 10.055 10.590 40.00 .650 - .950 - - - 1.000 -Plasterers............................. 9.740 10.140 40.00 .700 - 1.400 - - - .140 -Plumbers.............................. 9.475 10.170 40.00 .850 - 1.160 - - - 1.060 -Reinforcing iron workers........ 9.275 10.655 40.00 .845 - 1.590 - - - .070 -Roofers, slate and tile ............ 10.530 11.410 40.00 .770 - 1.500 - - - .373 -
Sheet-metal workers.............. +8.871 9.592 40.00 .900 - 1.230 - - 12.00 6.575 -
Spackler and taper................ 9.980 10.630 40.00 .700 - .400 - - - - -Stonemasons........................ +9.840 10.140 37.50 .750 - 1.500 - - - 6 .520 -Structural-iron workers........... 10.275 10.655 40.00 .845 - 1.590 - - - .070 -
Ornamental iron workers .................................. 10.275 10.655 40.00 .845 - 1.590 - - - .070 -
Fence erectors.................. 10.275 10.655 40.00 .845 - 1.590 - - - .070Tile layers............................. +8.250 8.880 40.00 .750 - 1.300 - - - .520 -
Helpers and laborers
Bricklayers’ tenders............... 8.070 8.800 40.00 .790 _ .600 _ _ .040 2.70Hod carriers and mortar mixers......................... 8.320 9.050 40.00 .790 - .600 - - - .040 2.70
Building laborers................... 8.070 8.800 40.00 .790 - .600 - - - .040 2.70Elevator constructors’
helpers.............................. 6.880 7.410 40.00 .545 - .350 - - 6.00 .020 2.30Marble setters’ helpers.......... 8.400 9.100 40.00 .750 - 1.000 - - - .050 3.10Plasterers’ tenders................ 8.320 9.050 40.00 .790 ~ .600 .040 2.70
See footnotes at end of table.
132
Digitized for FRASER http://fraser.stlouisfed.org/ Federal Reserve Bank of St. Louis

Table 20. Wage rates, hours, and employer contributions for selected benefits: Selected cities—Continued
(Union hourly wage rates, July 1, 1976, and wage rates, straight-time weekly hours, and employer insurance, pension, vacation, and othercontributions to funds in the building trades, July 1, 1977)
City and job classification
Pittsburgh, Pa. —Continued
Building construction —Continued
Helpers and laborers — Continued
Terrazzo workers’helpers........................
Tile layers’ helpers...........
Highway and street construction
Journeymen
Carpenters....................Cement finishers............Engineers-Power equipment operators:
Medium equipment: Bulldozers, carryallsgraders, scoops........
Light equipment:Rollers......................Compressors.............
Helpers and laborers
Construction laborers..........
Other heavy construction
Journeymen
Carpenters................
Portland, Ore.
Building construction
Journeymen
Asbestos workers ........Boilermakers................Bricklayers...................
Caulkers, pointers andcleaners.................
Carpenters..................Floor layers..............Millwrights................Dock and wharf builders:Agreement A ..........
July 1, 1976 July 1, 1977
Rate per hour1
Rate per hour1
Hoursper
week2
Employer contributions for selected benefits3
Insurance4 Pension Vacation Other5
Dollars Percent Dollars Percent Dollars Percent Dollars Percent
$8,655 $9,305 40.00 0.750 1.000 0.050 3.107.840 8.190 40.00 .750 1.000 .950
9.560 10.130 40.00 8.00 7.00 .409.020 9.550 40.00 6.00 10.00 6.40
9.670 10.370 40.00 .650 _ .800 _ _ _ .035 _
7.310 8.010 40.00 .650 _ .800 _ _ _ .035 _6.860 7.560 40.00 .650 .800 .035
7.260 7.710 40.00 .600 - .600 6.00 - - .040 -
9.560 * 9.560 40.00 - 8.00 - 7.00 - - - .40
+ 10.786 11.810 40.00 .500 1.000 6 0.250 .07010.650 11.575 40.00 .775 - 1.000 - .500 - - -10.780 11.580 40.00 .750 - .850 - 6 .250 - .210 -
10.780 11.580 40.00 .750 _ .850 _ 6.250 _ .21010.090 10.650 40.00 .550 - .850 - .500 - - -
10.240 10.800 40.00 .550 - .850 - .500 - - -
10.340 10.900 40.00 .550 - .850 - .500 - - -
10.390 11.010 40.00 .550 - .850 - .500 - - -
See footnotes at end of table.
133
Digitized for FRASER http://fraser.stlouisfed.org/ Federal Reserve Bank of St. Louis

Table 20. Wage rates, hours, and employer contributions for selected benefits: Selected cities—Continued
(Union hourly wage rates, July 1, 1976, and wage rates, straight-time weekly hours, and employer insurance, pension, vacation, and other contributions to funds in the building trades, July 1, 1977)
July 1, 1976 July 1, 1977
City and job classification Hoursper
week2
Employer contributions for selected benefits3Rate per
hour1Rate per
hour1 Insurance4 Pension Vacation Other5
Dollars Percent Dollars Percent Dollars Percent Dollars Percent
Portland, Ore. — Continued
Building construction — Continued
Journeymen— Continued
Agreement B ................... $10,290 $10,750 40.00 0.550 _ 0.850 _ 0.500 _ _ _Shinglers.......................... 10.090 10.650 40.00 .550 - .850 - .500 - _ _
Cement finishers................... 9.870 10.370 40.00 .750 - .700 - .600 _ 0.030 _Composition, mastic........... 10.020 10.520 40.00 .750 - .700 - .600 6 0.00 .030 _
Electricians (insidewirers)............................... 10.442 11.776 40.00 .650 - 1.000 3.00 - 8.00 .050 1.00
Elevator constructors............. 10.463 11.473 40.00 .545 - .350 - - 6.00 .362 _Engineers— Power equip
ment operators heavy equipment: Power shovels under1 cu. yd........................... 9.850 10.590 40.00 1.000 - 1.000 - .500 - .080 _1 cu yd. and under3 cu yd .......................... 9.990 10.730 40.00 1.000 - 1.000 - .500 - .080 _
3 cu yd. and over............ 10.630 11.370 40.00 1.000 - 1.000 - .500 - .080 _Tractors over 50horsepower..................... 9.770 10.510 40.00 1.000 - 1.000 - .500 - .080 -
Medium equipment: Blades, power over 50horsepower..................... 9.990 10.730 40.00 1.000 - 1.000 - .500 - .080 -
Piledriver engineers........... 9.990 10.730 40.00 1.000 - 1.000 - .500 - .080 -Light equipment: Hoists:Single drum..................... 9.470 10.210 40.00 1.000 - 1.000 - .500 - .080 -2 active drums ormore............................. 9.910 10.650 40.00 1.000 - 1.000 - .500 - .080 _
Concrete mixers:1 -5 bag capacity.............. 9.450 10.190 40.00 1.000 - 1.000 - .500 - .080 -5 bag capacity andover.............................. 9.610 10.350 40.00 1.000 - 1.000 - .500 - .080 -
Multi-units of 3mixers ............................ 9.910 10.650 40.00 1.000 - 1.000 - .500 - .080 _
Derricks, live boom ........... 9.990 10.730 40.00 1.000 - 1.000 - .500 - .080 -Glaziers ............................... 9.250 10.075 40.00 .410 - .650 - - 6 6.80 .010 -Lathers ................................ 9.400 10.050 40.00 .600 - .900 - 6 1.000 - .120 -Machinists............................ 11.810 12.810 40.00 - - .100 - - - - _Marble setters ...................... 10.780 11.580 40.00 .750 - .850 - 6 .250 - .210 -Mosaic and terrazzo
workers............................. 9.340 9.940 40.00 .650 - .550 - 6.250 - .200 -
Painters............................... 8.950 9.830 40.00 .550 - .600 - .500 - .140 -Spray............................... 9.200 10.230 40.00 .550 - .600 - .500 - .140 -High work (over 50 ft) ........ 9.950 10.580 40.00 .550 - .600 - .500 - .140 -Structural steel.................. 9.450 10.580 40.00 .550 - .600 - .500 - .140 -
Bridge............................ 9.450 10.580 40.00 .550 - .600 - .500 - .140 -Tapers............................. 10.560 10.980 40.00 .650 - .600 - .500 - .140 -
Paperhangers....................... 9.200 10.230 40.00 .550 - .600 - .500 - .140 -Pipefitters and refrig
eration fitters...................... 11.000 12.120 40.00 1.370 - 1.600 - 6 1.000 - .190 -
Oil fitters........................... 7.090 7.940 40.00 1.120 - 1.600 - 6 1.000 - .190 _
Plasterers............................. 10.050 10.600 40.00 .600 - 1.000 - .450 - .120 _
Plumbers............................. 11.000 12.120 40.00 1.370 1.600 - 6 1.000 - .190 -
Reinforcing iron workers........ 10.750 10.750 40.00 .730 - 1.000 - .250 - - -Roofers, composition............. 8.950 10.350 40.00 .700 - .800 - 6 .100 - - -Sheet-metal workers.............. 9.680 11.130 40.00 .814 - .930 - 1.000 - .040 3.00Stonemasons........................ 10.780 11.580 40.00 .750 .850 6 .250 “ .210 -
See footnotes at end of table.
134
Digitized for FRASER http://fraser.stlouisfed.org/ Federal Reserve Bank of St. Louis

Table 20. Wage rates, hours, and employer contributions for selected benefits: Selected cities—Continued
(Union hourly wage rates, July 1, 1976, and wage rates, straight-time weekly hours, and employer insurance, pension, vacation, and othercontributions to funds in the building trades, July 1, 1977)
City and job classification
July 1, 1976 July 1, 1977
Rate per hour1
Rate per hour1
Hoursper
week2
Employer contributions for selected benefits3
Insurance4 Pension Vacation Other5
Dollars Percent Dollars Percent Dollars Percent Dollars Percent
$10,750 $10,750 40.00 0.730 1.000 0.25010.750 10.750 40.00 .730 - 1.000 - .250 - _ _9.340 9.940 40.00 .650 .550 6 .250 0.200
8.270 8.810 40.00 .900 1.000 6 .650 O (9)7.870 8.390 40.00 .900 - 1.000 - 6 .650 - (9) (9)
6.230 6.400 40.00 .700 - .800 - 6 .100 - - -
7.323 8.028 40.00 .545 _ .350 _ 6.000 6.00 .362 _5.232 5.734 40.00 .545 - .350 - 6 .000 6.00 .362 -8.220 8.740 40.00 .900 - 1.000 - 6.650 - 0 08.270 8.810 40.00 .900 - 1.000 - 6 .650 - (9) o8.270 8.810 40.00 .900 - 1.000 - 6 .650 - O ft7.970 8.490 40.00 .900 - 1.000 - 6 .650 - O f t
8.260 8.500 40.00 .650 _ .350 _ .250 _ .100 _
8.260 8.500 40.00 .650 .350 .250 .100
8.120 9.120 40.00 .900 - 1.000 - .650 - .150 -
7.220 8.390 40.00 .900 1.000 .650 .150, +8.220 8.740 40.00 .900 - 1.000 - .650 - .150 -
. +8.520 9.040 40.00 .900 - 1.000 - .650 - .150 -
. +8.770 +9.290 40.00 .900 1.000 .650 .150
8.920 9.280 35.00 1.000 1.180 6 1.00010.680 11.300 40.00 .950 - - 10.00 - - - -
9.550 9.550 40.00 .950 - 1.000 - - - .030 -
9.150 9.450 40.00 .650 - .900 6.250 - .030 -
Portland, Ore. —Continued
Building construction —Continued
Journeymen— Continued
Structural-iron workers.......Ornamental finishers......
Tile setters.......................
Helpers and laborers
Bricklayers’ tenders(hod carriers) ................
Building laborers.............Composition roofers’
helpers (first 800 hrs)....Elevator constructors’
helpers.........................Probationary helpers....
Jackhammer men (power) .Marble setters helpers.....Plasterers’ laborers..........Plumbers’ laborers...........Terrazzo workers’
helpers..........................Tile layers’ helpers...........
Highway and street construction
Journeymen
Group IV ........................
Helpers and laborers
Construction laborers:Group I ...........................Group I I ..........................Group III.........................Group IV ........................
Providence, R.l.
Building construction
Journeymen
Asbestos worker..................Boilermakers........................Bricklayers...........................Carpenters..........................
See footnotes at end of table.
135
Digitized for FRASER http://fraser.stlouisfed.org/ Federal Reserve Bank of St. Louis

Table 20. Wage rates, hours, and employer contributions for selected benefits: Selected cities—Continued
(Union hourly wage rates, July 1, 1976, and wage rates, straight-time weekly hours, and employer insurance, pension, vacation, and othercontributions to funds in the building trades, July 1, 1977)
City and job classification
Providence, R.l. —Continued
Building construction —Continued
Journeymen— Continued
Piledrivers and dockbuilders.....................
Millwrights...................Residential..................
Cement finishers.............Electricians (inside
wirers).........................Elevator constructors.......Engineers— Power equip
ment operators:Heavy equipment: Cranes, shovels,draglines, backhoes....
Medium equipment: Hoists, piledrivers,derricks....................
Light equipment:Pumps, air compressors, gas and electric heaters...............
Glaziers.........................Lathers..........................Marble setters................Mosaic and terrazzo
workers........................Painters.........................
Structural steel............Spray.........................
Paperhangers.................Drywall tapers.................Pipefitters.......................
Sprinkler fitters............Plasterers.......................Plumbers........................Reinforcing iron workers ....Roofers, composition.......Roofers, slate and tile ......Sheet-metal workers........Stonemasons..................Structural-iron workers.....
Ornamental.................Tile layers.......................
Helpers and laborers
Bricklayers’ tenders ...Mortar mixers......
Building laborers.....Composition roofers’
helpers:Class A ...............Class B ................
Elevator constructors’ helpers.................
July 1, 1976 July 1, 1977
Rate per hour1
Rate per hour1
Hoursper
week2
Employer contributions for selected benefits3
Insurance4 Pension Vacation Other5
Dollars Percent Dollars Percent Dollars Percent Dollars Percent
$9,160 $9,460 40.00 0.650 0.900 6 0.250 0.0309.400 9.700 40.00 .650 - .900 - 6.250 - .030 -7.270 7.510 40.00 .650 - .900 - 8 .250 - .030 -8.850 9.500 40.00 .900 - .450 - - - - -
9.100 9.600 40.00 .730 _ 1.650 3.00 6 .300 _ .020 1.009.700 10.260 40.00 .545 .350 6.00 .257
10.285 8 10.285 40.00 .950 - 1.150 - - - .150 -
10.285 8 10.285 40.00 .950 - 1.150 - - - .150 -
8.835 8 8.835 40.00 .950 1.150 .1508.880 8.880 40.00 .520 - 1.200 - - - .044 _9.550 8 9.550 35.00 .600 - .450 - - - .030 _9.650 9.800 40.00 .950 - 1.000 - - - - -
9.650 9.800 40.00 .950 _ 1.000 _ _ _ _ _8.800 9.050 40.00 .550 - .900 - 6.250 - - -9.050 9.300 40.00 .550 - .900 - 6.250 - _ _9.800 10.050 40.00 .550 - .900 _ 6.250 _ _ _8.800 9.050 40.00 .550 - .900 - 6.250 - - -8.800 9.050 40.00 .550 - .900 - 6 .250 - _ -
10.350 10.850 40.00 .830 - 1.030 - - - .070 _10.060 10.960 40.00 .650 - .950 - - - - _8.700 8.950 40.00 .900 - .450 - - _ - -
10.010 10.160 40.00 .860 - 1.540 - 6 .150 _ .050 _9.180 9.180 40.00 1.000 - 2.000 - 6 .250 _ .050 _9.900 9.850 40.00 .650 - .450 - 6.150 - - -
10.100 10.050 40.00 .650 - .450 - 6 .150 - -9.630 9.980 40.00 .960 - 1.300 - 6 .300 - .120 -9.550 9.550 40.00 .950 - 1.000 - - - .030 _9.180 9.180 40.00 1.000 - 2.000 - 6 .250 - .050 _9.180 9.180 40.00 1.000 - 2.000 - 8.250 - .050 _9.650 9.800 40.00 .950 1.000
7.500 7.750 40.00 .600 .750 .1807.750 8.000 40.00 .600 - .750 - - - .180 _7.500 7.750 40.00 .600 ~ .750 - - .180 -
9.050 9.000 40.00 .650 . .450 6 .1508.550 8.450 40.00 .650 - .450 - 8 .150 - -
6.790 7.180 40.00 .545 - .350 - - 6.00 .257 -
See footnotes at end of table.
136
Digitized for FRASER http://fraser.stlouisfed.org/ Federal Reserve Bank of St. Louis

(Union hourly wage rates, July 1, 1976, and wage rates, straight-time weekly hours, and employer insurance, pension, vacation, and other contributions to funds in the building trades, July 1, 1977)
Table 20. Wage rates, hours, and employer contributions for selected benefits: Selected cities—Continued
July 1, 1976 July 1, 1977
City and job classification Hoursper
week2
Employer contributions for selected benefits3Rate per
hour1Rate per
hour1 Insurance4 Pension Vacation Other*
Dollars Percent Dollars Percent Dollars Percent Dollars Percent
Providence, R.I. —Continued
Building construction —Continued
Helpers and laborers — Continued
Marble setters’ helpers.......... $7,810 $7,950 40.00 1.150Plasters’ laborers.................. 7.750 8.000 40.00 0.600 - .750 - - - 0.150 -
Terrazzo workers’ ................. 7.810 7.950 40.00 - - 1.150 - - - - -
Tile layers’ helpers................ 7.810 7.950 40.00 - - 1.150 - - - - -
Highway and street construction
Journeymen
Carpenters, piledrivers........... 9.160 9.460 40.00 .650 .900 6 0.250 .030Cement finishers................... 8.000 8.250 40.00 .500 - .350 - - - - -Engineers— Power equip
ment operators:Heavy equipment:Cranes, draglines, pavers, shovels............... 10.095 10.345 40.00 .950 1.150 .527
Medium equipment:Pile drivers, lighters, derricks.................... 10.095 10.345 40.00 .950 1.150 .527
Light equipment:Pumps and air compressors, mixers stone crushers................. 8.445 8.695 40.00 .950 1.150 .527
Helpers and laborers
General laborers................... 7.500 7.750 40.00 .600 .750 .200
Other heavy construction
Journeymen
Engineers— Power equipment operators:Heavy equipment:
Cranes, shovel, draglines, pavers............. 10.345 10.975 40.00 .950 1.150 .150
Medium equipment: Piledriverslighters, derricks.............. 10.345 10.975 40.00 .950 1.150 .150
Light equipment:Pumps and air compressors, mixers, stone crushers................ 8.905 9.275 40.00 .950 - 1.150 - - - .150 -
See footnotes at end of table.
137
Digitized for FRASER http://fraser.stlouisfed.org/ Federal Reserve Bank of St. Louis

Table 20. Wage rates, hours, and employer contributions for selected benefits: Selected cities—Continued
(Union hourly wage rates, July 1, 1976, and wage rates, straight-time weekly hours, and employer insurance, pension, vacation, and othercontributions to funds in the building trades, July 1, 1977)
City and job classification
July 1,1976 July 1, 1977
Employer contributions for selected benefits3Rate per
hour1Rate per
hour1noursper
week2Insurance4 Pension Vacation Other5
Dollars Percent Dollars Percent Dollars Percent Dollars Percent
Riverside, Calif.
Building construction
Journeymen
Asbestos workers ................. $11,350 $12,100 40.00 0.870 1.100 1.000Boilermakers......................... 12.000 13.175 40.00 .775 - 1.000 - .500 - _ _Bricklayers............................ 10.100 10.700 40.00 1.280 - 1.550 - 6.500 - 0.250 _Carpenters........................... 9.540 10.050 40.00 1.490 - 1.950 - 1.000 - .020 _Cement finishers................... 9.410 9.810 40.00 1.300 - 1.750 - 1.000 _ _ -Electricians........................... 11.510 12.360 40.00 .850 - 1.650 3.00 - - - 1.00Elevator constructors.............Engineers— Power equip-
12.000 12.950 40.00 .545 “ .350 • - 6.00 .020 2.31
ment operators: Backhoe, clamshell (over 3/4 yard),draglines, shovels........... 10.290 11.740 40.00 1.000 - 2.000 - .500 - .100 -
Tractor— Up to 100hP................................. 10.180 11.630 40.00 1.000 - 2.000 - .500 - .100 _
A-frame or winchtruck operator................ 9.820 11.270 40.00 1.000 - 2.000 - .500 - .100 _
Motor patrol blade operator:
Single engine............... 10.410 11.860 40.00 1.000 - 2.000 - .500 - .100 -Multi-engine ................ 10.580 12.030 40.00 1.000 - 2.000 - .500 - .100 -
Compressor operator....... 9.250 10.700 40.00 1.000 - 2.000 - .500 - .100 -Concrete mixer-slip.......... 9.530 10.980 40.00 1.000 - 2.000 - .500 - .100 -Tractor— Over 100 hp ...... 10.290 11.740 40.00 1.000 - 2.000 - .500 - .100 _Concrete mixer— Paving ................................ 10.290 11.740 40.00 1.000 - 2.000 - .500 - .100 _
Skip loaders (3/4 -1 -1 /2 yards.................... 10.180 11.630 40.00 1.000 - 2.000 - .500 - .100 -
Skip loader (1-1/2 -6-1 /2 yards)................... 10.290 11.740 40.00 1.000 - 2.000 - .500 - .100 _
Tractor loader— Over6-1 /2 yards.................... 10.410 11.860 40.00 1.000 - 2.000 - .500 - .100 -
Trenching machine operator (up to 6ft).................................. 9.960 11.410 40.00 1.000 - 2.000 - .500 - .100 -
Canal liner operator .............................. 10.710 12.160 40.00 1.000 - 2.000 - .500 - .100 _
Glaziers ............................... 9.522 9.736 40.00 .670 - 1.450 - - 8.00 .100 5.00Lathers ................................ 10.900 11.500 40.00 .700 - .900 - .500 - .120 _Machinists............................ 11.400 12.400 40.00 .472 - .600 - - - - _Marble setters...................... 9.529 10.701 40.00 - 10.27 - 12.95 - 4.46 - 6.69Painters............................... 10.370 10.990 40.00 1.090 - 1.180 - .750 - .240 -Paperhangers....................... 10.870 11.490 40.00 1.090 - 1.180 - .750 - .240 -Pipefitters.................. .......... 11.600 12.410 40.00 - 10.00 - 16.00 - 13.00 - 2.00Plasterers............................. 11.858 12.750 40.00 - - - - 6 1.913 - 6 .337 _Plumbers.............................. 11.660 12.410 40.00 - 10.00 - 16.00 - 13.00 - 2.00Reinforcing iron workers........ 11.030 11.550 40.00 1.240 - 2.220 - 1.460 - .100 -Roofers, composition............. 9.300 9.900 40.00 .800 - .650 - 1.000 - .160 -Roofers, slate and tile ........... 9.300 9.900 40.00 .800 - .650 - 1.000 - .160 -Sheet-metal workers.............. 8.055 9.090 40.00 1.040 - 1.800 - - 6 10.00 .290 -Stonemasons........................ 10.100 10.700 40.00 1.280 - 1.550 - 6.500 - .250 _Structural-iron workers........... 11.030 11.550 40.00 1.240 - 2.220 - 1.460 - .100 -Terrazzo workers..................Tile layers (tile
10.720 8 10.720 40.00 .300 ” .800 ~ 6 .700 - .300 -
setters).............................. 10.220 10.720 40.00 1.280 “ 1.550 6.500 - .250 -
See footnotes at end of table.
138
Digitized for FRASER http://fraser.stlouisfed.org/ Federal Reserve Bank of St. Louis

Table 20. Wage rates, hours, and employer contributions for selected benefits: Selected cities—Continued
(Union hourly wage rates, July 1, 1976, and wage rates, straight-time weekly hours, and employer insurance, pension, vacation, and other contributions to funds in the building trades, July 1, 1977)
July 1, 1976 July 1, 1977
City and job classification Hoursper
week2
Employer contributions for selected benefits3Rate per
hour1Rate per
hour1 Insurance4 Pension Vacation Other5
Dollars Percent Dollars Percent Dollars Percent Dollars Percent
Riverside, Calif. —Continued
Building construction —Continued
Helpers and laborers
Bricklayers’ tenders............... $8,255 $8,450 40.00 1.050 2.300 0.500 0.100Building laborers
(general const.)................... 7.655 7.950 40.00 1.050 _ 2.300 _ .500 _ .100 .Elevator constructors’
helpers.............................. 8.400 9.065 40.00 .545 _ .350 . _ 6.00 .020 2.31Marble setters’ helpers.......... +6.280 6.950 40.00 1.250 - 1.240 - 6.500 - - -
Plasterers’ laborers (tenders)............................ 10.370 40.00 1.050 _ 2.450 . .750 .
Terrazzo workers’ helpers.............................. 8.880 9.480 40.00 .750 _ 1.200 . 1.000 . .300
Tile layers’ helpers................ 8.460 8.960 40.00 1.250 - 1.240 - 6 .500 - .320 -Certified helpers................ 8.740 9.240 40.00 1.250 - 1.240 - 6 .500 - .320
Rochester, N.Y.
Building construction
Journeymen
Asbestos workers ................. 8 11.070 11.620 40.00 1.300 .600 .040Bricklayers............................ 10.665 11.265 40.00 .750 - .850 - - - !090 -
Residential........................ 8 7.190 31 6.410 40.00 .750 - .850 - - - .090 -Carpenters, general............... 10.300 10.300 40.00 .850 - 1.060 - - - .430 -
Residential........................ 5.500 5.500 40.00 .850 - 1.060 - - - .360 -Floor layers, hardwood tile and carpeting.............. 9.420 9.870 40.00 .850 _ .660 _ _ _ .055 _
Millwrights......................... 10.720 10.720 40.00 .850 - .960 - - - .421 -Cement finishers................... 10.665 11.265 40.00 .750 - .850 - - - .090 -
Residential........................ 8 6.990 31 6.410 40.00 .750 - .850 - - - .090 -Drywall tapers....................... 8.950 9.300 40.00 .980 - .620 - - - .380 -Electricians (inside
wirers)............................... + 10.350 11.050 40.00 .700 _ 1.350 3.00 6 .500 _ _ 1.25Elevator constructors............. 11.350 11.550 40.00 .545 - .350 - - 6.00 .287 -Engineers— Power equip
ment operators:Heavy equipment—Cranes, derricks, piledrivers........................ 10.460 10.960 40.00 .600 .600 .500 2.31
Medium equipment—Hoists, concrete pumps, high pressure boilers............................. 10.280 10.780 40.00 .600 .600 .500 2.31
Light equipment—Pumps, compressors, mixers.............................. 9.185 9.685 40.00 .600 .600 .500 2.31
Residential......................... 7.100 7.500 40.00 .600 - .600 - - - .500 2.31Glaziers............................... 9.400 9.950 40.00 1.020 - .610 - - - .050 -Lathers................................ 10.780 10.780 40.00 - - .500 - - - .060 -Machinists............................ 9.750 10.250 40.00 .500 - - - .050 - - -
Marble setters...................... 11.860 12.360 40.00 - - - - - - .030 -Mosaic and terrazzo
workers.............................. 11.860 12.360 40.00 - - - - - - .030 -
See footnotes at end of table.
139Digitized for FRASER http://fraser.stlouisfed.org/ Federal Reserve Bank of St. Louis

Table 20. Wage rates, hours, and employer contributions for selected benefits: Selected cities—Continued
(Union hourly wage rates, July 1, 1976, and wage rates, straight-time weekly hours, and employer insurance, pension, vacation, and othercontributions to funds in the building trades, July 1, 1977)
City and job classification
Rochester, N.Y.—Continued
Building construction —Continued
Journeymen— Continued
Painters........................Structural steel:To 40 feet.................Over 40 feet..............
Spray:Regular....................Bridge.......................
Paperhangers................Pipefitters......................Plasterers......................
Residential.................Plumbers.......................Reinforcing iron workers ...Roofers, composition......Roofers, slate and tile .....Sheet-metal workers.......
Residential.................Stonemasons.................
Residential.................Structural-iron workers....
Finishers (ornamental) .. Tile layers......................
Helpers and laborers
Building laborers............Elevators constructors’
helpers.... ..........................Marble setters’ helpers...Terrazzo workers’
helpers........................Machine operators
(grinders).................Tile layers’ helpers..........
Highway and street construction
Journeymen
Carpenters..................Piledrivers...............
Cement finishers..........Engineers— Power equip
ment operators:Class A— Backhoes, cranes, draglines, piledrivers..............
July 1, 1976 July 1, 1977
Rate per hour1
Rate per hour1
Hoursper
week2
Employer contributions for selected benefits3
Insurance4 Pension Vacation Other5
Dollars Percent Dollars Percent Dollars Percent Dollars Percent
$8,950 $9,300 40.00 0.980 0.620 0.380
9.450 9.800 40.00 .980 _ .620 _ _ _ .3809.650 10.000 40.00 .980 - .620 - - - .380 -
9.550 9.900 40.00 .980 _ .620 _ _ _ .380 _9.950 10.300 40.00 .980 - .620 - - - .380 -9.200 9.550 40.00 .980 - .620 - - - .380 _
10.490 10.990 40.00 .705 - .820 - 0.550 - 2.070 -
10.665 11.265 40.00 .750 - .850 - - - .090 -8 7.190 31 6.410 40.00 .750 - .850 - - - .090 -
10.490 10.990 40.00 .705 - .820 - .550 - 2.070 -
10.290 10.630 40.00 .900 - .920 - - - .170 -
10.420 10.960 40.00 .660 - .660 - 6.250 - .030 -
10.420 10.960 40.00 .660 - .660 - 6.250 - .030 -
10.340 10.770 40.00 .700 - 1.270 - 6.750 - .150 -
5.000 5.000 40.00 .700 - 1.270 - - - - -
10.665 11.265 40.00 .750 - .850 - - - .090 -
8 7.190 31 6.410 40.00 .750 - .850 - - - .090 -
10.290 10.630 40.00 .900 - .920 - - - .170 -
10.290 10.630 40.00 .900 - .920 - - - .170 -
11.860 12.360 40.00 .030
8.000 8.000 40.00 1.050 _ .990 _ _ _ .670
7.945 8.085 40.00 .545 _ .350 _ _ 6.00 .287 _8 9.050 9.150 40.00 - - .990 - - - .600 -
11 9.050 9.150 40.00 - - .990 - - - .600 -
9.150 9.250 40.00 _ _ .990 _ _ - .600 _
9.050 9.150 40.00 .990 .600
8.580 8.880 40.00 .850 .660 .4388.250 8.580 40.00 .850 - .960 - - - .436 -
8.890 8.990 40.00 .750 .850 .040
9.700 10.200 40.00 .600 .600 - - - .450 2.31
See footnotes at end of table.
140
Digitized for FRASER http://fraser.stlouisfed.org/ Federal Reserve Bank of St. Louis

(Union hourly wage rates, July 1, 1976, and wage rates, straight-time weekly hours, and employer insurance, pension, vacation, and other contributions to funds in the building trades, July 1, 1977)
Table 20. Wage rates, hours, and employer contributions for selected benefits: Selected cities—Continued
July 1, 1976 July 1, 1977
City and job classification Hoursper
week2
Employer contributions for selected benefits3Rate per
hour1Rate per
hour1 Insurance4 Pension Vacation Other5
Dollars Percent Dollars Percent Dollars Percent Dollars Percent
Rochester, N.Y.—Continued
Highway and street construction —Continued
Journeymen— Continued
Class B— Concrete pumps, one-drum hoists, rollers (all above subgrade)............... $9,500 $10,000 40.00 0.600 0.600 .450 2.31
Class C— Forklifts, hydraulic hammers, concrete pavement spreaders and finishers ................................... 9.200 9.700 40.00 .600 .600 | .450 2.31
Class D— Concrete mixers (165 and under), form tampers, tractors ................................. 8.450 8.700 40.00 .600 .600 .450 2.31
Class E— Oilers, junior engineers.................... 8.200 8.450 40.00 .600 - .600 - - - .450 2.31
Helpers and laborers
General laborers................... 7.370 7.450 40.00 1.050 .990 0.772Meter setters and changers......................... 7.670 7.750 40.00 1.050 _ .990 _ _ _ .772
Asphalt rakers, wagon drill operators, curb stone setters.................... 7.620 7.700 40.00 1.050 .990 .772
Pipe layers, power tool operators (air, electric, gas and diesel).............................. 7.570 7.650 40.00 1.050 .990 .772
Blasters............................ 9.120 9.200 40.00 1.050 - .990 - - - .772 -
Other heavy construction
Journeymen
Carpenters........................... 8.580 8.880 40.00 .850 .660 .438Piledrivers ......................... 8.580 8.580 40.00 .850 - .960 - - - .436 -
Cement finishers................... 8.890 8.990 40.00 .750 - .850 - - - .040 -Engineers— Power equipment operators:Heavy equipment— Cable- ways, piledrivers, cranes, shovels, carryalls, type scrappers......... 9.690 10.150 40.00 .600 .600 .470 2.31
See footnotes at end of table.
141Digitized for FRASER http://fraser.stlouisfed.org/ Federal Reserve Bank of St. Louis

Table 20. Wage rates, hours, and employer contributions for selected benefits: Selected cities—Continued
(Union hourly wage rates, July 1, 1976, and wage rates, straight-time weekly hours, and employer insurance, pension, vacation, and othercontributions to funds in the building trades, July 1, 1977)
City and job classification
July 1,1976 July 1, 1977
Employer contributions for selected benefits3Rate per
hour1Rate per
hour1noursper
week2Insurance4 Pension Vacation Other5
Dollars Percent Dollars Percent Dollars Percent Dollars Percent
Rochester, N.Y. —Continued
Other heavy construction —Continued
Journeymen— Continued
Medium equipment— Dinky locomotives, hoists (1-drum), concrete pumps (under 8 in.) high pressure boilers (15 lbs. and over) .............. $9,370 $9,820 40.00 0.600 0.600 .470 2.31
Light equipment— Pumps (under 4 in .)...................... 7.900 8.270 40.00 .600 _ .600 _ _ . .470 2.31
Compressors (315 cf and over), pumps (4 in. and over)................ 8.690 9.100 40.00 .600 .600 .470 2.31
Master mechanics............... 10.260 10.750 40.00 .600 - .600 - - - .470 2.31
Helpers and laborers
Laborers.............................. 6.800 6.800 40.00 1.050 .990 0.620
Rockford, ill.
Building construction
Journeymen
Asbestos workers ................. 10.220 11.150 40.00 .700 .800 1.000 .040Boilermakers......................... 11.550 12.300 37.50 .950 - 1.000 - - - .470 5.00Bricklayers............................ 9.900 10.450 40.00 .400 - .400 - *.450 - .030 -Carpenters........................... 10.050 10.300 40.00 .400 - .700 - - - 6.250 -
Millwrights......................... 9.780 10.060 40.00 .400 - .800 - - - 8 1.050 -Cement finishers................... 9.730 10.280 40.00 .400 - .450 - - - 8 .220 -Drywall tapers (fin
ishers ................................ 9.350 9.850 40.00 .400 . _ 8.500Electricians (inside
wirers)............................... 10.403 11.068 40.00 .400 _ .400 3.00 5.00 1.50Elevator constructors............. 11.010 11.420 40.00 .745 - .350 - - 6.00 .020 2.31Engineers— Power equip
ment operators:Heavy— Cranes................. 10.550 11.850 40.00 .750 .850 .400Medium— Small tractors types............................... 9.250 10.550 40.00 .750 _ .850 _ .400 _ _
Light— Air compressors ................................. 8.100 9.400 40.00 .750 . .850 . .400
Oilers............................... 6.850 8.150 40.00 .750 - .850 - .400 - - _Glaziers............................... 9.440 9.660 40.00 .440 - .250 - 1.250 - - _Lathers ................................ 9.440 9.790 40.00 .400 - .450 - 6.500 - .040 _Marble setters ...................... 9.300 9.900 40.00 .400 - .300 - 6.250 - .020 -Mosaic and terrazzo
workers.............................. 9.300 9.900 40.00 .400 _ .300 _ 8 .250 _ .020Painters............................... 9.350 9.850 40.00 .400 - - - 8 .500 - - -
Swing stage...................... 9.600 10.100 40.00 .400 - - - 6 .500 - - -Structural steel.................. 9.600 10.100 40.00 .400 - - - 6 .500 - - -
Paperhangers....................... 9.350 9.850 40.00 .400 6 .500 “ -
See footnotes at end of table.
142
Digitized for FRASER http://fraser.stlouisfed.org/ Federal Reserve Bank of St. Louis

(Union hourly wage rates, July 1, 1976, and wage rates, straight-time weekly hours, and employer insurance, pension, vacation, and other contributions to funds in the building trades, July 1, 1977)
Table 20. Wage rates, hours, and employer contributions for selected benefits: Selected cities—Continued
July 1, 1976 July 1, 1977
City and job classification Hoursper
week2
Employer contributions for selected benefits3Rate per
hour1Rate per
hour1 Insurance4 Pension Vacation Other5
Dollars Percent Dollars Percent Dollars Percent Dollars Percent
Rockford, III. —Continued
Building construction —Continued
Journeymen— Continued
Pipefitters............................. $10,100 $10,700 40.00 0.450 _ 0.600 _ 6 0.750 0.100 _Refrigeration fitters............ 10.100 10.700 40.00 .450 - .600 - 6.750 - .100 -
Plasterers............................. 9.080 9.530 40.00 .400 - .500 - 6.500 - .030 _Plumbers............................. 10.100 10.700 40.00 .450 - .600 - 6.750 - .100 _Reinforcing iron workers........ 11.875 12.600 40.00 .650 - .375 - - - .100 -Roofers, composition............. 9.550 10.200 40.00 .400 - - - - - 6 1.000 -Roofers, slate and tile ............ 9.550 10.200 40.00 .400 - - - - - 6 1.000 -Sheet-metal workers.............. 9.600 10.550 40.00 .400 - .830 - 6 .500 - .120 -Stonemasons........................ 9.900 10.450 40.00 .400 - .400 - 6.450 - .030 -Structural-iron workers........... 11.875 12.600 40.00 .650 - .375 - - - .100 -Tile layers............................. 9.300 9.900 40.00 .400 - .300 - 6 .250 - .020 -
Helpers and laborers
Medium— Small tractorstypes............................... 9.250 10.550 40.00 .750 - .850 - .400 - - -
Bricklayers’ tenders............... 8.710 9.310 40.00 .400 - .540 - - - .050 -Building laborers................... 8.510 9.110 40.00 .400 - .540 - - - .050 -Elevator constructors’
helpers.............................. 7.710 7.990 40.00 .745 - .350 - - 6.00 .020 2.31Marble setters’ helpers.......... 8.050 8.900 40.00 .600 - - - - - .250 -Plasterers’ laborers................ 8.710 9.310 40.00 .400 - .540 - - - .050 -Plumbers’ laborers................ 8.510 9.110 40.00 .400 - .540 - - - .050 -Terrazzo workers’
helpers.............................. 8.050 8.900 40.00 .600 - - - - - .250 -Wet and dry base machine operators................ 8.300 9.150 40.00 .600 - - - - - .250 -
Tile layers’ helpers................ 8.050 8.900 40.00 .600 - - - - - .250 -
Highway and street construction
Journeymen
Carpenters........................... 9.610 9.930 40.00 .400 1.250 6.450Cement finishers................... 9.730 10.280 40.00 .400 - .450 - - - 6 .220 -Engineers— Power equip
ment opertors:Heavy— Cranes................. 10.200 11.500 40.00 .750 - .850 - .400 - - -Medium— Small tractortypes............................... 9.650 10.950 40.00 .750 - .850 - .400 - - -
Light— Air compressors, pumps..................... 7.800 9.100 40.00 .750 - .850 - .400 - - -
Oilers............................... 6.800 8.100 40.00 .750 - .850 - .400 - - -Minor equipment................ 8.900 10.200 40.00 .750 - .850 - .400 - - -
Structural iron workers........... 11.875 12.600 40.00 .650 - .375 - - - .100 -
Helpers and laborers
Laborers.............................. 8.510 9.110 40.00 .400 - .540 - - - .050 _
See footnotes at end of table.
143Digitized for FRASER http://fraser.stlouisfed.org/ Federal Reserve Bank of St. Louis

Table 20. Wage rates, hours, and employer contributions for selected benefits: Selected cities—Continued
(Union hourly wage rates, July 1, 1976, and wage rates, straight-time weekly hours, and employer insurance, pension, vacation, and othercontributions to funds in the building trades, July 1, 1977)
City and job classification
Rockford, III. —Continued
Other heavy construction
Journeymen
Carpenters ....................Cement finishers............Engineers— Power equip
ment operators:Heavy— Cranes...........Medium— Small tractortypes........................
Light— Air compressors, pumps...............
Oilers........................Minor equipment.........
Structural iron workers....
Helpers and laborers
Laborers...................
St. Louis, Mo.
Building construction
Journeymen
Asbestos workers .........Boilermakers................Bricklayers:
Commercial...............Residential................Sewer manholes, over6 feet......................
Carpenters...................Residential................Millwrights................Piledrivers ................Hardwood floor layers:Commercial .............Residential...............
Cement finishers...........Drywall tapers
(finishers)...................Electricians (inside
wirers).......................Elevator constructors.....Engineers— Power equip
ment operators:Group 1:Cranes, derricks, piledrivers and shovels..................
July 1, 1976 July 1, 1977
Rate per hour1
Rate per hour1
Hoursper
week2
Employer contributions for selected benefits3
Insurance4 Pension Vacation Other5
Dollars Percent Dollars Percent Dollars Percent Dollars Percent
$9,610 $9,930 40.00 0.400 1.250 6 0.4509.730 10.280 40.00 .400 - .450 - - - 6 .220 -
10.200 11.500 40.00 .750 - .850 - 0.400 - - -
9.650 10.950 4Q.00 .750 - .850 - .400 - - -
7.800 9.100 40.00 .750 _ .850 - .400 _ _ _6.800 8.100 40.00 .750 - .850 - .400 - - -8.900 10.200 40.00 .750 - .850 - .400 - - -
11.875 12.600 40.00 .650 .375 .100
8.510 9.110 40.00 .400 - .540 - - - .050 -
+ 9.510 10.030 40.00 .500 .900 6 1.8209.600 10.450 40.00 .850 - 1.000 - - - - -
9.400 10.000 40.00 .720 _ .700 _ .900 _ .150 _9.400 10.000 40.00 .720 - .700 - .900 - .150 -
9.400 10.000 40.00 .720 _ .700 _ .900 _ .1509.960 10.160 40.00 .650 - .700 - 6.500 - .070 _
9.960 10.160 40.00 .650 - .700 - 6.500 - .070 -9.960 10.160 40.00 .650 - .700 - 6 .500 - .070 -
9.960 10.160 40.00 .650 - .700 - 6 .500 - .070 -
9.280 9.670 40.00 .880 _ .500 _ .500 _ _ _
9.280 9.670 40.00 .880 - .500 - .500 - - -
9.150 9.200 40.00 1.100 - .950 - 6 1.200 - - -
9.460 10.080 40.00 .420 - .300 - .300 - .080 -
10.300 10.950 37.50 .620 _ .600 3.00 .770 _ .930 1.0010.050 10.700 40.00 .545 .350 6.00 .020 2.30
9.520 9.870 40.00 .500 - 1.000 - 6 .650 - .140 -
See footnotes at end of table.
144
Digitized for FRASER http://fraser.stlouisfed.org/ Federal Reserve Bank of St. Louis

Table 20. Wage rates, hours, and employer contributions for selected benefits: Selected cities—Continued
(Union hourly wage rates, July 1, 1976, and wage rates, straight-time weekly hours, and employer insurance, pension, vacation, and othercontributions to funds in the building trades, July 1, 1977)
City and job classification
St. Louis, Mo. —Continued
Building construction —Continued
Journeymen— Continued
Group 2:Compressors (2), concrete pumps, elevating graders, 2-drum hoists, scoops .
Group 3:Compressor (1), concrete saws,1-drum hoists............
Group 4:Conveyors, oilers........
Glaziers..........................Lathers ..........................Machinists......................Marble setters .................Mosaic and terrazzo
workers........................Painters, general.............
Spray..........................Paperhangers.................Pipefitters.......................
Sprinkler fitters............Plasterers.......................Plumbers........................Reinforcing iron workers ....Roofers, composition........Roofers, slate and tile ......Sheet-metal workers.........Stonemasons..................Structural-iron workers.....Tile layers.......................
Helpers and laborers
Bricklayers’ tenders.........Building laborers.............
Residential laborers......Elevator constructors’
helpers........................Marble setters’ helpers ....Plasterers’ tenders..........Plumbers’ laborers..........Terrazzo workers’
helpers........................Base-machine operators
Tile setters’ helpers.........
July 1,1976 July 1, 1977
Employer contributions for selected benefits3Rate per
hour1Rate per
hour1noursper
week2Insurance4 Pension Vacation Other5
Dollars Percent Dollars Percent Dollars Percent Dollars Percent
$9,520 $9,870 40.00 0.500 1.000 6 0.650 0.140
9.020 9.370 40.00 .500 - 1.000 - 6.650 - .140 _
8.520 8.870 40.00 .500 _ 1.000 _ 6 .650 .140 _10.040 10.730 40.00 + .290 - 1.130 - - 8.00 - _9.775 10.905 40.00 .570 - .550 - - - .150 -
+ 10.560 10.760 40.00 6.450 - 23.300 - 8.500 - - -8.826 9.177 40.00 .555 - 1.000 - - 5.00 - -
10.400 10.700 40.00 _ _ _ _ .650 .050 _9.460 10.080 40.00 .420 - .300 - 6.300 - .080 -
10.960 11.580 40.00 .420 - .300 - 6.300 - .080 -
9.460 10.080 40.00 .420 - .300 - 6.300 - .080 -
10.450 11.350 40.00 2.165 - 1.510 - - - .075 -
9.660 10.460 40.00 .600 - .900 - 6 1.750 - - _
9.295 9.595 40.00 .680 - .800 - 8 1.000 - .150 -
10.355 11.155 37.50 .700 - .700 - .500 - + .700 -
9.075 9.725 40.00 .550 - .700 - 6.900 - * .050 -
8.650 9.450 40.00 .470 - .450 - 1.000 - - _
8.650 9.450 40.00 .470 - .450 - 1.000 - - -
10.290 10.290 37.50 .510 - .710 - .820 - .510 -
9.400 10.000 40.00 .720 - .700 - .900 - .150 -
9.075 9.725 40.00 .550 - .700 - 6.900 - .050 -
8.289 8.622 40.00 .555 1.000 10.00
+8.200 8.850 40.00 .450 1.000 8.300 23 .2008.775 9.125 40.00 .450 - 1.000 - 6.300 - 8 .210 -
8.225 8.725 40.00 .450 - 1.000 - 6.300 - 6 .210 -
7.035 7.490 40.00 .545 _ .350 _ _ 6.00 .020 2.309.280 10.080 40.00 - - - - - - - -
8.970 9.375 40.00 .450 - 1.000 - 8 .300 - 8 .250 -
8.950 9.500 40.00 .450 - 1.000 - 8.300 - 23 .150 -
9.500 9.850 40.00 _ _ _ _ 6.500 _ .050 _9.900 10.250 40.00 - - - - 6.500 - .050 -7.722 8.235 40.00 .555 .400 - - 8 10.00 - -
See footnotes at end of table.
145Digitized for FRASER http://fraser.stlouisfed.org/ Federal Reserve Bank of St. Louis

Table 20. Wage rates, hours, and employer contributions for selected benefits: Selected cities—Continued
(Union hourly wage rates, July 1, 1976, and wage rates, straight-time weekly hours, and employer insurance, pension, vacation, and other contributions to funds in the building trades, July 1, 1977)
July 1, 1976 July 1, 1977
City and job classification Hoursper
week2
Employer contributions for selected benefits3
Rate per hour1
Rate per hour1 Insurance4 Pension Vacation Other5
Dollars Percent Dollars Percent Dollars Percent Dollars Percent
St. Louis, Mo. —Continued
Highway and street construction
Journeymen
Engineers— Power equipment operators:Group 1— Cranes, derricks, 2-drum hoists, piledrivers, scoops, shovels............................ +$9,750 $10,500 40.00 0.500 1.000 6 0.400
Group 2— Compressors (2), concrete pumps, elevating graders, 1- drum hoists...................... +9.550 10.300 40.00 .500 1.000 .400
Group 3— Compressors (1), concrete saws, conveyors........................ +9.350 10.100 40.00 .500 1.000 .400
Group 4— Oilers................ +8.750 9.500 40.00 .500 - 1.000 - 6.400 - - -
Helpers and laborers
Laborers.............................. 8.875 9.125 40.00 .450 1.000 6 .300 0.210
Other heavy construction
Journeymen
Engineers— Power equipment operators:Group 1— Boom trucks, cranes, draglirtes, drilling machines,2- drum hoists, land or floating piledrivers, shovels............................ +9.300 9.300 40.00 .500 1.000 6 .400
Group 2— Forklifts,1-drum hoists................... +8.950 8.950 40.00 .500 _ 1.000 _ 6.400 _ _
Group 3— Boilers, conveyors, pumps, single compressors, welding machines......................... +8.750 8.750 40.00 .500 1.000 6 .400
Group 4— Oilers................ +7.900 7.900 40.00 .500 - 1.000 - 6 .400 - - -
Helpers and laborers
Laborers.............................. +8.975 9.125 40.00 .450 - 1.000 - 6 .300 - .210 _
See footnotes at end of table.
146
Digitized for FRASER http://fraser.stlouisfed.org/ Federal Reserve Bank of St. Louis

Table 20. Wage rates, hours, and employer contributions for selected benefits: Selected cities—-Continued
(Union hourly wage rates, July 1, 1976, and wage rates, straight-time weekly hours, and employer insurance, pension, vacation, and other contributions to funds in the building trades, July 1, 1977)
July 1, 1976 July 1, 1977
City and job classification Hoursper
week2
Employer contributions for selected benefits3Rate per
hour1Rate per
hour1 Insurance4 Pension Vacation Other5
Dollars Percent Dollars Percent Dollars Percent Dollars Percent
St. Petersburg, Fla.
Building construction
Journeymen
Asbestos workers................. $9,510 $10,180 40.00 0.500 0.450 6 0.750Boilermakers......................... 8.800 9.300 40.00 .950 - 1.000 - - - - -
Bricklayers:Commercial............ .......... 9.200 9.200 40.00 .450 . .500 . 0.040Residential........................ 7.170 7.170 40.00 .450 - .500 - - - .040 -
Carpenters:Commercial:Heavy .............................. 8.765 8.765 40.00 .500 .400 .025Light ............................... - 7.800 40.00 .500 - .400 - - - .025 -
Residential........................ - 5.000 40.00 .500 - .400 - - - .025 -Millwrights......................... 9.420 9.420 40.00 .550 - .700 - - - .020 -Piledrivers ......................... 8.700 9.000 40.00 .550 - .700 - - - .020 -
Cement finishers:Commercial....................... 8.600 8.600 40.00 .450 . .500 .040Residential........................ 6.850 6.850 40.00 .450 - .500 - - - .040 -
Drywall tapers (finishers) ............................... 8.800 9.250 40.00 .350 . .400 _ 6 .250 . .050
Electricians (inside wirers):
Commercial....................... +8.100 8.200 40.00 5.00 10.00 1.00Residential........................ +6.500 7.000 40.00 - 5.00 - 10.00 - - - 1.00
Elevator constructors............. 9.280 9.850 40.00 .545 - .350 - - 6.00 .020 2.30Engineers— Power equipment operators:
Group I— Cranes, derricks, material hoists (2 drums), graders............................ 10.890 10.890 40.00 .625 .600 .025
Group 2— Tugger hoists...... 10.140 10.140 40.00 .625 - .600 - - - .025 -Group 3— Material hoists (elevator), trenchers (over 24 in.)................................... 9.155 9.155 40.00 .625 .600 .025
Group 4— Bulldozers (crawlers)......................... 9.685 9.685 40.00 .625 _ .600 _ _ _ .025 _
Group 5— Air compressors (125 cu. ft. or over............................ 8.135 8.135 40.00 .625 .600 .025
Group 6— Material hoists, pumps................... 7.875 7.875 40.00 .625 _ .600 _ _ _ .025 _
Group 7— Air compressors (under 125 cu. ft.), mixers, trenchers (under 24 in .)................................. 7.645 7.645 40.00 .625 .600 .025
Glaziers............................... 7.700 7.700 40.00 .250 - .200 - 6 .450 - - -Lathers:
Commercial....................... 9.490 9.490 40.00 _ _ .200 _ _ .100 _Residential........................ 7.090 7.090 40.00 - - .200 - - - .100 -
Marble setters:Commerical....................... 9.200 9.200 40.00 .450 _ .500 _ _ _ .040 .
Residential........................ 7.170 7.170 40.00 .450 - .500 - - - .040 -Mosaic and terrazzo workers:
Commercial....................... 9.050 9.050 40.00 .450 - .500 - - - .040 -
See footnotes at end of table.
147
Digitized for FRASER http://fraser.stlouisfed.org/ Federal Reserve Bank of St. Louis

Table 20. Wage rates, hours, and employer contributions for selected benefits: Selected cities—Continued
(Union hourly wage rates, July 1, 1976, and wage rates, straight-tim e weekly hours, and em ployer insurance, pension, vacation, and othercontributions to funds in the building trades, July 1, 1977)
City and job classification
St. Petersburg, Fla. —Continued
Building construction —Continued
Journeymen— Continued
Residential...................Painters:
Commercial..................Residential...................
Paperhangers— CommercialPipefitters........................Plasterers:
Commercial..................Residential...................
Plumbers.........................Reinforcing iron workers...Roofers, composition........Roofers, slate and tile .......Sheet-metal workers:
Commercial...................Residential.....................
Stonemasons:Commercial..................Residential...................
Structural-iron workers......Tile layers:
Commercial..................Residential...................
Helpers and laborers
Bricklayers’ tenders........Building laborers............Composition roofers’
helpers........................Elevator constructors’
helpers ........................Marble setters’ helpers...Plasterers’ laborers.........Terrazzo workers’
laborers.......................Tile layers’ helpers..........
Highway and street construction
Journeymen
Piledrivers..........................
Other heavy construction
Journeymen
Piledrivers..........................
July 1, 1976 July 1, 1977
Rate per hour1
Rate per hour1
Hoursper
week2
Employer contributions for selected benefits3
Insurance4 Pension Vacation Other5
Dollars Percent Dollars Percent Dollars Percent Dollars Percent
$7,050 $7,050 40.00 0.450 0.500 0.040
7.950 8.400 40.00 .350 _ .400 6 0.250 _ .050 _5.240 5.240 40.00 .350 - .400 - • .250 - .050 -8.450 8.900 40.00 .350 - .400 - 6.250 _ .050 _9.830 10.380 40.00 .550 - .950 - - - - -
8.650 8.650 40.00 .450 _ .500 _ _ _ .100 _6.250 6.250 40.00 .450 - .500 - - - .100 -9.830 10.380 40.00 .550 - .950 - - - - -9.850 16 9.800 40.00 .650 - .500 - .500 - .035 _8.050 8.200 40.00 .400 - .200 - - - _ _8.050 8.200 40.00 .400 - .200 - - - - -
_ 7.750 40.00 .850 _ .550 6.250 .100 _- 4.750 40.00 .850 - .550 - 6.250 - .100 -
9.200 9.200 40.00 .450 _ .500 _ _ _ .040 _7.170 7.170 40.00 .450 - .500 - - - .040 _9.850 16 9.800 40.00 .650 - .500 - .500 - .035 -
9.050 9.050 40.00 .450 .500 _ _ _ .040 _7.050 7.050 40.00 .450 .500 .040
6.650 6.650 40.00 .425 .200 .0256.500 6.500 40.00 .425 - .200 - - - .025 -
4.600 4.650 40.00 .400 - .200 - - - -
6.500 6.800 40.00 .545 _ .350 _ 6.00 .020 2.306.700 6.700 40.00 .500 - .400 - - - .750 -
6.650 6.650 40.00 .425 - .200 - - - .025 -
6.700 6.700 40.00 .500 _ .400 _ _ .750 _6.700 6.700 40.00 .500 .400 .750
7.400 8.100 40.00 .550 - .700 - - - .020 -
7.400 8.100 40.00 .550 _ .700 _ - _ .020 _
See footnotes at end of table.
148
Digitized for FRASER http://fraser.stlouisfed.org/ Federal Reserve Bank of St. Louis

Table 20. Wage rates, hours, and employer contributions for selected benefits: Selected cities—Continued
(Union hourly wage rates, July 1, 1976, and wage rates, straight-tim e weekly hours, and employer insurance, pension, vacation, and othercontributions to funds in the building trades, July 1, 1977)
July 1,1976 July 1, 1977
City and job classification
Sacramento, Calif.
Building construction
Journeymen
Asbestos workers.........Boilermakers................Bricklayers....................Carpenters...................
Floor layers(hardwood)..............
Shinglers..................Millwrights................
Cement finishers...........Composition..............
Electricians (insidewirers).......................
Elevator constructors.....Engineers— Power equip
ment operators:Compressors............Compressors (2 to 6) .. Material hoists (1-drum)......................
Small rubber tiredtractors....................
Tractors, dozers, scrapers, sheep foot, self-prop compactor with dozer and pushcarts .......................
Euclid, T-pulls DW-10, 20, and 21 and similar (with earth- moving equipment up to and including 45cy struck mrc).........
Tractors with boom d- 6 or larger, and similar crane (not over 25 tons, hammerheadand gantry)..............
Power shovels, clamshell, draglines, backhoes, gradealls: Up to and including1 yard...................
Over 1 yd. and including 7 cu.yd.......
Universal Liebber and tower cranes (andsimilar types)...........
Glaziers.......................Lathers........................Mosaic and terrazzo
workers.....................Painters:
Brush.......................Spray.......................
Paperhangers...............
Employer contributions for selected benefits3Rate per
hour1Rate per
hour1noursper
week2Insurance4 Pension Vacation Other5
Dollars Percent Dollars Percent Dollars Percent Dollars Percent
$11,990 $12,410 40.00 0.970 1.100 1.520 0.08012.000 13.200 40.00 .750 - 1.000 - .500 - _ -
10.900 11.500 40.00 1.030 - 1.210 - 1.000 _ .180 _
11.250 11.650 40.00 1.220 - 1.710 - .850 - .120 -
11.400 11.800 40.00 1.220 _ 1.710 _ .850 _ .120 _11.400 11.800 40.00 1.220 - 1.710 - .850 - .120 -
11.750 12.150 40.00 1.220 - 1.710 - .850 _ .120 -
10.000 10.500 40.00 1.150 - 1.430 - 1.650 - _ _
10.250 10.500 40.00 1.150 - 1.430 - 1.650 - - -
10.314 12.952 32 36.00 .950 .850 3.00 _ 6 4.00 _ 33 7.0012.390 13.930 40.00 .545 - .350 - - 6.00 .025 2.31
9.050 8 9.050 40.00 1.120 2.000 .900 .24010.020 8 10.020 40.00 1.120 - 2.000 - .900 - .240 -
9.810 8 9.810 40.00 1.120 - 2.000 - .900 - .240 -
10.170 8 10.170 40.00 1.120 - 2.000 - .900 - .240 -
10.720 8 10.720 40.00 1.120 - 2.000 - .900 - .240 -
10.720 8 10.720 40.00 1.120 - 2.000 - .900 - .240 -
10.940 8 10.940 40.00 1.120 - 2.000 - .900 - .240 -
11.250 8 11.250 40.00 1.120 - 2.000 _ .900 .240 _
11.420 8 11.420 40.00 1.120 - 2.000 - .900 - .240 -
11.420 8 11.420 40.00 1.120 2.000 . .900 _ .2409.745 10.886 40.00 .580 - 1.500 - .871 - .478 -9.270 10.470 40.00 .670 - 1.250 - 1.250 - .640 -
10.900 11.500 40.00 1.030 - 1.210 - 6 1.000 - .180 -
10.920 11.120 35.00 .990 _ 1.300 _ .400 _ .400 _
11.800 11.620 35.00 .990 - 1.300 - .400 - .400 -10.920 11.870 35.00 .990 ■ 1.300 .400 - .400 -
See footnotes at end of table.
149Digitized for FRASER http://fraser.stlouisfed.org/ Federal Reserve Bank of St. Louis

Table 20. Wage rates, hours, and employer contributions for selected benefits: Selected cities—Continued
(Union hourly wage rates, July 1, 1976, and wage rates, straight-tim e weekly hours, and em ployer insurance, pension, vacation, and othercontributions to funds in the building trades, July 1, 1977)
City and job classification
Sacramento, Calif. —Continued
Building construction —Continued
Journeymen — Continued
Pipefitters.......................Plasterers.......................Plumbers........................Reinforcing iron workers ....Roofers, composition.......Roofers, slate and tile ......Sheet-metal workers........Stonemasons..................
Blocklayers.................Structural and ornamental
iron workers.................Fence erectors............
Tile layers.......................
Helpers and laborers
Bricklayers’ tenders .........Building laborers ............Elevator constructors’
helpers........................Plasterers’ laborers
(hod carriers) ...............Terrazzo workers’
helpers........................Base machine.............Floor machine men......
Tile layers’ helpers..........
San Antonio, Texas
Building construction
Journeymen
Asbestos workers ...Bricklayers..............Carpenters.............
Millwrights...........Cement finishers.....
Machine operators Drywall tapers(finishers)..............
Electricians (insidewirers).................
Elevator constructors
July 1, 1976 July 1, 1977
Rate per hour1
Rate per hour1
Hoursper
week2
Employer contributions for selected benefits3
Insurance4 Pension Vacation Other5
Dollars Percent Dollars Percent Dollars Percent Dollars Percent
$11,230 $11,490 40.00 1.320 1.810 6 2.350 0.1709.890 11.340 40.00 .860 - 1.600 - 6 1.000 - .140 -
11.230 11.490 40.00 1.320 - 1.810 - 6 2.350 - .170 -10.530 11.300 40.00 1.140 - 1.860 - 6 1.200 - .030 -9.360 10.110 40.00 1.040 - 1.100 - 1.000 - .080 -
9.360 10.110 40.00 1.040 - 1.100 - 1.000 - .080 -11.090 11.680 40.00 .660 - 1.650 - - 12.00 .300 -10.900 11.500 40.00 1.030 - 1.210 - 6 1.000 - .180 _10.900 11.500 4oroo 1.030 - 1.210 - 6 1.000 - .180 -
10.530 11.300 40.00 1.140 - 1.860 _ 6 1.200 _ .0309.640 10.410 40.00 1.140 - 1.860 - 6 1.200 - .030 -
. 11.000 12.000 40.00 .980 1.200 1.400 .150
7.855 8.880 40.00 1.250 1.700 1.000 .1208.035 8.525 40.00 1.250 - 1.700 - 1.000 - .210 -
8.670 9.750 40.00 .545 - .350 - - 6.00 .025 2.31
9.810 10.360 40.00 1.250 - 1.700 - 1.000 - .180 -
9.460 10.160 35.00 .750 _ .600 _ 1.000 _ .2009.860 10.560 35.00 .750 - .600 - 1.000 - .200 -9.460 10.160 35.00 .750 - .600 - 1.000 - .200 -7.300 8.460 40.00 .800 6 1.000 .150
. +8.892 9.320 40.00 .600 .600 6 10.008.570 9.270 40.00 .450 - .300 - .250 - .050 -
7.770 8.120 40.00 .430 - .400 - .400 - .010 -
8.070 8.420 40.00 .430 - .400 - .400 - .010 -
8.270 8.400 40.00 .400 - - - .650 - - -
8.520 8.650 40.00 .400 - - - .650 - - -
7.550 8.300 40.00 - - .200 - - - - -
9.348 10.070 40.00 .440 _ 5.00 _ 6 5.00 _ 2.009.070 9.270 40.00 .545 - .350 - - 6.00 .020 2.30
See footnotes at end of table.
150
Digitized for FRASER http://fraser.stlouisfed.org/ Federal Reserve Bank of St. Louis

Table 20. Wage rates, hours, and employer contributions for selected benefits: Selected cities—Continued
(Union hourly wage rates, July 1, 1976, and wage rates, straight-tim e weekly hours, and em ployer insurance, pension, vacation, and othercontributions to funds in the building trades, July 1, 1977)
July 1, 1976 July 1, 1977
Rate per hour1
Rate per hour1
Hoursper
week2
Employer contributions for selected benefits3
Insurance4 Pension Vacation Other5
Dollars Percent Dollars Percent Dollars Percent Dollars Percent
$8,320 $8,670 40.00 0.450 0.750
7.440 7.740 40.00 .450 .7508.760 8.840 40.00 - - - - 6 0.500 - 0.080 -
8.190 8.190 40.00 .400 - .300 - .250 - - -
7.550 8.300 40.00 - - .200 - - - -7.800 8.550 40.00 - - .200 - - - - -
8.050 8.800 40.00 - - .200 - - - - -
7.800 8.550 40.00 _ _ .200 _ - _ _ _7.550 8.300 40.00 - - .200 - - - - -
9.060 9.960 40.00 .400 - .550 - 6 .750 - 34 .170 -
9.060 9.960 40.00 .400 - .550 - 6.750 - 34 .170 -
9.060 9.960 40.00 .400 - .550 - 6 .750 - 34 .170 -
9.260 9.760 40.00 - - - - - - .050 -
9.060 9.960 40.00 .400 - .550 - 6 .750 - 34 .170 -
7.600 7.850 40.00 .550 - 1.000 - .500 - .010 -
6.200 6.450 40.00 .250 - - - - - - -
6.200 6.450 40.00 .250 - - - - - - -
8.730 9.700 40.00 .350 - .660 - 6 .650 - .110 3.008.570 9.270 40.00 .450 - .300 - .250 - .050 -
7.600 7.850 40.00 .550 - 1.000 - .500 - .010 -
8.190 8.190 40.00 .400 - .300 _ .250 _ _ _8.190 8.190 40.00 .400 .300 .250
5.200 5.590 40.00 .330 - .300 _ - .030 _
5.200 5.590 40.00 .330 - .300 - _ _ .030 _5.090 5.340 40.00 .330 - .300 - - - .030 -
5.180 5.590 40.00 .330 - .300 - - - .030 -
5.200 5.590 40.00 .330 - .300 - - - .030 -
5.200 5.690 40.00 .330 - .300 - - - .030 -
5.380 5.590 40.00 .330 ~ .300 - - .030 -
City and job classification
San Antonio, Texas —Continued
Building construction —Continued
Journeymen— Continued
Engineers— Power equipment operators:Heavy equipment— Bull* dozers, scrapers, cranes, derricks, draglines, hoists (2 drums or more), rollers (5 tons and over), blade graders (self-propelled), locomotives, trench machines, winch trucks.......
Light equipment— Mixers (less than 14 cu. ft.), air compressors (over 126 cu. ft.), pumps (2.5 in. or larger), welding machines, rollers (under 5 tons), hoists(single drum )..................
Lathers.................................Marble se tte rs .....................Painters, b rush ....................
Spray................................Spray, stee l......................Steel, other thanspray................................
Paperhangers......................P ipefitters.............................
Steamfitters....................Refrigeration fitte rs ..........
Plasterers.............................Plumbers..............................Reinforcing iron w orkers.....Roofers, composition...........Roofers, slate and tile .........Sheet-metal workers............Stonemasons.......................Structural-iron w orkers........Mosaic and terrazzo
w orkers..............................Tile layers.............................
Helpers and laborers
Bricklayers’ tenders..............Cement finishers’
helpers...........................Building laborers..................
Air tool operators..............Power buggy operators......Bell-hold men...................Stem men........................
See footnotes a t end of table.
151Digitized for FRASER http://fraser.stlouisfed.org/ Federal Reserve Bank of St. Louis

Table 20. Wage rates, hours, and employer contributions for selected benefits: Selected cities—Continued
(Union hourly wage rates, July 1, 1976, and wage rates, straight-tim e weekly hours, and em ployer insurance, pension, vacation, and othercontributions to funds in the building trades, July 1, 1977)
July 1, 1976 July 1, 1977
Rate per hour1
Rate per hour1
Hoursper
week2
Employer contributions for selected benefits3
Insurance4 Pension Vacation Other5
Dollars Percent Dollars Percent Dollars Percent Dollars Percent
$6,180 $5,690 40.00 0.330 0.300 0.0305.180 5.590 40.00 .330 - .300 - - - .030 -
6.350 6.490 40.00 .545 _ .350 _ - 6.00 .020 2.305.460 5.590 40.00 .330 - .300 - - - .030 -5.460 5.690 40.00 .330 - .300 - - - .030 -
2.700 2.950 40.00 .250 _ _ _ _5.090 5.590 40.00 .330 .300 .030
11.350 12.100 40.00 .870 1.100 1.00012.000 13.175 40.00 .775 - 1.000 - 0.500 - - -10.070 10.720 40.00 1.030 - 1.060 - .500 - .300 -
10.310 11.260 40.00 .660 - 1.200 - .800 - .110 -10.560 11.510 40.00 .660 - 1.200 - .800 - .110 -10.560 11.510 40.00 .660 - 1.200 - .800 - .110 -11.770 12.600 40.00 .660 - 1.200 - .800 - .110 -10.440 11.390 40.00 .660 - 1.200 - .800 - .110 -8.430 9.260 40.00 .880 - 1.760 - 1.360 - .050 -
+9.664 11.727 40.00 .700 _ 1.330 3.00 _ 6 10.00 .040 1.0012.000 12.950 40.00 .595 .350 6.00 .020 2.31
. 10.290 11.740 40.00 1.000 2.000 .500 .100
9.820 11.270 40.00 1.000 - 2.000 - .500 - .100 -
. 10.410 11.860 40.00 1.000 2.000 .500 .100
. 10.580 11.630 40.00 1.000 - 2.000 - .500 - .100 -
9.250 10.700 40.00 1.000 - 2.000 - .500 - .100 -
9.530 10.980 40.00 1.000 _ 2.000 - .500 .100 _9.334 9.810 40.00 .670 - .900 - - 6 6.00 .100 6 4.00
. 10.960 11.510 40.00 .600 - .900 - .900 - .100 -
. 11.400 12.400 40.00 .472 - . .600 - - - - -
. 10.040 10.640 40.00 .810 - 1.170 - .850 - - -
. 10.040 10.640 40.00 .810 - 1.170 - .850 - - -
City and job classification
San Antonio, Texas —Continued
Building construction —Continued
Helpers and laborers — Continued
Gunite..........................Cutting torches..............
Elevator constructors’helpers..........................
Plasterers’ laborers...........Mortar mixers................
Composition roofers’helpers..........................
Tile layers’ helpers............
San Diego, Calif.
Building construction
Journeymen
Asbestos workers ................Boilermakers........................Bricklayers...........................Carpenters..........................
Floor layers.......................Millwrights........................Drywall hangers................Shinglers.........................
Cement finishers..................Electricians (inside
wirers) ..............................Elevator constructors............Engineers— Power equip
ment operators:Heavy equipment:Universal equipment (to 1 cu. yd.), tractors, singleengine..........................
Medium equipment:Winch truck operators.......Motor patrols— Power blade operators(single engine)................Multi-engine....................
Light equipment:Air compressors...............Concrete mixer (skiptype)..............................
Glaziers ..............................Lathers ...............................Machinists (erection) ............Marble setters.....................Mosaic and terrazzo
workers.............................
See footnotes at end of table.
152
Digitized for FRASER http://fraser.stlouisfed.org/ Federal Reserve Bank of St. Louis

(Union hourly wage rates, July 1, 1976, and wage rates, straight-time weekly hours, and employer insurance, pension, vacation, and other contributions to funds in the building trades, July 1, 1977)
Table 20. Wage rates, hours, and employer contributions for selected benefits: Selected cities—Continued
July 1, 1976 July 1, 1977
City and job classification Hoursper
week2
Employer contributions for selected benefits3Rate per
hour1Rate per
hour1 Insurance4 Pension Vacation Other5
Dollars Percent Dollars Percent Dollars Percent Dollars Percent
San Diego, Calif. —Continued
Building construction —Continued
Journeymen— Continued
Painters............................... $10,370 $10,990 40.00 1.190 1.180 _ 0.750 _ 0.070 _Spray............................... 10.620 11.240 40.00 1.190 - 1.180 - .750 - .070 -Swing stage (brush)............ 10.620 11.240 40.00 1.190 - 1.180 - .750 - .070 -Swing stage (spray)............ 10.870 11.490 40.00 1.190 - 1.180 - .750 - .070 -
Drywall tapers....................... 10.720 11.660 40.00 1.190 - 1.180 - .750 - .070 -Paperhangers....................... 10.870 11.490 40.00 1.190 - 1.180 - .750 - .070 -Pipefitters............................. 11.660 12.410 36.00 - 10.00 - 16.00 - 13.00 - 2.00
Refrigeration fitters............ 11.660 12.410 36.00 - 10.00 - 16.00 - 13.00 - 2.00Plasterers......................... 9.810 10.210 40.00 .650 - 1.750 - 6 1.250 - .100 -
Plumbers.............................. 11.660 12.410 36.00 - 10.00 - 16.00 - 13.00 - 2.00Reinforcing iron workers........ 11.030 11.300 40.00 1.140 - 1.860 - 1.200 - - -Roofers, composition............. 9.990 10.790 40.00 .600 - .750 - 1.000 - .260 -Roofers, slate and tile ........... 9.990 10.790 40.00 .600 - .750 - 1.000 - .260 -Sheet-metal workers.............. 10.350 12.060 40.00 1.040 - 2.240 - 6.900 - .210 -Structural-iron workers........... 11.030 11.300 40.00 1.140 - 1.860 - 1.200 - - -
Ornamental finishers.......... 11.030 11.300 40.00 1.140 - 1.860 - 1.200 - - -Fence erectors.................. 10.140 10.410 40.00 1.140 - 1.860 - 1.200 - - -
Tile layers............................. 10.040 10.640 40.00 .810 - 1.170 - .850 - - -
Helpers and laborers
Bricklayers’ tenders............... 8.890 9.320 40.00 .770 _ 1.950 _ .500 35.230 _Building laborers................... 7.100 7.950 40.00 .770 - 1.950 - .500 - 35 .230 -Elevator constructors’
helpers.............................. 8.400 9.065 40.00 .595 - .350 - - 6.00 .020 2.31Marble setters’ helpers.......... 7.040 8.740 40.00 .810 - 1.000 - - - - -Plasterers’ tenders................ 10.030 10.460 40.00 .770 - 1.950 - .500 - .100 -Terrazzo workers’
helpers.............................. 7.020 8.400 40.00 - - 1.000 - 6 1.000 - - -Base machine.................... 7.300 8.680 40.00 - - 1.000 - 6 1.000 - - -
Tile layers’ helpers................ 7.040 8.740 40.00 .810 - 1.000 - - - - -
San Francisco, Calif.
Building construction
Journeymen
Asbestos workers................. 11.990 12.410 40.00 .970 _ 1.100 _ 1.520 - .060 _Boilermakers......................... 12.000 13.200 40.00 .750 - 1.000 - .500 - - -Bricklayers............................ 10.670 11.420 35.00 1.500 - 1.100 - 1.000 - .380 -
Tuck pointers, cleaners ................................. 10.670 11.420 35.00 1.500 - 1.100 - 1.000 - .380 -
Carpenters........................... 11.250 11.650 36.00 1.220 - 1.710 - .850 - .120 -Floor layers....................... 11.400 11.800 36.00 1.220 - 1.710 - .850 - .120 -Millwrights......................... 11.750 12.150 36.00 1.220 - 1.710 - .850 - .120 -Shinglers.......................... 11.400 11.800 36.00 1.220 - 1.710 - .850 - .120 -Power saw operators......... 11.400 11.800 36.00 1.220 - 1.710 - .850 - .120 -
Cement finishers................... 10.000 10.500 40.00 1.150 - 1.430 - 1.500 - - -Composition...................... 10.250 10.750 40.00 1.150 - 1.430 - 1.500 - - -Swinging scaffold............... 10.250 10.750 40.00 1.150 1.430 — 1.500 —
See footnotes at end of table.
153Digitized for FRASER http://fraser.stlouisfed.org/ Federal Reserve Bank of St. Louis
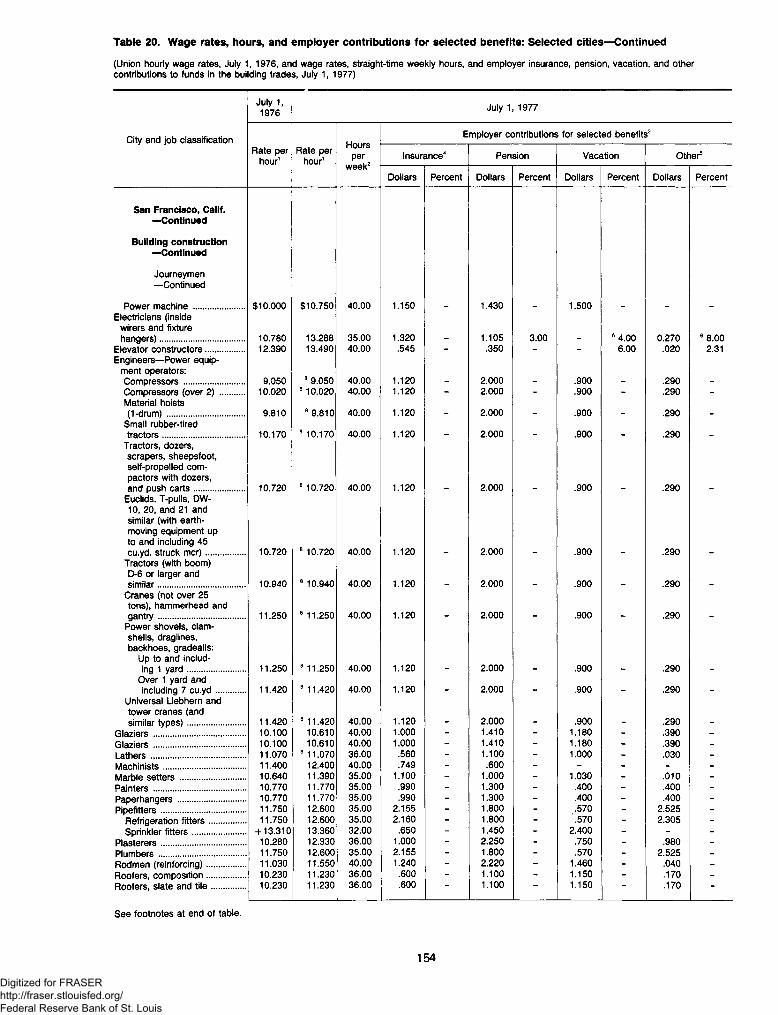
Table 20. Wage rates, hours, and employer contributions for selected benefits: Selected cities—Continued
(Union hourly wage rates, July 1, 1976, and wage rates, straight-tim e weekly hours, and em ployer insurance, pension, vacation, and othercontributions to funds in the building trades, July 1, 1977)
July 1,1976
July 1, 1977
Employer contributions for selected benefits3
Rate per hour1
Rate per hour1
noursper
week2Insurance4 Pension Vacation Other5
Dollars Percent Dollars Percent Dollars Percent Dollars Percent
San Francisco, Calif. — Continued
Building construction — Continued
Journeymen— Continued
Power machine ................. $10,000 $10,750 40.00 1.150 1.430 1.500Electricians (inside
wirers and fixture hangers)............................. 10.780 13.288 35.00 1.320 1.105 3.00 6 4.00 0.270 6 8.00
Elevator constructors............. 12.390 13.490 40.00 .545 - .350 - - 6.00 .020 2.31Engineers— Power equip
ment operators:Compressors..................... 9.050 8 9.050 40.00 1.120 2.000 .900 .290Compressors (over 2) ........ 10.020 8 10.020 40.00 1.120 - 2.000 - .900 - .290 -Material hoists (1-drum).......................... 9.810 8 9.810 40.00 1.120 _ 2.000 . .900 .290
Small rubber-tired tractors............................ 10.170 8 10.170 40.00 1.120 _ 2.000 _ .900 .290
Tractors, dozers, scrapers, sheepsfoot, self-propelled compactors with dozers, and push carts................. 10.720 8 10.720 40.00 1.120 2.000 .900 .290
Euclids, T-pulls, DW- 10, 20, and 21 and similar (with earth- moving equipment up to and including 45 cu.yd. struck mcr)............. 10.720 8 10.720 40.00 1.120 2.000 .900 .290
Tractors (with boom)D-6 or larger and similar.............................. 10.940 8 10.940 40.00 1.120 2.000 .900 .290
Cranes (not over 25 tons), hammerhead and gantry.............................. 11.250 8 11.250 40.00 1.120 2.000 .900 .290
Power shovels, clamshells, draglines, backhoes, gradealls:
Up to and including 1 yard.................... 11.250 8 11.250 40.00 1.120 2.000 .900 .290
Over 1 yard and including 7 cu.yd.......... 11.420 8 11.420 40.00 1.120 _ 2.000 _ .900 _ .290 _
Universal Liebhern and tower cranes (and similar types).................... 11.420 8 11.420 40.00 1.120 2.000 .900 .290
Glaziers............................... 10.100 10.610 40.00 1.000 - 1.410 - 1.180 - .390 -Glaziers............................... 10.100 10.610 40.00 1.000 - 1.410 - 1.180 - .390 -Lathers................................ 11.070 8 11.070 36.00 .560 - 1.100 - 1.000 - .030 -Machinists............................ 11.400 12.400 40.00 .749 - .600 - - - - -Marble setters...................... 10.640 11.390 35.00 1.100 - 1.000 - 1.030 - .010 -
Painters............................... 10.770 11.770 35.00 .990 - 1.300 - .400 - .400 -
Paperhangers....................... 10.770 11.770 35.00 .990 - 1.300 - .400 - .400 -
Pipefitters............................. 11.750 12.600 35.00 2.155 - 1.800 - .570 - 2.525 -Refrigeration fitters............ 11.750 12.600 35.00 2.160 - 1.800 - .570 - 2.305 -Sprinkler fitters.................. + 13.310 13.360 32.00 .650 - 1.450 - 2.400 - - -
Plasterers............................. 10.280 12.330 36.00 1.000 - 2.250 - .750 - .980 -Plumbers.............................. 11.750 12.600 35.00 2.155 - 1.800 - .570 - 2.525 -Rodmen (reinforcing)............. 11.030 11.550 40.00 1.240 - 2.220 - 1.460 - .040 -Roofers, composition............. 10.230 11.230 36.00 .600 - 1.100 - 1.150 - .170 -Roofers, slate and tile ............ 10.230 11.230 36.00 .600 — 1.100 1.150 .170 -
See footnotes at end of table.
154
Digitized for FRASER http://fraser.stlouisfed.org/ Federal Reserve Bank of St. Louis

(Union hourly wage rates, July 1, 1976, and wage rates, straight-time weekly hours, and employer insurance, pension, vacation, and other contributions to funds in the building trades, July 1, 1977)
Table 20. Wage rates, hours, and employer contributions for selected benefits: Selected cities—Continued
July 1, 1976 July 1, 1977
City and job classification Hoursper
week2
Employer contributions for selected benefits3Rate per
hour1Rate per
hour1 Insurance4 Pension Vacation Other5
Dollars Percent Dollars Percent Dollars Percent Dollars Percent
San Francisco, Calif. — Continued
Building construction — Continued
Journeymen— Continued
Sheet-metal workers.............. $11,200 $11,830 37.50 0.730 1.950 1.300 0.700Stonemasons........................ 10.670 11.420 35.00 1.500 - 1.100 - 1.000 - .380 -
Structural-iron workers........... 11.030 11.550 40.00 1.240 - 2.220 - 1.460 - .040 _Ornamental finishers.......... 11.030 11.550 40.00 1.240 - 2.220 - 1.460 - .040 _Fence men ........................ 10.140 10.660 40.00 1.240 - 2.220 - 1.460 - .040 -
Terrazzo workers.................. 10.320 11.420 35.00 1.100 - 1.000 - 1.000 - .200 -Tile layers............................. 11.000 12.000 40.00 .980 - 1.200 - 1.400 - .150 -
Helpers and laborers
Bricklayers’ tenders............... 9.150 9.650 36.00 1.050 1.200 1.000Building laborers:
Group III........................... 8.045 8.525 40.00 1.250 _ 1.700 _ 1.000 . .210Group II - concrete............ 8.145 8.625 40.00 1.250 - 1.700 - 1.000 - .210 -
Group I - pneumatic tool tunnel miner............... 8.295 8.775 40.00 1.250 _ 1.700 _ 1.000 _ .210
Elevator constructors’ helpers............................... 8.670 9.440 40.00 .545 . .350 . . 6.00 .020 2.31
Marble setters helpers........... 8.550 9.270 40.00 .690 - .510 - - 10.00 .150 -
Plasterers’ laborers................ 9.800 10.300 36.00 1.050 - 1.400 - 1.250 - .250 -
Terrazzo workers’ helpers............................... +8.460 9.160 35.00 .750 _ .600 _ 1.000 . .200 .
Base machine.................... +8.860 9.560 35.00 .750 - .600 - 1.000 - .200 -Polishers........................... +8.460 9.160 35.00 .750 - .600 - 1.000 - .200 -Wet machine men.............. +8.460 9.160 35.00 .750 - .600 - 1.000 - .200 -
Santa Ana, Calif.
Building construction
Journeymen
Asbestos workers ................. 11.350 12.100 40.00 .870 1.100 1.000Boilermakers......................... 12.000 13.175 40.00 .775 - 1.000 - .500 - - -Bricklayers (brick and
block)................................ 10.298 10.700 40.00 1.150 _ 1.450 _ 8.500 _ .250 .Carpenters........................... 9.540 8 9.540 40.00 1.300 - 1.800 - .800 - .020 -Cement finishers
(cement masons) ................ 9.410 8 9.410 40.00 1.100 _ 1.750 _ 1.000 _ _ _Electricians........................... 11.500 12.540 35.00 .810 - 1.450 3.00 - - .020 1.00Elevator constructors............. 12.000 12.950 40.00 .545 - .350 - - 6.00 .020 2.31Engineers— Power equip
ment operators:Shovels, backhoes, draglines, clamshells
(over 3/4 yard) ................ 10.290 11.740 40.00 1.000 2.000 .500 .100Tractors— Up to 100 hp...... 10.180 11.630 40.00 1.000 - 2.000 - .500 - .100 -
A-frames or winch trucks.............................. 9.820 11.270 40.00 1.000 - 2.000 - .500 - .100 -
See footnotes at end of table.
155Digitized for FRASER http://fraser.stlouisfed.org/ Federal Reserve Bank of St. Louis

Table 20. Wage rates, hours, and employer contributions for selected benefits: Selected cities—Continued
(Union hourly wage rates, July 1, 1976, and wage rates, straight-tim e weekly hours, and em ployer insurance, pension, vacation, and othercontributions to funds in the building trades, July 1, 1977)
City and job classification
July 1,1976
July 1, 1977
Employer contributions for selected benefits3Rate per
hour1Rate per
hour1noursper
week2Insurance4 Pension Vacation Other5
Dollars Percent Dollars Percent Dollars Percent Dollars Percent
Santa Ana, Calif. — Continued
Building construction — Continued
Journeymen— Continued
Motor patrol blades:Single engine................... $10,410 $11,860 40.00 1.000 - 2.000 - 0.500 - 0.100 -Multi-engine...................... 10.580 12.030 40.00 1.000 - 2.000 - .500 - .100 -
Compressors..................... 9.250 10.700 40.00 1.000 - 2.000 - .500 - .100 -Concrete mixers (sliptype)............................... 9.530 10.980 40.00 1.000 - 2.000 - .500 - .100 -
Tractors-over 100 hp.......... 10.290 11.740 40.00 1.000 - 2.000 - .500 - .100 -Concrete mixers.................Skip loaders (1-1/2 to
10.290 11.740 40.00 1.000 2.000 - .500 - .100 -
6-1/2 yards) ..................... 10.290 11.740 40.00 1.000 - 2.000 - .500 - .100 -Tractors over6 1 /2 yards)..................... 10.410 11.860 40.00 1.000 - 2.000 - .500 - .100 -
Trenchers.......................... 9.960 11.410 40.00 1.000 - 2.000 - .500 - .100 _Canal tinners..................... 10.710 12.160 40.00 1.000 - 2.000 - .500 - .100 -
Glaziers............................... 9.522 11.190 40.00 .790 - 1.450 - - 8 8.00 .100 6 5.00Lathers................................ 10.900 11.500 40.00 .700 - .900 - .500 - .120 -Machinists............................ 11.400 12.400 40.00 .472 - .600 - - - - -Marble setters...................... 10.298 10.700 40.00 1.150 - 1.450 - 6.500 - .250 -Mosaic and terrazzo
workers.............................. 10.720 10.720 40.00 .300 - .800 - .700 - .300 -Painters............................... 10.370 8 10.990 40.00 1.190 - 1.180 - .750 - .090 -Paperhangers....................... 10.870 11.490 40.00 1.190 - 1.180 - .750 - .090 -Plasterers............................. 10.485 11.485 40.00 .830 - 1.850 - .650 - .200 -Plumbers.............................. 10.145 12.410 40.00 - 10.00 - 16.00 - 13.00 - 2.00Roofers, composition............. 9.740 10.590 40.00 .820 - 1.080 - 6 1.000 - .020 -Roofers, slate and tile ........... 9.740 10.590 40.00 .820 - 1.080 - 6 1.000 - .020 -Pipefitters............................. 10.145 12.410 40.00 - 10.00 - 16.00 - 13.00 - 2.00Reinforcing iron workers........ 11.030 11.550 40.00 1.240 - 2.220 - 1.310 - - -Sheet-metal workers.............. 9.603 11.034 40.00 1.400 - 2.460 - - 6 10.00 - -
Stonemasons........................ 10.298 10.700 40.00 1.150 - 1.450 - 6.500 - .250 -
Structural-iron workers........... 11.030 11.550 40.00 1.240 - 2.220 - 1.310 - - _Tile layers............................. 10.400 10.990 40.00 .900 - 1.100 - 6 1.000 - .190 -
Helpers and laborers
Bricklayers tenders................ 8.255 8 8.255 40.00 .950 1.950 _ .500 _ .150Building laborers................... 7.650 8 7.650 40.00 .950 - 1.950 - .500 - .150 -Elevator constructors’
helpers.............................. 8.400 9.065 40.00 .545 - .350 - - 6.00 .020 2.31Marble setters’ helpers.......... 6.980 6.950 40.00 1.250 - 1.240 - .500 - - -Plasterers’ laborers
(hod carriers) ..................... 10.025 8 10.025 40.00 .950 - 1.950 - .500 - .150 -
Terrazzo helpers................... 8.880 9.480 40.00 .350 - 1.200 - 1.000 - .300 -Tile layers’ helpers................ 6.780 8.960 40.00 1.250 - 1.240 - 6 .500 - .320 -
Certified helpers................ 9.240 9.240 40.00 1.250 ~ 1.240 - 6.500 “ .320 ”
See footnotes at end of table.
156Digitized for FRASER http://fraser.stlouisfed.org/ Federal Reserve Bank of St. Louis

(Union hourly wage rates, July 1, 1976, and wage rates, straight-time weekly hours, and employer insurance, pension, vacation, and other contributions to funds in the building trades, July 1, 1977)
Table 20. Wage rates, hours, and employer contributions for selected benefits: Selected cities—Continued
July 1, 1976 July 1, 1977
City and job classification Hoursper
week2
Employer contributions for selected benefits3Rate per
hour1Rate per
hour1 Insurance4 Pension Vacation Other5
Dollars Percent Dollars Percent Dollars Percent Dollars Percent
Salt Lake City, Utah
Building construction
Journeymen
Asbestos workers................. $9,179 $9,740 40.00 0.520 1.170 6 0.820Boilermakers......................... + 10.650 11.450 40.00 .750 - 1.000 - 0.500 - - -Bricklayers............................ 9.620 10.260 40.00 .450 - .420 - 6.350 - .170 -Carpenters........................... 9.000 9.750 40.00 .550 - .600 - - - .030 -
Millwrights......................... 9.500 10.350 40.00 .550 - .600 - - - - -Piledrivers ......................... 11.380 11.480 36.00 6.550 - .600 - 6.250 - - -
Cement finishers................... 8.760 9.500 40.00 .550 - .600 - - - - -Composition floor layers and finishing machine operators............ 8.885 9.630 40.00 .550 .600
Drywall tapers (finishers) ............................... 9.040 9.590 40.00 .510 _ .300 _ .500 _ _ _
Electricians (inside wirers)............................... 9.870 10.340 40.00 .700 _ .500 3.00 _ +6.00 _ 6 1.55
Elevator constructors............. 9.155 10.030 40.00 .545 - .350 - - 6.00 .020 2.31Engineers— Power equip
ment operators:Heavy equipment:Group 11:Koehring scoopers........... 10.220 10.670 40.00 1.015 1.550 .950 + .100
Group 10:Derrick........................... 9.780 10.230 40.00 1.015 _ 1.550 _ .950 _ .100 _
Group 9:Tower crane.................... 9.620 10.070 40.00 1.015 _ 1.550 _ .950 _ .100 _
Group 8:Tractor with front- end loaders, 2 to 5 cubic yards................. 9.500 9.950 40.00 1.015 1.550 .950 .100
Medium equipment:Group 4:Hoist, 1 drum.................. 8.370 8.820 40.00 1.015 1.550 .950 .100
Group 7:Hoist, 2 drums................. 9.090 9.540 40.00 1.015 _ 1.550 _ .950 _ .100 _
Group 6:Mixermobiles................... 8.940 9.390 40.00 1.015 _ 1.550 _ .950 _ .100 _
Light equipment:Group 5:Air compressors,2 or more...................... 8.480 8.930 40.00 1.015 1.550 .950 .100
Group 3:Air compressors.............. 8.190 8.640 40.00 1.015 _ 1.550 - .950 _ .100 _
Group 2:Material loaders............... 7.840 8.290 40.00 1.015 1.550 _ .950 _ .100 _
Glaziers............................... 8.340 8.960 40.00 .510 - .300 - .680 - .370 -Lathers................................ 7.980 9.920 40.00 .500 - .500 - - - - -Marble setters...................... +8.670 8 9.170 40.00 .170 - .200 - 6 .350 -
oCD
8
-Mosaic and terrazzo
workers.............................. +8.670 8 9.170 40.00 .170 _ .200 _ 6 .350 _ 23 .160 _Painters............................... 7.650 8.700 40.00 .510 - .300 - 6 .500 - .030 -
Spray............................... 7.950 9.000 40.00 .510 - .300 - 6.500 - • .030 -Swing stage...................... 7.950 9.000 40.00 .510 - .300 - 6 .500 - .030 -
Paperhangers....................... 7.900 8.950 40.00 .510 - .300 - 6.500 - .030 -Pipefitters............................. 9.600 8 9.850 40.00 .510 - 1.000 - 6 .250 - .050 -
Pipe welders..................... 9.150 8 9.850 40.00 .510 - 1.000 - 6 .250 - .130 -Refrigeration fitters............ 8.800 8 8.800 40.00 .510 1.000 ~ 6.250 .110
See footnotes at end o f table.
157Digitized for FRASER http://fraser.stlouisfed.org/ Federal Reserve Bank of St. Louis

Table 20. Wage rates, hours, and employer contributions for selected benefits: Selected cities-—Continued
(Union hourly wage rates, July 1, 1976, and wage rates, straight-time weekly hours, and employer insurance, pension, vacation, and other contributions to funds in the building trades, July 1, 1977)
July 1, 1976 July 1, 1977
City and job classification Hoursper
week2
Employer contributions for selected benefits3Rate per
hour1Rate per
hour1 Insurance4 Pension Vacation Other5
Dollars Percent Dollars Percent Dollars Percent Dollars Percent
Salt Lake City, Utah — Continued
Building construction — Continued
Journeymen— Continued
Steamfitters....................... $9,150 8 $9,850 40.00 0.510 _ 1.000 _ 6 0.250 _ 0.130Plumbers.............................. 9.150 8 9.850 40.00 .510 - 1.000 - 8.250 _ .130 -Plasterers............................. 8.860 9.900 40.00 .550 - .600 - - - - -Reinforcing ironworkers ......... 9.800 10.650 40.00 .650 - 1.150 - - - .060 -Roofers, composition............. +8.590 9.390 40.00 .570 - .350 - - - - -Roofers, slate and tile ........... 8.590 9.390 40.00 .570 - .350 - - - - -Sheet-metal workers.............. 9.010 9.830 40.00 .540 - .600 - 6.530 - 6.550 -Structural-iron workers........... 9.800 10.650 40.00 .650 - 1.150 - - - .060 _
Ornamental finishers.......... 9.800 10.650 40.00 .650 - 1.150 - - - .060 -
Fence erectors.................. 9.800 10.650 40.00 .650 - 1.150 - - - .060 -
Sheeters........................... 9.800 10.650 40.00 .650 - 1.150 - - - .060 -Tile setters........................... +8.670 8 9.170 40.00 .170 - .200 - 6 .350 - 23 .160 -
Helpers and laborers
Bricklayers’ tenders............... 7.900 8.720 40.00 .400 _ .350 _ _ _ _ .Building laborers ................... 6.800 7.450 40.00 .400 - .350 - - - .040 -
Concrete laborers.............. 6.800 7.450 40.00 .400 - .350 - - - .040 -Elevator constructors’
helpers.............................. 6.410 7.020 40.00 .545 - .350 - - 6.00 .020 2.31Plasterers’ laborers................ 7.700 8.800 40.00 .400 - .350 - - - - -
Plumbers’ laborers................ 6.800 7.450 40.00 .400 - .350 - - - .040 -
Terrazzo workers’ helper....... 6.800 7.450 40.00 .400 - .350 - - - .040 -
Highway and street construction
Journeymen
Cement finishers................... 8.760 9.500 40.00 .550 - .600 - - - - -
Helpers and laborers
Construction laborers............ 6.800 7.450 40.00 .400 - .350 - - - .040 -
Other heavy construction
Journeymen
Cement finishers...................
Helpers and laborers
8.760 9.500 40.00 .550 - .600 - - - - -
Construction laborers............ 6.800 7.450 40.00 .400 - .350 - - - .040 -
See footnotes at end of table.
158
Digitized for FRASER http://fraser.stlouisfed.org/ Federal Reserve Bank of St. Louis

(Union hourly wage rates, July 1, 1976, and wage rates, straight-time weekly hours, and employer insurance, pension, vacation, and other contributions to funds in the building trades, July 1, 1977)
Table 20. Wage rates, hours, and employer contributions for selected benefits: Selected cities—Continued
July 1, 1976 July 1, 1977
City and job classification Hoursper
week2
Employer contributions for selected benefits3Rate per
hour1Rate per
hour1 Insurance4 Pension Vacation Other5
Dollars Percent Dollars Percent Dollars Percent Dollars Percent
Scranton, Pa.
Building construction
Journeymen
Asbestos workers ................. +$7,150 $9,700 40.00 0.650 0.600 61.000Bricklayers............................ 9.650 10.200 35.00 .750 - .800 - .500 - 0.060 -Carpenters........................... 9.550 10.200 40.00 .610 - .500 - - - .100 -
Millwrights......................... 10.130 10.780 40.00 .610 - .500 - - - .100 -Cement finishers................... 10.500 11.050 40.00 - - - - - - .050 -Electricians (inside
wirers)............................... 9.750 10.200 40.00 .500 _ .500 3.00 .500 . .100 .Elevator construction
mechanics......................... 10.000 10.595 40.00 .545 _ .350 . . 6.00 .020 2.31Engineers— Power equip
ment operators:Heavy equipment—Cranes, derricks,power shovels.................. 11.250 11.950 40.00 5.50 9.50 .050
Medium equipment— Turnapulls, carry- alls, bulldozers, tractors............................ 10.370 11.070 40.00 5.50 9.50 .050
Light equipment— Welding machines, compressors, pumps............... 9.600 10.300 40.00 5.50 9.50 .050
Glaziers (outside).................. 9.150 9.650 40.00 .400 - .700 - - - .295 -Lathers ................................ 10.040 10.500 40.00 - - .100 - - - .050 -Marble setters...................... 9.500 9.500 40.00 - - 1.000 - - - - -
Mosaic and terrazzo workers............................. 9.500 9.500 40.00 _ _ 1.000 _ _ _ _ _
Painters............................... 8.100 8.400 40.00 - - 1.200 - - - - -
Swing............................... 9.100 9.400 40.00 - - 1.200 - - - - -Steel ................................ 9.100 9.400 40.00 - - 1.200 - - - - -Spray............................... 9.600 9.900 40.00 - - 1.200 - - - - -
Paperhangers....................... 8.600 8.900 40.00 - - 1.200 - - - -Pipefitters............................. +8.750 10.040 40.00 .650 - .950 - 6 1.000 - .140 ~Plasterers............................. 10.580 11.130 40.00 - - - - - - .050 -Plumbers.............................. +9.540 10.240 40.00 .650 - .750 - 6 1.000 - .140 -Reinforcing iron workers........ + 9.150 10.800 40.00 .840 - 1.360 - 6 1.000 - .050 -Roofers, composition............. 9.810 10.630 40.00 .720 - - - - -Roofers, shingle, slate
and tile .............................. 9.810 10.630 40.00 .720 _ _ _ _ _ _ _Sheet-metal workers.............. 9.080 10.110 40.00 .600 - .610 - 6.500 - .140 3.00Stonemasons........................ 9.650 10.200 35.00 .750 - .800 - 6 .500 - .060 -Structural-iron workers........... +9.250 10.900 40.00 .840 - 1.360 - 6 1.000 - .050 -Tile layers............................. 9.500 9.500 40.00 - - 1.000 - - - - -
Helpers and laborers
Bricklayers’ tenders............... 8.600 9.200 40.00 .480 .500 .050Building laborers................... 8.200 8.800 40.00 .480 - .500 - - .050 -Composition roofers’
helpers.............................. 9.580 10.405 40.00 .720 - - - - - - -
Elevator constructors’ helpers.............................. 7.000 7.420 40.00 .545 _ .350 _ _ 6.00 .020 2.31
Marble setters’ helpers.......... 8.530 9.420 40.00 - - - - - - - -Plasterers’ and masons’
tenders............................. 8.600 9.200 40.00 .480 - .500 - - - .050 -
See footnotes at end of table.
159
Digitized for FRASER http://fraser.stlouisfed.org/ Federal Reserve Bank of St. Louis

Table 20. Wage rates, hours, and employer contributions for selected benefits: Selected cities—Continued
(Union hourly wage rates, July 1, 1976, and wage rates, straight-tim e weekly hours, and em ployer insurance, pension, vacation, and othercontributions to funds in the building trades, July 1, 1977)
July 1, 1976 July 1, 1977
Rate per hour1
Rate per hour1
Hoursper
week2
Employer contributions for selected benefits3
Insurance4 Pension Vacation Other5
Dollars Percent Dollars Percent Dollars Percent Dollars Percent
$8,350 $8,950 40.00 0.480 0.500 0.0508.630 9.520 40.00 - - - - - - _ _
8.530 9.420 40.00
8.720 9.270 40.00 .350 - .500 - - - - -
10.910 8 10.910 40.00 .510 .950 1.000 .03010.650 11.600 40.00 .750 - 1.000 - .500 - - _
10.270 10.970 40.00 .650 - .650 - 6.250 - .200 -
10.270 10.970 40.00 .650 _ .650 _ 6 .250 .200 _
9.550 9.600 40.00 .500 - .700 - 6 .200 - .020 -
9.550 9.800 40.00 .500 - .700 - 6 .200 - .020 -
9.680 9.730 40.00 .500 _ .700 _ 6 .200 _ .020 _
9.850 10.100 40.00 .500 - .700 - 6 .200 - .020 _9.500 9.750 40.00 .500 - .700 - 6.200 - .020 _9.970 8 9.970 40.00 .550 - 1.000 - - - .020 _
10.220 8 10.220 40.00 .550 - 1.000 - - - .020 _9.980 10.530 40.00 .540 - .700 - - - .060 -
11.327 12.408 40.00 .700 _ .650 3.00 _ 6 6.00 _ 1.0011.215 12.445 40.00 .545 .350 6.00 .020 2.31
11.080 11.980 40.00 .750 1.000 .04010.900 11.800 40.00 .750 - 1.000 - - - .040 -
10.680 11.580 40.00 .750 - T000 - - .040 -
10.800 11.700 40.00 .750 - 1.000 - - - .040 -
10.710 11.610 40.00 .750 _ 1.000 _ _ _ .040 _11.030 11.930 40.00 .750 - 1.000 - - - .040 _11.080 11.980 40.00 .750 - 1.000 - - - .040 -
City and job classification
Scranton, Pa. —Continued
Building construction —Continued
Helpers and laborers — Continued
Plumbers’ laborers............Terrazzo helpers...............Tile layers’ helpers............
Highway and street construction
Journeymen
Carpenters.................
Seattle, Wash.
Building construction
Journeymen
Asbestos workers ................Boilermakers........................Bricklayers...........................
Cleaners, pointers andcaulkers.........................
Carpenters..........................Boommen.........................Floor layers,shinglers.........................
Millwrights........................Piledrivers ........................
Cement finishers..................Composition.....................
Drywall tapers......................Electricians (inside
wirers)..............................Elevator constructors............Engineers— Power equip
ment operators:Heavy equipment:Shovels and cranes, crawler and trucktype..............................Bulldozers.......................Carryall typescraper (single)...............
Medium equipment:Hoists............................Mixers, c o n c r e t e :
2 0 0 yards and under......Over 200 yards.............
Piledrivers......................
See footnotes at end of table.
160Digitized for FRASER http://fraser.stlouisfed.org/ Federal Reserve Bank of St. Louis

Table 20. Wage rates, hours, and employer contributions for selected benefits: Selected cities—Continued
(Union hourly wage rates, July 1, 1976, and wage rates, straight-tim e weekly hours, and em ployer insurance, pension, vacation, and othercontributions to funds in the building trades, July 1, 1977)
July 1, 1976 July 1, 1977
City and job classification Hoursper
week2
Employer contributions for selected benefits3Rate per
hour1Rate per
hour1 Insurance4 Pension Vacation Other5
Dollars Percent Dollars Percent Dollars Percent Dollars Percent
Seattle, Wash.—Continued
Building construction —Continued
Journeymen— Continued
Light equipment:Forklifts or lumberstackers (onconstruction jobsite).............................. $10,680 $11,580 40.00 0.750 - 1.000 - - - 0.040 _
Compressors,excavating..................... 10.380 11.280 40.00 .750 - 1.000 - - - .040 -
Carryall typescrapers (double)............ 10.830 11.730 40.00 .750 - 1.000 - - - .040 -
Heavy duty machinery...... 10.760 11.660 40.00 .750 - 1.000 - - - .040 -Glaziers.................................. 9.590 10.400 40.00 .340 - .750 - 0.680 - .380 -Iron workers— Structural
and reinforcing.................... 10.500 10.750 40.00 .730 - 1.000 - 6.250 - - -Lathers.................................. 9.340 9.900 40.00 .550 - 1.000 - 1.000 - .120 -Marble setters........................ 10.270 10.970 40.00 .650 - .650 - 6.250 - .200 -Mosaic and terrazzo
workers.............................. 9.970 10.960 40.00 .650 .650 .750 .650 6.500 .650 .160 .650Painters............................... 9.980 10.530 40.00 .540 - .700 - - - .060 -
Structural steel.................. 9.980 10.980 40.00 .540 - .700 - - - .060 -Spray............................... 10.230 10.770 40.00 .540 - .700 - - .060 -
Paperhangers....................... 9.980 10.530 40.00 .540 - .700 - - - .060 -Pipefitters............................. 12.110 12.800 40.00 .890 - 1.410 - 1.100 - .070 -Plasterers............................. 8.900 9.900 40.00 .550 - 1.000 - 6 1.000 - .120 -Plumbers.............................. 12.110 12.800 40.00 .890 - 1.410 - 1.100 - .070 -Refrigeration fitters................ 11.260 12.000 40.00 .720 - 1.350 - 1.000 - .070 -Roofers, composition:
Steep.............................. 9.700 10.750 40.00 1.000 - .400 - - - - -
F lat................................. 9.450 10.500 40.00 1.000 - .400 - - - - -Roofers, slate and tile ........... 9.700 10.750 40.00 1.000 - .400 - - - - -Sheet-metal workers....... ...... 11.150 12.150 40.00 .560 3.81 .990 6.73 6 1.000 - .140 3.00Stonemasons........................ 10.270 10.970 40.00 .650 - .650 - 6.250 - .200 -Tile layers............................. 9.970 10.960 40.00 .650 - .750 - 23.750 - .160 -
Helpers and laborers
Bricklayers’ tenders............... 8.660 8.940 40.00 .900 _ 1.100 _ _ _ .100 _Building laborers ................... 8.360 8.640 40.00 .900 - 1.100 - - - .100 -Elevator constructors’
helpers.............................. 7.850 8.710 40.00 .545 - .350 - - 6.00 .020 2.31Marble setters’ helpers.......... 8.470 9.020 40.00 .650 - .300 - 6.500 - .160 -Plasterers’ laborers................ 8.660 8.940 40.00 .900 - 1.100 - - - .100 -Terrazzo helpers................... 8.470 9.020 40.00 .650 - .300 - 6.500 - .160 -Tile layers’ helpers................ 8.470 9.020 40.00 .650 - .300 - 6.500 - .160 -
Highway and street construction
Helpers and laborers
General laborers................... 8.360 8.940 40.00 .900 - 1.100 - - - .080 -
See footnotes at end o f table.
161Digitized for FRASER http://fraser.stlouisfed.org/ Federal Reserve Bank of St. Louis

Table 20. Wage rates, hours, and employer contributions for selected benefits: Selected cities—Continued
(Union hourly wage rates, July 1, 1976, and wage rates, straight-time weekly hours, and employer insurance, pension, vacation, and othercontributions to funds in the building trades, July 1, 1977)
City and job classification
Spokane, Wash.
Building construction
Journeymen
Asbestos workers ...........Boilermakers..................Bricklayers.....................
Cleaners, pointers andcaulkers ....................
Carpenters .....................Millwrights..................Piledrivers ..................
Cement finishers............Electricians (inside
wirers).........................Elevator constructors.......Engineers— Power equip
ment operators:Heavy equipment:Cranes (under 65 t) ....Derricks (under 65 t) .... Hoists (2 or moredrums).....................
Medium equipment: Mixer mobiles, pump- cretes, link beltsor similar..................
Light equipment: Compressors (1 only)...Pumps......................
Glaziers .........................Lathers .........................Marble masons...............Mosaic and terrazzo
workers.......................Painters .........................
Spray.........................Structural steel...........Drywall tapers.............
Paperhangers ................Pipefitters......................
Refrigeration fitters......Plasterers......................Plumbers.......................Reinforcing iron workers ...Roofers, composition.......Roofers, slate and tile .....Sheet-metal workers.......Stonemasons.................Structural and ornamental
iron workers................Finishers....................
Tile layers.......................
Helpers and laborers
Bricklayers’ tenders Building laborers ....
Employer contributions for selected benefits3Rate per
hour1Rate per
hour1noursper
week2Insurance4 Pension Vacation Other5
Dollars Percent Dollars Percent Dollars Percent Dollars Percent
$9,500 $10,650 40.00 0.510 1.020 6 1.25010.650 11.575 40.00 .775 - 1.000 - .500 _ _ _10.110 10.760 40.00 .650 - .700 - - - 0.300 -
10.110 10.760 40.00 .650 _ .700 _ _ .300 _9.490 10.590 40.00 .600 - .550 - 8.250 _ .020 -9.990 11.090 40.00 .600 - .550 - 6.250 _ .020 _9.640 10.740 40.00 .600 - .550 - 6.250 - .020 _9.140 9.780 40.00 .700 - .850 - 6.250 - 6.250 -
10.672 11.362 40.00 .570 _ .400 _ _ 6 8.00 _ _10.510 8 10.510 40.00 .545
'.350 — ~ 6.00 .020 2.31
9.850 10.450 40.00 .900 1.150 .0209.850 10.450 40.00 .900 - 1.150 - - - .020 -
9.550 10.150 40.00 .900 - 1.150 - - - .020 -
9.550 10.150 40.00 .900 - 1.150 - - - .020 _
8.700 9.300 40.00 .900 _ 1.150 _ .020 _8.700 9.300 40.00 .900 - 1.150 - - - .020 -8.790 9.730 40.00 .350 - .100 - .400 - _ _
10.350 16 9.950 40.00 .700 - .850 - - - .100 _10.110 10.760 40.00 .650 - .700 - - - .300 -
9.950 10.500 40.00 .650 _ .700 _ _ _ 36 .300 _9.420 10.520 40.00 .400 - .800 - - - .080 _9.670 10.770 40.00 .400 - .800 - - - .080 _9.670 10.770 40.00 .400 - .800 - - - .080 _9.670 10.770 40.00 .400 - .800 - - - .080 _9.420 10.520 40.00 .400 - .800 - - - .080 _
11.600 12.660 40.00 .900 - 1.260 - 1.250 - _ _11.600 12.660 40.00 .900 - 1.260 - 1.250 _ _ _10.530 10.130 40.00 .700 - .850 - - - .100 _11.600 12.660 40.00 .900 - 1.260 - 1.250 - - _10.750 10.750 40.00 .730 - 1.000 - 6.250 - - _8.440 8 8.440 40.00 .600 - .750 - 6.500 _ - _8.440 8 8.440 40.00 .600 - .750 - 6.500 - - _
10.600 11.200 40.00 .610 - 1.140 - 6 .750 - .630 3.0010.110 10.760 40.00 .650 - .700 - - - .300 -
10.750 8 10.750 40.00 .730 _ 1.000 _ 6 .250 _ _ _10.750 8 10.750 40.00 .730 - 1.000 - 6.250 - _ _9.950 10.500 40.00 .650 .700 36 .300
'
+8.200 8.300 40.00 .820 .700 37 .580+ 7.750 7.800 40.00 .820 - .700 - - - 37 .580 -
See footnotes at end of table.
162Digitized for FRASER http://fraser.stlouisfed.org/ Federal Reserve Bank of St. Louis

Table 20. Wage rates, hours, and employer contributions for selected benefits: Selected cities—Continued
(Union hourly wage rates, July 1, 1976, and wage rates, straight-time weekly hours, and employer insurance, pension, vacation, and other contributions to funds in the building trades, July 1, 1977)
July 1, 1976 July 1, 1977
City and job classification Hoursper
week2
Employer contributions for selected benefits3Rate per
hour1Rate per
hour1 Insurance4 Pension Vacation Other5
Dollars Percent Dollars Percent Dollars Percent Dollars Percent
Spokane, Wash. — Continued
Building construction — Continued
Helpers and laborers — Continued
Concrete and grade crew................................ $7,750 $7,800 40.00 0.820 0.700 37 0.580
Elevator constructors’ helpers.............................. 7.360 8 7.360 40.00 .545 _ .350 _ . 6.00 .020 2.31
Tile layers’ helpers................ - 7.850 40.00 .650 - .700 - - - .300 -
Stamford, Conn.
Building construction
Journeymen
Asbestos workers ................. 9.740 10.840 35.00 .650 .960 6 0.600Bricklayers............................ 9.500 10.210 35.00 .830 - .250 - 6.100 - - -Carpenters........................... 9.250 9.500 40.00 .800 - .550 - 6.350 - .100 -Cement finishers................... 9.500 10.210 35.00 .830 - .250 - 6 .100 - - -Drywall tapers
(finishers)........................... 8.500 8.850 35.00 .500 _ .500 _ 6.150 _ _ _Engineers— Power equipment operators:Derricks, piledrivers, stiff leg and guy derricks, hoists (2 drums or over)............................. 10.900 8 10.900 40.00 .450 .700 .570
Tower cranes, draglines, gradealls, front end loaders (over 7 cu. yd.).................. 10.800 8 10.800 40.00 .450 .700 .570
Maintenance engineers....... 10.700 8 10.700 40.00 .450 - .700 - - - .570 -
Welders, front end loaders (3-7 cu. yd.), mucking machines, pumpcretes, well diggers, conveyors................. 10.450 8 10.450 40.00 .450 .700 .570
Compressor battery operators.......................... 9.700 8 9.700 40.00 .450 _ .700 _ _ _ .570 _
Asphalt spreaders............... 10.250 8 10.250 40.00 .450 - .700 - - - .570 -Bulldozers, graders, scraper pans, carry- alls ................................... 10.200 8 10.200 40.00 .450 .700 .570
Concrete mixers, front end loaders (under 3 cu. yd.), powerstone spreaders.......................... 10.150 8 10.150 40.00 .450 .700 .570
Air and steam valve operators.......................... 9.450 8 9.450 40.00 .450 - .700 - - - .570 -
Compressors, generators, welding machines....... 9.350 8 9.350 40.00 .450 - .700 - _ _ .570 _
Steam jennies, forklifts under 4 feet................. 10.050 8 10.050 40.00 .450 _ .700 _ _ _ .570 .
Rollers............................... 9.950 8 9.950 40.00 .450 - .700 - - - .570 -
Mechanical heaters............. 9.200 8 9.200 40.00 .450 ~ .700 ~ .570
See footnotes at end of table.
163
Digitized for FRASER http://fraser.stlouisfed.org/ Federal Reserve Bank of St. Louis

Table 20. Wage rates, hours, and employer contributions for selected benefits: Selected cities—Continued
(Union hourly wage rates, July 1, 1976, and wage rates, straight-time weekly hours, and employer insurance, pension, vacation, and othercontributions to funds in the building trades, July 1, 1977)
City and job classification
Stamford, Conn. — Continued
Building construction — Continued
Journeymen— Continued
Dinky machines, power pavement breakers.......
Firemen— High pressure..Oilers...........................
Glaziers.........................Lathers..........................Painters.........................Paperhangers.................Pipefitters.......................Plasterers.......................Plumbers........................Reinforcing iron workers ....Roofers, composition.......Roofers, slate and tile ......Sheet-metal workers........Stonemasons..................Structural-iron workers.....
Helpers and laborers
Bricklayers’ tenders........Building laborers ............Plasterers’ laborers.........
Highway and street construction
Journeymen
Carpenters...................Cement finishers...........Engineers— Power equipment operators:Erecting and handling structural steel, front end loaders (7cu. yd. or over)..........
Piledrivers, draglines, gradealls,powershovels and cranes...
Side booms, euclid loaders, pumpcretes ....
Compressor batteries ...Asphalt spreaders......Front end loaders 3 yds. or over, graders ...
Well points system......Asphalt rollers, bulldozers, carryalls........
July 1, 1976 July 1, 1977
Rate per hour1
Rate per hour1
Hoursper
week2
Employer contributions for selected benefits3
Insurance4 Pension Vacation Other5
Dollars Percent Dollars Percent Dollars Percent Dollars Percent
$9,800 8 $9,800 40.00 0.450 0.700 .5709.000 8 9.000 40.00 .450 - .700 - - - .570 _8.550 8 8.550 40.00 .450 - .700 - - - .570 _9.530 9.530 35.00 .950 - .470 - - - 0.330 _9.010 9.010 10 35.00 .350 - .200 - 6 0.750 - .030 _8.000 8.350 35.00 .500 - .500 - 6.150 - - -8.500 8.850 35.00 .500 - .500 - 8 .150 - - _
10.300 10.550 37.50 .750 - .700 - - 4.00 .020 _9.500 10.210 35.00 .830 - .250 - 6.100 - - _
10.300 10.550 37.50 .750 - .700 - - 4.00 .020 _
10.700 10.700 40.00 .750 - .950 - 6.400 - .021 -
9.400 9.900 35.00 1.050 - .500 - 6.250 - .284 _
9.650 10.150 35.00 1.050 - .500 - 8 .250 - .284 -
10.740 10.790 37.50 1.070 - .790 - 8.400 - .100 3.009.500 10.210 35.00 .830 - .250 - 8.100 - - _
10.700 10.700 40.00 .750 .950 6 .400 .021
7.750 8.000 40.00 .500 .550 .1507.500 7.750 40.00 .500 - .550 - - - .150 _
7.750 8.000 40.00 .500 .550 .150
+9.300 9.550 40.00 .700 .450 .250 .1108.650 8.980 40.00 .830 .250 .100
10.930 10.930 40.00 .450 - .700 - - - .563 -
10.790 10.790 40.00 .450 - .700 - - - .563 -
10.470 10.470 40.00 .450 _ .700 _ _ _ .5639.690 9.690 40.00 .450 - .700 - - - .563 _
10.280 10.280 40.00 .450 - .700 - - - .563 -
10.140 10.140 40.00 .450 _ .700 _ _ .563 _9.350 9.350 40.00 .450 - .700 - - - .563 -
9.960 9.960 40.00 .450 - .700 - - - .563 -
See footnotes at end of table.
164
Digitized for FRASER http://fraser.stlouisfed.org/ Federal Reserve Bank of St. Louis

Table 20. Wage rates, hours, and employer contributions for selected benefits: Selected cities—Continued
(Union hourly wage rates, July 1, 1976, and wage rates, straight-time weekly hours, and employer insurance, pension, vacation, and othercontributions to funds in the building trades, July 1, 1977)
City and job classification
July 1, 1976 July 1, 1977
Rate per hour1
Rate per hour1
Hoursper
week2
Employer contributions for selected benefits3
Insurance4 Pension Vacation Other5
Dollars Percent Dollars Percent Dollars Percent Dollars Percent
$9,760 $9,760 40.00 0.450 0.700 0.5639.020 9.020 40.00 .450 - .700 - - - .563 _8.920 8.920 40.00 .450 - .700 - - - .563 -
9.300 9.300 40.00 .450 _ .700 _ _ _ .563 _8.580 8.580 40.00 .450 .700 .563
10.180 11.430 40.00 .500 1.200 6 1.000 .06011.900 12.450 40.00 .700 - .800 - - - .250 -11.735 12.155 40.00 .930 - .900 - - - .130 -
11.735 12.155 40.00 .930 _ .900 _ _ _ .130 _11.550 11.800 40.00 .930 - .750 - 6.500 - .070 -11.550 11.800 40.00 .930 - .750 - 6.500 - .070 -11.550 11.800 40.00 .930 - .750 - 6.500 - .070 -11.570 12.270 40.00 .600 - - - 6 1.000 - 6.110 -
12.150 12.800 40.00 .650 _ .550 3.00 _ _ _ 1.0011.270 12.150 40.00 .545 .350 6.00 .020 2.31
11.390 12.140 40.00 .560 - 1.000 - - - .100 -
11.230 11.980 40.00 .560 - 1.000 - - - .100 -
10.880 11.630 40.00 .560 - 1.000 - - - .100 -
10.070 10.820 40.00 .560 - 1.000 - - - .100 -
9.740 10.490 40.00 .560 - 1.000 - - - .100 -
8.280 8.780 40.00 .560 _ 1.000 _ _ _ .100 _10.125 10.375 40.00 .550 - 1.000 - 6 .800 - .050 -
10.375 10.625 40.00 .550 - 1.000 - 6 .800 - .050 -
11.900 8 11.900 40.00 .650 - .100 - - - .030 -
11.735 12.155 40.00 .930 - .900 - - - .130 -
11.120 11.790 40.00 - - - - - - - -
Stamford, Conn. — Continued
Highway and street construction — Continued
Journeymen— Continued
Front end loaders under 3 yds., rollers, powerchippers, forklifts..........
Firemen, high pressure....Pumps, compressors.....Batch and bulk cementplants.........................
Oilers...........................
Toledo, Ohio
Building construction
Journeymen
Asbestos workers................Boilermakers........................Bricklayers...........................
Pointers, cleaners andcaulkers.........................
Carpenters..........................Millwrights........................Piledrivers........................
Cement finishers..................Electricians (inside
wirers)..............................Elevator constructors............Engineers— Power equip
ment operators:Group A:Heavy equipment,cranes, e tc .....................
Group B:Medium equipment,bulldozers, e tc ................
Group C:Light equipment...............
Group D:Welder operators,compressors, mixers.......
Group E:Backfillers, concretespreading.......................
Group F:Oiler, pumps....................
Glaziers..............................Swing stage.....................
Lathers...............................Marble setters .....................Mosaic and terrazzo
workers.............................
See footnotes at end of table.
165
Digitized for FRASER http://fraser.stlouisfed.org/ Federal Reserve Bank of St. Louis

Table 20. Wage rates, hours, and employer contributions for selected benefits: Selected cities—Continued
(Union hourly wage rates, July 1, 1976, and wage rates, straight-time weekly hours, and employer insurance, pension, vacation, and other contributions to funds in the building trades, July 1, 1977)
July 1, 1976 July 1, 1977
City and job classification Hoursper
week2
Employer contributions for selected benefits3
Rate per hour1
Rate per hour1 Insurance4 Pension Vacation Other5
Dollars Percent Dollars Percent Dollars Percent Dollars Percent
Toledo, Ohio — Continued
Building construction — Continued
Journeymen— Continued
Painters, brush, general......... $9,640 $9,960 40.00 0.930 _ 0.900 _ 6 0.850 _ _ _Spray............................... 10.190 10.510 40.00 .930 - .900 - 6 .850 - - -Swing:Brush.............................. 9.940 10.260 40.00 .930 - .900 - 6.850 - - -Spray.............................. 10.490 10.810 40.00 .930 - .900 - 6.850 - - -
Paperhangers....................... 9.640 9.960 40.00 .930 - .900 - 6 .850 - - -Pipefitters............................. 10.730 11.280 40.00 1.050 - .850 - 6 1.300 - 0.120 -
Refrigeration fitters............ 10.730 11.280 40.00 1.050 - .850 - 6 1.300 - .120 -Plasterers............................. 11.450 12.050 40.00 .650 - - - 6 .750 - .050 -Plumbers.............................. 10.730 11.280 40.00 1.050 - .850 - 6 1.300 - .120 -Reinforcing iron workers........ 11.000 11.240 40.00 .930 - 1.110 - 6.980 - 6 .130 -Roofers, composition............. 11.090 11.610 40.00 .930 - .850 - 6 .500 - - -
Residential........................ 11.090 11.610 40.00 .930 - .850 - 6 .500 - - -Roofers, slate and tile ............ 11.090 11.610 40.00 .930 - .850 - 6 .500 - - -Sheet-metal workers.............. 10.825 11.195 40.00 .930 - 1.150 - 6 1.000 - .050 -Stonemasons........................ 11.735 12.155 40.00 .930 - .900 - - - .130 _Structural-iron workers........... 11.000 11.240 40.00 .930 - 1.110 - 6 .980 - 6 .130 -
Finishers........................... 11.000 11.240 40.00 .930 - 1.110 - 6.980 - 6.130 -Tile layers............................. 11.120 11.790 40.00 - - - - - - - -
Helpers and laborers
Bricklayers’ tenders............... 10.240 10.590 40.00 .650 _ .400 _ 6 .500 . .150Mortar mixers.................... 10.310 10.660 40.00 .650 - .400 - 6 .500 - .150 -
Building laborers ................... 10.110 10.460 40.00 .650 - .400 - 6 .500 - .150 -Elevator constructors’
helpers.............................. 7.890 8.505 40.00 .545 - .350 - - 6.00 .020 2.31Marble setters’ helpers.......... 10.100 10.100 40.00 .930 - - - 6 .500 - - -Plasterers’ tenders................ 10.130 10.480 40.00 .650 - .400 - 6 .500 - .150 -
Mixers.............................. 10.130 10.480 40.00 .650 - .400 - 6 .500 - .150 -Terrazzo workers’
helpers.............................. 10.100 10.100 40.00 .930 - - - 6 .500 - - -Base grinders.................... 10.400 10.400 40.00 .930 - - - 6 .500 - - -
Tile layers’ helpers................ 10.100 10.100 40.00 .930 - - - 6 .500 - - -
Highway and street construction
Journeymen
Carpenters........................... 11.550 11.800 40.00 .930 _ .750 _ 6 .500 _ .070 .Piledrivers ......................... 11.550 11.800 40.00 .930 - .750 - 6 .500 - .070 -
Cement finishers................... 10.460 10.530 40.00 .500 - . - - - - .040 -Engineers— Power equip
ment operators:Heavy equipment— Cranes (all types),power shovels, derricks ................................ 10.290 11.040 40.00 .560 - 1.000 - - - .040 -
See footnotes at end of table.
166Digitized for FRASER http://fraser.stlouisfed.org/ Federal Reserve Bank of St. Louis

(Union hourly wage rates, July 1, 1976, and wage rates, straight-time weekly hours, and employer insurance, pension, vacation, and other contributions to funds in the building trades, July 1, 1977)
Table 20. Wage rates, hours, and employer contributions for selected benefits: Selected cities—Continued
July 1, 1976 July 1, 1977
City and job classification Hoursper
week2
Employer contributions for selected benefits3Rate per
hour1Rate per
hour1 Insurance4 Pension Vacation Other5
Dollars Percent Dollars Percent Dollars Percent Dollars Percent
Toledo, Ohio — Continued
Highway and street construction — Continued
Journeymen— Continued
Medium equipment— Power graders, power scoops, bulldozers............ $10,170 $10,920 40.00 0.560 1.000 0.040
Light equipment— Portable compressors, pumps (4 in. and over), asphalt rollers .................................. 9.130 9.880 40.00 .560 1.000 .040
Structural iron workers........... 11.000 11.240 40.00 .930 - 1.110 - 6 0.980 - .130 -
Helpers and laborers
General laborers................... 8.150 8.700 40.00 .650 - .400 - - - .100 -
Other heavy construction
Journeymen
Carpenters........................... 11.550 11.820 40.00 .930 _ .750 _ 6.500 _ .070 _Millwrights.......................... 11.550 11.820 40.00 .930 - .750 - 6.500 - .070 -Piledrivers.......................... 11.550 11.820 40.00 .930 - .750 - 6.500 - .070 -
Cement finishers................... 10.460 10.530 40.00 .500 - - - - - .040 -Engineers— Power equip
ment operators:Heavy equipment—Cranes (all types), power shovels, derricks ....................... i........ 10.290 11.040 40.00 .560 1.000
-
.040Medium equipment— Power graders, power scoops, bulldozers............ 10.170 10.920 40.00 .560 1.000 .040
Light equipment— Portable compressors, pumps (4 in. and over), asphalt rollers .................................. 9.130 9.880 40.00 .560 1.000 .040
Structural iron workers........... 10.950 11.240 40.00 .930 - 1.110 - 6.980 - .130 -
Helpers and laborers
General laborers................... 8.150 8.700 40.00 .650 - .400 - - - .100 -
See footnotes at end of table.
167
Digitized for FRASER http://fraser.stlouisfed.org/ Federal Reserve Bank of St. Louis

Table 20. Wage rates, hours, and employer contributions for selected benefits: Selected cities—Continued
(Union hourly wage rates, July 1, 1976, and wage rates, straight-time weekly hours, and employer insurance, pension, vacation, and othercontributions to funds in the building trades, July 1, 1977)
City and job classification
July 1, 1976 July 1, 1977
Employer contributions for selected benefits3Rate per
hour1Rate per
hour1noursper
week2Insurance4 Pension Vacation Other5
Dollars Percent Dollars Percent Dollars Percent Dollars Percent
Washington, D.C.
Building construction
Journeymen
Asbestos workers ................. $10,210 $10,770 40.00 0.590 0.890 0.020Boilermakers......................... +7.700 9.700 40.00 .900 - 1.000 - _ _ 1.250 _Bricklayers............................ 10.600 11.650 40.00 .800 - .700 - - - .100 _
Residential........................ 8.750 8.750 40.00 .800 - .700 - - _ .100 _Carpenters........................... 10.000 10.450 40.00 .800 - .600 - - - - -
Pile drivers........................ 10.210 10.680 40.00 .800 - .600 - - _ _ . _Millwrights......................... 10.460 10.940 40.00 .800 - .600 - - - - -
Cement finishers................... 10.040 10.500 40.00 .805 - .600 - - - _ -Electricians (inside
wirers)............................... 10.500 11.100 40.00 .650 - .800 3.00 - - _ 0.50Elevator constructors............. 10.380 11.235 40.00 .545 - .350 - - 6.00 .020 2.30Engineers— Power equip
ment operators:Heavy equipment: Cranes, shovels, andpile drivers...................... 11.080 11.700 40.00 .600 - .600 - - - - _
Medium equipment: Hoists, single ordouble drum.................... 10.830 11.700 40.00 .600 - .600 - - - - -
Trenching machines.......... 10.830 11.040 40.00 .600 - .600 - - - - -Light equipment:Compressors..................... 9.910 10.170 40.00 .600 - .600 - - - - -Pumps............................. 9.910 10.170 40.00 .600 - .600 - - - - -Bulldozers........................ 10.230 10.850 40.00 .600 - .600 - - - - _
Glaziers............................... 9.780 10.530 40.00 .610 - .500 - - - .405 _Lathers................................ 9.510 10.360 40.00 .500 - .500 - - - .005 _Machinists............................ 10.000 11.250 40.00 .750 - - - 0.519 - .394 _Mosaic and terrazzo
workers.............................. 9.930 10.680 40.00 .600 - .400 - - - _ _Marble setters ...................... + 10.600 10.850 40.00 .800 - .650 - 6.750 - .060 _Painters............................... 9.840 10.540 40.00 .810 - 1.100 - - - .010 _
Spray............................... 9.840 10.540 40.00 .810 - 1.100 - - - .010 _Bridge, structuralsteel, swing stage............. 10.340 11.040 40.00 .810 - 1.100 - - - .010 -
Paperhangers....................... 9.840 10.540 40.00 .810 - 1.100 - - - .010 -Pipefitters............................. 9.400 10.580 40.00 .650 - .900 - .400 - - _
Refrigeration fitters............ 9.400 10.580 40.00 .650 - .900 - .400 - - -Sprinkler fitters.................. + 9.950 10.950 40.00 .650 - .950 - .750 - .080 -
Sprinkler fitters..................... - 10.560 40.00 .650 - .950 - .750 - .080 -Plasterers............................. 9.080 10.150 40.00 .550 - .650 - - - .234 -Plumbers.............................. + 9.709 10.110 40.00 .870 - .830 - 6 .380 - .030 _Reinforcing iron workers........ + 10.050 10.500 40.00 .620 - .950 - 6 .300 - - -Roofers, composition............. 9.010 9.570 40.00 .560 - .300 - - - - -Roofers, slate and tile ........... 9.570 10.130 40.00 .560 - .300 - - - - _Sheet-metal workers.............. 9.540 10.220 40.00 .840 - .940 - 6 .520 - .020 _Stonemasons........................ + 10.600 10.850 40.00 .800 - .650 - 6 .750 - .060 -Structural-iron workers........... 10.400 10.600 40.00 .920 - .850 - - - .050Tile layers............................. 9.930 10.680 40.00 .600 - .400 - - - - -
Helpers and laborers
Building laborers................... 8.070 8.460 40.00 .600 _ .450 _ _ .Residential laborers............ 5.050 5.090 40.00 .350 _ - .050 -
See footnotes at end of table.
168Digitized for FRASER http://fraser.stlouisfed.org/ Federal Reserve Bank of St. Louis

Table 20. Wage rates, hours, and employer contributions for selected benefits: Selected cities—Continued
(Union hourly wage rates, July 1, 1976, and wage rates, straight-time weekly hours, and employer insurance, pension, vacation, and other contributions to funds in the building trades, July 1, 1977)
July 1, 1976 July 1, 1977
City and job classification Hoursper
week2
Employer contributions for selected benefits3Rate per
hour1Rate per
hour1 Insurance4 Pension Vacation Other6
Dollars Percent Dollars Percent Dollars Percent Dollars Percent
Washington, D.C. —Continued
Building construction —Continued
Helpers and laborers — Continued
Composition roofers’ helpers................... ........... $6,430 $6,790 40.00 0.560 0.300
Elevator constructors’ helpers.............................. 7.280 7.860 40.00 .545 _ .350 . _ 6.00 0.020 2.30
Marble setters’ helpers.......... 8.600 9.200 40.00 .600 - .400 - - - - -
Plasterers’ laborers................ 8.760 '8.760 40.00 .500 - .400 - - - .050 -
Plumbers’ laborers................ 7.760 8.110 40.00 .500 - .400 - - - .050 -Terrazzo workers’
helpers.............................. 8.600 9.200 40.00 .600 _ .400 _ _ _ . _Tile layers’ helpers................ 8.600 9.200 40.00 .600 - .400 - - - - -
Highway and street construction
Journeymen
Cement masons.................... 6.750 7.150 40.00 .270 .350Engineers— Power equip
ment operators:Heavy equipment:Cranes, piledrivers, shovels.......................... 7.600 7.850 40.00 .500 .550
Medium equipment:Hoists (single or double drum)...................
Trenchers........................ 7.600 7.850 40.00 .500 - .550 - - - - -Light equipment:Bulldozers........................ 7.100 7.250 40.00 .500 _ .550 _ _ _ _ _Compressors, pumps........ 6.100 6.750 40.00 .500 - .550 - - - - -
Helpers and laborers
General laborers................... 6.400 7.000 40.00 .270 .350
Other heavy construction
Helpers and laborers
General laborers................... 8.070 8.610 40.00 .600 .450 .050
Wichita, Kansas
Building construction
Journeymen
Asbestos workers................. 9.050 10.050 40.00 + .855 .500 6 0.850 + .030
See footnotes at end of table.
169
Digitized for FRASER http://fraser.stlouisfed.org/ Federal Reserve Bank of St. Louis

Table 20. Wage rates, hours, and employer contributions for selected benefits: Selected cities—Continued
(Union hourly wage rates, July 1, 1976, and wage rates, straight-time weekly hours, and employer insurance, pension, vacation, and othercontributions to funds in the building trades, July 1, 1977)
City and job classification
July 1, 1976 July 1, 1977
Employer contributions for selected benefits3Rate per
hour1Rate per
hour1
noursper
week2Insurance4 Pension Vacation Other5
Dollars Percent Dollars Percent Dollars Percent Dollars Percent
Wichita, Kansas — Continued
Building construction — Continued
Journeymen— Continued
Bricklayers..................................... $9,330 $9,830 40.00 0.500 0.250 6 0.250Carpenters .................................... 9.150 9.650 40.00 .500 - - - - - - -Drywall tapers
(finishers).................................... 8.470 9.470 40.00 .100 .300Electricians (inside
w irers).......................................... 9.400 9.870 40.00 .600 .250 3.00 6 6.00 2.00Engineers— Power equip
ment operators:Group 1:Boilers (2), cranes, dozers, scrapers, hoists (2-drum) ..................... 9.500 10.000 40.00 .500 1.000 .750 0.100
Group 2:A-frames, boilers (1), forklifts, hoists (1-drum), power brooms....................... 9.100 9.600 40.00 .500 1.000 .750 .100
Group 3:Farm tractors with attachm ents.......................... 8.300 8.800 40.00 .500 1.000 .750 .100
Farm tractors without attachm ents.......................... 8.050 8.550 40.00 .500 1.000 .750 .100
Group 4:Track crane o ile r ................... 7.750 8.000 40.00 .500 1.000 .750 .100Motor crane o ile r................... 8.000 8.250 40.00 .500 _ 1.000 _ .750 _ .100 -
Glaziers .......................................... 8.620 9.235 40.00 .550 - .570 - - 10.00 + .030 4.00Lathers ........................................... 8.900 9.900 40.00 - - .150 - _ _ _ _Painters:
Brush ......................................... 8.470 9.470 40.00 .100 .300S p ra y ......................................... 9.070 10.070 40.00 .100 - .300 - - - - _
Plasterers...................................... 8.500 9.000 40.00 - _ - _ _ _ _ _Plumbers ....................................... 10.230 10.620 40.00 .750 - .800 6 .500 _ + .040 _Roofers, composition.................. 8.200 8.700 40.00 .280 - .200 - _ - - _Sheet-metal workers................... 10.125 11.020 40.00 .940 - .440 - .550 - .010 3.00Structural-iron w orkers .............. 9.880 10.480 40.00 - - .250 - .530 - + .020 -
Helpers and laborers
Building laborers ......................... 6.700 7.100 40.00 .500 _ .250 _ _ _ .150 _
170Digitized for FRASER http://fraser.stlouisfed.org/ Federal Reserve Bank of St. Louis

1 Basic (minimum) rates, excluding holiday, vacation, or other benefit payments made or regularly credited to the employee. Wage rates shown represent rates available and payable on July 1 of the survey year and do not include increases made later that are retroactive to July 1 or before.
2 Hours are the same for both years unless otherwise indicated.3 Shown in terms of cents per hour or as a percent of rate; in
actual practice, however, some employer payments are calculated on the basis of total hours or gross payroll. These variations in method of computation are not indicated in the above tabulation. Amounts shown include contractually authorized deductions from negotiated wage rates as well as direct employer contributions to specified benefit funds. Excluded, however, are voluntary deductions from wage rates authorized by individual employees.
4 Includes life insurance, hospitalization and other types of health and welfare benefits.
5 Includes all other nonlegally required employer contributions, except those for apprenticeship fund payments, as indicated in individual agreements.
6 Part of negotiated rate; not included in base rate shown. Amount may be included in computation of overtime and other premium rates.
7 Under 5 years of service: 2 percent plus supplemental vacation of 4 percent of actual hours worked. 5 years of service and over: 4 percent plus supplemental vacation of 4 percent of actual hours worked.
8 New rate in negotiation on survey date.9 Agreement provides for employer-financed plan; amount of
employer payment not available.10 Was 40 hours on July 1, 1976.11 Revision of data previously reported. New rate in negotiation on
survey date.12 $1 of this amount is a deduction from employee’s net wages;
not included in basic rate shown.13 Includes supplemental unemployment benefits; separate data
not available.14 Percentage based on negotiated rate of $12.49.15 Percentage based on negotiated rate of $9.94. Part of
negotiated rate, not included in basic rate shown. Amount may be included in computation of overtime and other premium rates.
16 Part of basic rate transferred to insurance, pension, and/or vacation.
17 Percentage based on negotiated rate of $9.94.18 Percentage based on negotiated rate of $12.49. Part of
negotiated rate, not included in basic rate shown. Amount may be in
cluded in computation of overtime and other premium rates.19 Includes a 2-1/2 percent contribution to holidays. Part of
negotiated rate, not included in basic rate shown.20 40-hour work week from Sept, to Feb. 36-hour work week from
Mar. to Aug.21 Includes 25-cent holiday contribution which is part of negotiated
rate, not included in basic rate shown.22 Includes 45-cent savings fund contribution which is part of
negotiated rate, not included in basic rate shown.23 Revision of data previously reported. Part of negotiated rate, not
included in basic rate shown. Amount may be included in computation of overtime and other premium rates.
24 Reduced wage rate negotiated for employees hired after Jan. 1, 1977.
25 Includes a 75-cent contribution to savings fund, which is part of negotiated rate, not included in basic rate shown.
26 Reduction in basic rate due to local economic situation.27 35 cents of this amount is a deduction from employee’s net
wages for a holiday fund; not included in basic rate shown.28 Was 36 hours on July 1, 1976.29 6 percent of this amount is a deduction from employee’s net
wages for a savings fund; not included in basic rate shown.30 44 cents of this amount is a deduction from employee’s net
wages; not included in basic rate shown.31 Decrease due to part of the basic rate being transferred to
insurance, pension, and/or vacation plans, as well as a negotiated decrease in the basic rate.
32 Alternate 32- and 36-hour work weeks.33 Includes 6 percent deferred payment plan which is part of nego
tiated rate, not included in basic rate shown.34 Includes 15-cent holiday contribution which is part of negotiated
rate, not included in basic rate shown.35 Includes 5-cent supplemental dues which is part of negotiated
rate, not included in basic rate shown.36 Includes 25-cent savings fund deduction which is part of nego
tiated rate, not included in basic rate shown.37 Includes 50-cent credit union deduction which is part of nego
tiated rate, not included in basic rate shown.+ Revision of data previously reported.
NOTE: Dash indicates no data, or no data reported. When referring to a rate per hour for a previous year, indicates either a change in progression, or a new jobs or union not previously reported.
171Digitized for FRASER http://fraser.stlouisfed.org/ Federal Reserve Bank of St. Louis

Appendix A. A Note on New Benefit Tabulations
Because of the growing importance of funds for holidays, savings, and supplemental unemployment benefits in the construction industry, the Bureau is expanding its definition of wages plus benefits to include contributions to these three funds in addition to the insurance, pension, and vacation contributions. Beginning with the July 1, 1978, survey, this six-benefit method of computing average employer benefit contributions will replace the current three-benefit formula.
On July 1, 1977, average employer contributions for holidays, insurance, pensions, savings funds, supplemental unemployment benefits, and vacations totaled
$2.26—18 percent of the basic wage plus six-benefit package (table A-l). The difference between average contributions for these six benefits and contributions for the three benefits previously tabulated—insurance, pension, and vacation—was 8 cents for all trades. It usually amounted to between 2 and 10 cents an hour for each trade; the largest differences—15 to 30 cents—were reported for boilermakers, electricians, elevator constructors and helpers, glaziers, plumbers, and sheet-metal workers. The relationships among regional and city averages based on wages pftus six benefits did not differ significantly from those for wages plus three benefits, as outlined in the main text. (See table A-2 through A-6).
Table A-1. Average wage rates and employer contributions for six benefits by trade: United States
(Average union hourly wage rates and employer contributions1 in the building trades, July 1, 1977)
Trade Average rate per hour
Average employer
contribution per hour1
Average rate plus employer contribution per hour1
Trade Average rate per hour
Average employer
contribution per hour1
Average rate plus employer contribution per hour1
All building trades.............. $10.02 $2.26 $12.28 Plumbers............................. 10.75 2.84 13.59Reinforcing iron workers....... 10.07 2.58 12.65
Journeymen........................... 10.44 2.37 12.81 Roofers composition .......... 9.98 1.92 11.90Asbestos workers................ 10.29 2.50 12.80 Roofers slate and tile 9.93 1.87 11.80Boilermakers........................ 10.89 2.28 13.18 Sheet-metal workers ............ 10.61 2.60 13.20Bricklayers .......................... 10.39 2.09 12.48 Stonemasons...................... 10.33 2.19 12.52Carpenters.......................... 10.25 2.28 12.53 Structural-iron workers ..... 10.41 2.88 13.30Cement finishers................ 9.92 2.31 12.24 Tile layers ........................... 9.84 1.95 11.80Drywall tapers ..................... 9.70 1.17 10.87Electricians (inside wirers)..... 11.02 2.54 13.55 Helpers and laborers............ 8.03 1.77 9.79Elevator constructors........... 11.22 2.06 13.28 Bricklayers’ tenders.............. 8.33 1.58 9.91Glaziers.............................. 9.77 2.07 11.84 Building laborers . . 7.96 1.85 9.80Lathers............................... 10.26 1.78 12.04 Composition roofers’ helpers .. 6.41 1.39 7.80Machinists........................... 10.60 1.14 11.74 Elevator constructors’ helpers 7.93 1.77 9.69Marble setters..................... 10.03 2.08 12.11 Marhle setters’ helpers 8.43 1.60 10.03Mosaic and terrazzo workers .. 9.80 1.67 11.46 Plasterers’ laborers............... 8.25 1.69 9̂ 94Painters.............................. 9.87 1.70 11.57 Plumbers’ laborers 7.64 1.20 8.84Paperhangers...................... 9.78 1.54 11.32 Terrazzo workers’ laborers 8.39 1.36 9.75Pipefitters............................ 11.15 2.87 14.02 Tile layers’ helpers 8.58 1.68 10̂ 26Plasterers............................ 10.08 1.94 12.02
1 Includes employer contributions to insurance (life insurance, hospitalization, medical, surgical, and other similar types of health and welfare programs); pension funds; vacation payments; supplemental unemployment benefits; savings funds; and paid holidays, as provided in labor-management contracts. Averages presented are for a straight-time hour; in actual prac* tice, however, some employer payments are calculated for total hours worked or gross payroll.
Average refers to all workers in the classification, including those for whom
employer contributions were not specified in their particular contracts. Such situations were included in the average computation as zero contributions.
Some contracts also provide payments to other funds, such as for education and promotion. Information on payments to these funds was not included in these tabulations.
NOTE: Because of rounding, sums of individual items may not equal totals.
172
Digitized for FRASER http://fraser.stlouisfed.org/ Federal Reserve Bank of St. Louis

(Average union hourly wage rates plus employer contributions1 in the building trades by region2, July 1, 1977)
Table A-2. Average wage rates plus employer contributions for six benefits: Regions
Trade UnitedStates
Region
NewEngland
MiddleAtlantic
BorderStates Southeast Southwest Great
LakesMiddleWest Mountain Pacific
All building trades.............. $12.28 $11.57 $13.10 $10.86 $9.63 $9.95 $12.68 $11.65 $11.43 $13.91
Journeymen........................... 12.81 12.10 13.69 11.46 10.23 10.51 13.12 12.16 12.13 14.44Asbestos workers................ 12.80 12.74 13.51 11.42 11.10 11.24 13.68 12.84 12.30 14.42Boilermakers........................ 13.18 13.38 13.96 12.44 11.26 11.50 13.78 12.29 13.92 14.59Bricklayers.......................... 12.48 11.82 14.25 10.64 10.26 10.31 12.88 11.66 11.69 13.56Carpenters.......................... 12.53 11.33 13.93 11.26 9.75 9.98 12.96 11.47 11.65 13.72Cement finishers.................. 12.24 11.63 13.57 10.22 9.23 9.91 12.40 11.81 11.51 13.33Drywall tapers.............. ....... 10.87 10.26 12.43 - 9.94 10.04 10.69 10.70 11.11 12.23Electricians (inside wirers)..... 13.55 12.75 14.41 12.10 11.18 11.68 13.83 13.46 13.27 15.50Elevator.constructors............ 13.28 12.58 13.85 12.70 11.55 11.43 13.89 12.95 12.66 14.64Glaziers.............................. 11.84 11.14 12.53 10.48 9.33 9.76 11.69 12.06 11.09 13.18Lathers............................... 12.04 11.23 12.88 10.46 9.69 10.18 12.01 11.12 11.28 13.47Machinists........................... 11.74 11.12 12.78 12.76 - 9.42 12.72 11.57 - 13.18Marble setters..................... 12.11 11.69 12.18 11.07 10.01 9.87 12.15 10.16 10.35 13.91Mosaic and terrazzo workers .. 11.46 11.66 12.92 10.14 9.82 9.43 10.95 9.16 10.44 13.59Painters.............................. 11.57 11.24 11.83 9.91 9.08 9.64 11.42 10.96 11.11 13.30Paperhangers...................... 11.32 10.53 11.17 11.78 9.42 9.71 10.91 11.29 10.99 14.06Pipefitters............................ 14.02 13.09 13.60 12.34 11.47 11.84 13.76 14.29 12.52 16.89Plasterers............................ 12.02 11.42 12.38 10.39 9.59 10.23 12.17 11.05 11.23 14.01Plumbers............................. 13.59 12.72 13.78 11.96 11.10 10.55 13.62 13.29 12.40 17.00Reinforcing iron workers....... 12.65 12.79 13.71 11.82 10.30 9.32 13.63 11.70 13.04 14.39Roofers, composition........... 11.90 11.74 13.49 8.97 9.15 8.29 12.89 10.78 10.63 12.75Roofers, slate and tile ........... 11.80 12.11 12.52 8.59 9.00 8.66 12.44 11.37 10.64 12.93Sheet-metal workers............ 13.20 12.81 13.91 11.91 10.68 10.98 13.31 12.80 12.69 15.16Stonemasons ...................... 12.52 11.89 12.52 11.54 10.18 10.96 12.56 11.43 12.05 13.88Structural-iron workers.......... 13.30 12.78 14.64 12.04 9.96 10.37 14.13 11.87 12.92 14.38Tile layers........................... 11.80 11.68 11.97 9.44 9.47 9.86 11.87 10.76 10.45 13.44
Helpers and laborers .............. 9.79 9.14 10.84 7.95 6.77 7.04 10.32 9.48 8.96 11.31Bricklayers’ tenders.............. 9.91 9.25 11.38 6.90 6.75 7.20 10.26 9.61 9.70 11.96Building laborers.................. 9.80 8.96 10.72 8.05 6.54 6.97 10.31 9.34 8.87 11.19Composition roofers’ helpers .. 7.80 9.75 9.04 6.03 6.29 3.20 9.25 - - 8.54Elevator constructors’ helpers 9.69 9.17 10.43 9.03 8.26 8.27 9.95 9.38 9.11 10.49Marble setters’ helpers......... 10.03 10.22 11.26 9.99 9.38 7.62 10.74 9.61 9.04 10.37Plasterers’ laborers............... 9.94 9.21 10.79 8.47 7.23 6.73 10.70 10.19 9.97 12.91Plumbers’ laborers................ 8.84 - 11.34 7.91 6.73 - 11.01 10.97 7.91 11.04Terrazzo workers’ laborers.... 9.75 10.57 11.27 7.06 7.24 7.42 10.13 9.62 8.45 11.84Tile layers’ helpers............... 10.26 10.14 10.16 8.69 7.35 7.53 10.83 9.72 9.50
•11.41
1 Includes employer contributions to insurance (life insurance, hospitalization, medical, surgical, and other similar types of health and welfare programs); pension funds; vacation payments; supplemental unemployment benefits; savings funds; and paid holidays, as provided in labor- management contracts. Averages presented are for a straight-time hour; in actual practice, however, some employer payments are calculated for total hours worked or gross payroll.
Average refers to all workers in the classification, including those for whom employer contributions were not specified in° their particular contracts. Such situations were included in the average computation as zero contributions.
Some contracts also provide payments to other funds, such as for education and promotion. Information on payments to these funds was not included in these tabulations.
2 The regions referred to in this study include: New England— Connecticut, Maine, Massachusetts, New Hampshire, Rhode Island, and Vermont; Middle Atlantic—New Jersey, New York, and Pennsylvania; Border States—Delaware, District of Columbia, Kentucky, Maryland, Virginia, and West Virginia; Southeast—Alabama, Florida, Georgia, Mississippi, North Carolina, South Carolina, and Tennessee; Southwest— Arkansas, Louisiana, Oklahoma, and Texas; Great Lakes—Illinois, Indiana, Michigan, Minnesota, Ohio, and Wisconsin; Middle West—Iowa, Kansas, Missouri, Nebraska, North Dakota, and South Dakota; Mountain—Arizona, Colorado, Idaho, Montana, New Mexico, Utah, and Wyoming; Pacific—Alaska, California, Hawaii, Nevada, Oregon, and Washington.
NOTE: Dash indicates no data reported.
173Digitized for FRASER http://fraser.stlouisfed.org/ Federal Reserve Bank of St. Louis

(Average union hourly wage rates and employer contributions1 in the building trades by city, July 1, 1977)
Table A-3. Average wage rates and employer contributions for six benefits: Selected cities by population group
City by population groupAverage rate per
hour
Average employer
contribution per hour1
Average rate plus employer
contribution per hour1
City by population groupAverage rate per
hour
Average employer
contribution per hour1
Average rate plus employer
contribution per hour1
All cities................................... $10.02 $2.26 $12.28 Cincinnati, Ohio.......................... $10.83 $1.83 $12.66Fort Worth, Tex ......................... 8.95 .94 9.88
Population group I Honolulu, Hawaii........................ 9.30 3.35 12.65(1,000,000 and over) .................... 10.50 2.93 13.44 Long Beach, Calif....................... 10.54 3.80 14.34Chicago, III.................................. 10.72 1.92 12.64 Louisville, Ky.............................. 9.77 1.62 11.39Detroit, Mich............................... 10.68 3.45 14.13 Miami, Fla.................................. 8.67 1.44 10.11Houston, Tex.............................. 9.70 1.39 11.09 Minneapolis-St. Paul, Minn........... 9.89 1.90 11.79Los Angeles, Calif........................ 10.48 3.70 14.18 Nashville-Davidson, Tenn............ 8.71 .82 9.53New York, N.Y ............................ 10.57 3.49 14.06 Newark, N.J............................... 10.74 2.41 13.15Philadelphia, Pa........................... 10.15 2.58 12.73 Norfolk, Va ................................ 8.34 .90 9.24
Omaha, Nebr............................. 9.46 1.54 11.00Population group II Portland, Oreg............................ 10.87 2.48 13.35(500,000 to 1,000,000) .................. 10.11 2.16 12.27 Rochester, N.Y .......................... 10.05 2.28 12.33Baltimore, Md.............................. 9.21 1.57 10.78 Sacramento, Calif....................... 10.71 3.83 14.54Boston, Mass.............................. 10.06 2.24 12.30 Toledo, Ohio ............................. 11.47 2.25 13.72Cleveland, Ohio........................... 11.04 2.77 13.81 Wichita, Kans............................. 9.46 1.12 10.58Columbus, Ohio........................... 9.94 1.62 11.57Dallas, Tex.................................. 9.12 1.04 10.16 Population group IVDenver, Colo............................... 9.50 2.02 11.52 (100,000 to 250,000).................... 9.49 1.86 11.35Indianapolis, Ind.......................... 10.21 1.62 .11.83 Albany, N.Y ............................... 9.58 1.86 11.45Jacksonville, Fla.......................... 8.47 1.45 9.92 Chattanooga, Tenn..................... 8.33 .87 9.20Kansas City, Mo.......................... 10.26 1.83 12.09 Corpus Christi, Tex..................... 8.30 .95 9.26Memphis, Tenn ........................... 9.39 1.12 10.51 Flint, Mich.................................. 9.86 2.50 12.36Milwaukee, Wis ........................... 10.21 2.38 12.59 Fremont, Calif ............................ 11.28 3.86 15.14New Orleans, La......................... 9.24 1.03 10.28 Fresno, Calif.............................. 10.84 3.33 14.17Phoenix, Ariz............................... 10.01 2.19 12.21 Grand Rapids, Mich .................... 9.08 1.95 11.03Pittsburgh, Pa............................. 10.29 2.33 12.62 Hammond, Ind ........................... 10.36 1.78 12.13St. Louis, M o.............................. 10.12 2.17 12.29 Huntsville, A la............................ 8.48 .77 9.26San Antonio, Tex......................... 8.25 1.30 9.56 New Bedford, Mass.................... 9.31 1.91 11.21San Diego, Calif.......................... 10.52 3.34 13.86 New Haven, Conn...................... 9.46 1.58 11.04San Francisco, Calif.................... 11.50 4.07 15.58 Providence, R.l .......................... 9.17 1.92 11.09Seattle, Wash............................. 10.96 2.28 13.24 Riverside, Calif........................... 10.26 3.73 13.99Washington, D.C......................... 10.16 1.55 11.71 Rockford, III............................... 10.70 1.48 12.17
St. Petersburg, F la ..................... 8.45 1.14 9.59Population group III Salt Lake City, Utah.................... 9.46 1.40 10.86(250,000 to 500,000) .................... 9.92 2.06 11.98 Santa Ana, Calif......................... 9.94 3.52 13.46Akron, Ohio................................. 10.41 2.03 12.44 Scranton, Pa ............................. 10.00 1.81 11.81Atlanta, Ga................................. 8.63 1.35 9.98 Spokane, Wash.......................... 10.30 2.01 12.31Buffalo, N.Y................................ 10.83 2.49 13.31 Stamford, Conn.......................... 9.71 1.70 11.41
1 Includes employer contributions to insurance (life insurance, hospitalization, medical, surgical, and other similar types of health and welfare programs); pension funds; vacation payments; supplemental unemployment benefits; savings funds; and paid holidays, as provided in labor- management contracts. Averages presented are for a straight-time hour; in actual practice, however, some employer payments are calculated for total hours worked or gross payroll.
Average refers to all workers in the classification, including those for whom employer contributions were not specified in their particular
contracts. Such situations were included in the average computation as zero contributions.
Some contracts also provide payments to other funds, such as for education and promotion. Information on payments to these funds was not included in these tabulations.
NOTE: Because of rounding, sums of individual items may not equal totals.
174Digitized for FRASER http://fraser.stlouisfed.org/ Federal Reserve Bank of St. Louis

(Average union hourly wage rates and employer contributions1 in the building trades by city, July 1, 1977)
Table A-4. Average wage rates and employer contributions for six benefits: Selected cities by region
City by region2Average rate per
hour
Average employer
contribution per hour1
Average rate plus employer
contribution per hour1
City by region2Average rate per
hour
Average employer
contribution per hour1
Average rate plus employer
contribution per hour1
All cities................................... $10.02 $2.26 $12.28 Great Lakes................................. $10.47 $2.27 $12.74Akron, Ohio (III)......................... 10.41 2.03 12.44
New England ................................. 9.64 1.93 11.57 Chicago, III. (I)............................ 10.72 1.92 12.64Boston, Mass. (II)........................ 10.06 2.24 12.30 Cincinnati, Ohio (III).................... 10.83 1.83 12.66New Bedford, Mass. (IV)............... 9.31 1.91 11.21 Cleveland, Ohio (II) .................... 11.04 2.77 13.81New Haven, Conn. (IV)................ 9.46 1.58 11.04 Columbus, Ohio (II).................... 9.94 1.62 11.57Providence, R.l. (IV) .................... 9.17 1.92 11.09 Detroit, Mich. (I)......................... 10.68 3.45 14.13Stamford, Conn. (IV).................... 9.71 1.70 11.41 Flint, Mich. (IV)........................... 9.86 2.50 12.36
Grand Rapids, Mich. (IV)............. 9.08 1.95 11.03Middle Atlantic .............................. 10.35 2.75 13.10 Hammond, Ind. (IV)..................... 10.36 1.78 12.13
Albany, N.Y. (IV) ......................... 9.58 1.86 11.45 Indianapolis, Ind. (II).................... 10.21 1.62 11.83Buffalo, N.Y. (Ill) ......................... 10.83 2.49 13.31 Milwaukee, Wis. (II)..................... 10.21 2.38 12.59New York, N.Y. (I)........................ 10.57 3.49 14.06 Minneapolis-St. Paul, Minn. (Ill).... 9.89 1.90 11.79Newark, N.J. (Ill) .......................... 10.74 2.41 13.15 Rockford, III. (IV)......................... 10.70 1.48 12.17Philadelphia, Pa. (I)...................... 10.15 2.58 12.73 Toledo, Ohio (III)......................... 11.47 2.25 13.72Pittsburgh, Pa. (II)........................ 10.29 2.33 12.62Rochester, N.Y. (Ill)..................... 10.05 2.28 12.33 Middle West................................. 9.87 1.77 11.65Scranton Pa (IV) ...................... 10.00 1.81 11.81 Kansas City, Mo. (II).................... 10.26 1.83 12.09
Omaha, Nebr. (Ill)....................... 9.46 1.54 11.00Border S ta te s ................................ 9.45 1.41 10.86 St. Louis, Mo. (II)........................ 10.12 2.17 12.29
Baltimore, Md. (II)........................ 9.21 1.57 10.78 Wichita, Kans. (Ill)...................... 9.46 1.12 10.58Louisville, Ky. (Ill)......................... 9.77 1.62 11.39Norfolk Va (III) ...................... 8.34 .90 9.24 Mountain...................................... 9.63 1.81 11.43Washington D C (II)................. 10.16 1.55 11.71 Denver, Colo. (II)........................ 9.50 2.02 11.52
Phoenix, Ariz. (II) ........................ 10.01 2.19 12.21Southeast .................................................... 8.56 1.07 9.63 Salt Lake City, Utah (IV).............. 9.46 1.40 10.86
Atlanta, Ga. (Ill)........................... 8.63 1.35 9.98Chattanooga, Tenn. (IV)................ 8.33 .87 9.20 Pacific......................................... 10.54 3.37 13.91Huntsville, Ala. (IV)...................... 8.48 .77 9.26 Fremont, Calif. (IV)..................... 11.28 3.86 15.14Jacksonville, Fla. (II).................... 8.47 1.45 9.92 Fresno, Calif. (IV) ....................... 10.84 3.33 14.17Memphis Tenn. (II)...................... 9.39 1.12 10.51 Honolulu, Hawaii (III)................... 9.30 3.35 12.65Miami Fla. (Ill) ............................ 8.67 1.44 10.11 Long Beach, Calif. (Ill)................ 10.54 3.80 14.34Nashville-Davidson, Tenn. (Ill)...... 8.71 .82 9.53 Los Angeles, Calif. (I) ................. 10.48 3.70 14.18St Petersburg, Fla. (IV) ................ 8.45 1.14 9.59 Portland, Oreg. (Ill)..................... 10.87 2.48 13.35
Riverside, Calif. (IV)..................... 10.26 3.73 13.99Southwest..................................... 8.87 1.07 9.95 Sacramento, Calif. (Ill)................ 10.71 3.83 14.54
Corpus Christi Tex ( IV ) ....................... 8.30 .95 9.26 San Diego, Calif. (II).................... 10.52 3.34 13.86Dallas, Tex. (II)............................ 9.12 1.04 10.16 San Francisco, Calif. (II).............. 11.50 4.07 15.58Fort Worth, Tex. (Ill).................... 8.95 .94 9.88 Santa Ana, Calif. (IV).................. 9.94 3.52 13.46Houston, Tex. (I)......................... 9.70 1.39 11.09 Seattle, Wash. (II)....................... 10.96 2.28 13.24New Orleans, La. (II).................... 9.24 1.03 10.28 Spokane, Wash. (IV)................... 10.30 2.01 12.31San Antonio, Tex. (II)................... 8.25 1.30 9.56
1 Includes employer contributions to insurance (life insurance, hospitalization, medical, surgical, and other similar types of health and welfare programs); pension funds; vacation payments; supplemental unemployment benefits; savings funds; and paid holidays, as provided in labor- management contracts. Averages presented are for a straight-time hour; in actual practice, however, some employer payments are calculated for total hours worked or gross payroll.
Average refers to all workers in the classification, including those for whom employer contributions were not specified in their particular contracts. Such situations were included in the average computation as zero contributions.
Some contracts also provide payments to other funds, such as for education and promotion. Information on payments to these funds was not included in these tabulations.
2 See table A-2, footnote 2, for definitions of regions. Population size is shown in parentheses as follows; Group I = 1,000,000 or more; Group II = 500,000 to 1,000,000; Group III = 250,000 to 500,000; and Group IV = 100,000 to 250,000.
NOTE: Because of rounding, sums of individual items may not equal totals.
175Digitized for FRASER http://fraser.stlouisfed.org/ Federal Reserve Bank of St. Louis

(Average union hourly wage rates and employer contributions1 in the building trades, July 1, 1977)
Table A-5. Average wage rates and employer contributions for six benefits, journeymen and laborers: Selected cities bypopulation group
City by population groupAverage rate per
hour
Average employer
contribution per hour1
Average rate plus employer
contribution per hour1
City by population groupAverage rate per
hour
Average employer
contribution per hour1
Average rate plus employer
contribution per hour '
Journeymen
All cities................................... $10.44 $2.37 $12.81 Cincinnati, Ohio.......................... $10.99 $1.97 $12.97Fort Worth, Tex ......................... 9.75 1.02 10.77
Population group I Honolulu, Hawaii......................... 9.74 3.68 13.43(1,000,000 and over) ..................... 10.88 3.07 13.95 Long Beach, Calif....................... 11.19 3.92 15.11Chicago, III.................................. 11.08 1.97 13.04 Louisville, Ky.............................. 10.11 1.74 11.86Detroit, Mich............................... 10.90 3.59 14.49 Miami, Fla.................................. 9.15 1.46 10.61Houston, Tex.............................. 10.10 1.53 11.63 Minneapolis-St. Paul, Minn........... 10.18 2.01 12.19Los Angeles, Calif........................ 10.74 3.74 14.48 Nashville-Davidson, Tenn............ 9.05 .85 9.90New York, N.Y ............................ 11.05 3.71 14.77 Newark, N.J............................... 10.97 2.49 13.46Philadelphia, Pa........................... 10.77 2.91 13.68 Norfolk, Va ................................ 8.94 1.00 9.94
Omaha, Nebr.............................. 10.10 1.70 11.80Population group II Portland, Oreg............................ 11.11 2.49 13.59(500,000 to 1,000,000) .................. 10.55 2.26 12.81 Rochester, N.Y .......................... 10.73 2.17 12.90Baltimore, Md.............................. 9.82 1.78 11.60 Sacramento, Calif....................... 11.62 3.78 15.39Boston, Mass.............................. 10.46 2.41 12.87 Toledo, Ohio .............................. 11.67 2.39 14.07Cleveland, Ohio........................... 11.23 2.84 14.07 Wichita, Kans............................. 9.99 1.21 11.20Columbus, Ohio........................... 10.58 1.72 12.29Dallas, Tex.................................. 9.74 1.15 10.88 Population group IVDenver, Colo............................... 10.07 2.24 12.31 (100,000 to 250,000).................... 9.91 1.94 11.85Indianapolis, Ind.......................... 10.80 1.76 12.56 Albany, N.Y ............................... 10.01 1.90 11.91Jacksonville, Fla.......................... 8.89 1.59 .10.47 Chattanooga, Tenn..................... 8.95 .99 9.94Kansas City, Mo.......................... 10.55 1.90 12.45 Corpus Christi, Tex..................... 8.66 1.02 9.68Memphis, Tenn ........................... 9.79 1.20 10.99 Flint, Mich.................................. 10.14 2.63 12.77Milwaukee, Wis ........................... 10.50 2.47 12.97 Fremont, Calif ............................ 11.83 3.90 15.74New Orleans, La......................... 9.72 1.17 10.90 Fresno, Calif.............................. 11.06 3.29 14.34Phoenix, Ariz............................... 10.58 2.29 12.87 Grand Rapids, Mich .................... 9.52 2.04 11.56Pittsburgh, Pa............................. 10.50 2.42 12.91 Hammond, Ind ........................... 11.13 2.04 13.17St. Louis, Mo .............................. 10.34 2.27 12.61 Huntsville, A la............................ 9.26 .80 10.06San Antonio, Tex......................... 8.87 1.45 10.32 New Bedford, Mass..................... 9.63 2.07 11.70San Diego, Calif.......................... 11.43 3.40 14.83 New Haven, Conn...................... 9.88 1.70 11.58San Francisco, Calif.................... 11.97 4.17 16.14 Providence, R.l .......................... 9.53 2.07 11.60Seattle, Wash............................. 11.28 2.33 13.61 Riverside, Calif........................... 11.20 3.80 15.00Washington, D.C......................... 10.53 1.65 12.19 Rockford, III............................... 10.82 1.52 12.34
St. Petersburg, Fla ..................... 8.67 1.15 9.82Population group III Salt Lake City, Utah.................... 9.95 1.58 11.53(250,000 to 500,000) ..................... 10.39 2.13 12.53 Santa Ana, Calif......................... 10.73 3.58 14.31Akron, Ohio................................. 10.50 2.10 12.60 Scranton, Pa .............................. 10.15 1.94 12.08Atlanta, Ga.................................. 9.15 1.51 10.66 Spokane, Wash.......................... 10.94 2.00 12.95Buffalo, N.Y................................ 11.62 2.33 13.95 Stamford, Conn.......................... 10.00 1.80 11.80
See footnotes at end of table.
176Digitized for FRASER http://fraser.stlouisfed.org/ Federal Reserve Bank of St. Louis

(Average union hourly wage rates and employer contributions1 in the building trades, July 1, 1977)
Table A-5. Average wage rates and employer contributions for six benefits, journeymen and laborers: Selected cities bypopulation group—Continued
City by population groupAverage rate per
hour
Average employer
contribution per hour1
Average rate plus employer
contribution per hour1
City by population groupAverage rate per
hour
Average employer
contribution per hour1
Average rate plus employer
contribution per hour1
Helpers and laborers
All cities................................... $8.03 $1.77 $9.79 Cincinnati, Ohio.......................... $9.98 $1.10 $11.08Fort Worth, Tex ......................... 6.44 .68 7.12
Population group I Honolulu, Hawaii......................... 7.62 2.09 9.71(1,000,000 and over) ..................... 8.56 2.23 10.79 Long Beach, Calif....................... 8.08 3.33 11.41Chicago, III.................................. 8.59 1.65 10.24 Louisville, K y............................. 7.49 .82 8.32Detroit, Mich............................... 9.00 2.42 11.42 Miami, Fla.................................. 6.80 1.40 8.20Houston, Tex.............................. 7.63 .71 8.34 Minneapolis-St. Paul, Minn........... 8.41 1.35 9.76Los Angeles, Calif........................ 7.89 3.34 11.22 Nashville-Davidson, Tenn............ 6.20 .59 6.79New York, N.Y ............................ 8.89 2.70 11.60 Newark, N.J............................... 8.33 1.62 9.96Philadelphia, Pa........................... 8.34 1.61 9.95 Norfolk, V a................................ 5.37 .38 5.75
Omaha, Nebr.............................. 7.80 1.15 8.95Population group II Portland, Oreg............................ 8.39 2.43 10.82(500,000 to 1,000,000) .................. 8.15 1.67 9.82 Rochester, N.Y.......................... 8.02 2.61 10.63Baltimore, M d.............................. 7.09 .82 7.91 Sacramento, Calif....................... 8.58 3.94 12.53Boston, Mass.............................. 7.90 1.34 9.24 Toledo, Ohio .............................. 10.44 1.55 11.99Cleveland, Ohio........................... 10.00 2.42 12.43 Wichita, Kans............................. 7.10 .75 7.85Columbus, Ohio........................... 8.02 1.34 9.36Dallas, Tex.................................. 6.52 .60 7.12 Population group IVDenver, Colo............................... 7.11 1.08 8.19 (100,000 to 250,000).................... 7.54 1.49 9.03Indianapolis Ind.......................... 7.69 1.04 8.73 Albany, N.Y ............................... 8.57 1.77 10.34Jacksonville, Fla.......................... 5.36 .45 5.81 Chattanooga, Tenn..................... 6.23 .46 6.69Kansas City, Mo.......................... 8.16 1.34 9.50 Corpus Christi, Tex..................... 5.23 .39 5.63Memphis, Tenn ........................... 6.49 .58 7.07 Flint, Mich.................................. 7.86 1.58 9.44Milwaukee, Wis ........................... 9.08 2.04 11.12 Fremont, Calif ............................ 8.72 3.64 12.36New Orleans, La... „..................... 7.25 .46 7.71 Fresno, Calif.............................. 8.47 3.73 12.20Phoenix, Ariz............................... 8.34 1.91 10.26 Grand Rapids, Mich .................... 6.49 1.42 7.91Pittsburgh, Pa.............................. 8.73 1.67 10.41 Hammond, Ind ........................... 8.29 1.09 9.38St. Louis, M o.............................. 9.05 1.74 10.79 Huntsville, A la............................ 4.87 .65 5.52San Antonio, Tex......................... 5.37 .64 6.01 New Bedford, Mass..................... 8.10 1.30 9.40San Diego, Calif.......................... 8.15 3.18 11.33 New Haven, Conn...................... 7.75 1.09 8.84San Francisco, Calif ......................... 8.91 3.53 12.44 Providence, R.l .......................... 7.80 1.35 9.15Seattle, Wash.............................. 8.70 1.95 10.66 Riverside, Calif........................... 8.51 3.61 12.12Washington, D .C ............................... 8.31 1.04 9.35 Rockford, III............................... 9.12 .95 10.08
St. Petersburg, Fla ..................... 6.34 1.04 7.38Population group III Salt Lake City, Utah.................... 7.70 .76 8.46(250,000 to 500,000) ..................... 7.83 1.73 9.57 Santa Ana, Calif......................... 7.90 3.37 11.27Akron, Ohio................................. 9.50 1.21 10.71 Scranton, Pa.............................. 8.96 .91 9.87Atlanta, Ga.................................. 6.03 .51 6.54 Spokane, Wash.......................... 7.82 2.01 9.83Buffalo, N.Y ................................ 8.29 2.99 11.28 Stamford, Conn.......................... 7.79 1.05 8.84
1 Includes employer contributions to insurance (life insurance, hospitalization, medical, surgical, and other similar types of health and welfare programs); pension funds; vacation payments; supplemental unemployment benefits; savings funds; and paid holidays, as provided in labor- management contracts. Averages presented are for a straight-time hour; in actual practice, however, some employer payments are calculated for total hours worked or gross payroll.
Average refers to all workers in the classification, including those for whom employer contributions were not specified in their particular
contracts. Such situations were included in the average computation as zero contributions.
Some contracts also provide payments to other funds, such as for education and promotion. Information on payments to these funds was not included in these tabulations.
NOTE: Because of rounding, sums of individual items may not equal totals.
177Digitized for FRASER http://fraser.stlouisfed.org/ Federal Reserve Bank of St. Louis

Table A-6. Average wage rates and employer contributions for six benefits, journeymen and laborers: Selected cities byregion
(Average union hourly wage rates and employer contributions1 in the building trades by city, July 1, 1977)
City by region2
Journeymen
All cities...........................
New England........................Boston, Mass. (II)................New Bedford, Mass. (IV).......New Haven, Conn. (IV)........Providence, R.l. (IV) ............Stamford, Conn. (IV)............
Middle Atlantic ......................Albany, N.V. (IV) .................Buffalo, N.Y. (Ill) .................New York, N.Y. (I)................Newark, N.J. (Ill).................Philadelphia, Pa. (I)..............Pittsburgh, Pa. (II) ...............Rochester, N.Y. (Ill).............Scranton, Pa. (IV) ...............
Border States........................Baltimore, Md. (II) ................Louisville, Ky. (Ill)................Norfolk, Va. (Ill)...................Washington, D.C. (II)...........
Southeast.............................Atlanta, Ga. (Ill)...................Chattanooga, Tenn. (IV).......Huntsville, Ala. (IV) ..............Jacksonville, Fla. (II)............Memphis, Tenn. (II)..............Miami, Fla. (Ill) ....................Nashville-Davidson, Tenn. (Ill) St. Petersburg, Fla. (IV) .......
Southwest.............................Corpus Christi, Tex. (IV).......Dallas, Tex. (II)....................Fort Worth, Tex. (Ill)............Houston, Tex. (I) .................New Orleans, La. (II) ...........San Antonio, Tex. (II) ...........
See footnotes at end of table.
Average rate per
hour
Average employer
contribution per hour1
Average rate plus employer
contribution per hour1
City by region2Average rate per
hour
Average employer
contribution per hour1
Average rate plus employer
contribution per hour1
$10.44 $2.37 $12.81 Great Lakes................................. $10.78 $2.38 $13.16Akron, Ohio (III) ......................... 10.50 2.10 12.60
10.02 2.08 12.10 Chicago, III. (I)............................ 11.08 1.97 13.0410.46 2.41 12.87 Cincinnati, Ohio (III).................... 10.99 1.97 12.979.63 2.07 11.70 Cleveland, Ohio (II) .................... 11.23 2.84 14.079.88 1.70 11.58 Columbus, Ohio (II).................... 10.58 1.72 12.299.53 2.07 11.60 Detroit, Mich. (I)......................... 10.90 3.59 14.49
10.00 1.80 11.80 Flint, Mich. (IV)........................... 10.14 2.63 12.77Grand Rapids, Mich. (IV)............. 9.52 2.04 11.56
10.80 2.89 13.69 Hammond, Ind. (IV).................... 11.13 2.04 13.1710.01 1.90 11.91 Indianapolis, Ind. (II).................... 10.80 1.76 12.5611.62 2.33 13.95 Milwaukee, Wis. (II).................... 10.50 2.47 12.9711.05 3.71 14.77 Minneapolis-St. Paul, Minn. (Ill).... 10.18 2.01 12.1910.97 2.49 13.46 Rockford, III. (IV)......................... 10.82 1.52 12.3410.77 2.91 13.68 Toledo, Ohio (III)......................... 11.67 2.39 14.0710.50 2.42 12.9110.73 2.17 12.90 Middle West................................. 10.28 1.88 12.1610.15 1.94 12.08 Kansas City, Mo. (II).................... 10.55 1.90 12.45
Omaha, Nebr. (Ill)....................... 10.10 1.70 11.809.92 1.54 11.46 St. Louis, Mo. (II)........................ 10.34 2.27 12.619.82 1.78 11.60 Wichita, Kans. (Ill)...................... 9.99 1.21 11.20
10.11 1.74 11.868.94 1.00 9.94 Mountain...................................... 10.15 1.97 12.13
10.53 1.65 12.19 Denver, Colo. (II)........................ 10.07 2.24 12.31Phoenix, Ariz. (II) ........................ 10.58 2.29 12.87
9.07 1.16 10.23 Salt Lake City, Utah (IV).............. 9.95 1.58 11.539.15 1.51 10.668.95 .99 9.94 Pacific......................................... 11.02 3.42 14.449.26 .80 10.06 Fremont, Calif. (IV)..................... 11.83 3.90 15.748.89 1.59 10.47 Fresno, Calif. (IV) ....................... 11.06 3.29 14.349.79 1.20 10.99 Honolulu, Hawaii (III)................... 9.74 3.68 13.439.15 1.46 10.61 Long Beach, Calif. (Ill)................ 11.19 3.92 15.119.05 .85 9.90 Los Angeles, Calif. (I) ................. 10.74 3.74 14.488.67 1.15 9.82 Portland, Oreg. (Ill)..................... 11.11 2.49 13.59
Riverside, Calif. (IV)..................... 11.20 3.80 15.009.34 1.17 10.51 Sacramento, Calif. (Ill)................ 11.62 3.78 15.398.66 1.02 9.68 San Diego, Calif. (II).................... 11.43 3.40 14.839.74 1.15 10.88 San Francisco, Calif. (II).............. 11.97 4.17 . 16.149.75 1.02 10.77 Santa Ana, Calif. (IV).................. 10.73 3.58 14.31
10.10 1.53 11.63 Seattle, Wash. (II)....................... 11.28 2.33 13.619.72 1.17 10.90 Spokane, Wash. (IV)................... 10.94 2.00 12.958.87 1.45 10.32
178
Digitized for FRASER http://fraser.stlouisfed.org/ Federal Reserve Bank of St. Louis

(Average union hourly wage rates and employer contributions1 in the building trades by city, July 1, 1977)
Table A-6. Average wage rates and employer contributions for six benefits, journeymen and laborers: Selected cities byregion—Continued
City by region2Average rate per
hour
Average employer
contribution per hour1
Average rate plus employer
contribution per hour1
City by region2Average rate per
hour
Average employer
contribution per hour1
Average rate plus employer
contribution per hour1
Helpers and laborers
All cities................................... $8.03 $1.77 $9.79 Great Lakes....................... ......... $8.73 $1.67 $10.39Akron, Ohio (III) ......................... 9.50 1.21 10.71
New England................................. 7.89 1.25 9.14 Chicago, III. (I)............................ 8.59 1.65 10.24Boston, Mass. (II)........................ 7.90 1.34 9.24 Cincinnati, Ohio (III).................... 9.98 1.10 11.08New Bedford, Mass. (IV)............... 8.10 1.30 9.40 Cleveland, Ohio (II) ..................... 10.00 2.42 12.43New Haven, Conn. (IV) ................ 7.75 1.09 8.84 Columbus, Ohio (II)..................... 8.02 1.34 9.36Providence, R.l. (IV) .................... 7.80 1.35 9.15 Detroit, Mich. (I)......................... 9.00 2.42 11.42Stamford, Conn. (IV).................... 7.79 1.05 8.84 Flint, Mich. (IV)........................... 7.86 1.58 9.44
Grand Rapids, Mich. (IV)............. 6.49 1.42 7.91Middle Atlantic .............................. 8.62 2.22 10.84 Hammond, Ind. (IV)..................... 8.29 1.09 9.38
Albany, N.Y. (IV) ......................... 8.57 1.77 10.34 Indianapolis, Ind. (II).................... 7.69 1.04 8.73Buffalo, N.Y. (Ill) ......................... 8.29 2.99 11.28 Milwaukee, Wis. (II)..................... 9.08 2.04 11.12New York, N.Y. (I)........................ 8.89 2.70 11.60 Minneapolis-St. Paul, Minn. (Ill).... 8.41 1.35 9.76Newark, N.J. (Ill)......................... 8.33 1.62 9.96 Rockford, III. (IV)......................... 9.12 .95 10.08Philadelphia, Pa. (I)...................... 8.34 1.61 9.95 Toledo, Ohio (III)......................... 10.44 1.55 11.99Pittsburgh, Pa. (II)........................ 8.73 1.67 10.41Rochester, N.Y. (Ill)..................... 8.02 2.61 10.63 Middle West................................. 8.16 1.31 9.48Scranton, Pa. (IV) ........................ 8.96 .91 9.87 Kansas City, Mo. (II).................... 8.16 1.34 9.50
Omaha, Nebr. (Ill)....................... 7.80 1.15 8.95Border States................................ 7.16 .79 7.95 St. Louis, Mo. (II)........................ 9.05 1.74 10.79
Baltimore, Md. (II)........................ 7.09 .82 7.91 Wichita, Kans. (Ill)...................... 7.10 .75 7.85Louisville, Ky. (Ill)........................ 7.49 .82 8.32Norfolk, Va. (Ill)........................... 5.37 .38 5.75 Mountain...................................... 7.75 1.21 8.96Washington, D.C. (II).................... 8.31 1.04 9.35 Denver, Colo. (II)........................ 7.11 1.08 8.19
Phoenix, Ariz. (II) ........................ 8.34 1.91 10.26Southeast...................................... 6.13 .65 6.77 Salt Lake City, Utah (IV).............. 7.70 .76 8.46
Atlanta, Ga. (Ill)........................... 6.03 .51 6.54Chattanooga, Tenn. (IV)................ 6.23 .46 6.69 Pacific......................................... 8.19 3.11 11.31Huntsville, Ala. (IV)...................... 4.87 .65 5.52 Fremont, Calif. (IV)..................... 8.72 3.64 12.36Jacksonville Fla (II) . ........... 5.36 .45 5.81 Fresno, Calif. (IV) ....................... 8.47 3.73 12.20Memphis, Tenn. (II)...................... 6.49 .58 7.07 Honolulu, Hawaii (III)................... 7.62 2.09 9.71Miami, Fla. (Ill) ............................ 6.80 1.40 8.20 Long Beach, Calif. (Ill)................ 8.08 3.33 11.41Nashville-Davidson, Tenn. (Ill)...... 6.20 .59 6.79 Los Angeles, Calif. (I) ................. 7.89 3.34 11.22St Petersburg, Fla. (IV) ........ 6.34 1.04 7.38 Portland, Oreg. (Ill)..................... 8.39 2.43 10.82
Riverside, Calif. (IV).................... 8.51 3.61 12.12Southwest..................................... 6.46 .58 7.04 Sacramento, Calif. (Ill)................ 8.58 3.94 12.53
Corpus Christi, Tex. (IV)............... 5.23 .39 5.63 San Diego, Calif. (II).................... 8.15 3.18 11.33Dallas, Tex. (II)............................ 6.52 .60 7.12 San Francisco, Calif. (II).............. 8.91 3.53 12.44Fort Worth, Tex. (Ill).................... 6.44 .68 7.12 Santa Ana, Calif. (IV).................. 7.90 3.37 11.27Houston, Tex. (I)......................... 7.63 .71 8.34 Seattle, Wash. (II)....................... 8.70 1.95 10.66New Orleans, La. (II).................... 7.25 .46 7.71 Spokane, Wash. (IV)................... 7.82 2.01 9.83San Antonio, Tex. (II)................... 5.37 .64 6.01
1 Includes employer contributions to insurance (life insurance, hospitalization, medical, surgical, and other similar types of health and welfare programs); pension funds; vacation payments; supplemental unemployment benefits; savings funds; and paid holidays, as provided in labor- management contracts. Averages presented are for a straight-time hour; in actual practice, however, some employer payments are calculated for total hours worked or gross payroll.
Average refers to all workers in the classification, including those for whom employer contributions were not specified in their particular contracts. Such situations were included in the average computation as zero contributions.
Some contracts also provide payments to other funds, such as for education and promotion. Information on payments to these funds was not included in these tabulations.
2 See table A-2, footnote 2, for definitions of regions. Population size is shown in parentheses as follows: Group I = 1,000,000 or more; Group II = 500,000 to 1,000,000; Group III = 250,000 to 500,000; and Group IV = 100,000 to 250,000.
NOTE: Because of rounding, sums of individual items may not equal totals.
179Digitized for FRASER http://fraser.stlouisfed.org/ Federal Reserve Bank of St. Louis

Appendix B. Scope and M ethod of Survey
Union wage rates and hours reported in this bulletin were agreed on through collective bargaining between trade unions and employers and are defined as (1) the basic (minimum) rates (excluding holiday, vacation, or other benefit payments made regularly or credited to the worker each pay period), and (2) the maximum number of weekly hours at straight-time rates. Wage rates exceeding the negotiated minimum, which may be paid for special qualifications or other reasons, are excluded. Thus, rates shown do not represent total hourly earnings of building trades workers.
Information presented for the building trades is based on union rates in effect on July 1, 1977, covering approximately 597,000 journeymen and 127,000 helpers and laborers in the 66 cities surveyed. Data were obtained from local union officials by mail questionnaire; in some instances, Bureau economists visited local union officials to obtain the desired information.
The survey was designed to reflect union wage rates in building construction in all cities of 100,000 inhabitants or more (1970 Census of Population). All cities that had 500,000 inhabitants or more were studied separately, as were most cities with 250,000 to 500,000 inhabitants. Data for some cities were weighted to com
pensate for cities not surveyed. In order to provide appropriate regional representation, each region was considered separately when city weights were assigned.
Average wage rates, designed to show current levels, were based on building trades wage rates in each city as of July 1, 1977. The wage rates were weighted by the number of union members at the rate in the area. These averages were not designed for precise year-to-year comparisons because of fluctuations in membership in the job classifications studied. Average cents-per-hour and percent changes from July 1, 1976, to July 1, 1977, however, were based on comparable quotations for the various job classifications in both periods, weighted by the membership reported for the current (1977) survey. The index series, designed for trend purposes, was constructed similarly.
Wage and hour information is presented in table 20 for workers in street and highway and other heavy construction (including railroads, tunnels, subways, elevated highways, viaducts, dams, bridges, reservoirs, hydroelectric projects, pipelines, transmission and telephone lines, radio towers, etc.). These rates were not used to calculate averages or indexes in this publication.
180
Digitized for FRASER http://fraser.stlouisfed.org/ Federal Reserve Bank of St. Louis

Keep Abreast of Employment, Wages, Prices, Productivity, with
BLS PeriodicalsSubscriptions to BLS periodicals are available from Superintendent of Documents, Government Printing Office, Washington, D. C. 20402. For subscriptions to foreign countries, add 25 percent to all prices. Make all checks payable to the Superintendent of Documents.
Monthly Labor Review. . .the oldest and most authoritative Government research journal in economics and social sciences. Regular features include reviews of books, developments in industrial relations, labor cases.$16 a year.
Current Wage Developments June 1978
Current Wage Developments. . . reports on specific wage and benefit changes from collective bargaining agreements. Includes data on strikes or lockouts, major agreements expiring, and statistics on compensation changes.$12 a year.
Employment and Earnings June 1978US Department of Labor Bureau of Labor Statistics Vol 25No 3
t977 annual averages tor all
Employment and Earnings. . . gives current employment and earnings statistics for the Nation as a whole, for individual States, and for more than 200 areas. Included are household and establishment data, seasonally and not seasonally adjusted.$18 a year.
Occupational Outlook Quarterly.. . helps students and guidance counselors learn about new occupations, training opportunities, salary trends, and career counseling programs. Written in nontechnical language and illustrated in color.$4, four issues.
CPI Detailed Report June 1978US Department of Labor Bureau of Labor Statistics
CPI Detailed Report. . .is the most comprehensive report on monthly consumer price indexes and rates of change. Includes data on commodity and service groups for 23 cities.$12 a year.
and Productivity
August 1978
Chartbook on Prices, Wages, and Productivity. . . reports trends in key economic indicators and makes comparisons in both tabular and graphic form month-to-month and within historic context.$11 a year.
Producer Prices and Price Indexes Data for June 1978
U S Department of Labor
Producer Prices and Price Indexes. . . includes price movements of industrial commodities and farm products, processed foods and feeds. Tables and charts give greater detail than available in other published material.$16 a year.
J f r U. S. GOVERNMENT P R I N T I N G O F F I C E : 1 9 7 9 — 2 8 1 - 4 1 2 / 6
Digitized for FRASER http://fraser.stlouisfed.org/ Federal Reserve Bank of St. Louis

Digitized for FRASER http://fraser.stlouisfed.org/ Federal Reserve Bank of St. Louis

Bureau of Labor Statistics Regional Offices
Region I1603 JFK Federal Building Government Center Boston. Mass. 02203 Phone: (617) 223-6761
Region IISuit-: 3400 1515 Broadway New York. N Y 10036 Phone: (212)399-5405
Region III3535 Market Street P O Box 13309 Philadelphia, Pa 19101 Phone: (215) 596-1154
Region IV1371 Peachtree Street, NE Atlanta, Ga 30309 Phone: (404) 881-4418
Region V9th FloorFederal Office Building 230 S Dearborn Street Chicago, III 60604 Phone: (312) 353-1880
Region VISecond Floor555 Griffin Square Building Dallas, Tex. 75202 Phone: (214) 749-3516
Regions VII and VIII*911 Walnut Street Kansas City, Mo. 64106 Phone: (816) 374-2481
Regions IX and X**450 Golden Gate Avenue Box 36017San Francisco, Calif. 94102 Phone: (415) 556-4678
* Regions VII and VIII are serviced by Kansas City
"Regions IX and X are serviced by San Francisco
Digitized for FRASER http://fraser.stlouisfed.org/ Federal Reserve Bank of St. Louis


![H20youryou[2] · 2020. 9. 1. · 65 pdf pdf xml xsd jpgis pdf ( ) pdf ( ) txt pdf jmp2.0 pdf xml xsd jpgis pdf ( ) pdf pdf ( ) pdf ( ) txt pdf pdf jmp2.0 jmp2.0 pdf xml xsd](https://static.fdocuments.net/doc/165x107/60af39aebf2201127e590ef7/h20youryou2-2020-9-1-65-pdf-pdf-xml-xsd-jpgis-pdf-pdf-txt-pdf-jmp20.jpg)


