
Resumen PDF Resumen PDF Resumen PDF Resumen PDF Resumen PDF Resumen PDF Resumen PDF

7/21/2019 bls_1551_1967.pdf
http://slidepdf.com/reader/full/bls15511967pdf 1/82
I N D U S T R Y W A D E S U R V E Y
WOOL TEXTILES
Part I: Wool Yarn and Broadwoven
Fabric Mills
Part II: Dyeing and Finishing Plantsi
Part III: Scouring and Combing Plants
NOVEMBER 1966
Bulletin No. 1551
UNITED STATES DEPARTMENT OF LABOR /''fsrv
BUREAU OF LABOR STATISTICS
7/21/2019 bls_1551_1967.pdf
http://slidepdf.com/reader/full/bls15511967pdf 2/82
INDUSTRY WAGE SURVEY
WOOL TEXTILES
Part I: W ool Yarn and Broad woven
Fabric Mills
Part II: Dyeing and Finishing Plants
Part III: Scouring and Combing Plants
NOVEMBER 1966
B u l le t in N o . 1 5 5 1
June 1967
UNITED STATES DEPARTMENT OF LABOR
W. Willard Wirtz, Secretary
BUREAU OF LABOR STATISTICS
Arthur M. Ross, Commissioner
For sale by the Superintendent of Documents, U.S. Government Printing Office, Washington, D.C. 2 040 2 - Price 45 cents

7/21/2019 bls_1551_1967.pdf
http://slidepdf.com/reader/full/bls15511967pdf 3/82
7/21/2019 bls_1551_1967.pdf
http://slidepdf.com/reader/full/bls15511967pdf 4/82
Preface
This bulletin summarizes the results of a Bureau of Labor Statistics survey of wages and supplementary benefits in the wool textiles industry in November 1966.
Part I provides information on national, regional, State, and area data for wool yarn and broadwoven fabric m ills . An advance release, providing national and regional information, was issued in February 1967. Separate releases were also issued for the Southeast region and for the following States and areas: Maine, Massachusetts, New
Hampshire, North Carolina—Virginia, Rhode Island, and Philadelphia—Camden, Pa.—N .J . Copies of these releases are available from the Bureau of Labor Statistics, Washington, D .C ., 20212, or any of its regional offices.
Part II provides information for wool dyeing and finishing and shrinking and sponging plants.
Part III provides information for scouring and combing plants.
The study was conducted in the Bureau1s Division
of Occupational Pay, Toivo P. Kanninen, Chief, under the general direction of L. R. Linsenmayer, Assistant Commissioner, Office of Wages and Industrial Relations. The analysis was prepared by Edward J. Caramela, under the immediate supervision of L. Earl Lewis. Field work for the survey was directed by Assistant Regional Directors for Wages and Industrial Relations.
Other reports available from the Bureau*s program
of industry wage studies, as well as the addresses of the Bureaus six regional offices, are listed at the end of this bulletin.
ii i

7/21/2019 bls_1551_1967.pdf
http://slidepdf.com/reader/full/bls15511967pdf 5/82
Contents
Part I. Wool yarn and broadwoven fabric m il ls --------------------------------------------------------------------- 1
Summary-------------------------------------------------------------------------------------------------------------- 1Industry characteristics,------------------------------------------------------------------------------------ 1
Employment trends -------------------------------------------------------------------------------------- 1Location---------------------------------------------------------------------------------------------------------- 2Type of m ill--------------------------------------------------------------------------------------------------- 2Unionization -------------------------------------------------------------------------------------------------- 2Method of wage payment ----------------------------------------------------------------------------- 3Sex------------------------------------------------------------------------------------------------------------------- 3
Average hourly earnings ----------------------------------------------------------------------------------- 3Occupational earnin gs---------------------------------------------------------------------------------------- 4Establishment practices and supplementary wage
provisions -------------------------------------------------------------------------------------------------------- 5Scheduled weekly hours ------------------------------------------------------------------------------- 5Shift provisions and practices --------------------------------------------------------------------- 5
Paid holidays ----------------------------------------------------------------------------------------------— 6Paid vaca tions----------------------------------------------------------------------------------------------- 6Health, insurance, and retirement pla ns--------------------------------------------------- 6Other selected benefits -------------------------------------------------------------------------------- 6
Tables:
Average hourly earnings:
1. By selected characteristics ----------------------------------------------------------------- 7
Earnings distribution:
2. All mills by type of y a rn ----------------------------------------------------------------------- 83. Al l mills by type of m ill ------------------------------------------------------------------------ 94. Weaving and integrated broadwoven fabric mills by
type of fabric ---------------------------------------------------------------------------------------- 105. Yarn mills by type of yarn ------------------------------------------------------------------- 11
Occupational averages:
6. All mills -------------------------------------- 12
8. Weaving mills ----------------------------------------------------------------------------------------- 169. Integrated m ills --------------------------------------------------------------------------------------- 17
10. Weaving and integrated millsby type of fabric ------------------------------------ 1811. All mills by size of community ------------------------------------------------------------ 20
12. All mills by size of mill ----------------------------------------------------------------------- 2213. All mills by method of wagepayment --------------------------------------------------- 23
Page
iv
7/21/2019 bls_1551_1967.pdf
http://slidepdf.com/reader/full/bls15511967pdf 6/82
Contents— Continued
Tables— Continued
Occupational earnings:
14. Maine ----------------------------------------------------------------------------------------------------- 2415. Massachusetts -------------------------------------------------------------------------------------- 2516. New Ham pshire------------------------------------------------------------------------------------- 2717. North Carolina—Virgin ia---------------------------------------------------------------------- 2818. Philadelphia—Camden, P a.—N. J . -------------------------------------------------------- 2919. Rhode Island ----------------------------------------------------------------------------------------- 30
Establishment practices and supplementary wage provisions:
20. Method of wage pay men t---------------------------------------------------------------------- 3221. Scheduled weekly hours ----------------------------------------------------------------------- 3222. Shift differential provisions --------------------------------------------------------------- 3323. Shift differential practices ------------------------------------------------------------------ 3424. Paid holiday s----------------------------------------------------------------------------------------- 35
25. Paid vacations--------------------------------------------------------------------------------------
3626. Health, insurance, and retirement plans ------------------------------------------ 3827. Other selected benefits ----------------------------------------------------------------------- 40
Part II. Dyeing and finishing plants-------------------------------------------------------------------------------- 41
Summary-------------------------------------------------------------------------------------------------------------- 41Industry chara cter istics ------------------------------------------------------------------------------------ 41
Average hourly earnings ----------------------------------------------------------------------------------- 42Occupational earnings---------------------------------------------------------------------------------------- 42Establishment practices and supplementary wage
provisions -------------------------------------------------------------------------------------------------------- 42Scheduled weekly hours and shift practices----------------------------------------------- 42Paid holidays ------------------------------------------------------------------------------------------------- 42
Paid vacations ---------------------------------------------------------------------------------------------- 43Health, insurance, and retirement plans ------------------------------------------------- 43Other selected benefits -------------------------------------------------------------------------------- 43
Tables:
28. Earnings distribution -------------------------------------------------------------------------------- 4429. Earnings distribution: By type of plant -------------------------------------------------- 4530. Occupational earnings ------------------------------------------------------------------------------- 4631. Method of wage payment --------------------------------------------------------------------------- 4632. Scheduled weekly hours ---------------------------------------------------------------------------- 4633. Shift differential provisions --------------------------------------------------------------------- 4734. Shift differential practices------------------------------------------------------------------------ 4735. Paid holiday s----------- 4836. Paid vacations -------------------------------------------------------------------------------------------- 49
37. Health, insurance, and retirement plans ----------------------------------------------- 5038. Other selected benefits ---------------------------------------------------------------------------- 51
Page

7/21/2019 bls_1551_1967.pdf
http://slidepdf.com/reader/full/bls15511967pdf 7/82
Con tents— Continued
Part III. Scouring and combing pl an ts ------------------------------------------------------------------------------- 52
Summary —-
---------------------------------------------------------------------------------------------------------- 52Industry characteristics------------------------------------------------------------------------------------- 52
Average hourly earnings ------------------------------------------------------------------------------------ 53Occupational earn ings ----------------------------------------------------------------------------------------- 53Establishment practices and supplementary wage pr ovisio ns --------------------- 53
Scheduled weekly hours---------------------------------------------------------------------------------- 53Shift provisions and practices ---------------------------------------------------------------------- 53Paid holidays -------------------------------------------------------------------------------------------------- 54Paid vacations ------------------------------------------------------------------------------------------------ 54Health, insurance, and retirement pla ns---------------------------------------------------- 54Other selected benefits --------------------------------------------------------------------------------- 54
Page
Tables:
39. Earnings distribution ---------------------------------------------------------------------------------- 5540. Occupational earnings -------------------------------------------------------------------------------- 5641. Method of wage payment ---------------------------------------------------------------------------- 5742. Scheduled weekly hours ------------------------------------------------------------------------------ 5743. Shift differential provisions ----------------------------------------------------------------------- 5844. Shift differential practices-------------------------------------------------------------------------- 5845. Paid holida ys------------------------------------------------------------------------------------------------ 5946. Paid vacations ---------------------------------------------------------------------------------------------- 5947. Health, insurance, andretirement plans -------------------------------------------------- 6048.. Other selected benefits ------------------------------------------------------------------------------- 61
Appendixes:
A. Scope and method of survey------------------------------------------------------------------------ 63B. Occupational descriptions ------------------------------------------------------------------------- - 67
vi
7/21/2019 bls_1551_1967.pdf
http://slidepdf.com/reader/full/bls15511967pdf 8/82
Industry Wage Survey----
Wool Textiles, November 1966
Part I. W oo l Yarn and Broadwoven Fabric Mills
Summary
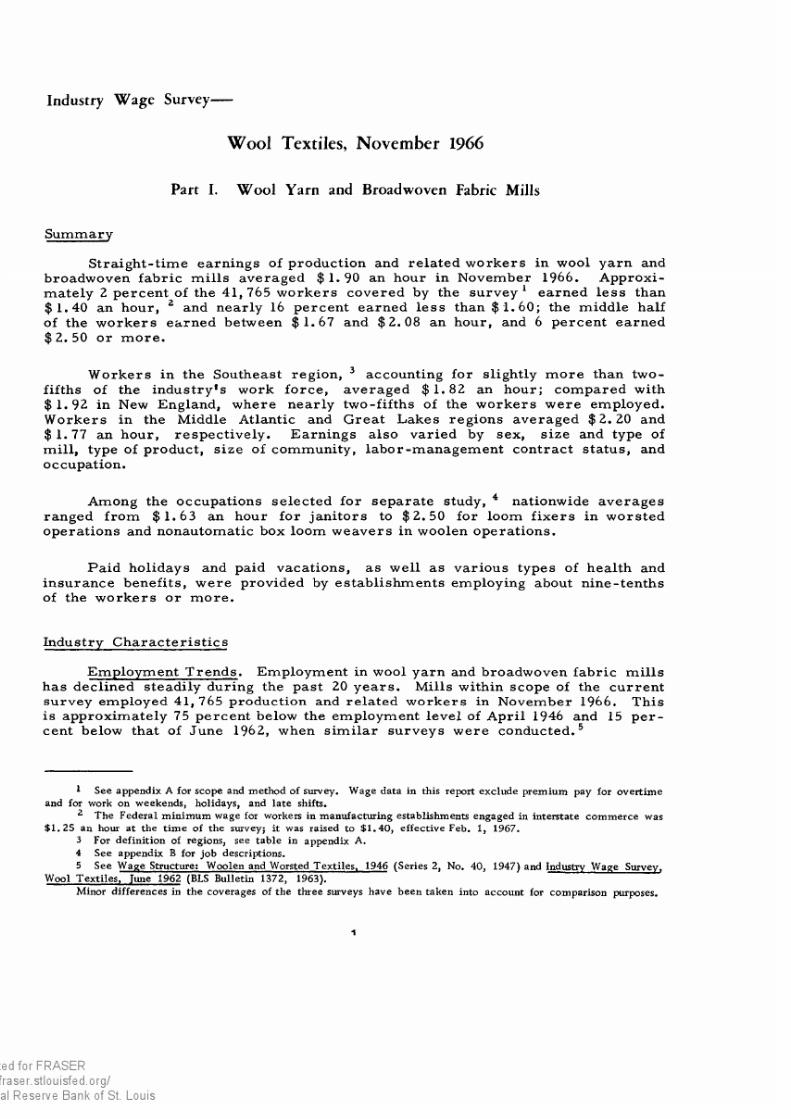
Straight-time earnings of production and related workers in wool yarn and broadwoven fabric m ills averaged $ 1. 90 an hour in November 1966. Approximately 2 percent of the 41, 765 workers covered by the survey 1 earned less than $1.40 an hour, 12 and nearly 16 percent earned less than $ 1 .6 0 ; the middle half of the workers earned between $1.67 and $2.08 an hour, and 6 percent earned $ 2. 50 or more.
Workers in the Southeast region, 3 accounting for slightly more than two- fifths of the industry^ work force, averaged $1 .8 2 an hour; compared with $1 .9 2 in New England, where nearly two-fifths of the workers were employed.
Workers in the Middle Atlantic and Great Lakes regions averaged $2.20 and $ 1.77 an hour, respectively. Earnings also varied by sex, size and type of mill, type of product, size of community, labor-management contract status, and occupation.
Among the occupations selected for separate study, 4 nationwide averages ranged from $1 .6 3 an hour for janitors to $2 .5 0 for loom fixers in worsted operations and nonautomatic box loom weavers in woolen operations.
Paid holidays and paid vacations, as well as various types of health and insurance benefits, were provided by establishments employing about nine-tenths of the workers or more.
Industry Characteristics
Employment Trends. Employment in wool yarn and broadwoven fabric mills has declined steadily during the past 20 years. Mills within scope of the current survey employed 41, 765 production and related workers in November 1966. This is approximately 75 percent below the employment level of April 1946 and 15 percent below that of June 1962, when similar surveys were conducted.5
1 See appendix A for scope and method of survey. Wage data in this report exclude premium pay for ove rtimeand for work on weekends, holidays , and late shifts.
2 The Federal minimum wage for workers in manufacturing establishments engaged in interstate com me rce was
$1 .25 an hour at the time of the surveyj it was raised to $1.4 0, effe ctive Feb. 1, 1967.3 For definition of regions, see table in appendix A.
4 See appendix B for job descriptions.
5 See Wage Structure; Wo olen and Worsted Tex tiles . 1946 (Series 2, No. 40, 1947) and Industry Wage Survey.Wool Text iles , June 1962 (BLS Bulletin 1372, 1963).
Minor differences in the coverages of the three surveys have been taken into accou nt for comparison purposes.
1
7/21/2019 bls_1551_1967.pdf
http://slidepdf.com/reader/full/bls15511967pdf 9/82
2
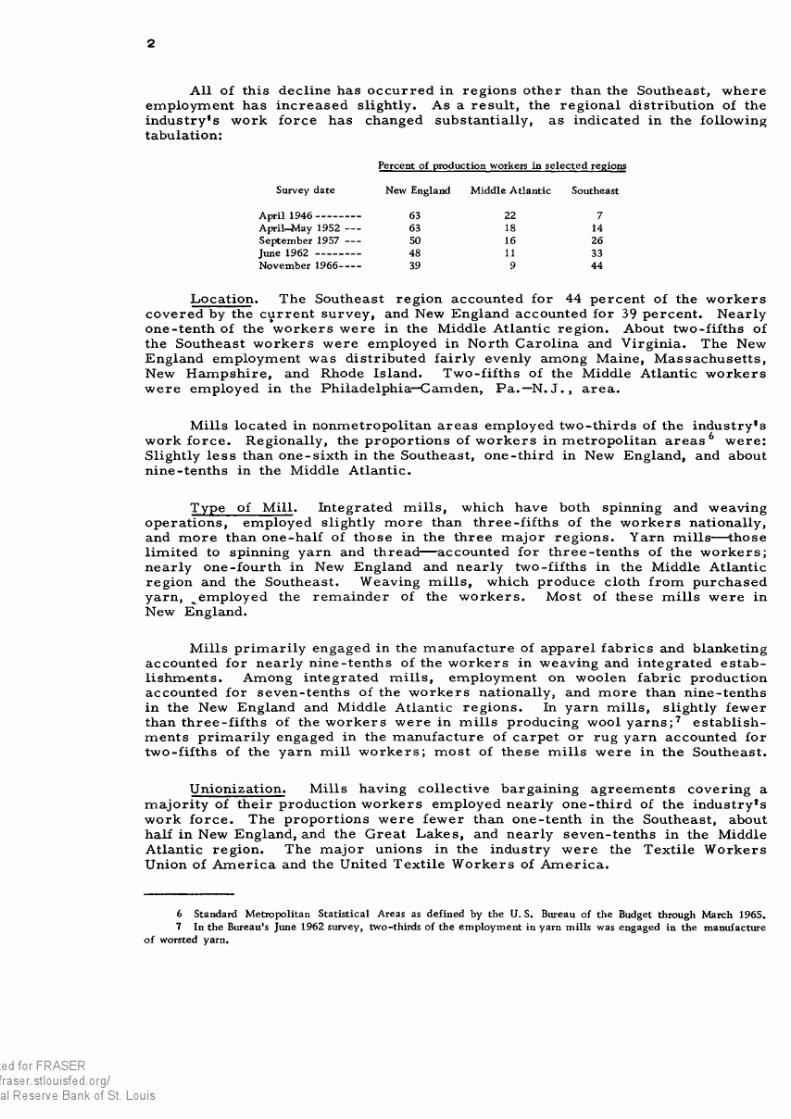
All of this decline has occurred in regions other than the Southeast, where employment has increased slightly. As a result, the regional distribution of the industry*s work force has changed substantially, as indicated in the following tabulation:
Percent of production workers in selected regions
Survey date New England Middle Atlantic Southeast
April 19 46 ------------- 63 22 7
April—May 1952 ---- 63 18 14
September 1957 ---- 50 16 26
June 1962 ------------- 48 11 33
November 1966------ 39 9 44
Location. The Southeast region accounted for 44 percent of the workers covered by the current survey, and New England accounted for 39 percent. Nearly one-tenth of the workers were in the Middle Atlantic region. About two-fifths of the Southeast workers were employed in North Carolina and Virginia. The New England employment was distributed fairly evenly among Maine, Massachusetts, New Hampshire, and Rhode Island. Two-fifths of the Middle Atlantic workers were employed in the Philadelphia—Camden, Pa.—N .J ., area.
Mills located in nonmetropolitan areas employed two-thirds of the industry*s workforce. Regionally, the proportions of workers in metropolitan areas 6 were: Slightly less than one-sixth in the Southeast, one-third in New England, and about nine-tenths in the Middle Atlantic.
Type of Mill. Integrated mills , which have both spinning and weaving operations, employed slightly more than three-fifths of the workers nationally, and more than one-half of those in the three major regions. Yarn mills— those limited to spinning yarn and thread— accounted for three-tenths of the workers; nearly one-fourth in New England and nearly two-fifths in the Middle Atlantic region and the Southeast. Weaving m ills , which produce cloth from purchased yarn, ^employed the remainder of the workers. Most of these mills were in New England.
Mills primarily engaged in the manufacture of apparel fabrics and blanketing accounted for nearly nine-tenths of the workers in weaving and integrated establishments. Among integrated m ills, employment on woolen fabric production accounted for seven-tenths of the workers nationally, and more than nine-tenths in the New England and Middle Atlantic regions. In yarn mills, slightly fewer than three-fifths of the workers were in mills producing wool ya rns;7 establishments primarily engaged in the manufacture of carpet or rug yarn accounted for two-fifths of the yarn mill workers; most of these mills were in the Southeast.
Unionization. Mills having collective bargaining agreements covering a majority of their production workers employed nearly one-third of the industry*s work force. The proportions were fewer than one-tenth in the Southeast, about
half in New England, and the Great Lakes, and nearly seven-tenths in the Middle Atlantic region. The major unions in the industry were the Textile Workers Union of America and the United Textile Workers of America.
6 Standard M etropo litan Statistica l Areas as defin ed by the U. S. Bureau of the Budget through March 1965.
7 In the Bureau's June 1962 survey, two-thirds of the employ ment in yarn mills was engaged in the manufacture
of worsted yarn.

7/21/2019 bls_1551_1967.pdf
http://slidepdf.com/reader/full/bls15511967pdf 10/82
3
Method of Wage Payment. Nearly three-fourths of the industry's production workers were paid time rates, usually under formal systems providing a single rate for a given occupation (table 20). Incentive system s— normally individualpiece rates----applied to slightly over one-fourth of the workers in the Southeast,about one-fourth in New England, and two-fifths in the Middle Atlantic region. Incentive workers included more than nine-tenths of the weavers, a majority of the cloth menders, slightly fewer than one-half of the frame spinners, and two-
fifths of the winders.
Sex. Men accounted for nearly three-fifths of the industry's production workers and were predominant in such jobs as card finishers, card strippers, hand truckers, and weavers, as well as in plant maintenance work. Women comprised the large majority of cloth menders, frame spinners, and winders. Men accounted for slightly more than three-fifths of the workers in integrated mills , compared with about one-half in weaving and yarn mills.
Average Hourly Earnings
Straight-time earnings of the 41 ,765 production and related workers in wool yarn and broadwoven fabric mills averaged $1 .9 0 an hour in November 1966 (table 1). This was 14 percent above the average ($ 1. 66) recorded in June 1962. 8Workers averaged $1 .8 2 an hour in the Southeast and $1 .9 2 in New England. Earnings in these two regions were, respectively, 21 and 12 percent higher in November 1966 than in June 1962. In the Middle Atlantic and Great Lakes regions, workers averaged $2 .20 and $1 .77 an hour, respectively. As indicated in the following tabulation, wage levels also varied by State and area.9
Number of Average
production hourly-Selected States and areas workers earnings
M ain e------------------------------------------------------------- 4,037 $1. 74
Massachusetts ------------------------------------------------ ----- 4,068 2.02
New Hampshire----------------------------------------------
3,456 1. 93
North Carolinar—Virginia -------------------------------- 7,297 1.83
Rhode Island -------------------------------------------------- 3,561 1.98
Philadelphia—Camden, Pa.—N. J . ------------------------- 1 ,502 2.06
Average hourly earnings of workers in woolen mills exceeded those in worsted m ills by 9 cents (table 2). In both the Southeast and New England, however, averages for these two mill groups were nearly identical.
Workers in integrated mills (those having both spinning and weaving operations) averaged $1 .9 6 an hour, compared with $1.91 for workers in weaving m ills , and $1 .7 6 for those in yarn (spinning) mills . In New England, the only region permitting such comparison, the corresponding averages were $1.95, $1.9 2 , and $1 .8 3 . Although the lack of skilled weaving operations in yarn mills contributes to the relatively low earnings level for this type of mill, yarn mill workers usually had lower pay when comparisons were made at the occupational level.
® Op. ci t. , BLS Bulletin 1372.9 For greater deta il, see individual State and area tables 14—19.

7/21/2019 bls_1551_1967.pdf
http://slidepdf.com/reader/full/bls15511967pdf 11/82
4
Average earnings among fabric mills (weaving and integrated mills) varied
by predominant class of fabric. In the three regions permitting comparisons, earnings of workers in mills primarily engaged in manufacturing apparel fabrics
and blanketing averaged less than those of workers in mills manufacturing other
types of fabrics— the differences amounting to 11 cents an hour in New England, 35 cents in the Great Lakes, and 38 cents in the Middle Atlantic region.
Data were also tabulated by size of community and s ize of mill, In the
New England and Middle Atlantic regions, workers in metropolitan areas averaged
7 and 35 cents an hour more, respectively, than workers in smaller communities; in the Great Lakes region, the relationship was reversed . In the Southeast, however, averages were nearly identical. Nationwide, workers in establishmentsemploying 250 workers or more averaged $1.93 an hour----7 cents more than thosein smaller mills. This relationship of mill -employment size to earnings held in
the three regions permitting comparisons— the differences amounting to 7 cents
an hour in New England, 14 cents in the Southeast, and 41 cents in the Middle
Atlantic region.
The wage advantage of workers in mills with labor-management contracts
over workers in mills not having such contracts amounted to 15 cents an hour
in New England, 29 cents in the Middle Atlantic region and 24 cents in the Great
Lakes region. Because of the interrelationship with other factors previously
mentioned, it is not possible to determine the exact influence unionization had on
earnings. In each of the three regions, integrated mills accounted for a larger
proportion of the employment in union mills than in those not having labor-
management contracts. In New England, for example, the proportions were
three-fourths and one-half, respectively. As indicated previously, fewer than
one-tenth of the workers in the Southeast were in union mills.
Men, who accounted for 57 percent of the workers in wool yarn and broad- woven fabric mills, averaged $1.97 an hour; women averaged $1.81. Men averaged
13 cents an hour more than women in the New England and Southeast regions, and 26 cents more in the Middle Atlantic region. Differences in average pay
levels for men and women may be the result of several factors, including variation
in the distribution of the sexes among establishments and among jobs with disparate pay lev els. Differences in averages in the same job and area may reflect
minor differences in workers’ duties. Job descriptions used in classifying workers in wage surveys are usually more generalized than those used in individual establishments, because allowance must be made for minor differences among establishments in specific duties performed. Also , earnings in some jobs in the
industry are largely determined by production at piece rates. Variations in incentive earnings for individuals or sex groupings may be traceable to differences
in work experience, effort, workflow, or other factors which the worker may or
may not control.
Ninety-seven percent of the workers earned between $1.4 0 and $ 3 an hour; the middle half of.the workers earned between $1.67 and $2 .0 8 . Nearly 6 pe rcent of the workers earned less than $1.5 0 an hour and a comparable proportion
earned $ 2.50 or more (table 2).
Occupational Earnings
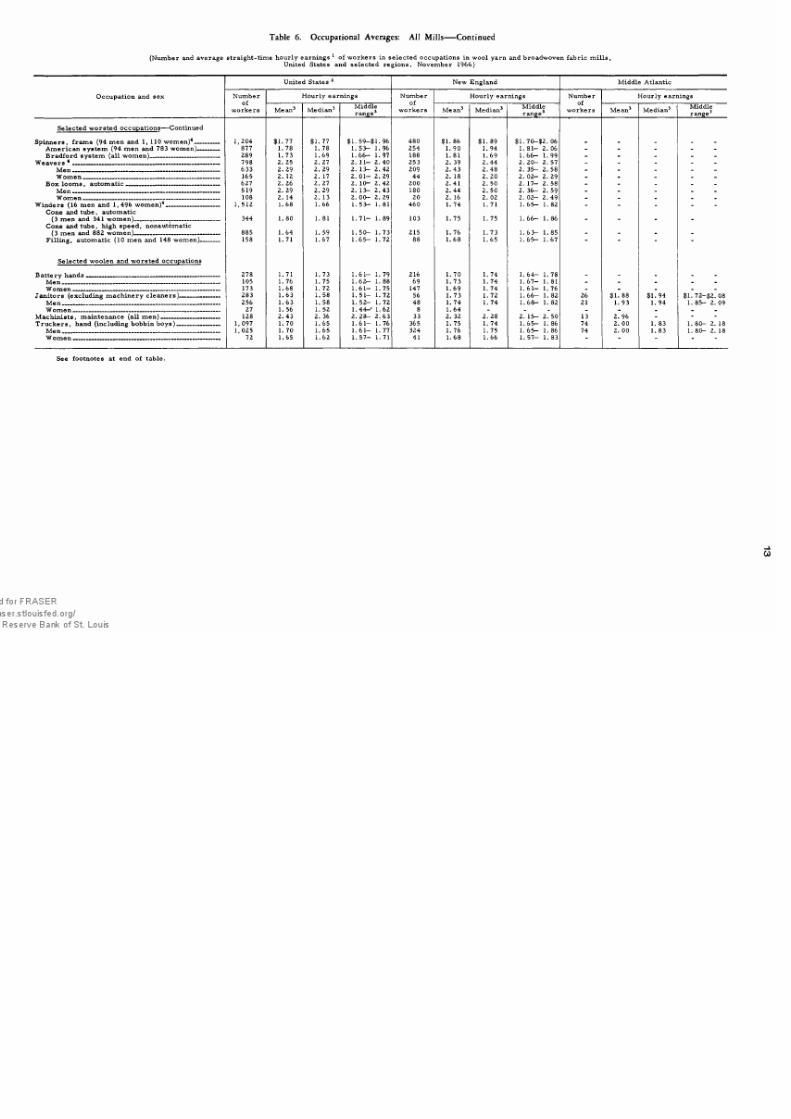
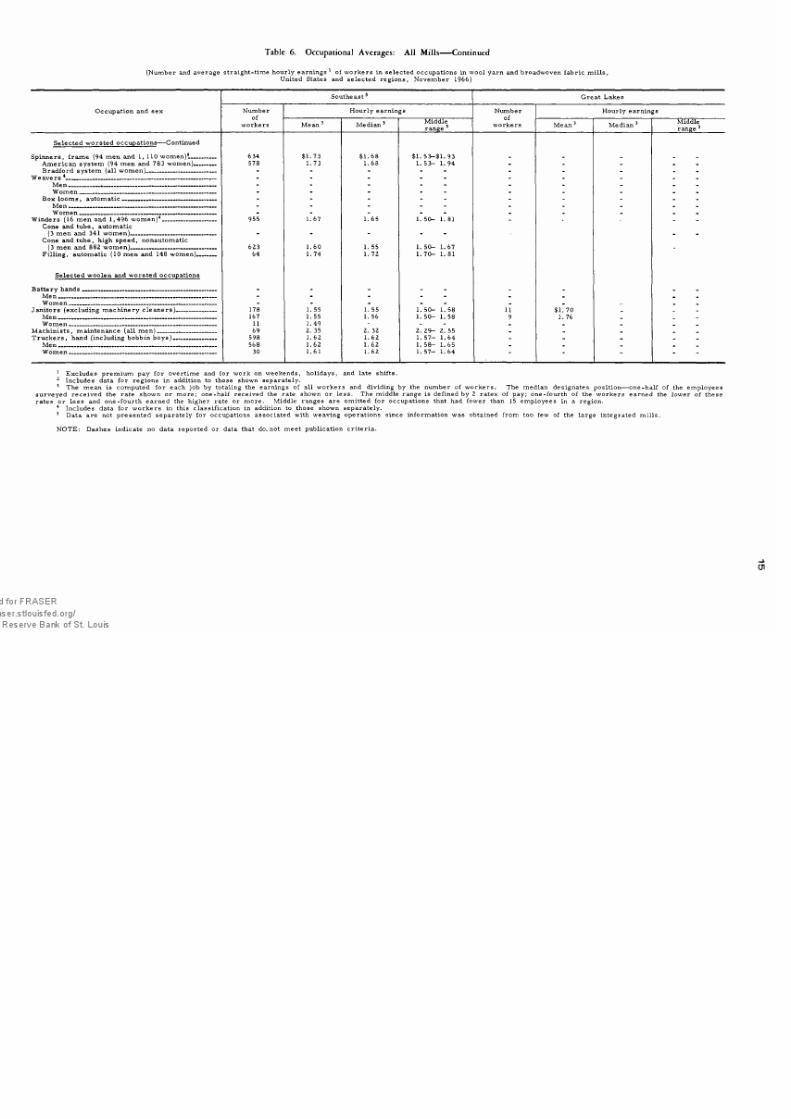
Occupational classifications for which data are presented separately, accounted for slightly more than two-fifths of the production workers covered by
the study (table 6). Hourly averages for these jobs ranged from $1 .6 3 for
janitors to $2.5 0 for loom fixers in worsted operations and nonautomatic box
loom weavers in woolen operations. Some numerically important jobs in woolen
operations and their averages were winders, $1.76 an hour; card finishers and
7/21/2019 bls_1551_1967.pdf
http://slidepdf.com/reader/full/bls15511967pdf 12/82
5
cloth menders, $1 .8 5 ; frame spinners, $1 .92 ; and weavers, $2 .3 2 . In worstedoperations, cloth menders averaged $1.7 8 an hour; frame spinners, $1 .7 7 ; weavers, $2.2 5; and winders, $1 .6 8 . Hand truckers and battery hands, two
jobs common in both woolen and worsted m ills , averaged $1.7 0 and $1.7 1 an hour, respectively.
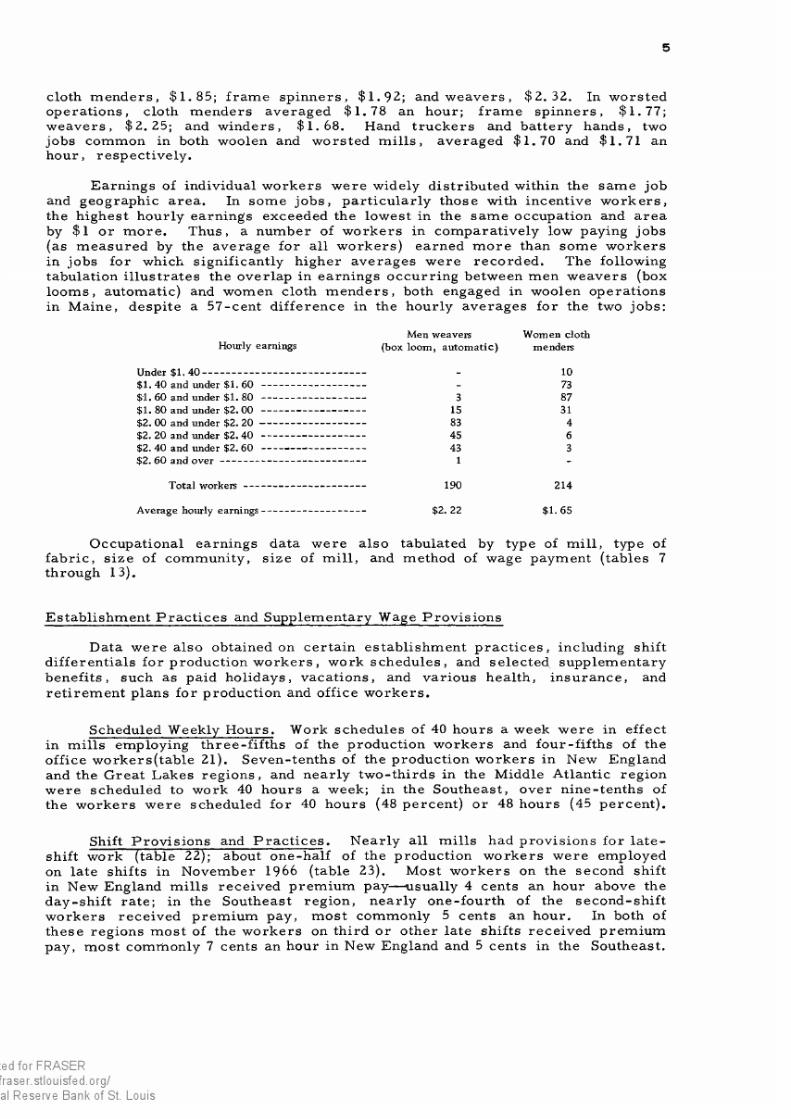
Earnings of individual workers were widely distributed within the same job
and geographic area. In some jobs, particularly those with incentive workers, the highest hourly earnings exceeded the lowest in the same occupation and area by $1 or more. Thus, a number of workers in comparatively low paying jobs (as measured by the average for all workers) earned more than some workers in jobs for which significantly higher averages were recorded. The following tabulation illustrates the overlap in earnings occurring between men weavers (box looms, automatic) and women cloth menders, both engaged in woolen operations in Maine, despite a 57-cent difference in the hourly averages for the two jobs:
Hourly earningsMen weavers
(box loom, automatic)Women cloth
menders
Under $1.40 -------------------
$1. 40 and under $1. 60 -$1. 60 and under $1. 80 -
$1. 80 and under $2. 00 -•$2. 00 and under $2. 20 —$2. 20 and under $2. 40 -$2. 40 and under $2. 60 -$2. 60 and ov e r --------------
- 10- 733 87
1531
83 445 6
43 31 -
Total workers 190 214
Average hourly earnings $2. 22 $1.65
Occupational earnings data were also tabulated by type of mill, type of fabric, size of community, size of mill, and method of wage payment (tables 7 through 13).
Establishment Practices and Supplementary Wage Provisions
Data were also obtained on certain establishment practic es, including shift differentials for production wo rkers, work schedules, and selected supplementary benefits, such as paid holidays, vacations, and various health, insurance, and retirement plans for production and office workers.
Scheduled Weekly Hours. Work schedules of 40 hours a week were in effect in mills employing three-fifths of the production workers and four-fifths of the office workers(table 21). Seven-tenths of the production workers in New England and the Great Lakes regions, and nearly two-thirds in the Middle Atlantic region were scheduled to work 40 hours a week; in the Southeast, over nine-tenths of the workers were scheduled for 40 hours (48 percent) or 48 hours (45 percent).
Shift Provisions and Practices. Nearly all m ills had provisions for late- shift work (table 22); about one-half of the production workers were employed on late shifts in November 1966 (table 23). Most workers on the second shift in New England mills received premium pay— usually 4 cents an hour above the day-shift rate; in the Southeast region, nearly one-fourth of the second-shift workers received premium pay, most commonly 5 cents an hour. In both of these regions most of the workers on third or other late shifts received premium pay, most commonly 7 cents an hour in New England and 5 cents in the Southeast.
7/21/2019 bls_1551_1967.pdf
http://slidepdf.com/reader/full/bls15511967pdf 13/82
6
Paid Holidays. Paid holidays were provided by establishments employing about nine-tenths of the production workers (table 24). Provisions varied by region and within regions. For example, workers in New England most commonly received 6 paid holidays annually, however, provisions for 7 days or more applied to one-fourth of the workers. In the Middle Atlantic region, 7 and 8 paid holidays were about equally prevalent, and in the Southeast, about one-half of the workers were employed in mills providing 2 days a year, although provisions for 5 days or more applied to one-fourth of the workers. Paid holiday provisions for office
workers were somewhat more liberal than those for plant workers.
Paid Vacations. Paid vacations (after qualifying periods of service) were provided for production and office workers by nearly all of the mills studied (table 25). Vacation payments for slightly more than one-half of the production workers were based on a stipulated percentage of the employee’ s annual earnings; payments for more than nine-tenths of the office workers were determined on a length-of-tim e basis. For purposes of this study, percentage payments were converted to an equivalent time basis . Most common vacation payments for p roduction workers were 1 week’s pay after 1 year of service and 2 week’s pay after 5 years or more. Nearly one-fifth of the production workers were in establishments providing at least 3 weeks' paly after 15 years of service or more. Nearly two-thirds of the office workers received 2 weeks’ pay after 1 year of
service; slightly more than two-fifths received 3 weeks' after 15 years; and one- fifth received 4 weeks' after 20 years.
Health, Insurance, and Retirement Plans. More than nine-tenths of the production and office workers were employed in mills that paid at least part of the cost of life , hospitalization, and surgical insurance (table 26). Accidental death and dismemberment insurance and medical insurance were provided to at least three-fifths of the workers in both groups; sickness and accident insurance applied to three-fourths of the production workers and one-half of the office workers. Sick leave (full pay, no waiting period) was available to two-fifths of the office workers, but to none of the production workers; catastrophe insurance was available to one-fifth of the office workers, and two-fifths of the production workers. All types of plans were usually financed wholly by the employer,
except for catastrophe insurance that applied to production workers. Usually, plans wholly financed by the employer did not provide benefits to the employee's dependents.
Pension plans (other than social security), providing regular payments to workers on retirement, were provided by mills employing two-fifths of the pr oduction workers and one-half of the office workers. Plans providing lump-sum payments upon retirement applied to fewer than one-tenth of the workers in both groups.
Other Selected Benefits. Mills with provisions for severance pa y10 employed fewer than one-tenth of the production workers and one-eighth of the
office workers (table 27). Formal plans providing pay for funeral leave applied to one-fifth of the production workers; and provisions for jury duty pay applied to
nearly three-tenths; both of these provisions applied to nearly two-fifths of the
office workers.
10 Pay to employees permanently separated from work through no fault of their own.
7/21/2019 bls_1551_1967.pdf
http://slidepdf.com/reader/full/bls15511967pdf 14/82
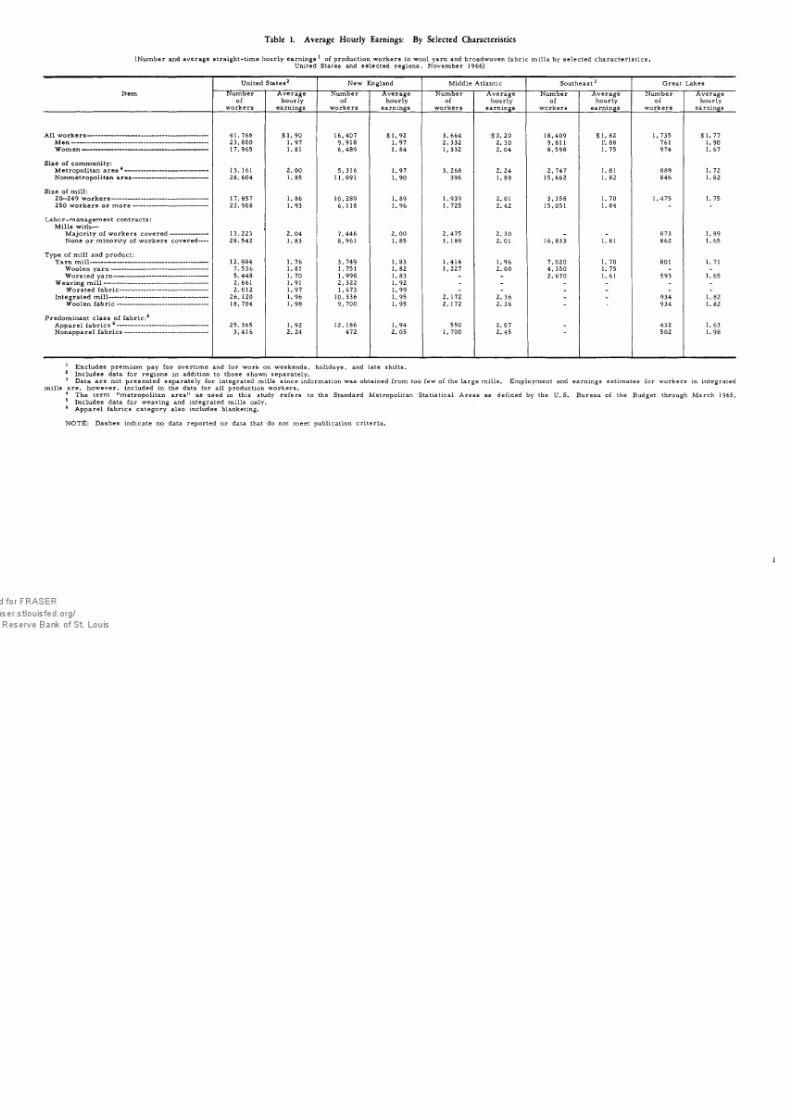
Table 1. Average Hourly Earnings: By Selected Characte ristics
( Number and average s tra ight- t ime hour ly earnings 1 o f product ion workers in woo l yarn and broadwoven f abr ic m i l l s by se lected cha racter is t i cs ,United States and selec ted reg ions, Nove mb er 1966)
Item
United States2 New England M idd le A tlantic Southeast 3 G reat Lakes
Numberof
w o r k e r s
A ve ra gehourly
earnings
N u m b e rof
w o r k e r s
A ve ra gehourly
earnings
Numberof
w o r k e r s
A ve ra gehourly
earnings
Numberof
w o r k e r s
A ve ra gehourly
earnings
Numberof
w o r k e r s
A ve ra gehourly
earnings
A ll w o rk e rs --------------------------------------------------------------- 41 ,7 65 $1. 90 16,407 $1. 92 3, 664 $2. 20 18,409 $ 1. 82 1, 735 $ 1. 77M e n ----------------------------------------------------------------------- 23,800 1. 97 9 ,918 1. 97 2, 332 2. 30 9 ,811 1*. 88 761 1. 90W o m e n ----------------------------------------------------------------- 17, 965 1. 81 6 ,489 1. 84 1,332 2. 04 8, 598 1. 75 974 1. 67
Size o f community :M e t r o p o l i t a n a r e a 4 ------------------------------------------- 13,161 2. 00 5, 316 1. 97 3, 268 2. 24 2, 747 I. 81 889 1. 72N o n m e t r o p o l it a n a r e a --------------------------------------- 28,604 1. 85 11,091 1. 90 396 1. 89 15,662 1. 82 846 1. 82
Size o f mi l l :
20—249 wo rke rs -------------------------------------------------- 17,857 1. 86 10 ,289 1. 89 1,939 2. 01 3 ,3 58 1. 70 1,475 1. 75
2 50 w o r k e r s o r m o r e ---------------------------------------
23,908 1. 93 6, 118 1. 96 1,725 2 .42 15,051 1. 84 - -
L a b o r - m a n a g e m e n t c o n t r a c t s :
Mi l l s w i th—M a j o r i t y o f w o r k e r s c o v e r e d - --- -- --- -- -- -- -- -- - 1 3 ,2 2 3 2. 04 7 ,4 46 2. 00 2 ,475 2. 30 _ - 873 1. 89N o n e o r m i n o r i t y o f w o r k e r s c o v e r e d ----- 28 ,542 1. 83 8, 961 1. 85 1, 189 2. 01 16,833 1. 81 862 1. 65
Type o f mi l l and product : Ya rn m il l ------------------------------------------------------------- 12,984 1. 76 3, 749 1. 83 1,414 1 .96 7 ,020 1. 70 801 1. 71
W o o l e n y a r n -------------------------------------------------- 7, 536 1. 81 1, 751 1. 82 1 ,227 2. 00 4, 350 1. 75 - -
W or st ed ya rn ------------------------------------------------- 5 ,448 1. 70 1 ,998 1. 83 _ _ 2, 670 1. 61 593 1. 65W e a v in g m i l l ------------------------------------------------------ 2, 661 1. 91 2, 322 1. 92 - - - - - -
W or ste d fa b ri c---------------------------------------------- 2, 012 1. 97 1,673 1. 99 - - - - - -
Integra ted m i l l --------------------------------------------------- 26,120 1. 96 10,336 1. 95 2, 172 2. 36 - - 934 1. 82W o o l e n f a b r i c ----------------------------------------------- 18,704 1. 98 9, 700 1. 95 2, 172 2. 36 934 1. 82
P r e d o m i n a n t c l a s s o f f a b r i c : 5 A p p ar el fa b ri c s 6 ----------------------------------------------- 25,365 1. 92 12,186 1. 94 550 2. 07 - 432 1. 63N o n a p p a r e l f a b r i c s ------------------------------------------- 3 ,4 16 2. 24 472 2. 05 1, 700 2 .4 5 502 1. 98
1 Excludes prem ium pay f or overt ime and f or work on weekends , ho l idays , and la te shi fts .2 Inc ludes da ta f or reg ions in addi t ion to those shown separate ly .3 Data are not presented separate ly f or integra ted mi l l s s ince inf ormation was ob ta ined f rom too f ew o f the la rge mi l l s . Employment and earnings es t imates f or workers in integra ted
mi l l s a re , how ever , inc luded in the da ta f or a l l product ion workers .4 The term "m etro polit an a rea" as used in this study refer s to the Standard Metrop olitan Statist ical Area s as defined by the U. S. Bureau of the Budget through Ma rch 1965.5 Inc ludes da ta f or weaving and integra ted mi l l s only .6 A p p a r e l f a b r i c s c a t e g o r y a l s o i n c lu d e s b la n k et in g .
NOTE: Dashes indica te no da ta reported or da ta that do not meet pub l i ca t ion cr i ter ia .
J

7/21/2019 bls_1551_1967.pdf
http://slidepdf.com/reader/full/bls15511967pdf 15/82
Table 2. Earnings Distribution: All Mills by Type of Yarn 00
( Percen t d is tr ibution o f product ion workers in woo l yarn and broadwoven f abr ic m i l l s by average s tra ight- t im e hour ly earnings 1and predominant type o f yarn produced or woven, United Sta tes and se lected reg ions , Novem ber 1966 )
A ve ra ge ho ur ly ea rn in gs 1
United States 2 New England Middle Atlanti c Southeast Great Lakes
A ll typ es W oo lenyarn orf abr ic
Wors tedyarn or
f abr ic
A lltypes
Woolenyarn orf abr ic
Wors tedyarn orf abr ic
A lltypes 3
Woolenyarn orf abr ic
A lltypes
Woolenyarn orf abr ic
Wors tedy a r n o rf abr ic
A lltypes 3
Woolenyarn orf abr icTota l Men W om en
$1 .25 and under $ 1 .30 ---------------------------- 0. 3 0. 4 0. 2 0. 3 0. 3 0. 3 0. 2 0. 3 0. 4 0. 7 0. 2 0. 2 0. 3
$ 1. 30 and un der $ 1.3 5----------------------------
. 3 . 3 . 3 . 4 . 1 .3 *4 . 1 _ _ . 2 .4 . 1 1. 5 2. 3$1 .3 5 and under $ 1 .40 ---------------------------- 1. 5 . 7 2. 6 1.4 1. 7 . 7 , 7 . 7 - _ 1. 2 2. 1 . 4 15. 6 7. 6$1 .40 and under $ 1. 45 ---------------------------- 1. 5 1. 2 2. 1 1.3 1. 9 1. 2 H i 1. 4 0. 1 (4) 2. 0 1. 8 2. 3 2. 1 2. 7$1.45 and under $ 1. 50 ---------------------------- 2. 3 2. 3 2. 2 2. 8 1. 4 3. 8 5i 0 . 4 . 3 0. 2 1. 3 . 6 1. 9 3 .9 5. 4
$ 1. 50 and under $ 1.60 ---------------------------- 9. 9 7. 3 13. 3 7. 6 14. 1 7. 0 7^9 4. 6 4. 6 1. 1 13. 4 9. 2 17. 3 13. 8 13. 9$ 1. 60 and un der $ 1.7 0 ---------------------------- 13. 7 12. 3 15. 7 12. 3 16. 3 11. 2 9* 2 16. 8 2. 6 2. 6 19.5 22. 1 17. 1 7. 8 9. 1$ 1. 70 and under $ 1. 80 ---------------------------- 15. 2 12.4 18. 9 14. 3 16. 8 14. 2 14a 2 14. 1 8. 9 9. 1 18. 0 17.9 18. 1 14. 6 11. 1$ 1. 80 and under $ 1. 90 ---------------------------- 14. 6 13. 7 15. 9 15. 8 12. 4 16.4 16a 1 17. 3 11. 6 12. 2 14. 8 19 .4 10. 6 8. 5 6. 5$ 1. 90 and under $2. 00 ---------------------------- 9. 9 9. 7 10. 1 9. 4 10. 7 12. 3 11<5 14. 7 6. 3 6. 8 8. 6 7. 5 9. 6 10. 0 12. 6
$2. 00 and under $2. 10 ---------------------------- 6. 8 7. 3 6. 0 7. 2 5. 9 8. 2 7j 7 9. 7 12. 4 13. 2 4. 4 4. 2 4. 6 6. 5 9 .4$2 .1 0 and under $2 . 20 ---------------------------- 6. 5 7. 8 4. 9 7. 5 4. 8 5. 9 6j 2 5. 2 11. 9 11. 7 4. 7 5. 1 4. 4 4 .4 4. 3$2 . 20 and un de r $2 . 30-------------------------- 4. 6 6. 4 2. 3 4. 7 4. 5 4. 5 4. 8 3. 8 7. 6 8. 0 4. 2 3. 2 5. 1 2. 7 4. 0$ 2. 30 and u nde r $ 2. 40---------------------------- 3. 7 5. 3 1. 7 3.9 3. 5 4. 6 5. 1 3. 2 4. 6 4. 8 3. 0 1. 9 3. 9 1. 8 2. 2$ 2. 40 and under $ 2.5 0 ---------------------------- 2. 6 3. 5 1. 3 3. 0 1. 8 2. 8 2. 9 2. 5 5. 9 5. 8 1. 7 2. 0 1 .4 1. 7 2. 6
$2. 50 and under $2. 60 ---------------------------- 2. 5 3. 7 1. 0 2. 8 2. 1 2. 9 3. 2 2. 3 4. 3 4. 5 1. 5 .9 2. 1 1. 6 1. 8$2. 60 and under $2. 70 ---------------------------- 1. 3 2. 0 . 5 1. 6 .9 1. 6 1. 7 1. 3 3. 7 3 .9 . 7 . 6 . 7 .8 1. 0$2 . 70 and un de r $2 . 80----------------------------- . 8 1.3 . 3 1. 1 . 3 . 9 1. 0 . 6 3. 9 4. 1 . 2 . 3 . 1 . 5 . 4$2. 80 and under $2. 90 ---------------------------- . 5 . 8 . 2 . 8 . 1 .4 . 4 . 3 3. 1 3. 3 (4 ) (4) (4) . 7 1. 1$ 2. 90 and under $ 3.0 0 ---------------------------- . 3 .5 . 1 . 5 (4 ) . 2 . 2 . 1 2. 7 2. 8 - . 2 . 3
$3 . 00 and ov er ------------------------------------------ . 8 1. 1 . 4 1. 1 . 3 . 6 •is . 8 5. 6 6. 0 (4) (4) . 1 .9 1. 3
T o t a l-------------------------------------------------- 100. 0 100. 0 100. 0 100. 0 100. 0 100. 0 100. 0 100. 0 100. 0 100. 0 100. 0 100. 0 100. 0 100. 0 100. 0
N u m b e r o f w o r k e r s ----------------------------------- 41 ,765 23 ,800 17 ,965 26 ,889 14 ,876 16,407 12 ,100 4, 307 3 ,664 3 ,399 18,409 8, 727 9, 682 1,735 1, 142
M e n --------------------------------------------------------- 23 ,800 _ _ 16,733 7, 067 9 ,91 8 7 ,9 37 1,981 2, 332 2, 240 9 ,811 5, 033 4, 778 761 548
W om en ---------------------------------------------------- 17 ,965 - 10, 156 7, 809 6 ,489 4 , 163 2, 326 1,332 1, 159 8 ,59 8 3, 694 4, 904 974 594
A ve ra ge ho ur ly ea rn in gs 1------------------------ $ 1.90 $ 1 .9 7 $ 1. 81 $ 1 .9 3 $ 1. 84 $ 1 .9 2 $ 1 . 9 2 $1 .91 $2 . 20 $2 . 23 $ 1. 82 $1 . 81 $ 1. 82 $ 1 . 77 $ 1. 83
M e n --------------------------------------------------------- 1. 97 - - 1 .97 1 .95 1 .97 1 .9 6 2. 03 2. 30 2. 30 1. 88 1. 84 1 .92 1. 90 1. 94W om en ---------------------------------------------------- 1.81 1.85 1. 74 1 .84 1. 86 1. 80 2. 04 2. 08 1. 75 1. 78 1. 73 1. 67 1. 74
1 Excludes prem ium pay f or overt im e and f or work on weekends , ho l idays , and la te shi f ts .2 Inc ludes da ta f or reg ions in addi t ion to those shown separate ly .3 Inc ludes da ta f or wors ted yarn or f abr i c mi l l s not shown separate ly .4 L e s s t h a n 0 . 0 5 p e r c e n t .
NOTE: Because o f rounding , sums o f indiv idua l items may not equa l to ta ls,

7/21/2019 bls_1551_1967.pdf
http://slidepdf.com/reader/full/bls15511967pdf 16/82
Table 3. Earnin gs Distribu tion: All Mills by Type of Mill
( Pe rcent d is tr ibution o f product ion workers in woo l yarn and broadwoven f abr ic m i l l s by average s tra igh t- t ime hour ly earningsand type o f mi l l , Uni ted Sta tes and se lected reg ions , Novem ber 1966)
A v er ag e h ou rl y ea rn in gs 1
United States New England M iddle A tlan tic S ou th east3 G reat Lakes
Ya rn W eavingm i l l s
Integratedm i l l s
Ya rnm i l l s
W eavingmi l l s
Integra tedm i l l s
Ya rnm i l l s
Integratedmi l l s
Ya rnmi l l s
Ya rnm i l l s
Integratedmi l l s
$ 1. 25 and under $ 1. 30 _____________________________ 0. 7 0. 2 0. 1 0 .4 (4) 0. 3 1. 0 0. 3$ 1. 30 and und er $ 1. 35_____________________________ .4 . 5 . 2 . 5 0. 5 . 3 - - . 5 - 2. 8$1 .3 5 and un de r $ 1. 40 --------------------------------------------- 3 .4 .4 . 7 .9 .4 . 6 - - 3. 2 23. 0 9. 3$ 1. 40 a nd u nd er $ 1. 45 --------------------------------------------- 3. 2 . 9 . 8 2. 8 . 9 . 7 0. 2 - 4. 4 . 7 3. 3$ 1. 45 an d un der $ 1. 50_____________________________ 3. 2 3. 6 1. 7 6. 3 4. 0 2. 7 . 7 2. 3 . 7 6. 6
$ 1. 50 and u nde r $ 1. 60_____________________________ 16. 8 8. 6 6. 6 7. 6 9. 5 6. 2 11. 0 0. 7 23. 2 14. 0 13. 6$ 1. 60 and under $ 1. 70 _____________________________ 17. 5 18. 3 11.4 15. 1 14. 9 9. 0 4. 7 1. 3 22. 8 4. 0 11. 1$ 1. 70 and under $ 1. 80 _____________________________ 14. 2 9. 0 16. 3 16. 2 9. 3 14. 6 15. 8 4. 5 12. 1 21. 0 9. 2$ 1. 80 and u nde r $ 1. 90_____________________________, 15. 8 10. 2 14. 5 16. 1 11. 0 17. 8 17. 3 8. 3 16. 0 10. 1 7. 2$ 1. 90 and u nde r $ 2. 00--------------------------------------------- 8. 9 13. 8 10. 0 12. 1 14. 8 11. 8 6. 1 6. 7 7. 6 10. 7 9. 4
$ 2. 00 and under $2. 10_____________________________ 5. 5 9 .0 7. 2 7. 1 9. 1 8. 4 16. 8 9. 8 2. 1 7. 6 5. 6$ 2. 10 and u nd er $ 2. 20--------------------------------------------- 4. 8 7 .4 7. 3 5. 5 6. 0 6. 0 12. 3 10. 3 2. 9 4. 7 4. 2$ 2. 20 and un der $ 2. 30________i______________ ______ 1. 8 2. 5 6. 3 3. 6 2. 7 5. 3 3. 9 10. 2 . 7 . 6 4. 5$ 2. 30 and un der $ 2. 40 _____________________________ 1. 2 4 . 2 4. 9 2. 7 4. 7 5. 2 1. 1 6. 8 . 5 . 7 2. 7$ 2. 40 and un der $ 2. 50-------------------------------------------- . 7 4. 1 3. 4 . 6 4. 0 3. 3 3. 3 7. 0 . 2 . 2 3. 0
$ 2. 50 and un der $ 2. 60_____________________________ . 6 3. 2 3. 4 . 5 3. 7 3. 6 1. 8 6. 0 . 4 . 7 2. 2$ 2. 60 and un der $ 2. 70--------------------------------------------- . 2 2. 3 1. 8 . 1 2. 6 1. 9 1. 3 5. 3 (4) .4 1. 2$ 2. 70 and u nde r $ 2. 80-------------------------------------------- . 3 .9 1. 1 . 5 1. 0 1. 0 . 9 6. 0 . 5 .4$ 2. 80 and u nde r $ 2. 90---------- - -- -- --- -- -- -- -- -- -- -- -- -- --- -- . 2 . 5 . 7 . 2 . 6 .4 1. 0 4. 6 _ _ 1.4$ 2. 90 and u nd er $3 . 00--------------------------------------------- . 1 . 2 . 5 - . 1 . 3 . 5 4. 1 - - . 3
$ 3. 00 and ov er ______________________________________ . 5 . 3 1. o 1. 0 . 2 . 5 1. 3 8. 5 (4) . 1 1. 6
T o ta l...............— --------- -------------- ------------------------ 100. 0 100. 0 100. 0 100. 0 100. 0 100. 0 100. 0 100. 0 100. 0 100. 0 100. 0
Nu m ber of wo rk er s__________________________________ 12,984 2, 661 26 ,120 3, 749 2, 322 10 ,336 1,414 2, 172 7, 020 801 934M en ________________________________________________ 6, 115 1 ,438 16, 247 1, 764 1,289 6, 865 854 1,436 3, 194 303 458 ‘W om e n _____________________________________________ 6, 869 1, 223 9, 873 1, 985 1 ,033 3 ,471 560 736 3, 826 498 476
A ve ra ge h ou rl y ea rn in gs 1--------------------------------------- $ 1. 76 $1. 91 $ 1. 96 $ 1. 83 $ 1. 92 $1. 95 $ 1. 96 $2. 36 $ 1. 70 $ 1. 71 $ 1. 82M en ________________________________________________ 1. 82 2. 03 2. 01 1. 87 2. 03 1. 99 2. 07 2 .43 1. 73 1. 85 1. 92W om en _____________________________________________ 1. 71 1. 78 1. 88 1. 79 1.78 1. 88 1. 78 2. 22 1. 67 1. 63 1 .72
1 Excludes p remium pay f or overt ime and f or work on weekends , h o l idays , and la te shi f ts .2 Inc ludes da ta for reg ions in addi t ion to those shown separate ly .3 Data are not presented sep arate ly f or integra ted mi l l s s ince inf orma tion was ob ta ined f rom too few o f the la rge mi l l s .
4 Les s than 0. 05 percent .
NOTE: Because o f rounding , sums o f indiv idua l i tems may not equa l to ta ls .
CD

7/21/2019 bls_1551_1967.pdf
http://slidepdf.com/reader/full/bls15511967pdf 17/82
Table 4. Earnings Distribution: Weaving and Integrated Broadwoven Fabric Mills by Type of FabricO
( Pe rcent d is tr ibution o f product ion workers in w oo l weaving and integra ted broadwoven f abr ic m i l l s by average s tra ight- t ime hou r ly earnings 1and type of fabr ic produced, United States and selec ted regio ns, N ovem ber 1966)
A v er ag e ho u rl y ea rn in gs 1
United States 2 New EnglandMiddle
At la nt icGreat Lakes
A p pa re l fa b r ic s3Nonappare l
f abr i cs
A p pa re l fa b ri c s 3Nonappare l
f abr i csNonappare l
f abr i cs
A pp ar elf abr i cs 3 Nonappare l
f abr icsW oolen W ors ted Woolen W orsted Woolen
$ 1. 25 and under $ 1. 30 ________________________ ____ _ 0. 2 0. 1 0. 3 (4) 0. 7
$ 1. 30 and under $ 1. 35 _____________________________ . 4 (4) _ . 4 (4) _ _ 6. 0 -$ 1. 35 and u nde r $ 1. 40 1. 1 . 1 0. 3 . 6 0. 1 2. 3 - 20. 1 -
$ 1. 4 0 a nd u n d er $ 1 . 4 5 ___ . . .. . . ........... . 8 . 8 . 8 . 5 . 8 5. 7 - 7. 1 -
$1 .45 and under $ 1. 50. ___ . ............... ....... . 2. 5 . 8 2. 0 3. 6 . 2 3. 6 - 3. 7 9. 2
$ 1. 50 and und er $ 1. 6 0 .................................. _ 8. 1 5. 6 4. 0 7. 9 2. 9 4. 0 0. 9 17. 1 10. 6$ 1. 60 and under $ i. 70 _____________________________ 12. 5 14. 0 4. 8 9. 4 13. 3 8. 5 1. 5 12. 5 10. 0$ 1. 70 and u nd er $ 1. 80______________________________ 15. 0 20. 1 5. 9 14. 3 12. 3 6. 8 3. 3 7. 6 10. 6$ 1. 80 and under $ 1. 90_____________________________ 16. 3 13. 7 4. 6 17. 5 14. 6 5. 9 2. 9 5. 1 9. 0$ 1. 90 and un der $ 2. 00_____________________________ 9. 5 12. 2 9. 3 11. 6 16. 5 8. 5 3. 6 7. 2 11. 4
$ 2. 00 and under $ 2. 10_____________________________ 7. 0 7. 1 9. 5 7. 7 11. 3 12. 1 9. 5 5. 8 5. 4$ 2. 10 and under $2. 20...... ............................................... 7. 9 6. 2 7. 9 5. 8 6. 3 8. 9 9. 5 2. 1 6. 0$ 2. 20 and un de r $ 2. 30------------------------------------ ------- 5. 2 6. 3 8. 1 4. 8 4. 9 4. 9 10. 1 2. 3 6. 4
$ 2. 30 and un der $ 2. 40___________________ __________ 4 .4 5. 1 6. 3 5. 3 4. 3 6. 6 7. 9 1. 4 3. 8
$ 2. 40 and un der $ 2. 50_____________________________ 2. 7 2. 7 8. 9 3. 2 4. 4 3. 6 8. 8 " 5. 6
$ 2. 50 and un der $ 2. 60_____________________________ 3. 1 3. 1 5. 6 3. 4 4. 0 6. 8 7. 3 . 7 3. 6
$ 2. 60 and un der $ 2. 70_____________________________ 1. 5 1. 3 5. 0 1. 8 2. 3 6. 1 6. 0 - 2. 2
$ 2. 70 and un der $ 2. 80_____________________________ . 7 . 4 4. 9 . 9 1. 0 2. 3 7. 4 - . 8
$ 2. 80 and under $ 2. 90--- -- -- -- -- -- -- -- -- -- -- -- -- -- -- -- -- -- -- -- -- -- . 5 . 1 3. 2 . 4 . 5 1. 5 5. 4 . 2 2. 4
$ 2. 90 and un der $ 3. 00_____________________________ . 2 . 1 2. 9 . 2 . 1 1. 5 5. 2 . 2 . 4
$ 3. 0 0 and o v e r _______________________________________ . 4 . 1 5. 9 . 5 . 2 . 4 10. 8 _ 3. 0
T o t a l___________________________________________ 100, 0 100. 0 100. 0 100. 0 100. 0 100.0 100. 0 100. 0 100. 0
N u m b e r o f w o r k e r s __________________________________ 15 ,937 9 ,4 28 3 ,4 16 9, 877 2, 309 472 1, 700 432 502
A ve ra ge h ou rl y ea rn in gs 1---------------------------------------
$ 1. 92 $ 1. 92$2. 24 $ 1 . 93 $ 1. 98 $2. 05 $ 2. 45 $ 1. 63 $ 1. 98
1 Exclude s premium pay f or overt im e and f or work on weekends , ho l idays , and late shi f ts .2 Inc ludes da ta f or reg ions in add i t ion to those shown separate ly . Data are not presented separate ly f or the Southeast s ince inf orm ation was ob ta ined f rom too f ew o f the la rge
integra ted m i l l s .3 A p p a r e l f a b r i c s c a t e g o r y a l s o i n c l u d e s b la n k e ti n g .4 L ess than 0. 05 percent .
NOTE: Because o f rounding , sums o f indiv idua l i tems may not equa l to ta ls.

7/21/2019 bls_1551_1967.pdf
http://slidepdf.com/reader/full/bls15511967pdf 18/82
Table 5. Earnings Distribution: Yarn Mills by Type of Yarn
( Percent d is tr ibution o f product ion worker s in woo l yarn mi l l s by average s tra igh t- t ime hour ly earningsand predominant type o f yarn produ ced, United Sta tes and se lected reg ions , Novem ber 1966)
A ve ra g e ho ur ly ea rn in gs 1
United States 2 ^ New EnglandMiddle
At lan ticSoutheast
Woolenyarn
W o r s t e dyarn
W oolenyarn
W ors tedyarn
Woolenyarn
Woolen W o r s t e d
$ 1. 25 and under $ 1. 30 _________________ ____ _________________ 0. 8 0. 5 0. 7 1. 3 0. 6
$ 1. 30 and under $ 1. 35 ---------------------- ------ ------------------------------- . 6 . 2 0. 8 . 3 - . 8 . 1
$ 1. 35 an d u nd er $ 1. 40 ......................................................................... 2. 6 4. 6 . 5 1. 3 - 4. 3 1. 5
$ 1. 40 a nd u nd er $ 1. 45 ________________________________________ 2. 7 4. 0 3. 4 2. 2 0. 1 3. 3 6. 1
$ 1. 4 5 and u nd er $ 1. 50_________________ ______________________ 3. 7 2. 5 13. 0 . 6 . 7 1. 1 4. 3
$ 1. 50 and unde r $ 1. 60 ... ...........---------------------------------------------- 8. 3 28. 5 8. 8 6. 6 1. 8 9. 6 45. 3
$ 1. 60 and under $ 1. 70 ------- -------------- -------------- ---------------------- 15. 5 20. 2 8. 5 21. 0 4. 9 22. 1 24. 0
$ 1. 70 and under $ 1. 80 _______________________________________ 16. 5 11. 1 16. 2 16. 3 17. 2 16. 2 5. 3
$ 1. 80 and under $ 1. 90 ________________ ______ ________________ 19. 8 10.4 11. 3 20. 3 19. 1 24. 2 2. 8
$ 1. 90 an d un de r $ 2. 00________________________________________ 9. 5 8. 1 11. 7 12. 5 7. 0 8. 5 6. 2
$ 2. 00 and u nd er $ 2. 10________________________________________ 6. 7 3. 8 6. 2 7. 9 19. 2 2. 4 1. 5
$ 2. 10 and under $ 2. 20 ----- --------- ---------- ----------------------------------- 6. 4 2. 5 7. 4 3. 9 14. 0 4. 0 1. 1$ 2. 20 and under $ 2. 30 ......... ...................- ------ ---------------------------- 2. 1 1. 5 4. 7 2. 6 4. 0 . 5 . 9$ 2. 30 and u nde r $ 2. 40--------------- ------ --------- --------------- -------------- 1. 5 . 8 3. 7 1. 9 1. 3 . 8 (3)$ 2. 40 an d u nd er $ 2. 50------------------------------ ------ ---------------- -------- 1. 0 . 2 1. 0 . 3 3. 7 . 2 . 2
$ 2. 50 and under $ 2. 60 ----------------- ------------------------------------------- . 9 . 3 . 7 . 3 1. 8 . 7 _
$ 2. 60 and u nde r $ 2. 70_______________________________________ . 3 . 1 . 1 . 1 1. 3 ( 3) -
$ 2. 70 a nd un de r $ 2. 80------------------------------------------------------------ . 4 . 1 1. 0 . 1 . 7 - -
$ 2. 80 and under $ 2. 90 _______________________________________ . 3 - . 5 - 1. 1 - -
$ 2. 90 a nd un de r $ 3. 00------------------------------------------------------------ . 1 - - ' . 6 -
$ 3. 00 and o v e r _________________________________________________ . 4 . 6 . 5 1. 5 1. 5 _ . 1
T o t a l _____________________________________________________ 100. 0 100. 0 100. 0 100. 0 100. 0 100. 0 100. 0
N u m be r of wo rk er s ------------------------------------------------------------------ 7, 536 5 ,448 1,751 1, 998 1,227 4 , 350 2, 670
A ve ra ge ho u rl y ea rn in gs 1------------------------------------------------------- $1 .81 $ 1. 70 $ 1. 82 $ 1. 83 $ 2. 00 $ 1. 75 $ 1. 61
1 Excludes pr emium pay f or overt ime and f or work on weekends , h o l idays , and la te shi f ts .2 Inc ludes da ta f or reg ions in addi tion to those shown separate ly .3 L e s s t h an 0 . 0 5 p e r ce n t .
NOTE : B ecaus e of rounding, sums of individual items m ay not equal totals.

7/21/2019 bls_1551_1967.pdf
http://slidepdf.com/reader/full/bls15511967pdf 19/82
Table 6. Occup ational Averages: All Mills 10
( Number and average s tra ight- t ime hou r ly earnings 1 o f workers in se lected occupations in woo l yarn and broadwoven f abr ic m i l l s ,United States and selec ted reg ions, Nove mbe r 1966)
Occupation and sex
United States 2 New England Middle Atlantic
Numberof
w o r k e r s
Hourly earnings Number
of w o r k e r s
Hourly earnings Numberof
w o r k e r s
Hourly earnings
M e a n 3 Me dian3Middlerange3
Me an3 Median3Middlerange3
Mean3 Median3Middlerange3
Se lected woo len occupations
Card f inishers —___
_ ^ 1, 176 $1. 85 $1. 85 $ 1.7 2—$1. 95 547 $1. 83 $1. 84 $1.67—$1.90 182 $2. 09 $2 . 01 $1. 94—$ 2. 12M en _________ 1,058 1. 87 1. 85 1. 76 - 1. 97 441 1. 86 1. 86 1. 7 2 - 1. 95 180 2. 08 2. 01 1. 94- 2. 12W o m e n_______ _ ___ 118 1. 72 1. 77 1 . 5 1 - 1. 85 106 1.69 1. 77 1 . 48 - 1. 85 _ _ _ _ _
Card s tr ippers ( a l l men)_________________________________ 499 1. 93 1. 89 1. 77- 2. 05 259 1. 99 1. 92 1 .81— 2. 06 68 2. 13 2. 10 1. 94- 2. 20Dof f ers , spinning f rame ( 332 men and 29 women) ___ 361 1. 74 1. 77 1. 6 4 - 1. 84 86 1. 67 1. 80 1. 45- 1. 81 38 1. 99 1. 80 1. 7 4 - 2. 24Dye ing- m achine tenders , c lo th
( 215 men and 1 woman) _________________________________ 216 1. 78 1. 79 1 .6 5 - 1. 93 129 1. 76 1. 75 1 . 6 5 - 1. 88 - - _ _ _
Dye ing- m achine tend ers , y arn ( a l l men) _____________ 109 1. 78 1. 84 1 . 6 7- 1. 92 73 1. 83 1. 89 1. 83 - 1. 92 - _ _ _ -
F u l l e r t e n d e r s ( a l l m e n ) _________________________________ 346 2. 01 1. 91 1 . 7 1 - 2 . 2 8 139 1. 87 1. 87 1. 7 0 - 1. 94 76 2. 36 2. 28 1. 99- 2. 77Loom f ixers ( a ll men) 557 2. 45 2. 47 2 . 2 3 - 2 . 6 0 302 2. 43 2. 47 2. 2 5 - 2. 54 59 2. 89 2. 78 2. 6 2 - 3. 25Mend ers , c lo th ( 11 men and 1 ,223 women) ___________ 1,2 34 1. 85 1. 85 1 . 6 5- 2. 03 594 1. 81 1. 85 1. 6 5 - 1 . 90 57 1. 88 1. 81 1. 8 1 - 2. 03S p i n n e r s, f r a m e ___________________________________________ 2, 779 1. 92 1. 89 1. 7 8- 2. 08 1,2 40 1. 99 1. 97 1 . 8 4 - 2. 15 244 2. 13 2. 1 1 2. 00- 2. 14
Me n 591 1. 99 1. 96 1. 85- 2. 12 207 2. 04 2. 00 1. 8 2 - 2. 20 165 2. 12 2. 12 2. 03- 2. 12Wo men — _ ___ __ 2, 188 1. 90 1. 87 1. 77- 2. 05 1 ,033 1. 99 1. 97 1. 84- 2. 13 79 2. 14 2. 11 2. 00- 2. 23
Spinners , mule ( 124 men and 23 women) 147 2. 09 2. 07 1 . 8 5 - 2. 32 93 2. 09 2. 10 1. 87- 2. 30 40 2. 32 2. 25 1. 9 6 - 2 . 6 2W e a v e r s 4__________________________________________________ 1,909 2. 32 2. 32 2. 11 - 2. 55 950 2. 32 2. 33 2. 12- 2. 51 209 2 .6 9 2. 75 2. 37- 2. 96
M en „ _______________________________________________ 1, 370 2. 39 2. 38 2. 15- 2. 58 683 2. 35 2. 37 2. 17- 2. 56 183 2. 73 2. 77 2. 4 5 - 2. 98W o m e n 539 2. 16 2. 18 1 . 9 9 - 2 . 4 0 267 2. 22 2. 22 2. 05 - 2. 38 26 2. 42 2. 40 2. 15 - 2. 70
Box looms , autom atic________________________________ 1,579 2. 27 2. 28 2. 09- 2. 48 892 2. 31 2. 33 2. 11- 2. 50 - _ _ _ _
Me n 1, 108 2. 32 2. 31 2. 13- 2. 53 631 2. 34 2. 36 2. 16- 2. 54 _ _ _ _ _
W om en _______________________________________________ 471 2. 15 2. 17 2. 00- 2. 38 261 2. 22 2. 22 2. 0 5 - 2. 38 _ _ _ _ _
Box loom s , nonautomatic(140 m en an d 57 w om en )____________________________ 197 2. 50 2. 55 2. 3 0 - 2. 80 31 2. 45 2. 47 2. 13 - 2. 73 61 2. 80 2. 86 2. 5 6 - 3. 06
We avin g-m ach ine op er at or s______________________________ 49 2. 44 2. 43 2 . 1 0 - 2 . 7 1 41 2. 45 2. 45 2. 10 - 2. 72 - _ _ _ _
Me n ____________________________________________________— 34 2. 60 2. 50 2 . 3 9 - 2 . 9 9 29 2. 64 2. 52 2 . 40 - 3. 01 _ _ _ _ _
W om en ___________________________________________________ 15 2. 06 1. 96 1. 94- 2. 29 12 2. 00 - - - - _ _ _ _
W inde r s 4___________________ _________________ __________ 1,670 1. 76 1.76 1.61— 1. 86 594 1. 76 1. 72 1. 5 7 - 1. 86 248 1. 86 1. 80 1. 7 7 - 1. 94M en _____ ___________________________________________ 116 1. 77 1 .76 1. 7 5 - 1. 80 20 1. 80 1. 76 1. 7 5 - 1. 91 39 1. 77 1 .71 1. 7 1 - 1. 80W o m e n _________________ 1,554 1. 76 1. 76 1.61— 1. 86 574 1. 76 1. 70 1. 5 7 - 1. 86 209 1. 88 1. 83 1. 7 7 - 2. 00
Cone and tube autom atic
(12 me n and 144 wo m en )____________________________ 156 1. 86 1. 79 1. 6 7 - 2 . 04 107 1. 81 1. 75 1. 5 5 - 1 . 86 - - - - -Cone and tube , high speed, nonautomatic
( 18 men and 853 wom en) ___________________________ 871 1. 73 1.77 1. 62 - 1. 84 209 1. 73 1. 70 1. 5 7 - 1. 83 164 1. 81 1. 77 1. 7 7 - 1. 84Fi l l ing , automatic ( 64 men and 445 wom en)_______ 509 1. 78 1. 76 1 .61— 1. 89 232 1. 78 1. 76 1. 6 5 - 1. 92 34 1. 89 1. 86 1. 8 2 - 1. 89
S e l e c t ed w o r s t e d o c c u p a t i o n s
Dof f ers , spinning f rame 4 _____________________ __________ 327 1. 77 1.69 1. 5 7 - 1 . 96 90 1. 75 1. 71 1. 67- 1. 96 _ _ _ _ _
M e n ______ ______ 203 1. 87 1. 91 1. 57- 2. 06 25 1. 96 1. 96 1. 95— 1. 96 - _ _ _ -
W om en _______________________________________________ 124 1. 61 1. 53 1. 51- 1.71 65 1. 67 1. 71 1. 5 0 - 1. 74 _ _ _ _ _
A m er ic a n sy st e m ______________________________________ 311 1. 78 1.70 1 . 5 7 - 1. 96 88 1. 76 1 .71 1 . 6 9 - 1. 96 _ _ _ _ _
M en ____ ____________________________________________ 195 1. 88 1.95 1. 57- 2. 08 _ _ _ _ _ _ _ _ _ _
W om en _______________________________________________ 116 1.62 1. 53 1. 51 - 1. 71 63 1. 68 1 .71 1. 49 - 1. 85 _ _ _ _ _
D y e i n g - m a c h in e t e n d e r s , c l o th ( a l l m e n ) _____________21 1. 87 1. 90 1. 83- 1. 91 21 1. 87 1. 90 1. 83- 1. 91 _ _ _ _ _
Fu ller ten der s (all m en )___ _____________________________ 35 1. 91 1.83 1 . 8 3 - 1. 93 29 1. 92 1. 83 1. 8 3 - 2. 08 _ _ _ _ _
L o o m f i x e r s ( a l l m e n )___________________________________ 348 2. 50 2. 55 2 . 4 7 - 2. 55 114 2. 46 2. 49 2 . 3 8 - 2 . 5 0 _ _ _ _ _
M en der s, clot h (all w om en )_____________________________ 1,084 1. 78 1. 75 1 . 7 2 - 1. 8 5 334 1. 84 1. 82 1. 7 5 - 1. 90 - _ _ _ _
Pi n dr aft er o p e ra to rs ------------------------------------------------------- 397 1. 74 1.75 1. 59- 1. 85 113 1. 82 1. 75 1. 7 0 - 1. 95 - - - - -
M en ______________________________________________ ________ 124 1. 82 1. 78 1 .71— 1. 87 19 1. 83 1. 75 1. 6 5 - 1. 96 - - - - -
W o m e n_—_________________________________________ _____ 273 1. 71 1.67 1 . 5 5 - 1. 8 0 94 1. 81 1 .78 1 . 7 1 - 1.95 - “ -
See footnotes at end of table.
7/21/2019 bls_1551_1967.pdf
http://slidepdf.com/reader/full/bls15511967pdf 20/82
Table 6. Occupational Averages: All Mills---- Continued
( Number and average s tra ight- t ime hou r ly earnings 1 o f workers in se lecte d occupations in woo l yarn and broadwoven f abr ic m i l l s ,United Sta tes and se lected reg ion s , Novem ber 1966 )
Occupation and sex
United States 2 New England Middle Atlantic
Numberof
w o r k e r s
H ou rly earn in gs N um berof
w o r k e r s
Hourly earnings Numberof
w o r k e r s
Hourly earnings
Mean3 Median3Middlerange3
M ea n3 M ed ian 3Middlerange3
M ean 3 M ed ia n3Middlerange3
S e l e c t e d w o r s t e d o c c u p a t io n s — C o n ti n ue d
Spinners , f rame ( 94 men and 1 , 110 women) 4 ------------- 1, 204 $1. 77 $1. 77 $1. 59—$1. 96 480 $1. 86 $1 .89 $1. 70—$2. 06 _ _ _ _
A m er ic a n sy st em (94 m en and 783 wo m en )------------ 877 1. 78 1. 78 1 .53 - 1 .96 254 1. 90 1. 94 1. 8 1- 2. 06 - - _ _
B r a d f o r d s y s t e m ( a ll w o m e n )----- ---------------------------- 289 1.73 1.69 1.66— 1.97 188 1. 81 1 .69 1 .6 6 - 1 .99 - - _ _
W eav ers4 _ ______ . _________________________ _________ 798 2. 25 2. 27 2. 1 1 - 2. 40 253 2. 39 2. 44 2 . 20 - 2 .57 - - - -
M en __ _ -------- ----------------------------------------------------- 633 2. 29 2. 29 2. 13- 2. 42 209 2. 43 2. 48 2. 35- 2.58 _ _ _ _
W om en _______________________________________________ 165 2. 12 2. 17 2. 0 1 - 2.2 9 44 2. 18 2. 20 2. 02- 2. 29 _ _ _ _
B o x l o o m s , a u t o m a t i c . _____________________________ 627 2. 26 2. 27 2. 10 - 2 .42 200 2. 41 2. 50 2. 1 7 - 2.58 _ _ _ _
M en __________________________________________________ 519 2. 29 2. 29 2. 13 - 2. 43 180 2. 44 2. 50 2. 3 6 - 2. 59 _ _ _ _
W om en _______________________________________________ 108 2. 14 2. 13 2. 00- 2.29 20 2. 16 2. 02 2. 0 2 - 2.49 _ _ _ _
Winders ( 16 men and 1 ,496 women) 4__________________
1 ,512 1. 68 1.66 1. 53 - 1. 81 460 1. 74 1.71 1 .6 5 - 1 .82 - - - -Cone and tube , automatic
( 3 men and 341 women)----------------- ------------------------ 344 1. 80 1. 81 1.7 1- 1. 89 103 1. 75 1. 75 1. 6 6 - 1. 86 - - - -
Cone and tube , high speed, nonautomatic( 3 men and 882 women)_____________________________ 885 1. 64 1. 59 1. 50 - 1. 73 215 1. 76 1. 73 1 .6 3 - 1.85 - - - -
Fi l l ing , automatic ( 10 men and 148 women)---------- 158 1. 71 1.67 1 .6 5 - 1 .72 88 1. 68 1. 65 1. 65— 1.67 - -
Se lected woo len and wors ted occupations
Battery hands ---------------- ---------------------------- ---------------- 278 1.71 1. 73 1 .61 - 1 .79 216 1. 70 1. 74 1 .6 4 - 1 .78 _ _ _ _
Men __ _____ _____________________ ____________________ 105 1. 76 1. 75 1. 62 - 1. 88 69 1. 73 1. 74 1. 6 7 - 1. 81 _ - _ _
W o m e n . ---------- ----------------------------------------------------- 173 1. 68 1. 72 1 .6 1 - 1 .75 147 1.69 1. 74 1 . 6 1 - 1 . 7 6 _ _ _ _
J a n i t o r s ( e x c lu d i n g m a c h i n e r y c l e a n e r s ) --------------------- 283 1. 63 1. 58 1 .51 - 1 .72 56 1. 73 1 .72 1 .6 6 - 1 .82 26 $1. 88 $1. 94 $1. 72—$2. 08Men - ----------------- — — --------- ~ --------- 256 1. 63 1. 58 1. 5 2 - 1. 72 48 1. 74 1. 74 1. 6 8 - 1. 82 21 1. 93 1. 94 1. 85 - 2. 09
W o m e n _____ _____ _ ____ ___ — ----- ----------------- 27 1. 56 1. 52 1. 44—* 1.62 8 1. 64 - _ - _ _ _
Mach inis ts , ma intenance ( a ll m en ) . _________________ 128 2 .4 3 2. 36 2 . 28 - 2 .63 33 2. 32 2. 28 2. 1 5 - 2. 50 13 2. 96 - -
Tru cker s , hand ( inc luding bobb in boy s ) ___ __ ______ 1 ,097 1. 70 1. 65 1 .6 1 - 1.76 365 1. 75 1. 74 1 .6 5 - 1.86 74 2. 00 1. 83 1. 80 - 2. 18M en ___________________________ ___ __________________ 1 ,025 1. 70 1. 65 1 .6 1- 1. 77 324 1. 76 1. 75 1 .65 - 1 .86 74 2. 00 1. 83 1. 8 0- 2. 18W om en ______________________________________________ — 72 1. 65 1.62 1. 57 - 1.71 41 1. 68 1.66 1. 57 - 1. 83 - - -
See f oo tnotes a t end o f tab le .

7/21/2019 bls_1551_1967.pdf
http://slidepdf.com/reader/full/bls15511967pdf 21/82
Table 6. Occupational Averages: All Mills— Continued*
( Number and average s tra ight- t ime hour ly earnings 1 o f workers in se lected occupations in woo l yarn and broadwoven f abr ic m i l l s ,United States and select ed regio ns, Nove mbe r 1966)
Occupation and sex
Southeast 5 Great Lakes
Numberof
w o r k e r s
H ou rly earn in gs Nu m berof
w o r k e r s
Hourly earnings
Mean 3 Median 3Middlerange 3
M ean 3 M edian 3Middlerange 3
Se lected woo len occupations
C a r d f i n i s h e r s _____________________________________________ 339 $1.79 $1. 81 $1. 71—$1. 85 54 $1. 66 $1. 65 $1. 40—$1. 85M en ______________________________________________________ 339 1. 79 1. 81 1.71— 1. 85 44 1. 62 1. 55 1. 39— 1. 87W o m e n_______ ___________ ____________________ - - - - - _ _ - _ _
Card s tr ippers ( a l l men)_________________________________ 126 1. 76 1. 81 1. 7 2 - 1. 83 29 1. 75 1. 82 1. 5 5 - 1. 95Dof f ers , spinning f rame ( 332 men and 29 wom en) ----- 199 1. 74 1. 77 1. 64- 1. 84 30 1. 75 1. 79 1. 56- 1. 90Dye ing- m achine tenders , c lo th
( 215 men and 1 woman )_________________________________ - - - - - - - - - -
Dye ing- m achine tenders , yarn ( a l l men )______________ 29 1.60 1 .62 1 .6 2 - 1. 75 - - - - -
F u l l e r t e n d e r s ( a l l m e n ) _________________________________ - - - - - 25 2. 01 2. 20 1 .6 2 - 2. 21
L o o m f i x e r s ( a l l m e n ) ____________________________________ - - _ - _ 25 2. 40 2. 50 2 . 2 5 - 2 . 5 6Menders , c lo th ( 11 men and 1 ,223 wom en) ____________ - - - - _ 97 1. 72 1. 50 1. 4 6 - 1. 81S p i n n e r s , f r a m e ___________________________________________ 1,052 1.79 1. 80 1. 7 6 - 1. 85 129 1. 77 1. 76 1 .6 0 - 2. 05
M en ______________________________________________________ 200 1. 86 1. 85 1. 8 5 - 1. 85 9 1. 88 - _ _
W om en ___________________________________________________ 852 1.78 1. 79 1. 7 0 - 1. 85 120 1. 76 1.71 1. 6 0 - 2. 05
Spinners , mule ( 124 men and 23 wom en)______________ - - - - - - - - - -
W e ave r s 4___________________________________________________ - - - - - 106 1. 90 1. 72 1. 59— 2. 15M en _________________ ______________ _______ ___ ____ - - - - - 27 2. 62 2. 66 2 . 3 4 - 2 . 8 6Wom en __ __________________________ ___________________ - - - - - 79 1. 65 1 .67 1 . 4 2 - 1. 79
B o x l o o m s , a u t o m a t i c ________________________________________ - - - - - 54 1. 62 1. 68 1. 3 8 - 1. 81M en --------------------------------- ------------------------------------------------------------- - - - - - - _ _ _ _
W o m e n _______________________________________________ - - - - - 52 1.61 1. 63 1. 38- 1. 80B o x l o o m s , n o n a u t om a t i c
( 140 men and 57 wom en) ___________________________________ - - - - - 52 2. 18 2. 21 1. 67 - 2. 66W e a v i n g -m a c h i n e o p e r a t o r s --------------------------------------------------------- - - - - - - - - - -
M en ____________________________________________________________________ - - - - - - - - - -W nm*=>n - - - - - - - - - -
Winders 4_________________________________________________________________ 600 1. 73 1. 72 1.61— 1. 85 147 1. 64 1. 75 1. 3 8 - 1. 80Men .................................... . . ...............— — — — 54 1.77 1 .76 1. 7 6 - 1 . 7 6 - - - _ _
W om en _______________________________________________ 546 1. 72 1 .70 1.61— 1. 85 145 1.65 1. 75 1. 3 8 - 1. 80
Cone and tube, au toma tic( 12 men and 144 wom en) ------------------------------------------ - - - - - - - - - -
Cone and tube , high speed, nonautomatic( 18 men and 853 wom en) ------------------------------------------ 407 1 .71 1. 72 1. 5 6 - 1. 85 81 1.61 1. 80 1. 3 5 - 1. 80
Fi l l ing , automatic ( 64 men and 445 wom en)_______ 143 1.69 1. 76 1.61— 1. 76 37 1. 72 1. 67 1. 6 0 - 1. 85
S e l e c t ed w o r s t e d o c c u p a t i o n s
Do f f ers , spinning f rame 4________________________________ 224 1. 80 1. 65 1. 5 7 - 2. 04 - _ _ _ -
M en _________ _ ____________________________________ 178 1. 86 1. 72 1. 5 7 - 2. 09 - - - - -
W o m e n — ---------- --------------- --------------------------------------------------- 46 1 .55 1. 53 1. 5 3 - 1 . 5 3 _ _ _ _ _
A m er ic an sy st e m ___________ _______ ___ ____________ ____ 213 1. 80 1. 65 1. 57- 2. 06 - - - _ -
M en ______________-________________________________________________ 170 1. 87 1. 81 1. 57- 2. 11 - - - _ -
W o m e n _____ ___________________________________________________ 43 1. 55 1. 53 1. 5 3 - 1. 53 - - - _ -
D y e i n g - m a c h i n e t e n d e r s , c lo th ( a l l m en) _________________ - - - - - - - - - -
F u l l e r t e n d e r s ( a l l m e n ) ---------------------------------------------------------------- - - - - - - - - - -
L o o m f i x e r s ( a l l m e n ) ---------------------------------------------------------------------- - - - - - - - - - -
M e n d e r s , c lo th ( a l l women) ---------------------------------------------------------- - - - - - - - - - -
P i n d r a f t e r o p e r a t o r s ---------------------------------------------------------------------- 256 1. 74 1. 72 1. 55- 1. 85 - - - - -
M en ____________________________________________________________________ 105 1. 82 1. 78 1. 7 2 - 1. 87 - - - - -
W o m e n ------------------------------------ ------------------------------ -----------------------. ------151 1. 68 1. 60 1. 5 5 - 1. 80 " - -
See footnote s at end of table
7/21/2019 bls_1551_1967.pdf
http://slidepdf.com/reader/full/bls15511967pdf 22/82
Table 6. Occupation al Averages : All Mills---- Continued
( Number and average s tra ight- t ime hour ly earnings 1 o f workers in se lected occupations in woo l yarn and broadwoven f abr ic m i l l s ,United Sta tes and se lected reg ions , Novem ber 1966 )
Occupation and sex
Southeas t5 Great Lakes
Numberof
w o r k e r s
Hourly earnings Numberof
w o r k e r s
Hourly earnings
Mean 123 Median 3Middlerange 3
M ean 3 M edian 3Middlerange 3
S e l e c t e d w o r s t e d o c c u p a t i o n s— C o n ti n u ed
Spinn ers, fram e (94 men and 1, 110 wom en)45. ------------- 6 34 $1. 73 $1. 68 $1. 5 3—$1. 93 _ _ _ _
A m er ic a n sy st em (94 m en and 783 wo m en )------------ 578 1. 73 1. 68 1. 5 3 - 1. 94 - _ - _ _
B r a d f o r d s y s t e m ( a ll w o m e n ) ------------------------------------ - - - - - - - - - -W e a v e r s 4„ ________ _____________________________________ - - - - - - - - - -
M en ____ __ _______________________________________ - - - - - - - - - -
W om en _______________________________________________ - - - - - - - - - -
B o x l o o m s , a u t o m a t i c ____ __________________________ - - - - - - - - - -
M en __________________________________________________ - - - - - - - - - -W om en _______________________________________________ - - - - - _ _ . _ _
Winders ( 16 men and 1 ,496 wom en) 4 ---------------------------- 955 1 .67 1. 65 1. 5 0 - 1. 81 _ _ _
Cone and tube , auto matic(3 men and 341 women)_____________________________ - - - - - _ _
Cone and tube , high speed, nonautomatic( 3 men and 882 women )_____________________________ 623 1.60 1. 55 1. 5 0 - 1. 67
Fillin g, autom atic (10 men and 148 wom en)_______ 64 1. 74 1. 72 1. 7 0 - 1. 81
Se lected woo len and wors ted occupations
B a t t e r y h a n d s___ __________________ ________________________ - - _ _ _ _ _ _ _
M en ______________________________________________________ - - - - - - - _ _
W o m e n __________________________________________________ - - - - - - _ _ _
Jani tors ( exc luding machinery c leaners ) --------------------- 178 1. 55 1. 55 1. 50- 1. 58 11 $1. 70 _ _ -
M en _____________________________________;________________ 167 1. 55 1. 56 1. 5 0 - 1. 58 9 1. 76 _ _ _
W o m e n __________________________________________________ 11 1.49 - - - _ _ _ _ _
Mach inis ts , ma intenance ( a ll m en) ____________________ 69 2. 35 2. 32 2 . 29 - 2. 55 _ _ _ _ _
Tr uc ke rs, hand ( including bob bin bo ys )_______________ 598 1. 62 1. 62 1. 5 7 - 1 .6 4 _ _ _ _ _
M en ______________________________________________________ 568 1 .62 1. 62 1. 58- 1. 65 _ _ _ _ _
W o m e n__________________________________________________ 30 1.61 1. 62 1. 5 7 - 1. 64 - - - -
1 Exc lude s premium p ay f or overt ime and f or work on weekends , h o l idays , and la te shi fts .2 Inc ludes da ta f or reg ions in addi t ion to those shown separate ly .3 The mean i s computed f or each job by to ta l ing the earnings o f a l lwor kers and dividing by the numb er ofwork ers . The median des ignatespos i t ion— one- ha l f o f the employees
surveyed rece ive d the ra te shown or m ore ; one - h a l f rece ived the ra te shown or les s . The middle range is de fined by 2 ra tes o f pay ; one - f ourth o f the workers earned the lower o f thesera tes or l es s and one - f ourth earned the higher ra te or more . Middle ranges are omitted f or occupations that had fewer than 15 employees in a reg ion.
4 Inc ludes da ta f or work ers in this c lass i f ica t ion in addit ion to those shown separate ly .
5 Data are not presented separate ly f or occupations assoc ia ted with weaving opera t ions s inceinf ormation was ob ta ined f rom too few o f the la rge integra ted m i l l s .
NOT E: Dashes ind icate no data reported or data that do. not meet publication crite ria.

7/21/2019 bls_1551_1967.pdf
http://slidepdf.com/reader/full/bls15511967pdf 23/82
Table 7. Occupational Averages: Yarn Mills
( Number and average s tra ight- t im e hour ly earnings 1 o f work ers inse lected occupations in woo l yarn mi l l s , Uni ted States and
se lected reg ions , November 1966 )
Occupation and sex
United Sta tes2 New England M iddle A tlantic Southeast
N u m b e rof
w o r k e r s
A ve ra gehourly
earnings
Numberof
w o r k e r s
Av er ag ehourly
earnings
Numberof
w o r k e r s
Av er ag ehourly
earnings
Numberof
w o r k e r s
Av er ag ehourly
earnings
Se lected woo len occupations
Me n
C a r d f i n i s h e r s ------------------------------- 513 $ 1. 87 139 $ 1 .87 127 $ 2 . 05 225 $ 1 . 7 9
Card s tr ippers—----------------------------
196 1.87 63 1 .83 51 2. 11 70 1 .75D o f f e r s , s p in n i n g f r a m e ------------- 222 1 .75 - - 33 1.95 133 1.74D y e i n g - m a c h i n e t e n d e r s , y a r n — 33 1 .62 - - - - 29 1. 60S p i n n e r s, f r a m e --------------------------- 210 2. 09 67 2. 07 137 2. 11 - -Sp in ne rs , mu le ------------------------------ 57 2. 22 22 2. 05 - - - -
Women
S p i n n e r s , f r a m e --------------------------- 1, 115 1.84 342 1.96 43 2. 02 663 1 .77Wind ers 3 --------------------------------------- 894 1 .74 189 1.71 161 1 .84 441 1.73
Cone and tube, high sp eed,n o n a u to m a t ic -------------------------- 7 77 1 . 72 149 1.73 144 1.81 407 1 .71
S e l e c t ed w o r s t e d o c c u p a t io n s
Me n
Do f f ers , spinning f rame, A m er ic an sy st e m ----------------------- 104 1 .70 - - - - 79 1.62
P i n d r a f t e r o p e r a t o r s ----------------- 40 1.73 17 1 .78 - - 23 1 .70
W o m e n
Do f f ers , spinning f rame 3 ---------- 119 1.61 65 1.67 - - 41 1. 53 A m er ic an sy st em -------------------- 111 1.61 63 1.68 - - 38 1. 53
P i n d r a f t e r o p e r a t o r s ----------------- 214 1. 66 85 1.79 - - 101 1.60Sp in ne rs , fr am e 3-------------------------- 733 1 .6 5 307 1 .77 ' - - 340 1. 58
A m er ic a n sy st em -------------------- 546 1. 66 167 1.83 - - 338 1. 58B r a d f o r d s y s t e m -------------------- 149 1 .56 102 1 .64 - - - -
W in de rs 3 ---------------------------------------- 963 1 .62 347 1 .74 - - 529 1.55Cone and tube , au tom atic ----- 96 1.76 91 1.77 - - - -
Cone and tube, high sp eed,no na ut om at ic-------------------------- 762 1.61 202 1.74 - 513 1 .56
Se lected woo len and wors tedoccupations
Me n
Janitors ( exc luding machineryc l e a n e r s )-------------------------------------- 77 1 .5 6 6 1.75 7 1.81 62 1.50
M a c h i n i s t s , m a i n t en a n c e ------------ 42 2 .48 6 2. 32 - - 21 2. 38
Tru ckers , hand (inc luding bob bin b o ys )--------------------------------- 389 1.67 112 1.71 34 1.89 194 1.58
W o m e n
Tru ckers , hand ( inc luding bobb in g i r l s ) -------------------------------- 27 1 .6 0 15 1 .62 “ "
1 Excludes prem ium pay f or overt ime and f or work on weekends , ho l idays , and la te shi fts .2 Inc ludes da ta f or reg ions in addi t ion to those shown separate ly .3 Inc ludes da ta f or work ers in this c lass i f i ca t ion in addi t ion to those shown separate ly .
NOTE: Dashes indica te no da ta reported o r da ta that do not meet pub l i ca t ion cr i ter ia .
Table 8. Occupational Averages: Weaving Mills 0)
( Number and average s tra ight- t ime hour ly earnings 1 o f workersin se lected occupations in woo l weaving mi l l s ,United States and New England, N ovem ber 1966)
United States 3 New England
Occupation2 and sex Numberof
w o r k e r s
Av er ag ehourly
earnings
Numberof
w o r k e r s
Av er ag ehourly
earnings
Me n
F u l l e r t e n d e r s ------------------------ 13 $2. 03 13 $2. 03
L o o m f i x e r s----------------------------
113 2. 43 88 2 .48Weavers 4 -------------------------------- 241 2. 36 191 2 .45
B o x l oo m s , a u t o m a t i c----- 217 2. 36 170 2 .44
Women
M en de rs, cl ot h ----------------------- 371 1 .84 298 1 .86Weavers 4 -------------------------------- 43 2. 01 19 2. 14
B o x lo o m s , a u t o m a t i c ----- 28 2. 14 19 2. 14Winders 4 -------------------------------- 116 1.71 106 1.71
Fi llin g, au tom atic ------------ 94 1 .68 88 1. 68
1 E x cl ud es p re m iu m pa y f or o v er ti m e an d f or w or k on we ek en d s,holid ays, and late shifts.
Al l oc cu pa ti on s sho wn w er e in w or st ed op er at io ns .3 Inc ludes da ta f or reg ions in addi t ion to New England.4 Inc ludes da ta f or workers in this c lass i f i ca t ion in addi t ion to
those shown separate ly .
NOT E: Dashe s indicate no data report ed or data that do notmeet pub l i ca t ion cr i ter ia .
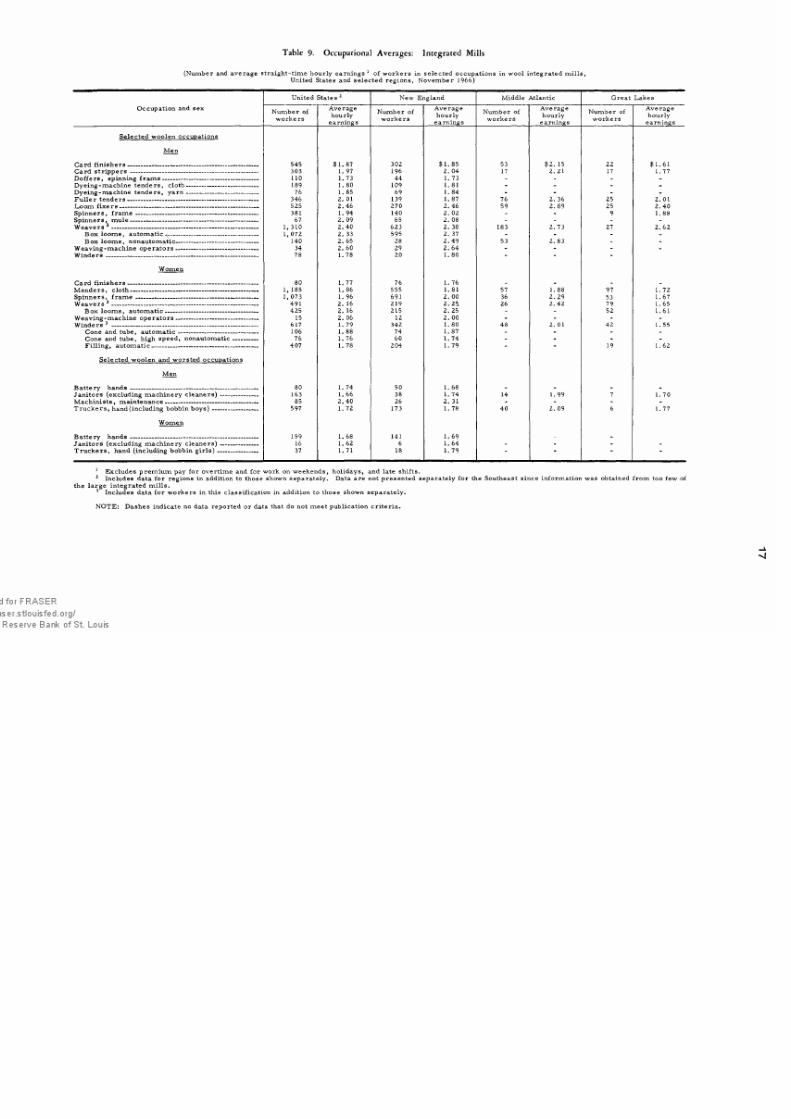
7/21/2019 bls_1551_1967.pdf
http://slidepdf.com/reader/full/bls15511967pdf 24/82
Table 9. Occupational Averages: Integrated Mills
( Number and average s tra ight- t ime hour ly earnings 1 o f workers in se lected occupations in woo l integra ted mi l l s ,United Sta tes and se lected re g ions , Novem ber 1966 )
Occupation and sex
United States 12 New England M idd le A tlan tic G reat L akes
Number o fw o r k e r s
A ve ra gehourly
earnings
Number o fw o r k e r s
A ve ra gehourly
earnings
Number o fw o r k e r s
A ve ra gehourly
earnings
Number o fw o r k e r s
A ve ra gehourly
earnings
Se lected woo len occupations
Me n
Ca rd fi n is h e rs -------------------------------------------------------------------- 545 $ 1. 87 302 $ 1 .8 5 53 $2 . 15 22 $ 1 . 6 1Card s tr ippers ------------------------------------------------------------------ 303 1. 97 196 2. 04 17 2. 21 17 1. 77D of fe rs , spi nn ing f ra m e-------------------------------------------------- 110 1. 73 44 1. 73 - - - -
D y e i n g - m a c h i n e t e n d e r s , c l o t h ------------------------------------- 189 1. 80 109 1. 81 - - - -
D y e i n g - m a c h i n e te n d e r s , y a r n ------------------------------------- 76 1. 85 69 1. 84 - - - -
F u ll er te n d e rs -------------------------------------------------------------------- 346 2. 01 139 1 .87 76 2. 36 25 2. 01
L o o m f i x e r s ----------------------------------------------------------
-------------
525 2 .4 6 270 2. 46 59 2. 89 25 2. 40S p i nn e r s, f r a m e ----------------------------------------------- ---------------- 381 1. 94 140 2. 02 - - 9 1. 88S p i n n e r s , m u l e ------ ------------------ --------------- ---------------------- 67 2. 09 65 2. 08 - - - -W ea ve rs 3 ---------------------------------------------------------------------------- 1, 310 2. 40 623 2. 38 183 2 .73 27 2. 62
B ox l oo m s, au to m ati c ---------------------------------------------- 1, 072 2. 33 595 2. 37 - - - -
B ox loo m s, no na ut om ati c------------------------------------------- 140 2. 65 28 2. 49 53 2. 83 - -
W e a v i n g - m a c h i n e o p e r a t o r s ----------------------------- ------------- 34 2. 60 29 2. 64 - - - -
W in de rs — --------------------------------------------------------------------------- 78 1. 78 20 1. 80 -
W o m e n
C ar d fi n is h e r s-------------------------------------------------------------------- 80 1. 77 76 1 .76 _ _ _ _
M e n d e r s , c l o t h ------------------------------------------------------------------ 1, 185 1. 86 555 1. 81 57 1. 88 97 1. 72S p i nn e r s, f r a m e ----------------------------------------------- --------------- 1, 073 1. 96 691 2. 00 36 2. 29 53 1. 67W ea ve rs 3 ---------------------------------------------------------------------------- 491 2. 16 219 2. 25 26 2. 42 79 1. 65
B o x l o o m s , a u t o m a t i c --------------------------------- -------------- 425 2. 16 215 2. 25 - - 52 1.61W eav ing -m ach ine op er at or s------------------------------------------- 15 2. 06 12 2. 00 - - - -
W in de rs 3 ---------------------------------------------------------------------------- 617 1. 79 342 1.80 48 2. 01 42 1.55Cone and tube , aut om atic ----------------------------------------- 106 1.88 74 1. 87 - - - -
Cone and tube , high speed, n onautom atic------------- 76 1 .76 60 1 .74 - - - -
F i l l i n g , a u t o m a t i c ------------------------------------------------------- 407 1. 78 204 1. 79 " 19 1. 62
Se lected woo len and wors ted occupations
Me n
Ba tte ry h an d s------------------------------ ------- ---------------------- 80 1. 74 50 1. 68 _ _ _ _
Jan itors (excludin g m achin ery c lea n er s)- - -- -- -- -- -- -- -- -- -- 163 1.66 38 1. 74 14 1.99 7 1.70M a c h i n i s t s , m a i n t e n a n c e ------------------------------------------------ 85 2 .40 26 2. 31 - - - -
T r u c k e r s , ha n d ( in c l u d in g b o bb i n b o y s ) --- -- --- -- -- ---- -- -- ---- 5 97 1.72 173 1. 78 40 2. 09 6 1. 77
W o m e n
B a t t e r y h a n d s ------------------------------------------------------------------ 159 1. 68 141 1. 69 _ _
J a n i t o r s ( e xc l u d in g m a c h i n e r y c l e a n e r s ) ------- ----------- 16 1.62 6 1. 64 - - -
T r u c k e r s , h a nd ( i n cl u d i n g bo b b in g i r l s ) --------------------- 37 1. 71 18 1.79 “
1 Excludes prem ium pay f or overt ime and for work on weekends , ho l idays , and la te shi f ts .2 Inc ludes da ta f or reg ions in addi t ion to those shown separate ly . Data are not presented separate ly f or the Southeast s ince inf ormation was ob ta ined f rom too f ew o f
the la rge integra ted mi l l s .3 Inc ludes da ta f or worke rs in this c lass i f i ca t ion in addi tion to those shown separate ly .
NOTE: Dashes indica te no da ta reported or da ta that do not meet pub l i ca t ion cr i te r ia .
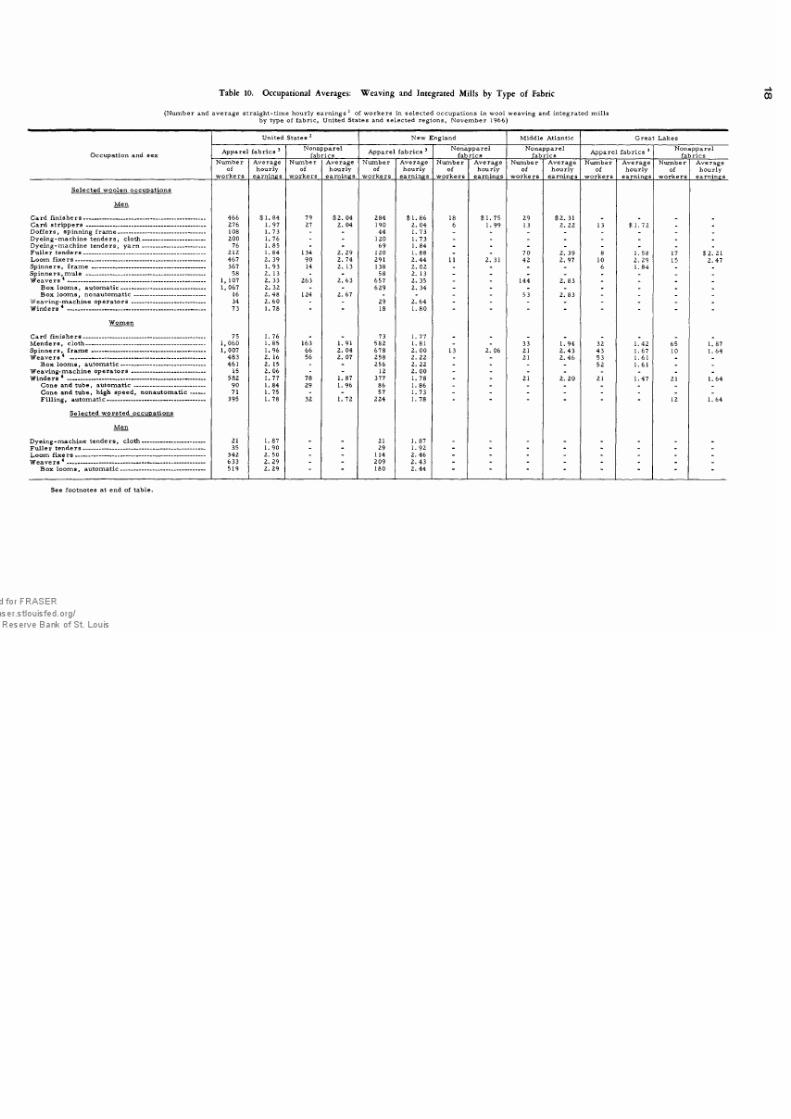
7/21/2019 bls_1551_1967.pdf
http://slidepdf.com/reader/full/bls15511967pdf 25/82
Table 10. Occupational Averages: Weavin g and Integrated Mills by Type of Fabric 00
( Number and average s tra ight- t ime hour ly earnings 1 o f workers in se lected occupations in woo l weaving and integra ted mi l l sby type o f f abr i c , United Sta tes and se lected reg ions , Novem ber 1966 )
Occupation and sex
United States 2 N ew England M idd le A tlantic Great Lakes
Ap pa re l fa b ri cs 3Nonappare l
f abr i cs A pp ar el fa b ri cs 3
Nonappare lf abr i cs
Nonappare lf abr i cs
A pp ar el fa b ri cs 3Nonappare l
f abr i csN u m b e r
of w o r k e r s
Av er ag ehourly
earnings
Numbe rof
w o r k e r s
A ve ra gehourly
earnings
Numberof
w o r k e r s
A ve ra gehourly
earnings
Numberof
w o r k e r s
A ve ra gehourly
earnings
Numberof
w o r k e r s
A ve ra gehourly
earnings
Numberof
w o r k e r s
A ve ra gehourly
earnings
Numberof
w o r k e r s
Av er ag ehourly
earnings
Se lected woo len occupations
Me n
C a r d f i n i s h e r s --------------------------------------------------------------- 466 $ 1 .84 79 $2. 04 284 $ 1.86 18 $ 1. 75 29 $2. 31 _ _ _ _
Car d str ip p er s-------------------------------------------------------------- 276 1.97 27 2. 04 190 2. 04 6 1. 99 13 2. 22 13 $ 1. 72 _ _
D offe rs, spinn ing fra m e______________________________ 108 1 .73 - - 44 1. 73 - - - - - - _ _
Dy ein g-m ach ine ten de rs, clo th --------------------------------- 200 1. 76 - - 120 1.73 _ _ _ _ _ _ _ _
Dye ing- m achine tenders , ya rn - -- -- -- -- -- -- -- -- -- -- -- -- -- -- -- -- 76 1.85 - - 69 1 .84 - - _ - _ _ _ _
F u l l e r t e n d e r s -- -- -- -- -- -- --- -- -- ---- -- -- ---- -- --- -- -- ---- -- -- ---- -- --- -- -- -- 2 12 1 . 8 4 1 34 2. 29 120 1. 88 - - 70 2. 39 8 1. 58 17 $2 . 21L o o m f i x e r s ------------------------------------------------------------------- 467 2. 39 90 2. 74 291 2. 44 11 2. 31 42 2. 97 10 2. 29 15 2. 47S p i n n e r s, f r a m e ---------- ------------------------------------------------ 367 1. 93 14 2. 13 138 2. 02 - - - _ 6 1. 84 - _
Sp inn ers ,m ule -------------------------------------------------------------- 58 2. 13 - - 58 2. 13 - - - _ - _ _ _
W e a v e r s 4 ----------------------------------------------------------------------- 1, 107 2. 33 263 2. 63 657 2. 35 _ - 144 2. 83 _ _ _ _
Bo x loo m s, au tom ati c-------------------------------------------- 1,067 2. 32 - - 629 2. 34 _ - _ _ _ _ _ _
Bo x loo m s, no na ut om ati c------------------------------------- 16 2. 48 124 2. 67 - - - - 53 2. 83 - _ _ _
W e a v i n g - m a c h i n e o p e r a t o r s -------------------------------------- 34 2. 60 - - 29 2. 64 - - - - - - - -
Win ders 4 - -- -- -- -- -- -- -- -- -- -- -- -- -- -- -- -- -- -- -- -- -- -- -- -- -- -- -- -- -- -- -- -- -- -- -- - 73 1.78 - 18 1 .8 0 - - - “ - - -
W o m e n
C a r d f i n i s h e r s --------------------------------------------------------------- 75 1. 76 _ _ 73 1. 77 _ _ _ _ _ _ _
M en de rs , cl ot h --------------------------,.---------------------------------- 1, 060 1. 85 163 1.91 582 1.81 - - 33 1. 94 32 1 .42 65 1. 87Sp inn ers, fr a m e ----------------------------------------------------------- 1, 007 1 .96 66 2. 04 678 2. 00 13 2. 06 21 2. 43 43 1.67 10 1. 64W e a v e r s 4 ----------------------------------------------------------------------------------------- 483 2. 16 56 2. 07 258 2. 22 - - 21 2. 46 53 1 . 61 - _
B o x lo o m s , a u t o m a t i c -------------------------------------------------------- 461 2. 15 - - 256 2. 22 - - - _ 52 1 . 61 _ _
W e a v i n g - m a c h i n e o p e r a t o r s ------------------------------------------------- 15 2. 06 - - 12 2. 00 - - - - - - - -
Winders 4 ------------------------------------------------------------------------------------------- 582 1 .77 78 1 .87 377 1. 78 - - 21 2. 20 21 1 .47 21 1. 64Cone and tube , aut om atic ----------------------------------------------- 90 1.84 29 1 .96 86 1.86 _ - - _ _ _ _ _
Cone and tube , high speed, n onau tom atic ---------- 71 1. 75 - - 57 1.73 - - - - - - - -
F i l l i n g , a u t o m a t i c ----------------------------------------------------------------- 395 1. 78 32 1.72 224 1. 78 - - - 12 1. 64
Se lected wors ted occupations
M en
D y e i n g - m a c h i n e t e n d e r s , c l o t h ------------------------------------------ 21 1. 87 _ _ 21 1 .87 _ _ _ _ _ _ _ _
F u l l e r t e n d e r s --------------------------------------------------------------------------------35 1.90 - - 29 1.92 - - - - - - - -
L o o m f i x e r s -------------------------------------------------------------------------------------- 342 2. 50 - - 114 2. 46 - - - - - - - _
W e a v e r s 4 ------------------------------------------------------------------------------------------- 633 2. 29 - - 209 2. 43 - - - - - - - _
B o x l o o m s , a u t o m a t i c -------------------------------------------------------- 519 2. 29 " " 180 2 .4 4 _ " • “ -
See footnotes at end of table,
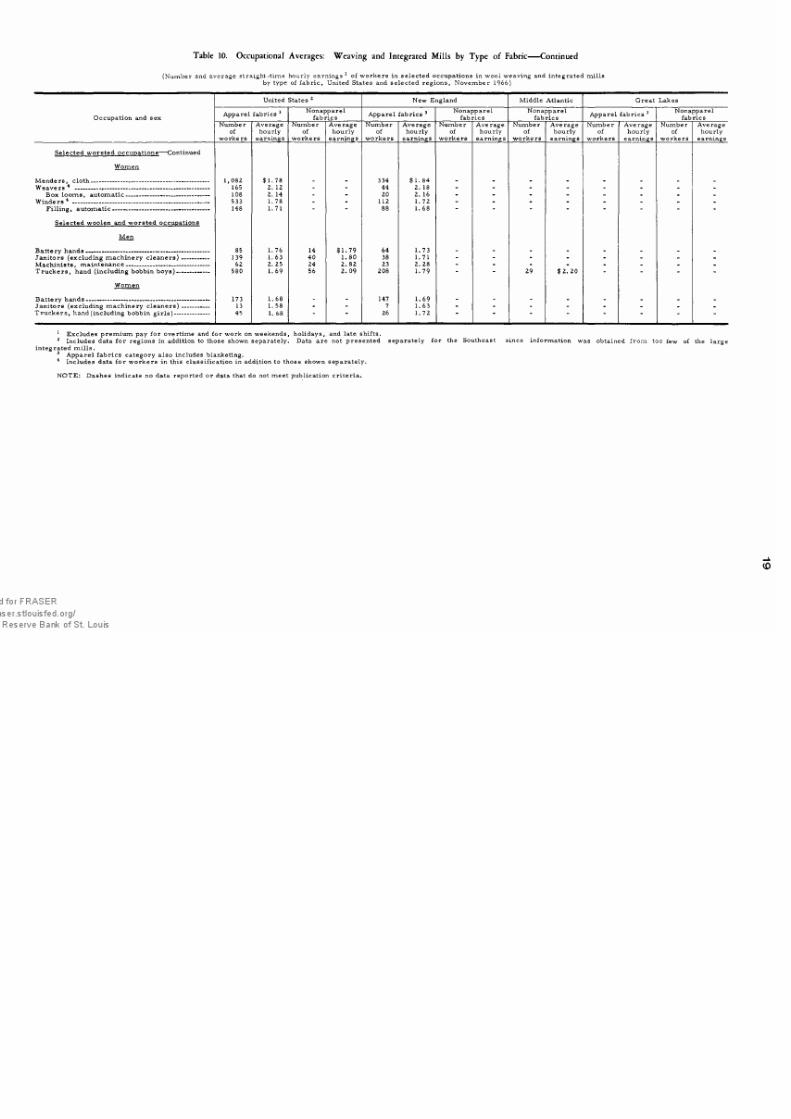
7/21/2019 bls_1551_1967.pdf
http://slidepdf.com/reader/full/bls15511967pdf 26/82
Table 10. Occupational Averages: Wea ving and Integrate d Mills by Type of Fabric-----Continued
( Number and average s tra ight- t ime hour ly earnin gs1 o f workers in se lected occupations in woo l weaving and integra ted mi l l sby type of fabr ic, United States and selec ted reg ions, Nov emb er 1966)
United States 12 New England Middle At la nt ic G r ea t L a ke s
Occupation and sex Ap pa re l fa br ic s 3
Nonappare lfab rics
A pp ar el fa b ri cs 3Nonappare l
fab ricsNonappare l
f abr i cs Ap pa re l fa b ri cs 3
Nonappare lf abr ics
Numberof
w o r k e r s
Av er ag ehourly
earnings
Numberof
w o r k e r s
A ve ra gehourly
earnings
Numberof
w o r k e r s
A ve ra gehourly
earnings
Numb e rof
w o r k e r s
A ve ra gehourly
earnings
Numberof
w o r k e r s
A ve ra gehourly
earnings
Numberof
w o r k e r s
Av er ag ehourly
earnings
Numberof
workers
Av e ra gehourly
earnings
S e l e c t e d w o r s t e d o c c u p a t i on s — C o nt i nu e d
W o m e n
M e n d e r s , c l o t h -------------- --------------- ---------------- ---------------- 1 ,082 $ 1 .7 8 . _ 334 $ 1 .8 4 _ _ _ _ _ _ _
W e a v e r s 4 ------------- ................................................................... 165 2. 12 - - 44 2. 18 - - - - - - - -
B o x l o o m s , a u t o m a t i c ------------------------------------------- 108 2. 14 - - 20 2. 16 - - - - - - - -
W ind ers 4 ----------------------------------------------------------------------- 533 1.78 - - 112 1 .72 - - - - - - - -
F i l l in g , a u t o m a t i c --------------------------------------------------
Selected woo len and wors ted occupations
Me n
148 1.71 88 1.68
B a t t e ry h a n d s --------------------------------------------------------------------------------- 85 1. 76 14 $1 .79 64 1.73 _ _ _ _ _ _ _
J a n i t o rs ( e x c l u d in g m a c h i n e r y c l e a n e r s ) ------------------ 139 1. 63 40 1 .80 38 1 .71 - - - - - - - -
M a c h i n i s t s , m a i n t e n a n c e ------------------------------------------------------- 62 2. 25 24 2. 82 23 2. 28 - - - - - - - -
Tru ckers , hand ( inc luding bobb in bo ys ) --------------------- 580 1.69 56 2. 09 208 1.79 - 29 $2. 20 - “ ' -
W o m e n
B a t t e r y h a n d s --------------------------------------------------------------------------------- 173 1.68 . _ 147 1.69 _ _ _ _ _ _ _ _
J a n i t o r s ( e x c l u d i n g m a c h i n e r y c l e a n e r s ) ------------------ 13 1. 58 - - 7 1 .63 - - - - - - - -
Tru ckers , hand ( inc luding bobb in g i r l s ) ----------------------- 45 1 . 68 " “ 26 1 .72 " " _ ” "
1 Excludes prem ium pay f or overt ime and f or work on weekends , ho l idays , and la te shif ts .2 Inc ludes da ta f or reg ions in addi t ion to those shown separate ly . Data are not presented separate ly f or the Southeast s ince inf ormation was ob ta ined f rom too f ew o f the la rge
integra ted m i l l s .3 A p p a r e l f a b r i c s c a t e g o r y a l s o i n c l u de s b l an k e ti n g.4 Inc ludes da ta f or wo rkers in this c lass i f i ca t ion in addi t ion to those shown separate ly .
NOTE: Dashes indica te no da ta reported or da ta that do not meet pub l i ca t ion cr i te r ia .

7/21/2019 bls_1551_1967.pdf
http://slidepdf.com/reader/full/bls15511967pdf 27/82
Table 11. Occupational Averages: All Mills by Size of Community N>
o
( Number and average s tra ight- t ime hour ly earnings 1 o f workers in se lected occupations in woo l yarn and broadwoven f abr ic m i l l sby s ize o f community , United States and se lected reg ion s , Novem ber 1966 )
United States 2 New England M i d d le A t la n t ic
Occupation and sexMetropo l i tan
areasNonmetropo l i tan
areasMetropo l i tan
areasNonmetropo l i tan
areasMetropo l i tan
areasNumber
of w o r k e r s
Av er ag ehourly
earnings
N u m b e r
of w o r k e r s
A ve ra gehourly
earnings
Number
of w o r k e r s
A ve ra gehourly
earnings
Number
of w o r k e r s
A ve ra gehourly
earnings
Numberof
w o r k e r s
Av er ag ehourly
earnings
Se lected woo len occupations
M en
C a r d f i n i s h e r s---------------------------------------------------------
337 $2. 00721
$ 1 .8 1 73$2. 13
368 $ 1 .8 1154
$2. 09Ca rd st r ip p e rs -------------------------------------------------------- 135 2. 03 364 1 .90 40 2. 16 219 1.96 55 2. 13D o f f e r s , s p in n i ng f r a m e --------------------------------------- 97 1. 87 235 1. 69 - - 70 1. 64 34 1 .94Dy ein g-m ach ine ten der s, c lo th --------------------------- 69 1. 94 146 1 .70 22 1 .98 107 1.71 - -
F u l l e r t e n d e r s --------------------------------------------------------- 125 2. 30 221 1. 85 13 2. 10 126 1 .84 76 2. 36
L o o m f i x e r s ------------------------------------------------------------- 165 2. 71 392 2. 34 40 2. 64 262 2 .4 0 59 2. 89S p i n n e r s, f r a m e ----------------------------------------------------- 202 2. 11 389 1.93 39 2. 09 168 2. 02 150 2. 13W e a v e r s 3 ----------------------------------------------------------------- 414 2. 59 956 2. 30 75 2. 53 608 2. 33 183 2. 73
Box loo m s , autom atic - -- -- -- -- -- -- -- -- -- -- -- -- -- -- -- -- -- -- - 210 2. 46 898 2. 29 32 2 .53 599 2. 33 - -
W o m e n
M e n d e r s , c l o t h - -- -- ---- -- -- -- -- -- --- -- -- ---- -- -- ---- -- --- -- -- ---- -- -- - 3 12 1 . 8 6 911 1.86 61 1 .96 532 1 .80 57 1.88Sp in ne rs , fr a m e ----------------------------------------------------- 505 1 .97 1, 683 1.88 170 2. 12 863 1. 96 61 2. 19W e a v e r s 3 ----------------------------------------------------------------- 106 2. 26 433 2. 13 8 2. 18 259 2. 22 26 2. 42
B o x lo o m s , a u t o m a t i c -------------------------------------- 47 2. 33 424 2. 13 6 2. 06 255 2. 22 - -
W i n d e r s 3 ___________________________________________ 548 1. 79 1, 006 1.74 131 1.74 443 1.’76 190 1.87C on e a nd t ub e, h ig h s p ee d , n o na u to m at ic — 3 74 1. 73 479 1. 72 95 1 .75 114 1.72 127 1.79Fi lli ng , au to m at ic--------------------------------------------- 131 1. 86 314 1 .74 32 1 .72 192 1.79 33 1.88
Se lected wors ted occupations
Me n
L o o m f i x e r s ---------------------------------------------- ------------ 133 2. 51 215 2 .49 92 2 .49 22 2. 37 - -
P i n d r a ft e r o p e r a t o r s ------------------------------------------- 44 1 .78 80 1 .84 13 1 .8 6 - - - -
W e a v e r s 3 ----------------------------------------------------------------- 216 2. 40 417 2. 23 154 2. 51 55 2. 22 - -
B ox lo om s, a ut om at ic -------------------------------------- 189 2 .42 330 2. 21 130 2. 55 50 2. 17 - -
W o m e n
D o f f e r s , s p in n i ng f r a m e --------------------------------------- 62 1. 64 62 1 .58 51 1 .67 - - - -
A m er ic a n sy st em ---------------------------------------------- 57 1. 65 59 1.58 49 1. 67 - - - -
Me nd ers, clot h-- -- -- -- -- -- -- -- -- -- -- -- -- -- -- -- -- -- -- -- -- -- -- -- -- -- -- -- 395 1. 83 689 1.75 236 1 .88 98 1. 74 - -
P i n d r a f t e r o p e r a t o r s ------------------------------------------- 106 1. 74 167 1.69 77 1 .82 - - - -S p i n n er s , f r a m e ----------------------------------------------------- 538 1 .75 572 1 .74 362 1 .82 39 1. 89 - -
A m er ic an sy st em --------------------------------------------- 213 1. 76 570 1.74 136 1.82 39 1.89 - -
W i n d e r s 3 ----------------------------------------------------------------- 544 1.72 952 1 .66 416 1 .75 43 1.63 - -
Con e and tub e, a u to m at ic ------------------------------- 106 1.75 235 1. 82 85 1 .76 18 1.71 _ _
C on e a nd t ub e, hi gh s p ee d , n o na ut om a ti c— 255 1.74 627 1 .60 208 1.76 - - - -
Fi lli ng , au to m at ic--------------------------------------------- 89 1 .69 59 1 .74 77 1.69 - - - -
Se lected woo len and wors ted occupations
Me n
Battery hands --------------------------------------------------------- 44 1. 91 61 1.64 29 1 .85 40 1 .64 _ _
J a n i t or s ( e x c lu d i n g m a c h i n e r y c l e a n e r s ) --------- 66 1 .77 190 1.59 17 1 .78 31 1.72 19 1.92M ac hi ni st s, m ai nt en an ce -------------------------------------- 32 2. 66 96 2. 36 9 2 .41 24 2. 29 13 2. 96Tru ckers , hand ( inc luding bobb in bo ys ) ----------- 203 1. 82 822 1. 67 106 1 .78 218 1.75 55 2. 04
See footnotes at end of table,

7/21/2019 bls_1551_1967.pdf
http://slidepdf.com/reader/full/bls15511967pdf 28/82
Table 11. Occup ational Averages: All Mills by Size of Community— Continued
( Number and average s tra ight- t ime hour ly earn ings1 o f workers in se lected occupations in woo l yarn and broadwoven f abr ic m i l l sby s ize o f community , United Sta tes and se lected reg ions , Novem ber 1966 )
Occupation and sex
Southeas t4 Great Lakes
Metropo l i tanareas
Nonmetropo l i tanareas
Metropo l i tanareas
Nonmetropo l i tanareas
Numberof
w o r k e r s
A ve ra gehourly
earnings
Numberof
w o r k e r s
Av er ag ehourly
earnings
Numberof
w o r k e r s
A ve ra gehourly
earnings
Number
of w o r k e r s
Av er ag ehourly
earnings
Se lected woo len occupations
Me n
C ar d fi n is h e rs ------------------------------------------------------------------- 52 $ 1 .75 287 $ 1.80 35 $ 1 .66 9 $ 1 . 4 8Ca rd st ri p p er s ------------------------------------------------------------------ 14 1.48 112 1.79 16 1 .78 13 1. 72D of fe rs , spin nin g fr a m e------------------------------------------------- - - 151 1.73 - - - -D y e i n g - m a c h i n e t e n d e r s , c l o t h ------------------------------------- - - - - - - - -
F u ll er te n d e rs ------------------------------------------------------------------- - - - - - - 14 1.84L oo m fi x e r s ----------------------------------------------------------------------- - - - - - - 13 2. 35Spin ners, fr am e---- -- -- -- -- -- -- -- -- -- -- -- -- -- -- -- -- -- -- -- -- -- -- -- -- -- -- -- -- -- - - - - - - - 6 1. 84W e a v e r s 123 --------------------------------------------------------------------------- - - - - - - - -
Bo x lo om s, au to m at ic------------------------------------------------ - - - - - - -
Women
M en de rs , c lo t h ------------------------------------------------------------------ - - - - - _ 44 1. 85Sp in ne rs , fr a m e --------------------------------------------------------------- 156 1.69 696 1. 80 - - 53 1. 70W ea v er s3 -------------------------------------------------------------------------- - - - - - - 53 1.61
Bo x lo om s, au to m at ic------------------------------------------------ - - - - - - 52 1.61Winders 3 --------------------------------------------------------------------------- 98 1 .71 448 1.72 90 1.60 55 1 .72
Cone and tube, high speed , non auto m atic- - -- -- -- -- -- - - - 331 1. 70 - - - -
F i l l in g , a u t o m a t i c ------------------------------------------------------ - - - - - - - -
Se lected wors ted occupations
Me n
L oo m fi x e r s ----------------------------------------------------------------------- - - - - - - _
P i n d r a f t e r o p e r a t o r s ----------------------------------------------------- 31 1 .74 74 1.85 - - -
W e a v e r s 3 ---------------------------------------------------------------------- ----- - - - - - - -Bo x lo om s, au to m at ic------------------------------------------------ - - - - - - -
Women
D of fer s, spin nin g fr a m e------------------------------------------------- - 38 1. 56 - - - -
A m er ic a n sy st e m -------------------------------------------------------- - - 35 1.56 - - - -
M en de rs , c lo th --------------------------- ------------------------------------ - - - - - - - -
P i n d r a f t e r o p e r a t o r s — -------------------------------- ---------- ------ - - 144 1.68 - - - -
Sp inn ers , fr a m e --------------------------------------------------------------- 116 1.72 507 1.73 - - - -
A m er ic an sy st em -------------------------------------------------------- - - 505 1 .74 - - -
Winders 3--------------------------------------------------------------------------- 77 1 .67 863 1. 67 - - - -
Con e and tub e, au to m at ic ----------------------------------------- - - •217 1 .82 - - - -
Cone and tube, high speed , non auto ma tic- - -- -- -- -- -- - - - 575 1. 60 - - - -
F i l l in g , a u t o m a t i c — ----------------- ------------------------------ - - 48 1 .77 - - -
Selected woo len and wors ted occupations
Me n
B a t t e r y h a n d s ----------------------------------------------------------------------------- ---------- - - - - - -
Jani tors ( exc luding machinery c leaners ) -------------------------- 16 1. 55 151 1. 55 - - - -
M a c h i n i s t s , m a i n t e n a n c e ------------------------------------------------------ .— - - 62 2. 34 - - - -
Tru ckers , hand ( inc luding bobb in boy s ) ---------------------------- 32 1 .58 536 1 . 62 7 1. 83 _
1 Excludes prem ium pay f or overt ime and f or work on weekends , h o l idays , and late shi f ts .2 Inc ludes da ta f or reg ions in addi tion to those shown separate ly .3 Inc ludes da ta f or workers in this c lass i f ica t ion in addi t ion to those shown separate ly .4 Data are not presented separate ly f or occupations assoc ia ted with weaving opera t ions s ince inf ormation was ob ta ined f rom too f ew o f the la rge integra ted mi l l s
having such opera t ions .
NOTE: Dashes indica te no da ta reported or da ta that do not meet pub l i ca t ion cr i ter ia .
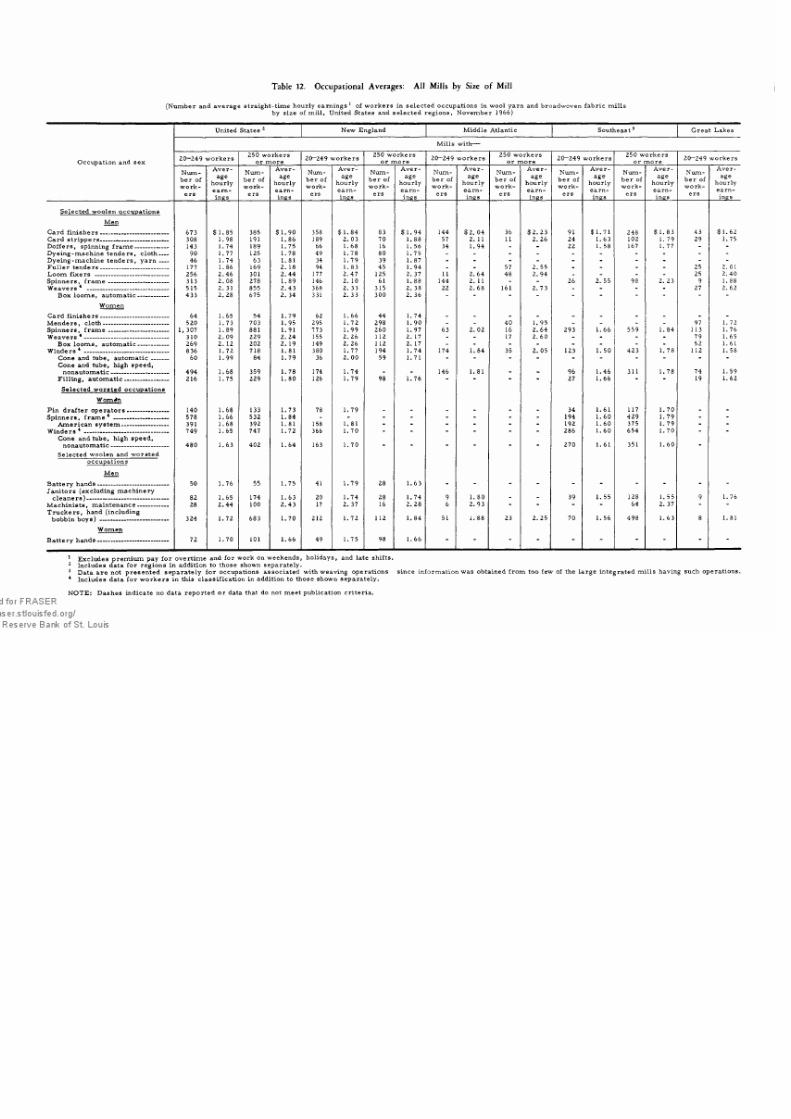
7/21/2019 bls_1551_1967.pdf
http://slidepdf.com/reader/full/bls15511967pdf 29/82
Table 12. Occu pationa l Averages: All Mills by Size of Mill
( Number and average s tra ight- t ime hour ly earnings 1 o f workers in se lected occupations in woo l yarn and broadwoven f abr ic mi l l sby s ize o f mi l l , Uni ted States and se lected reg ions , Novem ber 1966 )
United States 2 New England M idd le A tlan tic Southeast G reat Lakes
Mills with—
Occupation and sex20—249 wo rker s
250 workerso r m o r e
20—249 work ers250 workers
o r m o r e20—249 work ers
250 workerso r m o r e
20—249 wo rke rs250 workers
o r m o r e20—249 work ers
N u mb e r o fw o r k
er s
A v erage
hourlye a r nings
N u mber o fw o r k
er s
A v erage
hourlye a r nings
Numb e r o fw o r k
er s
A v erage
hourlye a r nings
N u mber o fw o r k
er s
A v e rage
hourlye a r nings
N u mber o fw o r k
er s
A v e rage
hourlye a r nings
N u mber o fw o r k
er s
A v erage
hourlye a r nings
N u mber o fw o r k -
er s
A v e rag e
hourlye a r nings
N u mber o fw o r k
er s
A v e rage
hourlye a r nings
N u mber o fw o r k
er s
A v erage
hourlye a r nings
Se lected woo len occupations
Me n
C a r d f i n i s h e r s ---------------------------- — 673 $ 1.85 385 $ 1 .9 0 358 $ 1.84 83 $ 1 .94 144 $2. 04 36 $2. 23 91 $1 .71 248 $ 1 .8 3 43 $1 .62
C a r d s t r i p p e r s ----------------------------------- 308 1.98 191 1.86 189 2. 03 70 1 .88 57 2. 11 11 2. 26 24 1.63 102 1. 79 29 1.75
Dof f ers , spinning f ram e ----------------- 143 1.74 189 1.75 66 1 .68 16 1. 56 34 1 .9 4 - - 22 1. 58 167 1. 77 - -
D y e i n g - m a c h i n e t e n d e r s, c l o t h ----- 90 1.77 125 1 .78 49 1 .78 80 1.75 - - - - - - - - - -
D y e i n g - m a c h i n e t e n d e r s , y a r n ----- 46 1.74 63 1.81 34 1.79 39 1.87 - - - - - - - - - -
F u l l e r t e n d e r s ----------------------------------- 177 1.86 169 2. 18 94 1 .83 45 1.94 - - 57 2. 55 - - - - 25 2. 01
L o o m f i x e r s -------------------------------------- 256 2 .46 301 2 .44 177 2.47 125 2. 37 11 2. 64 48 2. 94 - - - - 25 2. 40
S p i n n e r s, f r a m e -------------- --------------- -- 313 2. 08 278 1.89 146 2. 10 61 1.88 144 2. 11 - - 26 2. 55 98 2. 23 9 1. 88
W e a v e r s 4 -------------- ------------- -------------- - 515 2. 31 855 2 .43 368 2. 33 315 2. 38 22 2. 68 161 2. 73 - - - - 27 2. 62
B o x l o o m s , a u t o m a t i c ---------------- 433 2. 28 675 2. 34 331 2. 33 300 2. 36 - - - - - - - - - -
W o m e n
C a r d f i n i s h e r s ----------------------------------- 64 1 .65 54 1.79 62 1 .66 44 1.74 - - - - . - - - - -
M e n d e r s , c l o t h --------------- ---------------- --- 520 1 .73 703 1. 95 295 1 .72 298 1.90 - - 40 1. 95 - - - - 97 1.72
S p i n n e r s, f r a m e -------------- --------------- -- 1, 307 1.89 881 1.91 773 1.99 260 1 .97 63 2. 02 16 2. 64 293 1 .66 559 1.84 113 1. 76
W ea ve rs 4 -------------------------------------------- 310 2. 09 229 2. 24 155 2. 26 112 2. 17 - - 17 2. 60 - - - - 79 1.65
B o x l o o m s , a u t o m a t i c ---------------- 269 2. 12 202 2. 19 149 2. 26 112 2. 17 - - - - - - - - 52 1. 61
W in de rs 4 ..................................................... 836 1.72 718 1.81 380 1.77 194 1 .74 174 1 .84 35 2. 05 123 1. 50 423 1. 78 112 1. 58
Cone and tube , au tom atic --------- 60 1.99 84 1.79 36 2. 00 59 1.71 - - - - - - - - - -
Cone and tube, high speed,nonautomatic — --------- --------------- - 494 1.68 359 1.78 174 1 .74 - - 146 1.81 - - 96 1.46 311 1 .78 74 1. 59
Fil lin g, au tom at ic—......................... 216 1.75 229 1 .80 126 1.79 98 1.76 - - - - 27 1.66 - - 19 1. 62
Se lected wors ted occupations
Womdh
P i n d r a f t e r o p e r a t o r s --------------------- 140 1 .68 133 1 .73 78 1.79 - - - - - - 34 1.61 117 1. 70 - -
Spinners , f ram e 4 ---------------------------- 578 1.66 532 1 .84 - - - - - - - - 194 1 .6 0 429 1.79 - -
A m er ic a n sy st e m --------------- --------- 391 1.68 392 1 .81 158 1.81 - - - - - - 192 1 .60 375 1. 79 - -
W i n d e r s4 — ---------- -------------- ----------- --- 749 1.65 747 1 .72 366 1 .70 - - - - - - 286 1.60 654 1.70 - -
Cone and tube , high spee d,n o n a u t o m a t i c------------- ------------- — 480 1.63 402 1 .64 163 1.70 - - - - - - 270 1.61 351 1 .60 -
Se lected woo len and wors tedoccupations
Me n
Ba tte ry ha nd s------------------------------------- 50 1.76 55 1 .75 41 1 .79 28 1 .63 - - - - - - - - - -
Jani tors ( exc luding machinery1.76c l e a n e r s )------------------------------------------ 82 1.65 174 1.63 20 1.74 28 1.74 9 1.80 - - 39 1. 55 128 1. 55 9
M a c h i n i s t s , m a i n t e n a n c e ---------------- 28 2 .4 4 100 2.43 17 2. 37 16 2. 28 6 2. 93 - - - - 64 2. 37 - -
Truckers , hand ( inc luding
bobb in boys ) -----------------------------------324 1. 72 683 1 .70 212 1 .72 112 1 .84 51 i . 88 23 2. 25 70 1.56 498 1. 63 8 1.81
W o m e n
Ba tte ry ha nd s------------------------------------- 72 1 .70 101 1.66 49 1 .75 98 1 .66 " " - - - -
1 Exc ludes prem ium pay f or overt im e and f or work on weekends , ho l idays , and la te shi fts .2 Inc ludes data f or reg ions in addi t ion to those shown separate ly .3 Data are not presented separate ly f or occupations assoc ia ted with weaving opera t ions s ince inf ormation was ob tained f rom too few o f the la rge integra ted mi l l s having such opera t ions .4 Inc ludes da ta f or worke rs in this c lass i f i ca t ion in addi tion to those shown separate ly .
NOTE: Dashes indica te no da ta reporte d or da ta that do not meet pub l i ca tion cr i ter ia .

7/21/2019 bls_1551_1967.pdf
http://slidepdf.com/reader/full/bls15511967pdf 30/82
Tabic 13. Occupation al Averages: All Mills by Method of Wag e Payment
( Number and average s tra ight- t ime hour ly earnings 1 o f workers in se lected occupations in woo l yarn and broadwoven f abr ic m i l l sby method of wage payment, United States and selected r egion s, N ovem ber 1966)
United States 2 New England Middle At lan tic Sou th east 3 G reat Lakes
T i m e w o r k e r sIncentiveworkers
T i m e w o r k e r sIncentivew o r k e r s
T i m e w o r k e r sIncentivew o r k e r s
T i m e w o r k e r sIncentivew o r k e r s
T i m e w o r k e r sIncentivew o r k e r s
O ccu pation and sex Nu mbe rof
w o r ker s
A ve rag e
hourlye a r n -
i n fi s
Numbe rof
w o r ker s
A ve rage
hourlye a r n -ings
N u mbe rof
w o r ker s
A v erage
hourlye a r n -
infis
N u mbe rof
w o r ker s
A v erage
hourlye a r nings
N u mb er
of w o r k
er s
A v erag e
hourlye a r n
ings
N u mbe rof
w o r ker s
A v e rage
hourlye a r nings
N u mbe r
of w o r k
er s
A v erage
hourlye a r nings
N u mb erof
w o r ker s
A v e r
agehourlye a r nings
N u mbe r
of w o r k
er s
A v erag e
hourlye a r n
ings
N limberof
w o r ker s
A ve rage
hourlyearnings
Se lected woo len occupations
Me n
Card f inish ers --- -- -- -- -- -- -- -- -- -- -- -- -- -- -- -- -- -- 954 $1. 83 104 $2. 24 403 $1. 81 . _ 142 $1.98 38 $2. 45 311 $1.79 _ _ 44 $1. 62 _ _
C a rd s t r i p p e r s ----------------------------------- 447 1. 85 52 2. 67 219 1.86 40 $2. 69 56 2. 04 12 2. 58 126 1. 76 - _ 29 1. 75 _ _
D offe rs, spinn ing fra m e------------------- 247 1. 72 85 1. 82 82 1.66 - - 22 1.76 - - 122 1 .75 67 $1. 74 _ _ _
F u l l e r te n d e r s -- -- -- -- -- -- --- --- -- --- -- ---- -- -- ---- 2 94 1 . 9 0 5 2 2. 66 128 1 .82 11 2 .4 0 47 2. 05 29 2. 85 _ _ _ _ 25 2. 01 _ _
Loom f ixe rs - -- -- --- -- -- -- -- -- -- -- -- -- -- -- -- -- -- -- -- - 434 2 . 35 123 2. 78 243 2. 3659
2.71 11 2. 64 48 2. 94 _ _ _25 2 .40
_ _
S p i n n e r s, f r a m e -------------------------------- 363 1. 90 228 2. 13 101 1.88 106 2. 18 - - 97 2. 13 _ _ _ _ _ _ . _
Spinners , mule ---------------------------------- 21 1. 85 103 2. 21 18 1. 83 69 2. 14 - - - - _ _ _ _ _ - _
W ea ve rs 4 -------------------------------------------- 83 2. 03 1,287 2.41 - - 656 2. 38 - - 183 2. 73 - - - - _ - _ -
B o x l o o m s , a u t o m a t i c ----------------- 51 1. 77 1,057 2. 34 - - 604 2. 37 - - - - - - - " - - - - -
W o m e n
M e n d e r s , c l o t h ----------------------------------- 585 1. 74 638 1. 96 353 1 .74 240 1 .92 55 1.87 _ _ _ _ _ _ 74 1. 56 _ _
Sp inn ers , fr a m e --------------------------------- 903 1 .8 3 1,2 85 1 .95 347 1. 86 686 2.05 45 2. 02 34 2. 31 352 1 .74 500 1. 80 90 1.79 30 $1.69W e a v e r s 4 --------------------------------------------- 29 1 .88 510 2. 17 14 1. 98 253 2. 24 - _ 21 2. 56 _ _ 27 2. 62 69 1.63
B o x l o o m s , a u t o m a t i c ----------------- 22 1. 94 449 2. 16 13 1 .96 248 2. 23 - _ - _ _ _ _ _ _ _ 48 1. 58Winders 4 --------r------------------------------------ 938 1. 68 616* 1. 88 343 1. 69 231 1.87 128 1.79 81 2. 02 307 1.64 239 1. 82 112 1. 58 _ _
Cone and tube , au tom atic ---------- 70 1. 73 74 2. 01 47 1.69 48 1 .95 95 1.75 - - _ _ _ _ _ _ _
Cone and tube, high speed,n o n a u t o m a t i c ------------------------------- 554 1. 66 299 1. 85 159 1 .66 50 1.97 - - 51 1. 92 216 1 .62 - - 74 1.59 _ _
Fi l l ing , automatic ----------------------- 288 1.72 157 1. 88 125 1. 73 99 1. 84 - - - - 75 1 .64 - - 19 1. 62 - -
Se lected wors ted occupations
Me n
Dof f ers , spinning f ram e4 -------------- 105 1. 68 98 2. 08 - - _ - - _ _ _ 80 1. 59 98 2. 08 _ _ _ _
A m er ic a n sy st em ------------------------ 97 1. 68 98 2. 08 - - - - - - - - 72 1. 58 98 2. 08 _ _ _ _
Lo om fix e rs ----------------------------------------- 322 2. 51 - - 94 2. 48 - - - _ - - _ _ _ _ _ _ _ _
P i n d r a f t e r o p e r a t o r s ----------------------- 53 1.74 71 1. 87 17 1. 78 - - _ _ - 36 1.72 69 1. 86 _ _ _ _
W e a v e r s 4 --------------------------------------------- 50 2. 15 583 2. 30 - - 177 2 .48 - _ - _ _ _ - _ _ _ _ _
B o x l o o m s , a u t o m a t i c----------------- 47 2. 15 472 2. 30 - - 148 2. 50 - - - - - - - - - - - -
W o m e n
Do f f ers , spinning f rame 4 ---------------- 107 1. 60 _ - 53 1. 67 _ _ _ _ _ _ 41 1. 53 _ _ _ _ _ _
A m er ic an sy st em ------------------------ 99 1. 60 - - 51 1.67 - - - - - - 38 1. 53 _ _ _ _ _
M e n d e r s , c l o t h ----------------------------------- 418 1. 82 666 1. 76 308 1.84 _ - _ - - - _ _ _ _ _ _
P i n d r a f t e r o p e r a t o r s-----------------------
207 1. 65 66 1. 88 88 1.79 _ - - _ - - 91 1.57 60 1. 84 _ _ _ _Spi nn ers, fr am e4 ------------------------------ 731 1.65 379 1.9.3 284 1. 76 - - - - - 361 1.61 262 1. 90 _ _ _ _
A m er ic an sy st em ------------------------ 490 1. 65 293 1. 90 144 1 .82 - - - - - - 305 1 .58 262 1. 90 _ _ _ _
Winders 4 --------------------------------------------- 840 1 .63 656 1.75 341 1 .70 118 1.82 - - - - 402 1. 58 538 1 .74 _ _ _
Cone and tube, a utom atic ------------
Cone and tube, high speed,133 1. 74 208 1. 83 82 1. 74 21 1.79 " - 51 1.73 187 1. 83 - - -
n o n a u t o m a t i c------------------------------- 482 1.59 400 1. 70 121 1 .70 93 * 1.83 - - - - 314 1.54 307 1. 66 _ _ _
F i l l in g , a u t o m a t i c ------------------------ 121 1. 69 27 1. 82 88 1 .68 “ " " _ 27 1. 70 27 1 .82 ' " -
1 Exc ludes prem ium pay f or overt ime and f or work on weekends , ho l idays , and la te shi fts .2 Inc ludes da ta f or reg ions in addi tion to those shown separate ly .3 Data are not presented separate ly f or occupations assoc ia ted with weaving opera t ions s ince inf ormation was ob ta ined f rom too f ew o f the la rge integra ted mi l l s having such opera t ions .4 Inc ludes da ta f or wo rkers in this c lass i f i ca t ion in addi t ion to those shown separate ly .
NOTE: Dashes indica te no da ta reported or da ta that do not meet pub l i ca t ion cr i ter ia .
to03
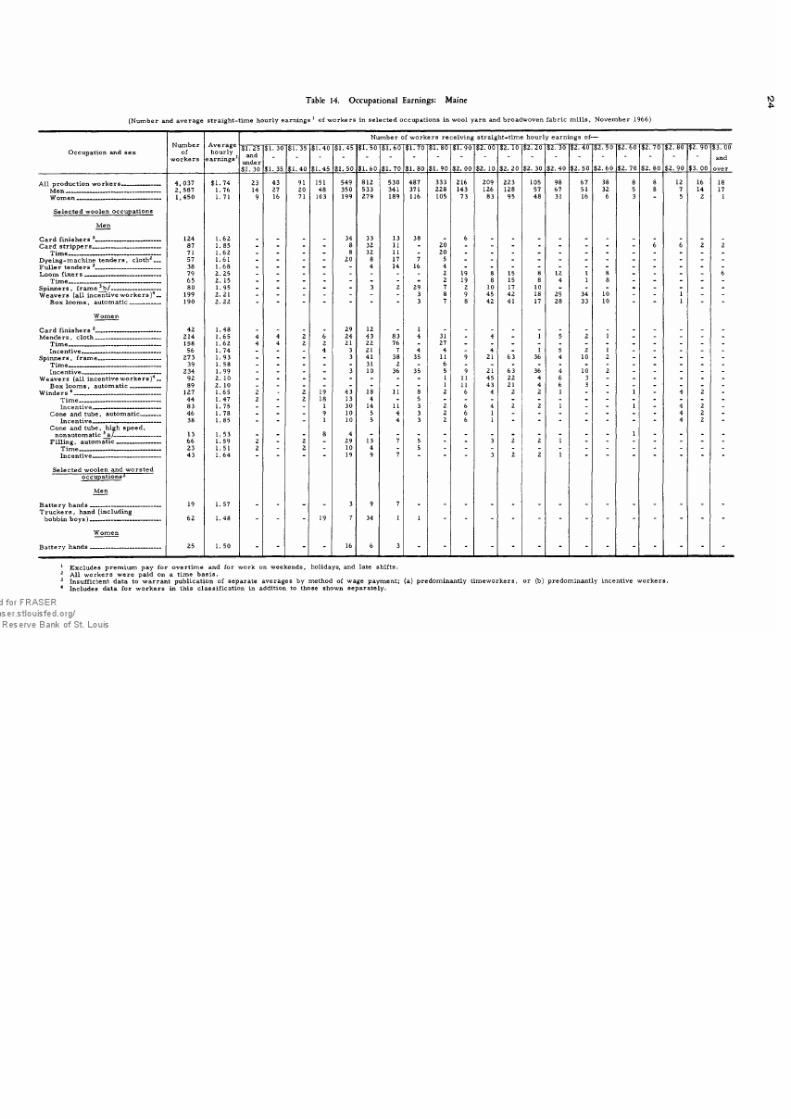
7/21/2019 bls_1551_1967.pdf
http://slidepdf.com/reader/full/bls15511967pdf 31/82
Table 14. Occup ational Earnings: Maine
( Number and average s tra ight- t ime h our ly earnings 1o f workers in se lected occupations in woo l yarn and broadwoven f abr ic m i l l s , Novemb er 1966 )
Av er ag ehourly
e a r n i n g s 1
Number o f work ers rece iv ing s tra ight- t ime hour ly earnings o f-
Occupation and sex of w o r k e r s
$1. 25and
under$1. 30
$1. 30
$1. 35.
$1. 35
$1. 40
$1.40
$1.45
$1. 45
$1. 50
$1. 50
$1. 60
$1. 60
$1. 70
$1. 70
$1. 80
$1. 80
$1. 90
$1. 90
$2. 00
$2. 00
$2. 10
$2. 10
$2. 20
$2. 20
$2. 30
$2. 30
$2. 40
$2. 40
$2. 50
$2. 50
$2. 60
$2. 60
$2. 70
$2. 70
$2. 80
$2. 80
$2. 90
$2. 90
$3. 00
$3. 00
and
over
A ll pr od u ct io n w or k er s ----- _ ------ 4, 037 $1. 74 23 43 91 151 549 812 530 487 333 216 209 223 105 98 67 38 8 8 12 16 18
2 ,5 8 7 1. 76 14 27 20 48 350 533 341 371 228 143 126 128 57 67 51 32 5 8 7 14 17
W o m e n_____ _____________________ 1 ,450 1. 71 9 16 71 103 199 279 189 116 105 73 83 95 48 31 16 6 3 - 5 2 1
Se lected woo len occupations
Me n
Card f inishers 12_____________ _______ 124 1. 62 _ _ _ - 34 33 13 38 - 6 . - - - - - _ - - _ _
C a r d s t r i p p e r s _______________________ 87 1. 85 - - - - 8 32 11 - 20 - - - - - - - - 6 6 2 2
T i m e _______________________________ 71 1. 62 - - - - 8 32 11 - 20 - - - - - - - - - - - -
D y e i n g - m a c h i n e t e n d e r s , c l o t h 2__ 57 1 .61 - - - - 20 8 17 7 5 - - - - - - - - - - - -
Ful ler tenders 2______________________ 38 1 .6 8 - - - - - 4 14 16 4 - - - - - - - - - - - -
L o o m f i x e r s __ — ----------------------- 79 2. 25 - - - - - - - - 2 19 8 15 8 12 1 8 - - - - 6
T i m e _______ ______________________ 65 2. 15 - - - - - - - - 2 19 8 15 8 4 1 8 - - - - -
Sp inn ers, fram e fb /-------------------------- 80 1. 95 - - - - - 3 2 29 7 2 10 17 10 - - - - - - - -
Weav ers ( a l l incentive work ers )4 „ 199 2. 21 - - - - - - - 3 8 9 45 42 18 29 34 10 - - 1 - -
B o x l o o m s , a u t o m a t i c ---------------- 190 2. 22 - - " - - - 3 7 8 42 41 17 28 33 10 - “ 1 " -
W o m e n
Card f inishers 2______________________ 42 1 .48 _ . _ _ 29 12 _ 1 _ _ _ . _ _ . _ - _ _ _ .
M e n d e r s , c l o t h ______________ ______ 214 1.65 4 4 2 6 24 43 83 4 31 - 4 - 1 5 2 1 - - - - -
T im e ____________________________ 158 1 .62 4 4 2 2 21 22 76 - 27 - - - - - - - - - - - -
In cen tiv e___________________ ______ 56 1. 74 _ - - 4 3 21 7 4 4 - 4 - 1 5 2 1 - - - - -
S p i n n e r s, f r a m e ------ -------------------- 273 1. 93 - - - - 3 41 38 35 11 9 21 63 36 4 10 2 - - - - -
T i m e _______________________________ 39 1. 58 - - - - - 31 2 - 6 - - - - - - - - - - - -
I n c e n t iv e — -------- --------------- ----- 234 1. 99 - - - - 3 10 36 35 5 9 21 63 36 4 10 2 - - - - -
W e a v e r s ( a l l i n c e n ti v e w o r k e r s ) 4 . . 92 2. 10 - - - - - - - - 1 11 45 22 4 6 3 - - - - - -
B o x l o o m s , a u t o m a t i c ______ __ 89 2. 10 - - - - - - - - 1 11 43 21 4 6 3 - - - - - -
ind ers ^ ,___ _______— 127 1. 65 2 2 19 43 18 11 8 2 6 4 2 2 1 - - 1 - 4 2 -
T im e____________________________ 44 1. 47 2 - 2 18 13 4 - 5 - - - - - - - - - - - - -
Incentive_______________________ 83 1. 75 - - - 1 30 14 11 3 2 6 4 2 2 1 - - 1 - 4 2 -
Cone and tube , autom atic ---------- 46 1. 78 - - - 9 10 5 4 3 2 6 1 - - - - - - - 4 2 -Incentive_______________________ 38 1. 85 - - - 1 10 5 4 3 2 6 1 - - - - - - - 4 2 -
Cone and tube, high spee d,8nonautomatic 3a /— ----------------- 13 1. 53 - - - 4 - - - - - - - - - - - 1 - - - -
Fi l l ing , autom a ti c ----------------------- 66 1. 59 2 - 2 - 29 13 7 5 - - 3 2 2 1 - - - - - - -
T i m e __________________________ 23 1. 51 2 - 2 - 10 4 - 5 - - - - - - - - - - - - -
Incentive ---------------------- -------- 43 1. 64 - - - - 19 9 7 - - 3 2 2 1 " - - - -
Se lected woo len and wors t edo c c u p a t i o n s 2
Me n
B a t t e r y h a n d s________________________ 19 1. 57 - - - - 3 9 7 - - - - - - - - - - - - - -
Tru cker s , hand ( inc luding
b o b b in b o y s ) ------------- -------------------- 62 1. 48 - - 19 7 34 1 1 - - " - “ - -
W o m e n
B a t t e ry h a n d s ________________________ 25 1. 50 - - - 16 6 3 - - - - - " - - - “ - -
1 Exc ludes prem ium pay f or ov ert ime and f or work on weekends , h o l idays , and la te shi f ts .2 A l l w o r k e r s w e r e p ai d on a t i m e b a s i s .3 Insuf f i c ient da ta to warrant pub l i ca t ion o f s epara te averages by method o f wage payment; ( a ) predominantly t imew orkers , o r ( b ) predominantly incentive worke rs .4 Inc ludes da ta f or worke rs in this c las s i f i ca t ion in addi t ion to those shown separate ly .

7/21/2019 bls_1551_1967.pdf
http://slidepdf.com/reader/full/bls15511967pdf 32/82
Table 15. Occu pational Earnings: Massachusetts
( Number and average s tra ight- t ime hour ly earnings 1 o f workers in se lected occup ations in woo l yarn and broadwoven f abr ic m i l l s , November 1966 )
Occupation and sexNumber
of w o r k e r s
A ve ra gehourly
earnings 1
Number o f work ers rece iv ing s tra ight- t ime hour ly earnings o f —
Under
$1 ,50
$1. 50and
under$ 1 . 6 0
$1. 60
$1. 70
$1. 70
$1. 80
$1. 80
$ 1. 90
$1. 90
$2. 00
$2. 00
$2. 10
$2. 10
$2. 20
$2. 20
$2. 30
$2. 30
$2. 40
$ 2. 40
$2. 50
$2. 50
$2. 60
$ 2 . 6 0
$2. 70
$2. 70
$2. 80
$2. 80
$2. 90
$2. 90
and
over
A ll pr od u ct io n w o rk er s -------------------- 4, 068 $2. 02 40 79 414 539 716 505 371 307 251 272 155* 178 112 60 32 37M en ---------------------------------- --------------- 2, 544 2. 09 8 20 87 341 407 327 259 218 192 221 120 126 98 57 31 32W om en -------------------------------------------- 1, 524 1. 90 32 59 327 198 309 178 112 89 59 51 35 52 14 3 1 5
Se lected woo len occupations
Me n
Ca rd fin is h e rs ---------------------------------- 138 1. 99 . _ _ 26 30 40 3 15 8 14 2 _ _ _ _
T im e ---------- —— ------------- ---------------- 114 1. 92 - - - 26 30 40 3 15 - - - - - - - _
C a r d s t r i p p e r s ----------------------------------- 56 2. 03 - - - - 11 17 12 8 - 4 2 2 - - - -
T im e ------------------------------------------------ 48 1. 96 - - - - 11 17 12 8 - - - - - - - -D ye in g-m ach in e ten de rs, c lo th 2— 53 1. 90 - - 4 20 3 16 - 9 - - - 1 - - _ -
Dye ing- m achine tend ers , yarn 2 — 16 1. 90 - - - - 4 11 - 1 - - - - - - - -F u l l e r t e n d e r s ----------------------------------- 30 2. 06 - - - - 7 12 3 - - 4 2 1 - - - 1
T i m e ---------- ------------------------------------- 22 1. 92 - - - - 7 12 3 - - - - - - - _ -
Lo om fi x e r s ---------------------------------------- 92 2. 50 - - - - - - - - 7 17 30 22 12 2 - 2T im e ------------------------------------------------ 66 2. 46 - - _ - - _ - T 7 16 29 9 3 - _ 2
Sp inn ers , f ra m e--------------------------------- 88 2. 07 - - - 2 18 14 23 - 9 14 8 - - - - -
T im e ------------------------------------------------ 48 1. 92 - - - - 18 13 17 - - - - - - - - -
Incentive ----------------------------------------- 40 2, 24 - - - 2 - 1 6 - 9 14 8 - - - _
W ea ve rs 3 -------------------------------------------- 217 2. 45 - - - - - 4 5 18 34 33 24 30 45 13 7 4Incentive ----------------------------------- 216 2. 45 - - - - - 4 5 18 34 32 24 30 45 13 7 4
B o x l o o m s , a u t o m a t i c ---------------- 198 2. 43 - - - - - 4 5 18 34 29 24 29 39 11 2 3Incentive ----------------------------------- 197 2. 43 - - - - - 4 5 18 34 28 24 29 39 11 2 3
W o m e n
M e n d e r s , c l o t h ---------------------------------- 163 1. 94 1 1 14 57 38 31 4 16 1 _ _ _ _ _
T im e------------------------------------------------ 71 1. 83 - - - 13 52 5 1 - . _ - _ _ _
Incentive ----------------------------------------- 92 2. 02 - 1 1 1 5 33 30 4 16 1 - _ . _ „
S p in n e rs , f r a m e - -------------------------------- 2 58 2. 03 - 1 - 18 44 60 33 60 12 22 8 - - - -
T im e------------------------------------------------ 90 1. 92 - - - - 32 47 11 - - - - - - - - _
Incentive ----------------------------------------- 168 2. 09 1 - 18 12 13 22 60 12 22 8 - - - - -
W e a v e r s , b o x l o o m s , a u t o m a t i c — 59 2. 26 - 2 - 2 - 6 3 2 14 11 16 2 - - - 1Incentive ----------------------------------------- 55 2. 29 - - 2 - 6 2 2 14 10 16 2 - - _ 1
Winders 3 --------------------------------------------- 211 1. 79 - 16 72 42 38 12 9 5 5 7 5 - - - _ _
T i m e ------------------------------------------ 131 1. 73 - 6 56 28 33 8 - - - - - - - - - _
Incentive ----------------------------------- 80 1. 90 - 10 16 14 5 4 9 5 5 7 5 - - - - _
Cone and tube, au toma tic 2-------- 19 1. 76 - 2 6 - 11 - - - - - - - - - - _
Cone and tube, high speed,
n o n a u t o m a t i c------------------------------
88 1. 80 - - 32 28 12 3 1 5 4 2 1 - - - . _T i m e ------------------------------------------
74 1. 72 - - 32 28 11 3 - - - - - - - - - _
F i l l in g , a u t o m a t i c----------------------- 70 1. 85 - 4 18 12 15 9 4 - - 4 4 - - _ _
T i m e ------------------------------------------ 38 1. 74 " 4 18 “ 11 5 " _ “ " “ " -
See footnotes at end of table.
1001

7/21/2019 bls_1551_1967.pdf
http://slidepdf.com/reader/full/bls15511967pdf 33/82
Table 15. Oc cupationa l Earnings: Massachusetts---- Continued
( Number and average s tra ight- t im e hourly earnings 1 o f workers in se lected occupations in woo l yarn and broadwoven f abr ic mi l l s , Novem ber ,1966 )
100)
1 Excludes prem ium pay f or overt im e and for work on weekends , ho l idays , and la te shi f ts .
2 A l l w o r k e r s w e r e p a i d on a t i m e b a s i s.
3 Inc ludes da ta f or wo rkers in this c lass i f i ca t io n in addit ion to those shown separate ly .
4 Insu f f i c ient da ta to warrant pub l i ca t ion o f s eparate averag es by method o f wage payment, predom inantly t imew orkers .

7/21/2019 bls_1551_1967.pdf
http://slidepdf.com/reader/full/bls15511967pdf 34/82
Table 16. Occupationa l Earnings: New Hampshire
( Number and average s tra ight- t ime hour ly earnings1o f workers in se lected occupations in woo l yarn and broadwoven f abr ic m i l l s , Novem ber 1966 )
Numberof
w o r k e r s
Av er ag ehourly
earnings1
Number o f worke rs rece iv ing s tra igh t- t ime hour ly earnings of —
Occupation and sexUnder$1. 50
$1. 50and
under$1 .60
$1. 60
$1. 70
$1\ 70
$1. 80
$1. 80
$1. 90
$1. 90
$2. 00
$2. 00
$2. 10
<^•19
$2. 20
$2. 20
$2. 30
$2. 30
$2. 40
$2. 40
$2. 50
$2. 50
$2. 60
$2. 60
$2. 70
$2. 70
and
over
A ll pr od uc ti on w o rk er s ------------------------ 3,456 $1. 93 61 70 408 712 660 466 345 152 181 153 86 94 42 26M en ___________________________________ 2 ,210 1. 96 19 21 243 372 449 337 204 110 139 113 62 84 34 23W o m e n _______________________________ 1,246 1. 87 42 49 165 340 211 129 141 42 42 40 24 10 8 3
Se lected woo len occupations
Me n
Card f inishers 12_________________________ 66 1. 78 _ _ 19 8 39 _ _ _ _ _ _ _ _
Card s tr ippers 2________________________ 55 1. 92 - - - 5 12 29 7 - 2 - - - - _
Dye ing- m achine tenders , c lo th 2 ____ 11 1. 77 - - 2 6 2 - 1 - - - - - - -Dyein g-m achin e te nders , ya rn 2--- -- -- - 41 1. 86 - - - 9 12 20 - - - - _ _ _ _
Ful ler tenders 2_________________________ 55 1. 81 - - 21 2 13 19 - - - - _ _ _ _
Lo om fix e r s _____________________________ 67 2. 42 - - - - - - - 1 9 22 18 9 8 _
T i m e __________________________________ 63 2. 42 - - - - - - - 1 9 22 18 5 8 -
W e a v e r s , b o x l o o m s , a u t o m a ti c( a ll i n c e n ti v e w o r k e r s )______________ 145 2 .43 " _ _ 1 “ 3 7 16 38 17 42 17 4
W o m e n
Card f inishers 2_________________________ 42 1. 82 _ _ _ 17 25 _ _ _ _ _ _ _
M e n d e r s , c l o t h _________________________ 129 1. 84 2 1 13 13 80 7 12 1 _ _ _ _ _ _
T im e____________________________ ____ 87 1. 83 - - 6 13 68 - - - - - _ _ _ _
Incentive______________________________ 42 1. 87 2 1 7 - 12 7 12 1 _ _ _ _ _ _
Spinners , f ram e ________________________ 232 1. 96 1 8 22 39 9 50 60 17 12 9 4 _ 2 _
T i m e________________ ____________ 56 1. 79 - 7 - 31 - 18 - - - - _ _ _ _In cen tive______________________________ 176 2. 01 1 - 22 8 9 32 60 17 12 9 4 _ 2 _
W e a v e r s 3________________________________ 62 2. 38 - - - - 2 - 1 1 9 21 15 8 4 1Incentive__________________________ 56 2. 40 - - - - 2 - 1 1 3 21 15 8 4 1
B o x l o o m s , a u t o m a t i c_____________ 61 2. 39 - - - - 2 - 1 1 8 21 15 8 4 1Incentive__________________________ 56 2. 40 - - - - 2 - 1 1 3 21 15 8 4 1
Winders 3________________________________ 82 1. 87 - 18 11 24 5 - 4 7 2 3 3 2 2 1T i m e _____________________ _________ 58 1.69 - 18 11 24 5 _ _ _ _ _ _ _ _ _
Incentive __________________________ 24 2. 30 - - - - - - 4 7 2 3 3 2 2 1Cone and tube , a utomatic _________ 30 1. 92 - 2 5 13 - - 2 1 _ 3 2 1 1 _
T im e_______________________________ 20 1. 72 - 2 5 13 - - - - - _ _ _ _ _
F illi ng , a utom ati c__________________ 36 1. 96 - - 6 11 5 - 2 6 2 _ 1 1 1 1T i m e ---------------------------------------------- 22 1. 76 - 6 11 5 “ - - - -
S e l e c t e d w o o l e n a n d w o r s t e doccupations
Me n
B a t t e r y h a n d s___________________________ 14 1. 73 _ _ 5 9 _ _ _ _ _ _ _ _
T i m e__________________________________ 12 1. 73 - - 5 7 - - _ _ _ _ _ _ _
Jani tors ( exc luding machinerycl ea n er s) 2______________________________ 12 1. 70 2 - 4 2 3 - 1 - - - - _ _
Mach inis ts , ma intenance 2 ___________ 18 2. 24 - - - - - - 7 - 6 3 - 1 1 _
Tru ckers , hand ( inc luding b o b b i n b o y s )______________________ __ 48 1. 73 ~ " 18 26 “ ~ 2 2 " “
1 Excludes prem ium pay f or overt ime and f or work on weekends , ho l idays , and la te shif ts .2 A l l w o r k e r s w e r e p a i d on a t i m e b a s is .3 Inc ludes da ta f or workers in this c lass i f i ca t ion in addi tion to those shown separate ly .

7/21/2019 bls_1551_1967.pdf
http://slidepdf.com/reader/full/bls15511967pdf 35/82
Table 17. Occupational Earnings: Nor th Caroli na—Virginia
( Number and average s tra ight- t ime hou r ly earnings 1 o f workers in se lected occupations in woo l yarn and broadwoven f abr ic m i l l s , November 1966 )
Occupation and sex
N u m b e rof
w o r k e r s
A ve ra gehourly
e a r n i n g s 1
Number o f workers rece iv ing s tra ight- t ime hour ly earnings o f —
$1. 25and
under$1. 30
$1. 30
$1. 35
$1. 35
$1. 40
$1. 40
$1 .45
$1. 45
$1. 50
$1. 50
$1. 60
$1. 60
$1. 70
$1. 70
$1. 80
$1. 80
$1. 90
$1. 90
$2. 00
$2. 00
$2. 10
$2. 10
$2. 20
$2. 20
$2. 30
$2. 30
$2. 40
$2. 40
$2. 50
$2. 50
and
o v e r
A ll pr od u ct io n w or k er s __ ____ 7, 297 $1. 83 15 7 120 130 130 1119 1006 1444 1016 655 290 348 393 299 99 226
M en ------------------------------- ---------------- 3, 749 1. 91 11 1 42 40 56 501 536 552 372 317 116 254 356 285 90 220
W o m e n __ __ _____ 3, 548 1. 74 4 6 78 90 74 618 470 892 644 338 174 94 37 14 9 6
S e l e c t ed w o o l e n o c c u p a t i o n s 2
Me n
C a r d f i n i s h e r s________________________ 73 1. 73 _ _ 12 _ _ _ 4 18 39 _ _ _ _ _ _ _
T i m e___________________ ____________ 51 1.71 - - 12 - - - 2 6 31 - - - - - - -
C ar d s tr ip p er s (a ll t im e w o rk e rs )__ 28 1.69 " " 8 ~ “ “ 2 4 8 6 •*' " "
W o m e n
S p i n n e rs , f r a m e______________________ 196 1. 67 _ _ 40 _ 2 17 8 56 73 _ _ _ - _ _ _
T i m e ----------------- ---------------------------- 114 1.61 - - 40 - - 13 - - 61 - - - - - - -
W in d ers , y arn (a ll t im e w or k er s ) — 53 1. 57 " " 20 5 " 28 - - " “ “ " “
Se lected wors ted occupations
Me n
Dof f ers , spinning f rame( A m e r i c a n s y s t e m ) 3b / _____________ 115 1. 88 1 “ 1 “ 32 17 3 6 8 18 8 12 2 5 2
W o m e n
Do ffers, spinn ing fram e3a /_________ 16 1. 59 _ _ _ 1 1 11 1 _ 1 _ 1 _ _ _ _ -P i n d r a f te r o p e r a t o r s________________ 110 1.71 - - - - 8 28 26 12 15 12 8 - 1 - - -
T i m e________________________________ 56 1. 57 - - - - 7 28 17 4 - - - - - - - -
S p i n n e r s, f r a m e 4-------------------------------- 321 1. 76 2 - - - 5 97 55 20 11 102 21 3 3 1 - 1
T im e_____________________________ 136 1. 57 - - - - 1 87 46 2 - - - - - - - -
A m er ic an sy s te m -------------------------- 319 1. 76 2 - - - 5 97 55 18 11 102 21 3 3 1 - 1
Ti m e____________________ _______ 134 1. 57 - _ - - 1 87 46 - - - - - - - - -
W i n d e r s , y a r n 4_______________________ 622 1.67 2 2 16 46 36 176 68 99 95 61 14 3 3 - 1 -
T im e_____________________________ 217 1. 57 - - 10 8 6 129 6 48 4 6 - - - - - -
Incentive________________________ 405 1. 72 2 2 6 38 30 47 62 51 91 55 14 3 3 - 1 -
Cone and tube, high spee d,n o n a u t o m a t i c____________________ 408 1 .60 2 2 16 43 34 168 47 33 29 19 11 2 2 - - -
T i m e____________________________ 164 1. 53 _ - 10 7 5 123 5 11 _ 3 _ _ - _ _ _
Incentive________________________ 244 1. 64 2 2 6 36 29 45 42 22 29 16 11 2 2 " “
1 Excludes prem ium pay f or overt ime and f or work on weekends , ho l idays , and la te shi fts .2 Data are not presented separate ly f or occupations assoc ia ted with weaving opera t ions s ince inf ormation was obta ined f rom too f ew o f the la rge mi l l s having such opera t ions . Employmen t
and earnings es t imate s f or these occu pations a re , however , inc luded in the data for a l l product ion workers .3 Insuf f i c ient data to warrant presenta t ion o f s epara te averages by method o f wage payment; ( a ) predominan tly t ime work ers , and (b ) predominantly incentive workers .4 Inc ludes da ta f or work ers in this c lass i f i ca t ion in addi t ion to those shown separate ly .

7/21/2019 bls_1551_1967.pdf
http://slidepdf.com/reader/full/bls15511967pdf 36/82
( Number and average s tra ight- t ime hour ly earnings 2 o f workers in se lected occupations in woo l yarn and broadwoven f abr ic m i l l s , Novem ber 1966 )
Table 18. Occupational Earnings: Philadelp hia—Camden, Pa.—N.J. 1
Occupation and sex
Numberof
w o r k e r s
A ve ra gehourly
earnings2
Number o f workers rece iv ing s tra ight- t ime h our ly earnings o f—
$1 .40and
under$1 .45
$1.45
$1. 50
$1. 50
$1. 60
$1. 60
$1. 70
$1. 70
$1. 80
$1. 80
$1. 90
$1. 90
$2. 00
$2. 00
$2. 10
$2. 10
$2. 20
$2. 20
$2. 30
$2. 30
$2. 40
$2. 40
$2. 50
$2. 50
$2. 60
$2. 60
$2. 70
$2. 70
$2. 80
$2. 80
$2. 90
$2. 90
$3. 00
$3. 00
$3. 10
$3. 10
$3. 20
$3. 20
and
over
A ll pr od uc ti on w o rk e r s ------------- — 1,502 $2. 06 1 8 23 14 218 261 170 215 261 101 29 68 30 32 17 21 11 13 1 8
M en _______________________ _________ 1 ,008 2. 13 - 2 9 8 69 124 147 162 190 89 22 63 28 30 17 21 8 10 1 8W o m e n ___ ________________—----------- 494 1. 90 1 6 14 6 149 137 23 53 71 12 7 5 2 2 - ' 3 3 -
Se lected woo len occupations
Me n
Ca rd fi n is h er s---------------------------------— 121 2. 06 _ _ _ _ 5 _ 42 34 23 _ _ 17 _ _ _ _ _ _ _ _
T i m e___________ __________________ 99 1.99 - - - - 5 - 42 34 18 - - - - _ _ - _ _ _ _
Ca rd st ri p pe rs —--------------------------------- 36 2. 18 - - - - - 2 6 2 16 2 2 - - 4 2 - _ _ _ _T i m e ___ __________ ___ ________ 28 2. 07 - - - - - 2 6 2 16 2 - _ _ - - _ _ _ _ _
F u l l e r t e n d e r s 3 a / __________________ 7 2. 06 _ - _ _ - - 4 2 _ 1 _ _ _ _ _ _ _ _ _ _
L o o m f i x e r s 3b / --------------------------------- 19 2 .68 - - - - - - - - _ - - - _ 11 8 _ _ _ _ _
Sp in ne rs, fr am e--------------------------------- 135 2. 14 - - - - - 4 6 38 66 1 - 10 10 - - - - - _ -
Incentive ___________________________ 85 2. 16 " " “ “ 4 6 37 17 1 10 10 - - - - - -
W o m e n
S p i n n e r s , fr a m e 3 a / _________ ______ 33 2. 13 _ _ _ _ _ 2 _ 6 19 4 _ 2 _ _ _ _ . _ .
W i n d e r s 4___ ____________ __________ 145 1. 88 - - - - 53 54 1 23 12 1 - 1 _ _ _ - _ _ _ _
T im e ___— ________________ -___ 91 1. 82 - - - - 50 33 - 8 - - - - _ _ - _ _ _ _ _
Ince ntive ________________ _____ 54 1. 98 - - - - 3 21 1 15 12 1 - 1 - _ _ _ _ _ _ _
Cone and tube , high speed, .
n o n a u t o m a t i c3 a / ------------------------ 99 1. 84 “ - “ 53 27 1 15 3 - - - -
Se lected woo len and wors tedo c c u p a t i o n s 5
M en
Janitors ( exc luding ma chineryc l e a n e r s ) ____ _ _____________________ 6 1. 84 - - - - 3 2 - - 1 - - - _ _ _ _ _ _ _ _
M a c h i n i s t s , m a i n t e n a n c e__________ 6 2. 93 _ _ - _ - - - _ - - - _ 1 2 _ _ _ 2 _ 1Tru cker s , hand ( inc luding
bobb in b oys ) _ __ _______ __ _____ 22 1. 88 “ 1 8 7 “ “ 6 “ - - -
1 The Phi lade lphia—Camden Area co ns is ts o f De laware and Phi lade lphia Counties , P a . , and Camden County , N . J .2 E xc ludes prem ium pay f or overt im e and f or work on weekends , ho l idays , and la te shi f ts.
3 Insuf f i c ient da ta to warrant presenta t ion o f s epara te averages by method o t wage payment; ( a ) predominantly t imework ers , o r ( b ) predominantly incentive worke rs .4 Inc ludes da ta f or worke rs in this c lass i f i ca t ion in addi t ion to those shown separate ly .8 A l l w o r k e r s w e r e p a i d o n a t i m e b a s i s .
10<0
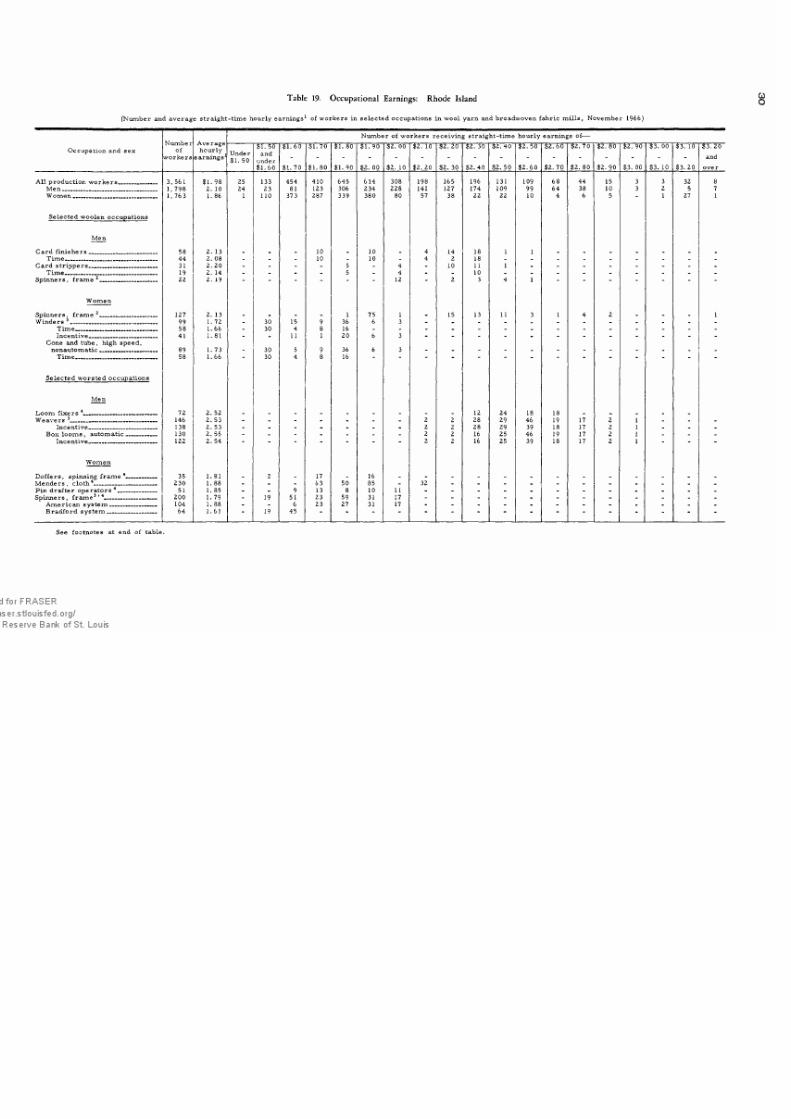
7/21/2019 bls_1551_1967.pdf
http://slidepdf.com/reader/full/bls15511967pdf 37/82
Table 19. Occu pational Earnings: Rhode Island
( Number and average s tra ight- t ime hour ly earnings1 o f workers in se lected occupations in woo l yarn and broadwoven f abr ic mi l l s , November 1966 )
Occupation and sex
N u m b e rof
w o r k e r s
A ve ra gehourly
e a r n i n g s 1
Number o f work ers rece iv ing s tra ight- t ime hour ly earnings o f —
Under$1. 50
$1. 50and
under$1. 60
$1. 60
$1. 70
$1. 70
$1. 80
$1. 80
$1. 90
$1. 90
$2. 00
$2. 00
$2. 10
$2. 10
$2. 20
$2. 20
$2. 30
$2. 30
$2. 40
$2. 40
$2. 50
$2. 50
$2. 60
$2. 60
$2. 70
$2. 70
$2. 80
$2. 80
$2. 90
$2. 90
$3. 00
$3. 00
$3. 10
$3. 10
$3. 20
$3. 20
and
o v e r
A ll pr od uc ti on w or ke rs 3, 561 $1. 98 25 133 454 410 645 614 308 198 165 196 131 109 68 44 15 3 3 32 8M en _______ ... 1 ,798 2. 10 24 23 81 123 306 234 228 141 127 174 109 99 64 38 10 3 2 5 7W o m e n 1 ,763 1. 86 1 110 373 287 339 380 80 57 38 22 22 10 4 6 5 - 1 27 1
Se lected woo len occupations
Me n
Card f inish ers ... ....... 58 2. 13 _ _ _ 10 _ 10 _ 4 14 18 1 1 _ _ _ _ _ _ _
Ti m e________________________________ 44 2. 08 _ _ _ 10 - 10 - 4 2 18 _ _ - _ _ _ - _ _
C a r d st r i p p e r s _ .... 31 2. 20 _ _ - _ 5 _ 4 - 10 11 1 _ _ _ _ _ - - _
T im e_____________________________ _ 19 2. 14 _ _ - - 5 _ 4 - _ 10 _ _ - _ - _ - - _
S p i n n e rs , f r a m e 2_ ___ __ __ __ __ __ __ ___ _ 2 2 2. 19 " " “ - - 12 “ 2 3 4 1 “ - - - -
W o m e n
Sp inn ers, f ram e 2_________ ___ ___ 127 2. 13 _ _ _ _ 1 75 1 _ 15 13 11 3 1 4 2 _ _ _ 1W inde r s 3__________________________ __ 99 1. 72 _ 30 15 9 36 6 3 - _ _ - _ - _ - _ _ _ _
T i m e ______________________ __ 58 1.66 _ 30 4 8 16 _ _ - _ _ - _ _ _ _ _ - _ _
Incentive_______________________ 41 1. 81 - _ 11 1 20 6 3 - _ _ _ _ _ _ _ _ _ _ _
Cone and tube , high speed,no na uto m atic ____________________ 89 1. 73 - 30 5 9 36 6 3 - - - - - - - - - - - -
T i m e_________________________ _ 58 1. 66 - 30 4 8 16 “ - - - “ - - “ - - -
S e l e c t ed w o r s t e d o c c u p a t io n s
M en
L o o m f i x e r s 4_________________________
72 2. 52 _ _ _ _ _ _ _ _ _ 12 24 18 18 _ _ _ _We avers 3______________________________ 146 2. 53 - - - - - - - 2 2 28 29 46 19 17 2 1 - _ -
Incentive_______________________ 138 2. 53 - - - - _ - - 2 2 28 29 39 18 17 2 1 _ _ -
B o x l o o m s , a u t o m a t i c__________ 130 2. 55 - _ - - - - - 2 2 16 25 46 19 17 2 1 _ _ -
Incentive ----------------------------------- 122 2. 54 - “ " ~ - - 2 2 16 25 39 18 17 2 1 “ -
W o m e n
Co f f ers , spinning f rame 4__________ 35 1. 81 _ 2 _ 17 _ 16 _ _ _ _ _ _ _ _ _ _ _ _ _
M e n d e r s , c l o t h 4- -- -- --- -- -- ---- -- -- ---- -- --- -- -- 2 30 1 . 8 8 - - - 63 50 85 - 32 - - - - - - - - - - _
Pin dra f ter opera tors 4_____________ 51 1. 85 - - 9 13 8 10 11 - - - - - - - - - - - -
Spinners , f ra m e3 ’ 4__________________ 200 1 . 79 - 19 51 23 59 31 17 - - - - - - - - - - - -
A m er ic an sy st e m ____________________ 104 1 . 88 - - 6 23 27 31 17 - - - - - - - - - - - -
B r a d f o r d s y s t e m _____________________ 64 1.61 “ 19 45 ~ " _ ~ “ " " " " " _
See footnotes at end of table.

7/21/2019 bls_1551_1967.pdf
http://slidepdf.com/reader/full/bls15511967pdf 38/82
Table 19. Occupational Earnings: Rhode Island-— Continued
( Number and average s tra ight- t ime hour ly earnings1 o f workers in se lected occupations in woo l yarn and broadwoven f abr ic m i l l s , November 1966 )
Numberof
w o r k e r s
Av er ag ehourly
earnings1
Number o f worke rs rece iv ing s tra ight- t ime hou r ly earnings o f —
Occupation and sexUnder$1. 50
$1. 50and
under
$1.60
$1. 60
$1. 70
I s T T W
$1. 80
“$l7 8"0
$1. 90
$1. 90
$2. 00
$2. 00
$2. 10
$2. 10
$2. 20
$2. 20
$2. 30
$2. 30
$2 .40
$2. 40
$2. 50
$2. 50
$2. 60
$2. 60
$2. 70
$2. 70
$2. 80
$2. 80
$2. 90
$2. 90
$3. 00
$3. 00
$3. 10
$3. 10
$3. 20
$3. 20
and
over
S e l e c t e d w o r s t e d o c c u p a t i o n s —Continued
W o m e n — C o n ti n u ed
Winders 123______________________________ 314 $1. 79 9 113 59 80 18 18 1 12 2 1 1T im e____________________________ 2 36 1. 72 - 9 113 48 50 10 6 - - - - - - - - - _ - -
Incentive__1____________________ 78 1. 98 - - - 11 30 8 12 1 12 2 - 1 1 - - - - - -
Cone and tube , au tomatic_______ 71 1. 76 - - 36 4 28 - 3 - - - - - - - - - - - -
T i m e ___________________________________ 62 1. 74 - - 36 4 22 - - - - - - - - - - - - - _
Cone and tube , high speed,n o n a u t o m a t i c_________________________ 120 1 . 88 9 4 21 48 12 9 1 12 2 1 1
T i m e _______________________________ _— 55 1. 74 - 9 4 12 26 4 - - - - - - - - - _ _ - _
Incentive _____________________________65 2. 00 - - - 9 22 8 9 1 12 2 - 1 1 - - _ _ _ _
Fi l l ing , automatic 4 _________________ 77 1.69 - 69 - 4 4 - - - “ " “ “
Se lected woo len and wors tedoccupations 4
Me n
Tru ckers , hand ( inc ludingb o b b i n b o y s ) ______________________ ________
93 1. 78 4 25 13 37 6 7 1
W o m e n
Tru ckers , hand ( inc ludingb o b b i n g i r l s )________________________ 9 1.68 _ _ 6 3 _ _ _ _ _ _ _ _ _ _ _ _ _ _ _
1 Excludes prem ium pay f or overt ime and f or work on weekends , ho l idays , and la te shi fts .2 Insuf f i c ient da ta to warrant pub l i ca t ion o f s epara te averages by method o f wage payment, predom inantly t imeworke rs .3 Inc ludes da ta f or work ers in this c lass i f i ca t ion in addi t ion to those shown separate ly .4 A l l w o r k e r s w e r e p a i d o n a t i m e b a s i s .
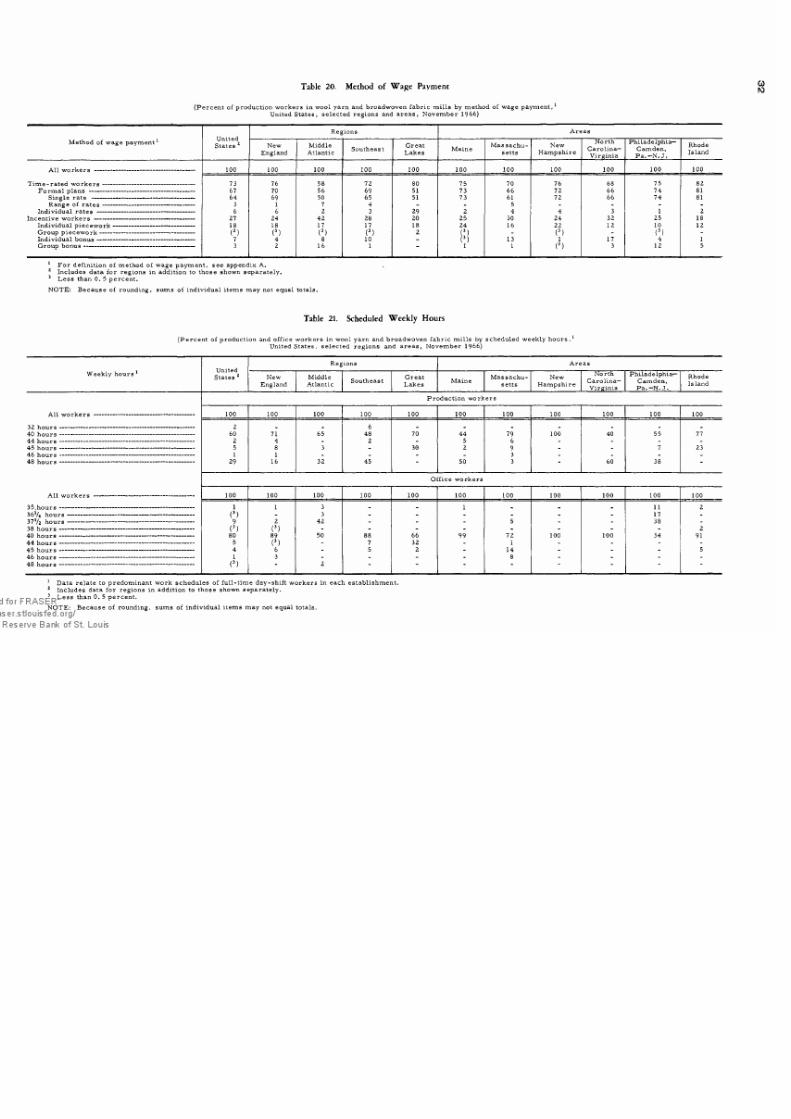
7/21/2019 bls_1551_1967.pdf
http://slidepdf.com/reader/full/bls15511967pdf 39/82
Table 20. Method of Wage Payment
(Percen t o f product ion w orkers in w oo l ya rn and b roa dw oven fa b r i c m i l l s b y method o f w a ge pa yment ,
Uni ted Sta tes , s e le c ted reg ions a nd a rea s , Novem b er 1 9 6 6)
Method o f w a ge pa ym ent1United
States 12
Reg;ions A re as
New
England
Middle
At lan ticSoutheast
G rea t
La kesMa ine
M a s s a c h u
setts
New
Ha mps hire
North
Ca ro l ina — V ir gi ni a
Phi la de lphia —Ca mden,
P a.—N. J.
Rhode
Island
A ll w or ke rs ---------------------------- ----------------------- 100 100 100 100 100 100 100 100 100 100 100
Ti m e-r at ed w or k er s------------------------------------------------ 73 76 58 72 80 75 70 76 68 75 82
Form a l p la ns - -- -- -- -- -- -- -- -- -- -- -- -- -- -- -- -- -- -- -- -- -- -- -- -- -- -- -- 6 7 70 56 69 51 73 66 72 66 74 81
Single rate ----------------------------------------------------- 64 69 50 65 51 73 61 72 66 74 81
Ran ge of ra te s------------------------------------------------ 3 1 7 4 - - 5 - - - -Individual rates --------------------------------------------------- 6 6 2 3 29 2 4 4 3 1 2
Incent ive w ork ers - - -- -- -- -- -- -- -- -- -- -- -- -- -- -- -- -- -- -- -- -- -- -- -- -- -- 2 7 24 42 28 20 25 30 24 32 25 18
I n d iv i du a l p i e c e w o r k ------------------------------------------ 18 18 17 17 18 24 16 22 12 10 12
G r ou p p i e c e w o r k ------------------------------------------------- (3 ) (3 ) (3 ) (3 ) 2 (? ) - (3 ) - (3 ) -
Ind ivid ual bo n u s--------------------------------------------------- 7 4 8 10 - (3 ) 13 1 17 4 1Gr oup b on u s---------------------------------------------------------- 3 2 16 1 “ I 1 (3 ) 3 12 5
1 F o r d e f i n i t io n o f m e t h o d o f w ag e p a y m e n t , s e e a p p e n d ix A .
2 Inc ludes da ta fo r reg ions in a ddi t i on to thos e s how n s epa ra te ly .3 L e s s t h an 0 . 5 p e r c e n t .
NO TE: Beca us e o f rounding , s ums o f indiv idua l i tems ma y no t eq ua l to ta l s.
Table 21. Scheduled W eek ly Hours
(Percen t o f product ion a nd o f f i ce w orkers in w oo l ya rn and b roa dw oven fa b r i c m i l l s b y s cheduled w eek ly hou rs ,1Uni ted Sta tes , s e le c ted reg ions a nd a rea s , Novem b er 1 96 6 )
Week ly hours 1United
States 2
Reg ion s A r ea s
New
England
Middle
At lan ti cSoutheast
G rea t
La kesMa ine
M a s s a c h u
setts
Ne w
Ha mps hire
North
Ca ro l ina —
V ir gi n ia
Phi la de lphia —Ca mden,
P a.—N. J.
Rhode
Island
P r o d u c t i o n w o r k e r s
A ll w or ke rs ------------- ----------------- --------------- ------- 100 100 100 100 100 100 100 100 100 100 100
32 ho ur s ---------------------------------------------------------------------- 2 _ _ 6 _ _ _ _ _ _ _
40 ho ur s ---------------------------------------------------------------------- 60 71 65 48 70 44 79 100 40 55 77
44 ho ur s ---------------------------------------------------------------------- 2 4 - 2 - 5 6 - - - -
45 ho ur s ---------------------------------------------------------------------- 5 8 3 - 30 2 9 - - 7 23
46 h o u r s---------------------------------------------------------------------- 1 1 - - - _ 3 - - - _
48 h o u r s---------------------------------------------------------------------- 29 16 32 45 " 50 3 - 60 38
O f f i c e w o r k e r s
A ll w or k er s ------------ ----------------- --------------- -------- 100 100 100 100 100 100 100 100 100 100 100
SS .h ou rs ---------------------------------------------------------------------- 1 1 3 _ _ 1 _ _ _ 11 2
36 V 4 h o u rs ------------------------------------------------------------------ (3 ) - 3 - - - - - - 17 -
37 V 2 h o u r s ------ —-------------------------------------------------------- 9 2 42 - - - 5 - - 38 -
38 h o u rs ---------------------------------------------------------------------- (3) (3 ) - _ - - - - - - 2
40 ho ur s ---------------------------------------------------------------------- 80 89 50 88 66 99 72 100 100 34 9144 ho ur s ---------------------------------------------------------------------- 5 (3 ) - 7 32 - 1 - - - -
45 h o u rs ---------------------------------------------------------------------- 4 6 - 5 2 - 14 - - - 5
46 ho ur s ---------------------------------------------------------------------- 1 3 - - - - 8 - - - -
48 hours (3 ) "
2' " " ' ' '
1 D a ta re la te to predomina n t w ork s chedules o f fu l l - t ime da y -s hi ft w orkers in ea ch es ta b l i shment .
2 Inc ludes da ta fo r reg ions in a ddi t i on to thos e s how n s epa ra te ly .
3 L e s s t h a n 0 . 5 p e r c e n t .
NO TE: Beca us e o f rounding , s ums o f indiv idua l i tems ma y no t eq ua l to ta l s.

7/21/2019 bls_1551_1967.pdf
http://slidepdf.com/reader/full/bls15511967pdf 40/82
Table 22. Shift Differential Provisions
(Percen t o f product ion w orkers b y s hi ft d i f fe rent ia l prov is ions 1 in w oo l ya rn a nd b roa dw oven fa b r i c m i l l s ,
Uni ted Sta tes, s e le c ted reg ions a nd a rea s , Novemb er 1 96 6)
Shi ft d i f fe rent ia lUnitedStates 2
Reg ions A re as
New
England
Middle
At la nt icSoutheast
G rea t
La kesMa ine
M a s s a c h u
setts
Ne w
Ha mps hire
North
Ca ro l ina —
Vi rg in ia
Phi la de lphia —Ca mden,
P a . - N . J .
Rhode
Island
Second s hi ft
Work ers in e s ta b li s hments ha v ing
s e c o n d - s h i ft p r o v i s i o n s -------------------- ----------------- 98. 1 98. 3 95. 8 99. 5 86. 2 94. 2 100. 0 100. 0 9 8.7 96. 8 100. 0With s hi ft d i f fe rent ia l ------------------------------------ 50. 3 69. 1 85. 8 23. 1 48. 0 34. 3 87. 3 79. 3 14. 6 91. 6 73. 3
U n if or m ce nts p er h o u r------------------------------ 47. 7 68. 0 64. 6 23. 1 41. 1 34. 3 86. 0 79. 3 14. 6 61. 7 69. 82 c e n t s ------------------------------------------------------ . 7 1. 7 - - - - 1. 6 6. 3 - - -
3 c e n t s------------------------------------------------------
5. 3 - 1. 0 10. 1 - - - - 11.3 - -4 ce n ts ------------------------------------------------------- 23. 2 48. 8 16. 0 - - 28. 9 37. 4 54. 0 - 3 1 .4 67. 2
5 c e n t s ------------------------------------------------------ 13. 7 17. 6 9. 6 10. 9 27. 8 5 .4 47. 0 1 9 . 0 3. 3 23. 5 2. 6
7 ce n ts ------------------------------------------------------- . 8 _ 5. 7 - 6. 3 - - - - 6. 8 -
7V2 c e n t s ----------------------------------- ,-------------- . 9 - - 2. 1 - - - - - - -
9 c e n t s ------------------------------------------------------ 1. 8 - 17. 5 - 7. 0 - - - - - -
10 ce n t s ---------------------------------------------------- 1. 1 - 12. 0 - - - - - - - -
13 cen ts ---------------------------------------------------- . 2 - 2. 7 - - - - - - - -
U n i f o r m p e r c e n t a g e ------------------------------------ 2. 6 1. 1 21. 2 - 6. 9 - 1. 3 - - 29. 9 3. 5
4 p e r c e n t -------------------------------------------------- . 3 .8 - - - - - - - - 3. 5
5 p e r c e n t -------------------------------------------------- 2. 3 . 3 21. 2 - 6. 9 - 1. 3 - - 29. 9 -
W i th n o s h i f t d i f f e r e n t i a l -------------------------------- 47. 8 29. 2 10. 0 76. 4 38. 2 60. 0 12. 7 20. 7 84. 0 5. 2 26. 7
Third o r o ther la te s hi ft
Work ers in e s ta b l is hme nts ha v ing thi rd-or oth er late -sh ift prov isio ns --------------------------- 93. 8 9 1 .0 85. 3 99. 5 74. 7 94. 2 87. 5 92. 2 98. 7 84. 8 91. 2
With s hi ft d i f fe rent ia l ------------------------------------ 76. 1 70. 3 77. 4 80. 9 57. 4 39. 1 85. 3 79. 1 97. 9 84. 8 75. 8
U nif or m ce nt s p er h ou r ------------------------------ 7 2.4 67. 3 56. 2 80. 9 41. 1 39. 1 85. 3 79. 1 97. 9 54. 9 63. 5
3 c e n t s ------------------------------------------------------ . 4 - - - - - - - - - -
4 c e n t s ---------------------------- -------------------------- 1. 0 2. 4 - - - 8. 3 1. 6 - - - -
5 c e n t s ------------------------------------------------------ 27. 7 3. 8 1. 0 57. 8 7. 7 - 4. 6 11. 8 83. 2 - 1. 06 c e n t s ------------------------------------------------------ 5. 6 1 . 8 3. 1 10. 1 - - - - 11. 3 - 8. 2
7 c e n t s --------------------------------------------------------------------- 21. 2 47. 1 8. 6 1 .4 6. 3 24. 1 58. 9 49. 4 1 . 2 2 1 .0 46. 7
7 V 2 c e n t s ---------------------------------------------------------------- 1 . 6 . 5 - - - 1. 9 - - - - -
8 c e n t s --------------------------------------------------------------------- 4. 2 . 7 - 8. 1 1 0 . 1 - - 3. 2 - - -
10 cents ------------------------------------------------------------------ 4. 7 4. 8 20. 8 1. 4 1 0 . 1- - 14. 8 2. 1 34. 0 7. 7
1 2 cents ------------------------------------------------------------------ 3. 5 5 .0 17. 5 - - - 20. 3 - - - -
13 cents ------------------------------------------------------------------ . 3 - - - 7. 0 - - - - - -
15 cents ------------------------------------------------------------------ 1. 4 - 5. 1 2. 1 - - - - - - -
2 2 V 2 cents ------------------------------------------------------------ . 3 - - - - - - - - - -
25 cents ------------------------------------------------------------------ . 5 1 . 2 - - - 4. 8 - - - - -
U n i f o r m p e r c e n t a g e ---------------------------------------------- 3. 7 3. 0 21. 2 - 16. 3 - - - - 29. 9 12. 45 percent -------------------------------------------------------------- . 3 - - - 6. 9 - - - - - -
1 0 percent ------------------------------------------------------------- 3 .4 3. 0 21. 2 - 9 .4 - - - - 29. 9 12. 4
With no s hi ft d i f fe rent ia l ------------------------------------ 17. 7 20. 6 7. 9 18. 6 17. 3 55. 1 2. 2 13. 0 . 8 15. 4
1 Re fer s to po l i c i e s o f e s ta b l is hments e i ther current ly opera t ing la te shi fts o r ha v ing prov is ions cover ing la te s hi fts.
2 Includes data for reg ions in addition to those shown separately .
NO TE: Beca u s e o f rounding , s ums o f indiv idual i tems m a y not eq ua l to ta l s .
COCO

7/21/2019 bls_1551_1967.pdf
http://slidepdf.com/reader/full/bls15511967pdf 41/82
Table 23. Shift Differential Practices CO
A
( Perce nt o f product ion w orkers employed on la te s hi fts in w oo l ya rn a nd b roa dw oven fa b r i c m i l l s b y a mount o f s hi ft d i f fe rent ia l ,United States, se lected region s and area s, No vem ber 1966)
Shi ft d i f fe rent ia lUnited
States 1
Reg ions A re as
Ne w
England
Middle
At lan ticSoutheast
G rea t
La kesMa ine
M a s s a c h u
setts
Ne w
Ha mps hire
North
Ca ro l ina —
Vi rg in ia
Phi la de lphia —
Ca mden,Pa .—N. J.
Rhode
Island
Second s hi ft
Wo rkers em ployed on se cond sh ift ---------------------- 28. 6 28. 5 23. 6 30. 9 18. 5 27. 3 28. 0 26. 5 29. 6 26. 6 3 1 .0R e c e i v i n g s h i f t d i f f e r e n t i a l ------------------------------ 14. 1 19. 6 20. 9 7. 3 10. 7 9. 9 24. 9 20. 4 4. 3 25. 2 21. 2
U n i f o r m c e n t s p e r h o u r ------------------------------- 13. 4 19. 1 15. 4 7. 3 8. 0 9. 9 24. 4 2 0 .4 4. 3 16. 0 19. 62 c e n t s -------------------------------------------------------- . 2 . 5 - - - - . 4 1. 9 - - -
3 cen ts ------------------------------------------------------- 1. 5 _ - 2. 9 _ _ _ _ 3. 3 - -
4 c e n t s -------------------------------------------------------- 6. 6 14. 0 4. 3 _ - 7. 9 10. 5 15. 8 - 7. 7 18. 75 c e n t s -------------------------------------------------------- 4. 0 4. 6 2. 8 3. 8 6. 0 2. 0 13. 5 2. 7 1. 0 6. 9 . 87 c e n t s ------------- -------------------------------------------- . 2 - 1. 8 - 1. 2 - - - - 1. 4 -
7 V 2 c e n t s ---------------------------------------------------- . 3 - - . 6 - - - - - - -
9 cents -------------------------------------------------------- . 4 - 4. 7 - . 8 _ - - - - -
10 ce n ts ------------------------------------------------------- . 2 - 1. 8 - - - - - - - -
13 ce n ts ------------------------------------------------------- (2 ) - . 1 _ - _ _ - - - -
U n i f o r m p e r c e n t a g e -------------------------------------- . 8 . 5 5. 4 - 2. 7 - . 5 - - 9. 1 1. 7
4 p e r c e n t ---------------------------------------------------- . 1 . 4 - - - - - - - - 1. 75 p e r c e n t ---------------------------------------------------- . 6 . 1 5. 4 - 2. 7 - . 5 - - 9. 1 -
R e c e i v i n g n o s h if t d i f f e r e n t i a l ------------------------------- 14. 5 8. 9 2. 7 23. 5 7. 8 17. 5 3. 1 6. 0 25. 3 1 .4 9 .8
Third o r o ther la te s hi fts
Wo rkers em ployed on thi rd o r o ther
la te s hi fts ---------------------------------------------------------------------------------- 16. 6 13. 9 10. 2 2 1 .4 5. 7 20. 9 11.4 10. 0 24. 5 9. 1 14. 0
R e c e i v i n g s h i f t d i f f e r e n t i a l -------------------------------------- 12. 6 9. 1 8. 0 17. 3 3. 7 6. 0 11. 3 7. 5 24. 4 9. 1 11. 1
U n i f o r m c e n t s p e r h o u r ---------------------------------------- 12. 4 8. 7 6. 8 17. 3 3. 7 6. 0 11. 3 7. 5 2 4 .4 7. 7 9. 6
3 c e n t s ------------------------------------------------------------------------ . 1 - - - - - - - - - -
4 c e n t s ------------------------------------------------------------------------ . 1 . 2 _ _ -. 9 - - <- -
5 c e n t s ------------------------------------------------------------------------ 6. 3 . 3 - 13.9 . 9 - . 5 . 7 22. 4 - . 1
6 c e n t s ------------------------------------------------------------------------ . 5 . 1 . 7 .9 - - - - 1 . 6 - .4
7 c e n t s ------------------------------------------------------------------------ 3. 2 7. 2 1 . 8 _ . 2 5. 0 8. 2 6. 4 - 4. 3 8. 2
7 V 2 c e n t s ------------------------------------------------------------------ . 3 (2 ) - - - . 1 - - - - -
8 c e n t s ------------------------------------------------------------------------ 1 . 1 . 1 - 2. 1 2. 1 - - . 4 - - -
10 cen ts ------------- ;-------------------------------------------------------- . 3 . 2 1. 7 . 2 - - - - . 4 3 .4 . 8
12 cents ---------------------------------------------------------------------- . 5 . 6 2. 3 - - - 2. 6 - - - -
13 cen ts ---------------------------------------------------------------------- (* ) - - - . 5 - - - - - -
15 cents ---------------------------------------------------------------------- . 1 - . 3 . 2 - - - - - - -
U n i f o r m p e r c e n t a g e ------------------------------------------------- . 3 . 4 1 . 2 - - - - - - 1. 3 1. 5
1 0 percen t --------------------------------------------------------------- . 3 . 4 1 . 2 - - - - - - 1. 3 1. 5
R e c e i v i n g n o s h i f t d i f f e r e n t i a l ----------------------- 4. 0 4. 8 2. 2 4. 1 2. 0 14. 8 . 1 2 .4 . 1 2. 8
Inc ludes da ta fo r reg ion s in a ddi t i on to thos e s how n s epa ra te ly .
Les s than 0 . 05 percen t .
NO TE : Beca us e o f rounding , s ums o f indiv idua l items ma y no t equa l to tal s ,
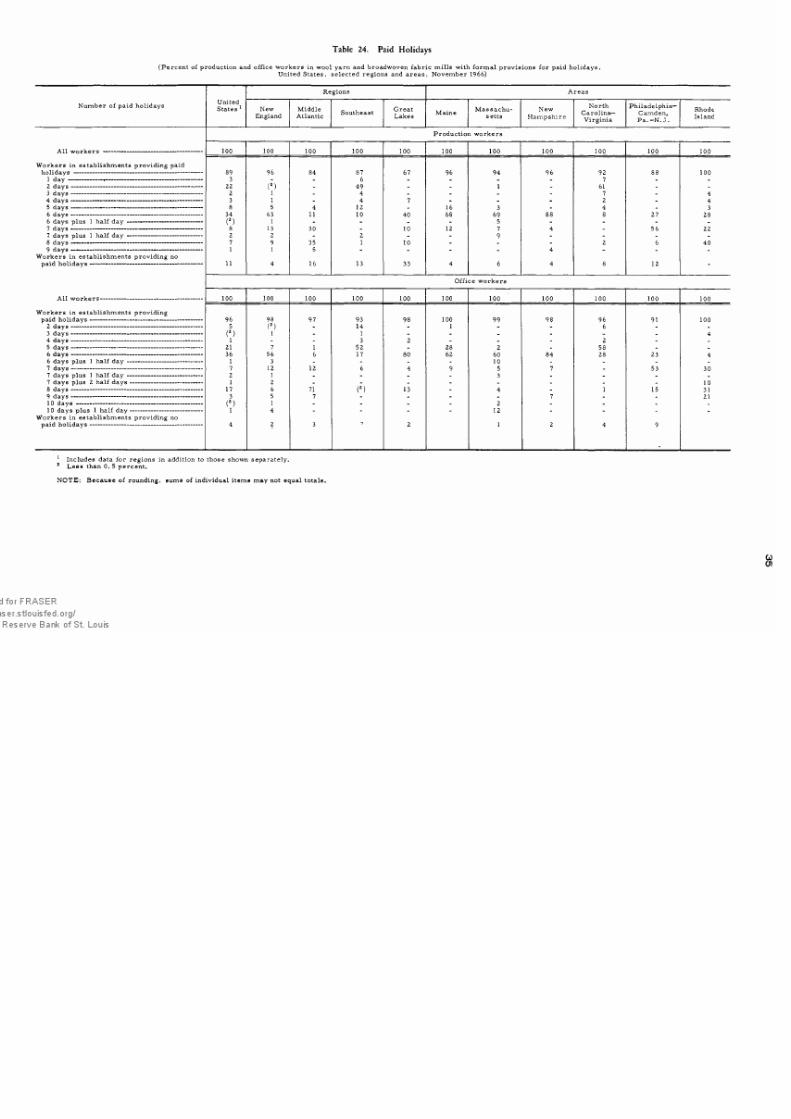
7/21/2019 bls_1551_1967.pdf
http://slidepdf.com/reader/full/bls15511967pdf 42/82
Table 24. Paid Holidays
(Percen t o f product ion and o f f i ce w orkers in w oo l ya rn a nd b roa dw oven fa b r i c m i l l s w i th fo rm a l prov is ions fo r pa id ho l ida ys ,United States, se lecte d regions and area s, No vem ber 1966)
Reg ions A re as
Numb er o f pa id ho l ida ysUnitedStates 1 New
EnglandMiddle
At la nt icSoutheast
G rea tLakes
Ma ineM a s s a c h u
setts
Ne w
H a m p s h i r e
North
Ca ro l ina — V ir gi ni a
Phi la de lphia —
Ca mden,
P a . - N . J .
Rhode
Island
P r o d u c t io n w o r k e r s
A ll w or ke rs ---------------- --------------- ------------
Work ers in e s ta b l i s hments prov id ing pa idho lid ay s ----------------------------------------------------------
1 d a y ----------------- ------------------------------------------
2 d a y s -----------------------------------------------------------
3 d a y s -----------------------------------------------------------
4 d a y s -----------------------------------------------------------
5 d a y s-----------------------------------------------------------
6 d a y s -----------------------------------------------------------
6 d a y s pl u s 1 h a l f d a y ------------------------------
7 d a y s -----------------------------------------------------------
7 da ys p lus 1 ha l f da y ------------------------------
8 d a y s -----------------------------------------------------------
9 d a y s -----------------------------------------------------------
Work ers in e s ta b l is hments prov id ing no
A ll w o rk e r s-
Work ers in e s ta b l i s hments prov id ing
p a i d h o l i d a y s ------------------------------------------
2 d a y s ----------------------------------------------------
3 d a y s ----------------------------------------------------
4 d a y s ----------------------------------------------------
5 d a y s ----------------------------------------------------
6 days -
6 da ys p lus 1 ha l f da y -
7 d a y s -----------------------------
7 da ys p lus 1 ha l f da y -7 days plus 2 half days
8 d a y s -----------------------------
9 d a y s -----------------------------
10 days
1 0 da ys p lus 1 ha l f da y ------------------------
Work ers in e s ta b li s hments prov id ing no
pai d h ol id ay s------------------------------------------------
100 100 100 100 100 100 100 100 100 100 100
89 96 84 87 67 96 94 96 92 88 1003 - - 6 _ - _ _ 7 - _
22 (12) - 49 _ - 1 - 61 - _
2 1 - 4 _ - _ - 7 - 43 1 - 4 7 - _ - 2 - 4
8 5 4 12 - 16 3 - 4 - 334 63 11 10 40 68 69 88 8 27 28
(2 ) 1 _ _ _ _ 5 _ _ _ _
8 13 30 - 10 12 7 4 - 56 222 2 - 2 - - 9 - - - _
7 9 35 1 10 - _ - 2 6 401 1 5 - - - - 4 " " -
11 4 16 13 33 4 6 4 8 12 -
O f f i c e w o r k e r s
100 100 100 100 100 100 100 100 100 100 100
96 98 97 93 98 100 99 98 96 91 1005 (2) _ 14 _ 1 _ _ 6 _ _
(2 ) 1 _ 1 _ _ _ _ _ _ 41 - - 3 2 - _ - 2 _ _
21 7 1 52 - 28 2 _ 58 _ _
36 56 6 17 80 62 60 84 28 23 41 3 - - - - 10 - - - _
7 12 12 6 4 9 5 7 - 53 30
1 2 _ _ _ _ _ _ _ _ 1017 6 71 (2 ) 13 - 4 - 1 15 31
3 5 7 - - - 7 - _ 21
(2 ) 1 _ _ _ _ 2 _ _ _ _
1 4- - "
12- -
4 2 3 2 1 2 4 9
1 Inc ludes da ta fo r reg ions in a ddi t ion to thos e s how n s epa ra te ly .2 L e s s t h an 0. 5 p e r c e n t .
NO TE: Beca us e o f rounding , s ums o f indiv idua l items ma y no t eq ual to ta ls .
GO01

7/21/2019 bls_1551_1967.pdf
http://slidepdf.com/reader/full/bls15511967pdf 43/82
Table 25. Paid Vacations
(Perce nt o f product ion a nd o f f i ce w orkers in w oo l ya rn a nd b roa dw oven fa b r i c m i l l s w i th fo rm a l prov is ions fo r pa id va ca t ionsa fte r s e le c ted per iods o f s e rv i ce , Uni ted Sta tes , s e le c ted reg ions a nd a rea s , Novem b er 1 9 66 )
V ac at io n p ol ic yUnited
States 1
Re g ions A re as
New
England
Middle
At la nt icSoutheast
G rea t
La kesMa ine
M a s s a c h u
settsNe w
Ha mps hire
North
Ca ro l ina —
V ir gi ni a
Phi la de lphia —Ca mden,
P a . - N . J .
Rhode
Island
P r o d u c t i o n w o r k e r s
A ll w or ke rs ---------------------------------------------------- 100 100 100 100 100 100 100 100 100 100 100
Method o f pa yment
Wo rkers in e s ta b l i s hments prov id ing pa id va ca t ions -------------------------------------------------------- 97 97 96 98 79 93 100 99 100 100 97
L e n g t h - o f - t i m e p a y m e n t ---------------------------------- 43 53 75 25 28 63 90 42 20 77 17
P e r c en t a g e p a y m e n t ------------------------------------------ 54 44 21 74 51 30 10 57 80 23 81
Work ers in e s ta b l i s hments prov id ing
no paid vacations --------------------------------------------------- 3 3 4 2 21 7 1 3
Am ou nt of va ca ti on pa y 2
A ft er 1 ye ar of se r vi ce
U n d e r 1 w e e k ------------------------------------------------------------ 4 5 _ 4 _ 16 _ _ _ _ 3
1 we ek ------------------------------------------------------------------------- 83 84 73 83 79 77 100 89 95 74 67
O v e r 1 a nd u nd e r 2 w e e k s -------------------------------------- 4 6 12 1 - - - - - 13 27
2 weeks ----------------------------------------------------------------------- 6 2 11 10 - - - 10 3 13 "
A ft er 3 y ea rs of se r v ic e
1 w eek ------------------------------------------------------------------------- 58 43 32 79 34 71 46 33 97 25 28
O v e r 1 a nd u nd e r 2 w e e k s -------------------------------------- 31 50 54 6 37 22 54 56 - 61 63
2 weeks ----------------------------------------------------------------------- 8 4 11 12 8 10 3 13 6
A ft er 5 ye ar s of se r v ic e
1 w e e k ------------------------------------------------------------------------- 14 27 _ 7 _ 55 32 16 9 _ 8
O v e r 1 a nd u nd e r 2 w e e k s -------------------------------------- 5 4 4 6 - - 3 6 7 - 8
2 we ek s ----------------------------------------------------------------------- 76 61 92 85 79 38 64 72 84 100 66
O ver 2 a nd under 3 w ee ks -------------------------------------- 2 4 - - - - - 4 " 15
A ft er 10 y ea rs o f se rv ic e
1 w e e k ------------------------------------------------------------------------- 12 22 _ 7 _ 34 32 16 9 _ 8
Ov er 1 and und er 2 w ee k s-------------------------------------- 4 3 4 6 - - - 6 7 - 8
2 weeks ----------------------------------------------------------------------- 66 49 50 81 64 57 54 31 84 84 56
O ver 2 and under 3 w eek s -------------------------------------- 7 15 8 - 15 - 12 20 - 16 22
3 weeks ----------------------------------------------------------------------- 8 7 34 4 - 2 2 25 - - 4
A ft er 15 y ea rs of se r v ic e
1 we ek ------------------------------------------------------------------------- 12 22 _ 7 _ 34 32 16 9 _ 8
O v e r 1 a nd u n d er 2 w e e k s -------------------------------------- 4 3 4 6 - - - 6 7 - 8
2 weeks ----------------------------------------------------------------------- 58 39 30 81 31 49 40 31 84 56 39O ver 2 and under 3 w eek s -------------------------------------- 4 10 - - - - 12 20 - - 3
3 weeks ----------------------------------------------------------------------- 18 23 62 4 48 10 16 25 - 44 39
A ft er 20 ye ar s of s e r v ic e 3
1 w e e k ------------------------------------------------------------------------- 12 22 _ 7 _ 34 32 16 9 _ 8
O v e r 1 a nd u n d er 2 w e e k s -------------------------------------- 4 3 4 6 - - - 6 7 - 8
2 weeks ----------------------------------------------------------------------- 57 39 23 81 24 49 40 31 84 56 39
O ver 2 and under 3 w eek s -------------------------------------- 4 10 - - - - 12 20 - - 3
3 weeks ----------------------------------------------------------------------- 17 23 52 2 55 10 16 25 - 44 39
4 w e e k s ----------------------------------------------------------------------- 2 " 17 2 " " " “ " "
See footnotes at end of table,

7/21/2019 bls_1551_1967.pdf
http://slidepdf.com/reader/full/bls15511967pdf 44/82
Table 25. Paid Vacations— Continued
(Percen t o f product ion and o f f ice w ork ers in w oo l ya rn a nd b roa dw oven fa b r i c mi l l s w i th fo rm a l prov is ions fo r pa id va ca t ionsa fte r s e le c ted per iods o f s e rv i ce , Uni ted Sta tes , s e le c ted reg ions a nd a rea s , N ovemb er 1 9 6 6 )
V ac at io n p ol ic y
Reg ions A re as
States 1 NewEngland
Middle
At la nt icSoutheast
G rea t
La kesMa ine
M a s s a c h usetts
Ne wH a m p s h i r e
NorthCa ro l ina —
V ir gi ni a
Phi la de lphia —Ca mden,
P a . - N . J .
RhodeIsland
O f f i c e w o r k e r s
A ll w or ke rs --------------- ---------------- --------------- ------ 100 100 100 100 100 100 100 100 100 100 100
Method o f pa yment
Work ers in e s ta b l i s hments prov id ing
paid vacations ------------------------------------- ------------------- 99 99 98 99 100 99 100 100 100 100 100
L e n g t h - o f- t im e p a y m e n t ----------------------------------- 92 84 94 96 100 72 100 83 100 74 70
P e r c en t a g e p a y m e n t ------------------------------------------ 7 15 4 4 - 27 - 17 - 26 30
Work ers in e s ta b l i s hments prov id ing
no paid va ca ti on s---------------------------------------------------- 1 1 2 1 1 ' “ -
Am ou nt of va ca ti on pa y 2
A ft er 1 ye ar of se rv ic e
Un der 1 w e e k ------------------------------------------------------------ . 2 (4 ) - 5 - - - - - - 3
1 w e e k ------------------------------------------------------------------------- 33 52 10 26 19 72 46 26 13 49 60
O v e r 1 a nd u n d e r 2 w e e k s ----------------------- -------------- (4 ) 1 1 - - - - - - - 4
2 w ee k s----------------------------------------------------------------------- 64 45 87 69 81 26 52 74 87 51 33
3 w ee k s-------------------------------------------------------------------- (4 ) 1 - - - " 2 - " - "
A ft er 3 ye ar s of se rv ic e
1 w e e k ------------------------------------------------------------------------- 16 20 6 20 14 38 11 11 13 23 29O ver 1 and und er 2 w ee k s-------------------------------------- 13 24 5 5 - 27 28 15 - 26- 22
2 w e ek s----------------------------------------------------------------------- 70 54 87 75 86 34 59 74 87 51 493 w e e k s --------------------------------------------- -— --------------------- (4 ) 1 - “ - 2 - - -
A ft er 5 ye ar s of se rv ic e
1 w e ek ------------------------------------------------------------------------ 4 8 _ 3 8 10 10 3 7 . 3
2 w e ek s----------------------------------------------------------------------- 94 91 98 96 92 89 88 97 93 100 97
3 w e e k s -------------------- --------------------------------------------------- (4 ) 1 - - - - 2 - - - -
A ft er 10 y ea rs of se r v ic e
1 w e e k ------------------------------------------------------------------—— 4 8 - 3 8 10 10 3 7 _ 3
2 w e e k s -------------------------------------------------------- -------------- 69 77 20 87 60 89 80 53 93 74 86
O ver 2 a nd under 3 w ee ks --------- ---------------------------- 2 5 4 - - - 5 10 - 26 -
3 w e e k s --------------------------- ------------------------------------------- 23 9 74 9 32 - 4 33 - 11
A ft er 15 y ea rs of se r v ic e
1 w e e k ------------------------------ ---------------------- --------------------- 4 8 - 3 8 10 10 3 7 _ 3
2 w e e k s -------------------------------------------------------- -------------- 49 70 13 51 21 89 69 53 37 51 66
Ov er 2 and under 3 week s —----------------------------------- 2 5 - - - - 5 10 - - 3
3 w e ek s----------------------------------------------------------------------- 44 16 85 46 72 - 15 33 56 49 28
A ft er 20 ye ar s of se r v ic e 3
1 w e e k ---------------------------------------------------------------------— 4 8 - 3 8 10 10 3 7 - 3
2 week s ----------------------------------------------------------------------- 49 70 11 51 21 89 69 53 37 51 66
Ov er 2 and un der 3 w ee ks -------------------------------------- 2 5 - - - - 5 10 - - 3
3 weeks — ---------------------------------------------------- --------------- 25 16 12 40 40 - 15 33 56 49 28
4 week s ----------------------------------------------------------------------- 19 ” 75 6 32 " " _
1 Inc ludes da ta fo r reg ions in a ddi t ion to thos e s how n s epa ra te ly .
2 Va ca t ion pa yments s uch a s percent o f a nnua l ea rnings w ere converted to a n eq uiva lent t ime b a s i s . Per iod s o f s e rv i ce w ere a rb i tra r i ly chos en a nd do not neces s a r i ly re f l e c t theindiv idua l e sta b l i s hment prov is ions fo r p rogres s ion. For exa m ple , the cha nges in proport ions indi ca ted a t 1 0 yea rs ma y inc lude cha nges o ccurr in g b e tw een 5 a nd 10 yea rs .
3 Va ca t ion prov is ions w ere v i r tua l ly the s a me a fte r l onger per iods o f s e rv i ce . Among product ion w orke rs , h ow ever , 3 7 percent in the Middle At la nt i c , 4 percen t in the Southea st ,
a nd 7 percen t in the G rea t La kes reg ions re ce ived 4 w eeks ' a fte r 2 5 yea rs o f s e rv i ce .* Les s tha n 0 . 5 percen t .
NO TE: Beca us e o f rounding , s um s o f indiv idua l i tems ma y not eq ua l to ta l s .

7/21/2019 bls_1551_1967.pdf
http://slidepdf.com/reader/full/bls15511967pdf 45/82
Table 26. Health, Insurance, and Retirement Plans G)00
(P e rcen t o f produ ct ion a nd o f f i ce w orke rs in w oo l ya rn a nd b roa dw oven text i l e m il l s w i th s pec i f i ed hea l th , ins ura nce , a nd
retirem ent plans, United States, selec ted region s and ar eas, Nove m ber 1966)
Type o f p la n 1 United
Sta tes 2
Reg ions A r e a s Reg ions A rea s
Ne wE n gland
M iddle A tl an ti c
Southeast
G rea tLakes
Maine M assa
chusetts
New
Ha mps hire
NorthC arolina— V irginia
P h i l adelphia—Ca mden,P a .—N. J.
RhodeIsland
UnitedSta tes 2
Ne w
E n gland
Middle At la nt ic
South
eastG rea tLa kes
Ma ineM a s s achus e tts
New
Ha mp
s hire
North
C a r olina—
V irginia
P h i l a
delphia—Ca mden,
P a.—N. J.
RhodeIsland
Product ion w orkers O ff i ce w orkers
A ll v /o r k e r s ----------------------
100 100 100 100 1 00 1 00 100 100 100 100 100 100 100 100 100 1 00 1 00 100 100 100 100 100
W orkers in e s ta b l i s hm entsprov id ing :
Life in su ran ce ------------------------ 91 84 91 99 77 93 89 100 100 95 49 94 88 96 99 94 94 94 100 100 94 52
Em ployer f ina nced ------------ 69 72 75 70 43 65 79 89 76 85 49 67 73 85 57 58 54 85 88 39 83 52
Jointly financed. ---------------- 23 12 16 2.9 33 28 9 11 24 10 - 27 15 11 42 36 40 9 12 61 11 -
A cc id en ta l de at h and d is -
m em b erm ent in s ura nce ----- 60 76 70 44 52 89 63 100 34 88 47 63 77 65 43 70 88 68 100 40 91 48
Em ployer f ina nced------------ 44 65 61 27 25 62 56 89 16 78 47 45 63 57 25 36 48 60 88 17 79 48J o int ly f ina nced ---------------- 16 11 9 17 26 28 7 11 18 10 - 18 14 9 17 34 40 8 12 23 11 -
S i cknes s a nd a cc ident ins ura nce o r s ick l ea veo r b o t h 3 — ----------------------------- 74 73 44 82 58 92 77 100 86 71 14 79 77 91 84 55 95 77 100 94 60 14
Sicknes s a nd a cc identin su r a n ce------------------------- 74 73 44 82 58 92 77 100 86 71 14 51 69 43 37 55 87 70 100 21 60 14
Em ployer f in a n ced ----- 49 61 34 47 25 64 67 89 61 68 14 27 54 16 5 36 47 60 88 - 55 14Jointly fin a n ced ---------- 25 12 10 36 33 28 9 11 25 3 - 24 15 27 32 19 40 9 12 21 6 -
Sick leave (full pay, no
w a i t ing per iod) -------------- - - - - - - - - - - 40 18 81 51 5 - 7 43 86 - 3
S ick l ea ve (pa rt ia l pa yor w a i t ing per iod) --------— 1 - 9 - - - - - - - - (4 ) - - - - - 12 - - - -
Hos pi ta l i za t ion ins ura nce — 95 94 94 99 72 83 97 9 6 100 95 99 96 95 97 99 87 86 98 9 8 100 94 100
Cover ing em ployeeson ly ----------------------------------- 52 43 74 58 25 46 38 43 70 « 72 40 54 40 83 56 36 51 30 50 69 68 23
Em ployer fin a n ced ----- 46 36 63 55 25 41 23 43 69 72 31 48 33 80 51 36 43 15 50 68 68 23J o int ly f in a n ced ---------- 6 7 11 3 - 5 15 - 1 - 8 6 7 3 5 - 8 15 - 1 - -
Cover ing em ployees a nd
the i r dependents ------------ 43 51 20 41 47 36 59 54 30 23 59 43 55 14 43 5 2 35 68 48 31 27 77
Em ployer f in a n ced ----- 9 19 11 - 12 - 30 4 - 20 40 11 26 5 - 10 - 45 7 - 21 56
Jointly fin a n ced ----------
25 15 9 37 35 20 28 5 25 3 8 25 14 10 39 4 2 12 23 9 27 6 10Em ployer f ina nced fo r
em ployees , jo int ly
f i n a n c ed f o r d e -
p e n d e n t s --------------------- 9 17 - 4 - 16 - 45 5 - 11 6 14 - 5 - 23 - 32 4 - 11
Surg i ca l ins ura nce ------------- -- 94 90 94 98 72 83 92 96 100 95 91 96 93 97 99 8 7 86 95 98 100 94 95Cover ing em ployees
on ly ----------------------------------- 50 39 74 57 25 46 33 43 70 72 31 53 38 83 56 36 51 27 50 69 68 18Em ployer f ina nced ----- 44 33 63 55 2 5 41 18 43 69 72 23 47 31 80 51 36 43 13 50 68 68 18J o int ly f ina nced ---------- 6 7 11 2 - 5 15 - 1 - 8 6 7 3 4 - 8 15 - 1 - -
Cover ing em ployees a nd
the i r dependents ------------- 43 51 20 41 47 36 59 54 30 23 59 43 55 14 43 52 35 68 48 31 26 77Em ployer fin a n ced ----- 9 19 11 - 12 - 30 4 - 20 40 11 26 5 _ 10 - 45 7 _ 21 56Join tly fin a n ced --------— 25 15 9 37 35 20 28 5 25 3 8 25 14 10 39 42 12 23 9 27 6 10Em ployer f ina nced fo r
em ployees , jo int ly
f ina nced fo r de -
p e n d e n t s --------------------- 9 17 “ 4 " 16 " 45 5 11 6 14 ~ 5 23 32 4 11
See foo tno tes a t end o f ta b le .

7/21/2019 bls_1551_1967.pdf
http://slidepdf.com/reader/full/bls15511967pdf 46/82
Table 26. Health, Insurance, and Retire ment Plans-----Continued
(Perce nt o f product ion a nd o f f ice w ork ers in w oo l ya rn a nd b roa dw oven text i le m i l l s w i th s pec i f i ed hea l th , ins ura nce , a nd
re t i rement p la ns , Uni ted Sta tes , s e le c ted reg ions a nd a rea s , N ovemb er 1 9 66 )
Type o f p la n 1United
Sta tes2
Regions A re as R eg io ns A re as
NewEng
land
Middle
At lan ticSouth
east
GreatLakes
MaineM a s s a
chus e tts
New
Ha mp
s hire
North
C a r o
lina— V ir
ginia
Phi ladelphia—
Camden,
Pa .—N. J.
Rhode
Island
United
Sta tes2New
E n g
land
Middle A tla nt ic
South
east
G rea t
La kesMa ine
M a s s a
chus e tts
New
H a m p
s hire
North
C a r o
lina— V ir
ginia
Phi la
delphia—
Camden,Pa .—N. J.
Rhode
Island
Product ion w orkers O f f i c e w o r k e r sW orkers in e s ta b l i s hments
p r o v i di n g — C o n ti n u ed
Medica l ins ura nce ---------------- 62 79 66 46 43 83 45 96 32 41 91 83 80 84 90 69 86 58 98 95 58 93C o v e r in g e m p l o y e e s
o n l y ---------- - — -------------------- 28 36 55 16 15 46 17 43 9 28 31 50 34 78 54 32 51 17 50 68 42 15E m p l o y e r f i n a n c e d ----- 23 29 4 4 14 15 41 2 43 9 28 23 44 28 75 50 32 43 2 50 68 42 15
J o i n tl y f i n a n e e d ---------- 6 7 11 2 - 5 15 - - - 8 6 7 3 4 - 8 15 - - - -
Cover ing emp loyees a ndt h e i r d e p e n d e n t s ------ ----- 34 43 11 31 28 36 28 54 23 13 59 34 45 6 36 36 35 41 48 26 17 77
E m p l o y er f i n a n c e d ----- 6 14 8 - - - 10 4 - 13 40 7 17 4 - - - 19 7 - 17 56
J o in t l y f i n a n c e d ---------- 20 12 3 28 28- 20 18 5 18 - 8 22 14 2 34 36 12 22 9 23 - 10
Employer f ina nced fo r
e m p l o y e e s , j o i n t ly
f i n a n ce d f o r d ependents — 8 17 - 2 - 16 - 45 5 - 11 5 14 - 2 - 23 - 32 4 - 11
C a t a st r op h e i n s u r a n c e --------- 20 26 26 15 24 28 21 44 13 13 7 43 32 39 57 54 35 28 51 75 26 6
C o v e r in g e m p l o y e e so n l y ----------------------------------- 8 12 19 (4 ) 15 14 5 35 I 7 - 28 17 32 37 32 26 3 41 57 23 -
E m p l o y er f i n a n c e d ----- 6 11 12 15 14 2 35 - 7 - 26 15 29 37 32 26 2 41 56 23 -
J o i n t l y f i n a n c e d ---------- 1 1 7 ( 4") - - 3 - 1 - - 1 2 2 (4 ) - - 1 - 1 - -
Cover ing employees a nd
the i r dependents ------------- 13 14 8 15 9 14 16 8 12 7 7 16 15 8 20 22 9 25 10 18 4 6
E m p l o y er f i n a n c e d ----- 2 5 3 - - - 6 4 - 7 7 3 7 1 - - - 11 7 - 4 6
J o i n t l y f i n a n c e d ----------9 6 5 14 9 14 10 - 12 - - 12 7 7 20 22 9 13 - 18 - -
Employer f ina nced fo rem ployees , jo int ly
f ina nced fo r de -p e n d e n t s--------------------- 1 2 - 1 - - 4 - - (4 ) 1 - (4 ) - - - 2 - -
Re t i rement p la ns :Pens ion p la ns 5 ----------------- 40 20 48 59 22 10 14 5 79 51 52 22 79 66 57 24 16 9 76 - 44
E m p l o y e r
f i n a n c e d----------------- 37 20 43 53 22 10 14 5 74 - 51 33 22 72 19 57 24 16 9 6 - 44
J o i n t l y f i n a n c e d ----- 3 - 5 7 - - - - 6 - - 18 - 7 48 - - - - 70 - -
A ct u ar ia l p l a n ------------- 19 16 44 18 7 10 11 5 15 - 35 30 13 78 23 25 24 3 9 1 - 27E m p l o y e r
f ina nced ---------------- 17 16 39 13 7 10 11 5 13 - 35 27 13 71 17 25 24 3 9 - - 27J o in t l y f i n a n c e d ----- 3 - 5 5 - - - - 2 - - 4 - 7 6 - - - - 1 - -
An nu ity ty pe p r of it -s ha r ing p la n ------------- 20 4 4 40 15 - 3 - 61 - 15 7 9 (4 ) 3 32 - 13 - 2 - 18
E m p l o y e r
f i n a n c e d ---------------- 20 4 4 40 15 - 3 - 61 - 15 7 9 (4 ) 2 32 - - - - - -
J o i n tl y f i n a n c e d ----- - - - - - - - - - - - (4 ) - 1 - - 13 - 2 - 18
Both types o f p la ns 6 - - 1 - - 1 - - - 4 - - 14 - - 41 - - - - 67 - -
L u m p - s u m p a y m e n t s ------ 6 9 3 - 10 8 12 12 - 16 - 8 10 11 - 13 20 9 7 - 26 -
N o p l a n s ----------------------------------- 2 1 6 21 ” “ " - 5 1 ' 1 1 3 3 2
"~ 6
Inc ludes only thos e p la ns fo r w hich a t l ea s t pa rt o f the cos t i s b orne b y the employer ; l ega l ly req uired p la ns s uch a s w orkm en's com pens a t ion a nd s oc ia l s e cur i ty w ere exc luded ;how ev er , thos e p la ns req uired b y Sta te tempora ry d i s a b i l ity ins ura nce la w s w ere inc luded , i f the employer contr ib utes more than i s l ega l ly req uired o r the employee s re ce ive b ene f i ts in
exces s o f the l ega l req uirem ents .2 Inc ludes da ta fo r reg ions in a ddi t i on to thos e s how n s epa ra te ly .
3 Undupl i ca ted to ta l o f w ork ers re ce iv ing s i ck lea ve o r s i cknes s a nd a cc ident ins ura nce s how n s epa ra te ly .
4 L e s s t h a n 0. 5 p e r c e n t .5 Limited to p la ns prov id ing regula r pa yments fo r the rema inder o f the re t i r ee 's l i fe , inc luding : Actua r ia l p la ns — the employer con tr ib utes s pec i f i c a mounts to a pens ion p la n pro
v id ing fo r prede term ined pa yments to the re t i ree fo r l i fe (the p lan m a y b e funded o r unfunded, a nd i s not b a s ed on pro f i ts ) ; a nd annui ty type p ro f i t -s ha r ing p la ns ce r ta in noncurrent
pro f i t -s h a r ing p la ns w hich prov ide fo r the purcha s e o f a n annuity pa yab le over the re t i re e 's l i fe w i th funds a ccumula ted to hi s c red i t a t re t irement .
6 Both "a c tua r ia l " a nd "a nnui ty type pro f i t -s ha r ing p la ns " a re prov ided s epa ra te ly b y the esta b l i s hment .
NOT E: Bec ause of r.ounding, sums of individual items may not equal totals .
G)CD

7/21/2019 bls_1551_1967.pdf
http://slidepdf.com/reader/full/bls15511967pdf 47/82
Table 27. Other Selected Benefits *
O
(Perce nt o f product ion a nd o f f i ce w orkers in w oo l ya rn a nd b roa dw oven fa b r i c m i l l s prov id ing funera l l ea ve pa y,
ju ry du ty pay , and se ve ra nc e pay , Un ite d St at es , se le ct ed re gi on s and ar ea s, No ve m be r 1966)
ItemUnited
States 1
Regions A re as
New EnglandMiddle
At la nt icS ou th ea st G re at La ke s Ma ine
M a s s a c h usetts
New
Ha mps hire
North
Ca ro l ina —
Vi rg in ia
Phi la de lphia —Ca mden,
Pa. -N. J .Rhode Island
P r o d u c t i o n w o r k e r s
A ll w o rk e rs ------------------------ 100 100 100 100 100 100 100 100 100 100 100
Work ers in e s ta b l i s hments
w i th prov is ions fo r :
Funera l l ea ve pa y-----------------
20 28 53 2 35 17 15 29 - 29 56J u ry d ut y p a y -- -- -- --- -- -- -- -- -- ---- -- - 28 9 37 44 45 - 20 6 61 - 12
Severa nce pa y 2 ----------------------- 6 10 5 2 ( 3) 8 12 7 13 3
O f f i c e w o r k e r s
A ll w or ke rs ----------------------- 100 100 100 100 100 100 100 100 100 100 100
Wo rkers in e s ta b l i s hmentsw i t h p r o v i s i o n s f o r :
Funera l l ea ve pa y ----------------- 38 25 85 25 37 14 10 29 39 43 70
Jury duty pay -------------- ------- — 38 8 76 46 52 - 16 - 56 - 16
Severa nce pa y 2 ----------------------- 12 7 3 25 3 "
12 3 39 17 6
Inc ludes da ta fo r reg ions in a ddi t ion to thos e s how n s epa ra te ly .
Pa y to em ployees perm a nently s epa ra ted from the compa ny through no fa ul t o f the i r ow n.
Le ss than 0. 5 perc ent.
7/21/2019 bls_1551_1967.pdf
http://slidepdf.com/reader/full/bls15511967pdf 48/82
Part II. Dyeing and Finishing Plants
Summary
Straight-time earnings of production and related workers in wool dyeing and finishing plants averaged $ 2 .1 2 an hour in November 1966. 11 Approximately
2 percent of the 3, 559 workers covered by the survey earned less than $ 1 .4 0 an hour, 1112 and about 8 percent earned less than $ 1. 60; the middle half of the workers earned between $1 .8 1 and $ 2. 31 an hour, and nearly 6 percent earned $ 3 or more.
Workers in the Middle Atlantic and New England regions, 13 together accounting for almost two-thirds of the workforce, averaged $2.43 and $1.85 an hour, respectively. Earnings also varied by sex, type of plant, and occupation.
Among the occupations studied separately, 1415 nationwide averages ranged from $1 .5 9 an hour for janitors to $2 .2 7 for yarn dyeing-machine tenders.
Paid holidays and paid vacations, as well as various types of health and insurance benefits were provided by establishments employing a large majority of the workers.
Industry Characteristics
Plants primarily engaged in eyeing and finishing woven wool fabrics, or dyeing wool, tops, or yarn, accounted for 87 percent of the 3, 559 production workers covered by the study; one-third of these workers were in plants owned by textile producing companies. Plants shrinking and sponging wool goods for the trade accounted for the other 13 percent of the workers.
Plants in the Middle Atlantic region employed 45 percent of the production workers; those in New England, 20 percent. 13 Most of the remaining workers were in the Southeast. Nearly all the workers in the Middle Atlantic region and about one-half in New England were in metropolitan areas. 16
Thirty-six of the 58 establishments covered by the survey employed fewer than 50 workers; 8 employed 100 workers or more.
Establishments with labor-management contracts covering a majority of their production workers employed about seven-tenths of such workers. In the Middle Atlantic, the proportion of workers in such plants was four-fifths; in New England, two-fifths.
Slightly more than nine-tenths of the production workers were paid time rates (table 31). The large majority of these workers were in plants with fo rmalized wage structures; most commonly, these plants provided a single rate for a given occupation.
11 Op. c i t ., footnote 1, p. 1.
12 Op. ci t. , foo tnote 2, p. 1.
13 Op. ci t. , footnote 3, p. 1.
14 Op. c it ., foo tnote 4, p. 1.
15 In the 1962 study (op. c i t ., footnote 5, p.
production workers; the Middle Atla ntic, 38 percent.
Op. c it ., footnote 6, p. 2.
1) the New England region acco unted for 41 percent of the
41

7/21/2019 bls_1551_1967.pdf
http://slidepdf.com/reader/full/bls15511967pdf 49/82
42
Average Hourly Earnings
Straight-time earnings of the 3, 559 production workers in wool dyeing and
finishing plants averaged $ 2 .1 2 an hour in November 1966 (table 28). Workers
in the Middle Atlantic and New England regions averaged $2 .4 3 and $1 .8 5 an
hour, respectively. In New England, all of the workers were in plants primarily
engaged in dyeing and finishing woven wool fabrics, or dyeing wool, tops, or yarn.
In the Middle Atlantic region, slightly more than one-fourth of the workers were in shrinking and sponging plants and averaged $2 .9 9 an hour, compared with
$ 2. 22 for workers in other dyeing and finishing plants (table 29).
Men accounted for three-fourths of the workers and averaged $ 2 .2 2 an
hour; women averaged $ 1 .8 0 . In New England, earnings of men exceeded those
of women by 30 cents an hour; in the Middle Atlantic region the differential was
48 cents. Men and women, however, were generally employed in different
occupations.
Earnings of more than nine-tenths of the production workers were between
$1.4 0 and $3 .5 0 an hour; the middle half of the workers earned between $ 1 .8 1
and $ 2 .3 1 . In the Middle Atlantic region, fewer than 1 percent of the workers
earned less than $1 .4 0 an hour and 12 .3 percent earned $ 3 or m ore; the middle
half earned between $2 .0 7 and $2 .6 0 . In New England, 3.6 percent earned less than $1 .4 0 an hour and none of the workers earned as much as $ 2 .8 0 an hour;
the middle half earned between $1.70 and $2.03.
Occupational Earnings
Occupational classifications for which data are presented separately in
table 30 accounted for about one-sixth of the work force. Averages for these
jobs ranged from $1 .5 9 for janitors to $2 .2 7 for yarn dyeing-machine tenders
(all men). Winders, accounting for three-tenths of the women production workers
in the industry, averaged $1 .9 2 .
Establishment Practices and Supplementary Wage Provisions
Data were also obtained on certain establishment practices, including work
schedules, paid holidays, vacations, and various health, insurance, and retirement plans, as well as other selected benefits for production and office workers.
Scheduled Weekly Hours and Shift Practices. Work schedules of 40 hours
a week were in effect in plants employing nearly two-thirds of the production
and office workers (table 32). All of the production workers in New England
and four-fifths in the Middle Atlantic region were scheduled to work 40 hours a
week; the remainder in the Middle Atlantic were employed in plants with 35-hour
work schedules.
About 17 percent of the production workers were employed on second shifts
in November 1966 (table 34). About one-half of these workers received premium pay, usually 5 cents an hour above the day-shift rate in the Middle Atlantic region
and 4 cents in New England. Third shifts accounted for about 7 percent of the
workers; all of whom received premium pay.
Paid Holidays. Paid holidays were provided by establishments employing nearly all of the production and office workers (table 35). The most common
provisions for both groups were 7 lU days a year in New England and 7 or 8 days
in the Middle Atlantic.

7/21/2019 bls_1551_1967.pdf
http://slidepdf.com/reader/full/bls15511967pdf 50/82
43
Paid Vacations. Paid vacations (after qualifying periods of service) were provided by plants employing nearly all of the production and office workers (table 36). Vacation payments for three-tenths of the production workers were based on a stipulated percentage of the employee’ s annual earnings; in the New England and Middle Atlantic regions, vacation payments for nine-tenths or more of the production and office workers were determined on a length-of-time basis. For purposes of this study, percentage payments were converted to an equivalent
time basis. The most common provisions for production workers were 1 week’ s pay after 1 year of service and 2 weeks’ pay after 5 yea rs. Nearly two-fifths of the production workers (primarily in the Middle Atlantic region) were in establishments providing 3 weeks’ pay after 15 years. About four-fifths of the office workers received 2 weeks’ pay after 1 year of service , and three-fifths received 3 weeks’ after 15 years.
Health, Insurance, and Retirement Plans. About nine-tenths or more of the production and office^ workers were employed in establishments that paid at least part of the cost of life, hospitalization, and surgical insurance (table 37).
Accidental death and dismemberment insurance was provided for one-half of the production workers, medical insurance for nearly two-thirds, and sickness and accident insurance for three-fourths; these plans applied to about two-fifths or fewer of the office workers. Sick leave (full pay, no waiting period) was available to nearly seven-tenths of the office workers, but to fewer than one-tenth of the production workers. Catastrophe insurance was available to 6 percent of the workers in both groups. Except for catastrophe insurance, the other types of plans were usually financed wholly by the employer. Dependents of production workers were frequently covered by hospitalization, surgical, and medical insurance plans wholly financed by the employer.
Pension plans (other than social security) providing regular payments to workers on retirement, were provided by establishments employing six-tenths and seven-tenths, respectively, of the production and office workers. Plans providing lump-sum payments upon retirement applied to 11 percent of the production workers and 4 percent of the office workers.
Other Selected Benefits . Formal plans providing pay for funeral leave and jury duty applied to three-eighths of the production workers, and the corresponding figures were three-tenths and nearly two-thirds of the office workers (table 38). Provisions for severance pay 17 were practically nonexistent.
17 Op. c it ., footnote 10, p. 6.
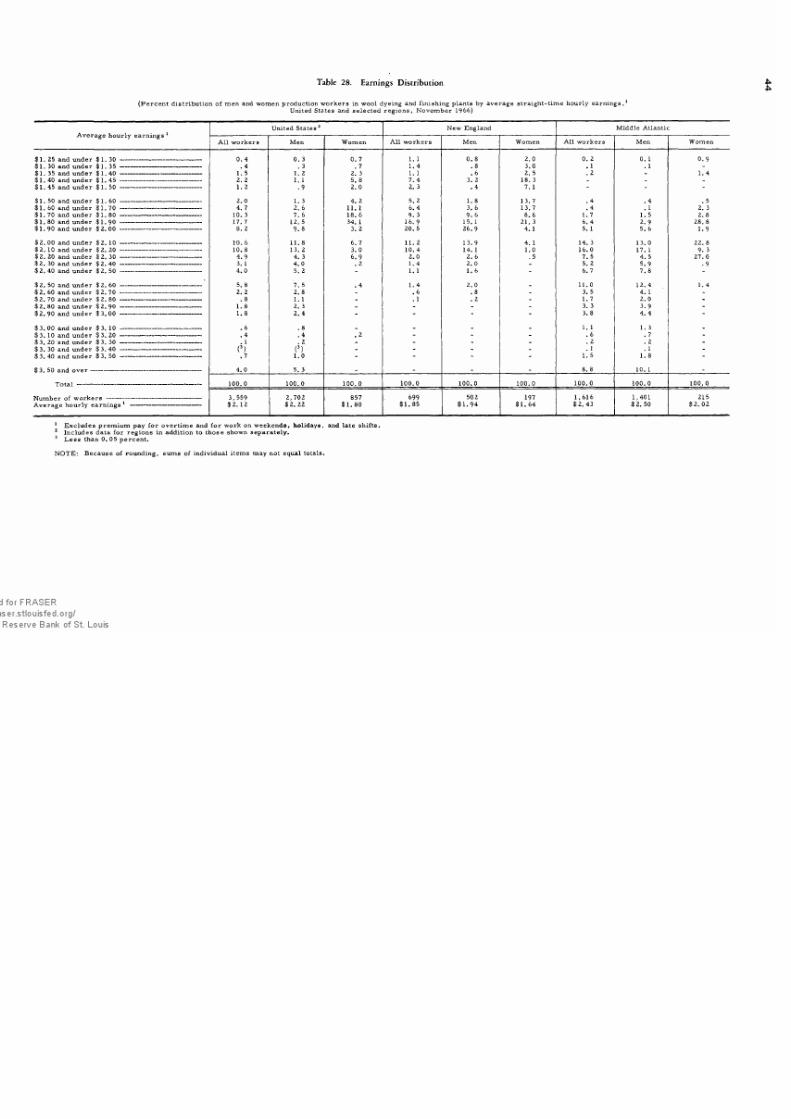
7/21/2019 bls_1551_1967.pdf
http://slidepdf.com/reader/full/bls15511967pdf 51/82
Table 28. Earnings Distribution **
( Percen t d is tr ibution o f men and women product ion workers in woo l dye ing and f inishing plants by average s tra ight- t ime hou r ly earn ings ,1United Sta tes and se lected reg ion s , Novem ber 1966 )
A ve ra ge h ou rl y ea rn in gs 1United States 2 New England Middle A tlantic
A ll w or ke rs Me n W om en A ll w or k er s Me n Women A ll w or ke rs Me n W om en
$1 .25 and under $ 1 . 3 0 ------------------------------------------ 0. 4 0. 3 0. 7 1. 1 0. 8 2. 0 0. 2 0. 1 0. 9$1 . 30 and under $ 1 .3 5 ----------------------------- ------------- . 4 . 3 . 7 1 .4 . 8 3. 0 . 1 . 1 -
$ 1 . 3 5 a n d u n d er $ 1 . 4 0 ------------------------------------------ 1. 5 1. 2 2. 3 1. 1 . 6 2. 5 . 2 - 1. 4$ 1 .40 and under $ 1 .4 5 ------------------------------------------ 2. 2 1. 1 5. 8 7. 4 3. 2 18. 3 - - -
$ 1 .45 and under $ 1 .5 0 ------------------------------------------ 1. 2 .9 2. 0 2. 3 . 4 7. 1 - -
$ 1 .50 and under $ 1 .6 0 ------------------------------------------ 2. 0 1. 3 4. 2 5. 2 1 .8 13.7 . 4 . 4 . 5$ 1 . 6 0 a nd u n d e r $ 1 . 7 0
------------------------------------------4. 7 2. 6 11. 1 6. 4 3. 6 13.7 . 4 . 1 2. 3
$1 .70 and under $ 1 . 8 0 ------------------------------------------ 10. 3 7. 6 18. 6 9. 3 9. 6 8 .6 1. 7 1 .5 2. 8$ 1 . 8 0 a nd u n d e r $ 1 . 9 0 -------------------- --------------------- 17.7 12. 5 34. 1 16 .9 15. 1 21. 3 6. 4 2. 9 28. 8$1 .90 and under $ 2. 0 0 ------------------------------------------ 8. 2 9 .8 3. 2 20. 5 26. 9 4. 1 5. 1 5. 6 1. 9
$2.00 and under $2. 10 ------------------------------------------ 10. 6 11.8 6. 7 11. 2 13.9 4. 1 14. 3 13. 0 22. 8
$2 .10 and under $2 . 2 0 ------------------------------------------ 10. 8 13. 2 3. 0 10. 4 14. 1 1. 0 16.0 17. 1 9. 3$2. 20 and under $2. 3 0 ------------------------------------------ 4. 9 4. 3 6 .9 2 .0 2. 6 . 5 7. 5 4. 5 27. 0$2 . 30 and under $2 . 4 0 ---------------------------*------------- -- 3. 1 4. 0 . 2 1 .4 2. 0 - 5. 2 5 .9 •9$ 2 . 4 0 a n d u n d e r $ 2 . 5 0 ------------------------------------------ 4 .0 5. 2 - 1. 1 1. 6 - 6. 7 7. 8 -
$ 2. 50 and u nder $ 2. 60 ------------------------------------------ 5. 8 7. 5 . 4 1 .4 2. 0 _ 11 .0 12. 4 1. 4$ 2. 60 and und er $ 2. 7 0 ------------------------------------------ 2. 2 2. 8 - . 6 . 8 - 3. 5 4. 1 -
$2 . 70 and under $2 . 8 0 ------------------------------------------ . 8 1. 1 - . 1 . 2 - 1 .7 2 .0 -
$ 2 . 8 0 a nd u n d e r $ 2 . 9 0 ------------------------------------------ 1 .8 2. 3 - - - - 3. 3 3. 9 -
$ 2 . 9 0 a nd u n d e r $ 3 . 0 0 ------------------------------------------ 1 .8 2. 4 - - - 3. 8 4. 4 -
$3 .00 and under $3 . 10 ------------------------------------------ . 6 . 8 _ _ _ _ 1. 1 1. 3 _
$3 .10 and under $ 3 . 2 0 ------------------------------------------ . 4 . 4 . 2 - - - . 6 . 7 -
$ 3. 20 and un der $ 3. 30 ------------------------------------------ . 1 . 2 - - - - . 2 . 2 -
$ 3. 30 and und er $ 3. 40 ------------------------------------------------------ (3 ) (*) - - - - . 1 . 1 -
$3 .40 and under $3 . 50 ------------------------------------------------------ . 7 1.0 - ~ - 1. 5 1 .8 -
$ 3. 50 and ov e r ------------------------------------------------------------------------- 4. 0 5. 3 _ _ . _ 8. 8 10. 1 -
T o t a l ---------------------------------------------------------------------------------- 10 0 . 0 100.0 10 0 . 0 10 0 . 0 1 0 0 . 0 100.0 10 0 . 0 1 0 0 . 0 1 0 0 . 0
N u m b er o f w o r k e r s --------------------------------------------------------------- 3, 559 2 ,702 857 699 502 197 1 ,616 1,401 215
A v er ag e h ou rl y ea rn in gs 1 ----------------------------------------------- $2. 12 $ 2 . 22 $ 1 . 8 0 $ 1 . 8 5 $ 1 . 9 4 $1. 64 $2. 43 $2. 50 $2. 02
1 Excludes prem ium pay f or overt im e and f or work on weekends , ho l idays , and la te shi f ts .2 Inc ludes da ta f or reg ion s in addi tion to those shown separate ly .3 L e s s t h a n 0 . 0 5 p e r c e n t .
NOTE: Because o f rounding , sums o f indiv idua l i tems may not equa l to ta ls.
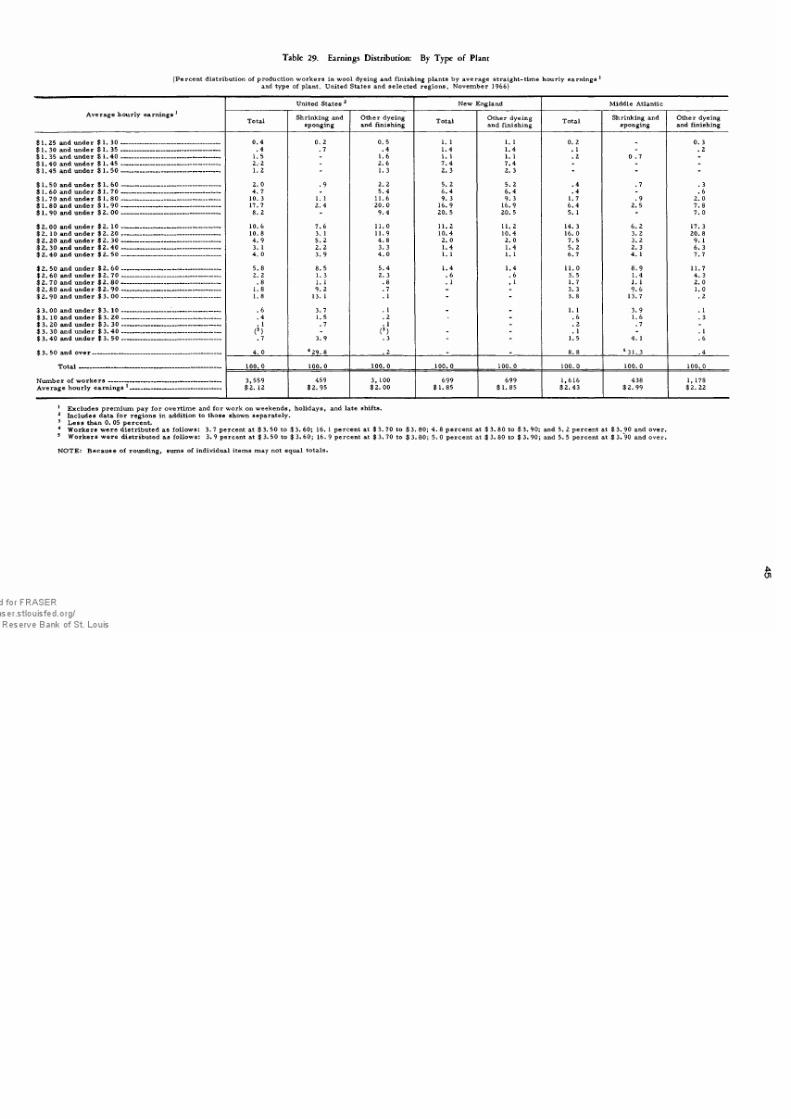
7/21/2019 bls_1551_1967.pdf
http://slidepdf.com/reader/full/bls15511967pdf 52/82
Table 29. Earnings Distribution: By Type of Plant
( Percent d is tr ibution o f product ion workers in woo l dye ing and f inishing plants by average s tra ight- t ime hou r ly earnings 1and type of plant, Un ited States and selected region s, Nove mb er 1966)
A ve ra ge h ou rl y ea rn in gs 1
United States 2 New England Middle Atlantic
Tota lShrinking and
sponging Other dyeingand f inishing
Tota lOther dyeingand f inishing
Tota lShrinking and
sponging Other dyeingand f inishing
$1.2 5 and unde r $ 1. 30 - ......... ............................................ 0. 4 0. 2 0. 5 1. 1 1. 1 0. 2 . 0. 3
$ 1. 30 and under $ 1. 3 5 ------------------------------ --....................... .4 . 7 .4 1. 4 1. 4 . 1 - . 2$ 1. 35 and un der $ 1. 4 0 --------------------------------------------------- 1. 5 - 1. 6 1. 1 1. 1 . 2 0 .7 -
$1 .40 and unde r $ 1 4 5 .......................— - - .............— 2. 2 - 2. 6 7. 4 7 .4 - - -
$1 .45 and under $1 . 50 - ........... ............ ............ ............. ........... 1. 2 1. 3 2. 3 2. 3 - "
$ 1.50 and under $ 1. 6 0 ................................................ - — 2. 0 .9 2. 2 5. 2 5. 2 .4 . 7 . 3$ 1.60 and under $ 1. 7 0 ----------------------- ---------- ----------------- 4. 7 - 5 .4 6 .4 6 .4 . 4 - .6
$1 .70 and unde r $ 1 8 0 __________________________________ 10. 3 1. 1 11.6 9. 3 9. 3 1. 7 . 9 2. 0
$1 .80 and unde r $ 1. 9 0 ---------------------------------------------------
17. 7 2. 4 20. 0 16. 9 16. 9 6 .4 2. 5 7. 8$1 .90 and under $ 2 . 0 0 --------------------------------------------------- 8. 2 - 9 .4 20. 5 20. 5 5. 1 - 7. 0
$2 .00 and under $2 . 1 0 - - ------------- ------------------------- 10. 6 7. 6 11. 0 11. 2 11. 2 14. 3 6. 2 17. 3$2. 10 and under $2. 2 0 --------------------------------------------------- 10. 8 3. 1 11.9 10 .4 10 .4 16. 0 3. 2 20. 8$ 2 . 20 and under $ 2 . 30 ------ - ---------------------------------------- 4. 9 5. 2 4. 8 2. 0 2. 0 7. 5 3. 2 9. 1$2. 30 and und er $2. 4 0 --------------------------------------------------- 3. 1 2. 2 3. 3 1 .4 1. 4 5. 2 2. 3 6. 3$2 .40 and under $2 . 5 0 --------------------------------------------------- 4. 0 3. 9 4. 0 1. 1 1. 1 6. 7 4. 1 7. 7
$2. 50 and unde r $2. 60 5. 8 8. 5 5 .4 1. 4 1. 4 11. 0 8. 9 11. 7$ 2 . 60 a n d u n d e r $ 2 . 7 0 ----------------- - ........... ............. .. — 2. 2 1. 3 2. 3 . 6 . 6 3. 5 1.4 4. 3$2 . 70 and under $2 . 8 0 --------------------------------------------------- . 8 1. 1 . 8 . 1 , 1 1. 7 1. 1 2. 0$ 2. 80 and un der $ 2. 9 0 ___________________ - _____________ 1. 8 9. 2 . 7 - - 3. 3 9. 6 1. 0$ 2. 90 and under $ 3. 0 0 ----- ------------------ ----- -------------------- 1. 8 13. 1 . 1 - 3. 8 13. 7 . 2
$3 .00 and unde r $ 3. 1 0 ----------------------- ------------------------- .6 3. 7 . 1 _ _ 1. 1 3. 9 . 1
$3. 10 and under $3. 2 0 ............................................................... . 4 1 .5 . 2 - . 6 1. 6 . 3$ 3 . 20 a nd u n d e r $ 3 . 3 0 --------- -------------- ------------- -------------- . 1 . 7 . 1 - . 2 . 7 -
$3 .30 and under $ 3. 4 0 ............................................................... (3 ) - (3 ) - - . 1 - . 1
$ 3. 40 and under $ 3. 5 0 --------------------------------------------------- . 7 3. 9 . 3 - 1. 5 4. 1 . 6
$ 3 . 5 0 a n d o v e r -------- 4. 0 429. 8 . 2 _ _ 8. 8 5 31. 3 .4
T o t a l-------------------------------------------------------------------------- 100. 0 100. 0 100. 0 100. 0 100. 0 100. 0 100. 0 100. 0
N u m b er o f w o r k e r s ----------------------------------------------------------
A ve ra ge h ou rl y ea rn in gs 1-----------------------------------------------
3,559$2. 12
459$ 2 . 9 5
3, 100$2. 00
699$ 1. 85
699$ 1. 85
1,616$ 2 . 4 3
438
$ 2 . 9 91, 178$2. 22
1 Excludes prem ium pay f or overt ime and f or work on weekends , ho l idays , and la te shi f ts .
2 Inc ludes da ta f or reg ions in addi t ion to those shown separate ly .3 L e s s t h an 0 . 0 5 p e r c e n t .4 W orke rs w ere d istribu ted as follow s: 3. 7 percent at $ 3. 50 to $ 3. 60; 16. 1 perc ent at $ 3.7 0 to $ 3. 80; 4. 8 percen t at $ 3. 80 to $ 3. 90; and 5. 2 percen t at $ 3. ^0 and over.
5 W orke rs w ere distribu ted as fo llow s: 3. 9 percent at $ 3. 50 to $ 3. 60; 16. 9 perc ent at $ 3. 70 to $ 3. 80; 5.0 perc ent at $ 3. 80 to $ 3. 90; and 5. 5 percen t at $ 3. 90 and over.
NOTE: Because o f rounding , sums o f indiv idua l i tems may not equa l to ta ls .
*01
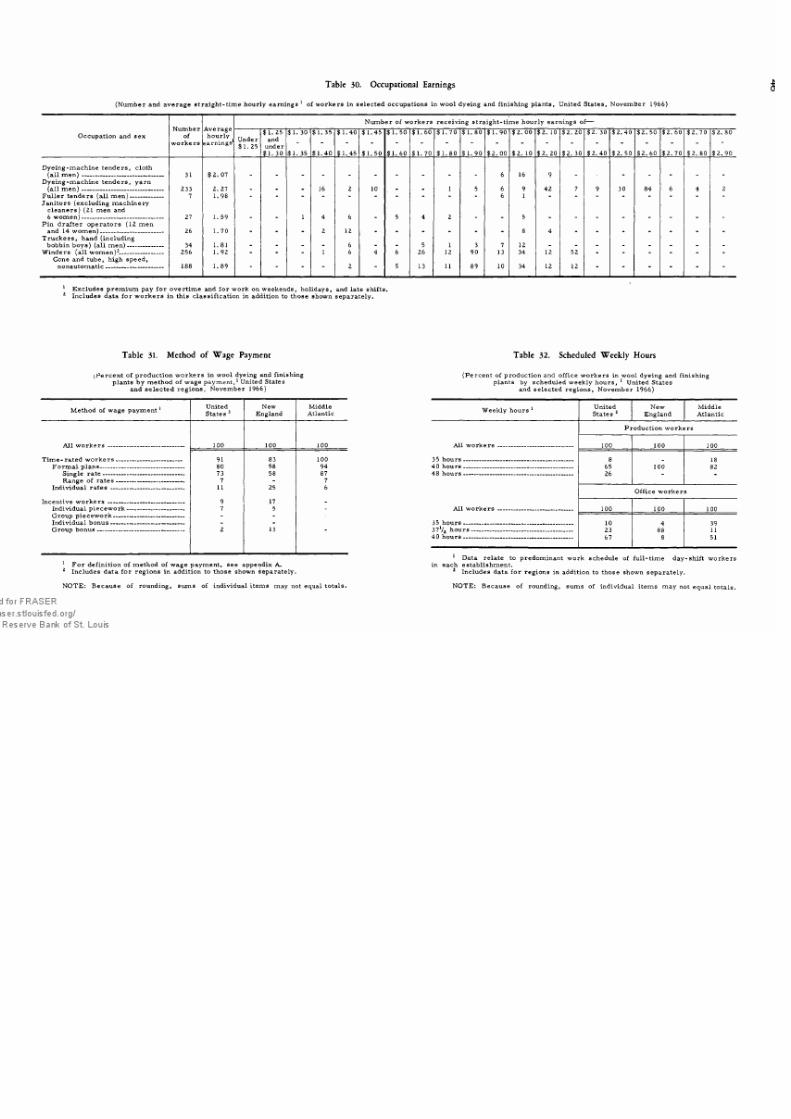
7/21/2019 bls_1551_1967.pdf
http://slidepdf.com/reader/full/bls15511967pdf 53/82
Table 30. Occupation al Earnings
( Number and average s tr a ight- t ime hou r ly earnings 1 o f workers in se lected occup ations in woo l dye ing and f inishing plants , United Sta tes , November 1966)
Occupation and sexN u m b e r
of w o r k e r s
A ve ra gehourly
earnings1
N u m b e r o f w o r k e rs r e c e i v in g s t r a i g h t - t i m e h o u r l y e a rn i n g s o
Under$1. 25
$1. 25and
under$1. 30
$1. 30
$1. 35
$1. 35
$ 1 . 4 0
$ 1 . 4 0
$1. 45
$ 1 . 4 5
$1. 50
$ 1. 50
$1. 60
$ 1 . 6 0
$1. 70
$ 1 . 7 0
$ 1 . 8 0
$ 1. 80
$ 1. 90
$ 1.90
$2. 00
$2. 00
$2. 10
$2. 10
$2. 20
$2. 20
$2. 30
$2. 30
$ 2 . 4 0
$ 2 . 4 0
$2. 50
$2. 50
$2. 60
$2. 60
$2. 70
$2. 70
$2. 80
$2. 80
$2. 90
Dye ing- m achine tende rs , c lo th( a ll m e n ) ------------------------------------------ 31 $2. 07 - - - - - - - - - - 6 16 9 - - - - - -
D y e i n g - m a c h i n e t e n d e r s , y a r n( a ll m e n ) -------------- --------------------------- 233 2. 27 - - - 16 2 10 - - 1 5 6 9 42 7 9 30 84 6 4 2
F u l l e r t e n d e r s ( a l l m e n ) ----------------- 7 1 .98 - - - - - - - - - - 6 1 - - - - - - - -
Jani tors ( exc luding mach ineryc leaners ) ( 21 men and6 w o m e n ) ------------------------------------------ 27 1.59 - - 1 4 6 - 5 4 2 - - 5 - - - - - - - -
Pin dra f ter o pera tors ( 12 menand 14 wo m en )--- -- -- -- -- -- -- -- -- -- -- -- -- -- -- -- 26 1.70 - - - 2 12 - - - - - - 8 4 - - - - - - -
Tru ckers , hand ( inc luding bob bin b oy s) (all m en )------------------- 34 1.81 - - - - 6 - - 5 1 3 7 12 - - - - - - - -
Winders ( a l l wom en) 12--- -- -- -- -- -- -- -- -- -- -- 256 1.92 - - - 1 6 4 6 26 12 90 13 34 12 52 - - - - - -
Cone and tube, high speed,
n o n a u t o m a t i c------------------------------ 188 1.89 ~ “ " ” 2 “ 5 13 11 89 10 34 12 12 “ " “ "
1 Excludes prem ium pay f or overt ime and f or work on weekends , ho l idays , and la te shi f ts .2 Inc ludes da ta f or work ers in this c lass i f i ca t ion in addi t ion to those shown separate ly .
Table 31. Method of Wage Payment Table 32. Scheduled Week ly Hours
^Percent o f product ion worke rs in woo l dye ing and finishingplants by m ethod o f w age paym ent,1United Sta tes
and se lecte d reg ions , Novem ber 1966 )
( Percent o f product ion and o f f i ce worker s in woo l dye ing and f inishingplants by s cheduled weekly hours , 1 United Sta tes
and se lected reg ion s , Novem ber 1966)
M e t h o d o f w a ge p a y m e n t 1United
States 2
New
England
Middle
At lan tic
A ll w o r k e r s ---------------------------------------- 100 100 100
T i m e - r a t ed w o r k e r s -------------------------------- - 91 83 100Form al p lans - -- -- -- -- -- -- -- -- -- -- -- -- -- -- -- -- -- -- -- -- -- - 80 58 94
Single ra te ------------------------------------------ 73 58 87Range o f ra tes ----------------------------------- 7 - 7
Indiv idua l ra te s -------------------------------------- 11 25 6
In cen tiv e wo rk e r s ---------------------------------------- 9 17 _
Indiv idua l p iec ew ork ------------------------------ 7 5 -
G r o u p p i e c e w o r k -- --- --- -- -- ---- -- -- --- -- ---- -- -- ---- - -Indiv idua l bonus --------------------------------------
G r o u p b o n u s --------------------------------------------- 2 13
1 F o r d e f i n i t io n o f m e t h o d o f w a g e p a ym e n t , s e e a p p e n d ix A .2 Inc ludes da ta f or reg ion s in addi t ion to those shown separate ly .
Weekly hours 1United
States 2
New
England
Middle
At la nt ic
P r o d u c t io n w o r k e r s
A ll w or ke rs --------------------------------------- 100 100 100
35 h o u rs --------------------------------------------------------- 8 1840 h ou rs --------------------------------------------------------- 65 100 8248 h ou r s--------------------------------------------------------- 26 -
Of f i ce workers
A ll w o r k e r s --------------------------------------- 100 100 100
35 h o u rs --------------------------------------------------------- 10 4 3937V2 h o u r s----------------------------------------------------- 23 88 1140 h o u r s--------------------------------------------------------- 67 8 51
1 Data re la te to predominant work s chedule o f f ul l - t ime day- shi f t workersin each es tab l i shment.
2 Inc ludes da ta f or reg ions in addi t ion to those shown separate ly .
NOTE: Becau se o f rounding , sums o f indiv idua l i tems may not equa l to ta ls . NOTE: Because o f rounding , sums o f indiv idua l i tems may not equa l to ta ls .
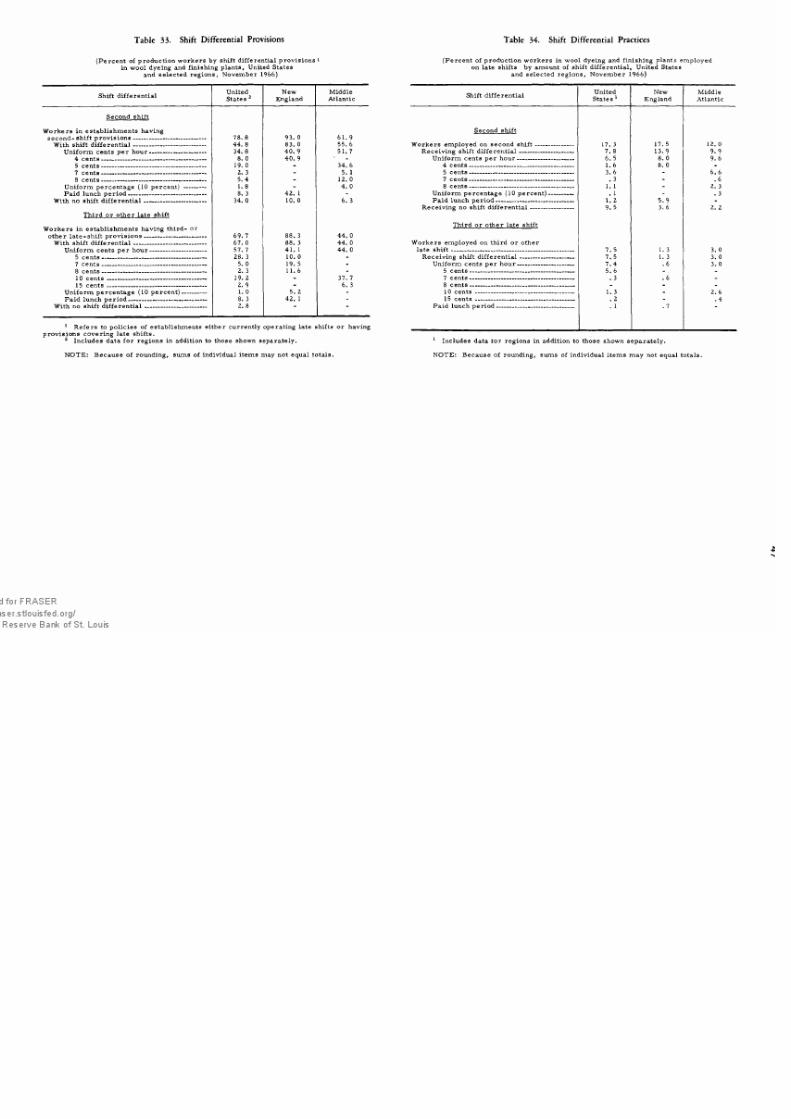
7/21/2019 bls_1551_1967.pdf
http://slidepdf.com/reader/full/bls15511967pdf 54/82
Table 33. Shift Differential Provisions
( Percen t o f product ion w orkers by shi f t d i f f erentia l prov is ions i
in wool dyein g and f inishing plants, United States
and se lected reg ions , N ovember 1966 )
Shi f t d i f f erentia lUnited
States 2
Ne wEngland
Middle
At lan tic
Second shi f t
Work ers in es tab li shmen ts having
se co n d- sh ift p ro v is io n s-------------------------------------- 78. 8 93. 0 61 .9With sh ift di ff er en ti a l-------------------------------------- 44. 8 83. 0 55. 6
U n i f o r m c e n t s p e r h o u r ----------------------------- 34. 8 40. 9 51. 7
4 c e n t s ------------------------------------------------------ 8. 0 40. 9 -
5 cen ts ------------------------------------------------------ 19. 0 - 34. 6
7 c e n ts ------------------------------------------------------ 2. 3 - 5. 1
8 c e n t s ------------------------------------------------------ 5. 4 - 12. 0
Uni f orm percentage ( 10 percent) ----------- 1. 8 - 4. 0
P a i d l u n c h p e r i o d ---------------------------------------- 8. 3 42. 1 -
With no shi f t d i f f erentia l -------------------------------- 34. 0 10. 0 6. 3
Third or o ther la te shi f t
Workers in es tab l i shments having third- or
o t h e r l a t e - s h i ft p r o v i s i o n s -------------------------------- 69. 7 88. 3 44. 0
With shi f t d i f f erentia l — -------------------------------- 67. 0 88. 3 44. 0
U n i f o r m c e n t s p e r h o u r ----------------------------- 57. 7 41. 1 44. 0
5 cents ------------------------------------------------------ 28. 3 10. 0 -
7 c e n t s ------------------------------------------------------ 5. 0 19. 5 -
8 c e n t s ------------------------------------------------------ 2. 3 11. 6 -
1 0 c e n t s ------ .--------------------------------------------- 19. 2 - 37. 7
15 cents --------------------------------------------------- 2. 9 - 6. 3
U n i f o r m p e r c e n t a g e ( 10 p e r c e n t ) ------------- 1 . 0 5. 2 -
P a i d l u n c h p e r i o d ---------------------------------------- 8. 3 42. 1 -
With no shi f t d i f f erentia l -------------------------------- 2. 8
1 Ref ers to po l i c ie s o f es tab l ishments e i ther currently opera ting la te shi f ts or having
prov is ions cover ing la te shi f ts .2 Inc ludes da ta f or reg ions in addi t ion to those shown separate ly .
NOTE: Becaus e o f rounding , sums o f indiv idua l i tems may not equa l to ta ls .
Table 34. Shift Differential Practices
( Percent o f product ion work ers in woo l dye ing and f inishing plants employedon late shifts by amount of shift dif ferentia l, Un ited States
and se lected reg ions , Novem ber 1966)
Shift dif ferentialUnited
States 1New
EnglandMiddle
At lan tic
Second shi f t
W o r k e r s e m p l o y e d o n s e c o n d s h i f t -------------------- 17. 3 17. 5 12. 0
Rece iv ing shi f t d i f f erentia l ---------------------------- 7. 8 13.9 9 .9U n i f o rm c e n ts p e r h o u r ----------------------------- 6. 5 8. 0 9. 6
4 c e n t s ------------------------------------------------------ 1. 6 8. 0 -
5 cents ------------- •---------------------------------------- 3. 6 - 6. 67 cents ------------------------------------------------------ . 3 - . 6
8 cents ------------------------------------------------------ 1. 1 - 2. 3
Uni f orm percentage ( 10 per cent ) ---------- — . 1 - . 3P a i d l u n ch p e r i o d ---------------------------------------- 1. 2 5. 9 -
Re ceiv ing n o shift di ffe re n tia l----------------------- 9. 5 3. 6 2. 2
Third or o ther la te shi f t
Work ers em ployed on third or o ther
late sh ift - -- -- -- - — ------------------------------------------- 7. 5 1. 3 3. 0
R e c e i v i n g s h i ft d i f f e r e n t i a l---------------------------- 7. 5 1. 3 3. 0U n i f or m c e n t s p e r h o u r ----------------------------- 7. 4 . 6 3. 0
5 cents ------------------------------------------------------ 5. 6 -
7 cents ------------------------------------------------------ . 3 . 6 -
8 cen ts ------------------------------------------------------ - - -
10 cents --------------------------------------------------- 1. 3 - 2. 615 cents --------------------------------------------------- . 2 - . 4
P a i d l u n c h p e r i o d ---------------------------------------- . 1 . 7
1 Inc ludes da ta tor reg ions in addi t ion to those shown separate ly .
NOTE: Because o f rounding , sums o f indiv idua l i tems may not equa l to ta ls .
A nJ

7/21/2019 bls_1551_1967.pdf
http://slidepdf.com/reader/full/bls15511967pdf 55/82
Table 35. Paid Holidays
( Perce nt o f product ion and o f f i ce workers in woo l dye ing and f inishing plants w i th f orm al provis ions f or pa id ho l idays ,United Sta tes and se lected reg ions , Novem ber 1966 )
United
States 1New
England
Middle
At lan ticNumber o f pa id ho l idays
Production workers
100 100 100 A ll w o r k e r s ---------------------------------------------------------- '
97 100 100Workers in es tab li shments providing pa id
26h o l i d a y s -------------------------------------------------------------------------
2 5 d a y s---------------------------------------------------------------------------
1 7 6 d a y s---------------------------------------------------------------------------
5 157 d a y s---------------------------------------------------------------------------
14 257 days plus 1 ha l f da y --------------------------------- ------------
8 428 d a y s---------------------------------------------------------------------------
22 17 409 d a y s---------------------------------------------------------------------------
1 l 10 da ys ------------------------------------------------------------------------
11 19 1511 da ys ------------------------------------------------------------------------
8 - 18
3 - -
United New M iddleStates 1 England At la nt ic
Of f i ce workers
100 100 100
100 100 100
47 - -
5 6 -
9 - 31
16 70 -
10 2 38
5 17 5
1 6 -
6 26
Number o f pa id ho l idays
A ll w o r k e r s --------------------------------------------
Wo rkers in es tab l ishm ents providing pa id
h o li d a y s-----------------------------------------------------------2 d a y s------------------------------------------------------------
3 da ys ------------------------------------------------------------
7 d a y s----------------------------------------------------------
7 days plus 1 ha l f day -------------------------------
8 d a y s ------------------------------------------------------------
8 days plus 1 ha l f da y -------------------------------
9 d a y s ------------------------------------------------------------
11 da ys ---------------------------------------------------------
Work ers in es tab li shments pro viding nop a i d h o l i d a y s_________________________________
Inc ludes da ta f or reg ions in addi t ion to those shown separate ly .
NOTE: Becaus e o f rounding , sums o f indiv idua l i tems may not equa l to ta ls .

7/21/2019 bls_1551_1967.pdf
http://slidepdf.com/reader/full/bls15511967pdf 56/82
Table 36. Paid Vacations
( Percent o f product ion and o f f i ce worke rs in woo l dye ing and finishing plants w i th f ormal p rovis ions f or pa id vaca tionsa f ter se lected per iods o f s erv ice , United States and se lected reg ion s , Novem ber 1966 )
V ac at io n p o li cyUnited
States 1New
EnglandMiddle
At la nt ic
P r o d u c t i o n w o r k e r s
100 100 100
Method o f payment
Work ers in es tab l i shments providing
p a i d v a c a t i o n s ----------------------------------------------------------------- 97 100 100
L e n g t h - o f - t i m e p a y m e n t --------------------------------------------- 68 95 100
P e r c en t a g e p a y m e n t --------------------------------------------------- 29 5 -Wo rkers in es tab l i shments providing
no pa id v a ca ti on s------------------------------------------------------------- 3 - "
Am ou nt of va ca ti on pa y 12
A ft er 1 y ea r of s er v ic e
1 w e e k ----------------------------------------------------------------------------------- 77 58 76
O v e r 1 a n d u n d e r 2 w e e k s --------- --------------------------------------- 8 42 -
2 w e e k s ------------------------ --------------------------------------------------------- 10 - 193 w ee k s---------------------------------------------------------------------------------- 2 5
A ft er 2 ye ar s of s er v ic e
1 w e e k ----------------------------------------------------------------------------------- 56 58 32
O ve r 1 and u nd er 2 w ee ks ------------------------------------------------- 23 42 34
2 w e ek s---------------------------------------------------------------------------------- 14 - 26
3 w e ek s---------------------------------------------------------------------------------- 4 9
A ft er 3 y ea rs of s e rv ic e
1 w e e k ----------------------------------------------------------------------------------- 42 22 21
O ve r 1 and u nd er 2 w ee ks ------------------------------------------------- 17 59 12
2 w e e k s---------------------------------------------------------------------------------- 23 19 34
O ve r 2 and un de r 3 w ee k s------------------------------------------------- 11 - 24
3 w e e k s ----------------------------------------------------------------------------------4 - 9
A ft er 5 y ea rs of se r v ic e
1 w e e k ----------------------------------------------------------------------------------- 3 17 -
2 w ee k s---------------------------------------------------------------------------------- 69 41 63
Ove r 2 and unde r 3 wee ks --- -- -- -- -- -- -- -- -- -- -- -- -- -- -- -- -- -- -- -- -- -- -- -- 19 42 24
3 w ee k s---------------------------------------------------------------------------------- 6 - 13
A ft er 10 ye ar s of se rv ic e
1 w e e k -------------------- --------------------------------------------------------------- 3 17 -
2 w e ek s----------------------------------------------------------------------------------- 58 36 50
Ov er 2 and un de r 3 w ee ks ------------------------------------------------- 17 47 183 w e e k s---------------------------------------------------------------------------------- 18 " 32
A ft er 15 y ea rs of s er v ic e
1 w e e k ----------------------------------------------------------------------------------- 3 17 -
2 w ee k s---------------------------------------------------------------------------------- 39 19 14
Ov er 2 and un de r 3 w ee ks ------------------------------------------------- 17 47 18
3 w ee k s---------------------------------------------------------------------------------- 38 17 68
A ft er 20 y ea rs of se rv ic e 3
1 w e e k ----------------------------------------------------------------------------------- 3 17 -
2 w e ek s---------------------------------------------------------------------------------- 39 19 14
Ove r 2 and unde r 3 we ek s--- -- -- -- -- -- -- -- -- -- -- -- -- -- -- -- -- -- -- -- -- -- -- -- 9 47 -
3 w ee k s---------------------------------------------------------------------------------- 46 17 86
Va ca tio n p ol ic yUnited
States 1New
EnglandMiddle
At la nt ic
Of f i ce workers
Al l w or ke rs ---------------------------------------------------------- 100 100 100
Method o f payment
Work ers in estab l i shments providing pa id vaca tions -------------------------------------------------------------- 100 100 100
L en gt h- of- tim e pa ym en t------------------------------------------ 98 94 100
P e r c e n t a g e p a y m e n t-------------------------------------------------- 2 6 -
Workers in es tab l i shments providing no pai d va ca ti on s --------------------------------------------------------- “
Am ou nt of va ca ti on pa y 2
A ft er 1 ye ar of se rv ic e
1 w e e k ------------------------------------------------------------------------------- 16 12 4 02 w ee k s------------------------------------------------------------------------------ 82 88 543 w e ek s------------------------------------------------------------------------------ 2 6
A ft er 2 y ea rs of se rv ic e
1 w e e k ------------------------------------------------------------------------------- 7 10 9Ov er 1 and u nd er 2 we ek s--------------------------------------------- 3 _ 13
2 w e e k s------------------------------------------------------------------------------ 88 9 0 7 23 we eks ----------------------------------------------------------------------------- 2 - 6
A ft er 3 y ea rs of se rv ic e
1 w e e k ------------------------------------------------------------------------------- 3 6 6
2 we ek s--------------------------------------——------------------------ —------ 95 94 83Ov er 2 and un de r 3 w ee ks --------------------------------------------- 1 - 43 we eks --------------------------------------------------------------------- ,.------ 2 - 6
A ft er 5 ye ar s of se rv ic e
2 w ee k s------------------------------------------------------------------------------ 97 100 87Ov er 2 and un de r 3 w ee ks ---------------------------------------------
3 w ee k s------------------------------------------------------------------------------
1
2 :
4
9
A ft er 10 ye ar s o f se r vi ce
2 w e e k s ----------------- ----------------------------------------------------------- - 92 94 77Over 2 and under 3 wee ks - -- -- -- -- -- -- -- -- -- --- -- -- -- -- -- -- -- -- -- --- -- 1 6 -
3 w ee k s----------------------------------------------------------------------------- 7 - 23
A ft er 15 ye ar s of se rv ic e 3
2 w ee k s----------------------------------------------------------------------------- 37 94 43Ov er 2 and un der 3 w ee ks --------------------------------------------- 1 6 -
3 we eks ----------------------------------------------------------------------------- 61 57
1 Inc ludes da ta f or reg ion s in addit ion to those shown separate ly .2 Vacation payments such as percen t o f annua l earnings were converted to an equiva lent t ime bas is . Per iod s o f s er v ice were arb i trar i ly chosen do not neces sar i ly re f lect the indiv idua l
es tab l i shment provis ion s f or prog ress ion . For exam ple , the changes in proport ions indica ted at 10 years may inc lude changes occurr ing between 5 and 10 years .
3 V a c a t io n p r o v i s i o n s w e r e t h e s a m e a f t er l o n g e r p e ri o d s o f s e r v i c e .
NOTE: Becaus e o f rounding , sums o f indiv idua l i tems may not equal to ta ls.

7/21/2019 bls_1551_1967.pdf
http://slidepdf.com/reader/full/bls15511967pdf 57/82
Table 37. Health, Insurance, and Retirem ent Plans
( P ercent o f product ion and o f f i ce workers in w oo l dye ing and f inishing plants w i th spe c i f ied hea l th, insurance ,and retirem ent plans, United States and selected regio ns, Nov em ber 1966)
Type of plan 1 United
States 2New
EnglandMiddle
At lan tic
United
States 2
NewEngland
Middle At la nt ic
P rod u ction w ork e rs O ffice w ork er s
A ll w or k er s ----------------------------------------------------------------------- 100 100 100 100 100 100
W orkers in es tab l i shm ents providing :Li fe in su ra n ce ------------------------------------------------------------------------- 87 90 78 90 100 67
Em pl oy er fi n an ce d ----------------------------------------------------------- 83 90 78 89 100 67
Jo intly f in an ced ---------------------------------------------------------------- 3 - 2 - -
A cc id en ta l de ath and di sm e m be rm e n t in su ra n ce ------------ 52 90 60 41 100 53
E m pl oy er fin an ce d ----------------------------------------------------------- 48 90 60 39 100 53
Jo intly f in an ced ---------------------------------------------------------------- 3 2 - -
S ickness and acc ident insurance or s i ck leave
or bo th ----------------------------------------------------------------------------------- 74 47 83 81 80 62
Sickness and acc ident in sura nce ---------------------------------- 74 47 83 31 76 54
Em ployer f in an ced ----------------------------------------------------- 65 47 65 28 76 44Jo in tl y fin an ce d ----------------------------------------------------------- 9 - 18 3 - 10
Sick lea ve ( full pay , no waiting p e rio d ) ---------------------- 8 - 18 67 74 9Sick leave ( part ia l p ay or wa i t ing p er iod )------------------ " -
H os pi ta liz at ion in s u r a n c e---------------------------------------------------- 95 100 90 89 100 54
Co ve rin g em plo ye es on ly ------------------------------------------------ 49 47 26 69 76 8E m ployer f in an ced ----------------------------------------------------- 49 47 26 67 76 8
Joi nt ly fi n an ce d ----------------------------------------------------------- 2 - - 2 - -
Cover ing em ployees and the ir dependents ------------------ 45 53 63 20 24 46E m ployer f in an ced ----------------------------------------------------- 28 46 36 15 19 37Jo in tl y f in an ce d ----------------------------------------------------------- 17 7 27 5 6 10E m ployer f inanced f or em ployees , jo int ly
f inanced f or dependents ------------------------------------------ - - - - - -
Surgica l in su ran ce ---------------------------------------------------------------- 95 100 90 89 100 54
Co ve rin g em plo ye es on ly ------------------------------------------------ 50 47 26 69 76 8
Em ployer f in an ced ----------------------------------------------------- 49 47 26 67 76 8
Jo in tl y f in an ce d ----------------------------------------------------------- 2 - - 2 - -
Cover ing em ployees and the ir dependents ------------------ 45 53 63 20 24 46
Em ployer f in an ced ----------------------------------------------------- 28 46 36 15 19 37
Jo int ly fin an ce d ----------------------------------------------------------- 17 7 27 5 6 10
Em ployer f inan ced f or em ployees , jo int ly
f inanced f or dependents ------------------------------------------ - - - "
M ed ic al i n su ra n ce ------------------------------------------------------------------ 65 95 84 39 94 44
Co ve rin g em plo ye es on ly ------------------------------------------------ 25 42 30 21 70 8
Em ployer f in an ced ----------------------------------------------------- 23 42 30 19 70 8
Jo in tl y fi n an ce d ----------------------------------------------------------- 2 - - 2 - -
Cover ing em ployees and the ir dependents ------------------ 41 53 54 18 24 37
Em ployer f in an ced ----------------------------------------------------- 24 46 27 13 19 27
Jo in tl y fi n an ce d ----------------------------------------------------------- 17 7 27 5 6 10
E m ployer f inanced f or em ployees , jo int ly
f inanced f or dependents ------------------------------------------ " ”
See footnotes at end of table.

7/21/2019 bls_1551_1967.pdf
http://slidepdf.com/reader/full/bls15511967pdf 58/82
Table 37. Health, Insurance, and Retirement Plans-----Continued
( Percent o f product ion and o f f i ce work ers in woo l dye ing and f inishing plants w i th spe c i f ied hea l th, in surance ,
and re t i remen t plans , United Sta tes and se lected reg ion s , Novem ber 1966 )
Type o f plan 1United
States 12
NewEngland
Middle
At lan tic
United
States 2Ne w
EnglandMiddle
At la nt ic
P r o d u c t i on w o r k e r s Of f i ce workers
Work ers in es tab li shments providing— Continued
Catastroph e insuran ce -- -- -- -- -- -- -- -- -- -- -- -- -- -- -- -- -- -- -- -- -- -- -- -- -- -- -- -- -- 6 10 - 6 - 13Cover ing employees only ------------------------------------------------ 2 - - 2 - -
E m pl oy er fin an ce d------------------------------------------------------ - - - (4 ) - 1Jo in tl y fi n a n ce d ----------------------------------------------------------- 2 - - 2 - -
Cover ing employees and the ir dependents ------------------ 5 10 - 4 - 12E m pl oy er fin an ce d------------------------------------------------------ 2 10 2 - 6Jointly f ina nc ed --- -- -- -- -- -- -- -- -- -- -- -- -- -- -- -- -- -- -- -- -- -- -- -- -- -- -- -- -- 3 - 2 - 5
Employer f inanced f or employees , jo int ly
fin an ced fo r de pe nd en ts------------------------------------------- - - "
Reti rement plans :
Pens ion plans 5 ___________________________________________ 61 54 52 72 84 20Em ploy er fin an ce d________________________________ 59 54 47 71 84 16Jo intly f inanced ___________________________________ 2 _ 5 1 _ 4
A ct u ar ia l p la n _________________________________________ 34 54 52 24 84 15Em ploy er fin an ce d________________________________ 32 54 47 23 84 11Jo intly f inanced ___________________________________ 2 _ 5 1 _ 4
An nu ity ty pe pr of it -s ha ri n g pla n .................................... 26 - - 1 _ 5Em ploy er fin an ce d________________________________ 26 - - 1 _ 5
Both types of plans 6__________________________________ - - - 46 - -
Lu m p-s um pa ym en ts ------------------------------------------------------- 11 5 21 4 6 10N o p l a n s ----------------------------------------------------------------------------------- '
"“ 6 24
1 Inc ludes only those plans f or which a t leas t part o f the cos t i s borne by the emp loyer ; l ega l ly required plans such as workm en's
compen sation and soc ia l s ecur i ty were exc luded; h owever , those plans required by Sta te tem porary disab i l i ty insurance laws were inc luded i f theem ployer contr ibutes more than i s lega l ly required or the employees rece ives bene f i ts in excess o f the lega l requiremen ts .
2 Inc ludes da ta f or reg ions in addit ion to those shown separate ly .3 Undupl i cated tota l o f workers rece iv ing s i ck leave or s i ckness and acc ident insurance shown separate ly .4 Les s than 0. 5 percen t.
5 Limited to p lans providing regular payments f or the remainder o f the re t i ree 's l i f e , inc luding : Actua r ia l p lans— the emp loyer contr ibutes
a spec i f i c amount to a pens ion plan providing f or predeterm ined payments to the re t i ree f o r l i f e ( the plan may be f unded or unf unded, and
is not based on pro fits) ; and annuity type pro fit-sh arin g p lans---- certa in noncurrent pro f i t - shar in g plans which provide f or the purchase o f anannuity payab le ove r the re t i re e 's l i f e w ith f unds accumulated to his cred i t a t re t i rement.
Both "actuar ia l " and "annuity type pro f i t - shar in g plans " a re provided sep arate ly by the estab l i shment.
NOTE: Because o f rounding , sums o f indiv idua l i tems may not equa l to ta ls .
Table 38. Other Selected Benefits
( Percent o f product ion and o f f i ce workers in woo l dye ing and finishing plants providing f unera l pay , ju ry duty pay ,
and severance pay , United Sta tes and se lected re g ions , November 1966 )
ItemUnited
States 1New
EnglandMiddle
At la nt ic
United
States 1Ne w
EnglandMiddle
At lan tic
P r o d u c t i o n w o r k e r s Of f i ce workers
AU w or ke rs ___________________-__________________________ 100 100 100 100 100 100
Wo rkers in es tab l i shments w ith provis ions f or :
F un er al le av e p a y ------------------------------------------------------------------ 37 78 47 30 89 35Ju ry d ut y p a y -------------------------------------------------------------------------- 38 42 6 65 74 5Severance pay 2----------------------------------------------------------------------- 1 5 1 6 "
1 Inc ludes da ta f or reg ions in addi tion to those shown separate ly .
2 Pay to employees permanently separated f rom the company through no f aul t o f the ir own.

7/21/2019 bls_1551_1967.pdf
http://slidepdf.com/reader/full/bls15511967pdf 59/82
Part III. Scouring and Combing Plants
Summary
Straight-time earnings of production and related workers in scouring and combing plants averaged $1 .9 2 an hour in November 1966. 18 Three percent of
the 4 ,041 workers covered by the survey earned less than $1 .4 0 an hour, 19 and 12 .4 percent earned less than $1 .6 0 ; the middle half of the workers earned from $1 .7 3 to $2 .0 9 an hour, and 4. 5 percent earned $2 .50 or more.
Workers in the New England and Southeast regions, 20 together accounting for nearly nine-tenths of the industry^ work force, averaged $ 2 .0 4 and $ 1.81 an hour, respectively. Earnings also varied by s*ex and occupation.
Among the occupations studied separately, 21 nationwide earnings ranged from $1.67 an hour for hand truckers (including bobbin boys) to $ 2.51 for maintenance machinists.
Paid holidays and paid vacations, as well as various types of health and insurance benefits, were provided by establishments employing a large majority
of the workers.
Industry Characteristics
Scouring and combing plants prepare wool fibers for further processing by textile m ills. Raw "gre as y" wool is washed to remove grease and other impurities before the fibers are spun into yarn. In addition, scoured wool is combed before it is spun on the worsted system. Frequently these operations also are performed in yarn and integrated wool textile m ills .
The 32 scouring and combing plants within scope of the survey employed 4, 041 production workers in November 1966. These plants ranged in size from 20 to 500 workers or more; about one-half of the establishments each employed fewer tharf 100 workers, and one-fourth employed 250 workers or more.
New England plants employed one-half of the production workers; the Southeast plants, nearly two-fifths. Nationwide, establishments employing slightly more than two-fifths of the workers were in metropolitan areas; 22 in New England the proportion was two-thirds; in the Southeast, one-fifth.
Establishments which had labor-management contracts covering a majority of their production workers employed three-tenths of the work force. Such plants accounted for one-half of the workers in New England and none in the Southeast.
More than nine-tenths of the production workers were paid time rates (table 41). A large majority of these workers were in plants with formalized wage structures; most of these plants provided a single rate for a given occupation.
Op. ci t. , footnote 1, p. 1.
*9 Op. c it ., footnote 2, p. 1.
20 Op. c i t ., footnote 3, p. 1.
21 Op. c it ., footnote 4, p. 1.
22 Op. c it ., footnote 6, p. 2.
52
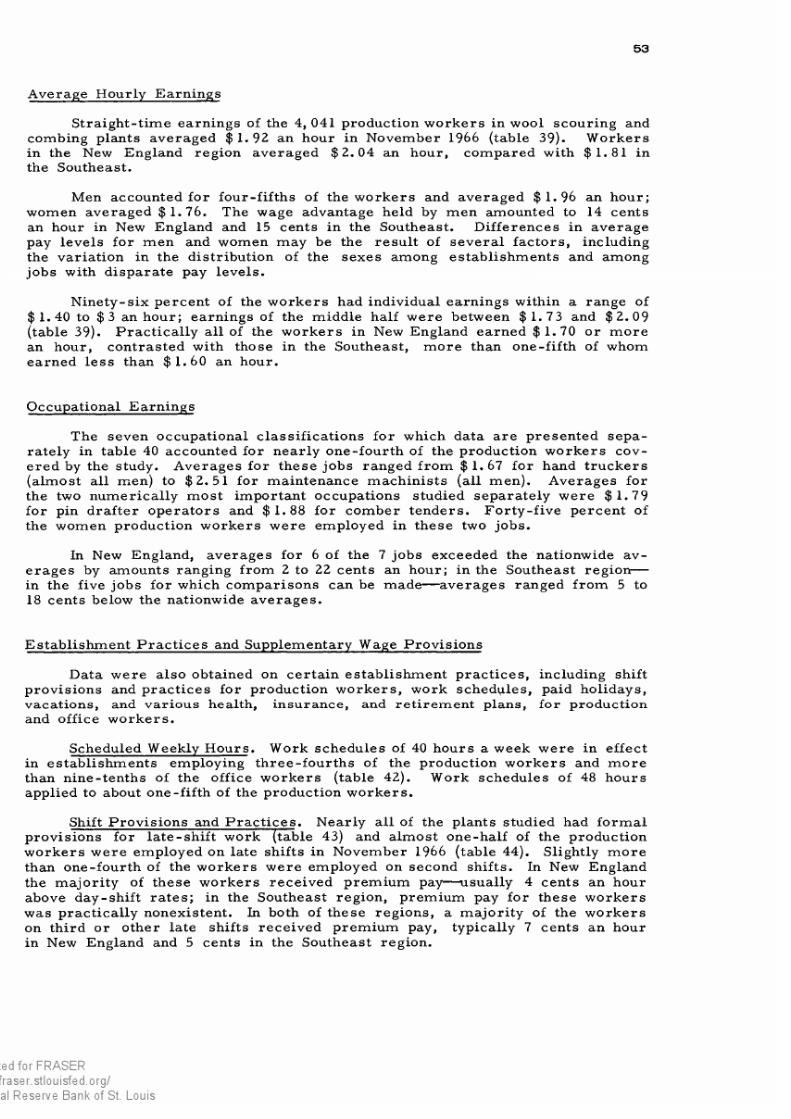
7/21/2019 bls_1551_1967.pdf
http://slidepdf.com/reader/full/bls15511967pdf 60/82
53
Average Hourly Earnings
Straight-time earnings of the 4, 041 production workers in wool scouring and
combing plants averaged $1 .92 an hour in November 1966 (table 39). Workers
in the New England region averaged $2 .04 an hour, compared with $1. 81 in
the Southeast.
Men accounted for four-fifths of the workers and averaged $ 1. 96 an hour; women averaged $1.76. The wage advantage held by men amounted to 14 cents
an hour in New England and 15 cents in the Southeast. Differences in average
pay levels for men and women may be the result of several factors, including the variation in the distribution of the sexes among establishments and among
jobs with disparate pay levels.
Ninety-six percent of the workers had individual earnings within a range of $1.40 to $3 an hour; earnings of the middle half were between $ 1.73 and $ 2.09
(table 39). Practically all of the workers in New England earned $1.70 or more
an hour, contrasted with those in the Southeast, more than one-fifth of whom
earned less than $1.60 an hour.
Occupational Earnings
The seven occupational classifications for which data are presented separately in table 40 accounted for nearly one-fourth of the production workers covered by the study. Averages for these jobs ranged from $1. 67 for hand truckers
(almost all men) to $2 .51 for maintenance machinists (all men). Averages for
the two numerically most important occupations studied separately were $ 1.79
for pin drafter operators and $1.88 for comber tenders. Fo rty-five percent of the women production workers were employed in these two jobs.
In New England, averages for 6 of the 7 jobs exceeded the nationwide averages by amounts ranging from 2 to 22 cents an hour; in the Southeast region—
in the five jobs for which comparisons can be made— averages ranged from 5 to
18 cents below the nationwide averages.
Establishment Practices and Supplementary Wage Provisions
Data were also obtained on certain establishment practices, including shift
provisions and practices for production workers, work schedules, paid holidays, vaca tions, and variou s health, insuranc e, and retirem ent plans, for production
and office workers.
Scheduled Weekly Hours. Work schedules of 40 hours a week were in effect
in establishments employing three-fourths of the production workers and more
than nine-tenths of the office workers (table 42). Work schedules of 48 hours
applied to about one-fifth of the production workers.
Shift Provisions and Pra ctices . Nearly all of the plants studied had formal
provisions for late-shift work (table 43) and almost one-half of the production
workers were employed on late shifts in November 1966 (table 44). Slightly more
than one-fourth of the workers were employed on second shifts. In New England
the majority of these workers received premium pay— usually 4 cents an hour
above day-shift rates; in the Southeast region, premium pay for these workers
was practically nonexistent. In both of these regions, a majority of the workers
on third or other late shifts received premium pay, typically 7 cents an hour
in New England and 5 cents in the Southeast region.

7/21/2019 bls_1551_1967.pdf
http://slidepdf.com/reader/full/bls15511967pdf 61/82
54
Paid Holidays. Paid holidays were provided by establishments employingnearly all of the production and office workers (table 45). Provisions variedranging from 5 to 10 paid holidays annually for both groups of workers in NewEngland, to 1 or Z days for production workers and 5 days for office workersin the Southeast.
Paid Vacations. Paid vacations (after qualifying periods of service) wereprovided to production and office workers by nearly all of the plants studied(table 46). More than nine-tenths of the production workers received 1 week's payafter 1 year of service and Z weeks1 after 5 years. Two-fifths of the productionworkers were in establishments providing at least 3 weeks' after 15 years oservice or more. Almost three-fourths of the office workers received Z weekspay after 1 year of service and three-fifths received at least 3 weeks' after15 years of service or more.
Vacation payments for three-fourths of the production workers were basedon a stipulated percentage of the employee's annual earnings; payments for asimilar proportion of the office workers were determined on a length-of-tim eba sis . For purposes of this study, percentage payments were converted to anequivalent time basis.
Health, Insurance, and Retirement Plans. All of the production and officeworkers studied were in establishments that paid at least part of the cost of hospitalization and surgical insurance (table 47). Life insurance was available toabout seven-eighths of the workers in both groups; medical insurance to three-fourths, and accidental death and dismemberment insurance to nearly two-thirdsSickness and accident insurance was available to slightly over three-fifths othe production workers and to one-third of the office workers. Sick leave (fulpay, no waiting period) was provided to three-tenths of the office workers, buto none of the production workers. Catastrophe insurance was available to fewerthan one-tenth of the workers in both groups. Except for catastrophe insurancethe other types of plans were usually financed wholly by the employer. Dependents of production and office workers were frequently covered by hospitalizationsurgical, and medical insurance plans wholly financed by the employer.
Other Selected Benefits. Provisions for severance pay 23 applied to one-sixth and one-tenth of the production and office workers, respectively (table 48)Formal plans providing pay for funeral leave applied to three-tenths of the workers in both groups; jury duty pay applied to one-half of the production workersand about one-third of the office workers.
23 Op. c it ., footnote 10, p. 6.
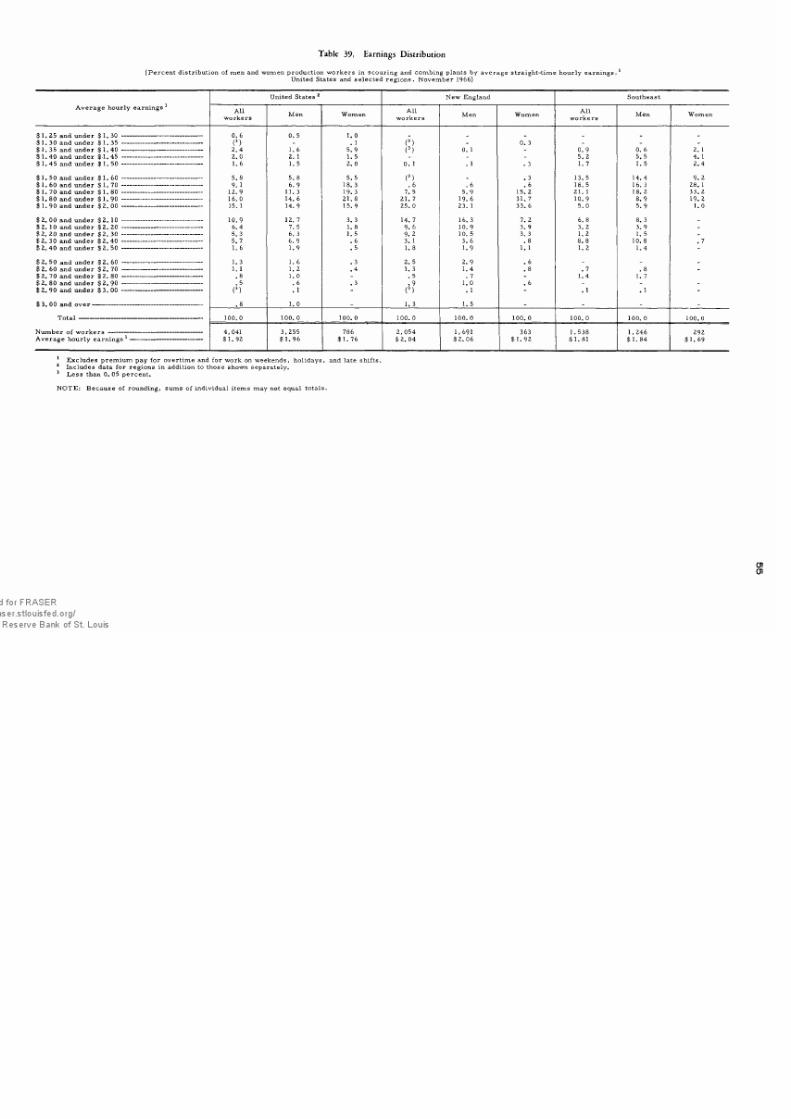
7/21/2019 bls_1551_1967.pdf
http://slidepdf.com/reader/full/bls15511967pdf 62/82
Table 39, Earnings Distribution
( Percen t d is tr ibution o f men and women product ion workers in s cour ing and combing plants by average s tra ight- t ime hour ly earnings ,United States and selected regions, November 1966)
A ve ra g e ho u rl y ea rn in gs 1
United States 012 New England Southeast
A llw o r k e r s
Men W om en A ll
w o r k e r sMe n Women
A llw o r k e r s
Me n Women
$ 1 .2 5 a nd u n de r $ 1 .3 0 ------------------------------------------ 0. 6 0. 5 1. 0 . . . . _
$1 .3 0 a nd u nd er $1 .3 5 ------------------------------------------ (3 ) - . 1 (3 ) - 0. 3 - - -
$ 1.35 and un de r $1 .4 0 ------------------------------------------ 2. 4 1. 6 5. 9 (3 ) 0. 1 - 0. 9 0. 6 2. 1$ 1. 40 and u nd er $ 1. 45 ------------------------------------------ 2. 0 2. 1 1. 5 - - 5. 2 5. 5 4. 1
$1 .4 5 and u nd er $1 .5 0 ------------------------------------------ 1. 6 1. 5 2. 0 0. 1 . 1 . 3 1. 7 1. 5 2. 4
$1 .50 and under $ 1. 60 -- -- -- -- -- -- -- -- -- -- -- -- -- -- -- -- -- -- -- -- -- 5. 8 5. 8 5. 5 (3 )_ . 3 13. 5 14. 4 9. 2
$ 1. 60 an d u nd er $ 1. 70 ------------------------------------------ 9. 1 6 .9 18. 3 . 6 . 6 . 6 18. 5 16. 3 28. 1$ 1. 70 and u nd er $ 1. 80 ------------------------------------------ 12.9 11. 3 19. 3 7. 5 5. 9 15. 2 21. 1 18. 2 33. 2
$1 .8 0 and u nd er $1 .9 0 ------------------------------------------ 16. 0 14. 6 21. 8 21. 7 19. 6 31. 7 10. 9 8. 9 19. 2
$ 1. 9 0 and un de r $ 2. 00 ------------------------------------------ 15. 1 14. 9 15. 9 25. 0 23. 1 33. 6 5. 0 5. 9 1. 0
$ 2. 00 and under $2 .10 - -- -- -- -- -- -- -- -- -- -- -- -- -- -- -- -- -- -- -- -- - 10. 9 12. 7 3. 3 14. 7 16. 3 7. 2 6. 8 8. 3 _
$2 .1 0 and un de r $ 2. 20 ------------------------------------------ 6 .4 7. 5 1. 8 9. 6 10. 9 3. 9 3. 2 3. 9 -
$ 2. 20 and under $ 2. 30 ----------------------- ------------------- 5. 3 6. 3 1. 5 9. 2 10. 5 3. 3 1. 2 1. 5 -
$ 2.3 0 and un d er $ 2. 40 ------------------------------------------ 5. 7 6. 9 . 6 3. 1 3. 6 . 8 8. 8 10. 8 . 7$ 2. 40 and under $ 2. 50 - - -- -- -- -- -- -- -- -- -- -- -- -- -- -- -- -- -- -- -- -- 1. 6 1. 9 . 5 1. 8 1. 9 1. 1 1. 2 1. 4 -
$ 2. 50 and un de r $ 2. 6 0 ------------------------------------------ 1. 3 1. 6 . 3 2. 5 2. 9 . 6 _ _ _
$2 . 60 and un de r $2 . 7 0 ------------------------------------------ 1. 1 1. 2 . 4 1. 3 1. 4 . 8 . 7 . 8 -
$2 . 70 and un de r $2 . 8 0 ------------------------------------------ . 8 1. 0 - . 5 . 7 - 1. 4 1. 7$ 2. 80 and un de r $ 2. 9 0 ------------------------------------------ . 5 . 6 . 3 . 9 1. 0 . 6 - - -
$ 2. 90 and un de r $ 3. 0 0 ------------------------------------------ (3 ) . 1 - (3 ) . 1 - . 1 . 1
$ 3. 00 and o ve r --------------------------------------------------------- . 8 1. 0 - 1. 3 1. 5 - - - _
T o ta l---------------------------------------------------------------- 100. 0 100, 0 100. 0 100. 0 100. 0 100. 0 100. 0 100. 0 100. 0
Nu mb er of w o r k e r s ------------------------------------------------- 4, 041 3 ,255 786 2 ,05 4 1,691 363 1 ,538 1 ,2 46 292 A ve ra ge h ou rl y ea rn in g s1 -------------------------------------- $ 1 .9 2 $ 1 .9 6 $ 1. 76 $ 2 . 0 4 $2. 06 $ 1 . 9 2 $ 1. 81 $ 1. 84 $ 1 . 6 9
1 Excludes prem ium pay f or overt ime and f or work on weekends , ho l idays , and la te shi fts .2 Inc ludes da ta for reg ion s in addi t ion to those shown separate ly .3 L e s s t h an 0 . 0 5 p e r c e n t .
NOTE: Because o f rounding , sums o f indiv idual items may not equa l to ta ls .
0101

7/21/2019 bls_1551_1967.pdf
http://slidepdf.com/reader/full/bls15511967pdf 63/82
Table 40. Occu pationa l Earnings
( Number and average s tra ight- t ime hour ly earnings 1 o f workers in se lected occupations in s cour ing and combing plants ,United States and selected r egion s, N ovem ber 1966)
Occupation and sexNumber
of w o r k e r s
A ve ra gehourly
earnings1
Number o f workers rece iv ing ; s tra ight- t ime hour ly earnings o f —
Under$1.40
$1 .40and
under$1 .45
$1. 45
$1 .50
$1. B0
$1. 60
$1. 60
$1. 70
$1. 70
$1. 80
$1 .80
$1 .90
$1 .90
$2. 00
$2. 00
$2. 10
$2. 10
$2. 20
$2. 20
$2. 30
$2730
$2. 40
$2. 40
$2. 50
$2. 50
$2. 60
$2. 60
$2. 70
$2. 70
$2. 80
$2. 80and
o v e r
United States 2
Card f inishers ( 99 men and 7 women) ---------------- 106 $1. 82 . 32 41 33 . . _ . _
C a r d s t r ip p e r s ( a l l m e n ) -------------------------------------- 50 1. 94 - - - - - - 22 18 5 - 5 - - - - - -
Co m be r te n d er s------------------------------------------------------- 251 1. 88 - 2 3 3 20 55 32 77 49 3 3 - - - 2 - 2M en ----------------------------------------------------------------------- 128 1. 89 - 1 2 2 6 19 25 30 43 - - - - - - - -
W o m e n ---------------------------------------------------------------- 123 1. 87 - 1 1 1 14 36 7 47 6 3 3 - - - 2 - 2
J a n i t o r s ( e x cl u d i n g m a c h i n e r y c l e a n e r s )( 33 m e n an d 1 w o m a n ) ----------------------------------------- 34 1. 68 2 3 2 9 2 - 11 3 1 1 - - - - - - -
M a c h i n i s t s , m a i n t e n a n ce ( a l l m e n ) -------------------- 25 2. 51 - - - - - - - - - 3 9 2 4 1 - 3 3
Pin dr af te r op e ra to rs -------------------------------------------- 353 1. 79 - 1 3 19 78 108 35 85 10 5 3 2 3 1 - - -
M en --------- -------------------------------------------------------------- 119 1. 83 - - - 1 2 56 15 38 5 2 - - - - - - -
W om en ------------------------------------------------------------------ 234 1. 77 - 1 3 18 76 52 20 47 5 3 3 2 3 1 - - -
Tru ckers , hand ( inc luding bobb in boys )(145 m en and 1 w om an )---------------------------------------- 146 1. 67 3 24 " 2 50 2 16 14 29 3 6 " " “ ~
New England
Card f inishers ( 81 men and 7 wom en) ---------------- 88 $1. 84 . . . 14 41 33 . . _ _ _ _ _ _ _
Ca rd s tr ip pe rs ( al l me n) ---------------------------------------- 27 1. 98 - - - - - - 4 18 - - 5 - - - - - -
Co m be r te n d er s------------------------------------------------------- 159 1. 98 - - - - - - 27 76 46 3 3 - - - 2 - 2
M e n ----------------------------------------------------------------------- 89 1.95 - - - - - - 20 29 40 - - - - - - - -
Wom en- -- -- -- -- -- -- -- -- -- -- -- -- -- -- -- -- -- -- -- -- -- -- -- --- -- -- -- -- -- -- -- -- 70 2 . 01 - - - - - - 7 47 6 3 3 - - - 2 - 2
Jani tors (exc luding machin ery c leaners )( 14 men and 1 woman) '------------------------------------------ 15 1. 88 - - - - - - 10 3 1 1 - - - - - - -
M a c h i n i s t s , m a i n t e n a n c e (a l l m e n ) -------------------- 21 2 .49 - - - - - - - - - 3 9 1 4 1 - - 3
P i n d r a f t e r o p e r a t o r s --------------------------------------------- 138 1 .92 - - - - - 32 19 70 5 3 3 2 3 1 - - -
M e n ----------------------------------------------------------------------- 35 1. 86 - - - - - 12 - 23 - - - - - - - - -
W om en ------------------------------------------------------------------ 103 1. 94 - - - - - 20 19 47 5 3 3 2 3 1 - - -
Tru ckers , hand ( inc luding bobb in boys )(a ll m en )------------------------------------------------------------------ 45 1. 89 “ “ " 1 14 29 1 “ " ~ “ " - ~ ~
Southeast
Ca rd st rip pe rs (a ll m en )---------------------------------------- 21 $1. 89 _ _ _ _ _ _ 16 _ 5 _ _ _ _ _ _ _ _
Co m be r te n d er s------------------------------------------------------- 82 1. 72 - 2 3 3 10 55 5 1 3 - - - - - - - -
W om en ------------------------------------------------------------------ 43 1. 70 - 1 1 1 4 36 - - - - - - - - - - -
Jani tors (exc luding mach inery c lean ers )
(a ll m en )------------------------------------------------------------------ 12 1. 50 - 3 - 9 - - - - - - - - - - - - -
Pin dra fter op er at or s-- -- -- -- -- -- -- -- -- -- -- -- -- -- -- -- -- -- -- -- -- -- 201 1. 71 - 1 3 19 64 76 16 15 5 2 - - - - - - -
M en ------------------------------------------------------------------------ 84 1. 81 - - - 1 2 44 15 15 5 2 - - - - - - -
Tru ckers , hand ( inc luding bobb in boys )( 53 m e n a nd 1 w o m a n ) ----------------------------------------- 54 1. 56 2 50 2
Excludes prem ium pay f or ove rt ime and for work on weekends , ho l idays , and late shi f ts .Inc ludes da ta f or reg ions in addi t ion to those shown separate ly .Work ers were d is tr ibuted as f o l lows : 4 a t $1 .25 to $1 .30 and 20 a t $1 . 35 to $1 .40 .

7/21/2019 bls_1551_1967.pdf
http://slidepdf.com/reader/full/bls15511967pdf 64/82
Table 41. Method of Wage Payment
(Percent o f product ion w or kers in s cour ing a nd comb ing p la nts b y method o f w a ge pa yment ,Uni ted Sta tes a nd s e le c ted reg ion s , Novem b er 1 9 6 6 )
Method o f w a ge pa yme nt 1 United States 12 New England Southeast
Al l w o r k e r s- --------------- ---------------- --------------- --------------------------- 100 100 100
T im e- ra te d w or k er s------------------------------------------------------------------------- 94 92 95F or m al p la n s-------------------------------------------------------------------------------- 89 92 95
Sin gle ra te -------------------------------------------------------------------------------- 71 85 56Ran ge of ra te s------------------------------------------------------------------------- 18 6 39
Ind ivid ual r a t e s---------------------------------------------------------------------------- 5 " -
Inc en tiv e w o rk e rs ----------------------------------------------------------------------------- 6 8 5
Individua l p ie cew ork ------------------------------------------------------------------- (3 ) 1 -
Gr oup pi ec ew or k-------------------------------------------------------------------------- - -Indiv idua l b onu s --------------------------------------------------------------------------- 6 8 5
Gr oup bo nu s---------------------------------------------------------------------------------- (3 ) -
1 For d e f ini t ion o f method o f w a ge pa yment , s ee a ppendix A .
2 Includes data for region s in addition to those shown sepa rately.
3 Less than 0. 5 perce nt.
NO TE: Beca us e o f rounding , s um s o f indiv idua l i tems ma y no t eq ua l to ta l s .
Table 42. Scheduled Wee kly Hours
(Percen t o f product ion and o f f i ce w ork ers in s cour ing a nd comb ing p la nts b y s cheduled w eek ly hours , 1
United Sta tes and s e le c ted reg ion s , Novem b er 1 9 6 6 )
Week ly hours 1United
States 2
New
EnglandSoutheast Week ly hours 1
United
States 2
Ne wEngland
Southeast
P r o d u c t i on w o r k e r s O f f i c e w o r k e r s
A ll w or ke rs ----------------- 100 100 10 0 A ll w o r k e r s -------------- 100 100 100
4 0 h o u r s - -- -- -- -- -- -- -- -- -- -- -- -- -- -- -- -- -- 75 77 774 ^ V i m i r e 4 5 10
48 h ou rs ----------------------------------- 21 23 23 4 0 h o u r s -------------------------------- 95 90 100
1 D a ta re la te to predomina nt w ork s chedule o f fu l l - t ime da y -s h i ft w ork ers in ea ch es ta b li s hment .
2 Includes data for rfegions in addition to those shown separa tely.
01
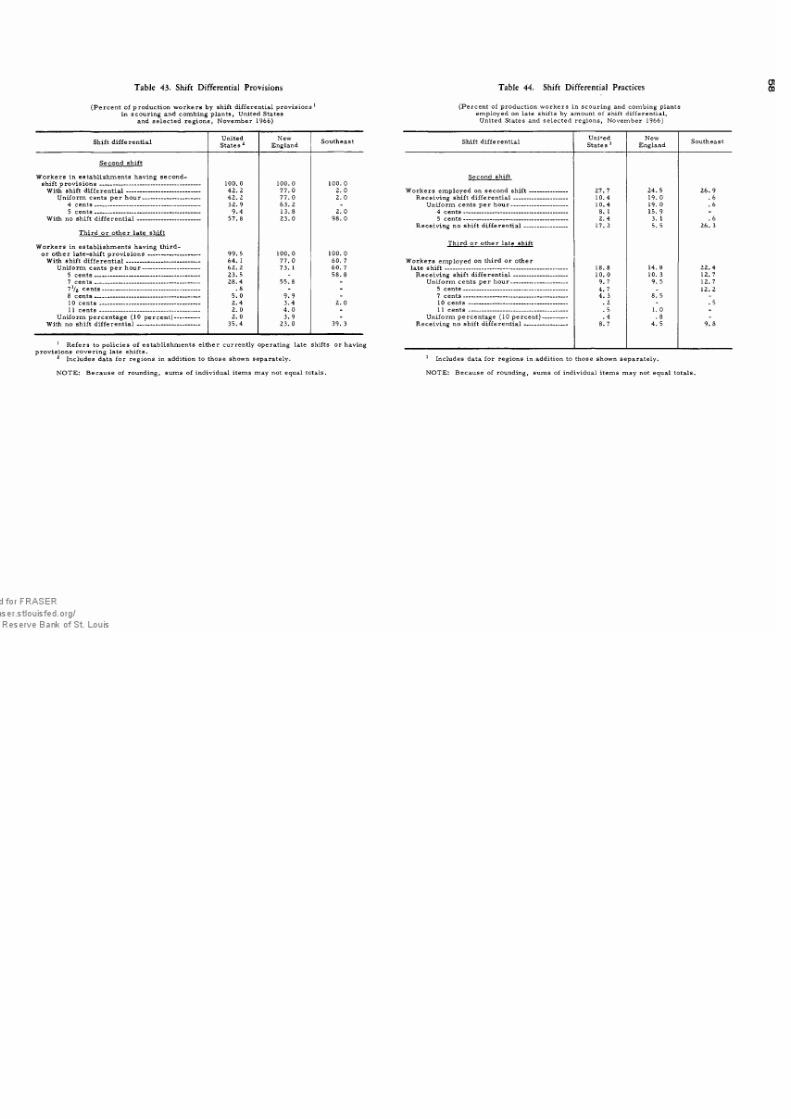
7/21/2019 bls_1551_1967.pdf
http://slidepdf.com/reader/full/bls15511967pdf 65/82
Table 43. Shift Differential Provisions
( Percen t o f produ ct ion workers by shi f t d i f f erentia l pro v is ion s1in s cour ing and combing plants , United Sta tes
and se lected reg ions , N ovember 1966)
Shi f t d i f f erentia lUnited
States 2New
EnglandSoutheas t
Second shi f t
Wo rkers in es tab l i shments having second-
s h i f t p r o v i s i o n s ---------------------------------------------------- 100. 0 100. 0 100. 0
With shi f t d i f f erentia l -------------------------------------- 42. 2 77. 0 2. 0
U n i f o r m c e n ts p e r h o u r ------------------------------ 42. 2 77. 0 2. 0
4 c e n t s ____________________________________ 32. 9 63. 2 -5 c e n t s -------------------------------- :---------------------- 9 .4 13. 8 2. 0
With no shi ft dif fe re n ti a l--------------------------------- 57 .8 23. 0 98. 0
Third or o ther la te shi f t
Wo rkers in es tab li shmen ts having third-
o r o t h e r l a t e- s h i ft p r o v i s i o n s --------------------------- 99. 5 100. 0 100. 0
With shi f t d i f f er en tia l -------------------------------------- 64. 1 77. 0 60. 7
U n i f o r m c e n t s p e r h o u r ------------------------------ 62. 2 73. 1 60. 7
5 c e n ts ------------------------------------------------------- 23. 5 - 58. 8
7 c e n ts ------------------------------------------------------- 2 8 .4 55. 8 -
7 V 2 c e n ts --------------------------------------------------- . 8 - -
8 c e n ts ------------------------------------------------------- 5. 0 9. 9 -
10 cents ---------------------------------------------------- 2 .4 3 .4 2. 0
11 ce n t s ---------------------------------------------------- 2. 0 4. 0 -
Unif orm percentage ( 10 perce nt) ------------- 2. 0 3. 9 -
With no shif t d iff e re n ti a l--------------------------------- 35 .4 23. 0 39. 3
1 Ref ers to po l i c ie s o f es tab l i shments e i ther currently opera ting la te shi f ts or having
provis ion s cover in g la te shi f ts.
2 Inc ludes da ta f or reg ions in addi t ion to those shown separate ly .
NOTE: Because o f rounding , sum s o f indiv idua l i tems may not equal to ta ls .
Table 44. Shift Differential Practices 01
00
( Percent o f produ ct ion workers in s cour ing and combing plants
employed on late shifts by amount of shift dif ferential,United States and selec ted region s, N ovem ber 1966)
Shi f t d i f f erentia lUnited
States 1
NewEngland
Southeast
Second shi f t
W o r k e r s e m p l o y ed on se c o n d s h i f t -- -- -- -- -- -- --- -- --- 2 7. 7 24. 5 26. 9
R e c e i v in g s h i ft d i f f e r e n t i a l ---------------------------- 10. 4 19 . 0 . 6
U n i f o rm c e n t s p e r h o u r ----------------------------- 10. 4 19 . 0 . 64 c e n t s ------------------------------------------------------ 8 . 1 15 . 9 -
5 cents ------------------------------------------------------ 2. 4 3. 1 . 6
Rece iv ing no shi f t d i f f erentia l ---------------------- 17. 2 5. 5 26. 3
Third or o ther la te shi f t
Workers employed on third or o ther
lat e s h if t ---------------------------------------------------------------- 18. 8 14. 8 2 2 .4
R e c e i v in g s h i ft d i f f e r e n t i a l---------------------------- 10. 0 10. 3 12. 7
U n i f or m c e n t s p e r h o u r ----------------------------- 9. 7 9. 5 12. 7
5 c e n ts ------------------------------------------------------ 4. 7 _ 12. 27 cen ts-- -- -- -- -- -- -- -- -- -- -- -- -- -- -- -- -- -- -- -- -- -- -- -- -- -- -- 4. 3 8. 5 -
10 cents --------------------------------------------------- . 2 - . 5
11 cen ts --------------------------------------------------- . 5 1. 0 -
Unif orm percentage ( 10 perc ent ) ------------- . 4 . 8 -
Rece iv ing no shi f t d i f f erentia l ---------------------- 8. 7 4. 5 9 .8
1 Inc ludes da ta for reg ions in addit ion to those shown separate ly .
NOTE: Because o f rounding , sums o f indiv idua l i tems may not equa l to ta ls .
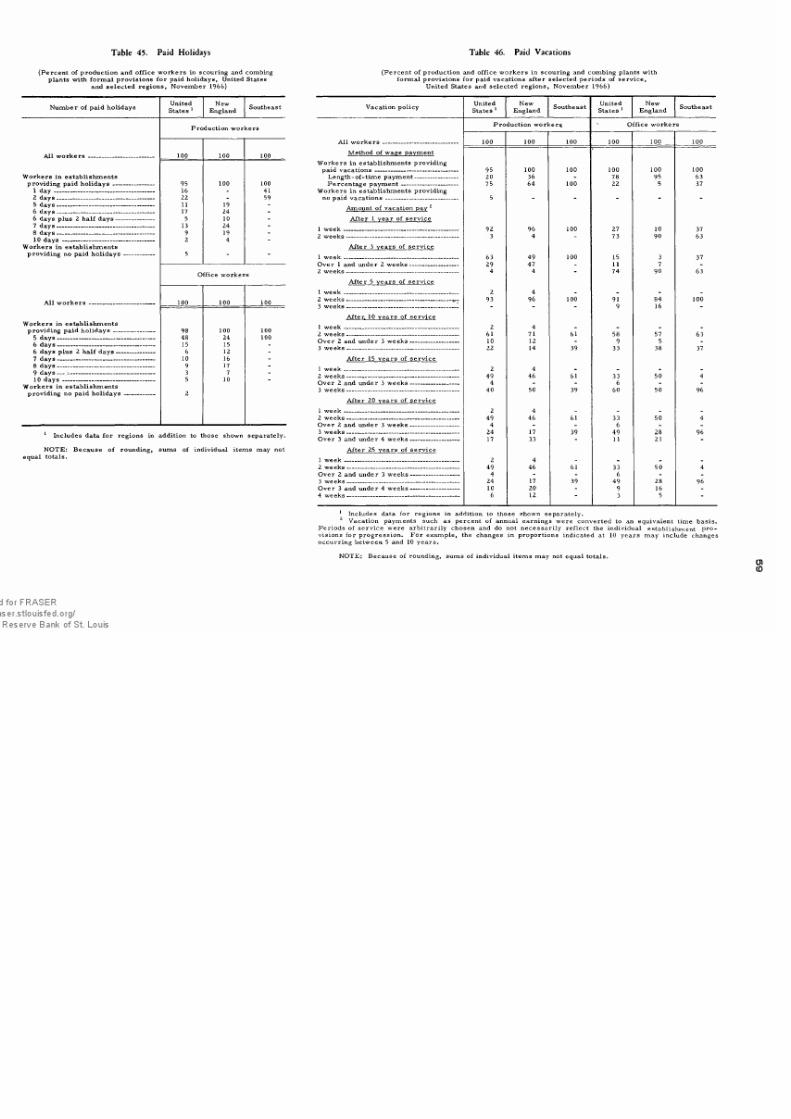
7/21/2019 bls_1551_1967.pdf
http://slidepdf.com/reader/full/bls15511967pdf 66/82
Table 45. Paid Holidays
( Percen t o f product ion and o f f i ce work ers in s cour ing and combing
plants w i th f ormal pr ovis ions f or pa id ho l idays , United States
and se lected reg ions , N ovember 1966)
Num ber o f pa id ho l idaysUnited
States 1New
EnglandSoutheast
Production workers
Al l w or ke rs — ------------------------------ 100 100 100
Work ers in es tab li shmen ts
p r o v i d in g p a i d h o l i d a y s --------------------- 95 100 100
1 d a y ---------------------------------------------------- 16 - 41
2 d ay s--------------------------------------------------- 22 - 59
5 days -------------------------------------------------- 11 19 -6 days -------------------------------------------------- 17 24 -
6 days plus 2 ha l f days -------------------- 5 10 -
7 da ys --------------------------------------------------- 13 24 -
8 d ay s--------------------------------------------------- 9 19 -
10 da ys ------------------------------------------------ 2 4 -
W orkers in es tab l i shments
p r o v i d in g n o p a i d h o l i d a y s ---------------- 5 " "
Of f i ce workers
A ll w o r k e r s ---------------------------------- 100 100 100
Work ers in es tab l i shmentsp r o v i d i n g p a i d h o l i d a y s --------------------- 98 100 100
5 da y s-------------------------------------------------- 48 24 100
6 d a y s -------------------------------------------------- 15 15 -
6 days plus 2 ha l f day s -------------------- 6 12 -
7 d a y s--------------------------------------------------- 10 16 -
8 da ys ------------------- ------------------------ - 9 17 -
9 d a y s — '--------------------------------------------- 3 7 -
1 0 d a y s _______________________________ 5 10 -
Workers in es tab l i shments
p r o v i d in g n o p a i d h o l i d a y s ---------------- 2
1 Inc ludes da ta f or reg ions in addi t ion to those shown separate ly .
NOTE: Because o f rounding , sum s o f indiv idua l i tems may not
equal totals.
Table 46. Paid Vacations
( Percent o f product ion and o f f i ce workers in s cour ing and combing plants w i th
f orma l provis ions f or pa id vaca tions a f ter se lected per iods o f s erv ice ,
United Sta tes and se lected reg ion s , Novem ber 1966 )
Va ca tio n p ol ic yUnitedStates 1
NewEngland
SoutheastUnited
States 1Ne w
EnglandSoutheast
Production worker^ ' O f f i ce workers
Al l w o r k e r s --------------------------------------- 100 100 100 100 100 100
Method o f wage payment
Workers in es tab l i shments providing p a i d v a c a t i o n s ------------------------------------------- 95 100 100 100 100 100
L en gt h-o f-t im e p ay me nt ----------------------- 20 36 - 78 95 63
P e r c e n t a g e p a y m e n t ----------------------------- 75 64 100 22 5 37
Work ers in es tab l i shments providing no pa id vaca t ions - -- -- -- -- -- -- -- -- -- --- -- -- -- -- -- -- -- -- 5 - - - - -
Am ou nt of va ca ti on pa v 2
A ft er 1 ye ar of se rv ic e
1 w e e k ----------------------------------------------------------- 92 96 100 27 10 37
2 w e e k s ---------------------------------------------------------- 3 4 - 73 90 63
A ft er 3 ye ar s of se rv ic e
1 w ee k------------------------------------------------------------ 63 49 100 15 3 37Over 1 and under 2 wee ks— - --------------------- 29 47 - 11 7 -
2 w e e k s ---------------------------------------------------------- 4 4 - 74 90 63
A ft er 5 ye ar s of se rv ic e
1 w e e k ----------------------------------------------------------- 2 4 _ _ _ _
2 w ee k s------------------------------------------- -------- 93 96 100 91 84 100
3 wee ks ---------------------------------------------------------- - - - 9 16 -
Af te r. 10 ve ar s of se rv ic e
1 w e e k ----------------------------------------------------------- 2 4 _ _ _ _
2 wee ks ---------------------------------------------------------- 61 71 61 58 57 63Over 2 and under 3 week s ---------- --------------- 10 12 - 9 5 -
3 wee ks -------------------------------- ----------------------- 22 14 39 33 38 37
A ft er 15 ye ar s of se rv ic e
1 w ee k---- -- -- -- -- -- -- -- -- -- -- -- -- -- -- -- -- -- -- -- -- -- -- -- -- -- -- -- -- 2 4 _ _ _ _
2 wee ks ---------------------------------------------------------- 49 46 61 33 50 4
Over 2 and under 3 wee ks ------------------------- 4 - - 6 - -
3 wee ks ---------------------------------------------------------- 40 50 39 60 50 96
A ft er 20 ye ar s of se rv ic e
1 w e e k -------------------- - --------------------------------------
2 4- _ _ _
2 weeks ---------------------------------------------------------- 49 46 61 33 50 4Over 2 and under 3 w eek s ------------------------- 4 - - 6 - _
3 wee ks ---------------------------------------------------------- 24 17 39 49 28 96Over 3 and under 4 we eks ------------------------- 17 33 - 11 21 -
A ft er 25 ye ar s of se rv ic e
1 w ee k---- -- -- -- -- -- -- -- -- -- -- -- -- -- -- -- -- -- -- -- -- -- -- -- -- -- -- -- -- 2 4 - _ _ _
2 w e e k s ---------------------------------------------------------- 49 46 61 33 50 4
Over 2 and under 3 we eks ------------------------- 4 - - 6 - -
3 wee ks ---------------------------------------------------------- 24 17 39 49 28 96Over 3 and under 4 we eks ------------------------- 10 20 - 9 16 -
4 w e e k s ---------------------------------------------------------- 6 12 - 3 5 -
1 Inc ludes da ta f or reg ions in addi t ion to those shown separate ly .
2 Vacation payments such as percent o f annual earnings were conv erted to an equiva lent t ime bas is .
Per iods o f s erv ice w ere arb i tra r i ly chosen and do not necessar i ly r e f lect the indiv idua l es tab l i shment pro v is ions f or progress ion . For example , the changes in proport ions indica ted a t 10 years m ay inc lude changesoccurr in g between 5 and 10 years .
NOTE: Because o f rounding , sums o f indiv idua l i tems may not equa l to ta ls .
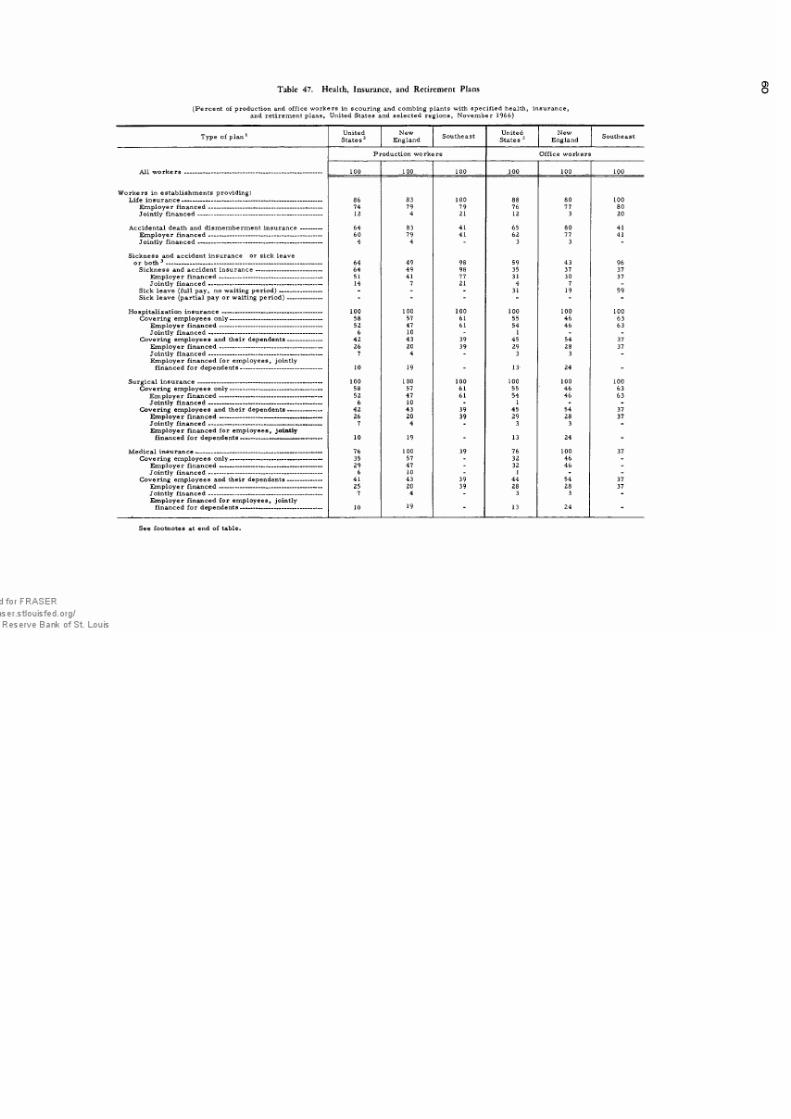
7/21/2019 bls_1551_1967.pdf
http://slidepdf.com/reader/full/bls15511967pdf 67/82
Table 47. Health, Insurance, and Retirement Plans
( Percen t o f product ion and o f f i ce workers in s cour ing and combing plants w i th spec i f ied hea l th, insurance ,and re t irement plans , United Sta tes and se lected reg ions , Novem ber 1966 )
Type o f p lan 1United
States 2
Ne wEngland
SoutheastUnited
States 2
Ne w
EnglandSoutheast
P r o d u c t io n w o r k e r s Of f i ce workers
A ll w or ke rs ----------------------------------------------------------------------- 100 100 100 100 100 100
Work ers in es tab l i shments providing :
Life in su ra nc e------------------------------------------------------------------------- 86 83 100 88 80 100
E m pl oy er fin an ce d ----------------------------------------------------------- 74 79 79 76 77 80J o i n tl y f i n a n c e d ---------------------------------------------------------------- 12 4 21 12 3 20
A cc id en ta l de at h and di sm em be rm en t in su r a n ce ----------- 64 83 41 65 80 41
Em ploy er f in an ced --- -- -- -- -- -- -- -- -- -- -- -- -- -- -- -- -- -- -- -- -- -- -- -- -- -- -- -- -- 60 79 41 62 77 41
J o i n tl y f i n a n c e d ---------------------------------------------------------------- 4 4 - 3 3 -
Sickness and acc ident insurance or s i ck leaveor bo th 3 --------------------------------------------------------------------------------- 64 49 98 59 43 96
S i c k n e s s a n d a c c id e n t i n s u r a n c e ------------------------------ - 64 49 98 35 37 37
E m p l o y e r f i n a n c e d ----------------------------------------------------- 51 41 77 31 30 37
Jo in tl y fi n a n ce d ----------------------------------------------------------- 14 7 21 4 7 -
Sick leave ( f ul l pay , no wa it ing pe r iod ) ---------------------- - - - 31 19 59Sick leave ( part ia l pay or wai t ing per iod ) ------------------ - - - “ - -
H os pi ta liz at ion in su ra n ce ---------------------------------------------------- 100 100 100 100 100 100
Cove ring em ploy ees on ly-- -- -- -- -- -- -- -- -- -- -- -- -- -- -- -- -- -- -- -- -- -- -- -- 58 57 61 55 46 63
E m p l o y e r f i n a n c e d ----------------------------------------------------- 52 47 61 54 46 63
Jointly f ina n ced --- -- -- -- -- -- -- -- -- -- -- -- -- -- -- -- -- -- -- -- -- -- -- -- -- -- -- -- -- 6 10 - 1 - -
Cover ing em ployees and the ir dependents------------------ 42 43 39 45 54 37
E m p l o y e r f i n a n c e d ----------------------------------------------------- 26 20 39 29 28 37
Jointly f ina nc ed --- -- -- -- -- -- -- -- -- -- -- -- -- -- -- -- -- -- -- -- -- -- -- -- -- -- -- -- -- 7 4 - 3 3 -
Em ployer f inanced f or employees , jo int ly
f inanced f o r d epende nts - - -- -- -- -- -- -- -- -- -- -- -- -- -- -- -- -- -- -- -- -- 10 19 - 13- 24
S u r g i c a l i n s u r a n c e ---------------------------------------------------------------- 100 100 100 100 100 100
Cover ing employ ees only ----------------------------------------------- 58 57 61 55 46 63
E m p l o y e r f i n a n c e d ----------------------------------------------------- 52 47 61 54 46 63
Jointly f ina nc ed --- -- -- -- -- -- -- -- -- -- -- -- -- -- -- -- -- -- -- -- -- -- -- -- -- -- -- -- -- 6 10 - 1 - -
Cover ing em ployees and the ir dependents ------------------ 42 43 39 45 54 37E m p l o y e r f i n a n c e d
---------------------------------------- ----------- -
26 20 39 29 28 37J o i n tl y f i n a n c e d ------------------------------------------------ ---------- 7 4 - 3 3 -
E m p l o y e r f in a n c e d f o r e m p l o y e e s , join tly
f i n a n c ed f o r d e p e n d e n t s------------------------------------------ 10 19 - 13 24 "
M ed ica l in su ra n ce ------------------------------------------------------------------ 76 100 39 76 100 37
C o v e r i n g e m p l o y e e s o n l y ---------------------------------------------- - 35 57 - 32 46 -
E m p l o y e r f in a n c e d — ------------------------------------------------- 29 47 - 32 46 -
Jo int ly fin an ce d ----------------------------------------------------------- 6 10 - 1 - -
Cover ing em ployees and the ir dependents ------------------ 41 43 39 44 54 37
E m p l o y e r f i n a n c e d ----------------------------------------------------- 25 20 39 28 28 37
Jointly f ina nc ed --- -- -- -- -- -- -- -- -- -- -- -- -- -- -- -- -- -- -- -- -- -- -- -- -- -- -- -- -- 7 4 - 3 3 -
E m p l o y e r f in a n c e d f o r e m p l o y e e s , j o i n t ly19f i n an c e d f o r d e p e n d e n t s------------------------------------------ 10 13 24
See f oo tnotes a t end o f tab le .
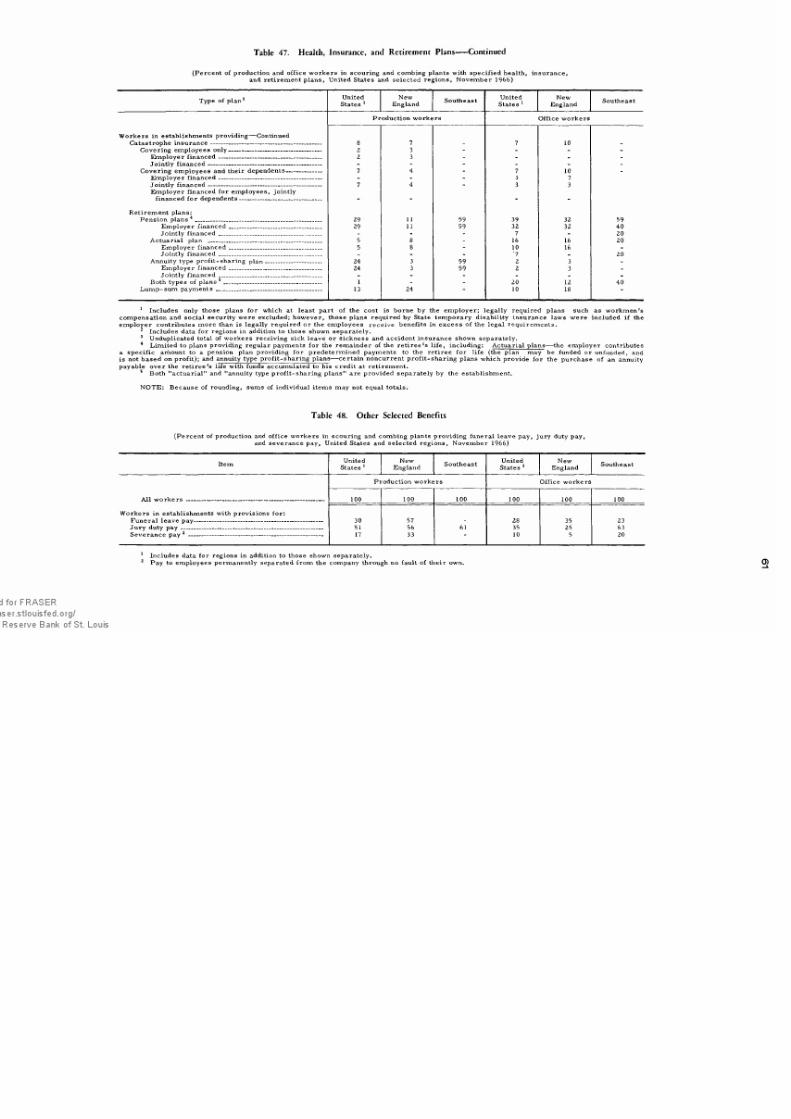
7/21/2019 bls_1551_1967.pdf
http://slidepdf.com/reader/full/bls15511967pdf 68/82
Table 47. Health, Insurance, and Retirement Plans-----Continued
( Percent o f product ion and o f f i ce workers in s cour ing and combing plants w i th spec i f ied hea l th, insu rance ,
and re t i rement plans , United Sta tes and se lected reg ion s , Novem ber 1966 )
Type o f p lan1United
States 1
New
EnglandSoutheast
United
States 1New
EnglandSoutheast
P r o d u c t io n w o r k e r s Of f i ce workers
Work ers in es tab l ishments providing— Continued
Ca tas tro ph e in su ra n ce ---------------------------------------------------------- 8 7 - 7 10 -
Cover ing employees only ------------------------------------------------ 2 3 - - - -
Employe r f inance d ----------------------------------------------------- 2 3 - - - -
Jo in tl y fi n an ce d ----------------------------------------------------------- - - - - -
Cover ing em ployees and the ir dependents------------------ 7 4 - 7 10E m p l o y e r f i n a n c e d ----------------------------------------------------- - - - 3 7Jo in tl y fi n an ce d ----------------------------------------------------------- 7 4 - 3 3Em ployer f inanced f or employees , jo int ly
fin an ced fo r de pe nd en ts------------------------------------------- - - “
Reti rement plans :P e n s i o n p l a n s 4 ___________________________________________ 29 11 59 39 32 59
Em plo ye r fin an ce d________________________________ 29 11 59 32 32 40Joint ly fina n ce d_________________________________ - - - 7 - 20
A ct u ar ia l pla n _______________________________________ 5 8 - 16 16 20E mp loyer f in an ce d________________________________ 5 8 - 10 16 -
Jo intly f inanced ___________________________________ - - - '7 - 20 An nu ity typ e pr of it -s h ar in g p la n ___________________ 24 3 59 2 3 -
Em plo yer fin an ce d________________________________ 24 3 59 2 3 -
Jo intly f inanced ___________________________________ - - - - - -
Both types of plans 5 _________________________________ 1 - - 20 12 40L u m p - s u m p a y m e n t s____________________________________ 13 24 “ 10 18
1 Inc ludes only those plans f or which at leas t part o f the cos t i s borne by the emp loyer ; l ega l ly required plans such as workmen 's
compen sation and soc ia l s ecur i ty were exc luded; however , those plans required by Sta te tem porary disab i l i ty insurance laws were inc luded i f theemp loyer contr ibutes more than is l ega l ly required or the employees rece ive bene f i ts in excess o f the lega l requirements .
2 Inc ludes da ta f or reg ions in addit ion to those shown separate ly .
3 Undupl i ca ted to ta l o f workers rece iv ing s i ck leave or s i ckness and acc ident insurance shown separate ly .
4 Limited to p lans providing regular payments f or the remainde r o f the re t i re e 's l i f e , inc luding : Actuar ia l p lans— the employer contr ibutesa spec i f i c amount to a pens ion plan providing f or predetermin ed payments to the re t i ree f or l i f e ( the plan may be f unded or unf unded, andis not based on pro f i t ) ; and annuity type pro f i t - shar ing plans— certa in noncurrent pro f i t - shar ing plans which provide f or the purchase o f an annuity
payab le over the re t i ree 's l i f e w ith f unds accumulated to his cred i t a t re t i rement.5 Both "actuar ia l " and "annuity type pro f i t - shar in g plans " a re provided separate ly by the estab l i shment.
NOTE: Because o f rounding , sums o f indiv idua l items m ay not equal to ta ls .
Table 48. Other Selected Benefits
( Percent o f product ion and o f f ice w orkers in s cour ing and combing plants providing f unera l l eave pay , jury duty pay ,
and severance pay , United Sta tes and se lected reg ions , Novem ber 1966 )
ItemUnited
States 1
NewEngland
SoutheastUnited
States 1New
EnglandSoutheast
P r o d u c t io n w o r k e r s Of f i ce workers
A ll w or k er s ------------------------------------------------------------------------ 100 100 100 100 100 100
Work ers in es tab l i shments w ith provis ions f or :
F un er al lea ve pay ------------------------------------------------------------------- 30 57 - 28 35 23Ju ry d uty p a y -------------------------------------------------------------------------- 51 56 61 35 25 63
Severance pay 12 - -- -- ---- -- -- -- -- -- --- --- -- --- -- -- -- -- -- ---- -- -- --- -- ---- -- -- ---- -- -- - 17 33 10 5 20
1 Inc ludes da ta f or reg ions in addi tion to those shown separate ly .2 Pay to employees permanently separated f rom the company through no f ault o f the ir own.

7/21/2019 bls_1551_1967.pdf
http://slidepdf.com/reader/full/bls15511967pdf 69/82
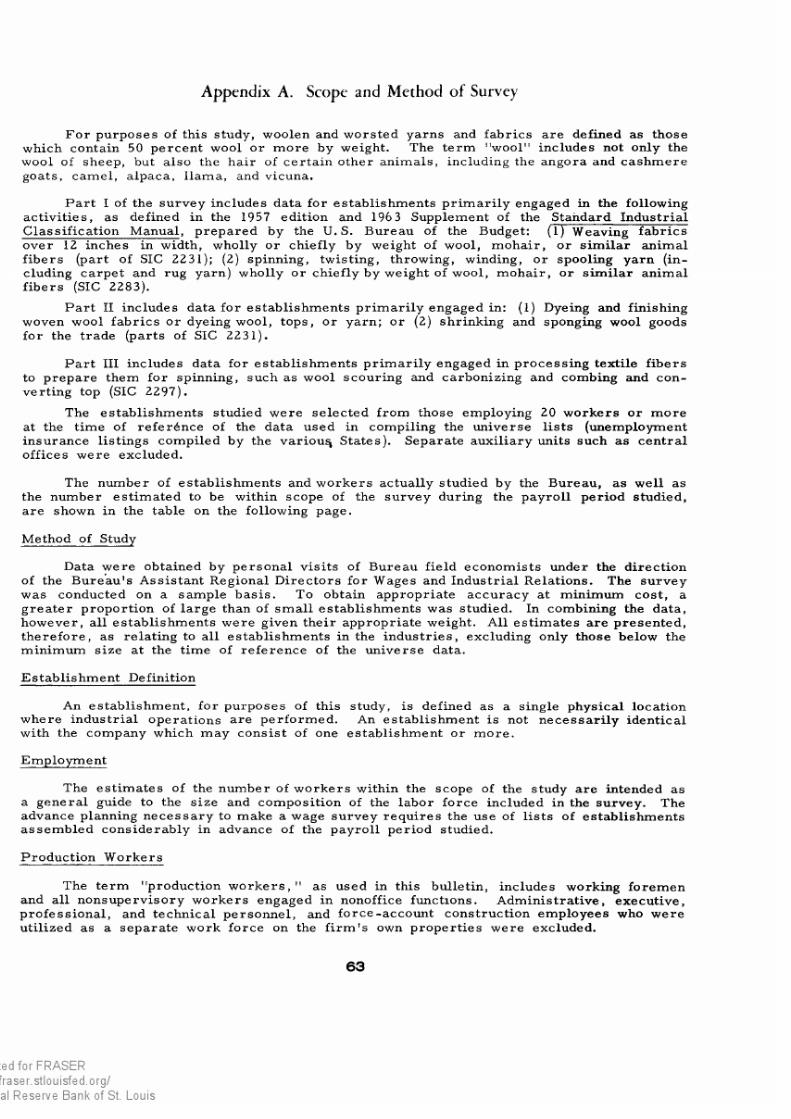
7/21/2019 bls_1551_1967.pdf
http://slidepdf.com/reader/full/bls15511967pdf 70/82
Appendix A. Scope and Method of Survey
For purposes of this study, woolen and worsted yarns and fabrics are defined as those
which contain 50 percent wool or more by weight. The term "wool" includes not only the
wool of sheep, but also the hair of certain other animals, including the angora and cashmere
goats, camel, alpaca, llama, and vicuna.
Part I of the survey includes data for establishments primarily engaged in the following activities, as defined in the 1957 edition and 196 3 Supplement of the Standard Industrial
Classification Manual, prepared by the U. S. Bureau of the Budget: (1) Weaving fabrics
over 12 inches in width, wholly or chiefly by weight of wool, mohair, or similar animal fibers (part of SIC 2231); (2) spinning, twisting, throwing, winding, or spooling yarn (including carpet and rug yarn) wholly or chiefly by weight of wool, mohair, or similar animal fibers (SIC 2283).
Part II includes data for establishments primarily engaged in: (1) Dyeing and finishing woven wool fabrics or dyeing wool, tops, or yarn; or (2) shrinking and sponging wool goods for the trade (parts of SIC 2231).
Part III includes data for establishments primarily engaged in processing textile fibers
to prepare them for spinning, such as wool scouring and carbonizing and combing and converting top (SIC 2297).
The establishments studied were selected from those employing 20 workers or more at the time of reference of the data used in compiling the universe lists (unemployment
insurance listings compiled by the various States). Separate auxiliary units such as central offices were excluded.
The number of establishments and workers actually studied by the Bureau, as well as the number estimated to be within scope of the survey during the payroll period studied, are shown in the table on the following page.
Method of Study
Data were obtained by personal visits of Bureau field economists under the direction
of the Bureau's Assistant Regional Directors for Wages and Industrial Relations. The survey
was conducted on a sample basis. To obtain appropriate accuracy at minimum cost, a
greater proportion of large than of small establishments was studied. In combining the data,
however, all establishments were given their appropriate weight. All estimates are presented, therefore, as relating to all establishments in the industries, excluding only those below the
minimum size at the time of reference of the universe data.
Establishment Definition
An establishment, for purposes of this study, is defined as a single physical location
where industrial operations are performed. An establishment is not necessarily identical with the company which may consist of one establishment or more.
Employment
The estimates of the number of workers within the scope of the study are intended as
a general guide to the size and composition of the labor force included in the survey. The
advance planning necessary to make a wage survey requires the use of lists of establishments
assembled considerably in advance of the payroll period studied.
Production Workers
The term "production workers, " as used in this bulletin, includes working foremen
and all nonsupervisory workers engaged in nonoffice functions. Administrative, executive, professional, and technical personnel, and force-account construction employees who were
utilized as a separate work force on the firm's own properties were excluded.
63
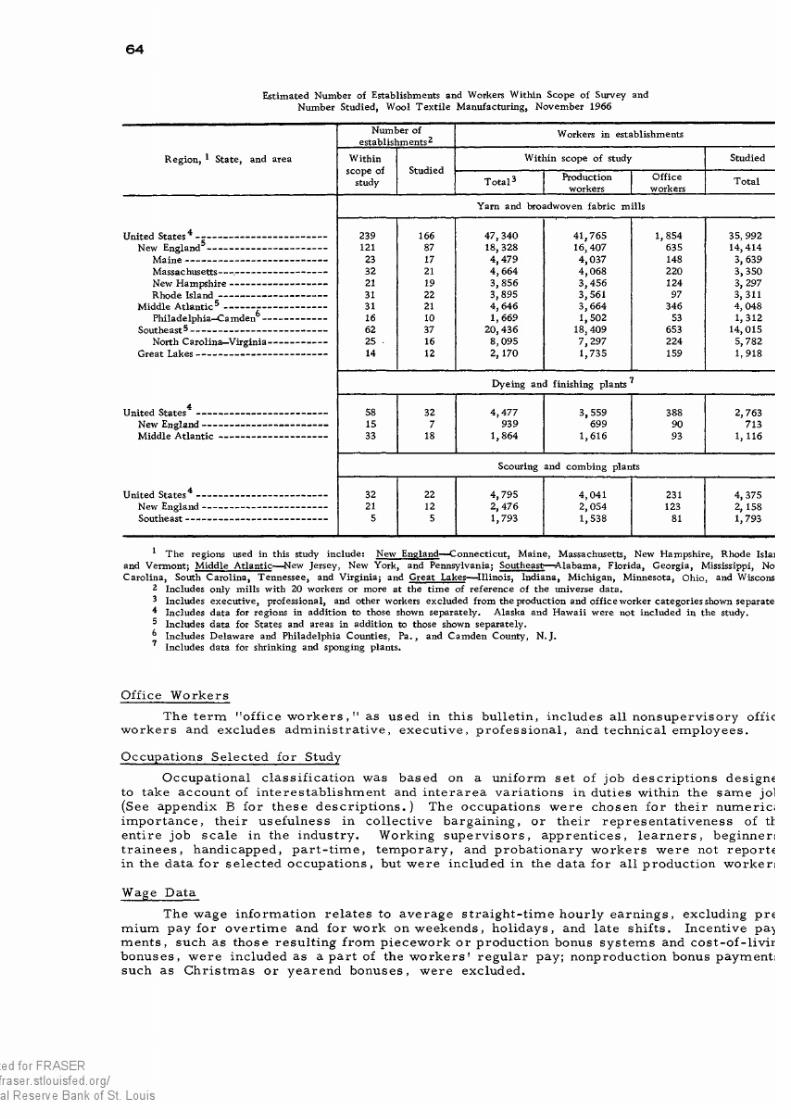
7/21/2019 bls_1551_1967.pdf
http://slidepdf.com/reader/full/bls15511967pdf 71/82
64
Estimated Number of Establishments and Workers Within Scope of Survey andNumber Studied, Wool Textile Manufacturing, November 1966
Region, * State, and area
Number of
establishments2Workers in establishments
Within
scope ofstudy
Studied
Within scope of study Studied
T otal3Production
workers
Office
workersTotal
Yarn and broadwoven fabric mills
United States 4 -g ------------------------------------ 239 166 47, 340 41,765 1,854 35, 992
New England------------------------------------ 121 87 18,328 16,407 635 14,414
M ain e------------------------------------------- 23 17 4,479 4,037 148 3, 639
Massachusetts---- .--------------------------- 32 21 4,664 4,068 220 3,350
New Hampshire----------------------------- 21 19 3,856 3,456 124 3, 297
Rhode Island----------- ------------------- 31 22 3,895 3,561 97 3, 311
Middle Atlantic ^ ----------------------------- 31 21 4, 646 3,664 346 4,048
Philadelphia—C am de n ------------------- 16 10 1,669 1,502 53 1,312
Southeast 5----------------------------------------- 62 37 20,436 18, 409 653 14,015
North Carolina—Virginia ----------------- 25 16 8,095 7,297 224 5,782
Great Lakes--------------------------------------- 14 12 2, 170 1,735 159 1, 918
Dyeing and finishing plants7
4
United States---------------------------------------
58 32 4,477 3,559 388 2,763New England---------------------- -
---- -
------
15 7 939 699 90 713Middle Atlan tic------- ------------------------ 33 18 1,864 1,616 93 1, 116
Scouring and combing plants
United States4 - -------------------------------------- 32 22 4,795 4,041 231 4, 375New England-------------------------------------- 21 12 2, 476 2, 054 123 2, 158
Southeast------------------------------------------ 5 5 1,793 1,538 81 1,793
1 The regions used in this study include: New England—Connecticut, Maine, Massachusetts, New Hampshire, Rhode Islanand Vermont; Middle Atlantic— New Jersey, New York, and Pennsylvania; Southeast-—Alabama, Florida, Georgia, Mississippi, NorCarolina, South Carolina, Tennessee, and Virginia; and Great Lakes— Illinois, Indiana, Michigan, Minnesota, Ohio, and Wisconsi
2 Includes only mills with 20 workers or more at the time of reference o f the universe data.
3 Includes executive, professional, and other workers excluded from the production and of fice workercategories shown separatel* Includes data for regions in addition to those shown separately. Alaska and Hawaii were notincluded in the study.
3 Includes data for States and areas in addition to those shown separately.^ Includes Delaware and Philadelphia Counties, Pa., and Camden County, N.J.7 Includes data for shrinking and sponging plants.
Office Workers
The term "office workers," as used in this bulletin, includes all nonsupervisory officworkers and excludes administrative, executive, professional, and technical employees.
Occupations Selected for Study
Occupational classification was based on a uniform set of job descriptions designeto take account of interestablishment and interarea variations in duties within the same job(See appendix B for these descriptions.) The occupations were chosen for their numericaimportance, their usefulness in collective bargaining, or their representativeness of th
entire job scale in the industry. Working supervisors, apprentices, learners, beginnerstrainees, handicapped, part-time, temporary, and probationary workers were not reportein the data for selected occupations, but were included in the data for all production workers
Wage Data
The wage information relates to average straight-time hourly earnings, excluding premium pay for overtime and for work on weekends, holidays, and late shifts. Incentive payments, such as those resulting from piecework or production bonus systems and cost-of-livinbonuses, were included as a part of the workers’ regular pay; nonproduction bonus paymentssuch as Christmas or yearend bonuses, were excluded.
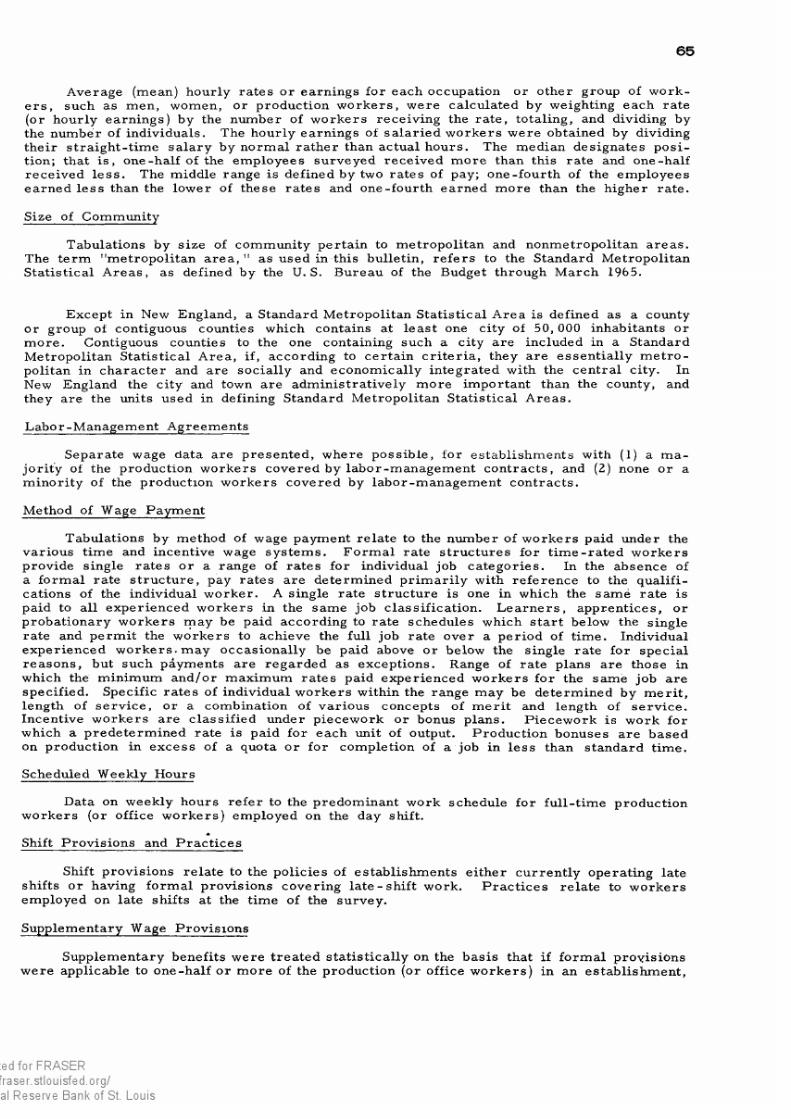
7/21/2019 bls_1551_1967.pdf
http://slidepdf.com/reader/full/bls15511967pdf 72/82
65
Average (mean) hourly rates or earnings for each occupation or other group of workers, such as men, women, or production workers, were calculated by weighting each rate
(or hourly earnings) by the number of workers receiving the rate, totaling, and dividing by
the number of individuals. The hourly earnings of salaried workers were obtained by dividing their straight-time salary by normal rather than actual hours. The median designates position; that is, one-half of the employees surveyed received more than this rate and one-half received less. The middle range is defined by two rates of pay; one-fourth of the employees
earned less than the lower of these rates and one-fourth earned more than the higher rate.
Size of Community
Tabulations by size of community pertain to metropolitan and nonmetropolitan areas. The term "metropolitan area," as used in this bulletin, refers to the Standard Metropolitan
Statistical Areas, as defined by the U. S. Bureau of the Budget through March 1965.
Except in New England, a Standard Metropolitan Statistical Area is defined as a county
or group of contiguous counties which contains at least one city of 50, 000 inhabitants or
more. Contiguous counties to the one containing such a city are included in a Standard
Metropolitan Statistical Area, if, according to certain criteria, they are essentially metropolitan in character and are socially and economically integrated with the central city. In
New England the city and town are administratively more important than the county, and
they are the units used in defining Standard Metropolitan Statistical Areas.
Labor-Management Agreements
Separate wage data are presented, where possible, for establishments with (1) a ma jority of the production workers covered by labor-management contracts, and (2) none or a
minority of the production workers covered by labor-management contracts.
Method of Wage Payment
Tabulations by method of wage payment relate to the number of workers paid under the
various time and incentive wage systems. Formal rate structures for time-rated workers
provide single rates or a range of rates for individual job categories. In the absence of a formal rate structure, pay rates are determined primarily with reference to the qualifications of the individual worker. A single rate structure is one in which the same rate is
paid to all experienced workers in the same job classification. Learners, apprentices, or
probationary workers may be paid according to rate schedules which start below the single rate and permit the workers to achieve the full job rate over a period of time. Individual
experienced workers, may occasionally be paid above or below the single rate for special reasons, but such payments are regarded as exceptions. Range of rate plans are those in
which the minimum and/or maximum rates paid experienced workers for the same job are
specified. Specific rates of individual workers within the range may be determined by merit, length of service, or a combination of various concepts of merit and length of service. Incentive workers are classified under piecework or bonus plans. Piecework is work for
which a predetermined rate is paid for each unit of output. Production bonuses are based
on production in excess of a quota or for completion of a job in less than standard time.
Scheduled Weekly Hours
Data on weekly hours refer to the predominant work schedule for full-time production
workers (or office workers) employed on the day shift.
Shift Provisions and Practices
Shift provisions relate to the policies of establishments either currently operating late
shifts or having formal provisions covering late-shift work. Practices relate to workers
employed on late shifts at the time of the survey.
Supplementary Wage Provisions
Supplementary benefits were treated statistically on the basis that if formal provisions
were applicable to one-half or more of the production (or office workers) in an establishment,

7/21/2019 bls_1551_1967.pdf
http://slidepdf.com/reader/full/bls15511967pdf 73/82
66
the benefits were considered applicable to all such workers. Similarly, if fewer than onehalf of the workers were covered, the benefit was considered nonexistent in the establishmentBecause of length-of-service and other eligibility requirements, the proportion of workerreceiving the benefits may be smaller than estimated.
Paid Holidays. Paid holiday provisions relate to full-day and half-day holidays provided annually.
Paid Vacations. The summary of vacation plans is limited to formal arrangementexcluding informal plans, whereby time off with pay is granted at the discretion of the employer or the supervisor. Payments not on a time basis were converted; for example, payment of 2 percent of annual earnings was considered the equivalent of 1 week’s payThe periods of service for which data are presented were selected as representative of thmost common practices, but they do not necessarily reflect individual establishment provisions for progression. For example, the changes in proportions indicated at 10 years oservice may include changes which occurred between 5 and 10 years.
Health, Insurance, and Retirement Plans. Data are presented for health, insurancepension, and lump-sum retirement payment plans for which all or a part of the cost is bornby the employer, excluding programs required by law, such as workmen’s compensation ansocial security. Among the plans included are those underwritten by a commercial insuranccompany and those paid directly by the employer from his current operating funds or froma fund set aside for this purpose.
Death benefits are included as a form of life insurance. Sickness and accident insurance is limited to that type of insurance under which predetermined cash payments armade directly to the insured on a weekly or monthly basis during illness or accident disability. Information is presented for all such plans to which the employer contributes aleast part of the cost. However, in New York and New Jersey, where temporary disabilitinsurance laws require employer contributions,24 plans are included only if the employe(l) contributes more than is legally required or (2) provides the employees with benefitwhich exceed the requirements of the laws.
Tabulations of paid sick leave plans are limited to formal plans which provide full paor a proportion of the worker's pay during absence from work because of illness; informaarrangements have been omitted. Separate tabulations are provided according to (1) planwhich provide full pay and no waiting period, and (2) plans providing either partial pay oa waiting period.
Medical insurance refers to plans providing for complete or partial payments of doctors' fees. Such plans maybe underwritten by a commercial insurance company or a nonprofit organization, or the benefits may be paid by the employer from a fund set aside fothis purpose.
Catastrophe insurance, sometimes referred to as extended medical insurance, includethe plans designed to cover employees in case of sickness or injury involving as expenswhich goes beyond the normal coverage of hospitalization, medical, and surgical plan
Tabulations of retirement pensions are limited to plans which provide regular paymentfor the remainder of the retiree's life. Information is also presented on various types retirement pension plans— actuarial and annuity type profit-sharing plans. Data are presenteseparately for lump-sum retirement pay (one payment or several over a specified period otime) made to employees on retirement. Establishments providing bom lump-sum paymentand pensions to employees on retirement were considered as having both retirement pensio
and lump-sum retirement pay. Establishments having optional plans providing employees choice of either lump-sum retirement payments or pensions were considered as having onlretirement pension benefits.
Paid Funeral and Jury Duty Leave. Data for paid funeral and jury duty leave arlimited to formal plans which provide at least partial payment for time lost as a result oattending funerals of specified family members or serving as a juror.
Severance Pay. Data relate to formal plans providing for payments to employees permanently separated from the company through no fault of their own.
The temporary disability insurance laws in California and Rhode Island do not require employer contributions.
7/21/2019 bls_1551_1967.pdf
http://slidepdf.com/reader/full/bls15511967pdf 74/82
Appen dix B. Occupational Descriptions
The primary purpose of preparing job descriptions
for the Bureau's wage surveys is to assist its field staff in classifying into appropriate occupations workers who are
employed under a variety of payroll titles and different
work arrangements from establishment to establishment
and from area to area. This permits the grouping of occupational wage rates representing comparable job content.
Because of this emphasis on inter establishment and interarea comparability of occupational content, the Bureau's
job descriptions may differ significantly from those in use
in individual establishments or those prepared for other purposes. In applying these job descriptions, the Bureau's
field economists are instructed to exclude working supervisors, apprentices, learners, beginners, trainees, handicapped, part-time, temporary, and probationary workers.
BATTERY HAND
Transfers or loads quills or bobbins of filling to the battery or loading hopper of automatic looms. May convey filling to looms by means of a handtruck.
CARD FINISHER (woolen and worsted)
Tends the front or discharge ends of a number of carding machines which prepare
wool for further processing by cleaning and opening the fibers, arranging them parallel and
transforming them into loose untwisted strands. Work involves: Doffing balls of sliver
(worsted system) or spools of roving (woolen system); starting new balls by winding ends
of strands around revolving axle or setting in empty spools; and guiding broken ends to their
places on balls or spools.
CARD STRIPPER (woolen and worsted)
Removes accumulated wool fibers adhering to the clothing of carding machines, using any of the following methods: (1) Mounting a wire-tooth-covered stripping roll on
brackets over the drums; attaching a machine-driven belt to the roll, which, while rotating, combs out the fibers packed between the teeth of the card clothing; lifting the stripping roll
from the drum and removing the waste fibers by turning the roll against a stationary comb
mounted on a truck used to transport the stripping roll; (2) using a wire card to comb out the fibers by hand; or (3) placing stripper nozzles of vacuum stripper attachment at side of carding cylinder and doffer drum; and starts machine to move stripper across cylinder; drawing dust into nozzle.
COMBER TENDER (worsted)
Tends the operation of a machine that combs out short fibers, removes dirt, and
delivers long fibers in a sliver which is coiled in a can preparatory to the drawing process. Work involves: Laying card slivers on pair of fluted rollers; starting new slivers, feeding through machine by pinching end of new slivers onto end of slivers from exhausted roll, or
balls; threading card slivers between combing and drawing rollers, through gathering eyes,
and through coiler head into can; and replacing full cans with empty cans.
DOFFER, SPINNING FRAME
Removes full bobbins of yarn from spindles of ring- or cap-spinning frames, replaces
with empty ones and starts yarn on empty bobbins. May help piece-up broken ends of yarn.
67
7/21/2019 bls_1551_1967.pdf
http://slidepdf.com/reader/full/bls15511967pdf 75/82
68
DOFFER, SPINNING FRAME— Continued
For wage study purposes, workers are classified by type of yarn and by type osystem as follows:
Doffer, spinning frame (woolen)Doffer, spinning frame, American system (worsted)Doffer, spinning frame, Bradford system (worsted)
Doffer, spinning frame, French system (worsted)Doffer, spinning frame, other systems (worsted)
DYEING-MACHINE TENDER, CLOTH (woolen and worsted)
Operates or runs one of many types of dyeing machines such as "spiral dye beck," "jig ge r," "padder," etc., to dye cloth. Work involves most of the following: Threading cloththrough machine; operating valves admitting dye or liquor into the trough or vat of machineobserving passage of cloth to eliminate tangling or overlapping; regulating speed of machinand adjusting it for proper number of dips cloth is to receive; washing out vat after eachbatch; and cleaning and oiling machine.
DYEING-MACHINE TENDER, YARN OR TOPS (woolen and worsted)
Prepares and operates one or more of the various types of dyeing machines or kettleused to dye yarn or tops. Work involves: Mixing dye colors, acids, soap and water according to formula, and pouring solution into kettle or tank of machine, or opening and controllinvalves which supply dyeing equipment with dyeing solution and water; loading material intmachine or kettle; controlling steam valves to heat solution; starting and stopping the rotatinor revolving mechanism of the machine; and removing dyed batch, draining solution fromkettle or machine and rinsing equipment for next batch. May use mechanical hoist to loweor raise kettle baskets or other parts of equipment.
FULLER TENDER (woolen and worsted)
(Wet finisher, wool)
Operates a machine that causes fibers of wool to felt or interlock, thus strengthenincloth preparatory to other finishing processes. Work involves: Threading cloth through roller
of machine and sewing the two ends together with a portable sewing machine to make aendless strand with bulk of cloth resting in bottom of machine; pouring proper amount osoap into tank, and admitting water; and cleaning and oiling machine.
JANITOR
(Cleaner; porter; sweeper; charwoman; and janitress)
Cleans and keeps in an orderly condition factory working areas and washrooms, opremises of an office, apartment house, or commercial or other establishment. Duties involva combination of the following: Sweeping, mopping and/or scrubbing, and polishing floorsremoving chips, trash, and other refuse; dusting equipment, furniture, or fixtures; polishinmetal fixtures or trimmings; providing supplies and minor maintenance services; and cleaninlavatories, showers, and restrooms. Workers who specialize in window washing are excluded
LOOM FIXER (woolen and worsted)
Prepares looms for operation and keeps looms in an assigned section of the weavroom in good working condition. Work involves most of the following: Inspecting and examining looms to see that they are operating properly; adjusting or fixing various parts of loomsdismantling or partially dismantling loom to make necessary repairs, adjustments, or replacement of parts; reassembling loom; changing cams and gears; installing or setting harnesand reeds in position; changing beams; cutting and removing cloth from loom; and using variety of handtools. May have supervisory or inspectoral duties over weavers and their work
7/21/2019 bls_1551_1967.pdf
http://slidepdf.com/reader/full/bls15511967pdf 76/82
69
MACHINIST, MAINTENANCE
Produces replacement parts and new parts in making repairs of metal parts of mechanical equipment operated in an establishment. Work involves most of the following: Interpreting written instructions and specifications; planning and laying out of work; using a variety of machinist's handtools and precision measuring instruments; setting up and operating standard machine tools; shaping of metal parts to close tolerance; making standard
shop computations relating to dimensions of work, tooling, feeds and speeds of machining;
knowledge of the working properties of the common metals; selecting standard materials,
parts and equipment required for his work; and fitting and assembling parts into mechanical equipment. In general, the machinist's work normally requires a rounded training in machine- shop practice usually acquired through a formal apprenticeship or equivalent training and
experience.
MENDER, CLOTH (woolen and worsted)
(Sewer)
Repairs defects in cloth by hand. Work involves examining closely the defects which
are indicated by chalk marks, to determine method of repair; weaving in missing strands of yarn with hand needle; repairing rips and tears; pulling threads with heavy sections (slubs) to the surface, thinning them, and working them carefully back into cloth; and performing other fine mending as required. Does not include burlers.
PIN DRAFTER OPERATOR (worsted)
Tends the operation of a pin drafter (also called gill reducer). This machine, which
is based on the screw gill principle, transforms top from the card or comb to the reducer
stage of the Bradford system, the forefinisher of the French system, and the long-draft roving frame of the American system, in three consecutive operations. This replaces six equivalent operations of gilling and drawing of the traditional English and French systems. Work involves
most of the following: Creel balls of top into first pass (set of machines), creel cans intosecond and third passes, doff cans from all three passes, weigh and balance cans before
creeling third pass, repair all sliver breaks and remove bad work from can, clean machines
according to schedule, start up machines once per shift after faller inspection, sweep floor
in pin drafter area, prepare and punch identification tickets, sort weight tickets and replace
in weight box, fill out daily production records, break out pin drafters and run out lots as instructed, replace or trim parchment rolls and replace shear pins as necessary.
SPINNER, FRAME
Tends the operation of one or more sides of ring- or cap-frame-spinning machines
which spin yarn or thread from roving by drawing out strand of roving to proper size, twisting it and winding it on a bobbin or cop. Work involves: Placing full bobbins of roving on spindles or pins of creel; threading yarn through the various guides and starting it on a winding bobbin, piecing-up broken ends by pinching or twisting the two ends together; and cleaning rollers and wiping off other parts of spinning frame.
For wage study purposes, workers are classified as follows:
Spinner, frame (woolen)Spinner, frame, American system (worsted)Spinner, frame, Bradford system (worsted)Spinner, frame, French system (worsted)Spinner, frame, other systems (worsted)
SPINNER, MULE
Tends the operation of one or more mule-spinning machines which draw out, twist, and wind strands of yarn on cops and bobbins. Work involves most of the following: Setting

7/21/2019 bls_1551_1967.pdf
http://slidepdf.com/reader/full/bls15511967pdf 77/82
70
full spools or bobbins of roving on creel; threading ends of yarn through various guides,piecing-up broken ends of yarn by twisting or tying the two ends together, doffing the machineby removing full cops of spun yarn from the spindles, placing empty tubes on spindles andstarting yarn on the empty tubes; cleaning and oiling machine; and making minor repairsand adjustments to the mule-spinning machine.
For wage study purposes, workers are classified by type of yarn, as follows:
Spinner, mule (woolen)Spinner, mule, French system (worsted)
TRUCKER, HAND (INCLUDING BOBBIN BOY)
Pushes or pulls handtrucks, cars, or wheelbarrows used for transporting goods andmaterials of all kinds about a warehouse, manufacturing plant, or other establishment, andusually loads or unloads handtrucks or wheelbarrows. May stack materials in storage bins,etc. , and may keep records of materials moved.
WEAVER
(Plain loom weaver; box loom weaver; automatic loom weaver)
Tends the operation of one or more looms to produce woven cloth. Work involves:Piecing-up broken warp threads by twisting or tying together the two ends, drawing the yarnthrough the harness, reed, and/or drop wires when necessary; replacing empty bobbins inshuttle with full ones, if loom is not automatic in this respect; and inspecting product as itis woven for imperfections and stopping loom and removing imperfections when they occur.
For wage study purposes, weavers are classified by type of loom operated and typeof cloth, as follows:
Weaver, box loom (woolen and worsted, automatic; 25 and woolen and worsted,non automatic 26)
(Box weaver; C. and K. cam box loom weaver)
Tends the operation of one or more cam driven looms fitted with a box motion so that several shuttles of different colors or twists of filling may be used. The loom may have two, four, or six boxes on one side of the lay, known as 2 x 1, 4 x 1, and 6 x 1 looms, or there may be an equal number of boxes on each side of the lay known as 2 x 2 , 4 x 4 , and 6 x 6 looms. The box motion on these looms can be adjusted to weave plain fabrics. This classification includes all weavers on cam box looms, irrespective of the type of fabric woven.
Weaver, plain loom (woolen and worsted)
(Plain weaver; Draper loom weaver; plain automatic weaver)
Tends the operation of one or more plain looms which are equipped with
cams to alternately raise or lower from 2 to 4 harnesses, and occasionally up to 7 harnesses. These looms are equipped with a single shuttle and weave plain fabrics.
Weaver, loom, other than box or plain loom (woolen and worsted)
2^ Includes weavers tending box looms in which the filling bobbins are changed automatically .Includes weavers tending box looms in which the filling bobbins are changed by hand.
7/21/2019 bls_1551_1967.pdf
http://slidepdf.com/reader/full/bls15511967pdf 78/82
71
WEAVING-MACHINE OPERATOR (woolen and worsted)
(Draper shuttle-less loom operator; Warner and Swasey weaving-machine operator; Sulzer-loom weaver)
Tends the operation of one or more machines which weave cloth without the use of conventional bobbins and shuttles. Filling yarn is carried through warp yarns at high
speed by a steel gripper shuttle which grasps yarn from a cone and passes through a shed
formed by intermittent steel guides. Harnesses are operated by direct cam motion.
WINDER. YARN, AUTOMATIC MACHINE
Tends the operation of a section or an entire automatic machine used to wind yarn
from one form to another for shipment or to facilitate handling in later processing. One
or more of the following steps, which are manually performed on nonautomatic winders, are accomplished automatically on these machines: Tying in ends of yarn; removing fullbobbins; placing empty bobbins or cones on spindle heads; and piecing-up broken ends.
For wage study purposes, winders on automatic machines are classified as follows:
Winder, cone and tube, automatic (woolen and worsted)
(Abbot Automatic Tube and Cone Winder, etc. )
Winder, filling, automatic (woolen and worsted)
(Abbot Automatic Quiller, Barber-Colmen Automatic Quiller, Whitin-Schweiter
Automatic Filling Bobbin Winder, Hacoba (Swiss) Automatic Filling Winder, etc. )
WINDER. YARN. NONAUTOMATIC MACHINES
(Winder; rewinder; reeler; quiller; tuber)
Tends the operation of one or more of the various type machines used to wind yarn
from one form to another for shipment or to facilitate handling in later processing. Work
involves: Placing skeins, bobbins or cones of yarn on reels or spindles of machine; threading
yarn through the various guides; piecing-up broken ends by twisting or tying the two ends
together; removing full winding bobbins, cones, tubes, or quills, and replacing them with
empty ones. Does not include spoolers.
For wage study purposes, winders on nonautomatic machines are classified asfollows:
Winder, cone and tube, high speed, nonautomatic (woolen and worsted)
(Universal Roto-Coner No. 44, Universal No. 50, Foster No. 102, Walter Kidde
and Co. Cone Winder, and similar types)
Winder, cone and tube, slow speed, nonautomatic (woolen and worsted)
(All other nonautomatic cone and tube winders not specified under above)
Winder, filling, nonautomatic (woolen and worsted)
(All nonautomatic winding of filling on bobbins or quills for use in shuttles on
looms)
Winder, other (woolen and worsted)
(All other winding not reported separately; may include automatic as well as
nonautomatic winding)

7/21/2019 bls_1551_1967.pdf
http://slidepdf.com/reader/full/bls15511967pdf 79/82

7/21/2019 bls_1551_1967.pdf
http://slidepdf.com/reader/full/bls15511967pdf 80/82
Industry Wage Studies
The most recent reports for industries included in the Bureau's program of industry wage surveys since January 1950 are listed below. Those for which a price is shown are available from the Superintendent of Documents, U.S. Government Printing Office, Washington, D. C. , 20402, or any of its regional sales offices. Those for which a price is not shown may be obtained free as
long as a supply is available, from the Bureau of Labor Statistics, Washington, D. C. , 20212, or from any of the regional offices shown on the inside back cover.
I. Occupational Wage Studies
Manufacturing
Basic Iron and Steel, 1962. BLS Bulletin 1358 (30 cents).Candy and Other Confectionery Products, 1965. BLS Bulletin 1520 (30 cents).
^Canning and Freezing, 1957. BLS Report 136.Cigar Manufacturing, 1964. BLS Bulletin 1436 (30 cents).Cigarette Manufacturing, 1965. BLS Bulletin 1472 (20 cents).Cotton Textiles, 1965. BLS Bulletin 1506 (40 cents).Distilled Liquors, 1952. Series 2, No. 88.
Fabricated Structural Steel, 1964. BLS Bulletin 1463 (30 cents).Fertilizer Manufacturing, 1962. BLS Bulletin 1362 (40 cents).Flour and Other Grain Mill Products, 1961. BLS Bulletin 1337 (30 cents).Fluid Milk Industry, 1964. BLS Bulletin 1464 (30 cents).Footwear, 1965. BLS Bulletin 1503 (50 cents).Hoisery, 1964. BLS Bulletin 1456 (45 cents).
Industrial Chemicals, 1965. BLS Bulletin 1529 (40 cents).Iron and Steel Foundries, 1962. BLS Bulletin 1386 (40 cents).Leather Tanning and Finishing, 1963. BLS Bulletin 1378 (40 cents).Machinery Manufacturing, 1965. BLS Bulletin 1476 (25 cents).Meat Products, 1963. BLS Bulletin 1415 (75 cents).Men's and Boys' Shirts (Except Work Shirts) and Nightwear, 1964.
BLS Bulletin 1457 (40 cents).Men's and Boys' Suits and Coats, 1963. BLS Bulletin 1424 (65 cents). Miscellaneous Plastics Products, 1964. BLS Bulletin 1439 (35 cents). Miscellaneous Textiles , 1953. BLS Report 56.Motor Vehicles and Motor Vehicle Parts, 1963. BLS Bulletin 1393 (45 cents).
Nonferrous Foundries, 1965. BLS Bulletin 1498 (40 cents).Paints and Varnishes, 1965. BLS Bulletin 1524 (40 cents).Paperboard Containers and Boxes, 1964. BLS Bulletin 1478 (70 cents).Petroleum Refining, 1965. BLS Bulletin 1526 (30 cents).Pressed or Blown Glass and Glassware, 1964. BLS Bulletin 1423 (30 cents).
^Processed Waste, 19-57. BLS Report 124.Pulp, Paper, and Paperboard M ills, 1962. BLS Bulletin 1341 (40 cents).Radio, Television, and Related Products, 1951. Series 2, No. 84.Railroad Cars, 1952. Series 2, No. 86.
*Raw Sugar, 1957. BLS Report 136.Southern Sawmills and Planing M ills , 1965. BLS Bulletin 1519 (30 cents). Structural Clay Products, 1964. BLS Bulletin 1459 (45 cents).Synthetic Fibers, 1966. BLS Bulletin 1540 (30 cents).Synthetic Textiles, 1965. BLS Bulletin 1509 (40 cents).Textile Dyeing and Finishing, 1965—66. BLS Bulletin 1527 (45 cents).
* Studies of the effects of the $1 minimum wage.
7/21/2019 bls_1551_1967.pdf
http://slidepdf.com/reader/full/bls15511967pdf 81/82
I. Occupational Wage Studies— Continued
Manufacturing— Continued
"•'Tobacco Stemming and Redrying, 1957. BLS Report 136.West Coast Sawmilling, 1964. BLS Bulletin 1455 (30 cents).Women's and M isse s' Coats and Suits, 1965. BLS Bulletin 1508 (25 cents). Women's and Misses' Dresses, 1966. BLS Bulletin 1538 (30 cents).Wood Household Furniture, Except Upholstered, 1965. BLS Bulletin 1496
(40 cents).^Wooden Containers, 1957. BLS Report 126.
Work Clothing, 1964. BLS Bulletin 1440 (35 cents).
Nonmanufacturing
Auto Dealer Repair Shops, 1964. BLS Bulletin 1452 (30 cents).Banking, 1964. BLS Bulletin 1466 (30 cents).Bituminous. Coal Mining, 1962. BLS Bulletin 1383 (45 cents). Communications, 1965. BLS Bulletin 1521 (20 cents).Contract Cleaning Services, 1965. BLS Bulletin 1507 (30 cents).Crude Petroleum and Natural Gas Production, I960. BLS Report 181. Department and Women's Ready-to-W ear Stores, 1950. Series 2, No. 78. Eating and Drinking Places, 1963. BLS Bulletin 1400 (40 cents).Electric and Gas Utilities, 1962. BLS Bulletin 1374 (50 cents).Hospitals, 1963. BLS Bulletin 1409 (50 cents).
Hotels and Motels , 1963. BLS Bulletin 1406 (40 cents).Laundries and Cleaning Services, 1963. BLS Bulletin 1401 (50 cents).Life Insurance, 1961. BLS Bulletin 1324 (30 cents).Nursing Homes and Related Facilities, 1965. BLS Bulletin 1492 (45 cents).
II. Other Industry Wage Studies
Factory Workers' Earnings— Distribution by Straight-Time Hourly Earnings, 1958. BLS Bulletin 1252 (40 cents).
Factory Workers' Earnings— Selected Manufacturing Industries, 1959.BLS Bulletin 1275 (35 cents).
Employee Earnings and Hours, June 1965—Retail Trade. BLS Bulletin 1501 (50 cents).
Building Materials, Hardware, and Farm Equipment Dealers.BLS Bulletin 1501-1 (25 cents).
General Merchandise Stores. BLS Bulletin 1501-2 (40 cents).Food Stores. BLS Bulletin 1501-3 (30 cents).
Automotive Dealers and Gasoline Service Stations.BLS Bulletin 1501-4 (40 cents).
Apparel and Accessory Stores. BLS Bulletin 1501 -5 (45 cents).Furniture, Home Furnishings, and Household Appliance Stores.
BLS Bulletin 1501-6 (40 cents).Miscellaneous Stores. BLS Bulletin 1501-7 (30 cents).
Employee Earnings in Nonmetropolitan Areas of the South and North Central Regions, 1962. BLS Bulletin 1416 (40 cents).
Employee Earnings and Hours in Eight Metropolitan Areas of the South, 1965.
BLS Bulletin 1533 (40 cents).
* Studies of the effects of the $1 minimum wage.
* U.S. GOVERNMENT PRINTING OFFICE : 1967 0- 26 6- 27 1

7/21/2019 bls_1551_1967.pdf
http://slidepdf.com/reader/full/bls15511967pdf 82/82
BUREAU OF LABOR STATISTICS REGIONAL OFFICES


