Blow Up The Business Case
46
BLOW UP THE BUSINESS CASE @barryoreilly #LeanEnterprise 1
-
Upload
barry-oreilly -
Category
Business
-
view
3.826 -
download
0
Transcript of Blow Up The Business Case

BLOW UP THE BUSINESS CASE
@barryoreilly #LeanEnterprise1

2
PMO + Finance PMO
Iteration 0 | 1 | 2 | 3 | 4Fuzzy front end The last mile
Ȋ$JLOHȋ�WHDPV
Centralized QA Ζ7�2SHUDWLRQV
Study+ approval
Design+ planning
Integration+ QA
Development
Testing+ showcase
Analysis
Release &operation
TRADITIONAL BUSINESS PARADIGM

2015 PRODUCT MANAGEMENT INSIGHTS
3
44% include user feedback throughout
the development process
66% of products take or more 6 months
to launch

It’s typical for 50% of the total product development time to be spent
on the fuzzy front end
- Don Reinersten
4Don Reinersten, The Principles Of Product Development Flow

STOP WRITINGSTART LEARNING
5
Sketch out ideas with the right people, at speed

BREAKING DOWN BARRIERS
6

CROSS FUNCTIONAL COLLABORATION
7

8Alexander Osterwalder and Yves Pigneur, Business Model Generation

9

10
GO, LOOK, SEE
User research by the people that are designing solutions
Get out of the building
Challenge beliefs through experience
LEARNING OVER EARNING
11
Build a runway of questions to ask, not requirements to build

12
Minimize thetotal time through
the loop
LEARN
Ζ'($6
&2'(DATA
MEASURE
BUILD
Eric Ries, The Lean Startup
IMPLEMENT AND AMPLIFY LEARNING LOOPS

13
MINIMUM VIABLE PRODUCT
Delightful
Usable
Valuable
Feasible
Delightful
Usable
Valuable
Feasible
ThisNot this
Diagram inspired by Jussi Pasanen, with acknowledgments to Aarron Walter, Ben Tollady, Ben Rowe, Lexi Thorn, and Senthil Kugalur.
TEST WITH SMALL, THIN SLICES AT SPEED

14
LAUNCH AND LEARN

15
&KDQJHVin Value
Time
%LJ�'LVFRYHU\�3RVLWLYH�%ODFN�6ZDQ�
6PDOO�(UURUV
THE PRINCIPAL OF OPTIONALITY
Nassim Taleb, Antifragile

16


Barry O’Reilly, How To Implement Hypothesis-Driven Development http://barryoreilly.com/2013/10/21/how-to-implement-hypothesis-driven-development/
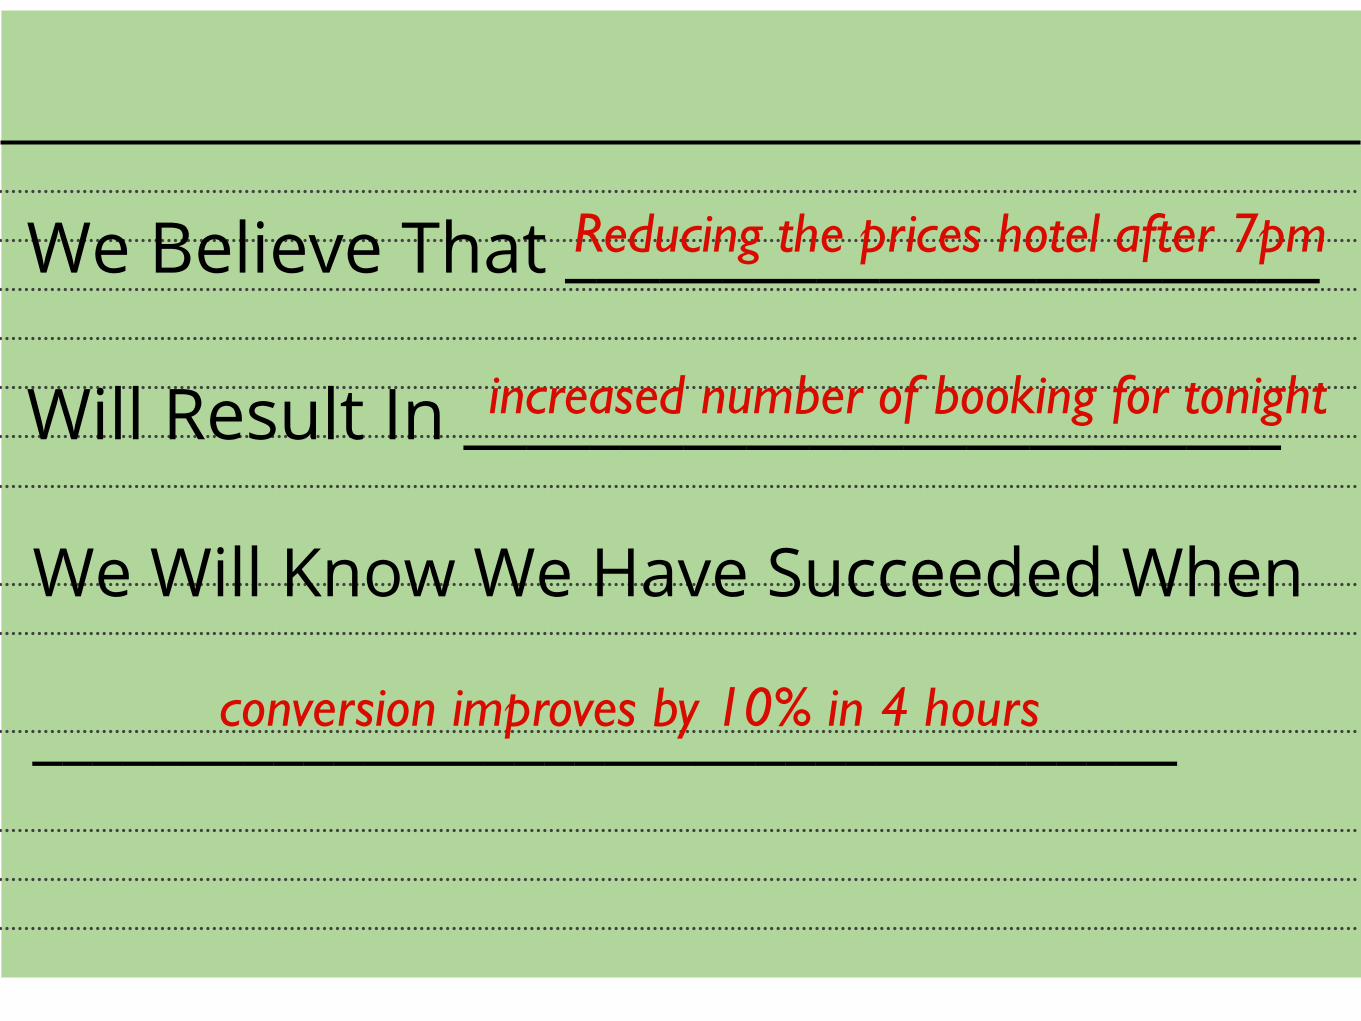
We Believe That ________________________ Will Result In __________________________
We Will Know We Have Succeeded When ______________________________________
Reducing the prices hotel after 7pm
increased number of booking for tonight
conversion improves by 10% in 4 hours

We Believe That ________________________ Will Result In __________________________
We Will Know We Have Succeeded When ______________________________________
Reducing the prices hotel after 7pm
increased number of booking for tonight
conversion improves by 10% in 4 hours
Which Is Worth £100,000

INVESTING BASED ON EVIDENCE
22
Making better decisions based on learnings

23
Doubt is not a pleasant condition,
but certainty is absurd.
- Voltaire

24

25

REDUCE UNCERTAINTY WITH EXPERIMENTS
26

27

27
14 people
£261,000
12 weeks

28

It is not enough to do your best; you must know what to do, and then do your best.
- W Edward Deming
29

PRODUCT / PROFIT CURVES
30

WHY INNOVATION LOOKS COSTLY
▫︎ Traditional management & financial accounting measures are not designed for innovation
▫︎More effective, for exploiting well understood domains or established business models and products
▫︎When exploring, accounting must not be ignored or irrelevant -- simply needs to be interpreted differently.
▫︎ Established practices provide little insight on if customer or user will love or engage with a new product
▫︎ return on investment
▫︎ financial ratio analysis
▫︎ cash flow analysis 31
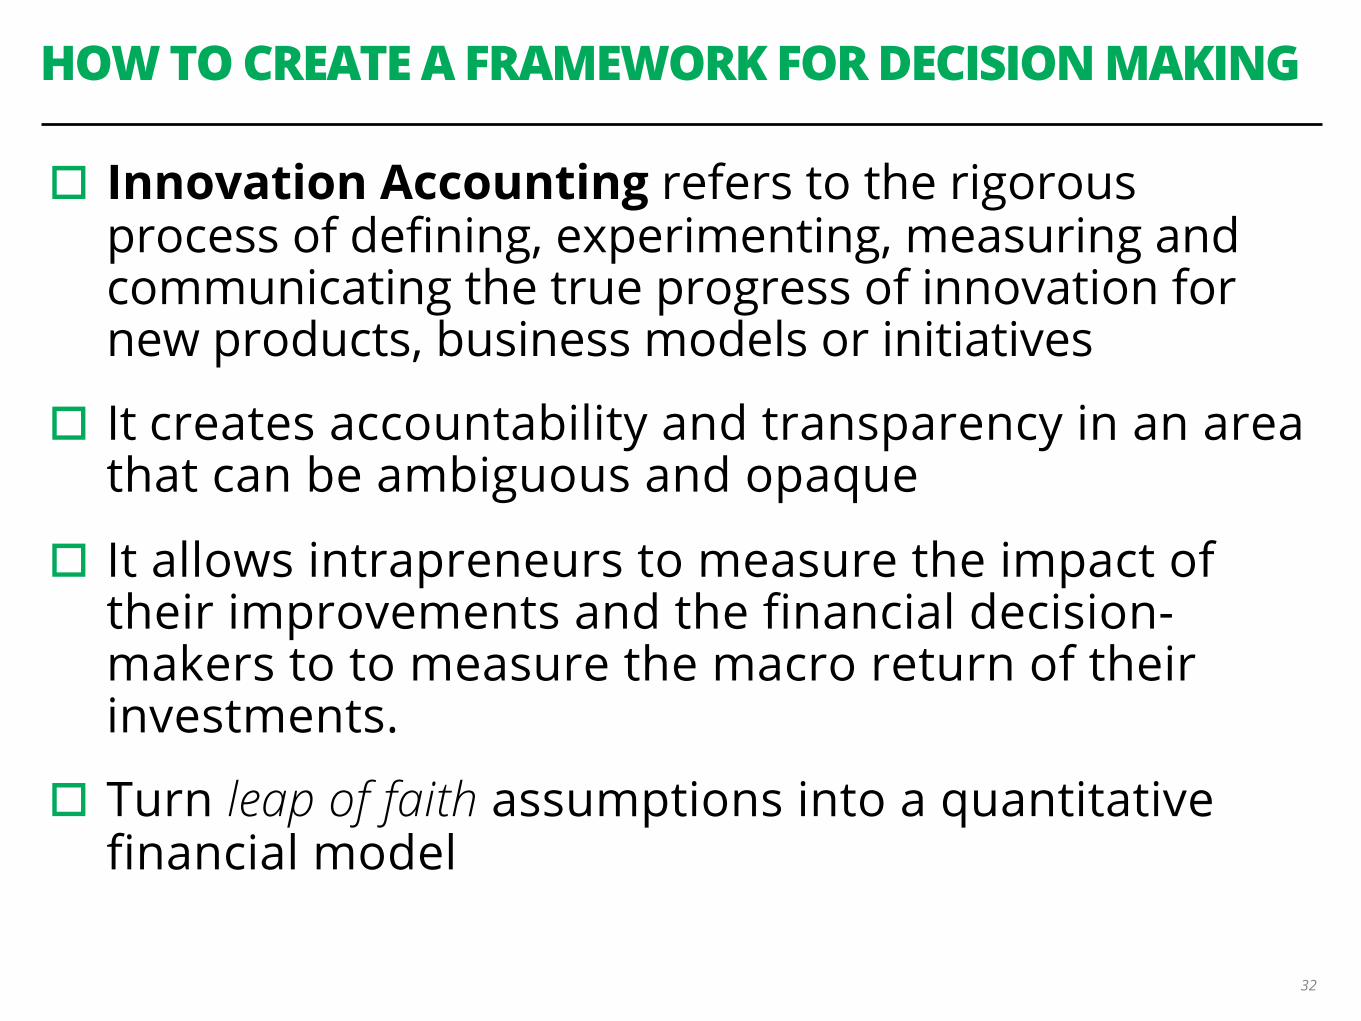
HOW TO CREATE A FRAMEWORK FOR DECISION MAKING
▫︎ Innovation Accounting refers to the rigorous process of defining, experimenting, measuring and communicating the true progress of innovation for new products, business models or initiatives
▫︎ It creates accountability and transparency in an area that can be ambiguous and opaque
▫︎ It allows intrapreneurs to measure the impact of their improvements and the financial decision-makers to to measure the macro return of their investments.
▫︎ Turn leap of faith assumptions into a quantitative financial model
32

HOW DO WE SHOW THE CFO WE ARE MAKING PROGRESS?
33
Stakeholder Measure Current Target Trend
CustomerCustomerCustomer
BusinessBusinessBusinessBusinessBusiness
% users that complete sales flow 30% 45%
% retention 20% 25%
Net Promoter Score 44 60
% visits to sign up for service 20% 25%
% conversion to paying customers 15% 20%
Customer acquisition costs £0.50 £0.25
Life time customer vale £12 £20
% attrition 30% 15%

ONE METRIC THAT MATTERS
34
Stakeholder Measure Current Target Trend
CustomerCustomerCustomer
BusinessBusinessBusinessBusinessBusiness
% users that complete sales flow 30% 45%
% retention 20% 25%
Net Promoter Score 44 60
% visits to sign up for service 20% 25%
% conversion to paying customers 15% 20%
Customer acquisition costs £0.50 £0.25
Life time customer vale £12 £20
% attrition 30% 15%

MEASURE USER AND CUSTOMER ENGAGEMENT
35

GROWTH METICS AND OUTCOMES
36
Element Purpose Relevant Metrics
What we will use?
Acquisition
Activation
Retention
Revenue
Referral
Generate attention of product
Traffic, Mentions, Cost per Click, Cost of
Acquisition
Turn drive-by visitors into customers that
are enrolled
Sign ups, Completed on-boarding process,
Used service once
Convince customer to return repeatedly or stickiness behaviour
Time since last visit, daily/month active
users, churns
Business outcomes dependent or
business model
Customer life value, conversion rate,
shopping cart size
Viral and word of mouth invitations to
other customers
Invites sent, viral coefficient, viral cycle
time

BASED ON EVIDENCE UNDERSTAND THE FUTURE UPSIDE
37
Understanding the upside of new customers, how often they return, convert, share or recommend our product means we can use the evidence of the engagement level to steer future decisions and potential for return on investment

CONCLUSIONTell the story as a narrative with a runway to succeed
38

TELL THE STORY AS A NARRATIVE WITH A RUNWAY TO SUCCEED
17
39

TELL THE STORY AS A NARRATIVE WITH A RUNWAY TO SUCCEED
17
Aspirational Customer Journey
40

TELL THE STORY AS A NARRATIVE WITH A RUNWAY TO SUCCEED
17
Aspirational Customer Journey
Product Hypotheses
41

TELL THE STORY AS A NARRATIVE WITH A RUNWAY TO SUCCEED
17
Aspirational Customer Journey
Product Hypotheses
Design Experiments
42
TELL THE STORY AS A NARRATIVE WITH A RUNWAY TO SUCCEED
17
Aspirational Customer Journey
Product Hypotheses
Design Experiments
User Story Map
43

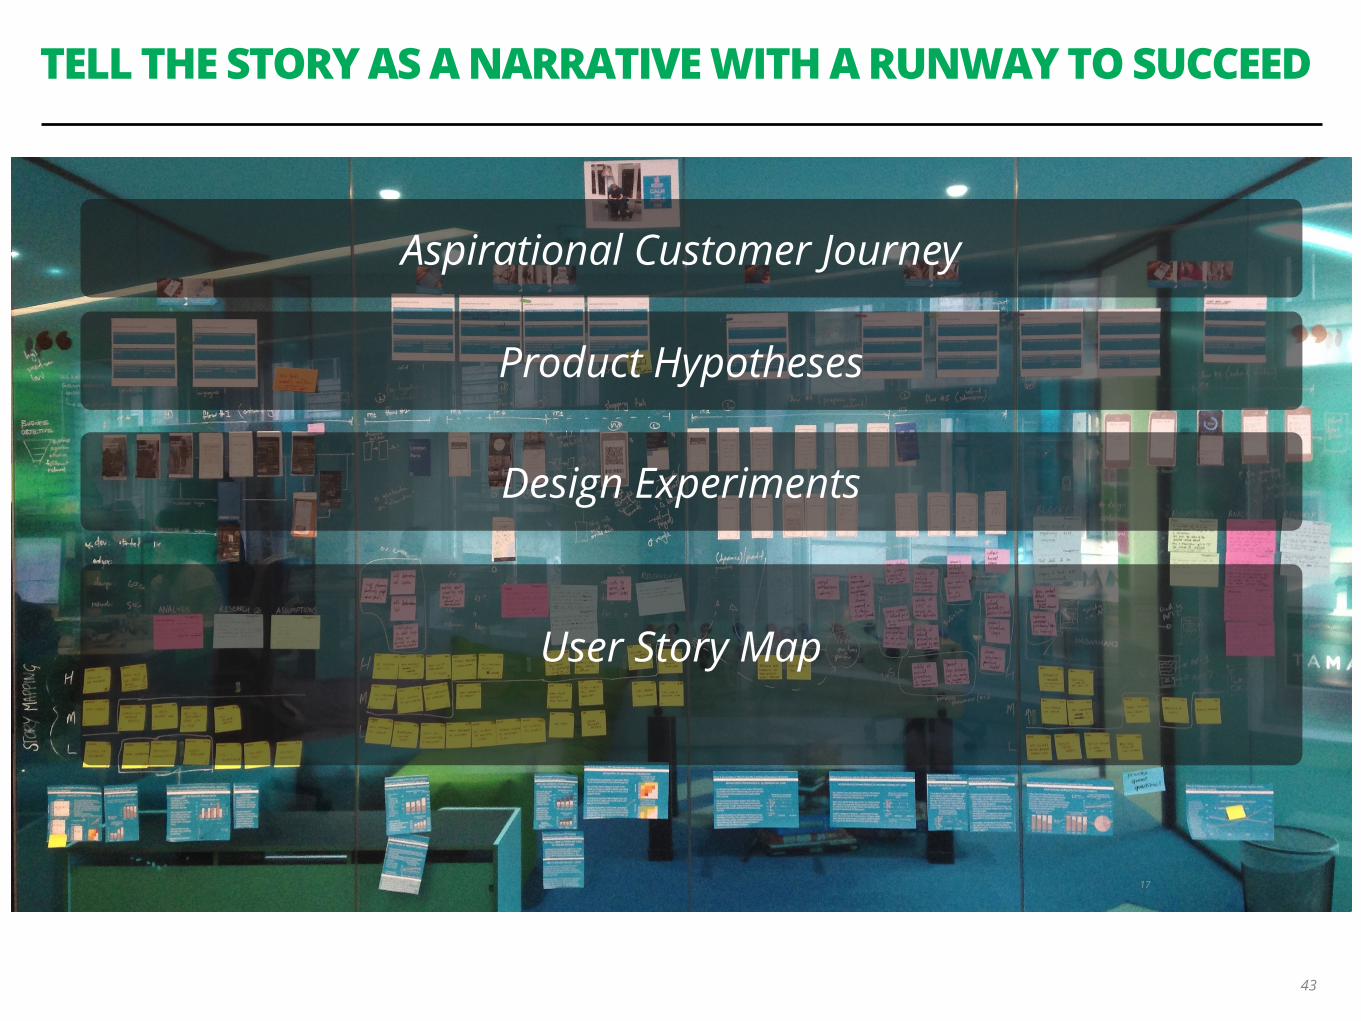
TELL THE STORY AS A NARRATIVE WITH A RUNWAY TO SUCCEED
17
Aspirational Customer Journey
Product Hypotheses
Design Experiments
User Story Map
Data/feedback
44

@barryoreillywww.barryoreilly.com#leanenterprise @jezhumble | @jemolesky
Australia | Brazil | Canada | ChinaEcuador | Germany | Italy India | Singapore | South Africa Turkey | Uganda | UK | USA
© 2015 ThoughtWorks, Inc.
45
THANK YOU