Bloomington Faculty Council 2013 Cohort Report …obap/docs/BFC11-05-13PresentationPublic.pdf ·...
74
Bloomington Faculty Council 2013 Cohort Report and 2014 Initiatives November 5, 2013
Transcript of Bloomington Faculty Council 2013 Cohort Report …obap/docs/BFC11-05-13PresentationPublic.pdf ·...

Bloomington Faculty Council
2013 Cohort Report and 2014 Initiatives
November 5, 2013

Bloomington Faculty Council
Enrollment Presentation
2013 Cohort Report and 2014 Initiatives
Vice Provost David Johnson
Office of Enrollment Management
November 5, 2013
I N D I A N A U N I V E R S I T Y 1
WELCOME

OEM Vision and Goals
2013
• Beginner Cohort
• Data Projections
• Recruitment Strategies
2014
• Data Projections
• Challenges for Higher Education
• Strategies to Employ
• New Initiatives
I N D I A N A U N I V E R S I T Y 2
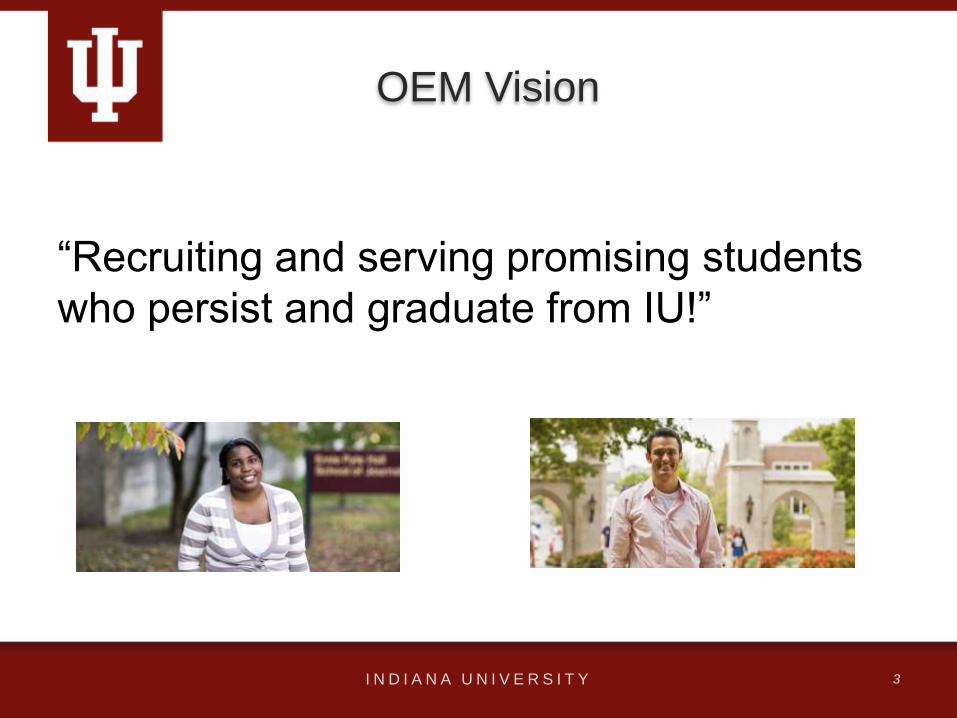
OEM Vision
I N D I A N A U N I V E R S I T Y 3
“Recruiting and serving promising students
who persist and graduate from IU!”

OEM Enrollment Goals
• Serve Indiana residents and non-residents
• Make quality gains in the student profile
• Improve the number of underrepresented
minorities
• Help keep IUB affordable for Hoosiers
I N D I A N A U N I V E R S I T Y 4

2013 Beginner Cohort
I N D I A N A U N I V E R S I T Y 5
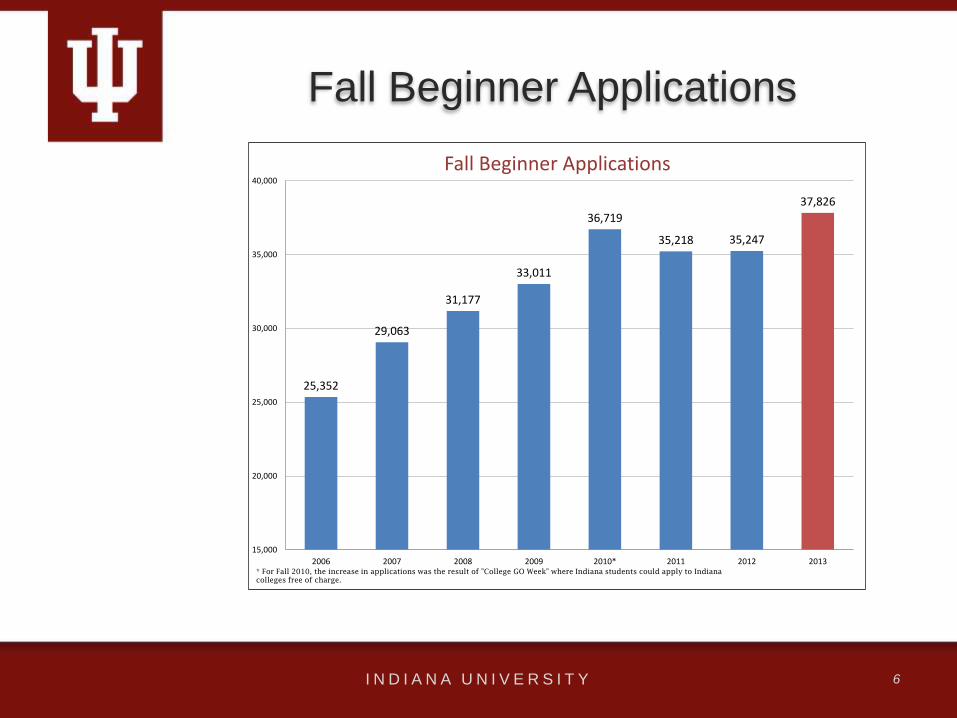
Fall Beginner Applications
I N D I A N A U N I V E R S I T Y 6
25,352
29,063
31,177
33,011
36,719
35,218 35,247
37,826
15,000
20,000
25,000
30,000
35,000
40,000
2006 2007 2008 2009 2010* 2011 2012 2013
Fall Beginner Applications
* For Fall 2010, the increase in applications was the result of "College GO Week" where Indiana students could apply to Indiana
colleges free of charge.

Undergraduate Beginners
I N D I A N A U N I V E R S I T Y 7
7,2537,198
7,564
7,327
7,020
7,424
7,613 7,604
6,000
6,200
6,400
6,600
6,800
7,000
7,200
7,400
7,600
7,800
2006 2007 2008 2009 2010 2011 2012 2013
Undergraduate Beginners
*the base budget is currently 7500 students
2013 Beginner Cohort
I N D I A N A U N I V E R S I T Y 8
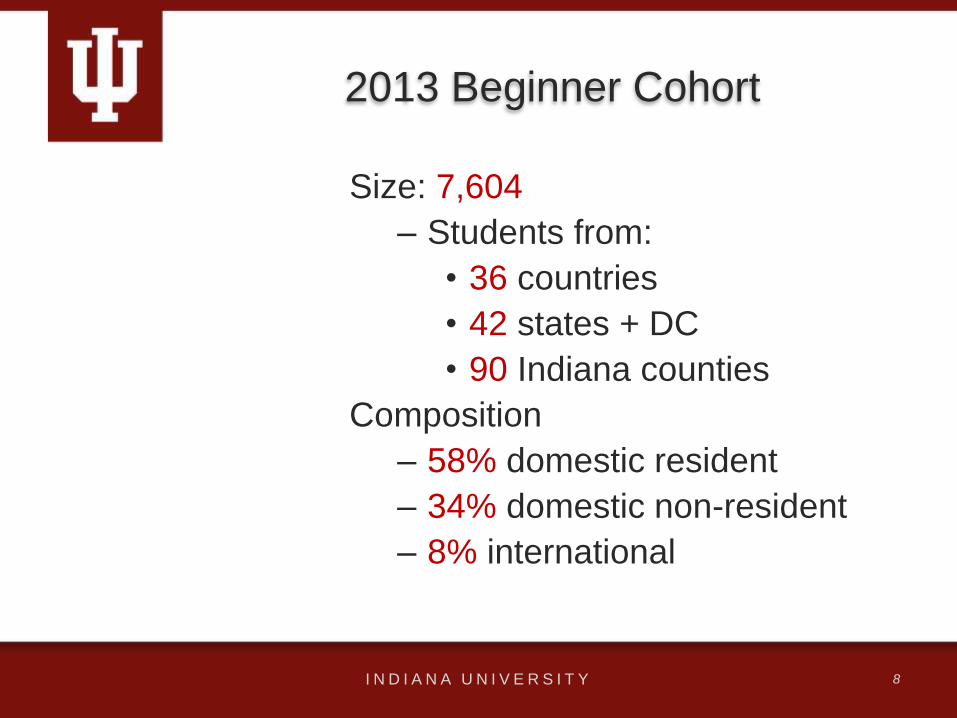
Size: 7,604
– Students from:
• 36 countries
• 42 states + DC
• 90 Indiana counties
Composition
– 58% domestic resident
– 34% domestic non-resident
– 8% international

2013 Beginner Cohort, Continued
I N D I A N A U N I V E R S I T Y 9
Most academically talented
– Average SAT Composite/ACT converted of 1217
– Median GPA of 3.72
– More than 90% of enrolled Indiana residents graduated
with an Indiana Academic Honors Diploma
Most diverse in IU's history, with much more work to do
– 1,289 US minority students
– 19% of domestic students with a known race or ethnicity
– 1,184 First Generation students
Intended Major, Direct Admits,
Hutton Honors College Enrollment
I N D I A N A U N I V E R S I T Y 10
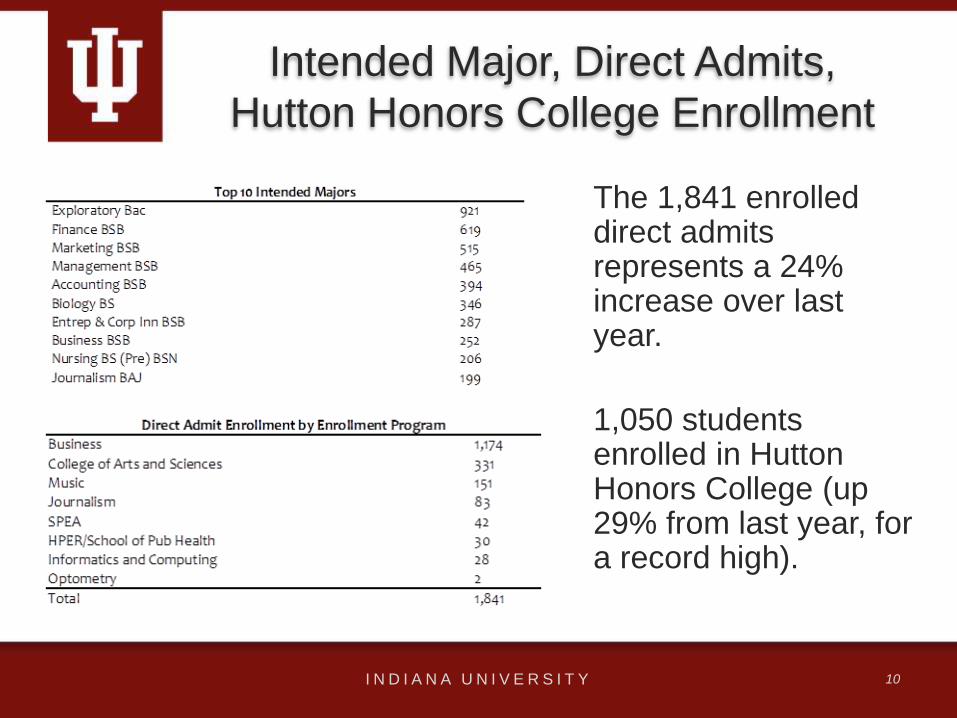
The 1,841 enrolled direct admits represents a 24% increase over last year.
1,050 students enrolled in Hutton Honors College (up 29% from last year, for a record high).

Undergraduate Beginners by
Residency
I N D I A N A U N I V E R S I T Y 11

2012 & 2013 Beginner Cohorts
I N D I A N A U N I V E R S I T Y 12
Marion 744 Hamilton 749
Hamilton 620 Marion 671
Lake 311 Lake 297
Monroe 297 Monroe 291
Allen 278 Allen 260
St Joseph 185 St Joseph 172
Hendricks 149 Hendricks 141
Johnson 134 Johnson 138
Porter 134 Porter 130
Vanderburgh 116 Boone 129
2012 Cohort
Top 10 Indiana Counties
2013 Cohort
Indiana 4,720 Indiana 4,426
Illinois 919 Illinois 1,087
Ohio 151 New York 181
New York 148 California 171
California 147 Ohio 160
New Jersey 118 New Jersey 153
Missouri 77 Michigan 84
Florida 68 Florida 79
Texas 62 Missouri 78
Maryland 61 Pennsylvania 61
2012 Cohort
Top 10 States
2013 Cohort
China 508 China 404
South Korea 91 South Korea 84
India 40 India 50
Canada 10 Taiwan 10
Taiwan 8 Canada 9
Indonesia 5 United Kingdom 5
Hong Kong 3 Pakistan 4
Singapore 3 Hong Kong 3
Australia 2 Thailand 3
Colombia 2 Bolivia 2
2013 Cohort
Top 10 Countries of Citizenship for International Students
2012 Cohort

OEM Awards to Beginners and
Others, Fiscal Year 2013
I N D I A N A U N I V E R S I T Y 13
Student
Population
Number of
AwardsPercentage
Dollars
DisbursedPercentage
3,394 27% $19,215,562 30%
9,047 73% $45,710,542 70%
12,441 100% $64,926,104 100%
Beginners
All Others
Total
Undergraduate Beginner SAT Scores
I N D I A N A U N I V E R S I T Y 14
1132
1164
1174
12031199
1201 1202
1217
1120
1130
1140
1150
1160
1170
1180
1190
1200
1210
1220
2006 2007 2008 2009 2010 2011 2012 2013
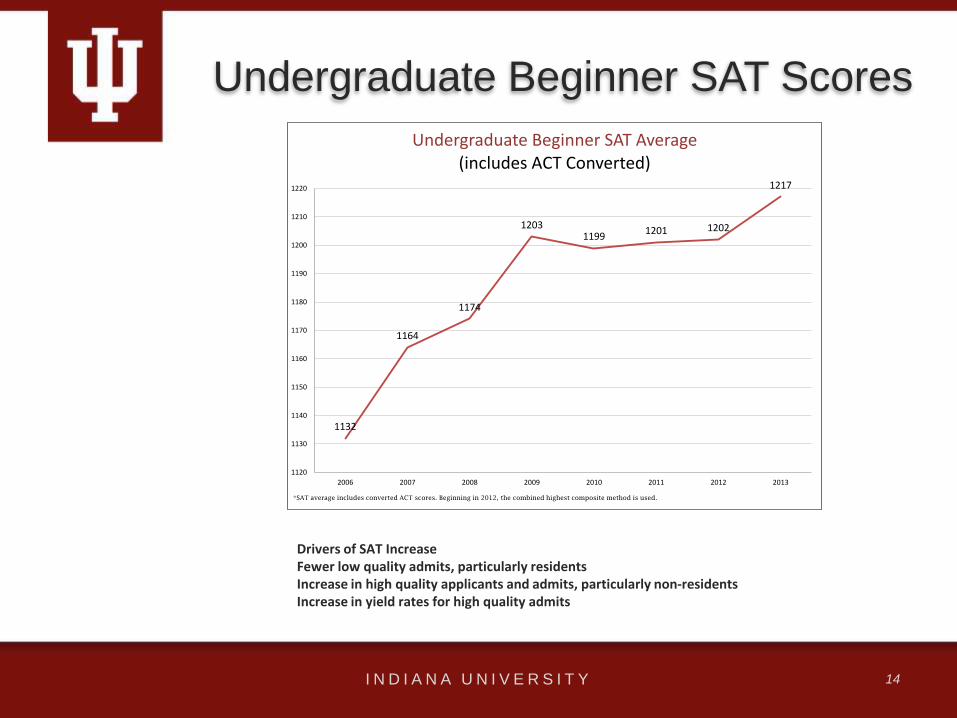
Undergraduate Beginner SAT Average(includes ACT Converted)
*SAT average includes converted ACT scores. Beginning in 2012, the combined highest composite method is used.
Drivers of SAT Increase Fewer low quality admits, particularly residents Increase in high quality applicants and admits, particularly non-residents Increase in yield rates for high quality admits

Undergraduate Beginner SAT
Average by Residency
I N D I A N A U N I V E R S I T Y 15
1100
1120
1140
1160
1180
1200
1220
1240
1260
2006 2007 2008 2009 2010 2011 2012 2013
Undergraduate Beginner SAT Average by Residency(includes ACT Converted)
Overall Average SAT (including ACT) Domestic Resident Domestic Nonresident International
*SAT average includes converted ACT scores. Beginning in 2012, the combined highest composite method is used.
Undergraduate Beginner Median
High School GPA
I N D I A N A U N I V E R S I T Y 16
3.53
3.61
3.63
3.67
3.69 3.69 3.69
3.72
3.50
3.55
3.60
3.65
3.70
3.75
2006 2007 2008 2009 2010 2011 2012 2013
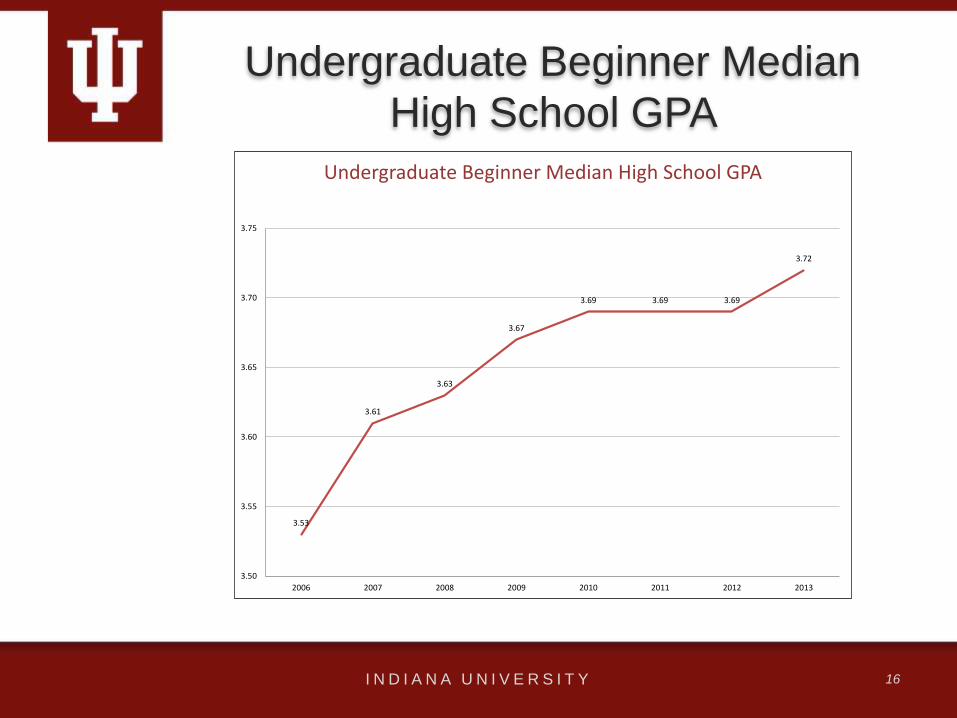
Undergraduate Beginner Median High School GPA

US Minority Enrollment (Beginners)
I N D I A N A U N I V E R S I T Y 17
808 817
923950
1,1401,175
1,229
1,289
12% 12% 13%14%
18% 18% 18% 19%
0%
2%
4%
6%
8%
10%
12%
14%
16%
18%
20%
500
600
700
800
900
1,000
1,100
1,200
1,300
2006 2007 2008 2009 2010 2011 2012 2013
US Minority Enrollment (Beginners)Includes African American, Asian, Hispanic, and Native American.
Beginning in 2010, also includes Hawaiian/Pacific Islander, and 2 or more races. The percentage is of domestic students with known race/ethnicity.

US Underrepresented Minority
Enrollment (Beginners)
I N D I A N A U N I V E R S I T Y 18
532 535
584
623
886859
938965
8% 8% 8%
9%
14%13%
14% 14%
0%
2%
4%
6%
8%
10%
12%
14%
16%
500
600
700
800
900
1,000
1,100
1,200
1,300
2006 2007 2008 2009 2010 2011 2012 2013
US Underrepresented Minority Enrollment (Beginners)Includes African American, Hispanic, and Native American.
Beginning in 2010, also includes Hawaiian/Pacific Islander, and 2 or more races. The percentage is of domestic students with known race/ethnicity.

Total Undergraduate and Campus
Enrollment
I N D I A N A U N I V E R S I T Y 19
29,258 29,734 31,087 32,000 31,892 32,041 31,927 31,984
8,951 9,2179,224
10,311 10,542 10,646 10,154 10,36838 39
4336 30 44 52
4,465
38,247 38,99040,354
42,347 42,464 42,731 42,133
46,817
0
5,000
10,000
15,000
20,000
25,000
30,000
35,000
40,000
45,000
50,000
2006 2007 2008 2009 2010 2011 2012 2013
Total Undergraduate and Campus Enrollment(Campus includes Undergraduate, Graduate, Professional, and NonDegree)
Undergraduate Graduate and Other Advanced College Project* Total
* Beginning in 2013, a new online application/enrollment system allowed ACP students to be registered prior to census (which was historically
unavailable), leading to an apparent large increase in this population on census date.

2013 Data Projections
I N D I A N A U N I V E R S I T Y 20
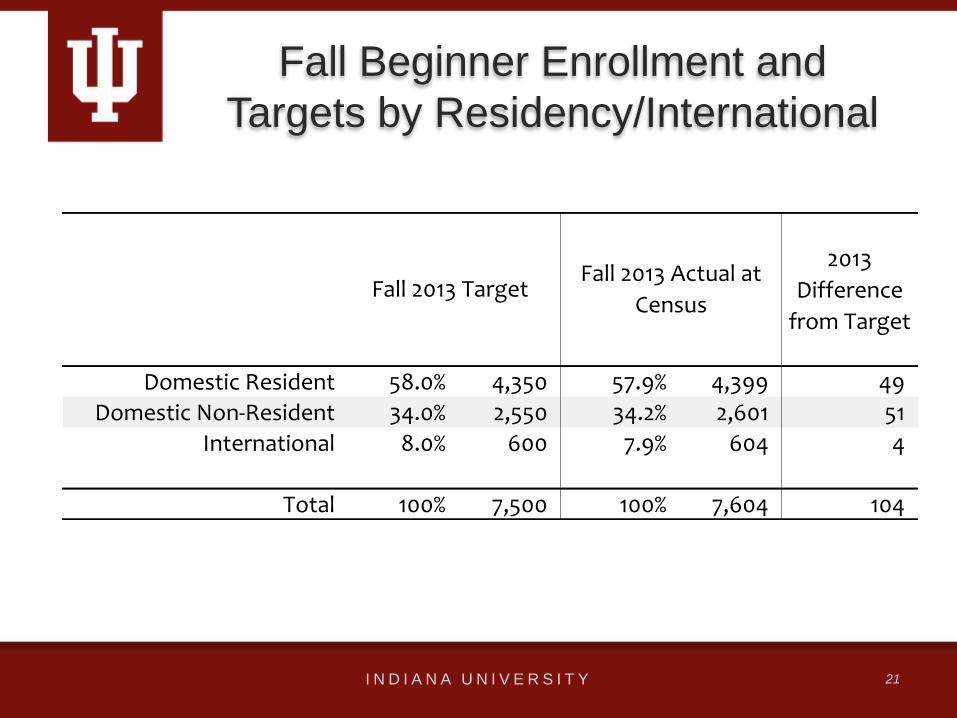
Fall Beginner Enrollment and
Targets by Residency/International
I N D I A N A U N I V E R S I T Y 21
2013
Difference
from Target
Domestic Resident 58.0% 4,350 57.9% 4,399 49
Domestic Non-Resident 34.0% 2,550 34.2% 2,601 51
International 8.0% 600 7.9% 604 4
Total 100% 7,500 100% 7,604 104
Fall 2013 TargetFall 2013 Actual at
Census
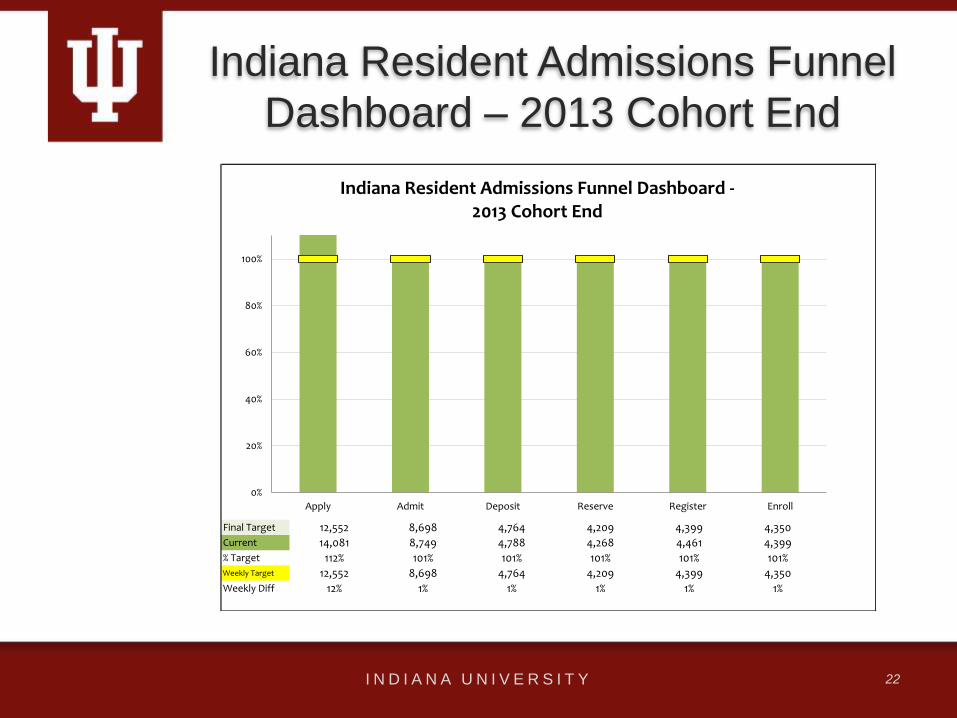
Indiana Resident Admissions Funnel
Dashboard – 2013 Cohort End
I N D I A N A U N I V E R S I T Y 22
Final Target 12,552 8,698 4,764 4,209 4,399 4,350
Current 14,081 8,749 4,788 4,268 4,461 4,399
% Target 112% 101% 101% 101% 101% 101%Weekly Target 12,552 8,698 4,764 4,209 4,399 4,350
Weekly Diff 12% 1% 1% 1% 1% 1%
0%
20%
40%
60%
80%
100%
Apply Admit Deposit Reserve Register Enroll
Indiana Resident Admissions Funnel Dashboard -2013 Cohort End
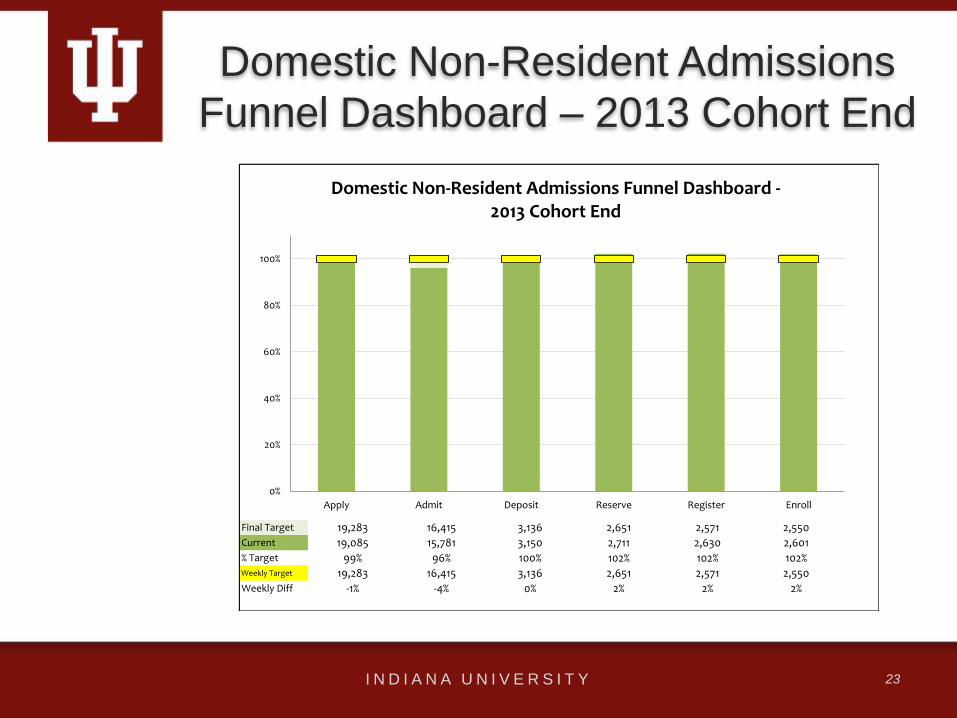
Domestic Non-Resident Admissions
Funnel Dashboard – 2013 Cohort End
I N D I A N A U N I V E R S I T Y 23
Final Target 19,283 16,415 3,136 2,651 2,571 2,550
Current 19,085 15,781 3,150 2,711 2,630 2,601
% Target 99% 96% 100% 102% 102% 102%Weekly Target 19,283 16,415 3,136 2,651 2,571 2,550
Weekly Diff -1% -4% 0% 2% 2% 2%
0%
20%
40%
60%
80%
100%
Apply Admit Deposit Reserve Register Enroll
Domestic Non-Resident Admissions Funnel Dashboard -2013 Cohort End

International Admissions Funnel
Dashboard – 2013 Cohort End
I N D I A N A U N I V E R S I T Y 24
Final Target 4,289 2,242 702 606 600 600
Current 4,711 2,791 725 609 606 604
% Target 110% 124% 103% 100% 101% 101%Weekly Target 4,289 2,242 702 606 600 600
Weekly Diff 10% 24% 3% 0% 1% 1%
0%
20%
40%
60%
80%
100%
Apply Admit Deposit Reserve Register Enroll
International Admissions Funnel Dashboard -2013 Cohort End

2013 Recruitment Strategies
1. Resident and Nonresident Regional Recruitment
2. Scholarships
3. Purchasing More Names
How did we do:
1. Key markets were up – 2013 key markets chart
2. Scholarship yield increased – 2013 scholarships report
3. Purchased names yield was up – 2013 bought names report
I N D I A N A U N I V E R S I T Y 25

2014 Data Projections
I N D I A N A U N I V E R S I T Y 26
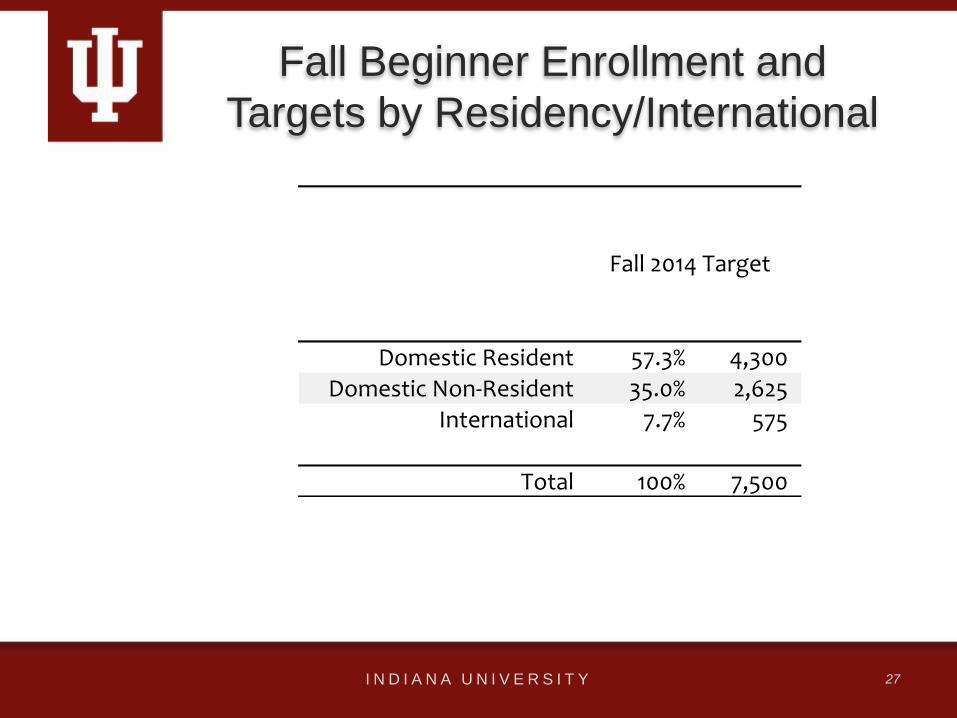
Fall Beginner Enrollment and
Targets by Residency/International
I N D I A N A U N I V E R S I T Y 27
Domestic Resident 57.3% 4,300
Domestic Non-Resident 35.0% 2,625
International 7.7% 575
Total 100% 7,500
Fall 2014 Target
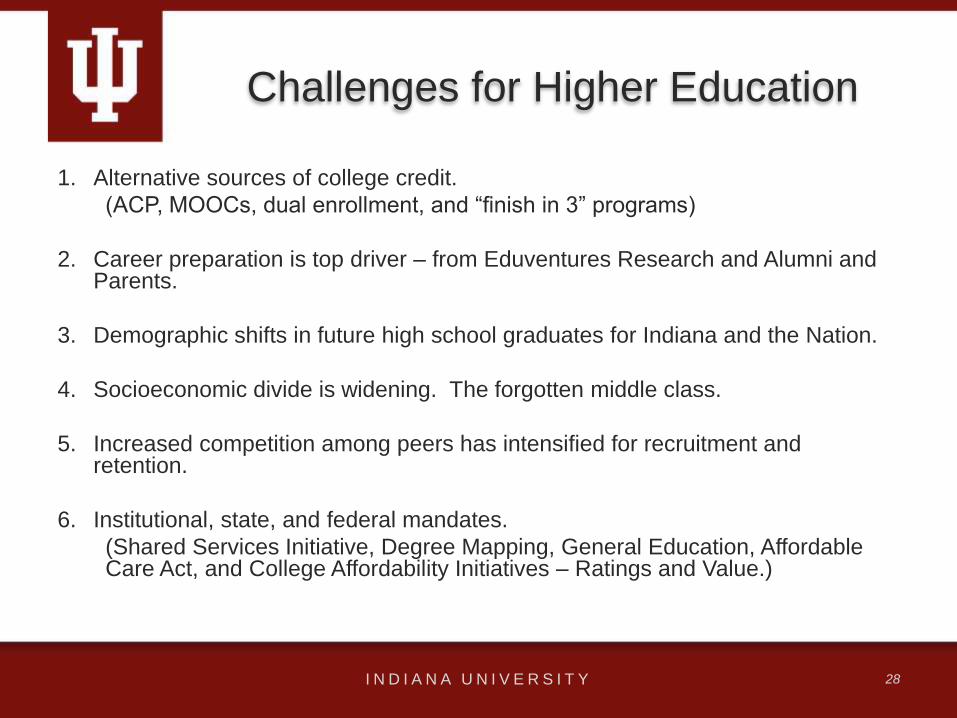
Challenges for Higher Education
1. Alternative sources of college credit.
(ACP, MOOCs, dual enrollment, and “finish in 3” programs)
2. Career preparation is top driver – from Eduventures Research and Alumni and Parents.
3. Demographic shifts in future high school graduates for Indiana and the Nation.
4. Socioeconomic divide is widening. The forgotten middle class.
5. Increased competition among peers has intensified for recruitment and retention.
6. Institutional, state, and federal mandates.
(Shared Services Initiative, Degree Mapping, General Education, Affordable Care Act, and College Affordability Initiatives – Ratings and Value.)
I N D I A N A U N I V E R S I T Y 28
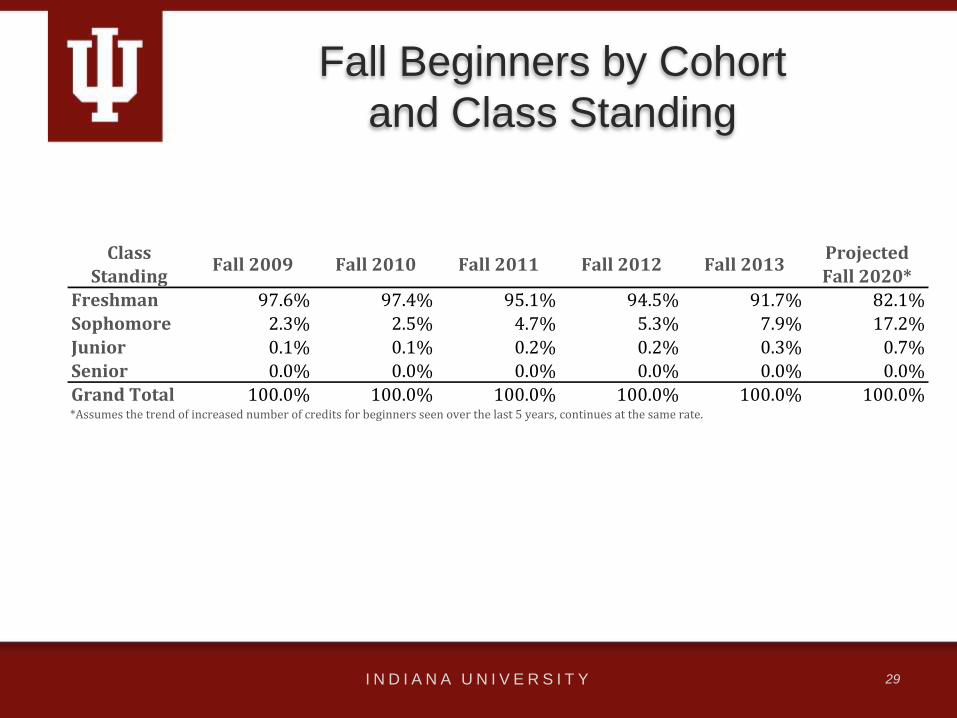
Fall Beginners by Cohort
and Class Standing
I N D I A N A U N I V E R S I T Y 29
Class
StandingFall 2009 Fall 2010 Fall 2011 Fall 2012 Fall 2013
Projected
Fall 2020*
Freshman 97.6% 97.4% 95.1% 94.5% 91.7% 82.1%
Sophomore 2.3% 2.5% 4.7% 5.3% 7.9% 17.2%
Junior 0.1% 0.1% 0.2% 0.2% 0.3% 0.7%
Senior 0.0% 0.0% 0.0% 0.0% 0.0% 0.0%
Grand Total 100.0% 100.0% 100.0% 100.0% 100.0% 100.0%*Assumes the trend of increased number of credits for beginners seen over the last 5 years, continues at the same rate.

3-Year Trend on the Top Drivers of
College Choice
I N D I A N A U N I V E R S I T Y 30
Source: Eduventures 2013 College Bound Market Survey

Alumni Survey
I N D I A N A U N I V E R S I T Y 31
• IU/IUAA partnership with Eduventures
• Survey administered in March and April 2013
• 58,239 alumni invited
• 10% response rate
• Respondents graduated in over 400 degree
programs
– Top majors were Marketing, Finance,
Biology, and Accounting
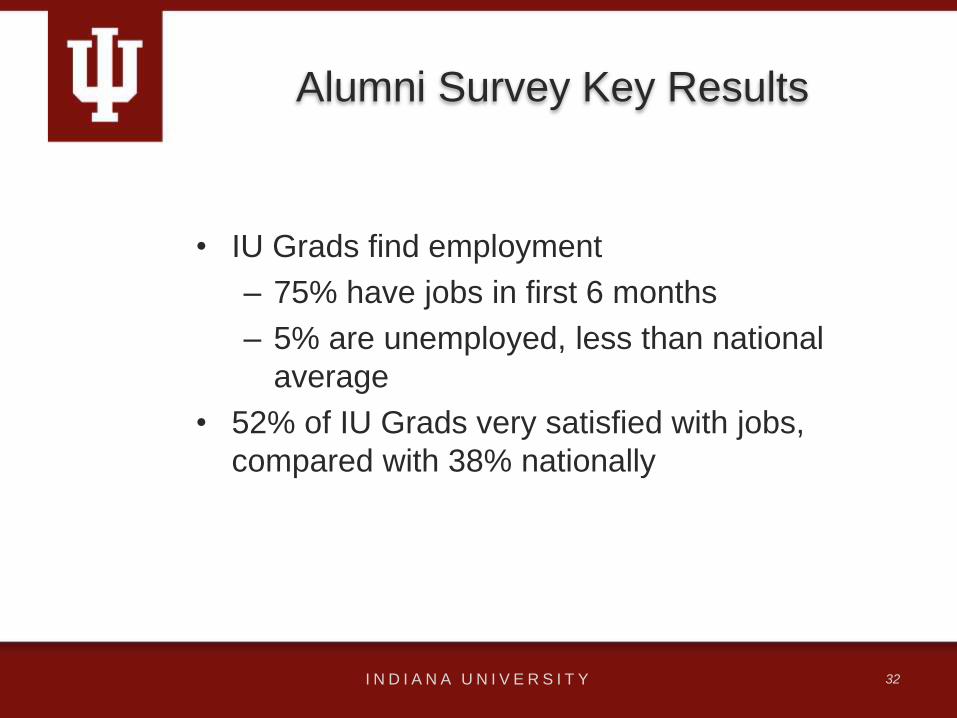
Alumni Survey Key Results
I N D I A N A U N I V E R S I T Y 32
• IU Grads find employment
– 75% have jobs in first 6 months
– 5% are unemployed, less than national
average
• 52% of IU Grads very satisfied with jobs,
compared with 38% nationally

Alumni Say They are Prepared For:
I N D I A N A U N I V E R S I T Y 33
• Effective teamwork
and communication
• Problem solving and
critical thinking

Top Skills Employers Seek,
Top Skills Alumni Report for Career Preparation,
and Parent Preference
Top Skills Employers Seek
Ability to work in a team structure
Ability to verbally communicate with people in and out of the organization
Ability to make decisions and solve problems
Ability to obtain and process information
Ability to plan, organize and prioritize work
Source: National Association of Colleges and Employers (NACE) report, Getting Noticed, Getting Hired, November 2011
IU Alumni Career Preparation
Work effectively as a member of a team
Act ethically
Solve problems independently
Communicate effectively in writing
Improve your critical thinking/analytic abilities
Source: Eduventures: 2013 Alumni Outcomes Study
Parents
Parents have a preference for what we define as characteristics that are the “Means to Success,” which are those overall
skills that their children will employ to achieve success over the long-term, such as critical thinking and communication skills.
Source: Eduventures: Parents as Partners: 2013 Parent Market Update
I N D I A N A U N I V E R S I T Y 34
I N D I A N A U N I V E R S I T Y 35
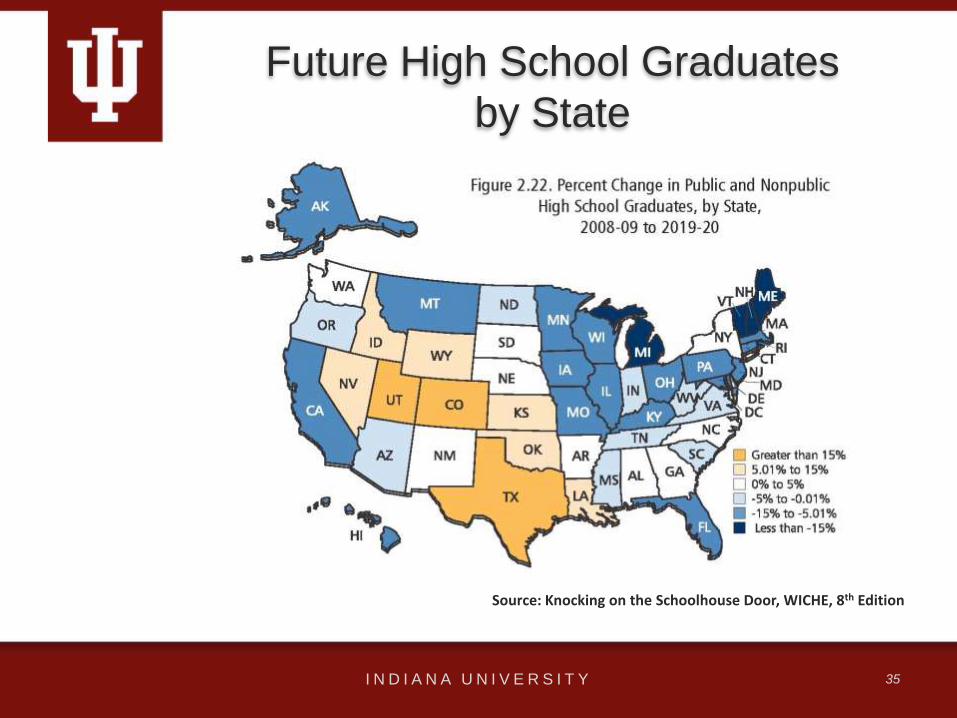
Future High School Graduates
by State
Source: Knocking on the Schoolhouse Door, WICHE, 8th Edition

I N D I A N A U N I V E R S I T Y 36
US and Regional Change
Source: Knocking on the Schoolhouse Door, WICHE, 8th Edition

Indiana Public High School
Graduates by Race/Ethnicity
I N D I A N A U N I V E R S I T Y 37
Source: Knocking on the Schoolhouse Door, WICHE, 8th Edition
0
10,000
20,000
30,000
40,000
50,000
60,000
70,000
Indiana Public High School Graduates by Race/Ethnicity
White, non-Hispanic Hispanic Black, non-Hispanic Asian/Pacific Islander Am. Indian/Alaska NativeSource: Knocking on the Schoolhouse Door, WICHE, 8th Edition
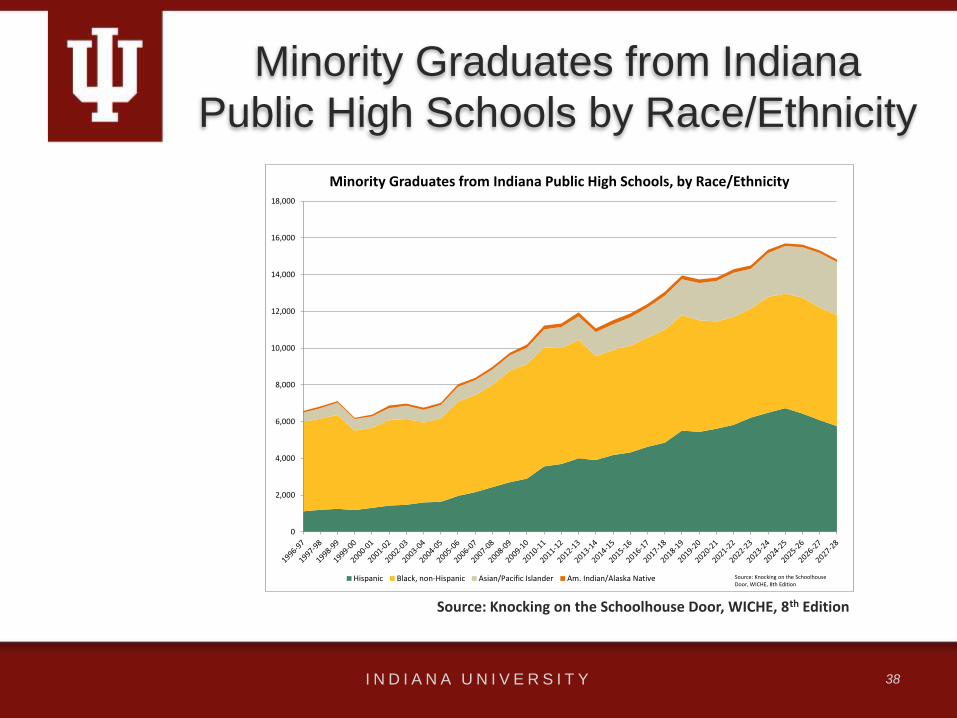
Minority Graduates from Indiana
Public High Schools by Race/Ethnicity
I N D I A N A U N I V E R S I T Y 38
0
2,000
4,000
6,000
8,000
10,000
12,000
14,000
16,000
18,000
Minority Graduates from Indiana Public High Schools, by Race/Ethnicity
Hispanic Black, non-Hispanic Asian/Pacific Islander Am. Indian/Alaska Native Source: Knocking on the Schoolhouse Door, WICHE, 8th Edition
Source: Knocking on the Schoolhouse Door, WICHE, 8th Edition
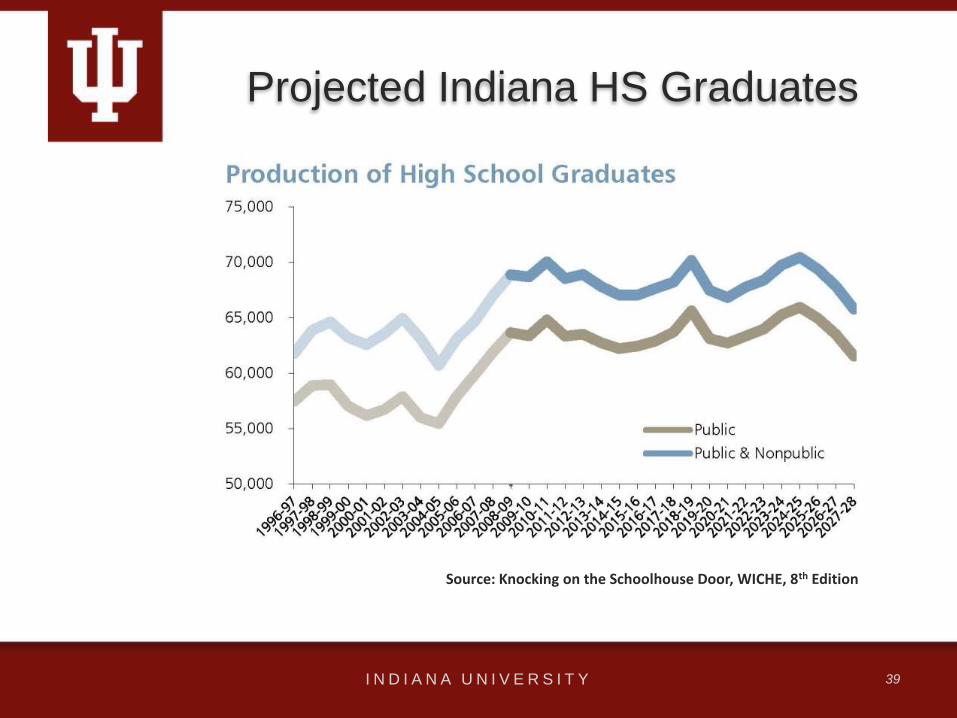
I N D I A N A U N I V E R S I T Y 39
Projected Indiana HS Graduates
Source: Knocking on the Schoolhouse Door, WICHE, 8th Edition

Average Net Price for IUB Resident
Beginner Students by Income
I N D I A N A U N I V E R S I T Y 40
Income Band 2009-2010 2010-2011 2011-2012
$0 – $30,000 3,637$ 3,919$ 4,726$
$30,001 – $48,000 5,845$ 6,921$ 7,435$
$48,001 – $75,000 12,953$ 13,299$ 14,634$
$75,001 – $110,000 17,229$ 18,553$ 18,614$
$110,001 and more 17,864$ 18,929$ 19,701$
Total Average Net Price 10,219$ 10,324$ 10,899$
Full-time beginning undergraduate students who paid the in-state or in-district tuition rate and were awarded grant or scholarship aid from federal, state or local governments, or the institution. Average net price is generated by subtracting the average amount of federal, state/local government, or institutional grant or scholarship aid from the total cost of attendance. Total cost of attendance is the sum of published tuition and required fees (lower of in-district or in-state), books and supplies, and the weighted average for room and board and other expenses.
Source: College Navigator http://NCES.ed.gov/collegenavigator

Undergraduate First-Time Full Time
Beginner Loan Debt by Family Income:
2011 IUB Beginners by Residency
I N D I A N A U N I V E R S I T Y 41
Income Band Count
Percent
with
Loans
Average
Loan Debt
for
Borrowers Count
Percent
with
Loans
Average
Loan Debt
for
Borrowers Count
Percent
with
Loans
Average
Loan Debt
for
Borrowers
$0 - $30,000 567 35% $5,564 116 64% $7,115 683 40% $5,987
$30,001 - $48,000 395 47% $5,479 56 80% $6,712 451 51% $5,721
$48,001 - $75,000 635 70% $6,731 92 78% $9,348 727 71% $7,097
$75,001 - $110,000 860 68% $7,123 146 71% $9,900 1,006 69% $7,540
$110,000 or More 1,407 48% $7,098 815 58% $7,861 2,222 52% $7,409
Unknown 729 1% $9,237 1,565 0% $13,375 2,294 0% $11,076
Total 4,593 46% $6,747 2,790 28% $8,166 7,383 39% $7,127
Resident Non-Resident Total
Source: UIRR Loan Debt Data
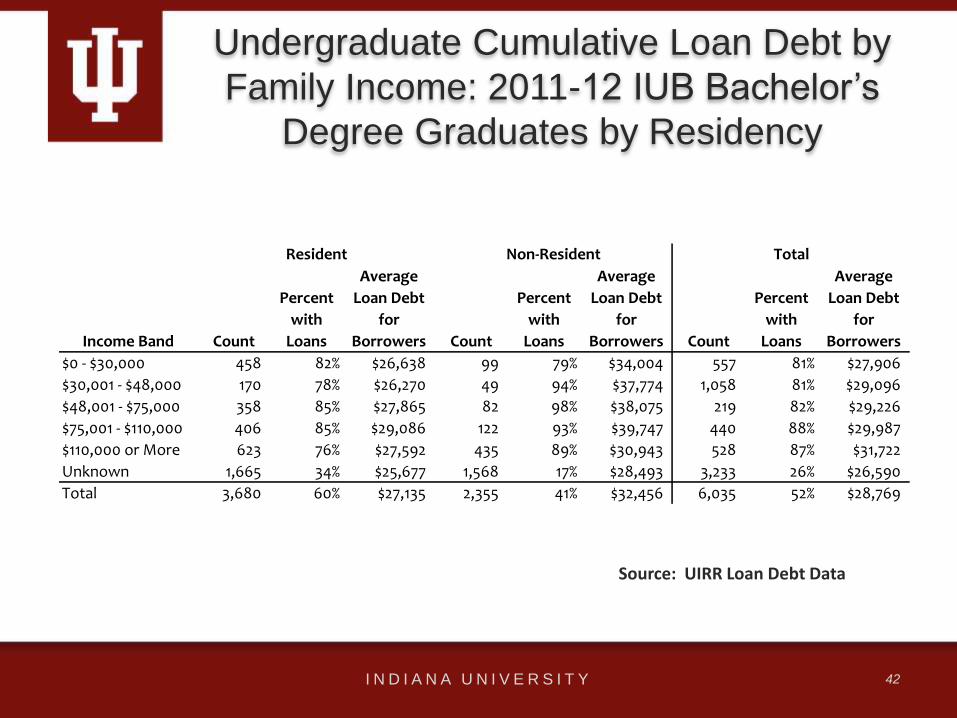
Undergraduate Cumulative Loan Debt by
Family Income: 2011-12 IUB Bachelor’s
Degree Graduates by Residency
I N D I A N A U N I V E R S I T Y 42
Income Band Count
Percent
with
Loans
Average
Loan Debt
for
Borrowers Count
Percent
with
Loans
Average
Loan Debt
for
Borrowers Count
Percent
with
Loans
Average
Loan Debt
for
Borrowers
$0 - $30,000 458 82% $26,638 99 79% $34,004 557 81% $27,906
$30,001 - $48,000 170 78% $26,270 49 94% $37,774 1,058 81% $29,096
$48,001 - $75,000 358 85% $27,865 82 98% $38,075 219 82% $29,226
$75,001 - $110,000 406 85% $29,086 122 93% $39,747 440 88% $29,987
$110,000 or More 623 76% $27,592 435 89% $30,943 528 87% $31,722
Unknown 1,665 34% $25,677 1,568 17% $28,493 3,233 26% $26,590
Total 3,680 60% $27,135 2,355 41% $32,456 6,035 52% $28,769
Resident Non-Resident Total
Source: UIRR Loan Debt Data
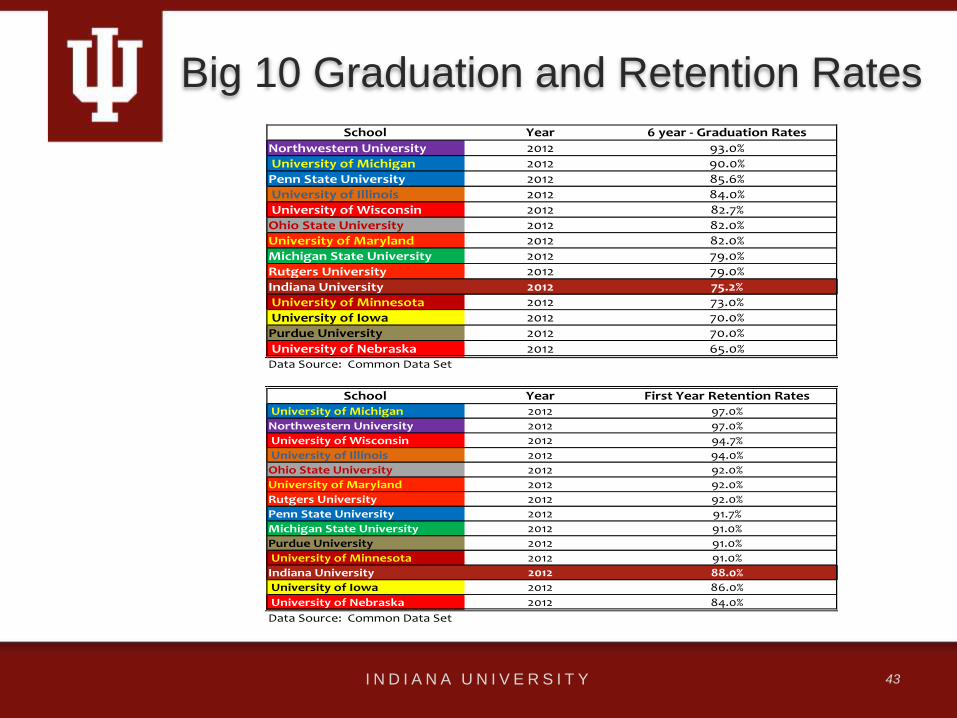
Big 10 Graduation and Retention Rates
I N D I A N A U N I V E R S I T Y 43
School Year 6 year - Graduation Rates
Northwestern University 2012 93.0%
University of Michigan 2012 90.0%
Penn State University 2012 85.6%
University of Illinois 2012 84.0%
University of Wisconsin 2012 82.7%
Ohio State University 2012 82.0%
University of Maryland 2012 82.0%
Michigan State University 2012 79.0%
Rutgers University 2012 79.0%
Indiana University 2012 75.2%
University of Minnesota 2012 73.0%
University of Iowa 2012 70.0%
Purdue University 2012 70.0%
University of Nebraska 2012 65.0%
School Year First Year Retention Rates
University of Michigan 2012 97.0%
Northwestern University 2012 97.0%
University of Wisconsin 2012 94.7%
University of Illinois 2012 94.0%
Ohio State University 2012 92.0%
University of Maryland 2012 92.0%
Rutgers University 2012 92.0%
Penn State University 2012 91.7%
Michigan State University 2012 91.0%
Purdue University 2012 91.0%
University of Minnesota 2012 91.0%
Indiana University 2012 88.0%
University of Iowa 2012 86.0%
University of Nebraska 2012 84.0%
Data Source: Common Data Set
Data Source: Common Data Set
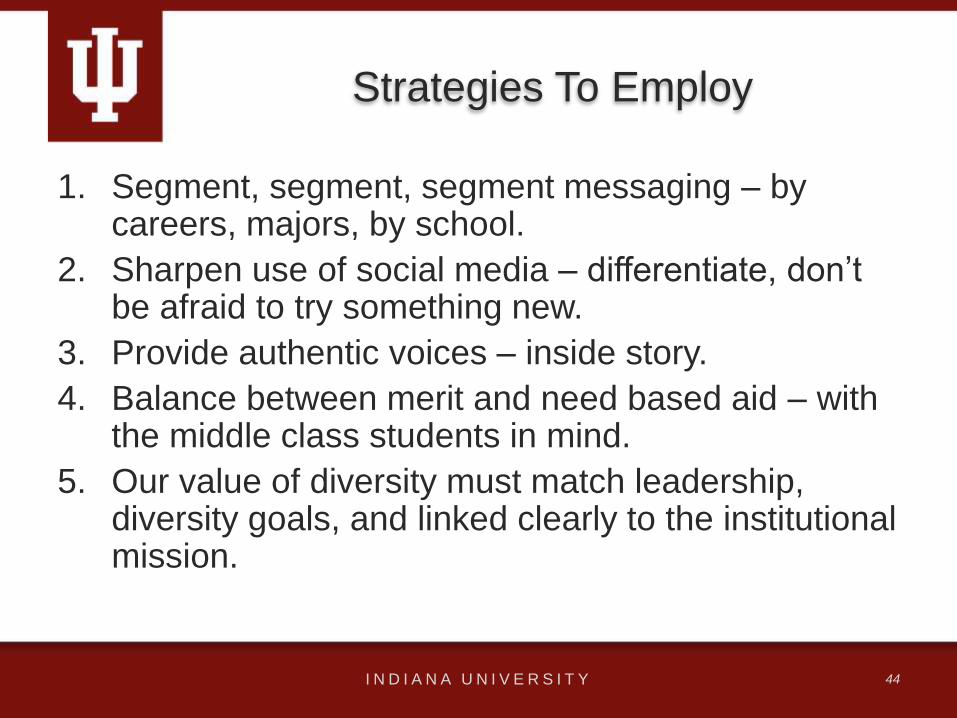
Strategies To Employ
1. Segment, segment, segment messaging – by careers, majors, by school.
2. Sharpen use of social media – differentiate, don’t be afraid to try something new.
3. Provide authentic voices – inside story.
4. Balance between merit and need based aid – with the middle class students in mind.
5. Our value of diversity must match leadership, diversity goals, and linked clearly to the institutional mission.
I N D I A N A U N I V E R S I T Y 44

Career Focused Post Card
I N D I A N A U N I V E R S I T Y 45
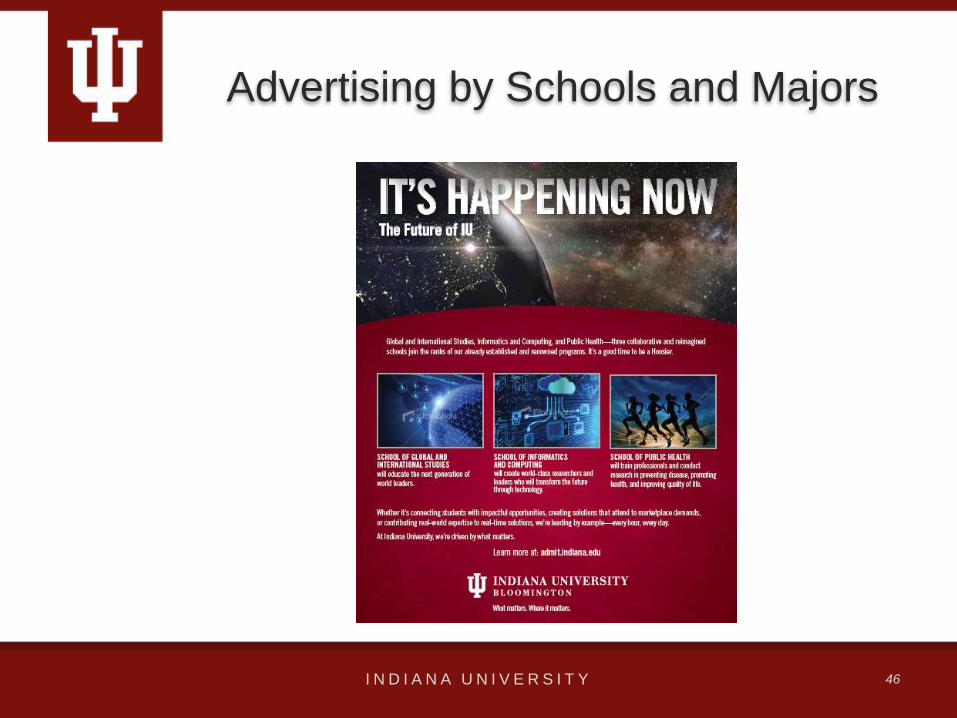
Advertising by Schools and Majors
I N D I A N A U N I V E R S I T Y 46
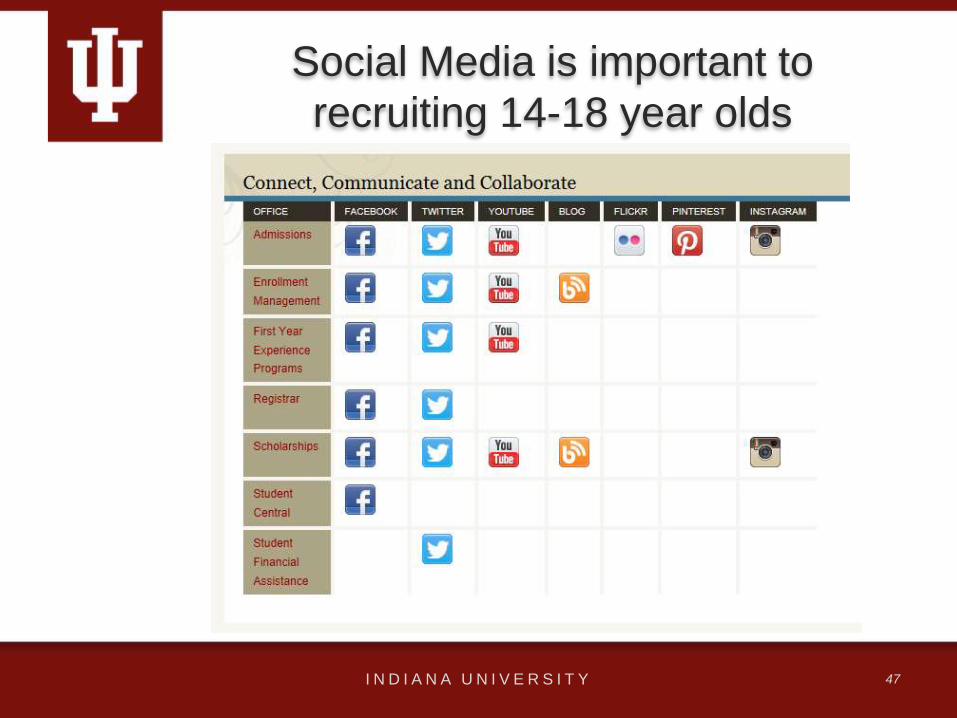
Social Media is important to
recruiting 14-18 year olds
I N D I A N A U N I V E R S I T Y 47

Social Media Research Data
“Teens and Technology 2013”
Internet Access Demographics
– Black, non-Hispanic – 92%
– Hispanic – 88%
– All teen usage – 95%
Mobile Access
– Black, non-Hispanic – 74%
– Hispanic – 63%
– All teen access – 74%
Mobile as Main Access
– Black, non-Hispanic – 33%
– Hispanic – 21%
– All teen access – 25%
One out of three Black, non-Hispanic teens use their mobile device as their main source for the internet
Teens, Social Media, and Privacy”
Social Networking Usage
– Black, non-Hispanic – 88%
– Hispanic – 77%
– All teen usage – 81%
Twitter Usage
– Black, non-Hispanic – 39%
– Hispanic – 19%
– All teen usage – 24%
Black, non-Hispanic teens use social networking sites at a higher % than do other teens.
Source: Pew Research 2013
I N D I A N A U N I V E R S I T Y 48

What is Private Facebook?
Finding people who share interests
• Private Facebook
• Uversity (formerly Inigral) Schools App
• Build Community Where Students
Connect
• Over 4,000 Communities to Choose
I N D I A N A U N I V E R S I T Y 49

IUB Private Facebook Network
I N D I A N A U N I V E R S I T Y 50

Over 19,000 Posts & Comments
I N D I A N A U N I V E R S I T Y 51

Approximately 1/3 of Fall 2013
Depositors Joined
Invited: 26,824
Not Joined: 23,375 (87%)
Joined: 3,449 (13%)
Joined and Paid/Waived: 2,677 (77.6%)
77.6% of the admits who joined the network paid his or her enrollment deposit.
Resident: 1,426 (53.3%)
Non-Resident: 1,251 (46.7%)
I N D I A N A U N I V E R S I T Y 52

Blogs are Stories - Stories are
Content – Inside Story
Compendium Content Marketing Hub
• Plan – Editorial Calendar and Scheduling
• Produce – Capture and Curate Content
• Publish – Push content to multiple platforms
• Prove – Analytic dashboard to assess ROI
I N D I A N A U N I V E R S I T Y 53

WeAreIU.com
I N D I A N A U N I V E R S I T Y 54

WeAreIU.com Blogger Corp
I N D I A N A U N I V E R S I T Y 55
“During high school and my first
year in college, I looked to this blog
to gain insight and excitement over
my career at Indiana University.
Coming from a small town, moving
to a large campus seemed a bit
daunting. However, the monthly
blog posts helped ease me into
college life and calmed any nerves
that I had.”
Caroline Reis – Sophomore
WeAreIU.com Blogger
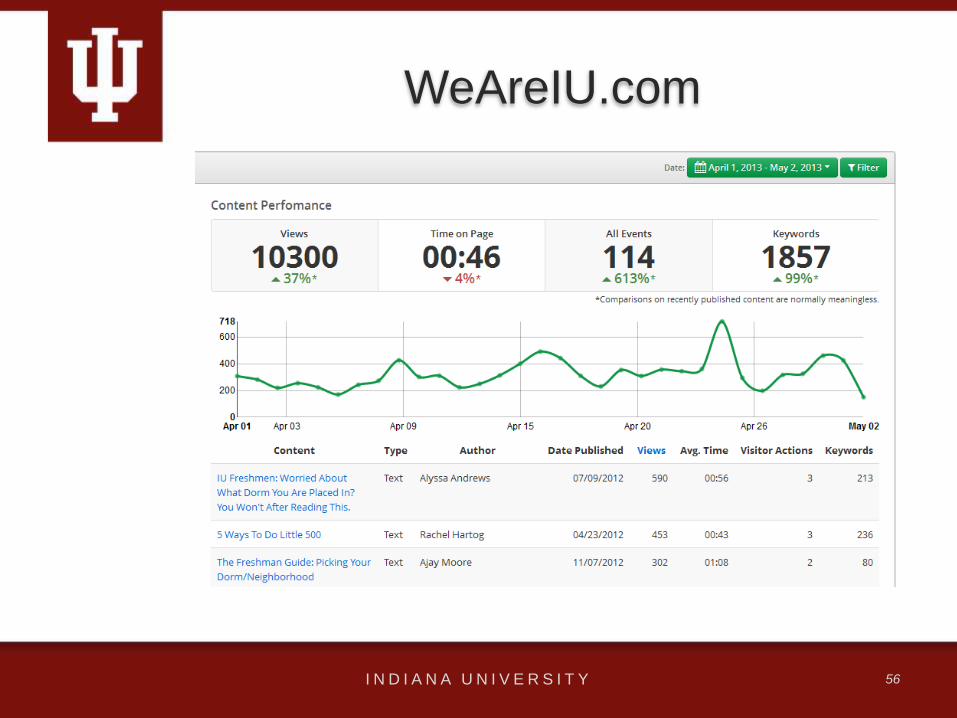
WeAreIU.com
I N D I A N A U N I V E R S I T Y 56

WeAreIU Blog Engagement
I N D I A N A U N I V E R S I T Y 57
New Initiatives
I N D I A N A U N I V E R S I T Y 58

New Initiatives in Progress
• Community Based Organizations – new position
• Neighborhood and high school segment analysis
• Mindset for Success communication to 21st Century Scholar students
and guidance counselors (Based on Hoxby research)
• I’m First Campaign with Center for Student Opportunity
• Pilot Program: Reminder texts to African American students in
process of completing application
• #IUsaidYes
I N D I A N A U N I V E R S I T Y 59
Segment Analysis Services From
The College Board
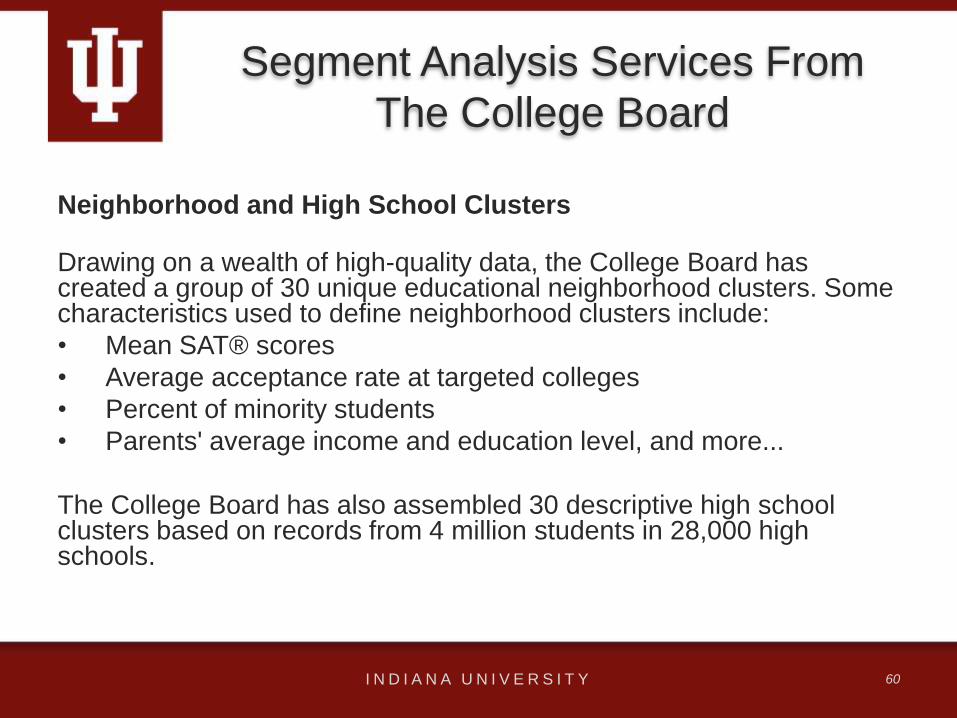
Neighborhood and High School Clusters
Drawing on a wealth of high-quality data, the College Board has created a group of 30 unique educational neighborhood clusters. Some characteristics used to define neighborhood clusters include:
• Mean SAT® scores
• Average acceptance rate at targeted colleges
• Percent of minority students
• Parents' average income and education level, and more...
The College Board has also assembled 30 descriptive high school clusters based on records from 4 million students in 28,000 high schools.
I N D I A N A U N I V E R S I T Y 60

Segment Analysis Screen Shot
I N D I A N A U N I V E R S I T Y 61

Strategic Segment Analysis
STRATEGIC PLANNING and USE
The short term goal is to learn enough about the clusters to use them to impact Yield for Fall 2014.
Other strategic goals associated with the purchase of the product include:
• More accurately targeting our name buys
• Targeting and refining our messaging
• Being more effective and efficient in our existing recruitment markets
• Identifying new markets similar to those areas where we have been successful
I N D I A N A U N I V E R S I T Y 62
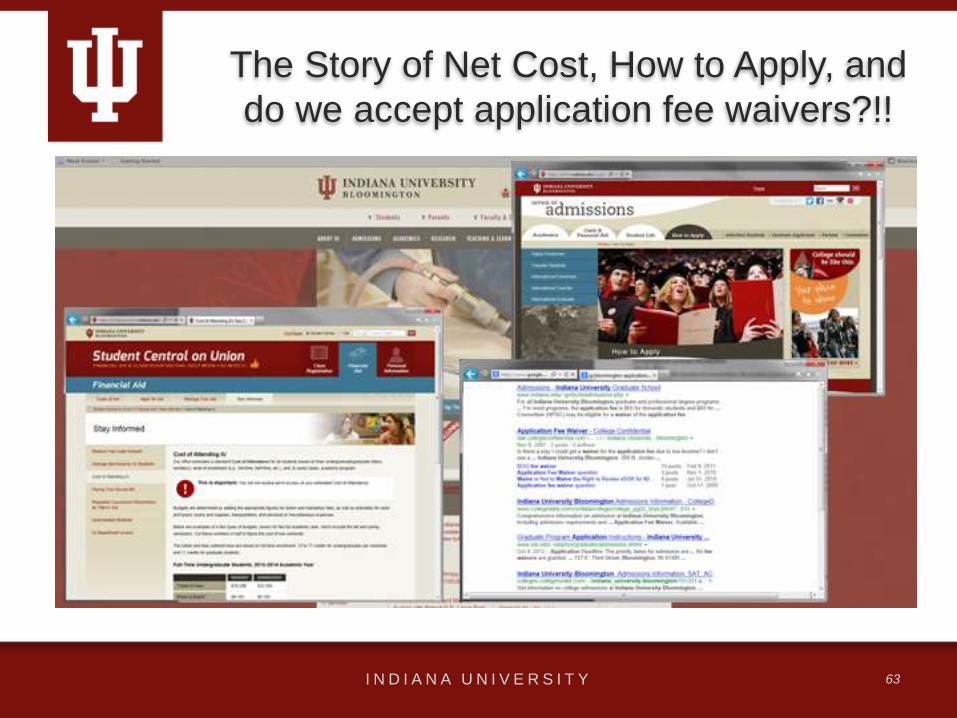
The Story of Net Cost, How to Apply, and
do we accept application fee waivers?!!
I N D I A N A U N I V E R S I T Y 63

Get Your Mind Set For Success
I N D I A N A U N I V E R S I T Y 64
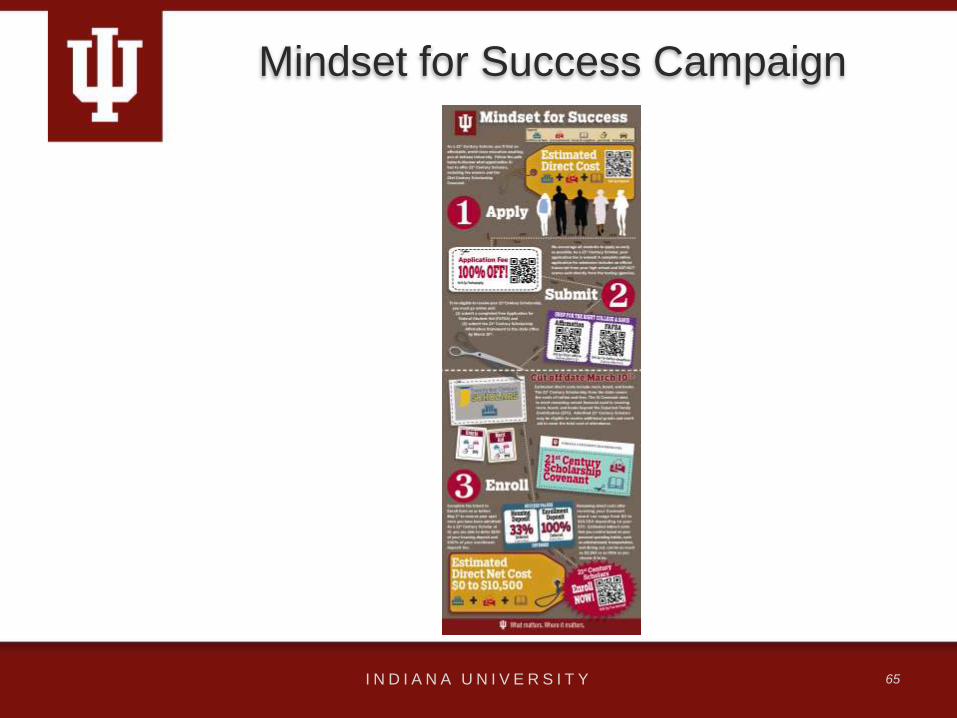
Mindset for Success Campaign
I N D I A N A U N I V E R S I T Y 65
I’m First Website
I N D I A N A U N I V E R S I T Y 66

I’m First Website
I N D I A N A U N I V E R S I T Y 67

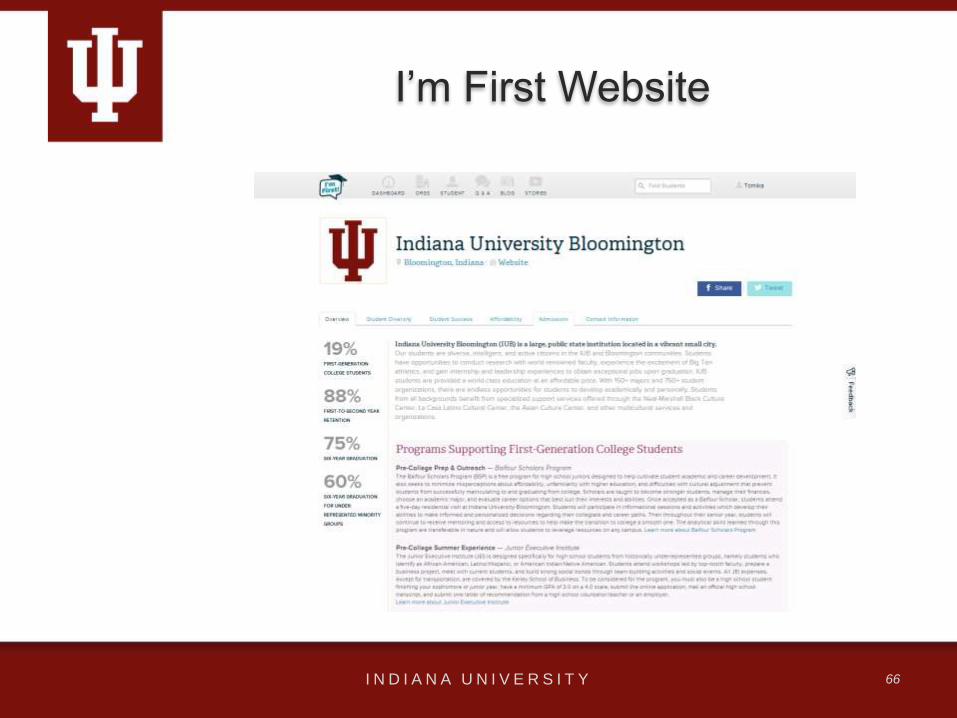
I’m First Website
• The I’m First website hosted by the Center for Student Opportunity, provides
IU with a direct connection with over 2500 community based organizations
(CBOs) across the country who serve a diverse population of middle- and
high-school students who are primarily first-generation college students.
• Through I’m First, IU has the opportunity to communicate with thousands of
first-generation college students who are interested in pursuing a bachelor’s
degree.
• Lastly, I’m First serves as a platform for IU to demonstrate a focused effort
to recruit students from a targeted population by sharing information about
key programs that support students at different phases of the
undergraduate experiences in their nationally recognized guidebook, Guide
to College. This book is in high schools, middle schools, CBOs, and homes
around the country.
I N D I A N A U N I V E R S I T Y 68
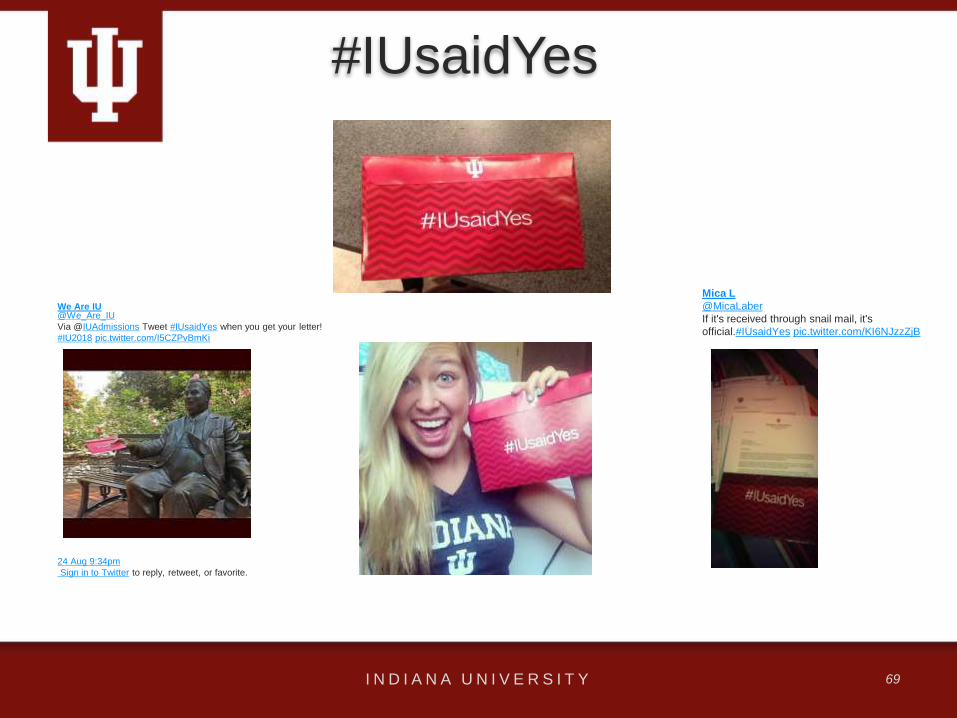
We Are IU @We_Are_IU
Via @IUAdmissions Tweet #IUsaidYes when you get your letter!
#IU2018 pic.twitter.com/I5CZPvBmKi
24 Aug 9:34pm
Sign in to Twitter to reply, retweet, or favorite.
I N D I A N A U N I V E R S I T Y 69
#IUsaidYes
Mica L
@MicaLaber
If it's received through snail mail, it's
official.#IUsaidYes pic.twitter.com/KI6NJzzZjB
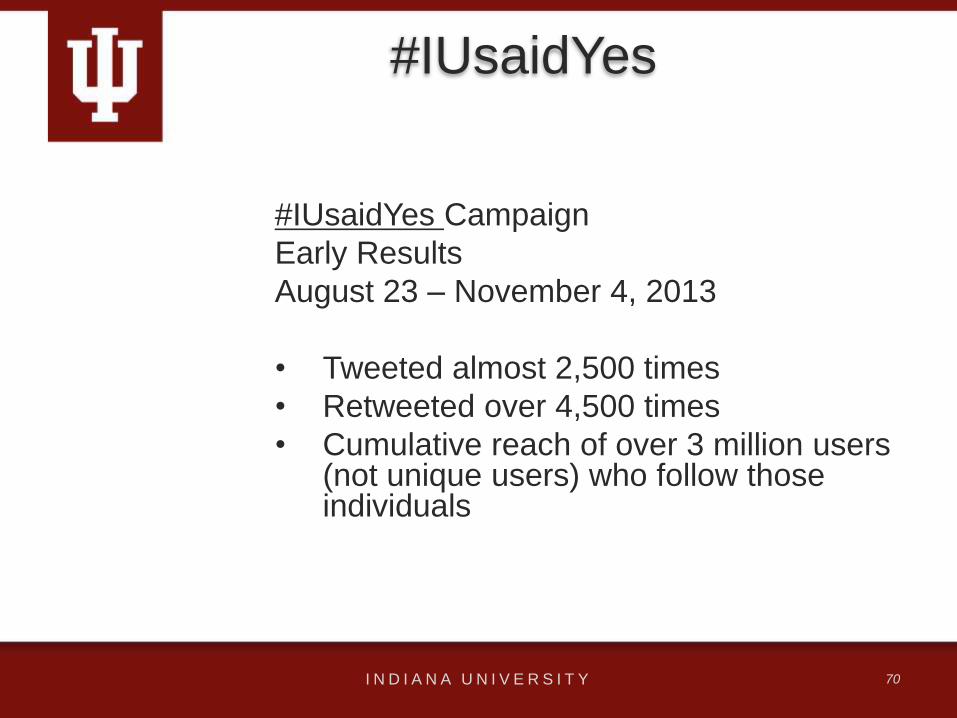
#IUsaidYes
#IUsaidYes Campaign
Early Results
August 23 – November 4, 2013
• Tweeted almost 2,500 times
• Retweeted over 4,500 times
• Cumulative reach of over 3 million users (not unique users) who follow those individuals
I N D I A N A U N I V E R S I T Y 70

OEM Vision and Goals
2013
• Beginner Cohort
• Data Projections
• Recruitment Strategies
2014
• Data Projections
• Challenges for Higher Education
• Strategies to Employ
• New Initiatives
I N D I A N A U N I V E R S I T Y 71

Thanks for popping in!
I N D I A N A U N I V E R S I T Y 72

Dr. David B. Johnson
Vice Provost for Enrollment Management
Student Services Building, Room 215
408 N. Union Street
Indiana University
Bloomington, IN 47405
812-855-8908
I N D I A N A U N I V E R S I T Y 73
Questions/Answers