BLOOMBERG DERIVATIVE INFORMATION AND · PDF fileBLOOMBERG DERIVATIVE INFORMATION AND FUNCTIONS...
63
1 BLOOMBERG DERIVATIVE INFORMATION AND FUNCTIONS E2 SPOT EQUITY OPTIONS To access a listing of current options on a company, you first enter the company‟s ticker followed by the [EQUITY] key. As noted, this will bring up a menu of information and data sources than can be accessed on the selected stock, as well as analytical functions. The menu includes: 1. Today‟s Market‟s – Quotes and Recaps 2. Company Information 3. Historical Prices 4. News 5. Fundamentals and Earning Analysis 6. Option, Warrants, and Convertibles To access options on the stock, you click the “Options, Warrants, & Convertibles‟ selection on the menu (or type in the number 6). This will bring up a menu of option data and analytics that you can access. From this menu, current market information on exchanged-listed options on the selected stock can be accessed by clicking OMON (number 2). For example, to access options on IBM, you would: Enter IBM [EQUITY] Click “Options, Warrants & Convertibles” on the resulting IBM Menu Screen On Options, Warrants & Convertibles Screen, click “OMON” You also can access IBM options information directly by typing IBM [EQUITY] OMON. The OMON screen for IBM is shown in Exhibit E.2-1. Exhibit E.2-1: OMON The exhibit is reprinted with the permission of Bloomberg Inc, via Bloomberg Copyright Clearance Center, 2007. All rights reserved worldwide.
Transcript of BLOOMBERG DERIVATIVE INFORMATION AND · PDF fileBLOOMBERG DERIVATIVE INFORMATION AND FUNCTIONS...
1
BLOOMBERG DERIVATIVE INFORMATION AND FUNCTIONS E2 SPOT EQUITY OPTIONS
To access a listing of current options on a company, you first enter the company‟s ticker
followed by the [EQUITY] key. As noted, this will bring up a menu of information and data
sources than can be accessed on the selected stock, as well as analytical functions. The menu
includes:
1. Today‟s Market‟s – Quotes and Recaps
2. Company Information
3. Historical Prices
4. News
5. Fundamentals and Earning Analysis
6. Option, Warrants, and Convertibles
To access options on the stock, you click the “Options, Warrants, & Convertibles‟
selection on the menu (or type in the number 6). This will bring up a menu of option data and
analytics that you can access. From this menu, current market information on exchanged-listed
options on the selected stock can be accessed by clicking OMON (number 2). For example, to
access options on IBM, you would:
Enter IBM [EQUITY]
Click “Options, Warrants & Convertibles” on the resulting IBM Menu Screen
On Options, Warrants & Convertibles Screen, click “OMON”
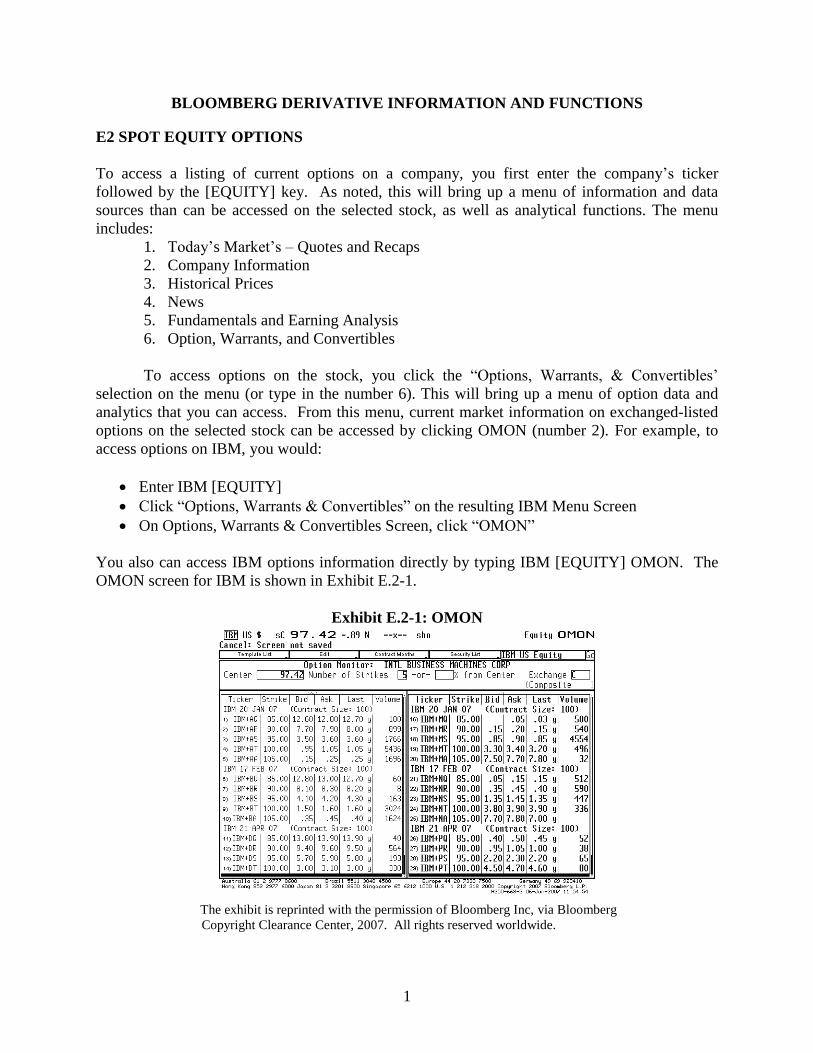
You also can access IBM options information directly by typing IBM [EQUITY] OMON. The
OMON screen for IBM is shown in Exhibit E.2-1.
Exhibit E.2-1: OMON
The exhibit is reprinted with the permission of Bloomberg Inc, via Bloomberg
Copyright Clearance Center, 2007. All rights reserved worldwide.
2
The Bloomberg OMON Screen for IBM options shows the call and put options traded on
IBM stock at the time the option is accessed, along with price and volume information on the
stock. The screen in Exhibit E.2-1 was accessed on January 6, 2007. It shows IBM trading at
97.42, along with price and volume information on IBM call and put options broken down into
five exercise prices and three expiration months. For example, line 8 shows the IBM call with an
exercise price of 95 and expiration of February 7, 2007 trading a 4.10 (bid) and 4.20 (ask), and
line 23 shows the IBM January 95 put trading at 1.35 (bid) and 1.45 (ask). The OMON Screen,
in turn, can be customized to show other descriptive information about the option. For example,
more options can be accessed by changing the number of strikes and the contract months (top
box in the middle). IBM options can also be selected based on exchange listings by using the
exchange key (top right).
A number of functions can be applied to all of the listed stock options. To access a
function, you type in the function‟s identifier on the OMON Screen (many of these functions are
discussed in this appendix). For example, to analyze one or more of the IBM options in terms of
profit tables and graphs, you type in OSA. This brings up the OSA Screen for IBM options
where you can generate profit tables and graphs for selected portfolio positions formed with IBM
stock and the options traded on it.
To obtain information on a specific option shown on the OMON Screen, you set your
cursor on the option of interest and left click. This will bring up the following menu of
information and analytics that you can access or apply to that option:
DES gives a description of the option
QRM gives a trade recap
TSM gives a trade matrix
GIP is an intraday price graph
GPO gives a bar chart
OV is the option valuation screen
OVX is exotic option valuation screen
In evaluating options, two useful Bloomberg functions are the OSA function for evaluating
option strategies and the OV function for valuing a specific option using an option pricing
model.
OSA – Generating Profit Tables
As noted, the OSA function allows you to evaluate an option portfolio formed with the options
and it underlying stock. To access: enter Company‟s Ticker [EQUITY]; on the Company menu
screen, click “Options, Warrants, & Convertible; on the Options, Warrants, & Convertible
Screen, click OSA (23)). The OSA function for a stock can also be accessed directly by simply
entering “Company‟s Ticker [EQUITY] OSA. For example, to access IBM‟s OSA Screen: Enter
IBM [EQUITY] OSA. The OSA Screen for the IBM options (Exhibit E.2-1) is shown in Exhibit
E.2-2.
3
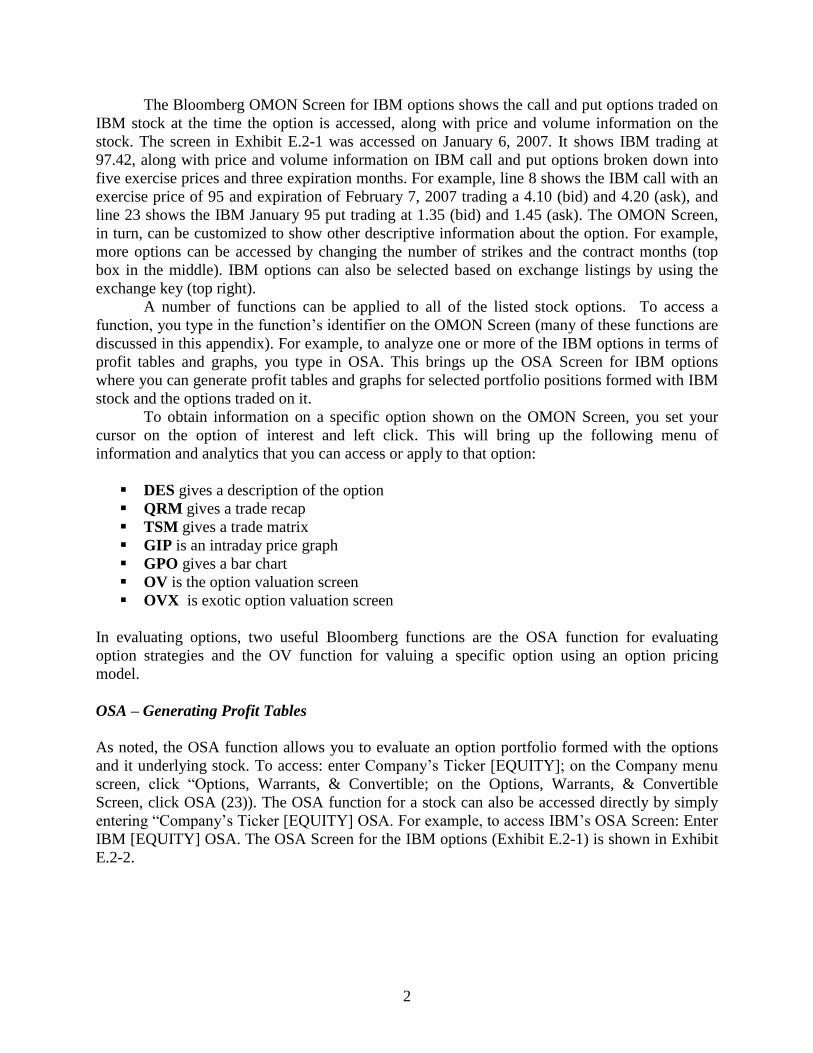
Exhibit E.2-2: OSA Screen Exhibit E.2-3: OSA Screen: Option Inputs
The exhibits are reprinted with the permission of Bloomberg Inc, via Bloomberg
Copyright Clearance Center, 2007. All rights reserved worldwide.
The OSA Screen in Exhibit E.2-2 shows IBM stock trading at 97.42. In constructing
option portfolios on this screen, you can include the stock in your portfolio by inputting the
number of shares in the position box (e.g., 100 shares (long) or -100 shares (short). To include
options on the stock, you click the “Add Options” key (top left corner). This brings up the OSA
Screen for inputting currently traded options (see Exhibit E.2-3). On the OSA Screen for
inputting option positions, you first need to select the option selection months (“Contract
Month”). This will bring up a screen with all options with those selected expirations and
exercises prices. You can then input the number of puts options and call options in the position
column (“Pos.”). The cost of the option will default to the current option price. You can keep
this price or input your own. In the OSA Screen shown in Exhibit E.2-3, 100 IBM calls with an
exercise price of 95 and expiration of 4/2007 purchased as the ask price of 5.90 and 100 IBM
puts with an exercise price of 95 purchased at the ask price of 2.30 were selected. Typing 1 and
pressing <go> takes you back to the portfolio screen where you can now see the loaded portfolio
position.
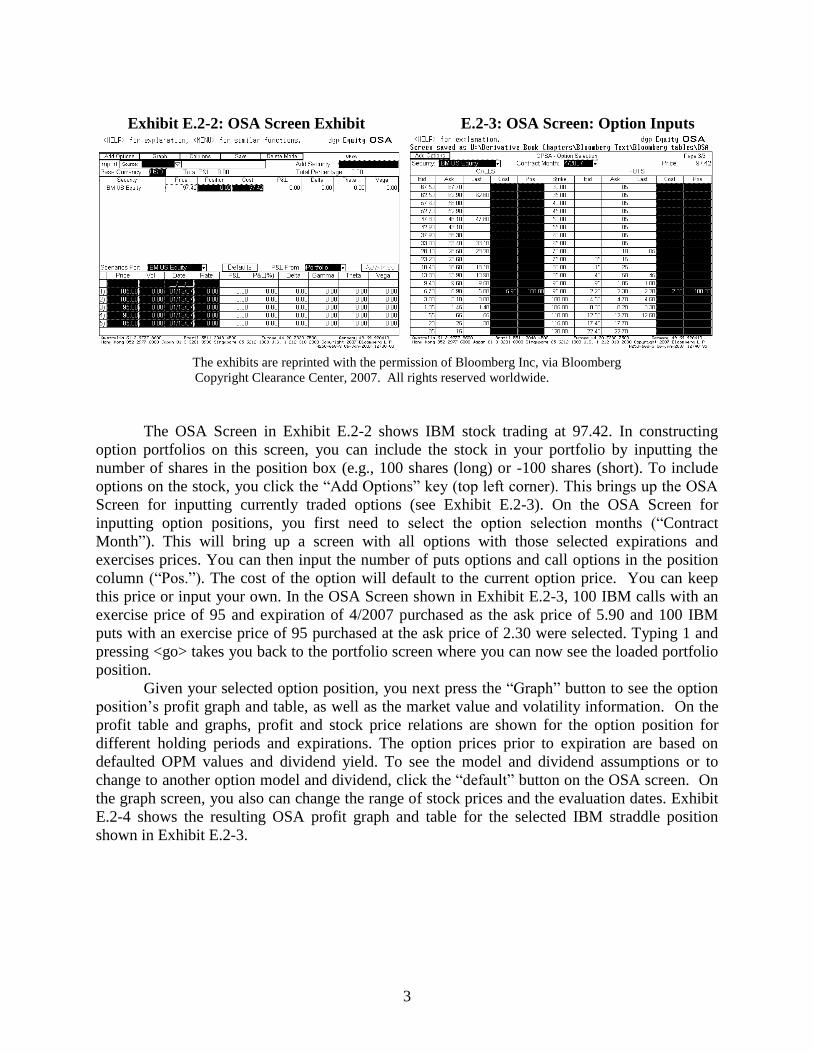
Given your selected option position, you next press the “Graph” button to see the option
position‟s profit graph and table, as well as the market value and volatility information. On the
profit table and graphs, profit and stock price relations are shown for the option position for
different holding periods and expirations. The option prices prior to expiration are based on
defaulted OPM values and dividend yield. To see the model and dividend assumptions or to
change to another option model and dividend, click the “default” button on the OSA screen. On
the graph screen, you also can change the range of stock prices and the evaluation dates. Exhibit
E.2-4 shows the resulting OSA profit graph and table for the selected IBM straddle position
shown in Exhibit E.2-3.
4
Exhibit E.2-4: OSA Option Profit Graph and Table
The exhibits are reprinted with the permission of Bloomberg Inc, via Bloomberg
Copyright Clearance Center, 2007. All rights reserved worldwide.
It should be noted that in using the OSA function to evaluate option positions (or any
other Bloomberg function), you can always press the „Help‟ key on the Bloomberg keypad to
obtain more information, instructions, and other uses of the function. Also, it should be noted
that once you have loaded an option or any security, you can apply the other functions by simply
typing in the name of the function. For example, to obtain a description of the option, you can
type DES at the top left side of the screen. Alternatively, to access other functions, you can hit
the menu key to return to the menu function screen.
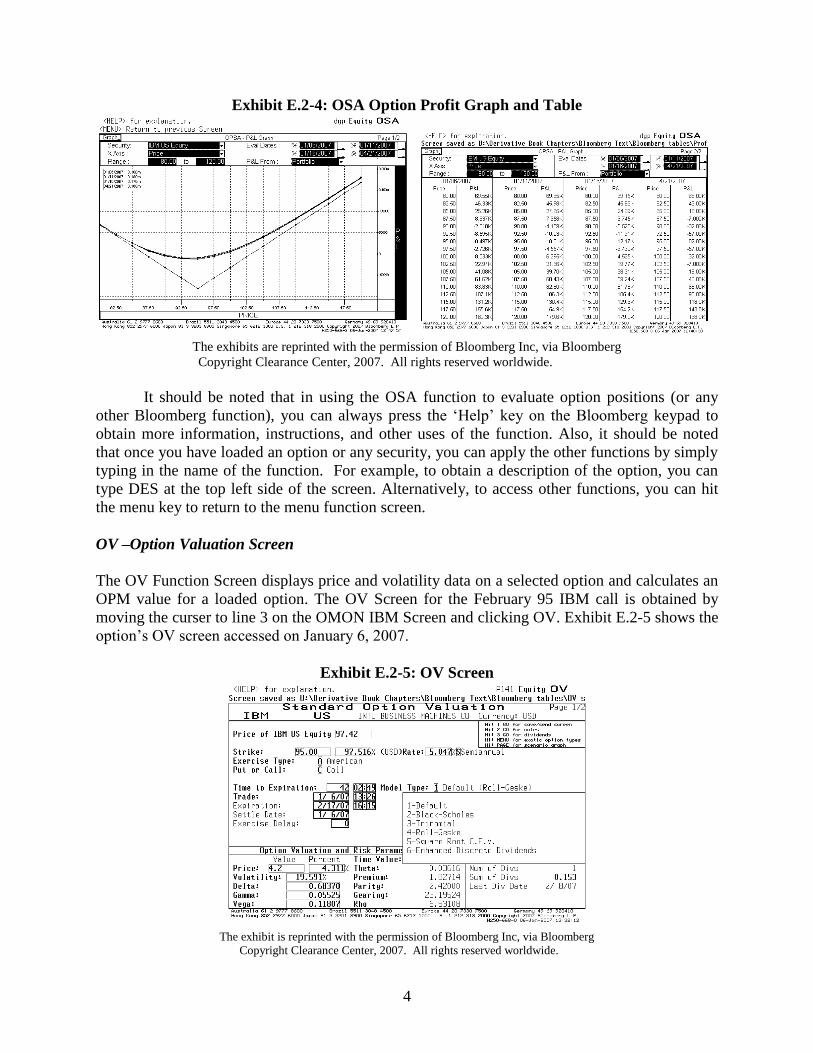
OV –Option Valuation Screen
The OV Function Screen displays price and volatility data on a selected option and calculates an
OPM value for a loaded option. The OV Screen for the February 95 IBM call is obtained by
moving the curser to line 3 on the OMON IBM Screen and clicking OV. Exhibit E.2-5 shows the
option‟s OV screen accessed on January 6, 2007.
Exhibit E.2-5: OV Screen
The exhibit is reprinted with the permission of Bloomberg Inc, via Bloomberg
Copyright Clearance Center, 2007. All rights reserved worldwide.
5
The OV Screen in the exhibit shows the OPM value (“Price”), volatility, and Greeks (bottom
left). In the case of the February 95 call option on IBM, the OPM value is 4.2 and the volatility is
19.591%. The OPM value is based on the Roll-Geske option pricing model with defaulted future
dividend payments and projected ex-dividend dates (lower right box) incorporated into the
valuation.
On this screen, you can determine options values and other features (such as the Greeks),
given different selected inputs. The following are some of the key features and functions
available on the OV Screen:
Choice of Option Model:
o Black-Scholes Model: For European options on stocks with continuously
compounded dividends.
o Trinomial Model: for European and American options; uses continuous dividend
yield and discrete dividend payments. Bloomberg‟s Trinomial model is good
estimate of the binomial model; Bloomberg‟s Trinomial provides a good estimate
of Known Dividend-Payment Binomial Model.
o Roll-Geske Model: For American and European options with discrete dividends;
Roll-Geske is a good estimate of the Known Dividend-Payment Binomial Model.
o Square Root Constant Elasticity of Variance (CEV) Model: For European
options.
o Enhanced Discrete Dividends: A trinomial model for discrete dividends.
To select option model, you click the box to the right of “Model Type.”
Choice of Dividend: On the OV Screen there is a menu of dividend information and
defaults from which you can choose or change. To view the dividend information and
defaults, you type 3 and then hit <go>. This will bring up a dividend information and
menu screen. On this screen, you can select (depending on the model) either dividend
yield (B-S or Trinomial) or discrete dividends (Trinomial).
Choice of Volatility: On the OV Screen, the user has the choice select the volatility and
interest rate. The volatility on the OV Screen is the annualized standard deviation of the
daily logarithmic price return expressed as a percentage. The default volatility is the
historical volatility of stock‟s logarithmic return. On Bloomberg Screens, you can change
any value shown with an amber background.
Choice of Graphs: On page 2 of the OV Screen are customizable graphs showing the
option‟s price plotted against the underlying price of the stock at different evaluation
dates, and information on the underlying stock‟s volatility (e.g., volatility smiles).
Different graphs and price relations can be generated by accessing the options appearing
on page 2.
Example: Black-Scholes Model Using the OV Screen: To determine the B-S OPM value on the
IBM call on the OV Screen (Exhibit E.2-5):
Click “2” on the pull-down menu for “Model Type‟ and then hit <go>.
6
Type the number 3 to access the dividend menu (top left corner of the screen). You have
the choice to select a different dividend model projection on IBM or enter your own
estimate. In this example, suppose you inputted an annual dividend yield of 2% in the
amber dividend yield box.
Press <Menu> to return to the OV Screen.
On the OV screen, you can change the volatility or risk-free rate (amber boxes). In this
example, suppose you had changed the volatility to 22%.
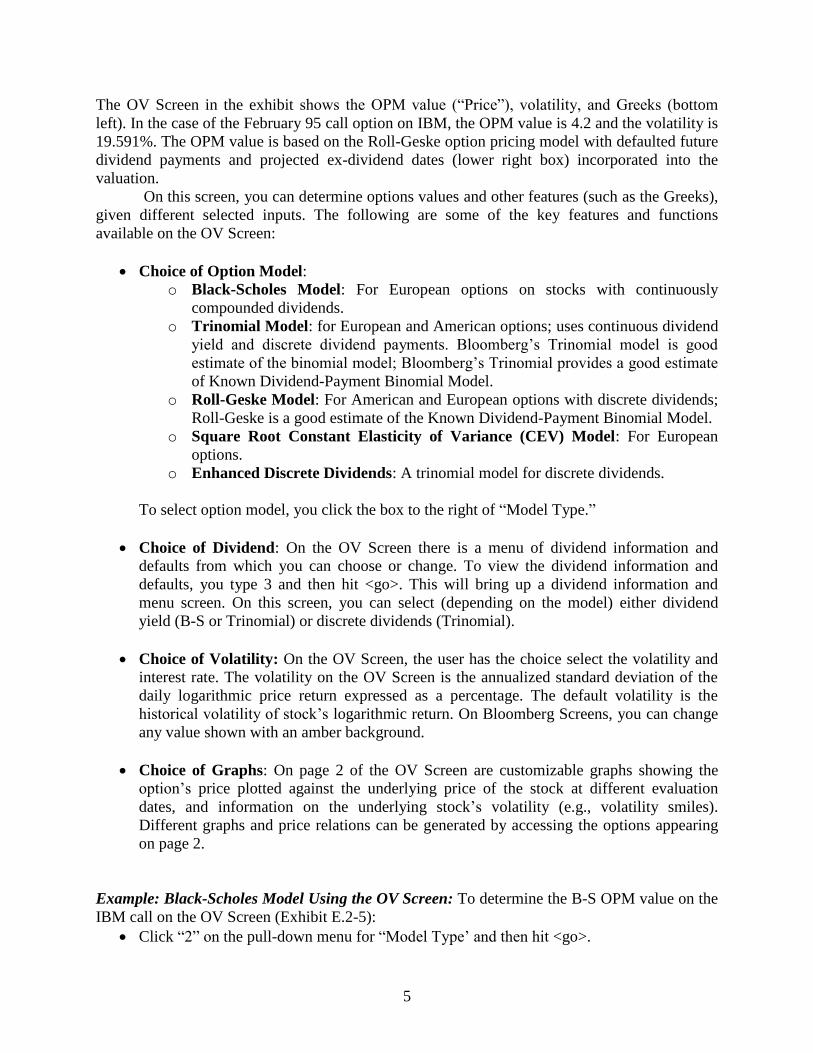
Exhibit E.2-6 shows the resulting Bloomberg screen for the B-S OPM value on the February 95
IBM call with a volatility of 22% and dividend yield of 2%. As shown, the B-S price is 4.43. The
screen also shows the Greek values, and on page 2, the screen (not shown here) shows B-S OPM
values for different evaluation dates.
Exhibit E.2-6: OV Screen Using B-S OPM
The exhibit is reprinted with the permission of Bloomberg Inc, via Bloomberg
Copyright Clearance Center, 2007. All rights reserved worldwide.
Example: Binomial (Trinomial) Model Using the OV Screen: To determine the binomial OPM
value on the IBM call:
Click “Trinomial” from the pull-down menu on “Model Type” and then hit <go>.
Type the number 3 to access the dividend menu. Here you have the choice of using the
dividend yield (Choice 1) or discrete dividends (Choice 2). To use the discrete
dividend, you select 2 in the “use box”. A projected dividend stream is displayed with
the dividend shown for each ex-dividend date for IBM. The relevant ex-dividend dates
for the option are shown in amber and can be changed. For the February IBM option
(accessed on January 6, 2007), there was only one projected ex-dividend date (2/8/07).
The projected dividend on that date was $0.153. You can change the dividend. For this
example, suppose you had changed the dividend to $0.25.
Press the menu key to return to the OV screen.

7
On the new OV screen, you can change the volatility or risk-free rate (amber boxes). In
this example, suppose you had changed the volatility to 22%.
As shown in Exhibit E.2-7, the Trinomial/binomial value of the February 95 IBM call (on
January 5, 2007) is 4.456205. The screen also shows the Greek values and the information on the
discrete dividends; the screen on the right, in turn, shows the projected dividend stream for IBM
that was accessed for a longer-term IBM option.
Exhibit E.2-7: OV Screen Using Binomial/Trinomial OPM
The exhibits are reprinted with the permission of Bloomberg Inc, via Bloomberg
Copyright Clearance Center, 2007. All rights reserved worldwide.
Other OV Functions
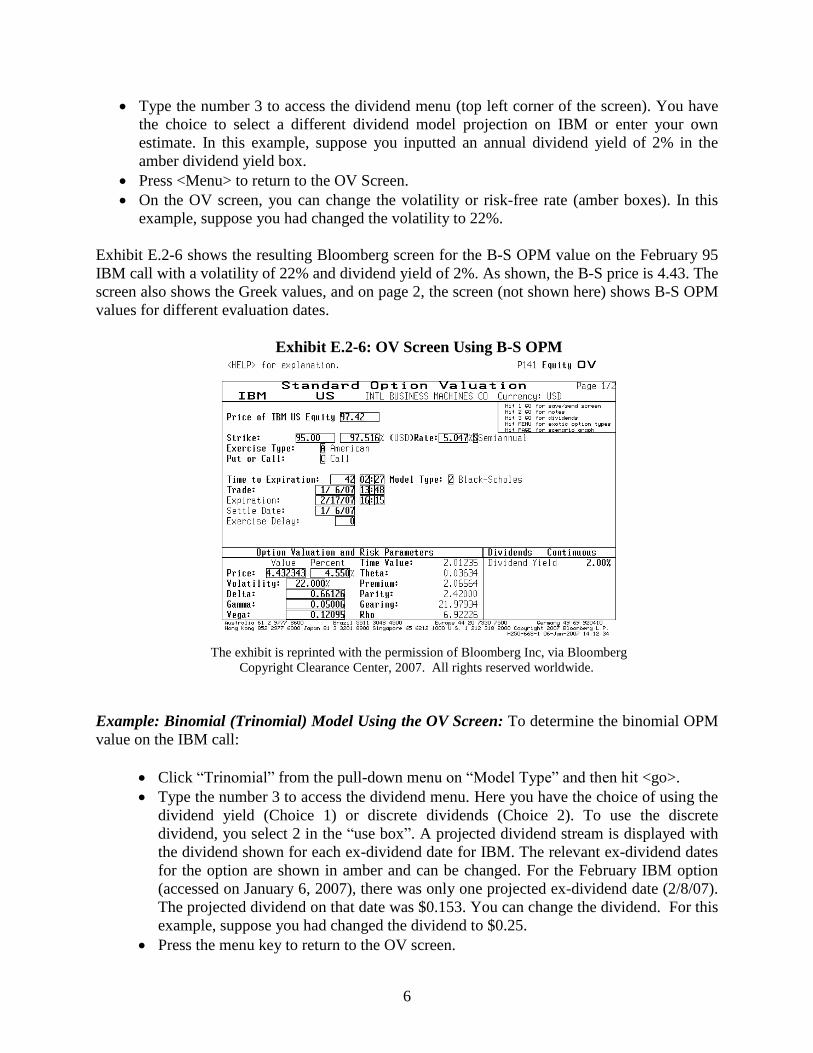
On the graph page (page 2 of the OV Screen), you can change the Y-axis to view different
“Greek” values for either different underlying security prices or for different volatility changes.
Exhibit E.2-8 shows a call price graph (IBM B-S call values for different IBM stock prices), a
gamma graph (gamma values for different stock prices), and price and volatility graph (B-S call
values for different volatilities). The Bloomberg values are obtained using the B-S program with
the Bloomberg default values for volatility and dividend yield.
Exhibit E.2-8: OV Screen Graphs
B-S OPM Call Price, Gamma, and Price and Volatility Graphs
8
The exhibits are reprinted with the permission of Bloomberg Inc, via Bloomberg
Copyright Clearance Center, 2007. All rights reserved worldwide.
Other Equity Option Functions
In addition to the OSA and OV functions, a number of other derivative functions can be accessed
either from the “Options, Warrants, and Convertible Screen” or if the stock or option is already
loaded by typing in the function‟s name, and if it is not loaded, by entering: “Company Ticker
[EQUITY] “Function Identifier” (e.g., IBM [EQUITY] OSA)). The lists below provide
descriptions and the related screens for IBM options on January 11, 2007 on some of the popular
Bloomberg stock option functions. It is worth noting again, that once you have accessed the
function, you can always press the green “Help” key to obtain information on the function. Also
note that many of the function screens allow you to access the defaulted values for viewing and
changing.
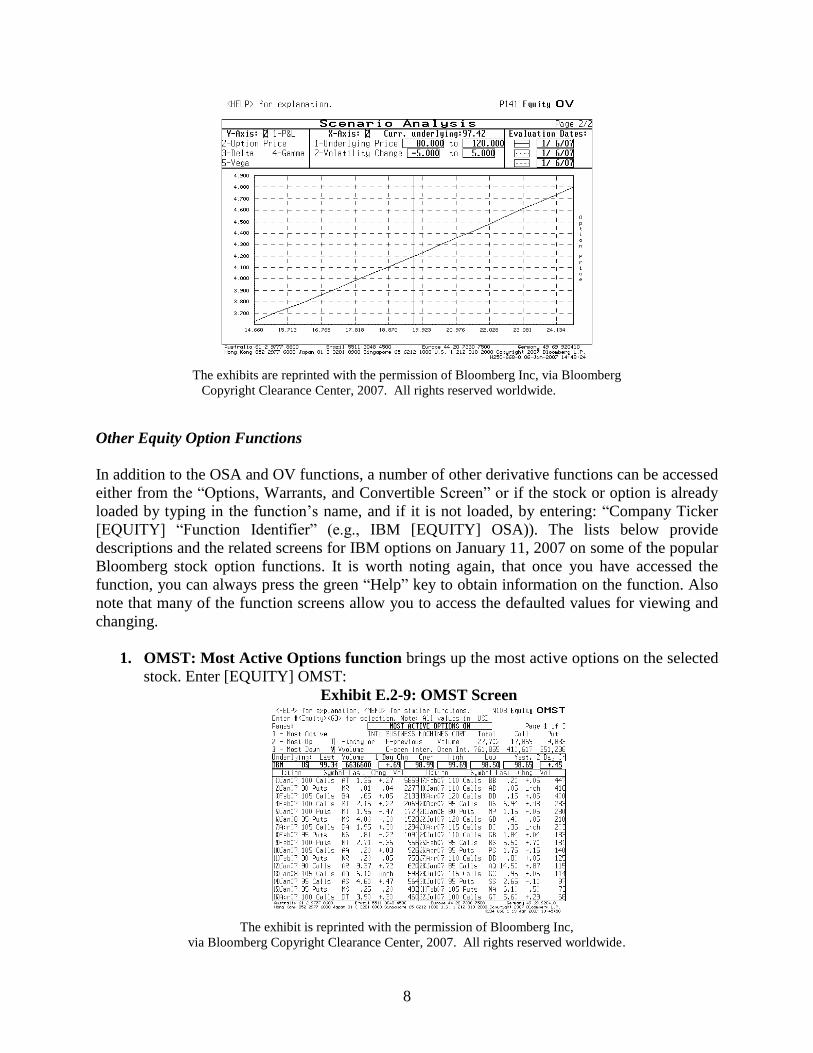
1. OMST: Most Active Options function brings up the most active options on the selected
stock. Enter [EQUITY] OMST:
Exhibit E.2-9: OMST Screen
The exhibit is reprinted with the permission of Bloomberg Inc,
via Bloomberg Copyright Clearance Center, 2007. All rights reserved worldwide.
9
2. OHT: Option Horizon Analysis function allows the user to estimate the future prices of
options for different period, security prices and volatilities. Enter IBM [EQUITY] OHT:
Exhibit E.2-10: OHT Screen
The exhibit is reprinted with the permission of Bloomberg Inc,
via Bloomberg Copyright Clearance Center, 2007. All rights reserved worldwide.
3. OPSA: Option Portfolio Scenario Analysis provides a tool for option analysis. This
function screen provides the same screen and functions as OSA. To access, enter IBM
[EQUITY] OPSA.
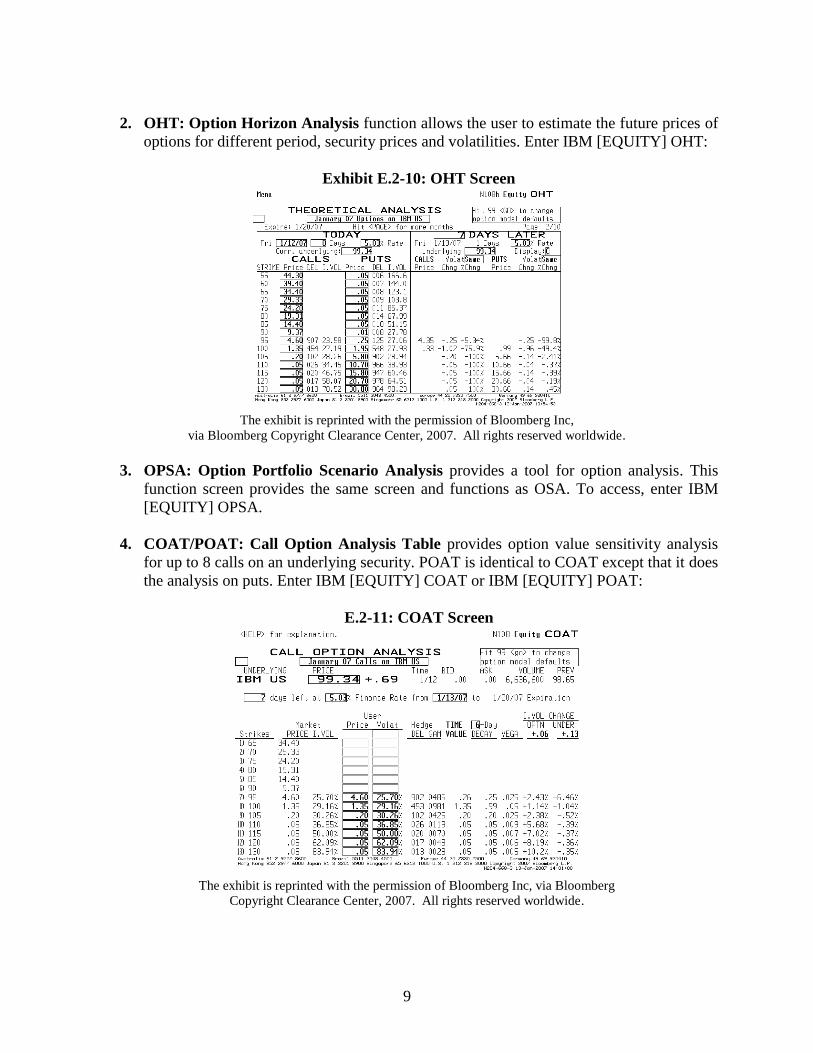
4. COAT/POAT: Call Option Analysis Table provides option value sensitivity analysis
for up to 8 calls on an underlying security. POAT is identical to COAT except that it does
the analysis on puts. Enter IBM [EQUITY] COAT or IBM [EQUITY] POAT:
E.2-11: COAT Screen
The exhibit is reprinted with the permission of Bloomberg Inc, via Bloomberg
Copyright Clearance Center, 2007. All rights reserved worldwide.

10
5. OVX – Exotic Option Valuation. This screen displays the different exotic option types
in which Bloomberg has functions for valuation. Each function works similar to the OV
screen. To get to the OVX screen, you must first load the underlying equity. Once the
security is loaded. OVX defaults to the OV screen. The following exhibits show the OVX
Screen and the Chooser Option Valuation Screen for IBM. Enter IBM [EQUITY] OVX:
Exhibit E.2-12: OVX Screen
The exhibit is reprinted with the permission of Bloomberg Inc,
via Bloomberg Copyright Clearance Center, 2007. All rights reserved worldwide.
11
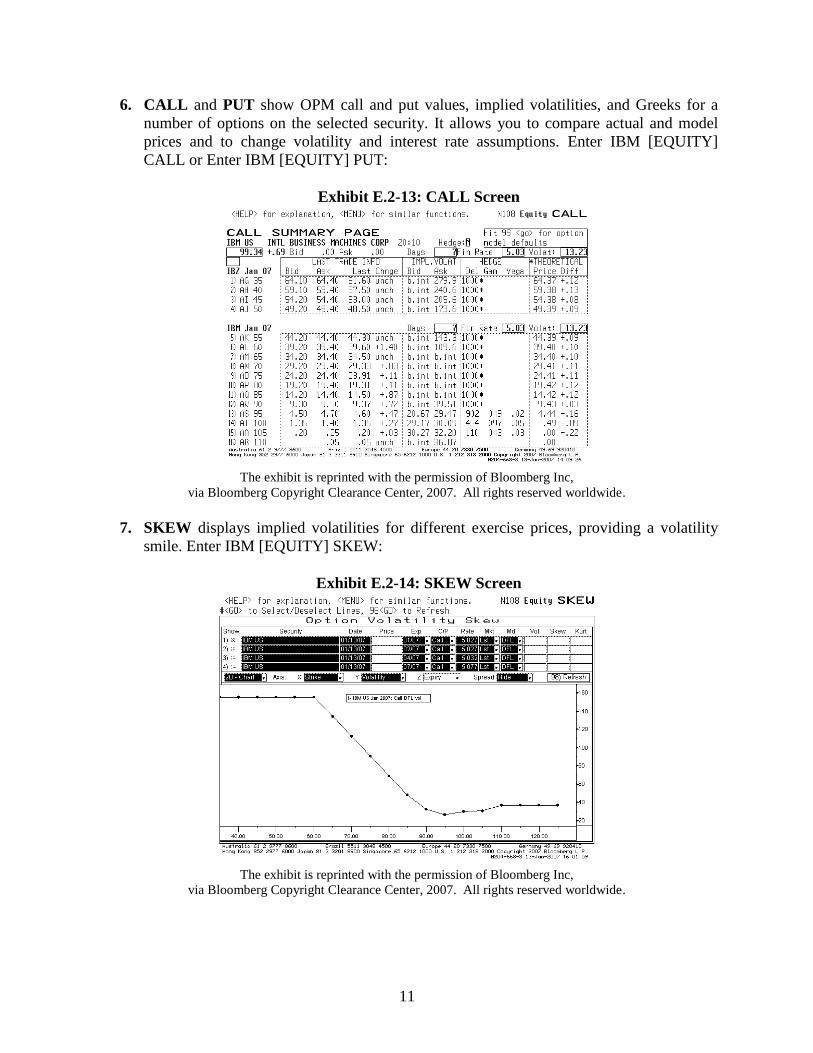
6. CALL and PUT show OPM call and put values, implied volatilities, and Greeks for a
number of options on the selected security. It allows you to compare actual and model
prices and to change volatility and interest rate assumptions. Enter IBM [EQUITY]
CALL or Enter IBM [EQUITY] PUT:
Exhibit E.2-13: CALL Screen
The exhibit is reprinted with the permission of Bloomberg Inc,
via Bloomberg Copyright Clearance Center, 2007. All rights reserved worldwide.
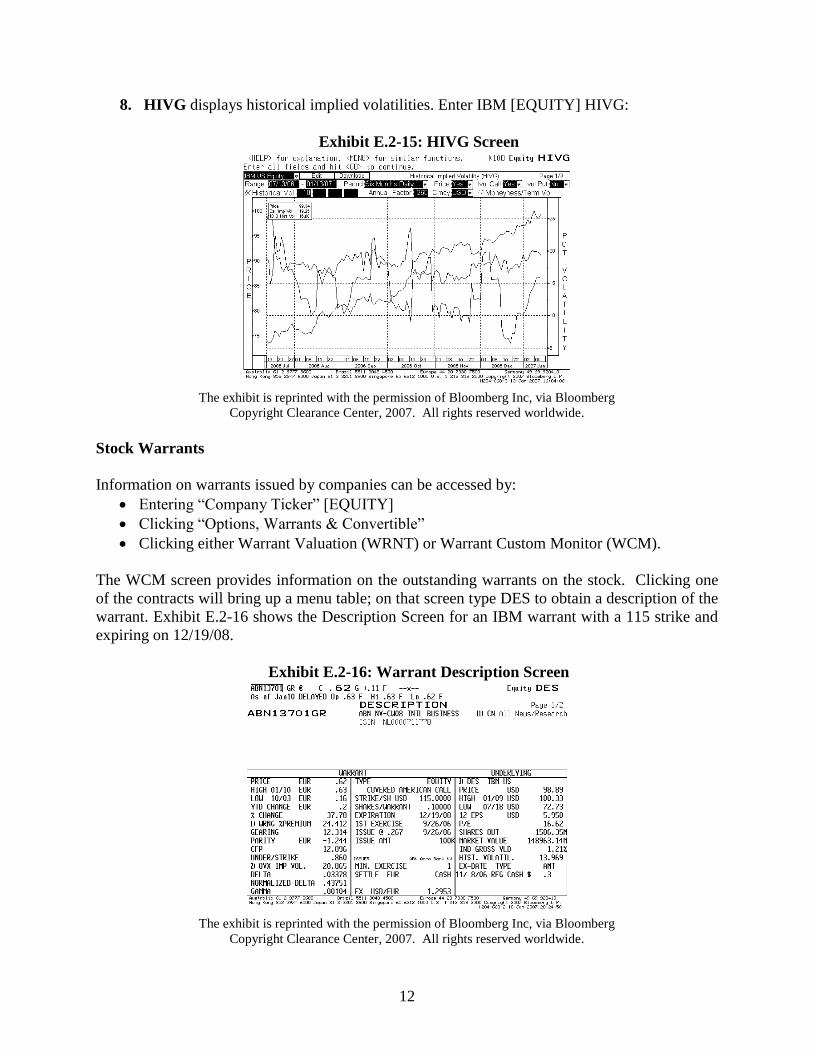
7. SKEW displays implied volatilities for different exercise prices, providing a volatility
smile. Enter IBM [EQUITY] SKEW:
Exhibit E.2-14: SKEW Screen
The exhibit is reprinted with the permission of Bloomberg Inc,
via Bloomberg Copyright Clearance Center, 2007. All rights reserved worldwide.
12
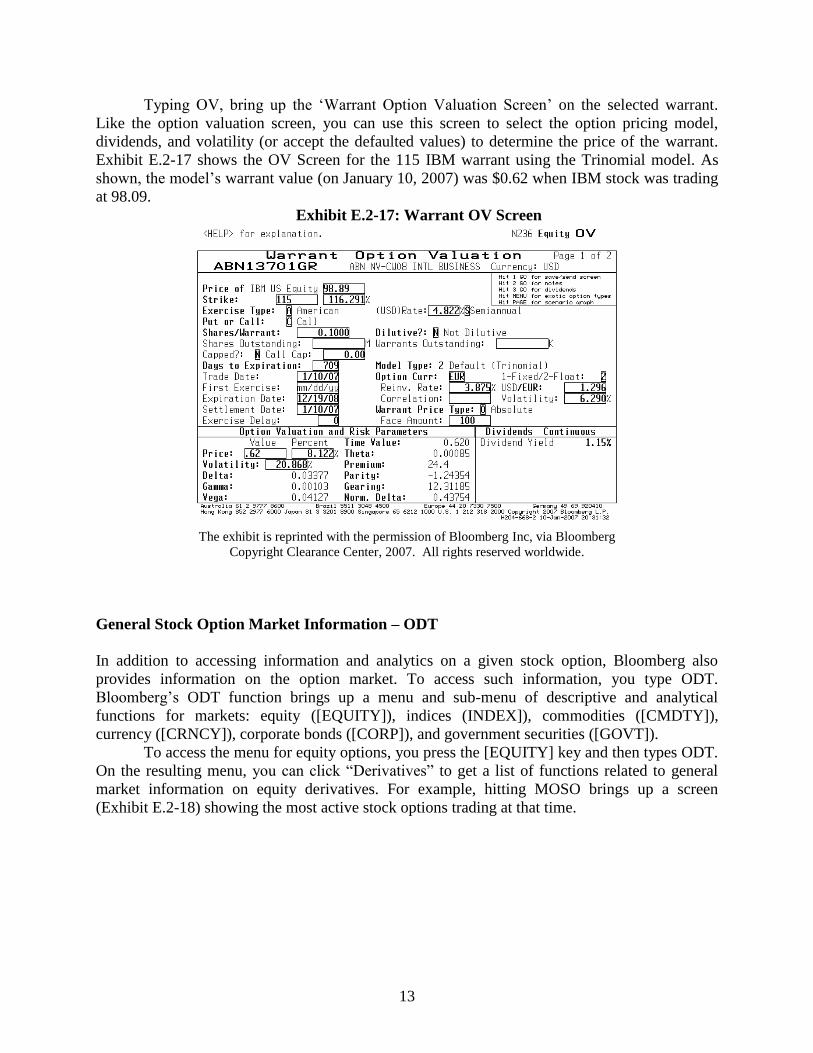
8. HIVG displays historical implied volatilities. Enter IBM [EQUITY] HIVG:
Exhibit E.2-15: HIVG Screen
The exhibit is reprinted with the permission of Bloomberg Inc, via Bloomberg
Copyright Clearance Center, 2007. All rights reserved worldwide.
Stock Warrants
Information on warrants issued by companies can be accessed by:
Entering “Company Ticker” [EQUITY]
Clicking “Options, Warrants & Convertible”
Clicking either Warrant Valuation (WRNT) or Warrant Custom Monitor (WCM).
The WCM screen provides information on the outstanding warrants on the stock. Clicking one
of the contracts will bring up a menu table; on that screen type DES to obtain a description of the
warrant. Exhibit E.2-16 shows the Description Screen for an IBM warrant with a 115 strike and
expiring on 12/19/08.
Exhibit E.2-16: Warrant Description Screen
The exhibit is reprinted with the permission of Bloomberg Inc, via Bloomberg
Copyright Clearance Center, 2007. All rights reserved worldwide.
13
Typing OV, bring up the „Warrant Option Valuation Screen‟ on the selected warrant.
Like the option valuation screen, you can use this screen to select the option pricing model,
dividends, and volatility (or accept the defaulted values) to determine the price of the warrant.
Exhibit E.2-17 shows the OV Screen for the 115 IBM warrant using the Trinomial model. As
shown, the model‟s warrant value (on January 10, 2007) was $0.62 when IBM stock was trading
at 98.09.
Exhibit E.2-17: Warrant OV Screen
The exhibit is reprinted with the permission of Bloomberg Inc, via Bloomberg
Copyright Clearance Center, 2007. All rights reserved worldwide.
General Stock Option Market Information – ODT
In addition to accessing information and analytics on a given stock option, Bloomberg also
provides information on the option market. To access such information, you type ODT.
Bloomberg‟s ODT function brings up a menu and sub-menu of descriptive and analytical
functions for markets: equity ([EQUITY]), indices (INDEX]), commodities ([CMDTY]),
currency ([CRNCY]), corporate bonds ([CORP]), and government securities ([GOVT]).
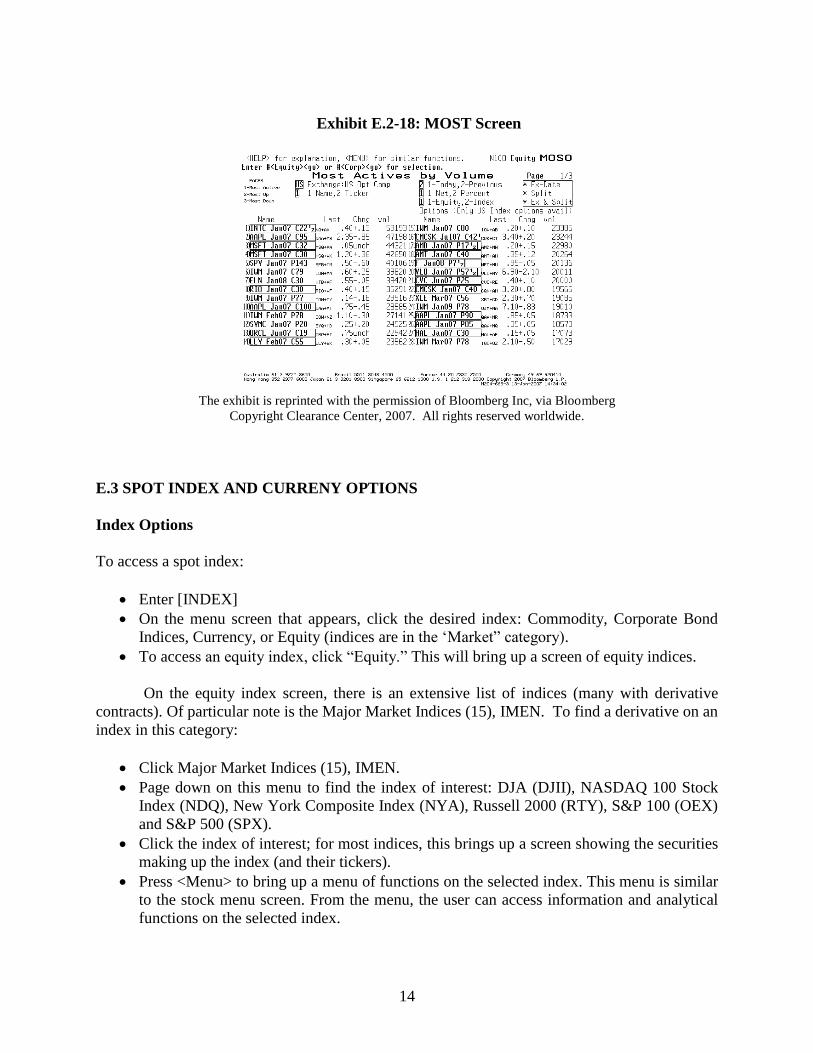
To access the menu for equity options, you press the [EQUITY] key and then types ODT.
On the resulting menu, you can click “Derivatives” to get a list of functions related to general
market information on equity derivatives. For example, hitting MOSO brings up a screen
(Exhibit E.2-18) showing the most active stock options trading at that time.
14
Exhibit E.2-18: MOST Screen
The exhibit is reprinted with the permission of Bloomberg Inc, via Bloomberg
Copyright Clearance Center, 2007. All rights reserved worldwide.
E.3 SPOT INDEX AND CURRENY OPTIONS
Index Options
To access a spot index:
Enter [INDEX]
On the menu screen that appears, click the desired index: Commodity, Corporate Bond
Indices, Currency, or Equity (indices are in the „Market” category).
To access an equity index, click “Equity.” This will bring up a screen of equity indices.
On the equity index screen, there is an extensive list of indices (many with derivative
contracts). Of particular note is the Major Market Indices (15), IMEN. To find a derivative on an
index in this category:
Click Major Market Indices (15), IMEN.
Page down on this menu to find the index of interest: DJA (DJII), NASDAQ 100 Stock
Index (NDQ), New York Composite Index (NYA), Russell 2000 (RTY), S&P 100 (OEX)
and S&P 500 (SPX).
Click the index of interest; for most indices, this brings up a screen showing the securities
making up the index (and their tickers).
Press <Menu> to bring up a menu of functions on the selected index. This menu is similar
to the stock menu screen. From the menu, the user can access information and analytical
functions on the selected index.
15
Alternatively, if you know the index ticker you can access the function menu directly by entering
the index‟s ticker and pressing [INDEX]. For example, to access the S&P 500, enter: SPX
[INDEX].
Example: S&P Spot Options: To access the S&P 500 derivative:
Enter SPX [INDEX]
On the SPX Menu, click “Derivative” to bring up SPX‟s derivative screen.
SPX‟s derivative screen is similar to the Option, Futures, and Convertible Screen for a specified
stock. It includes the most active option function (OMST), option monitors (OMON), option
scenario analysis (OSA), call and put option analysis (CALL and PUT), and option valuation
(OV).
As with stock options, three useful functions are OMON for viewing current options
prices, OSA for evaluating option strategies, and OV for valuing call and put options.
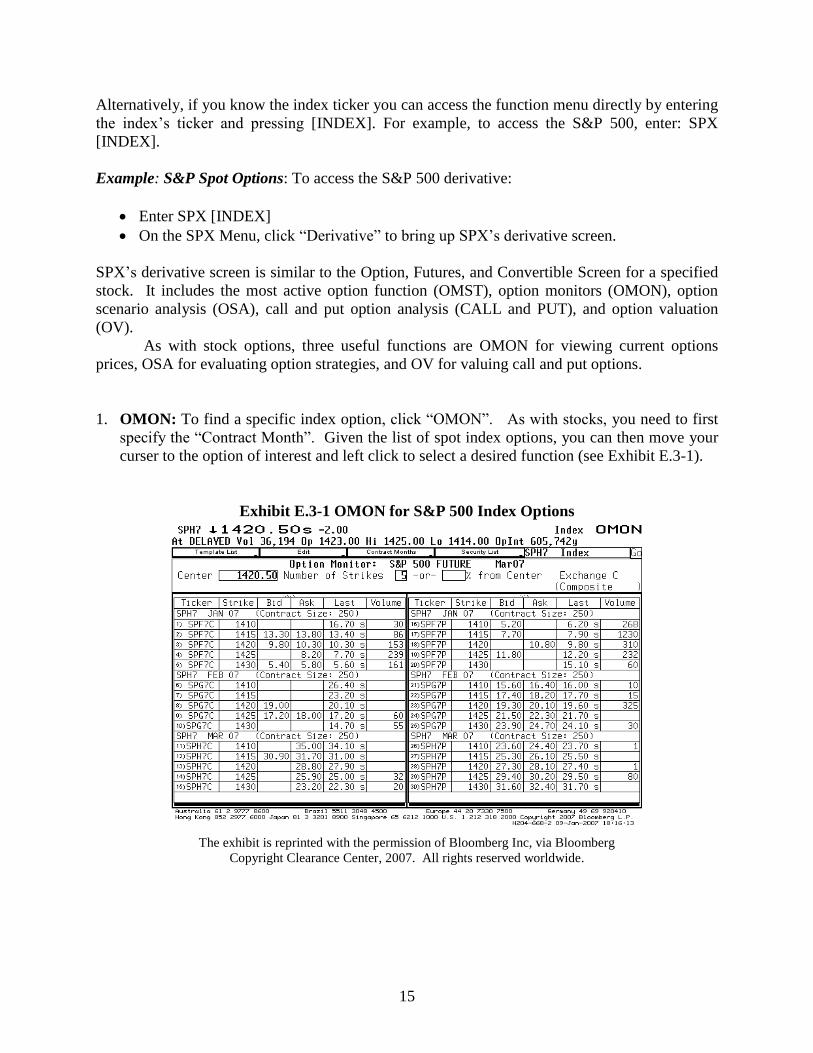
1. OMON: To find a specific index option, click “OMON”. As with stocks, you need to first
specify the “Contract Month”. Given the list of spot index options, you can then move your
curser to the option of interest and left click to select a desired function (see Exhibit E.3-1).
Exhibit E.3-1 OMON for S&P 500 Index Options
The exhibit is reprinted with the permission of Bloomberg Inc, via Bloomberg
Copyright Clearance Center, 2007. All rights reserved worldwide.
16
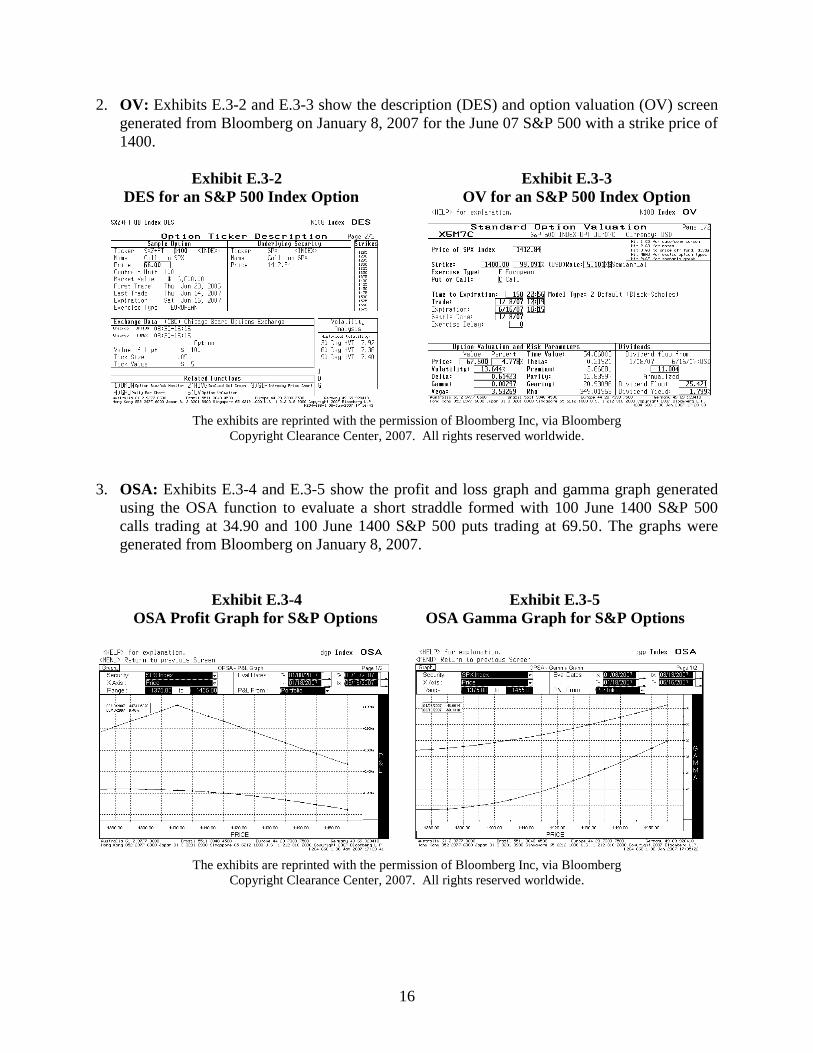
2. OV: Exhibits E.3-2 and E.3-3 show the description (DES) and option valuation (OV) screen
generated from Bloomberg on January 8, 2007 for the June 07 S&P 500 with a strike price of
1400.
Exhibit E.3-2 Exhibit E.3-3
DES for an S&P 500 Index Option OV for an S&P 500 Index Option
The exhibits are reprinted with the permission of Bloomberg Inc, via Bloomberg
Copyright Clearance Center, 2007. All rights reserved worldwide.
3. OSA: Exhibits E.3-4 and E.3-5 show the profit and loss graph and gamma graph generated
using the OSA function to evaluate a short straddle formed with 100 June 1400 S&P 500
calls trading at 34.90 and 100 June 1400 S&P 500 puts trading at 69.50. The graphs were
generated from Bloomberg on January 8, 2007.
Exhibit E.3-4 Exhibit E.3-5
OSA Profit Graph for S&P Options OSA Gamma Graph for S&P Options
The exhibits are reprinted with the permission of Bloomberg Inc, via Bloomberg
Copyright Clearance Center, 2007. All rights reserved worldwide.
17
Spot Currency Options
Spot currency options can be accessed by typing CTM to access Bloomberg‟s Contract Table
Menu and then clicking „Spot Currency Options‟ (number 19). This will bring up a screen
showing spot currency options traded on different exchanges. To directly access information on
spot currency options traded on the Philadelphia Exchange, type FCO <go>. This will bring up a
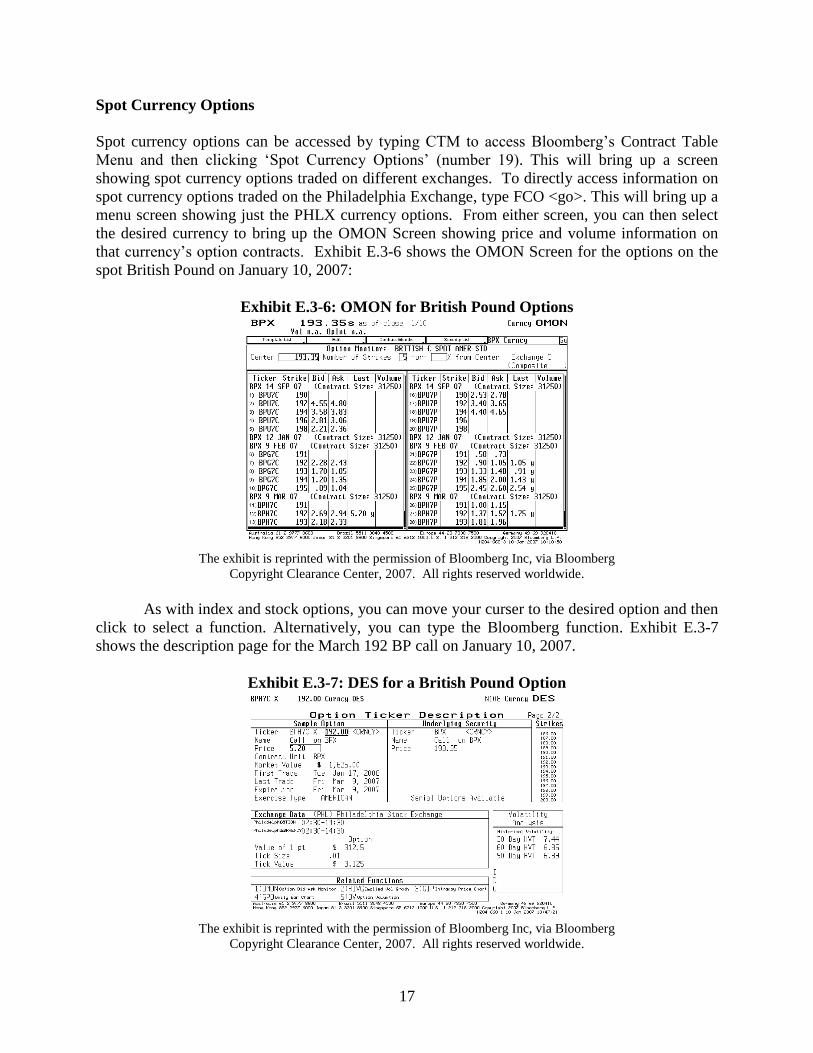
menu screen showing just the PHLX currency options. From either screen, you can then select
the desired currency to bring up the OMON Screen showing price and volume information on
that currency‟s option contracts. Exhibit E.3-6 shows the OMON Screen for the options on the
spot British Pound on January 10, 2007:
Exhibit E.3-6: OMON for British Pound Options
The exhibit is reprinted with the permission of Bloomberg Inc, via Bloomberg
Copyright Clearance Center, 2007. All rights reserved worldwide.
As with index and stock options, you can move your curser to the desired option and then
click to select a function. Alternatively, you can type the Bloomberg function. Exhibit E.3-7
shows the description page for the March 192 BP call on January 10, 2007.
Exhibit E.3-7: DES for a British Pound Option
The exhibit is reprinted with the permission of Bloomberg Inc, via Bloomberg
Copyright Clearance Center, 2007. All rights reserved worldwide.
18
It should be noted that accessing the OV function to value a spot currency option brings up a
screen called the “Multileg Option Valuation” Screen. This function screen is similar to the
standard OV screen used for stock and stock indices.
In addition to information and analytical functions on specific currency options,
Bloomberg also has a number of functions that provide market information and analytics on the
overall currency market that can be used for currency option derivatives. To access general
currency market functions and information:
Pressing [CRNCY]
Type ODT
On the ODT menu, two functions of note are the “Currency Volatility Surface” (currency
volatility smiles) and the “Volatility Comparison.” Also note that currency options can be
accessed from the ODT screen by clicking “Futures and Options”; doing this will bring up a
menu listing the currency option markets (FCO and CMT).
E.4 FUTURES AND FUTURES OPTION CONTRACTS
Futures Contracts
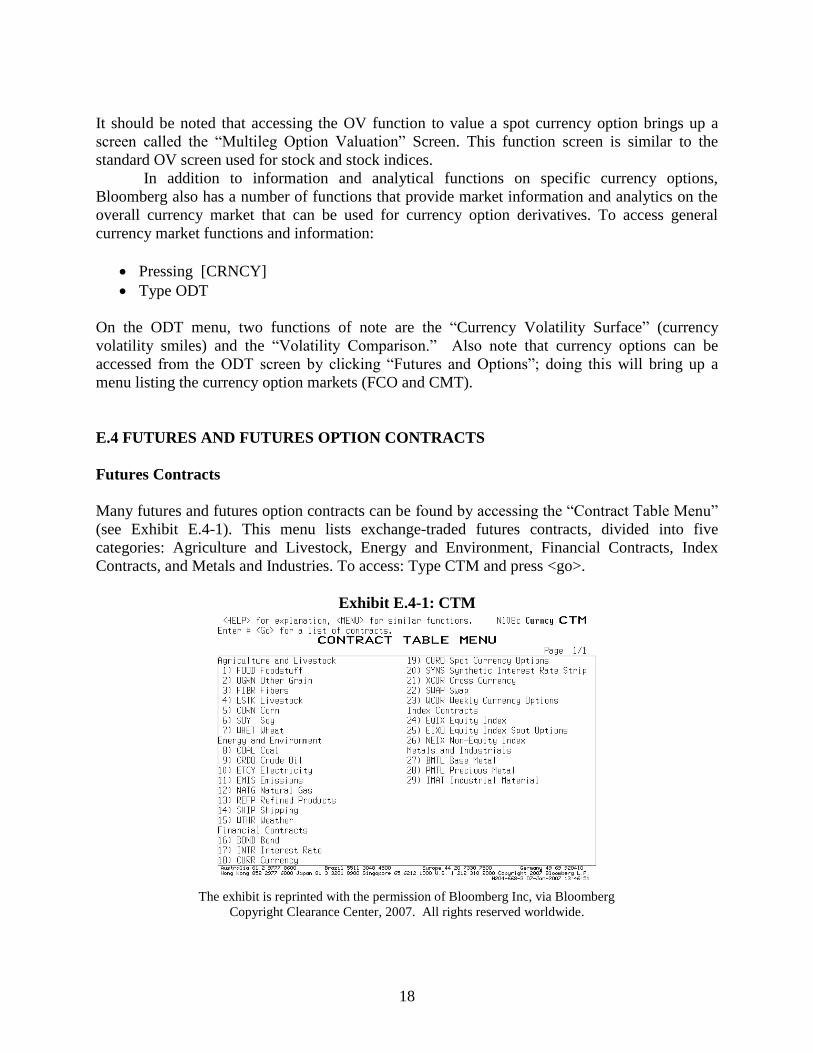
Many futures and futures option contracts can be found by accessing the “Contract Table Menu”
(see Exhibit E.4-1). This menu lists exchange-traded futures contracts, divided into five
categories: Agriculture and Livestock, Energy and Environment, Financial Contracts, Index
Contracts, and Metals and Industries. To access: Type CTM and press <go>.
Exhibit E.4-1: CTM
The exhibit is reprinted with the permission of Bloomberg Inc, via Bloomberg
Copyright Clearance Center, 2007. All rights reserved worldwide.

19
From the Contract Table Menu, you can click on the desired category to open the display
of contract sources. For example, to access equity index contracts, you type 24 (see Exhibit E.4-
1) at the top left corner of the screen or move the cursor to 24 and click. This brings up a screen
displaying the contracts on that commodity or index, their tickers, descriptions, exchanges, and
types. Exhibit E.4-2 shows the CTM for equity indices.
Exhibit E.4-2: CTM for Equity Indices
The exhibit is reprinted with the permission of Bloomberg Inc, via Bloomberg
Copyright Clearance Center, 2007. All rights reserved worldwide.
On the Equity OTM Screen, there are several features to note:
The Opt Column has a check mark if options are traded on the futures contract.
The MULT Column has a check mark if there are multiple electronic trading sessions.
The “Sort By” box allows users to sort contracts by volume or open interest.
For information on one of the contracts shown on the CTM Screen for the selected commodity
group (e.g., equity indices):
Type the number of the contract of interest (or move the cursor to that number and click).
This will bring up a screen that gives you the choice of selecting either the options on the
contract (OMON) or the futures and futures option contracts (CT).
Click the CT option to bring up a screen listing contracts on the selected underlying
commodity, currency, or index.
Example: To access the contacts on the S&P 500 futures contract traded on the CME, you click
4 (page 2 of the CTM equity index screen) and then click CT. This brings up the Contract Table
Screen for the S&P 500 futures and futures option contracts (Exhibit E.4-3):
20
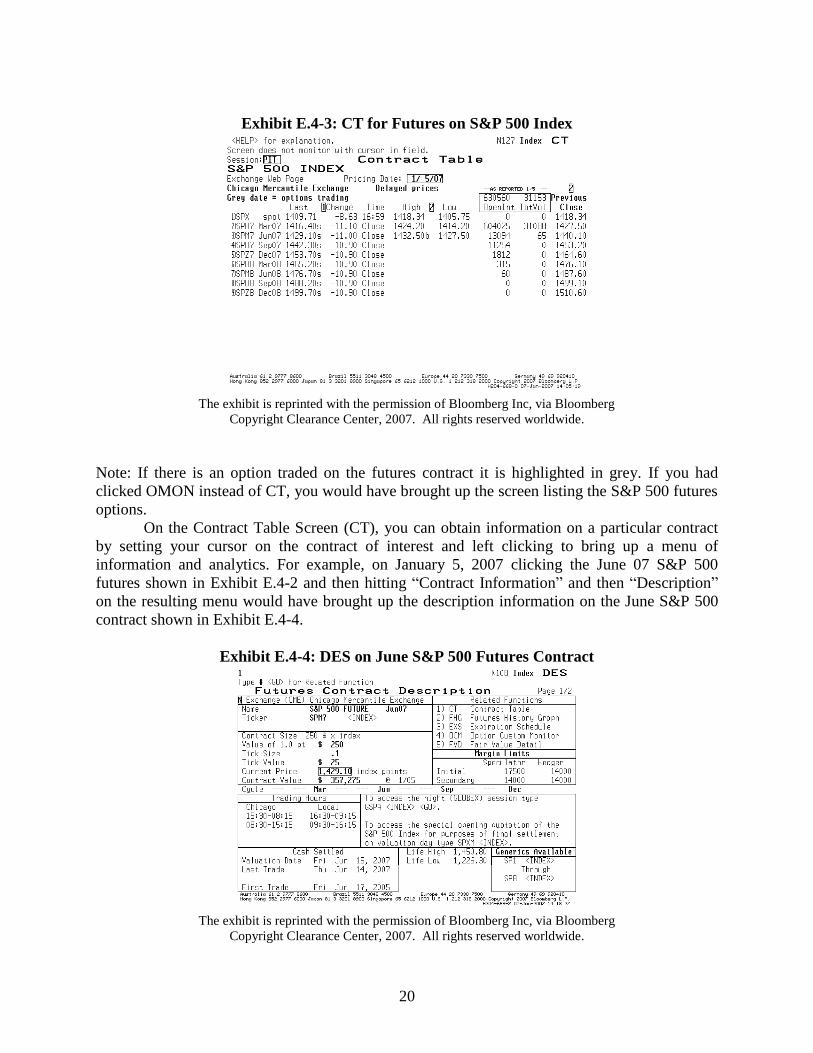
Exhibit E.4-3: CT for Futures on S&P 500 Index
The exhibit is reprinted with the permission of Bloomberg Inc, via Bloomberg
Copyright Clearance Center, 2007. All rights reserved worldwide.
Note: If there is an option traded on the futures contract it is highlighted in grey. If you had
clicked OMON instead of CT, you would have brought up the screen listing the S&P 500 futures
options.
On the Contract Table Screen (CT), you can obtain information on a particular contract
by setting your cursor on the contract of interest and left clicking to bring up a menu of
information and analytics. For example, on January 5, 2007 clicking the June 07 S&P 500
futures shown in Exhibit E.4-2 and then hitting “Contract Information” and then “Description”
on the resulting menu would have brought up the description information on the June S&P 500
contract shown in Exhibit E.4-4.
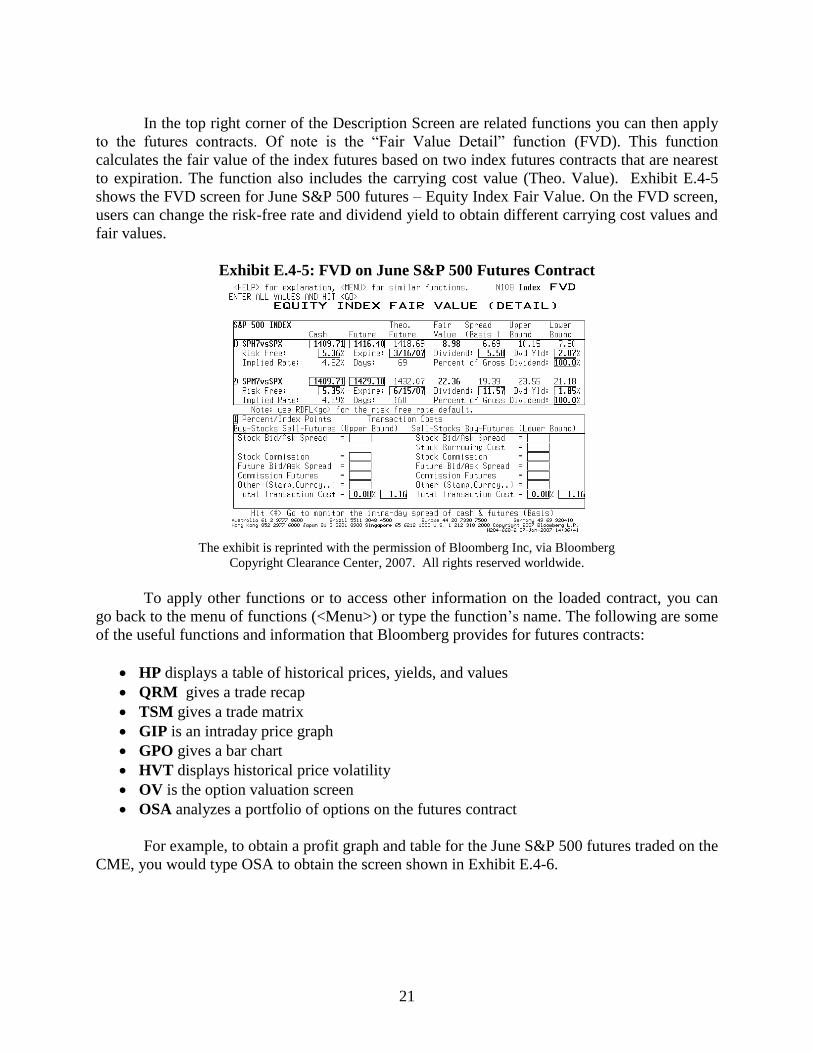
Exhibit E.4-4: DES on June S&P 500 Futures Contract
The exhibit is reprinted with the permission of Bloomberg Inc, via Bloomberg
Copyright Clearance Center, 2007. All rights reserved worldwide.
21
In the top right corner of the Description Screen are related functions you can then apply
to the futures contracts. Of note is the “Fair Value Detail” function (FVD). This function
calculates the fair value of the index futures based on two index futures contracts that are nearest
to expiration. The function also includes the carrying cost value (Theo. Value). Exhibit E.4-5
shows the FVD screen for June S&P 500 futures – Equity Index Fair Value. On the FVD screen,
users can change the risk-free rate and dividend yield to obtain different carrying cost values and
fair values.
Exhibit E.4-5: FVD on June S&P 500 Futures Contract
The exhibit is reprinted with the permission of Bloomberg Inc, via Bloomberg
Copyright Clearance Center, 2007. All rights reserved worldwide.
To apply other functions or to access other information on the loaded contract, you can
go back to the menu of functions (<Menu>) or type the function‟s name. The following are some
of the useful functions and information that Bloomberg provides for futures contracts:
HP displays a table of historical prices, yields, and values
QRM gives a trade recap
TSM gives a trade matrix
GIP is an intraday price graph
GPO gives a bar chart
HVT displays historical price volatility
OV is the option valuation screen
OSA analyzes a portfolio of options on the futures contract
For example, to obtain a profit graph and table for the June S&P 500 futures traded on the
CME, you would type OSA to obtain the screen shown in Exhibit E.4-6.
22
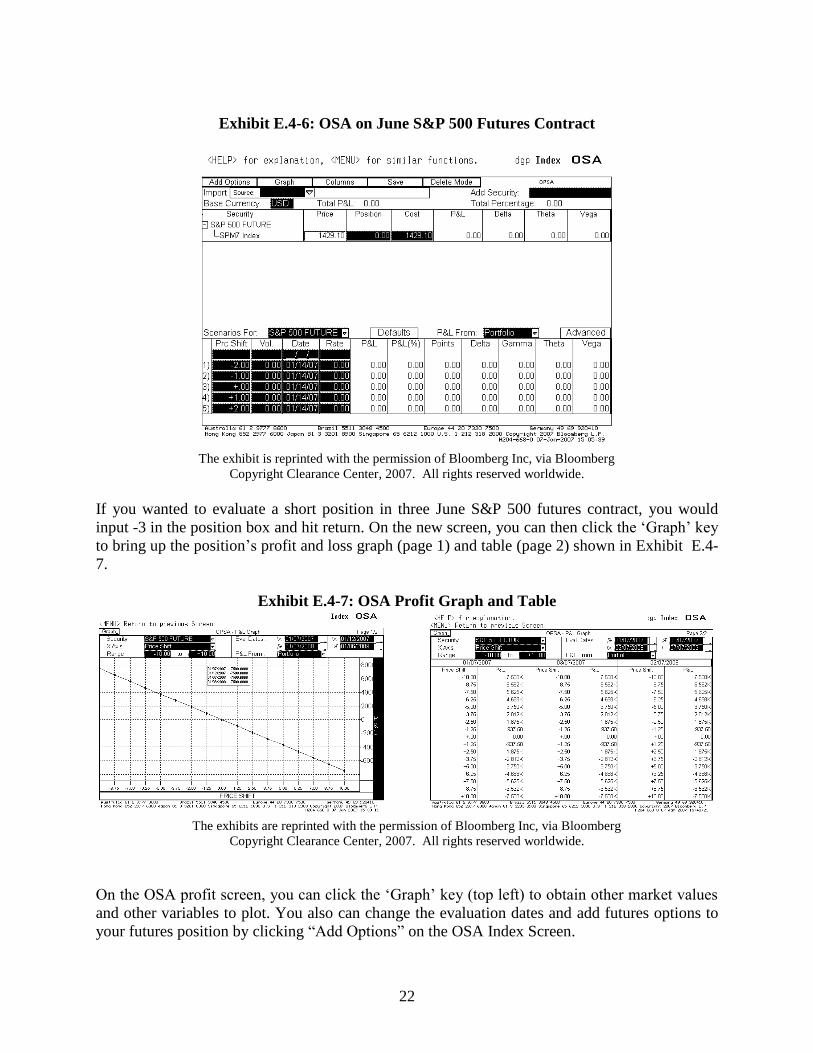
Exhibit E.4-6: OSA on June S&P 500 Futures Contract
The exhibit is reprinted with the permission of Bloomberg Inc, via Bloomberg
Copyright Clearance Center, 2007. All rights reserved worldwide.
If you wanted to evaluate a short position in three June S&P 500 futures contract, you would
input -3 in the position box and hit return. On the new screen, you can then click the „Graph‟ key
to bring up the position‟s profit and loss graph (page 1) and table (page 2) shown in Exhibit E.4-
7.
Exhibit E.4-7: OSA Profit Graph and Table
The exhibits are reprinted with the permission of Bloomberg Inc, via Bloomberg
Copyright Clearance Center, 2007. All rights reserved worldwide.
On the OSA profit screen, you can click the „Graph‟ key (top left) to obtain other market values
and other variables to plot. You also can change the evaluation dates and add futures options to
your futures position by clicking “Add Options” on the OSA Index Screen.
23
Futures Options
In general, to access information and analytical function for a specific futures option, one uses
the same steps defined above for futures contract:
Type CTM to bring up a Contract Table Menu Screen
Click the desired category to open the display of contract sources
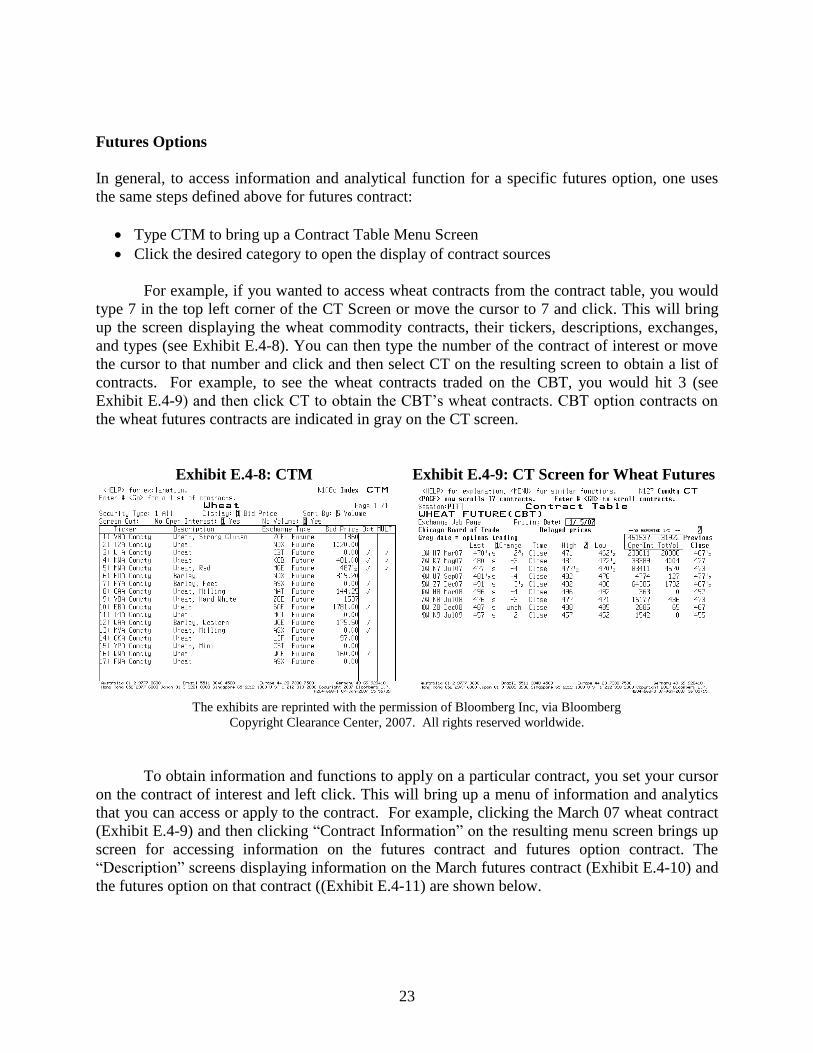
For example, if you wanted to access wheat contracts from the contract table, you would
type 7 in the top left corner of the CT Screen or move the cursor to 7 and click. This will bring
up the screen displaying the wheat commodity contracts, their tickers, descriptions, exchanges,
and types (see Exhibit E.4-8). You can then type the number of the contract of interest or move
the cursor to that number and click and then select CT on the resulting screen to obtain a list of
contracts. For example, to see the wheat contracts traded on the CBT, you would hit 3 (see
Exhibit E.4-9) and then click CT to obtain the CBT‟s wheat contracts. CBT option contracts on
the wheat futures contracts are indicated in gray on the CT screen.
Exhibit E.4-8: CTM Exhibit E.4-9: CT Screen for Wheat Futures
The exhibits are reprinted with the permission of Bloomberg Inc, via Bloomberg
Copyright Clearance Center, 2007. All rights reserved worldwide.
To obtain information and functions to apply on a particular contract, you set your cursor
on the contract of interest and left click. This will bring up a menu of information and analytics
that you can access or apply to the contract. For example, clicking the March 07 wheat contract
(Exhibit E.4-9) and then clicking “Contract Information” on the resulting menu screen brings up
screen for accessing information on the futures contract and futures option contract. The
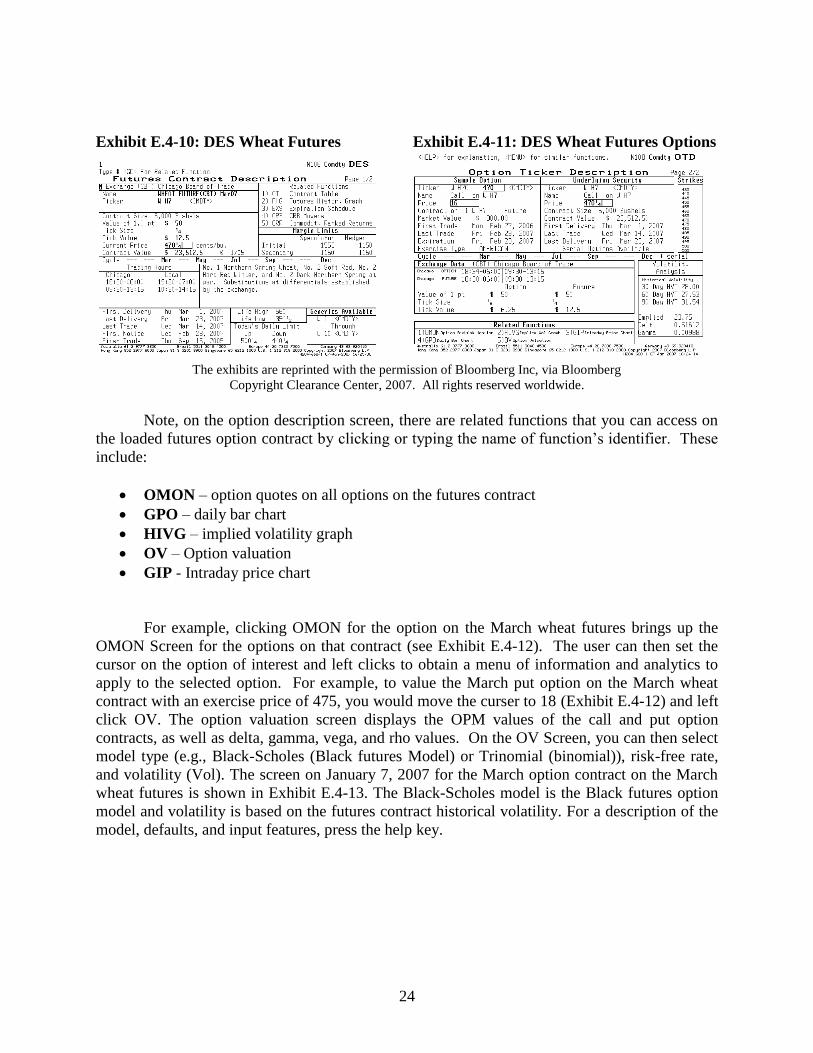
“Description” screens displaying information on the March futures contract (Exhibit E.4-10) and
the futures option on that contract ((Exhibit E.4-11) are shown below.
24
Exhibit E.4-10: DES Wheat Futures Exhibit E.4-11: DES Wheat Futures Options
The exhibits are reprinted with the permission of Bloomberg Inc, via Bloomberg
Copyright Clearance Center, 2007. All rights reserved worldwide.
Note, on the option description screen, there are related functions that you can access on
the loaded futures option contract by clicking or typing the name of function‟s identifier. These
include:
OMON – option quotes on all options on the futures contract
GPO – daily bar chart
HIVG – implied volatility graph
OV – Option valuation
GIP - Intraday price chart
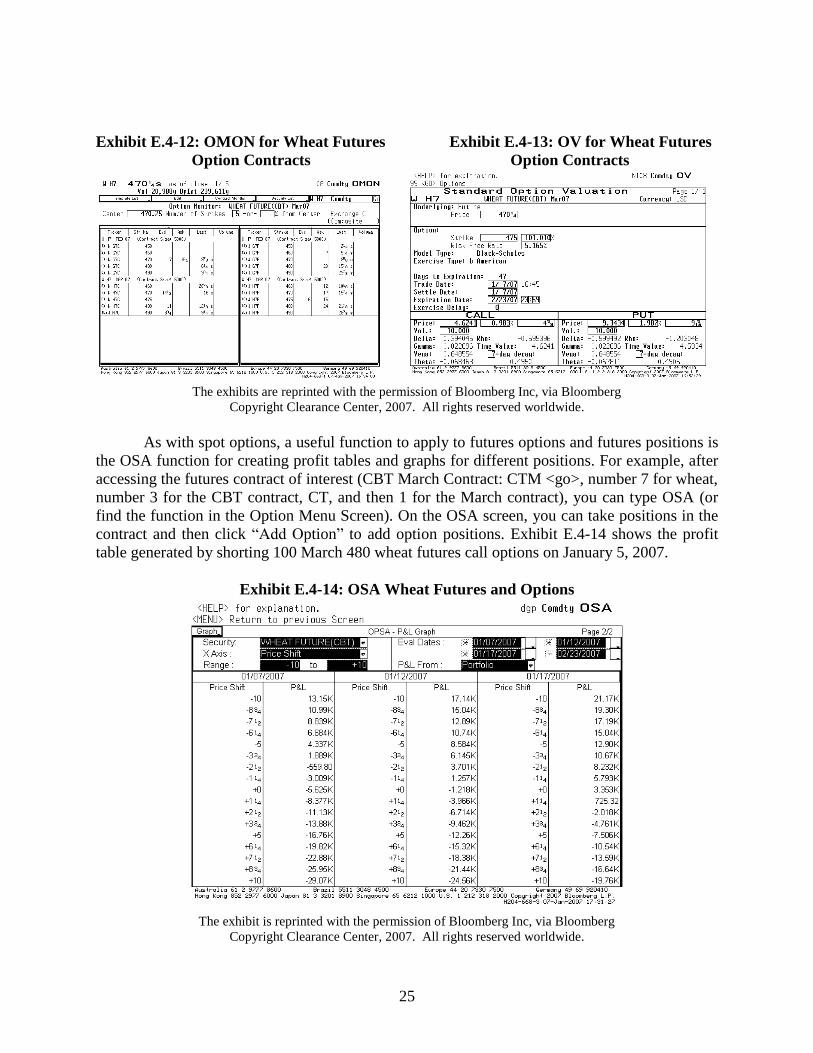
For example, clicking OMON for the option on the March wheat futures brings up the
OMON Screen for the options on that contract (see Exhibit E.4-12). The user can then set the
cursor on the option of interest and left clicks to obtain a menu of information and analytics to
apply to the selected option. For example, to value the March put option on the March wheat
contract with an exercise price of 475, you would move the curser to 18 (Exhibit E.4-12) and left
click OV. The option valuation screen displays the OPM values of the call and put option
contracts, as well as delta, gamma, vega, and rho values. On the OV Screen, you can then select
model type (e.g., Black-Scholes (Black futures Model) or Trinomial (binomial)), risk-free rate,
and volatility (Vol). The screen on January 7, 2007 for the March option contract on the March
wheat futures is shown in Exhibit E.4-13. The Black-Scholes model is the Black futures option
model and volatility is based on the futures contract historical volatility. For a description of the
model, defaults, and input features, press the help key.
25
Exhibit E.4-12: OMON for Wheat Futures Exhibit E.4-13: OV for Wheat Futures
Option Contracts Option Contracts
The exhibits are reprinted with the permission of Bloomberg Inc, via Bloomberg
Copyright Clearance Center, 2007. All rights reserved worldwide.
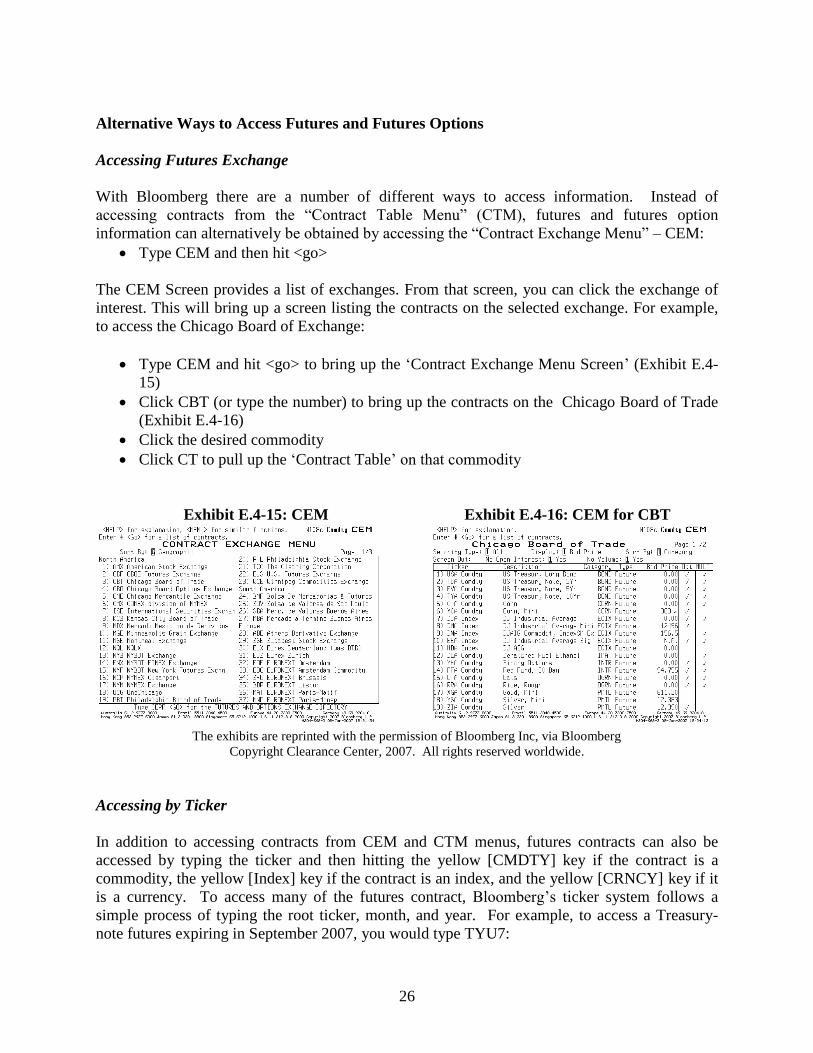
As with spot options, a useful function to apply to futures options and futures positions is
the OSA function for creating profit tables and graphs for different positions. For example, after
accessing the futures contract of interest (CBT March Contract: CTM <go>, number 7 for wheat,
number 3 for the CBT contract, CT, and then 1 for the March contract), you can type OSA (or
find the function in the Option Menu Screen). On the OSA screen, you can take positions in the
contract and then click “Add Option” to add option positions. Exhibit E.4-14 shows the profit
table generated by shorting 100 March 480 wheat futures call options on January 5, 2007.
Exhibit E.4-14: OSA Wheat Futures and Options
The exhibit is reprinted with the permission of Bloomberg Inc, via Bloomberg
Copyright Clearance Center, 2007. All rights reserved worldwide.
26
Alternative Ways to Access Futures and Futures Options
Accessing Futures Exchange
With Bloomberg there are a number of different ways to access information. Instead of
accessing contracts from the “Contract Table Menu” (CTM), futures and futures option
information can alternatively be obtained by accessing the “Contract Exchange Menu” – CEM:
Type CEM and then hit <go>
The CEM Screen provides a list of exchanges. From that screen, you can click the exchange of
interest. This will bring up a screen listing the contracts on the selected exchange. For example,
to access the Chicago Board of Exchange:
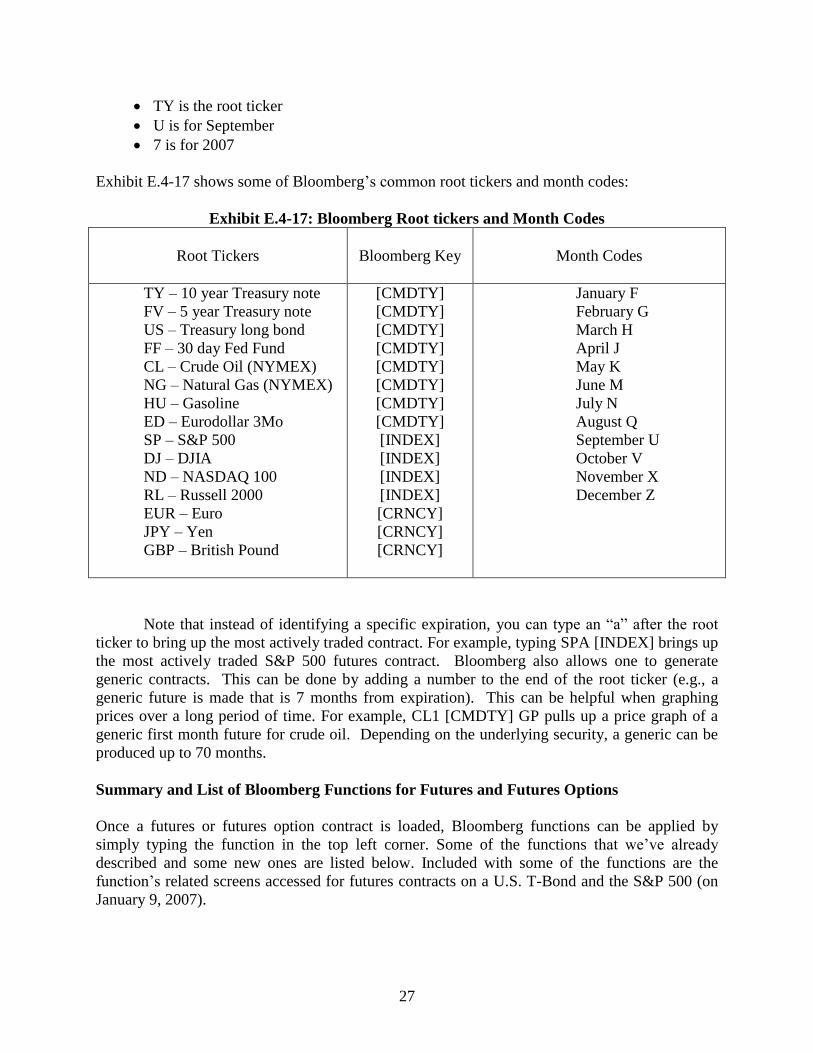
Type CEM and hit <go> to bring up the „Contract Exchange Menu Screen‟ (Exhibit E.4-
15)
Click CBT (or type the number) to bring up the contracts on the Chicago Board of Trade
(Exhibit E.4-16)
Click the desired commodity
Click CT to pull up the „Contract Table‟ on that commodity
Exhibit E.4-15: CEM Exhibit E.4-16: CEM for CBT
The exhibits are reprinted with the permission of Bloomberg Inc, via Bloomberg
Copyright Clearance Center, 2007. All rights reserved worldwide.
Accessing by Ticker
In addition to accessing contracts from CEM and CTM menus, futures contracts can also be
accessed by typing the ticker and then hitting the yellow [CMDTY] key if the contract is a
commodity, the yellow [Index] key if the contract is an index, and the yellow [CRNCY] key if it
is a currency. To access many of the futures contract, Bloomberg‟s ticker system follows a
simple process of typing the root ticker, month, and year. For example, to access a Treasury-
note futures expiring in September 2007, you would type TYU7:
27
TY is the root ticker
U is for September
7 is for 2007
Exhibit E.4-17 shows some of Bloomberg‟s common root tickers and month codes:
Exhibit E.4-17: Bloomberg Root tickers and Month Codes
Root Tickers
Bloomberg Key
Month Codes
TY – 10 year Treasury note
FV – 5 year Treasury note
US – Treasury long bond
FF – 30 day Fed Fund
CL – Crude Oil (NYMEX)
NG – Natural Gas (NYMEX)
HU – Gasoline
ED – Eurodollar 3Mo
SP – S&P 500
DJ – DJIA
ND – NASDAQ 100
RL – Russell 2000
EUR – Euro
JPY – Yen
GBP – British Pound
[CMDTY]
[CMDTY]
[CMDTY]
[CMDTY]
[CMDTY]
[CMDTY]
[CMDTY]
[CMDTY]
[INDEX]
[INDEX]
[INDEX]
[INDEX]
[CRNCY]
[CRNCY]
[CRNCY]
January F
February G
March H
April J
May K
June M
July N
August Q
September U
October V
November X
December Z
Note that instead of identifying a specific expiration, you can type an “a” after the root
ticker to bring up the most actively traded contract. For example, typing SPA [INDEX] brings up
the most actively traded S&P 500 futures contract. Bloomberg also allows one to generate
generic contracts. This can be done by adding a number to the end of the root ticker (e.g., a
generic future is made that is 7 months from expiration). This can be helpful when graphing
prices over a long period of time. For example, CL1 [CMDTY] GP pulls up a price graph of a
generic first month future for crude oil. Depending on the underlying security, a generic can be
produced up to 70 months.
Summary and List of Bloomberg Functions for Futures and Futures Options
Once a futures or futures option contract is loaded, Bloomberg functions can be applied by
simply typing the function in the top left corner. Some of the functions that we‟ve already
described and some new ones are listed below. Included with some of the functions are the
function‟s related screens accessed for futures contracts on a U.S. T-Bond and the S&P 500 (on
January 9, 2007).
28
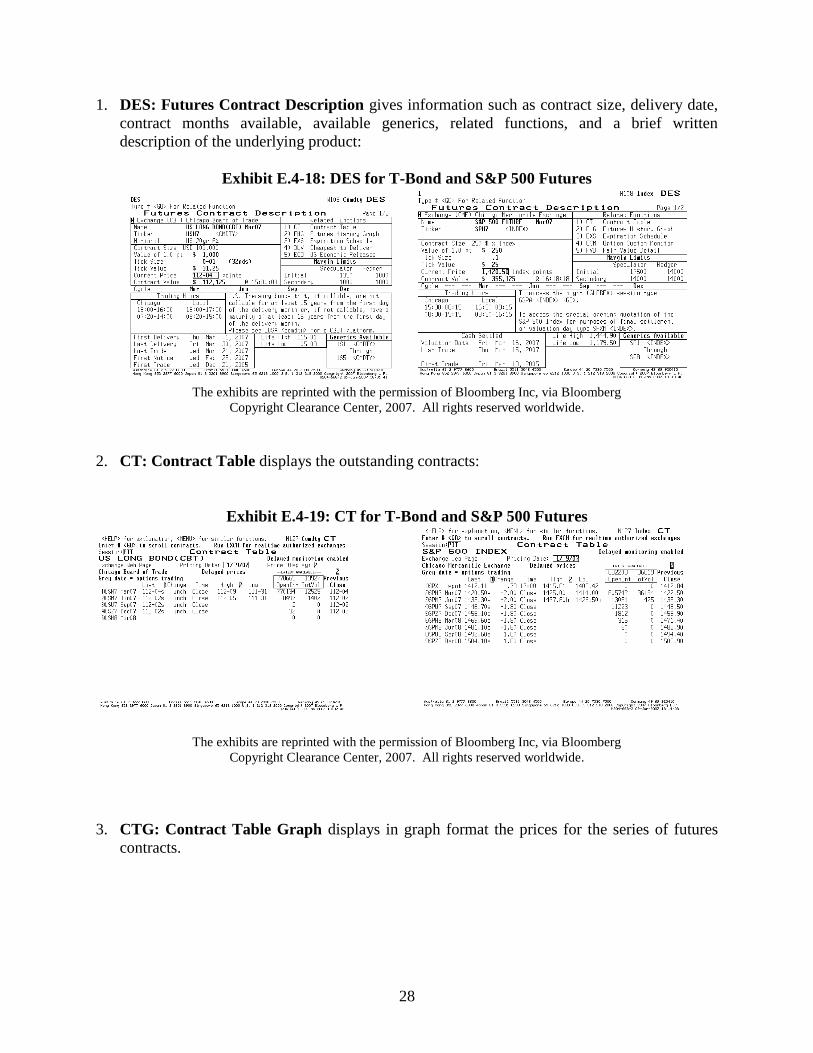
1. DES: Futures Contract Description gives information such as contract size, delivery date,
contract months available, available generics, related functions, and a brief written
description of the underlying product:
Exhibit E.4-18: DES for T-Bond and S&P 500 Futures
The exhibits are reprinted with the permission of Bloomberg Inc, via Bloomberg
Copyright Clearance Center, 2007. All rights reserved worldwide.
2. CT: Contract Table displays the outstanding contracts:
Exhibit E.4-19: CT for T-Bond and S&P 500 Futures
The exhibits are reprinted with the permission of Bloomberg Inc, via Bloomberg
Copyright Clearance Center, 2007. All rights reserved worldwide.
3. CTG: Contract Table Graph displays in graph format the prices for the series of futures
contracts.
29
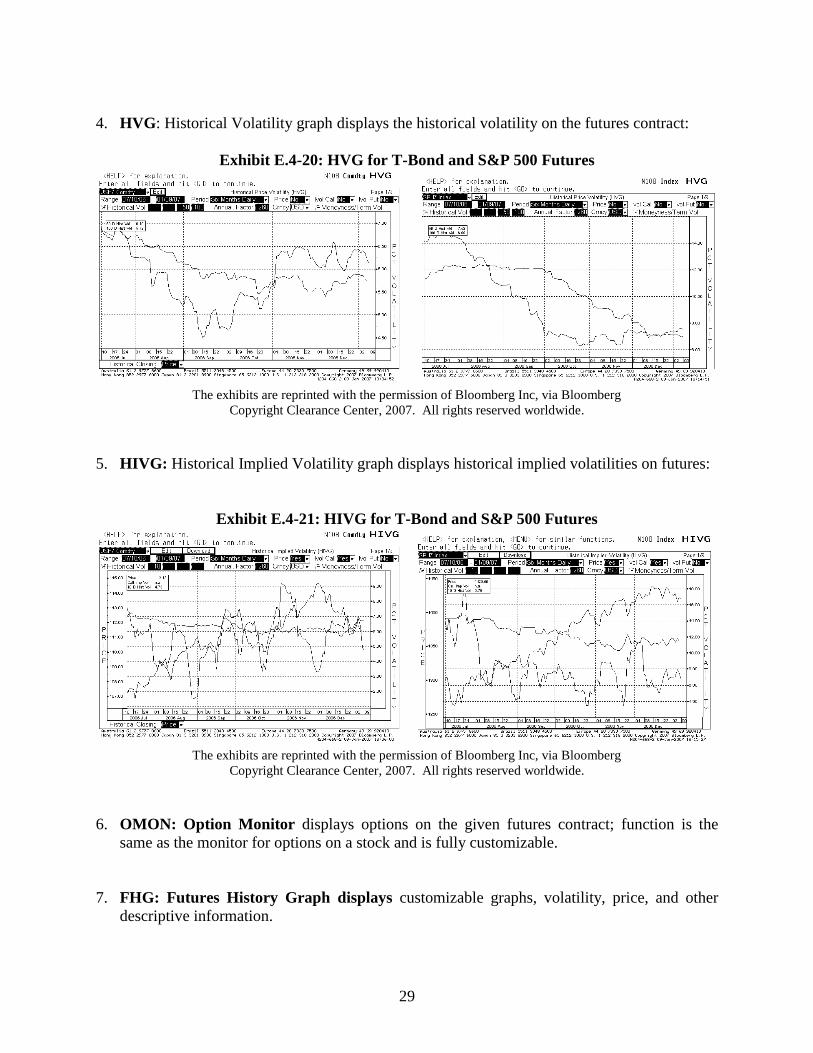
4. HVG: Historical Volatility graph displays the historical volatility on the futures contract:
Exhibit E.4-20: HVG for T-Bond and S&P 500 Futures
The exhibits are reprinted with the permission of Bloomberg Inc, via Bloomberg
Copyright Clearance Center, 2007. All rights reserved worldwide.
5. HIVG: Historical Implied Volatility graph displays historical implied volatilities on futures:
Exhibit E.4-21: HIVG for T-Bond and S&P 500 Futures
The exhibits are reprinted with the permission of Bloomberg Inc, via Bloomberg
Copyright Clearance Center, 2007. All rights reserved worldwide.
6. OMON: Option Monitor displays options on the given futures contract; function is the
same as the monitor for options on a stock and is fully customizable.
7. FHG: Futures History Graph displays customizable graphs, volatility, price, and other
descriptive information.
30
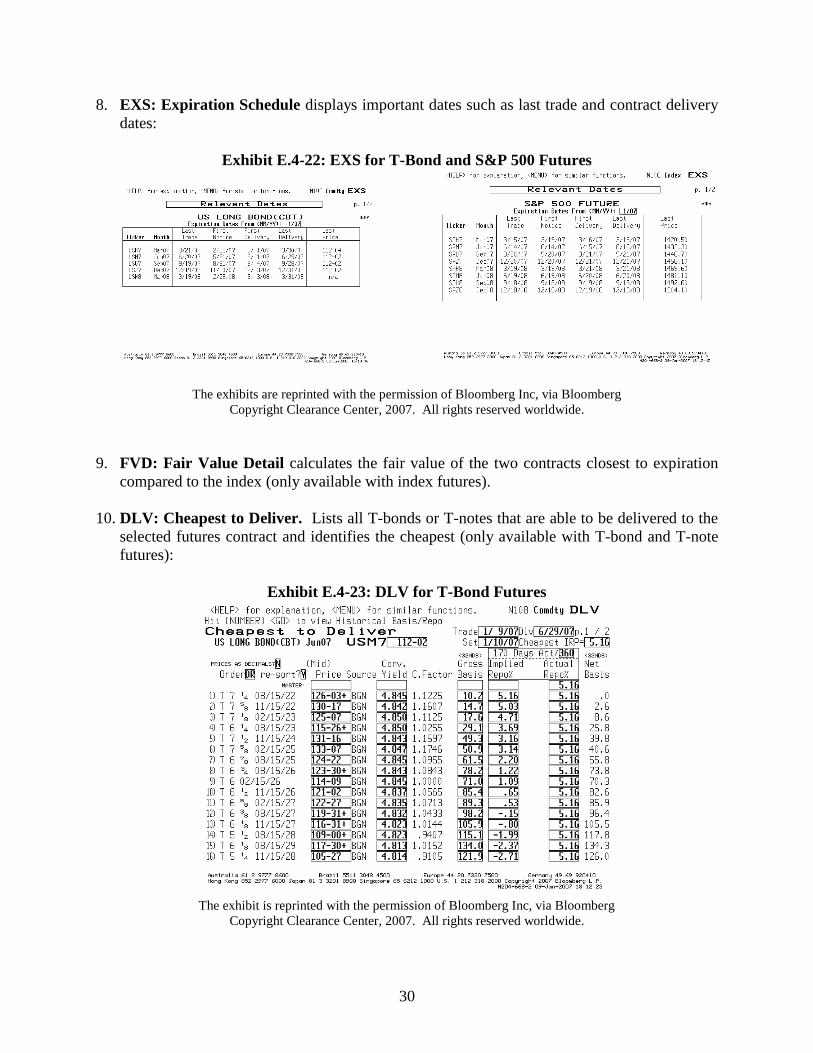
8. EXS: Expiration Schedule displays important dates such as last trade and contract delivery
dates:
Exhibit E.4-22: EXS for T-Bond and S&P 500 Futures
The exhibits are reprinted with the permission of Bloomberg Inc, via Bloomberg
Copyright Clearance Center, 2007. All rights reserved worldwide.
9. FVD: Fair Value Detail calculates the fair value of the two contracts closest to expiration
compared to the index (only available with index futures).
10. DLV: Cheapest to Deliver. Lists all T-bonds or T-notes that are able to be delivered to the
selected futures contract and identifies the cheapest (only available with T-bond and T-note
futures):
Exhibit E.4-23: DLV for T-Bond Futures
The exhibit is reprinted with the permission of Bloomberg Inc, via Bloomberg
Copyright Clearance Center, 2007. All rights reserved worldwide.
31
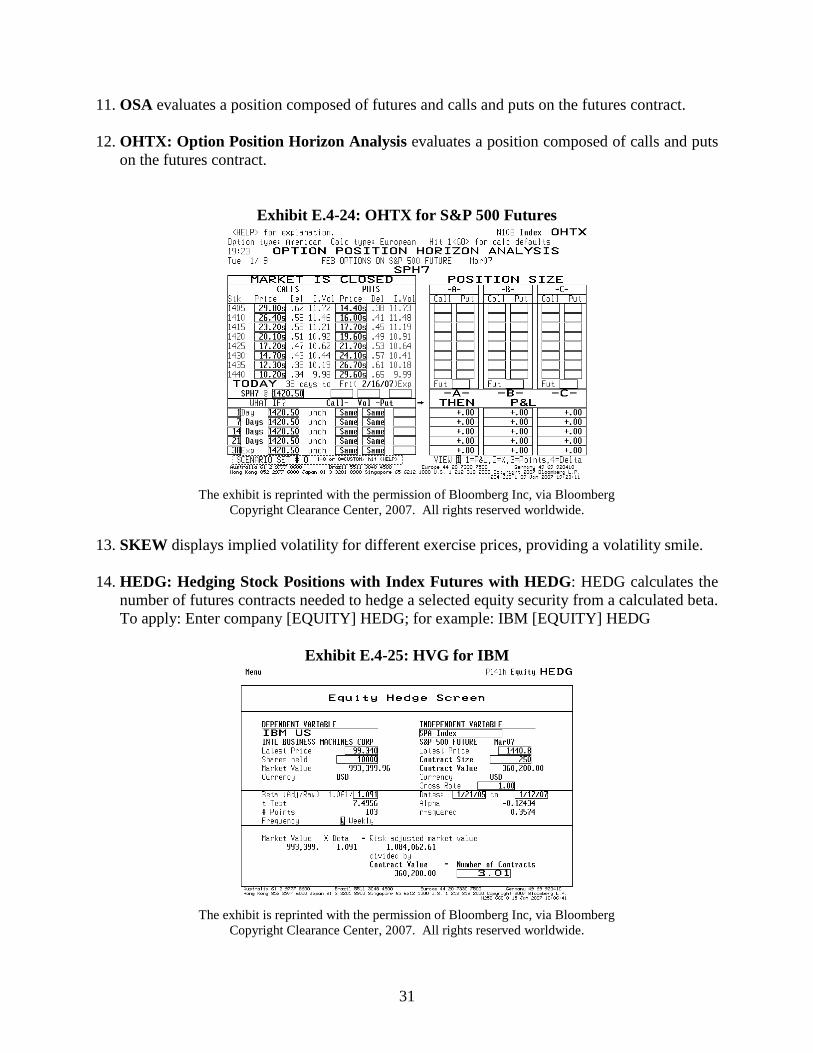
11. OSA evaluates a position composed of futures and calls and puts on the futures contract.
12. OHTX: Option Position Horizon Analysis evaluates a position composed of calls and puts
on the futures contract.
Exhibit E.4-24: OHTX for S&P 500 Futures
The exhibit is reprinted with the permission of Bloomberg Inc, via Bloomberg
Copyright Clearance Center, 2007. All rights reserved worldwide.
13. SKEW displays implied volatility for different exercise prices, providing a volatility smile.
14. HEDG: Hedging Stock Positions with Index Futures with HEDG: HEDG calculates the
number of futures contracts needed to hedge a selected equity security from a calculated beta.
To apply: Enter company [EQUITY] HEDG; for example: IBM [EQUITY] HEDG
Exhibit E.4-25: HVG for IBM
The exhibit is reprinted with the permission of Bloomberg Inc, via Bloomberg
Copyright Clearance Center, 2007. All rights reserved worldwide.
32
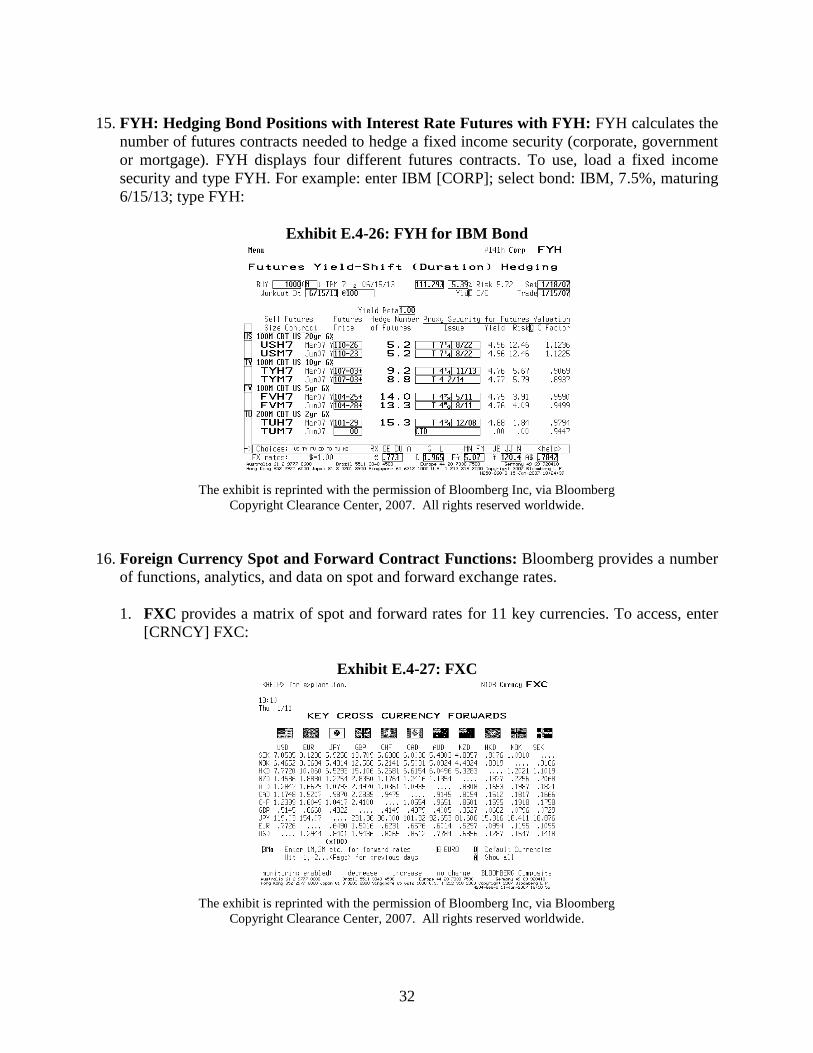
15. FYH: Hedging Bond Positions with Interest Rate Futures with FYH: FYH calculates the
number of futures contracts needed to hedge a fixed income security (corporate, government
or mortgage). FYH displays four different futures contracts. To use, load a fixed income
security and type FYH. For example: enter IBM [CORP]; select bond: IBM, 7.5%, maturing
6/15/13; type FYH:
Exhibit E.4-26: FYH for IBM Bond
The exhibit is reprinted with the permission of Bloomberg Inc, via Bloomberg
Copyright Clearance Center, 2007. All rights reserved worldwide.
16. Foreign Currency Spot and Forward Contract Functions: Bloomberg provides a number
of functions, analytics, and data on spot and forward exchange rates.
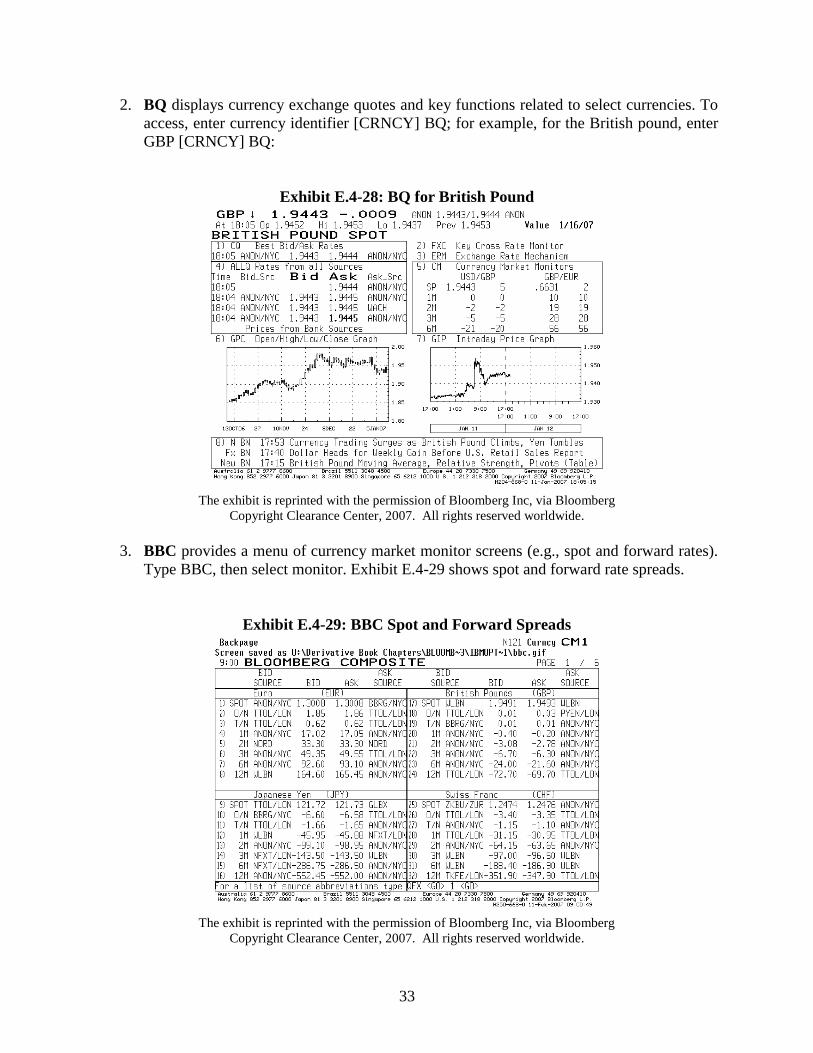
1. FXC provides a matrix of spot and forward rates for 11 key currencies. To access, enter
[CRNCY] FXC:
Exhibit E.4-27: FXC
The exhibit is reprinted with the permission of Bloomberg Inc, via Bloomberg
Copyright Clearance Center, 2007. All rights reserved worldwide.
33
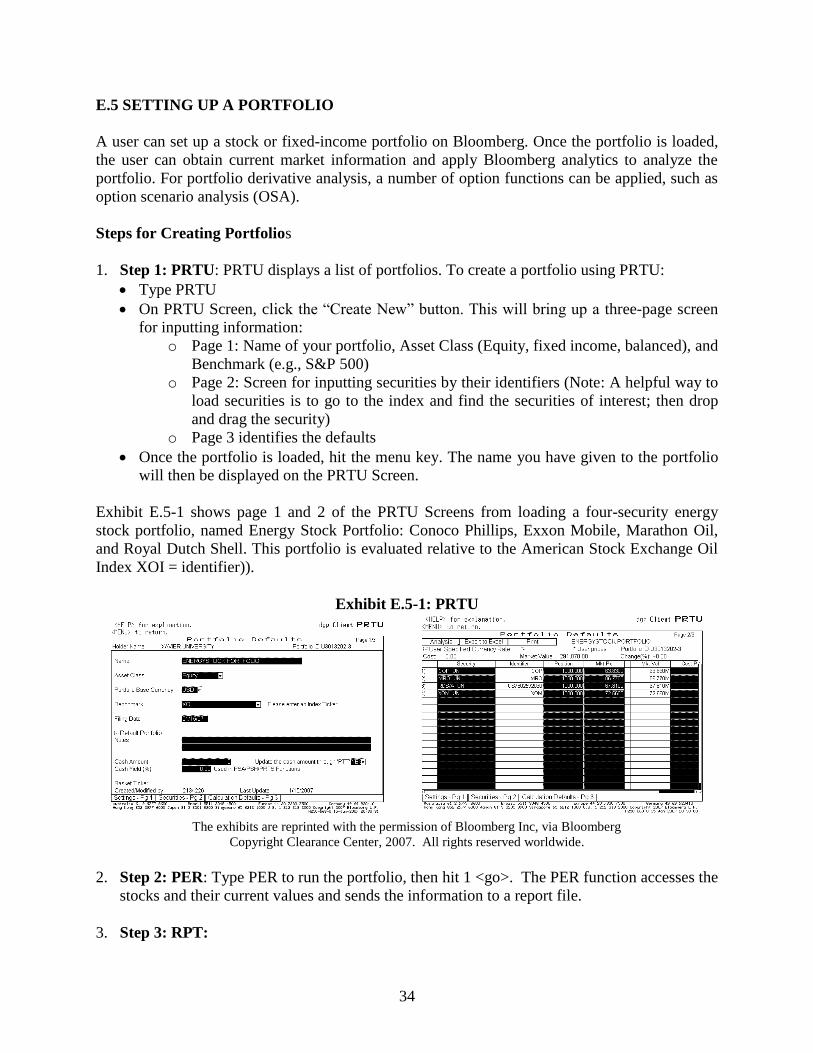
2. BQ displays currency exchange quotes and key functions related to select currencies. To
access, enter currency identifier [CRNCY] BQ; for example, for the British pound, enter
GBP [CRNCY] BQ:
Exhibit E.4-28: BQ for British Pound
The exhibit is reprinted with the permission of Bloomberg Inc, via Bloomberg
Copyright Clearance Center, 2007. All rights reserved worldwide.
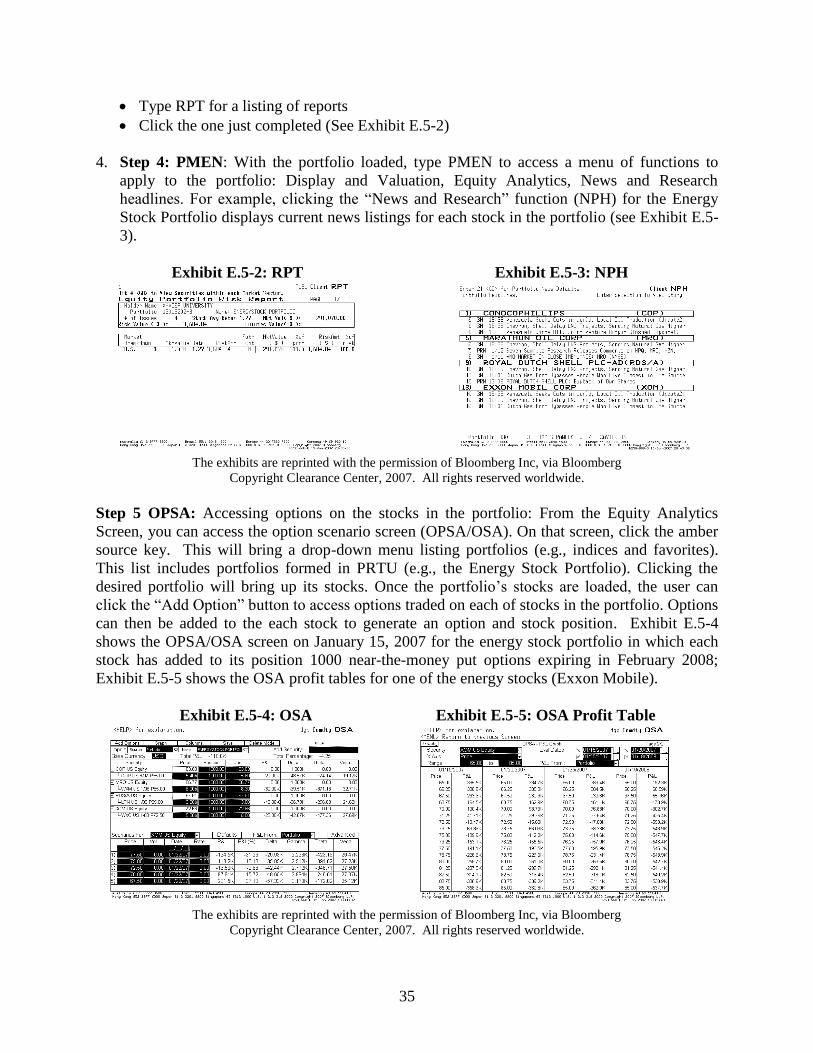
3. BBC provides a menu of currency market monitor screens (e.g., spot and forward rates).
Type BBC, then select monitor. Exhibit E.4-29 shows spot and forward rate spreads.
Exhibit E.4-29: BBC Spot and Forward Spreads
The exhibit is reprinted with the permission of Bloomberg Inc, via Bloomberg
Copyright Clearance Center, 2007. All rights reserved worldwide.
34
E.5 SETTING UP A PORTFOLIO
A user can set up a stock or fixed-income portfolio on Bloomberg. Once the portfolio is loaded,
the user can obtain current market information and apply Bloomberg analytics to analyze the
portfolio. For portfolio derivative analysis, a number of option functions can be applied, such as
option scenario analysis (OSA).
Steps for Creating Portfolios
1. Step 1: PRTU: PRTU displays a list of portfolios. To create a portfolio using PRTU:
Type PRTU
On PRTU Screen, click the “Create New” button. This will bring up a three-page screen
for inputting information:
o Page 1: Name of your portfolio, Asset Class (Equity, fixed income, balanced), and
Benchmark (e.g., S&P 500)
o Page 2: Screen for inputting securities by their identifiers (Note: A helpful way to
load securities is to go to the index and find the securities of interest; then drop
and drag the security)
o Page 3 identifies the defaults
Once the portfolio is loaded, hit the menu key. The name you have given to the portfolio
will then be displayed on the PRTU Screen.
Exhibit E.5-1 shows page 1 and 2 of the PRTU Screens from loading a four-security energy
stock portfolio, named Energy Stock Portfolio: Conoco Phillips, Exxon Mobile, Marathon Oil,
and Royal Dutch Shell. This portfolio is evaluated relative to the American Stock Exchange Oil
Index XOI = identifier)).
Exhibit E.5-1: PRTU
The exhibits are reprinted with the permission of Bloomberg Inc, via Bloomberg
Copyright Clearance Center, 2007. All rights reserved worldwide.
2. Step 2: PER: Type PER to run the portfolio, then hit 1 <go>. The PER function accesses the
stocks and their current values and sends the information to a report file.
3. Step 3: RPT:
35
Type RPT for a listing of reports
Click the one just completed (See Exhibit E.5-2)
4. Step 4: PMEN: With the portfolio loaded, type PMEN to access a menu of functions to
apply to the portfolio: Display and Valuation, Equity Analytics, News and Research
headlines. For example, clicking the “News and Research” function (NPH) for the Energy
Stock Portfolio displays current news listings for each stock in the portfolio (see Exhibit E.5-
3).
Exhibit E.5-2: RPT Exhibit E.5-3: NPH
The exhibits are reprinted with the permission of Bloomberg Inc, via Bloomberg
Copyright Clearance Center, 2007. All rights reserved worldwide.
Step 5 OPSA: Accessing options on the stocks in the portfolio: From the Equity Analytics
Screen, you can access the option scenario screen (OPSA/OSA). On that screen, click the amber
source key. This will bring a drop-down menu listing portfolios (e.g., indices and favorites).
This list includes portfolios formed in PRTU (e.g., the Energy Stock Portfolio). Clicking the
desired portfolio will bring up its stocks. Once the portfolio‟s stocks are loaded, the user can
click the “Add Option” button to access options traded on each of stocks in the portfolio. Options
can then be added to the each stock to generate an option and stock position. Exhibit E.5-4
shows the OPSA/OSA screen on January 15, 2007 for the energy stock portfolio in which each
stock has added to its position 1000 near-the-money put options expiring in February 2008;
Exhibit E.5-5 shows the OSA profit tables for one of the energy stocks (Exxon Mobile).
Exhibit E.5-4: OSA Exhibit E.5-5: OSA Profit Table
The exhibits are reprinted with the permission of Bloomberg Inc, via Bloomberg
Copyright Clearance Center, 2007. All rights reserved worldwide.
36
Note: Pressing the graph button on OSA‟s graph screen brings down a menu listing other
variables that you can evaluate: market values and Greeks. Also, depending on the Bloomberg
access agreement, the profit and loss data for each option can be downloaded to Excel file where
the entire portfolio can be evaluated.
E.6 GETTING STARTED ON OTHER DERIVATIVES FUNCTIONS
In addition to spot options, warrants, futures, and futures options, there are also Bloomberg
functions on swaps, interest rate derivative products, credit derivatives, convertible bonds, and
asset-backed securities. As a guide to getting stated, this section defines some of the Bloomberg
functions that can be used to access information on swaps, credit derivatives, convertibles, and
asset-backed securities. In examining theses functions, remember there is usually an extensive
help page included with most Bloomberg functions. More information on other derivatives also
can be found by typing NI BUSEMR to access the a Bloomberg tutorial on the subject.
Interest Rate Swaps and Other Interest Rate Products
Interest Rate Swap Functions
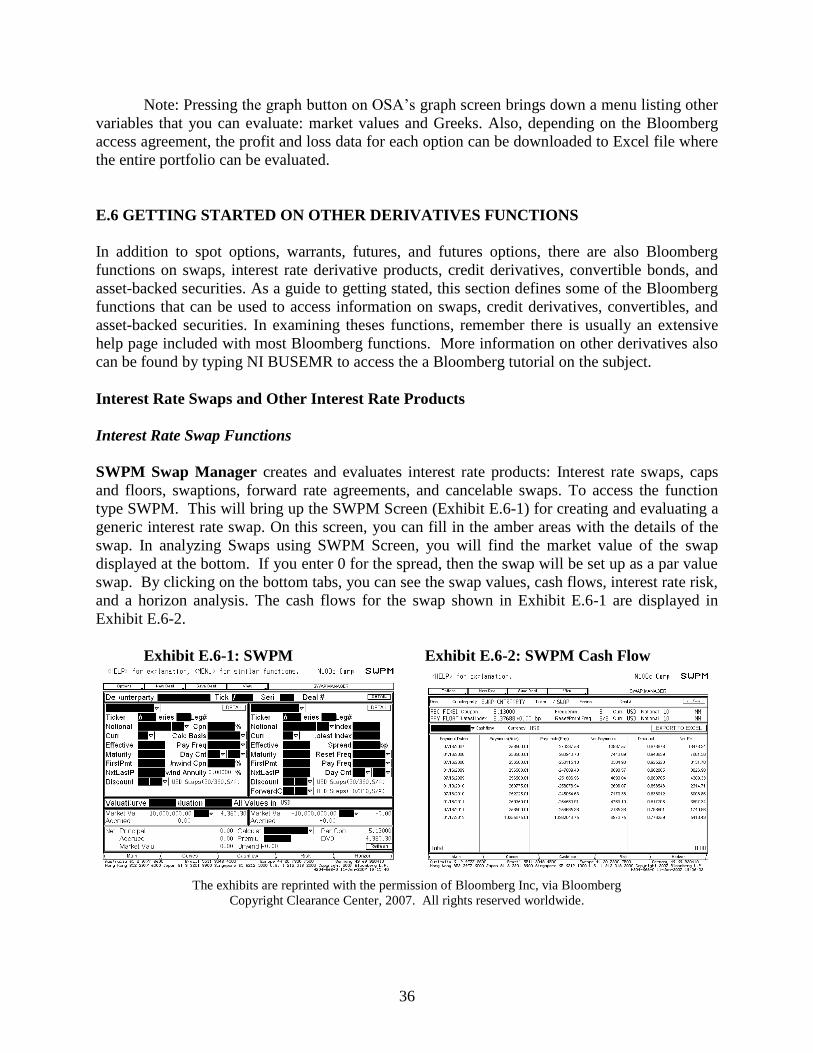
SWPM Swap Manager creates and evaluates interest rate products: Interest rate swaps, caps
and floors, swaptions, forward rate agreements, and cancelable swaps. To access the function
type SWPM. This will bring up the SWPM Screen (Exhibit E.6-1) for creating and evaluating a
generic interest rate swap. On this screen, you can fill in the amber areas with the details of the
swap. In analyzing Swaps using SWPM Screen, you will find the market value of the swap
displayed at the bottom. If you enter 0 for the spread, then the swap will be set up as a par value
swap. By clicking on the bottom tabs, you can see the swap values, cash flows, interest rate risk,
and a horizon analysis. The cash flows for the swap shown in Exhibit E.6-1 are displayed in
Exhibit E.6-2.
Exhibit E.6-1: SWPM Exhibit E.6-2: SWPM Cash Flow
The exhibits are reprinted with the permission of Bloomberg Inc, via Bloomberg
Copyright Clearance Center, 2007. All rights reserved worldwide.
37
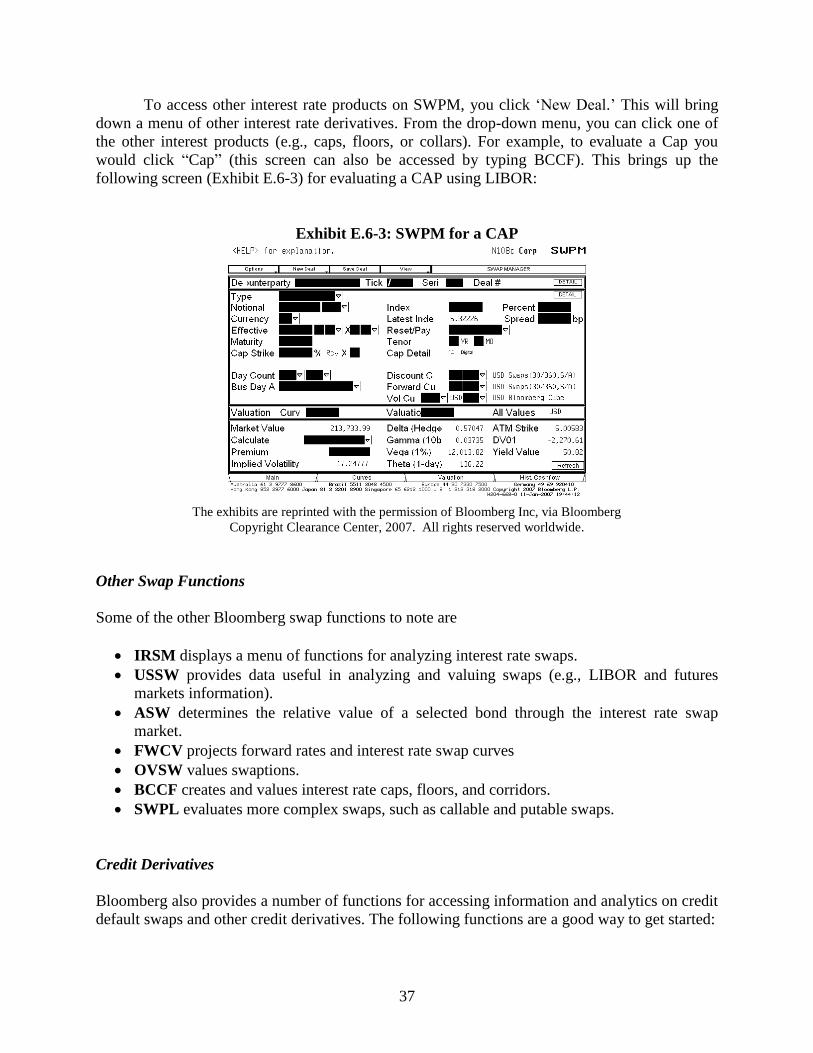
To access other interest rate products on SWPM, you click „New Deal.‟ This will bring
down a menu of other interest rate derivatives. From the drop-down menu, you can click one of
the other interest products (e.g., caps, floors, or collars). For example, to evaluate a Cap you
would click “Cap” (this screen can also be accessed by typing BCCF). This brings up the
following screen (Exhibit E.6-3) for evaluating a CAP using LIBOR:
Exhibit E.6-3: SWPM for a CAP
The exhibits are reprinted with the permission of Bloomberg Inc, via Bloomberg
Copyright Clearance Center, 2007. All rights reserved worldwide.
Other Swap Functions
Some of the other Bloomberg swap functions to note are
IRSM displays a menu of functions for analyzing interest rate swaps.
USSW provides data useful in analyzing and valuing swaps (e.g., LIBOR and futures
markets information).
ASW determines the relative value of a selected bond through the interest rate swap
market.
FWCV projects forward rates and interest rate swap curves
OVSW values swaptions.
BCCF creates and values interest rate caps, floors, and corridors.
SWPL evaluates more complex swaps, such as callable and putable swaps.
Credit Derivatives
Bloomberg also provides a number of functions for accessing information and analytics on credit
default swaps and other credit derivatives. The following functions are a good way to get started:
38
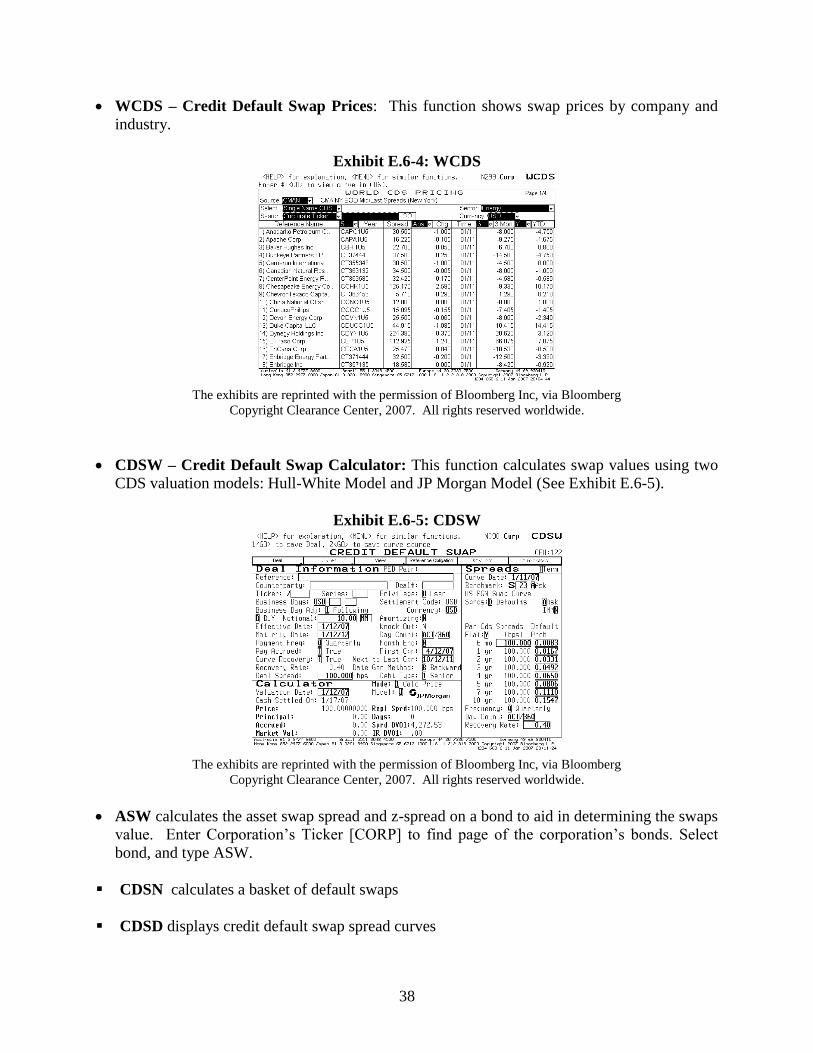
WCDS – Credit Default Swap Prices: This function shows swap prices by company and
industry.
Exhibit E.6-4: WCDS
The exhibits are reprinted with the permission of Bloomberg Inc, via Bloomberg
Copyright Clearance Center, 2007. All rights reserved worldwide.
CDSW – Credit Default Swap Calculator: This function calculates swap values using two
CDS valuation models: Hull-White Model and JP Morgan Model (See Exhibit E.6-5).
Exhibit E.6-5: CDSW
The exhibits are reprinted with the permission of Bloomberg Inc, via Bloomberg
Copyright Clearance Center, 2007. All rights reserved worldwide.
ASW calculates the asset swap spread and z-spread on a bond to aid in determining the swaps
value. Enter Corporation‟s Ticker [CORP] to find page of the corporation‟s bonds. Select
bond, and type ASW.
CDSN calculates a basket of default swaps
CDSD displays credit default swap spread curves
39
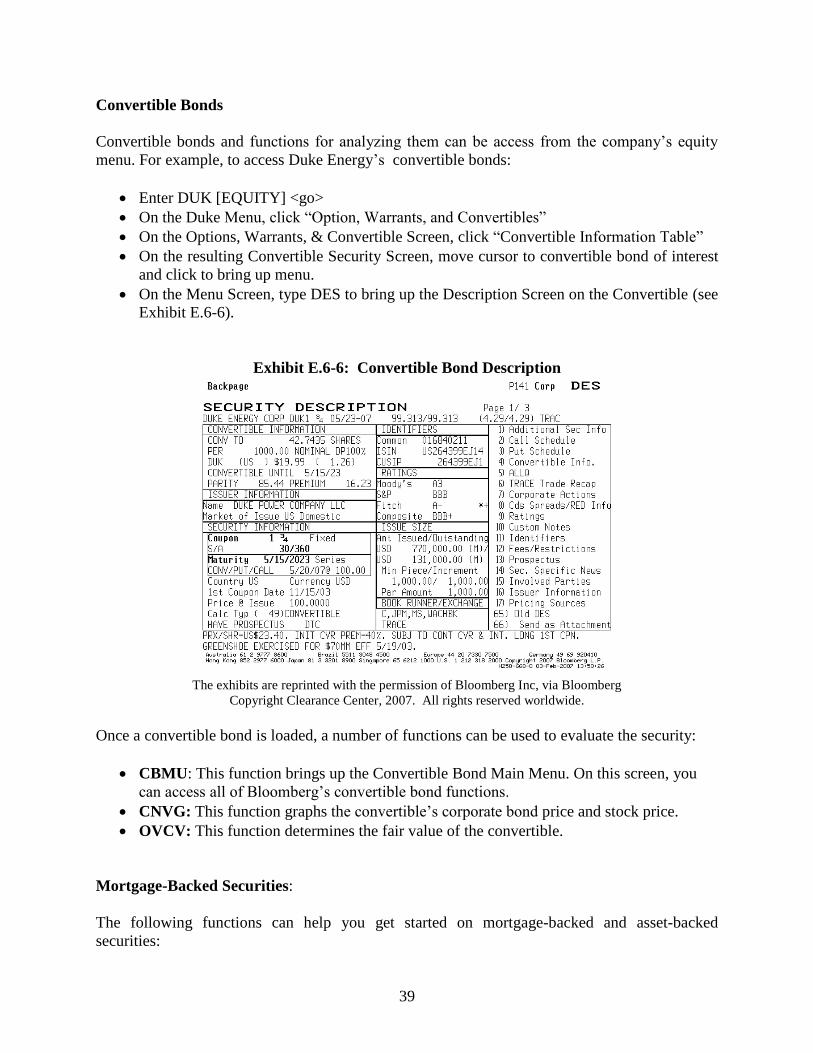
Convertible Bonds
Convertible bonds and functions for analyzing them can be access from the company‟s equity
menu. For example, to access Duke Energy‟s convertible bonds:
Enter DUK [EQUITY] <go>
On the Duke Menu, click “Option, Warrants, and Convertibles”
On the Options, Warrants, & Convertible Screen, click “Convertible Information Table”
On the resulting Convertible Security Screen, move cursor to convertible bond of interest
and click to bring up menu.
On the Menu Screen, type DES to bring up the Description Screen on the Convertible (see
Exhibit E.6-6).
Exhibit E.6-6: Convertible Bond Description
The exhibits are reprinted with the permission of Bloomberg Inc, via Bloomberg
Copyright Clearance Center, 2007. All rights reserved worldwide.
Once a convertible bond is loaded, a number of functions can be used to evaluate the security:
CBMU: This function brings up the Convertible Bond Main Menu. On this screen, you
can access all of Bloomberg‟s convertible bond functions.
CNVG: This function graphs the convertible‟s corporate bond price and stock price.
OVCV: This function determines the fair value of the convertible.
Mortgage-Backed Securities:
The following functions can help you get started on mortgage-backed and asset-backed
securities:
40
1. To look up specific agency MBS:
FHLMC (Freddie Mac Securities): Enter FHR [MTGE] <go>
GNMA: GNR [MTGE] <go>
FNMA: FNR [MTGE] <go>
2. For an agency MBS finder, enter [MTGE] MAX
3. Useful MBS functions:
[MTGE] CLAS – Glossary of CMO Class Types
YT – Yield table
CFG – Cash Flow Graph
WALG – Weighted Average Life Graph
CLC – Collateral Composition
CPH - Historical prepayments
CLC – Collateral information
VALL displays a table of dealer prepayment assumptions
PVG shows chart of prepayment model available on Bloomberg
DV displays prepayment model based on your select scenarios
YT values a mortgage or asset-backed security given different assumptions.
E.7 OTHER USEFUL BLOOMBERG FUNCTIONS
Information and analytical functions on all of the derivatives examined in this text can be
accessed from the Bloomberg system. Below are a number of other Bloomberg functions that
can be used for evaluating derivatives, the derivative‟s underlying asset, or a portfolio.
1. YAS estimates interest rate risk and hedge ratios need to hedge selected securities.
2. PSA creates a report forecasting the portfolio performance based interest rate and
exchange rate scenarios.
3. PTED calculates the spread between a corporate and government security and the
corresponding Eurodollar futures strip for a selected portfolio.
4. OPSF takes portfolio created in PRTU and allows you to load a program with options
and evaluate the portfolio for selected scenarios.
5. VOL compares historical volatilities with implied volatilities.
6. HRH displays a historical return histogram for a selected security.
7. HVT shows historical price or yield volatility for a selected security.
8. FRD calculates forward exchange rates.
41
9. FWCV projects forward interest rates and forward swaps rates.
10. BTMM monitors major rates and economic information for selected countries.
11. WEIF displays World Equity Index Futures.
12. WBF displays World Bond Futures.
13. WIR displays World Interest Rate Futures.
14. GLCO displays Global Commodity Prices. (The Commodity screen does not show
futures exclusively, so be sure to select the correct security.)
15. PSFX creates and evaluates currency swap positions.
16. IYC displays information on yield curves for different countries.
42
BLOOMBERG DERIVATIVE EXERCISES USING BLOOMBERG
CHAPTER 1: OPTION CONCEPTS AND FUNDAMENTAL STRATEGIES
1. Select a stock of interest and identify the exchange-traded options traded on it.
Example: Options on IBM
Enter IBM [EQUITY]
On IBM Menu, click “Option, Warrants, and Convertibles”
Click OMON
Alternative: Enter IBM [EQUITY] OMON
For a display example of the OMON Screen, see Exhibit E.2-1.
2. Examine the contracts traded on the Chicago Board of Trade.
Type CEM to bring up “Contract Exchange Menu”
On Contract Exchange Menu, click CBT
For display examples of the CEM and CBT Screens, see Exhibits E.4-15 and E.4-16.
3. Examine the contracts traded on the Chicago Board of Options Exchange
Type CEM to bring up “Contract Exchange Menu”
On Contract Exchange Menu, click CBO
4. Examine the contracts traded on the Chicago Mercantile Exchange
Type CEM to bring up “Contract Exchange Menu”
On Contract Exchange Menu, click CME
CHAPTER 2: THE OPTION MARKET
1. Determine the recent prices and option details on an exchange option on a particular stock.
Example: Information on options on IBM
Enter IBM [EQUITY] OMON
Set cursor on option of interest and left quick (use contract month key to see option by
expiration)
On resulting menu, access the following functions: DES, QRM, TSM, and GPO
For a display example of the IBM Description Screen, see Exhibit E.2-1.
2. Determine the most actively traded options on a particular stock.
Example: Enter IBM [EQUITY] OMST
43
For a display example of the OMST Screen for most actively traded options, see Exhibit E.2-
9.
3. Determine the most actively traded stock options on a particular exchange.
Example: Most active stock options
Press [EQUITY]
Press Derivative
Click MOSO function
Alternative: Enter [EQUITY] MOSO
For a display example of the MOSO Screen, see Exhibit E.2-18.
4. Determine the recent prices and option details on an index.
Example: Information on options on the SP 100
Enter: OEX [INDEX] OMON
Set cursor on option of interest and left quick
On resulting menu, access the following functions: DES, QRM, TSM, and GPO
5. Determine the most actively traded options on a particular index.
Example: Enter OEX [INDEX] OMST
6. Determine the recent prices and option details for exchange-traded options on a spot
currency.
Example: British Pound
Type CTM
Click “Spot Currency Options”
Click British Pound and OMON
For a display example of the OMON Screen for British Pound, see Exhibit E.3-5.
Example: British pound options on Philadelphia Exchange
Type FCO and then select British Pound to bring up OMON screen on British Pound
options traded on PHLX
Set cursor on option of interest and left quick
On resulting menu access the following functions: DES, QRM, TSM, and GPO
7. Determine the most actively traded PHLX options on a currency.
Example: PHLX British pound options
Type FCO and then select British Pound to bring up OMON screen on British Pound
options traded on PHLX
Type OMST
44
CHAPTER 3: OPTION STRATEGIES
1. Select an exchange call and put option on a company and evaluate the following option
strategies with a profit table and graph using the Bloomberg OSA function: call purchase, put
purchase, straddle purchase, straddle sale, synthetic long position, or synthetic short position.
Example: Construct a profit table and graph for options on IBM
Enter IBM [EQUITY] OSA; on the OSA screen enter stock position (if any) and then
click “Add Options” to identify IBM options (remember the standard size on a stock
option contract is 100 options)
Input positions; after loading, type 1 and press <go>
Click “Graph” to see position
For a display example of the OSA Screens for IBM, see Exhibits E.2-2 and E.2-3. For an
example of the profit graph and table for a straddle purchase formed with IBM options, see
Exhibits E.2-4.
2. Find the latest news and financial information about the stock you selected in Question 1.
Example: To access news and information on IBM:
Enter IBM [EQUITY]
From the menu, click the functions of interests
3. Select an exchange call and put option on an index and evaluate the following option
strategies with a profit table and graph using the Bloomberg OSA function: call purchase, put
purchase, straddle purchase, straddle sale, synthetic long position, or synthetic short position.
Example: Profit table and graph for options on S&P 500:
Enter SPX [INDEX] OSA
On the OSA screen enter index position (if any) and then click “Add Options” to identify
S&P 500 options
Input positions; after loading, type 1 and press <go>
Click “Graph” to see position
4. Evaluate a portfolio insurance strategy using OSA. Assume your portfolio is correlated with
the S&P 500 and select S&P 500 put option contracts expiring at or near the future date you
want to evaluate your portfolio. In using OSA to construct a profit table, select positions on
the index that best match the value for your portfolio (e.g., 1,000 for a portfolio worth 1,000
hypothetical shares of the index times the index value). In determining the number of put
options on the S&P 500 needed to hedge your index portfolio, remember the S&P 500 spot
options have a 100 multiplier.
Enter SPX [INDEX] OSA
On the OSA screen enter index position (e.g., 1000)
Click “Add Options” to input put positions (10 puts (given 100 multiplier) with expiration
near portfolio liquidation date
45
After loading, type 1 and press <go>
Click “Graph” to see position.
Click “Graph” on Graph Screen to bring up a menu; select “Market Value”
CHAPTER 4: FUNDAMENTAL OPTION PRICE RELATIONS
1. Select several exchange-traded call and put options on a stock, currency or index from
Bloomberg‟s OMON. Given the option prices, determine if they satisfy some of the
boundary conditions presented in Chapter 4. Note: The stock options that you select are
likely to pay a dividend that needs to be incorporated in the boundary conditions. To avoid
the complications of dividend payments, you may want to look for options that expire in the
near term.
Example: IBM, enter IBM [EQUITY] OMON
CHAPTER 5: THE BINOMIAL OPTION PRICING MODEL
1. Estimate the binomial (trinomial) price of call and put options on a selected stock using the
Bloomberg OV function. Examine the model‟s call and put values and stock price curve
generated from Bloomberg. In valuing your option, try to select an option on a stock that is
not expected to go ex-dividend during the option‟s expiration period. You may want to select
an option with a short expiration period. Use either Bloomberg defaulted values for the
stock‟s volatility and risk-free rate or input your own.
Example: Binomial OPM values on IBM call and put options. To access and value options on
IBM:
Enter IBM [EQUITY] OMON
Set cursor on option of interest (select near-term option) and left quick OV.
On the OV screen, select Trinomial; on dividend screen, select discrete dividends and
check to make sure the stock has no future dividend during the life of the option (if so
select another one or set dividend to zero); on OV screen you can change the volatility or
keep the defaulted one.
Press <help> for information on the OV program‟s defaults
For an example of the OV Screen for an IBM option using the trinomial model, see Exhibit
E.2-7.
2. Using the „Binomial Option Pricing Model‟ Excel Program, determine the price of the call and
put on the stock given the information on the options provided by Bloomberg (make the
number of subperiods at least 30). Compare your Excel BOPM value to the Bloomberg‟s
trinomial model value.
3. Using the Bloomberg historical volatility function (HVG), identify the historical volatility on
the stock you selected in Question 1.
46
Example: To access options on IBM, enter IBM [EQUITY] OMON; type HVG.
For a display example of the HVG Screen, see Exhibit E.4-20.
4. Use Bloomberg‟s BTMM function to determine the risk-free rate for BOPM: Type BTMM.
CHAPTER 6: THE BINOMIAL PRICING OF OPTIONS ON
DIVIDEND-PAYING STOCKS AND STOCK INDICES
1. Estimate the binomial (trinomial) price of call and put options on a selected stock expected to
pay dividends using the Bloomberg OV function. Examine the model‟s call and put values
and stock price curve generated from Bloomberg. Select an option with some time to
expiration to ensure the stock will pay future dividends. Use either Bloomberg defaulted
values for the stock‟s volatility, risk-free rate, and dividends or input your own.
Example: Binomial OPM Value on IBM call and put options. To access options on IBM:
Enter IBM [EQUITY] OMON
Set cursor on option of interest (select a longer term option) and left quick OV.
On the OV screen, select Trinomial; on dividend screen, select discrete dividends; on OV
screen you can change the volatility or keep the defaulted one (type help for information
on program‟s defaults).
For an example of the OV Screen for an IBM option using the trinomial model, see Exhibit
E.2-7.
2. Using the „Known-Dividend Payment Binomial Model‟ Excel Program, determine the price of
the call and put on the stock you selected in 1 given the information provided by Bloomberg
on the options and the underlying stock‟s dividend payments and ex-dividend dates.
Compare your Excel BOPM values to Bloomberg‟s trinomial model‟s values.
3. Estimate the binomial (trinomial) price of a call or put option on a stock index using the
Bloomberg OV function. Examine the model‟s option value and stock price curve generated
from Bloomberg. Use either Bloomberg‟s defaulted values for the stock‟s historical
volatility, risk-free rate, and dividend yield or input your own.
Example: Binomial OPM Value on S&P 500 call and put. To access options on S&P 500:
Enter SPX [INDEX] OMON
Set cursor on option of interest and left quick OV
On the OV screen, select Trinomial; on dividend screen, input dividend flow; on OV
screen you can change the volatility or keep the defaulted one (type help for information
on program‟s defaults).
For an example of the OV Screen for an S&P 500 spot index option using the trinomial
model, see Exhibit E.3-3.
47
4. Using the Bloomberg historical volatility function, identify the historical volatility of the
stock index you selected in Question 3.
Example: S&P 500, enter SPX [INDEX] OMON; type HVG.
CHAPTER 7: THE BINOMIAL PRICING OF
OPTIONS ON CURRENCIES AND BONDS
1. Using the Binomial Model Excel Program, determine the prices of a call and put on an
exchange-traded spot currency option. Find information on the options and BOPM inputs
using Bloomberg: OMON to select option; DES to obtain information; HVG to find
historical volatility; BTMM to find U.S. and foreign interest rate.
Example: Binomial OPM value of a British pound call or put option. To access PHLX
options on the British pounds:
Type FCO <go>
Select British Pound to bring up OMON Screen.
Set cursor on option of interest and left quick DES
On DES Screen, you will find current price (Spot $/BP), option exercise price, option
expiration, and market price of the option.
Type HVG to access graph and table of historical volatility
Type BTMM to find U.S. rates and United Kingdom rates
Input information in Binomial Model Excel Program to determine the binomial value of
the option
CHAPTER 8: THE BLACK-SCHOLES OPTION PRICING MODEL
1. Estimate the Black-Scholes values of call and put options on a selected stock using the
Bloomberg OV function. Examine the model‟s option value and stock price curve generated
from Bloomberg‟s OV function. Examine the option‟s Greeks: delta, theta, gamma, vega and
rho. Use either Bloomberg‟s defaulted values for the stock‟s historical volatility, risk-free
rate, and dividend yield or input your own.
Example: Black-Scholes OPM values on IBM call and put. To access options on IBM:
Enter IBM [EQUITY] OMON
Set cursor on option of interest and left click OV
On the OV screen, select Black-Scholes; on dividend screen, select dividend yield; on OV
screen you can change the volatility or keep the defaulted one.
For a display example of the OV Screen valuing IBM options using the Black-Scholes
model, see Exhibit E.2-6.
2. Using the Black-Scholes Excel Program, determine the price of the call and put options on the
48
stock you selected in Question 1 using the option information from Bloomberg‟s OV Screen
on the options. Compare your Excel and Bloomberg B-S values.
3. Using Bloomberg‟s SKEW function, examine the volatility smile on the stock you selected in
Question 1 given different expirations. Identify the implied volatility that best relates to the
option you selected in Question 1.
Example: Volatility Smile for IBM:
Enter IBM [EQUITY] SKEW
On SKEW Graph Screen, identity volatility with expiration and exercise price closest to
the expiration and exercise price on the option you selected in question 1.
For a display example of the SKEW Screen for IBM, see Exhibit E.2-17.
4. Estimate the Black-Scholes values of call and put options on an index using the Bloomberg
OV function. Examine the option‟s Greeks: delta, theta, gamma, vega and rho. Use either
Bloomberg‟s defaulted values for the index‟s historical volatility, U.S. risk-free rate, and
dividend yield or input your own.
Example: B-S OPM values on S&P 500 call and put. To access options on S&P 500:
Enter SPX [INDEX] OMON
Set cursor on option of interest and left click OV
On resulting menu click OV
On the OV screen, select Black-Scholes; on dividend screen, select dividend yield; on OV
screen you can change the volatility or keep the defaulted one (type help for information
on program‟s defaults).
5. Using Bloomberg‟s SKEW function, examine the volatility smile on the index you selected
in Question 4 for different expirations. Identify the implied volatility that best relates to the
index option you selected in Question 4.
Example: Volatility smile for S&P 500:
Enter SPX [INDEX] SKEW
On SKEW Graph Screen, identity volatility with expiration and exercise price closest to
the expiration and exercise price on the option you selected in Question 4.
CHAPTER 9: EMPIRICAL TESTS, APPLICATIONS OF THE
OPTION PRICING MODEL AND EXOTIC OPTIONS
1. Select exchange call and put options on a stock and evaluate the following option strategies
for different holding periods with a profit table and graph using the Bloomberg OSA
function: call purchase, put purchase, straddle purchase, straddle sale, synthetic long position,
or synthetic short position.

49
Example: Construct a profit table for options on IBM for different holding periods
Enter IBM [EQUITY] OSA; on the OSA screen enter stock position (if any) and then
click “Add Options” to identify IBM options
Input positions; after loading, type 1 and press <go>
Click “Graph” to see position.
On graph select different evaluation dates (Eval Dates)
Press <Help> for information on the OSA
For a display example of the OSA Screens for IBM, see Exhibits E.2-2 and E.2-3. For an
example of the profit graph and table with different evaluation periods for a straddle purchase
formed with IBM options, see Exhibits E.2-4.
2. Generate a profit graph and table for a calendar call or put spread using the Bloomberg OSA
function.
Example: Construct a profit table for a calendar spread on IBM for different holding periods:
Enter IBM [EQUITY] OSA
On the OSA screen click “Add Options” to identify IBM options
Select call (or put) options with different expirations
After loading, type 1 and press <go>
Click “Graph” to see position. On graph select different evaluation dates (Eval Dates)
Press <Help> for information on the OSA
3. Using the Bloomberg OV function find the delta, theta, gamma, vega and rho values for call
and put options on a selected stock. On the OV graph, examine the Greeks (delta, gamma,
and vega) values for different stock prices. Use either Black-Scholes or the Trinomial model
and either keep Bloomberg‟s default values for the stock‟s volatility, risk-free rate, and
dividend yield (or dividends for Trinomial) or input your own.
Example: Black-Scholes Greek values on IBM call and put options. To access options on
IBM:
Enter IBM [EQUITY] OMON
Set cursor on option of interest and left click.
On resulting menu click OV. On the OV screen, select Black-Scholes; on dividend screen,
select dividend yield or dividends; on OV screen you can change the volatility or keep the
defaulted one.
On the graph screen (page 2 on OV Screen), change Y-axis: option price, delta, gamma,
and vega.
For a display example of the OSA Screen showing the Gamma Graph for IBM, see Exhibit
E.2-8.
4. Using the Bloomberg Exotic Option Valuation function, OVX, find the values, Greeks, and
other information for the following exotic options formed with a selected stock or index:

50
Chooser Option
Compound
Binary option: Cash or nothing or asset or nothing
Lookback
Asian
Use Bloomberg defaulted values for the stock‟s historical volatility, risk-free rate, and
dividend yield or input your own.
Example: Exotic option values for IBM options. To access options on IBM:
Enter IBM [EQUITY] OMON
On the OMON Screen, type OVX
On the OVX Menu Screen, select exotic option: Chooser Option, Compound, Binary
(Digital) option, Lookback, and Asian.
For a display example of the OVX Screen and the OVX Screen for a chooser option formed with
IBM options, see Exhibit E.2-12.
CHAPTER 10: FUTURES AND FORWARD CONTRACTS
1. Find descriptions, recent prices, outstanding contracts, and other information on an
exchange-traded commodity futures contract: agriculture and livestock, energy and
environment, and metals and industrials.
Example: Wheat futures contract information:
Type CTM to bring up “Contract Table Menu”
Click WHET (Wheat)
On Wheat screen, type the number of the contract of interest or move your cursor to
that contract and click
Click CT to bring up the “Contract Table” and type DES
For specific contract:
On “Contract Table,” set cursor on contract of interest and left click to bring up menu.
Click “Contract Information” and then “Description”
On Description Screen, click “Related Function”: FHG (Futures History Graph) and
EXS (expiration schedule)
Alternative: Type ticker or identifier with „a‟ and [CMDTY]. For crude oil futures listed on
the New York Mercantile Exchange (NYMEX):
NGa [CMDTY]
Click “Contract Information”
Click Description
For a display example of the CTM Screen, see Exhibit E.4-1; for a display example of a wheat
futures contracts on CBT, see E.4-9; for an example of the Description Screen for a specific

51
wheat futures contract, see Exhibit E.4-10.
2. Find descriptions, recent prices, outstanding contracts, and other information on different
types of exchange-traded financial futures contracts.
Example: S&P 500 futures contract information:
Type CTM to bring up “Contract Table Menu”
Click “Equity Index” (24)
On Equity Index Screen, page down to find the contract of interest and click
Click CT to bring up the “Contract Table” and type DES
For specific contract:
On “Contract Table,” set cursor on contract of interest and left click to bring up menu
Click “Contract Information” and then “Description”
On Description Screen, click “Related Function”: FHG (Futures History Graph), EXS
(expiration schedule), and FVD (fair value detail)
Alternative: Type ticker or identifier with „a‟ and press [INDEX]. For S&P 500 futures
contracts:
SPa [INDEX]
Click “Contract Information” and then “Description”
For a display example of equity index futures contracts from CTM, see E.4-2; for a display
example of S&P 500 futures contracts, see E.4-3; for an example of the Description Screen for a
specific S&P 500 futures contract, see Exhibit E.4-4.
3. Find descriptions, recent prices, outstanding contracts, and other information on an
exchange-traded interest rate futures contracts.
Example: Three-Month Eurodollar futures listed on the CME
Type CTM to bring up “Contract Table Menu”
Click INTR (Interest Rate)
On INTR screen, page down to the contract of interest (EDA) and click
Click CT to bring up the “Contract Table”
On “Contract Table,” set cursor on contract of interest and left click to bring up menu
Click “Contract Information” and “Description”
4. Find descriptions, recent prices, outstanding contracts, and other information on different
types of exchange-traded currency futures contracts.
Example: British pound futures contract information:
Type CTM to bring up “Contract Table Menu”
Click CURR (18)
On CURR Screen, page down to the contract of interest (British Pound) and click
Click CT to bring up the “Contract Table” and type DES
For specific contract:
52
On “Contract Table,” set cursor on contract of interest and left click to bring up menu.
Click “Contract Information and then “Description”
On Description Screen, click a function from “Related Functions”
Alternative: Type ticker or identifier with „a‟ and [CMDTY]. For British pound:
GBPa [CRNCY]
Click “Contract Information and then “Description
5. Find recent bid and ask rates on spot and forward rates on specific currency.
Example: British pound futures spot and forward contracts bid and ask rates:
Enter GBP [CRNCY] BBC
6. Find the number of T-bonds or T-notes that can delivered on a selected T-bond or T-note
futures contract and identify the cheapest
Example: 5-year T-Note
Type CTM to bring up “Contract Table Menu”
Click BOND (16)
On BOND screen, page down to find the contract of interest and then click (e.g., US
Treasury Note, 5 Yr (FVA))
Click CT to bring up the “Contract Table”
On “Contract Table,” set cursor on contract of interest and left click to bring up menu
Click “Contract Information” and then “Description”
On description page, click DLV (Cheapest to Deliver)
Alternative: Type ticker or identifier with „a‟ and [CMDTY]. For 5-year Treasury notes:
FVa [CMDTY]
Click “Contract Information” and then “Description”
On Description Screen, click DLV from “Related Functions”
Alternative: Access futures exchange. For 5-year Treasury notes:
Type CEM
Click CBT (Chicago Board of Trade)
Page down to find US Treasury Note, 5 Yr (FVA) and click
Click CT
Type DLV
For a display example of the DLV Screen showing cheapest to deliver bonds, see Exhibit
E.4-23.
7. Examine the prices on global commodity prices; type GLCO.
CHAPTER 11: PRCING FUTURES AND FORWARD CONTRACTS
53
1. Using Bloomberg‟s FVD (Fair Value Detail) function, find the fair value and carrying
cost value (Theo Value) on an exchange-traded stock index futures contract.
Example: S&P 500 futures contract information:
Enter SPa [INDEX]
Click “Contract Information” and then Description
Click FVD under Related Functions
For a display example of the FVD Screen for S&P 500 futures contract, see Exhibit E.4-5.
2. Access Bloomberg information on a currency futures contracts and U.S. and foreign
interest rates and then determine the equilibrium price on a currency futures contract
using the interest rate parity model. Compare the equilibrium price to the market price.
Example: Equilibrium price of British pound
For information to calculate the interest rate parity value for a British pound futures contract:
Type CTM to bring up “Contract Table Menu”
Click CURR (18)
On CURR screen, page down to the contract of interest (British Pound)) and click
Click CT to bring up the “Contract Table” and type DES
On “Contract Table,” set cursor on contract of interest and left click to bring up menu:
Click “Contract Information” and then “Description”
Find current futures price, expiration (EXS), and current spot exchange rate (TKC).
For country interest rates information, type BTMM
3. Access Bloomberg information on Eurodollar futures contracts and U.S. interest rates and
then determine the equilibrium price on a Eurodollar futures contract using the carrying
cost model. Compare the equilibrium price to the market price.
Example: Three-Month Eurodollar futures listed on the CME
For information:
Type CTM to bring up “Contract Table Menu”
Click INTR (Interest Rate)
On INTR screen, page down to the contract of interest and click
Click CT to bring up the “Contract Table”
On “Contract Table,” set cursor on contract of interest and left click to bring up menu
Click “Contract Information” and “Description”
On Description Screen (or Contract Table) find the futures‟ price and expiation
For interest rate information (e.g., LIBOR), type BTMM
CHAPTER 12: OPTIONS ON FUTURES CONTRACTS
1. Find descriptions, recent prices, outstanding contracts, historical implied volatility, volatility
smile, and other information on an exchange-traded commodity futures option contract:
agriculture and livestock, energy and environment, and metals and industrials.
54
Example: Wheat futures option contract:
Type CTM to bring up “Contract Table Menu”
Click WHET (Wheat)
On Wheat CTM screen, page down to the contract of interest and click
Click OMON to bring up the “Option Contract Table”
On “Option Contract Table,” set cursor on contract of interest and left click DES
On Description Screen, click some of the functions from “Related Function” menu
Type HVG for historical volatility
Type SKEW for volatility smile.
Alternative: Type ticker or identifier with „a‟, press [CMDTY], and type OMON. For crude
oil:
Enter: CLa [CMDTY] OMON
On “Option Contract Table,” set cursor on contract of interest and left click DES
For a display example of the CTM Screen, see Exhibit E.4-1; for a display example of futures
and futures option contracts on the Wheat CTM Screen, see Exhibit E.4-8; for example of
Description Screen on a wheat futures option contract, see Exhibit E.4-11.
2. Find descriptions, recent prices, outstanding contracts, and other information on different
types of exchange-traded financial futures contracts.
Example: S&P 500 futures option contract information:
Type CTM to bring up “Contract Table Menu”
Click “Equity Index” (24)
On Equity Index Screen, page down to the contract of interest (SPA) and click
Click OMON to bring up the “Options Contract Table”
On “Option Contract Table,” set cursor on contract of interest and left click DES
On Description Screen, click some of the functions from “Related Function” menu
Type HVG for historical volatility
Type SKEW for volatility smile
Alternative: Type ticker or identifier with „a‟, press [INDEX], type OMON. For S&P 500
futures contracts:
SPa [INDEX] OMON
On “Option Contract Table,” set cursor on contract of interest and left click DES
For a display example of the CTM Screen, see Exhibit E.4-1; for a display example of futures
and futures option contracts on Equity Index CTM Screen (futures options are in gray), see
Exhibit E.4-3; for an example of HVG Volatility Graph on S&P 500, see Exhibit E.4-20; for an
example of HIVG graph, see Exhibit E.4-21.
3. Find descriptions, recent prices, outstanding contracts, and other information on different
types of exchange-traded currency futures contracts.
55
Example: British pound futures contract information:
Type CTM to bring up “Contract Table Menu”
Click CURR
On CURR screen, page down to the contract of interest and click
Click OMON to bring up the “Options Contract Table”
On “Option Contract Table,” set cursor on contract of interest and left click DES
On Description Screen, click some of the functions from “Related Function” menu
Type SKEW for volatility smile
Alternative: Type ticker or identifier with „a‟, press [CMDTY], type OMON. For British
pound:
GBPa [CRNCY] OMON
Click contract of interest
4. Estimate the Black-Scholes Option Model values of call and put options on a commodity
futures contract using the Bloomberg OV function. Examine the futures option‟s Greeks:
delta, theta, gamma, vega and rho. Use either Bloomberg defaulted model input values or
input your own.
Example: Black-Scholes OPM values on wheat futures call and put options:
Type CTM to bring up “Contract Table Menu”
Click WHET (wheat)
Click OMON to bring up the “Options Contract Table”
On “Option Contract Table,” set cursor on contract of interest and left click OV to
bring up option value screen
For a display example of the OV Screen for a wheat futures option, see Exhibit E.4-13.
5. Using the “Black Futures Option Excel Program”, determine the prices on call and put
commodity futures options you selected in Question 4. Compare your Excel Black futures
option values to the Bloomberg B-S values.
6. Using Bloomberg‟s OV function, determine the values of the call and put options on a
currency futures contract.
Example: OPM value of call and put options on British pound futures:
Type CTM to bring up “Contract Table Menu”
Click CURR
Click OMON to bring up the “Options Contract Table”
On “Option Contract Table,” set cursor on contract of interest and left click OV to
bring up option value screen.
7. Using the “Black Futures Option Excel Program”, determine the prices on the call and put
currency futures option contracts you selected in Question 6. Compare your Excel Black
futures option values to the Bloomberg B-S values.
56
8. Select an exchange-traded futures and futures options on either a commodity or financial
futures contract and evaluate the following futures and futures option strategies with a profit
table and graph using the Bloomberg OSA function: call purchase, put purchase, straddle
purchase, straddle sale, synthetic long position, or synthetic short position.
Example: To construct a profit table for S&P 500 futures and futures options:
Type CTM to bring up “Contract Table Menu”
Click “Equity Index”
On Equity Index Screen, page down to contract of interest (S&P 500 futures, SPA) and
click
Click CT, Contract Table
On CT Screen, type OSA
On the OSA Screen enter futures position (if any) and then click “Add Options” to
identify futures options
Input futures option positions; after loading, type 1 and press <go>
Click “Graph” to see position.
For a display example of the OSA Screen for S&P 500 futures, see Exhibit E.4-6.
CHAPTER 13: MANAGING EQUITY POSITIONS WITH
STOCK INDEX DERIVATIVES
1. Using the HEDG function, calculate the number of futures contracts needed to hedge the
systematic risk of a selected stock.
Example: IBM
Enter: IBM [EQUITY] HEDG
For a display example of the HEDG Screen for IBM, see Exhibit E.4-25.
2. Set up an equity portfolio consisting of at least four stocks using PRTU. Given the portfolio‟s
market value and average beta, determine the number of S&P 500 futures contracts needed to
hedge the portfolio‟s position at a specified future date (select a futures contract expiring
closest to that date).
Example: Construct Energy Stock Portfolio (see Section E.5) and determine the number of
S&P 500 futures contracts needed to hedge the portfolio.
To construct portfolio:
Type PRTU
On PRTU Screen, click “Create New” button
Input information
Hit Menu
Type PER and 1 <go>
57
Type RPT
From RPT Screen, find portfolio beta and market value
For other information on your portfolio, type PMEN to access a menu of functions
For display examples of the PRTU and RPT Screens for forming the Energy Stock Portfolio,
see Exhibits E.5-1 and E.5-2. Note: On the RPT Screen, the Energy Stock Portfolio Value is
$291,070 and the portfolio‟s Beta is1.27
To access information on S&P 500 futures:
Enter SPa [INDEX] CT
Click contract with expiration closest to specified futures date
Use price sensitivity model, to determine number of futures contracts.
3. For the stocks in the equity portfolio you formed using PRTU in Question 2, construct and
evaluate put-insured positions on some of the stocks in your portfolio using OPSA/OSA
function.
Example: Construct Energy Stock Portfolio (See Section E.5).
Type PRTU
On PRTU Screen, click the name of the portfolio you constructed in Question 2.
Type PMEN to access menu of functions and click “Equity Analytics”
On the Equity Analytics Screen, access the option scenario screen (OPSA/OSA)
On the OSA Screen, press amber “Source” key and then “Portfolio” to find your portfolio
in PRTU, and then click your portfolio
Click “Add Options” to input option positions for selected stocks
Click “Graph” to see profit table and graph for each hedged stock position
For display examples of the OPSA Screen and profit table on the Energy Stock Portfolio, see
Exhibits E.5-4 and E.5-5.
CHAPTER 14: MANAGING FOREIGN CURRENCY POSITIONS WITH DERIVATIVES
1. Examine current spot, forward, and cross exchange rates for 11 key currencies using
Bloomberg‟s FXC function.
Example: Enter [CRNCY] FXC
For display example of the FXC Screen, see Exhibit E.4-27.
2. Find the current spot and forward rates on a selected currency using Bloomberg‟s BQ
function:
Example: For British pound, enter GBP [CRNCY] BQ
58
For display example of the BQ Screen, see Exhibit E.4-28.
CHAPTER 15: MANAGING FIXED-INCOME POSITIONS
WITH INTEREST-RATE DERIVATIVES
1. Find descriptions, recent prices, outstanding contracts, and other information on different
types of exchange-traded interest rate futures and futures option contracts.
Example: T-Bond futures and futures option contracts
Type CTM to bring up “Contract Table Menu”
Click “BOND”
On Bond Screen, page down to the contract of interest and click
Click CT to bring up the futures contracts and OMON to bring up the “Options
Contract Table”
On option table or contract table, set cursor on contract of interest and left click to
bring up menu
Click “Contract Information” and then “Description”
On Description Screen, click some of the function from “Related Function” menu.
For T-Bond or T-Note contracts, click DLV to find cheapest to deliver bond
Type HIVG for historical implied volatility
Type SKEW for volatility smile
For a display example of the CTM Screen, see Exhibit E.4-1; for an example of a Description
Screen for a T-Bond futures contract, see E.4-18; for an example of HIVG graph, see Exhibit
E.4-21; for an example of DLV Screen, see Exhibit E.4-23.
2. Select an exchange-traded futures and futures option on a T-bond or T-note and evaluate the
following futures option strategies with a profit table and graph using the Bloomberg OSA
function: call purchase, put purchase, straddle purchase, straddle sale, synthetic long position,
or synthetic short position.
Example: To construct a profit table for T-note futures and futures options:
Type CTM to bring up “Contract Table Menu”
Click “Bond”
On Bond Index Screen, page down to the contract of interest and click (e.g., 5-year T-
note, FVA)
Click CT
Type OSA
On the OSA screen enter futures position (if any) and then click “Add Options” to identify
futures options
Input positions; after loading, type 1 and press <go>
Click “Graph” to see position
59
3. Select an exchange-traded futures and futures option on an interest rate contract and evaluate
the following futures option strategies with a profit table and graph using the Bloomberg
OSA function: call purchase, put purchase, straddle purchase, straddle sale, synthetic long
position, or synthetic short position.
Example: To construct a profit table for Eurodollar futures and futures options:
Type CTM to bring up “Contract Table Menu”
Click “Interest Rate”
On Interest Rate Screen, page down to the contract of interest and click (e.g., Eurodollar,
three month, CME)
Click CT
Type OSA
On the OSA screen enter futures position (if any) and then click “Add Options” to identify
futures options
Input positions; after loading, type 1 and press <go>
Click “Graph” to see position
4. Using the FYH function, determine the number of futures contracts needed to hedge a fixed
income security.
Example: Hedge IBM bond with 7.5% coupon and maturing 6/15/13
Enter IBM [CORP]
Click 7.5% IBM bond maturing 1/15/13
Type FYH
For a display example of FYH Screen for hedging the IBM 7.5% bond, see Exhibit E.4-26.
5. Examine the global market for interest rate and bond futures contracts.
Example: For world bond futures, type WBF
Example: For world interest rate futures, type WIR
CHAPTER 16: MANAGING FIXED-INCOME POSITIONS WITH OTC DERIVATIVES
1. Using Bloomberg‟s SWPM function, form and evaluate a cap, floor, and collar.
Type SWPM
Click “New Deal” for menu
On drop-down menu, click interest rate derivative to evaluate: cap, floor, or collar
Alternative: Type BCCF
For a display example of SWPM Screen for evaluating a Cap, see Exhibit E.6-3.
2. Using Bloomberg‟s USSW function, examine some of the current information and market
data on futures and LIBORs that a bank would consider in forming a cap, floor, or collar.
60
Type USSW
CHAPTER 17: INTEREST RATE SWAPS
1. Using Bloomberg‟s SWPM function, form and evaluate a generic interest rate swap.
Type SWPM
For a display example of SWPM Screen for a generic interest rate swap, see Exhibit E.6-1.
2. Using Bloomberg‟s IRSM function, examine some of the Bloomberg functions for analyzing
interest rate swaps.
Type IRSM
3. Using Bloomberg‟s ASW function, determine the relative value of a selected bond through
the interest rate swap market.
Load bond: Enter IBM [CORP]
Click 7.5% IBM bond maturing 1/15/13
Type ASW
CHAPTER 18: SWAP DERIVATIVES: FORWARD SWAPS AND SWAPTIONS
1. Using Bloomberg‟s FWCV function, evaluate projected forward rates, interest rate swap
curves, and other information needed to value forward swaps and swaptions.
Type FWCV
2. Using Bloomberg‟s SWPM function evaluate a cancelable swap.
Type SWPM
Click “New Deal” for menu.
3. Examine Bloomberg‟s SWPL function for evaluating more complex swaps.
CHAPTER 19: SWAP VALUATION
1. Examine Bloomberg‟s OVSW function for valuing a swaption.
Type OVSW
61
CHAPTER 20: CURRENCY AND CREDIT SWAPS
1. Examine some of the following Bloomberg functions related to evaluating and obtaining
information on currency swaps:
PSFX for creating currency swaps
IYC for obtaining information on yield curves for different countries
2. Using Bloomberg‟s WCDS function, examine the swap prices for different companies.
Type WCDS
3. Using Bloomberg‟s ASW function, determine the Z spread on a corporate bond to determine
the company‟s CDS value.
Load bond: Enter IBM [CORP]
Click 7.5% IBM bond maturing 1/15/13
Type ASW
CHAPTER 21: EMBEDDED OPTIONS
1. Select a company of interest and identify the outstanding warrants issued by the corporation.
Access information and determine the option pricing model values and Greeks on one of the
company‟s outstanding warrants.
Example: Warrants on IBM
Enter IBM [EQUITY] <go>
On IBM Menu, click “Option, Warrants, and Convertibles”
On Options, Warrants, & Convertible Screen, click WCM
On WCM Screen, move cursor to warrant of interest and click to bring up menu
On Menu Screen, type DES
On Description Screen, click OV
For display examples of Description Screen and OV Screen for an IBM warrant, see Exhibit
E.2-16 and E.2-17.
2. Select a company of interest and identify the outstanding convertible bonds issued by the
corporation. Access information on one of the company‟s outstanding convertibles.
Example: Duke Energy convertible bonds
Enter DUK [EQUITY]
On Duke Menu, click “Option, Warrants, and Convertibles”
On Options, Warrants, & Convertible Screen, click Convertible Bond Information Table
On resulting Convertible Security Table, move cursor to convertible bond of interest and
click to bring up menu.
62
On Menu, type DES
For display example of Description Screen for a Duke convertible, see Exhibit E.6-6.
3. Analyze the convertible bond you selected in Question 2 using the following Bloomberg
functions:
a. CNVG to graph the convertible‟s underlying bond and stock price
b. OVCV to determine fair value of the convertible.
CHAPTER 22: MORTGAGE- AND ASSET-BACKED
SECURITIES AND THEIR DERIVATIVES
1. Select an agency MBS of interest (e.g., FHLMC, FNMA, or GNMA).
For FHLMC: Enter FHR [MTGE] <go>
For GNMA: Enter GNR [MTGE] <go>
For FNMA: Enter FNR [MTGE] <go>
2. Analyze the MBS you selected in Question 1 using the following Bloomberg functions:
CFG for a Cash flow analysis
WALG for determining the Weighted Average Life
CLC for Collateral Information
CPH for Historical prepayments
PVG to see a chart of prepayment models available on Bloomberg
63
REFERENCES:
Berger, Eric and D. Klein, “Valuing Options on Dividend-Paying Stock,” Bloomberg Magazine,
July 1998.
Bloomberg I, Historical Center for Financial Services, 2004.
Sharpen Your Financial Skills, Bloomberg Material provided at Bloomberg‟s Global Product
Certification Program, 2006.