BLOOD PRESSURE LOWERING. UKPDS design Aim To determine whether intensified blood glucose control,...
30
BLOOD PRESSURE BLOOD PRESSURE LOWERING LOWERING
-
Upload
raymond-rice -
Category
Documents
-
view
220 -
download
2
Transcript of BLOOD PRESSURE LOWERING. UKPDS design Aim To determine whether intensified blood glucose control,...

BLOOD PRESSURE BLOOD PRESSURE LOWERINGLOWERING

UKPDS designUKPDS designUKPDS designUKPDS designAim
To determine whether intensified blood glucoseTo determine whether intensified blood glucose control , with either sulphonylurea or insulin , control , with either sulphonylurea or insulin , reduces the risk of macrovascular or microvascular reduces the risk of macrovascular or microvascular complications in type 2 diabetes. To determine the complications in type 2 diabetes. To determine the effect of effect of aggressive blood pressure controlaggressive blood pressure control . .
Study Population3867 newly diagnosed type 2 diabetic patients 3867 newly diagnosed type 2 diabetic patients
who were asymptomatic after 3 months of diet ; who were asymptomatic after 3 months of diet ; fasting glucose 6.1–15 mmol/l (110–270 mg/dl) ; fasting glucose 6.1–15 mmol/l (110–270 mg/dl) ; treat for 10 years .treat for 10 years .
AimTo determine whether intensified blood glucoseTo determine whether intensified blood glucose
control , with either sulphonylurea or insulin , control , with either sulphonylurea or insulin , reduces the risk of macrovascular or microvascular reduces the risk of macrovascular or microvascular complications in type 2 diabetes. To determine the complications in type 2 diabetes. To determine the effect of effect of aggressive blood pressure controlaggressive blood pressure control . .
Study Population3867 newly diagnosed type 2 diabetic patients 3867 newly diagnosed type 2 diabetic patients
who were asymptomatic after 3 months of diet ; who were asymptomatic after 3 months of diet ; fasting glucose 6.1–15 mmol/l (110–270 mg/dl) ; fasting glucose 6.1–15 mmol/l (110–270 mg/dl) ; treat for 10 years .treat for 10 years .
Adapted from UK Prospective Diabetes Study (UKPDS) Group Lancet 1998;352:837-853; Turner R et al Ann Intern Med 1996;124(1 pt 2):136-145.

UKPDS : diabetes related UKPDS : diabetes related endpointsendpoints
• Diabetes related deathDiabetes related death
• Non fatal myocardial infarction , heart failure or Non fatal myocardial infarction , heart failure or anginaangina
• Non fatal strokeNon fatal stroke
• AmputationAmputation
• Renal failureRenal failure
• Retinal photocoagulation or vitreous haemorrhageRetinal photocoagulation or vitreous haemorrhage
• Cataract extraction or blind in one eyeCataract extraction or blind in one eye

UKPDS 38 : 154/87 versus 144/82UKPDS 38 : 154/87 versus 144/82
UK Prospective Diabetes Study (UKPDS) Group (38). BMJ 1998;317:703–713
MI
Microvascular endpoint –34%
Heart failure –35%
Stroke –37%
All macrovascular endpoints –44%
Retinal photocoagulation –56%
Any diabetes-related endpoint –24%
0 -10 -20 -30 -40 -50
% Reduction in risk
-24 -24 SignificantSignificant
-34 -34 SignificantSignificant
-21 Non significant
-44-44 SignificantSignificant
-56 -56 SignificantSignificant
-37-37 SignificantSignificant
-35-35 SignificantSignificant

UKPDS : diabetes-related UKPDS : diabetes-related deathsdeathsUKPDS : diabetes-related UKPDS : diabetes-related deathsdeaths
0%
5%
10%
15%
20%
0 3 6 9
% o
f p
atie
nts
wit
h e
ven
ts%
of
pat
ien
ts w
ith
eve
nts
Years from randomisationYears from randomisation
Tight blood pressure control (758)
Less tight blood pressure control (390)
Risk reduction32% ( p=0.019 )

UKPDS : microvascular endpointsUKPDS : microvascular endpointsUKPDS : microvascular endpointsUKPDS : microvascular endpoints
0%
5%
10%
15%
20%
25%
0 3 6 9
% p
atie
nts
wit
h e
ven
t%
pat
ien
ts w
ith
eve
nt
Years from randomisationYears from randomisation
Tight Blood Pressure Control (758)
Less Tight Blood Pressure Control (390)
Risk reductionRisk reduction37% ( p=0.0092 )37% ( p=0.0092 )

In 1148 type 2 diabetic patients a tight blood pressure In 1148 type 2 diabetic patients a tight blood pressure control policy which achieved blood pressure of 144 / 82 control policy which achieved blood pressure of 144 / 82 mm Hg gave reduced risk for :mm Hg gave reduced risk for :
Any diabetes-related endpoint Any diabetes-related endpoint 24% p=0.004624% p=0.0046Diabetes-related deaths Diabetes-related deaths 32% p=0.01932% p=0.019StrokeStroke 44% p=0.01344% p=0.013Microvascular disease Microvascular disease 37% p=0.009237% p=0.0092Heart failureHeart failure 56% p=0.004356% p=0.0043Retinopathy progression Retinopathy progression 34% p=0.003834% p=0.0038Deterioration of vision Deterioration of vision 47% p=0.003647% p=0.0036
UKPDS blood pressure control studyUKPDS blood pressure control study

Risk of Diabetes Complications by BP Risk of Diabetes Complications by BP and HbA1c% and HbA1c%

BP Treatment Targets: BP Treatment Targets: Moving the GoalpostsMoving the Goalposts
BP Treatment Targets: BP Treatment Targets: Moving the GoalpostsMoving the Goalposts
145 / 85
140 / 80
130 / 80
QOFQOF
Alphabet Alphabet StrategyStrategy
JBS2JBS2

Blood pressure lowering agentsBlood pressure lowering agentsBlood pressure lowering agentsBlood pressure lowering agents
What will you use?

Blood pressure lowering Blood pressure lowering agentsagentsBlood pressure lowering Blood pressure lowering agentsagents

ALLHATALLHAT
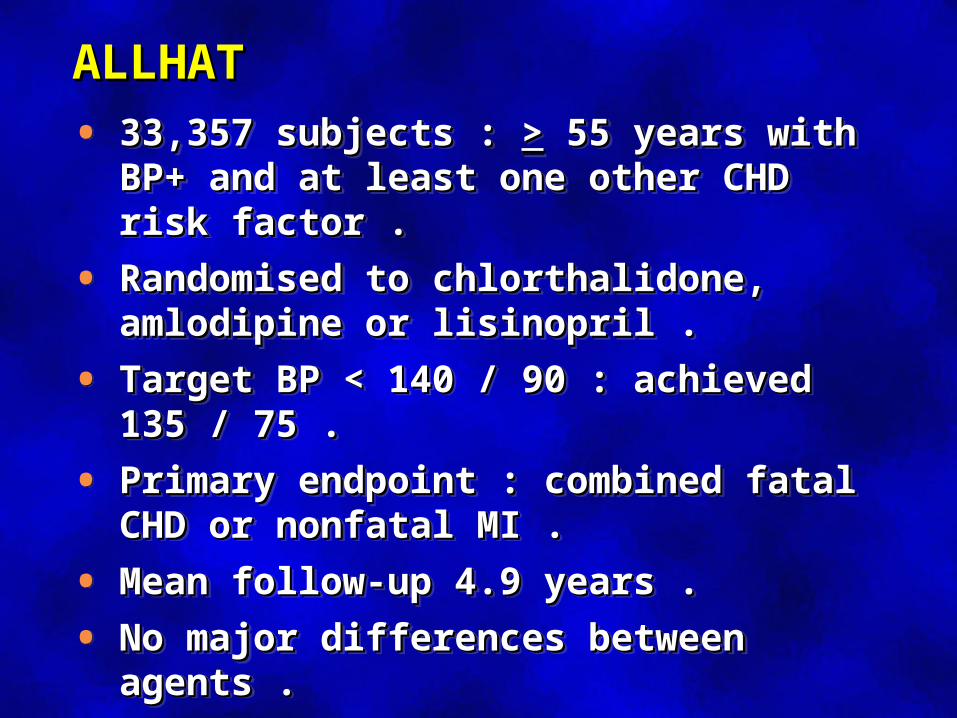
• 33,357 subjects : 33,357 subjects : >> 55 years with BP+ and at 55 years with BP+ and at least one other CHD risk factor .least one other CHD risk factor .
• Randomised to chlorthalidone, amlodipine Randomised to chlorthalidone, amlodipine or lisinopril .or lisinopril .
• Target BP < 140 / 90 : achieved 135 / 75 .Target BP < 140 / 90 : achieved 135 / 75 .
• Primary endpoint : combined fatal CHD or Primary endpoint : combined fatal CHD or nonfatal MI .nonfatal MI .
• Mean follow-up 4.9 years .Mean follow-up 4.9 years .
• No major differences between agents .No major differences between agents .


ASCOT-BPLA StudyASCOT-BPLA Study
• 19,257 subjects : 40-79 years with BP+ and 19,257 subjects : 40-79 years with BP+ and at least three other CHD risk factors .at least three other CHD risk factors .
• Randomised to amlodipine + perindopril or Randomised to amlodipine + perindopril or atenolol + bendroflumethiazide .atenolol + bendroflumethiazide .
• Target BP < 140 / 90 : 130 / 80 in diabetes .Target BP < 140 / 90 : 130 / 80 in diabetes .
• Mean follow-up 5.5 years .Mean follow-up 5.5 years .
• Fewer strokes, CV events & procedures and Fewer strokes, CV events & procedures and deaths in amlodipine group . . .deaths in amlodipine group . . .
• … … and 30% less new diabetes.and 30% less new diabetes.

GFRProteinuriaAldosterone releaseGlomerular sclerosis
Angiotensin II may play a central role in organ damageAngiotensin II may play a central role in organ damage
Adapted from Willenheimer R et al Eur Heart J 1999; 20(14): 9971008, Dahlöf B J Hum Hypertens 1995; 9(suppl 5): S37S44, Daugherty A et al J Clin Invest 2000; 105(11): 16051612, Fyhrquist F et al J Hum Hypertens 1995; 9(suppl 5): S19S24, Booz GW, Baker KM Heart Fail Rev 1998; 3: 125130, Beers MH, Berkow R, eds. The Merck Manual of Diagnosis and Therapy. 17th ed. Whitehouse Station, NJ: Merck Research Laboratories 1999: 16821704, Anderson S Exp Nephrol 1996; 4(suppl 1): 3440, Fogo AB Am J Kidney Dis 2000; 35(2):179188
A II AT1 receptor
AtherosclerosisVasoconstrictionVascular hypertrophyEndothelial dysfunction
LV hypertrophyFibrosisRemodelingApoptosis
Stroke
DEATH
LV = left ventricular; MI = myocardial infarction; GFR = glomerular filtration rate
Hypertension
Heart failureMI
Renal failure

HOPE StudyHOPE Study
• 9300 high-risk subjects : 3500 with diabetes9300 high-risk subjects : 3500 with diabetes
• Ramipril 10 mg versus placeboRamipril 10 mg versus placebo
• CV death, MI, stroke CV death, MI, stroke 25% in diabetic 25% in diabetic subjectssubjects
• Difference in BP between groups = 3/1Difference in BP between groups = 3/1
• Mechanism uncertainMechanism uncertain• ? Specific effect of ACE inhibition? Specific effect of ACE inhibition
• ? BP lowering? BP lowering
• Specific to ramipril or a class effect ?Specific to ramipril or a class effect ?
HOPE Study Investigators, Lancet 2000; 355:253

0.00
0.02
0.04
0.06
0.08
0.10
0.12
0.14
0.16
0 500 1000 1500 2000
Days of Follow-up
Kap
lan-
Mei
er R
ates
ramipril Placebo
HOPE : MI rate -HOPE : MI rate -ramipril vs placebo in diabeticsramipril vs placebo in diabetics
RRR = 22% (6 - 36) p= 0.01

HOPE : stroke rate - HOPE : stroke rate - ramipril vs placebo in diabeticsramipril vs placebo in diabetics
0.00
0.02
0.04
0.06
0.08
0 500 1000 1500 2000
Days of Follow-up
Kap
lan
-Mei
er R
ates
ramipril Placebo
RRR = 33% (10 - 50) p=0.0074

HOPE : CV death - HOPE : CV death - ramipril vs placebo in diabeticsramipril vs placebo in diabetics
0.00
0.02
0.04
0.06
0.08
0.10
0.12
0 500 1000 1500 2000
Days of Follow-up
Kap
lan
-Mei
er R
ates
ramipril Placebo
RRR = 37% (21 - 51) p=0.0001


LIFE StudyLIFE Study• 9200 patients with hypertension and LVH : 1200 9200 patients with hypertension and LVH : 1200
with diabeteswith diabetes
• Losartan versus atenolol (with add-on Losartan versus atenolol (with add-on medications)medications)
• Target BP 140/90 : BP lowering similar in both Target BP 140/90 : BP lowering similar in both groupsgroups
• In diabetics 1In diabetics 10 0 endpoint endpoint 25%, CV mortality 25%, CV mortality 37%37%
• More LVH regression in losartan groupMore LVH regression in losartan group
• Fewer losartan patients developed albuminuria Fewer losartan patients developed albuminuria (7% versus 13%)(7% versus 13%)
• Cannot extrapolate to subjects without LVH ?Cannot extrapolate to subjects without LVH ?
• 9200 patients with hypertension and LVH : 1200 9200 patients with hypertension and LVH : 1200 with diabeteswith diabetes
• Losartan versus atenolol (with add-on Losartan versus atenolol (with add-on medications)medications)
• Target BP 140/90 : BP lowering similar in both Target BP 140/90 : BP lowering similar in both groupsgroups
• In diabetics 1In diabetics 10 0 endpoint endpoint 25%, CV mortality 25%, CV mortality 37%37%
• More LVH regression in losartan groupMore LVH regression in losartan group
• Fewer losartan patients developed albuminuria Fewer losartan patients developed albuminuria (7% versus 13%)(7% versus 13%)
• Cannot extrapolate to subjects without LVH ?Cannot extrapolate to subjects without LVH ?
Lindholm LH et al (2002) Lancet 359, 1004 - 1010.

* Other antihypertensives excluding ACEIs, AII antagonists, beta-blockers.Dahlöf B et al (1997) Am J Hypertens 10:705713.
LIFE : study designLIFE : study designLIFE : study designLIFE : study design
Day 14
Day7
Day1
Mth1
Mth2
Mth 4
Mth6
Yr1
Yr1.5
Yr2
Yr2.5
Yr3
Yr3.5
Yr4
Yr5
Titration to target blood pressure: <140 / <90 mmHg
Placebo Losartan 50 mg
Atenolol 50 mg
Losartan 50 mg + HCTZ 12.5 mg
Losartan 100 mg + HCTZ 12.5 mg
Losartan 100 mg + HCTZ 12.5-25 mg + others*
Atenolol 50 mg + HCTZ 12.5 mg
Atenolol 100 mg + HCTZ 12.5 mg
Atenolol 100 mg + HCTZ 12.5-25 mg + others*


Adverse eventsAdverse events
Losartan Atenolol P
WithdrawalsWithdrawals 2 (0.3%)2 (0.3%) 9 (2%)9 (2%) 0.0650.065
BradycardiaBradycardia 6 (1%)6 (1%) 50 (8%)50 (8%) < 0.0001< 0.0001
AlbuminuriaAlbuminuria 43 (7%)43 (7%) 79 (13%)79 (13%) 0.0020.002
Lindholm LH et al (2002) Lancet 359, 1004 - 1010.


LIFE: LIFE: New Onset Diabetes by New Onset Diabetes by Treatment GroupTreatment GroupLIFE: LIFE: New Onset Diabetes by New Onset Diabetes by Treatment GroupTreatment Group
Study Month
0 6 12 18 24 30 36 42 48 54 60 660
2
4
6
8
10
Pro
po
rtio
n o
f p
atie
nts
, %
Atenolol
Losartan

The Alphabet StrategyThe Alphabet StrategyThe Alphabet StrategyThe Alphabet Strategy
• AAdvicedvice Smoking , diet , exerciseSmoking , diet , exercise
• BBlood pressure lood pressure << 140/80 140/80
• CCholesterol holesterol TC TC << 4.0 mmol/l , LDL ≤ 2.0 mmol/l 4.0 mmol/l , LDL ≤ 2.0 mmol/lHDL > 1.0 mmol/l, TGs HDL > 1.0 mmol/l, TGs << 1.7 mmol/l 1.7 mmol/l
• DDiabetes control iabetes control HbA1c ≤ 7%HbA1c ≤ 7%
• EEye examination ye examination Annual examinationAnnual examination
• FFeet examination eet examination Annual examinationAnnual examination
• GGuardian drugs uardian drugs Aspirin, ACEI, ARB, statinsAspirin, ACEI, ARB, statins