Blood Pressure and Sound.ppt - kau Pressure and Sound.pdfMeasurement of PressureMeasurement of...
45
Blood Pressure and Sound
Transcript of Blood Pressure and Sound.ppt - kau Pressure and Sound.pdfMeasurement of PressureMeasurement of...

Blood Pressure and Sound

What is pressure?What is pressure?
P F/AP=F/A
-Measured in Pascal-Measured in Pascal
-1 Pa = 1 Newton/ 1 m2
-Sectioned view of a syringe –pressure exerted by plunger is di t ib t d t ll t f thdistributed to all parts of the fluid
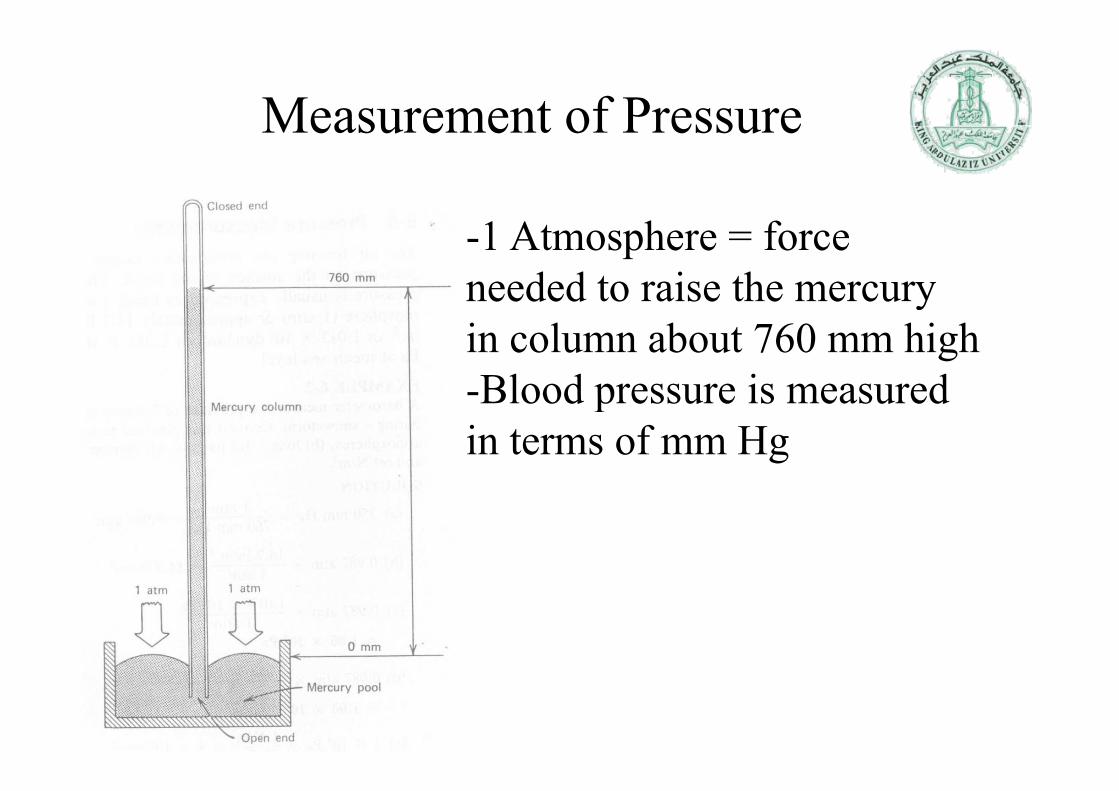
Measurement of PressureMeasurement of Pressure
-1 Atmosphere = force needed to raise the mercury yin column about 760 mm high-Blood pressure is measuredBlood pressure is measured in terms of mm Hg
Why we measure pressure?Why we measure pressure?
i h d i i f f h d i f• Pressure is the driving force of the dynamics of the human body
• Pressure is generated by the heart (constant volume or a constant pressure pump?)p p p )
• Changes of the pressure inside heart chambers cause acceleration and deceleration of thecause acceleration and deceleration of the blood that generate sounds.

Blood Pressure around the HeartSP: Systolic Blood PressureDP: Diastolic Blood Pressure
Blood Pressure around the Heart

Blood pressure reading as essential of every clinical visit

Arterial blood pressureArterial blood pressure

Very direct measurementmeasurement
of bloodof blood pressure

Direct measurementsDirect measurements
• Extra-vascular sensors:– Catheter filled with saline-heparin solution p
connected to a sensor.– Connected to the vessel through surgical cut-downConnected to the vessel through surgical cut-down
or percutaneous insertion S d b• Sensors used can be:– Strain gage, piezo-electric crystals, LVDT,
variable inductance, variable capacitance, opteo-electronics, and semiconductor devices

Direct – Extra Vascular Measurement of Blood pressurep
-Saline is more friendly with body than sensor
Flush solution under pressure
Saline is more friendly with body than sensor
-Time Delay for pressure to reach sensor through saline
-Saline must be flushed every minute to avoid blood clotting at tip of catheter
Sensing port
Roller clampSample and transducerzero stopcock
Electrical connector
Disposable pressure transducer with an integral flush device

Insertion of catheter:Seldinger-technique

An arterial monitoring set-upAn arterial monitoring set-up
Extra-vascular blood pressure measurement

Direct measurementsDirect measurements
• Intravascular sensors:– Sensors a tip of catheterp– Has higher frequency response and less time delay
More expensive may break after a few uses– More expensive, may break after a few uses• Sensors used can be:
– Strain gage, piezo-electric crystals, LVDT, variable inductance, variable capacitance, opteo-, p , pelectronics, and semiconductor devices
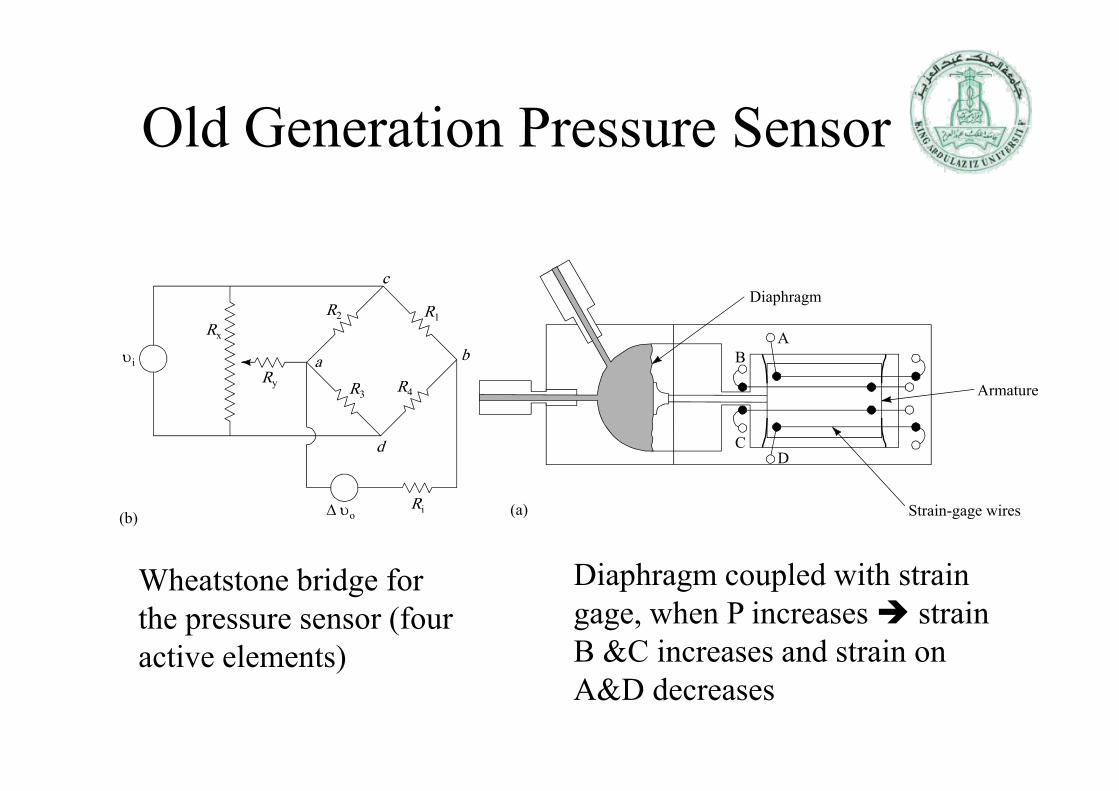
Old Generation Pressure SensorOld Generation Pressure Sensor
Diaphragmc
R
Armature
ABba
R4
i
R3
R2
Ry
Rx
R1
DCd
3
Strain-gage wires(a)(b) oRi
Wh t t b id f Diaphragm coupled with strainWheatstone bridge for the pressure sensor (four active elements)
Diaphragm coupled with strain gage, when P increases strain B &C increases and strain on active elements)A&D decreases

Fiber Optics based Pressure SensorFiber Optics based Pressure Sensor
-Operate in linear range of response
-Pressure causes membrane deflection
Deflection causes change in-Deflection causes change in angle of reflected light
-Reflected light is picked up by Photo-detector
-The amount of reflection is proportional to the membraneproportional to the membrane motion which is proportional to the blood pressure

Disposable Pressure SensorDisposable Pressure Sensor
• Connect diaphragm to a piezo-electric crystal• Pressure moves diaphragm crystal movesPressure moves diaphragm crystal moves
voltage is generatedR d i i i• Reduce cross-patients contamination
• Can connect diaphragm to variable resistor to C co ec d p g o v b e es s o omeasure diaphragm displacement and related to pressureto pressure

Harmonic analysis of BP waveform
• A Pressure waveform can be decomposed into infinite number of sine waves with different amplitudes and phasesamplitudes and phases
• Adding the first six harmonics almost reconstructs the signal

Required bandwidth for measuringRequired bandwidth for measuring
th h i if i i i h• Up to 10th harmonics if interest is in the amplitude of the signal
• Up to 20th harmonics if interest is in the slope of the signal (d/dt information)g ( )
• Catheter + transducer system must have sufficient bandwidthsufficient bandwidth
• Catheter + transducer system must have it bl d i tisuitable dynamic properties
Bandwidth requirementsBandwidth requirements
• For BP waveform: harmonics higher than the 10th are ignoredg– BP BW for HR of 120 bpm is 20 Hz
Derivative of BP may require BW up to frequency– Derivative of BP may require BW up to frequency of the 20th harmonic.

Modeling the catheter-sensor system
• We have three components (diaphragm, sensor and the liquid catheter)q )
• Each component hasI ti l i t t ti– Inertial resistance to motion
– Friction touching other material– Elasticity Ability to change shape with pressure

The catheter-sensor system No-bubbleThe catheter-sensor system No-bubbleCatheterli id i ti
Catheterliquid resistanceliquid inertia liquid resistance
SensorSensor Diaphragm compliance
R i d f i i b l l i i h• Resistance due to friction between molecules moving in catheter R= ΔP/F= ΔP/μA
• Where ΔP is pressure difference across a segment in Pa F is flow rate m3/s μWhere ΔP is pressure difference across a segment in Pa, F is flow rate, m /s, μis the average velocity m/s, and A is the cross sectional area m2
• Inertia or inertance Lc is given by/(d /d ) / /Lc= ΔP/(dF/dt) = ΔP/aA=ρL/A
• Where a= acceleration of fluid m/s2, , L =Length of catheter, ρ is density of fluid kg/m3kg/m
• Compliance C =ΔV/ ΔP = 1/Ed• Where Ed is the modulus of elasticity for the diaphragm

The catheter sensor system No bubbleThe catheter-sensor system No-bubble
Solving the second order system-Solving the second order system)()(
dttdvCtI o
c
)()()( vRtItdILtv
KVLdt
c
)()()()(
)()(
2
2
tvdttdvRC
dttvdLCtv
vRtIdt
Ltv
ooo
i
oci
dtdt
For a laminar flow
VLPrfn
2 )/(43
PVLr
Resonance Frequency Damping Ratio (η= viscosity)
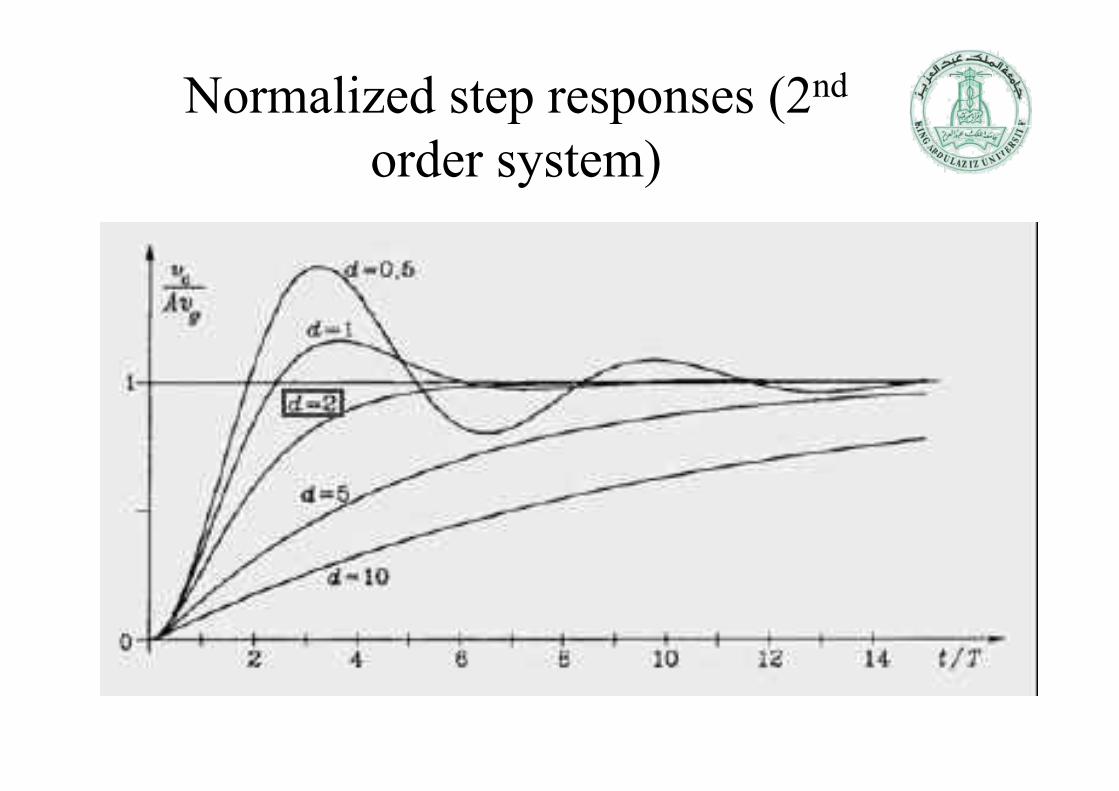
Normalized step responses (2nd
order system)

Effect of bubble in system
Lc Rc RcdLcd
C C (t)i (t)
(b)
Cb Cd o (t)i (t)
Effect of BubbleLc Rc
Effect of Bubble
o (t)
(c)
Cb Cdi (t)
(c)
Two parts, one before the bubble and the other is after the bubble, can ignore some elements

Transfer function with and without air bubble
10
fn = 91 Hz = 0.033
f 22 H
1.0
fn = 22 Hz = 0.137
0 1
1.0
Bubble
No bubble
o(j
) i
(j)
0 01
0.1
0.01
0.91f / f
0.01 0.02 0.04 0.06 0.1 0.22 0.4 0.6 1 2 4 6 8 10
f / fn
Bubble reduces cut-off frequencyd h iFor proper BP measurement, need to get 20 harmonics
~40Hz

BP terms and conceptsBP terms and concepts• Heart Rate (HR): Rate at which the heart is pumping blood• Stroke Volume (SV): volume of blood pumped in one cycle• Cardiac output (CO): Volume of blood pumped by the heart =
HR x SVM A i l P (MAP) P 1/3(P P )• Mean Arterial Pressure (MAP)=Pdias+1/3(Psys-Pdias)
• Resistance of vessels (capillaries), required cardiac output, and thi k f bl d ff t bl dthickness of blood affect blood pressure
• Exercise more blood is needed increase COV l b t t d i t i hi h i BP t• Vessels obstructed resistance is high increase BP to force the flow

Modeling the BRModeling the BR
• Blood flow can be modeled using Ohms law where pressure resembles voltage, flow p g ,resembles current and resistance of vessels is impedance (resistive + capacitive)impedance (resistive + capacitive)
• Many models are there to measure cardiac output using MAP
• R (vessels resistance, L length, r is radius, andR (vessels resistance, L length, r is radius, and P is pressure)
L 4Pr4)(rLR
L
F
4Pr

BR waveformBR waveform
• Systolic pressure (Psystolic) ventricle ejects into systolicaorta
• As ventricle relaxes, pressure drops, p p• The "dicrotic notch,“ occurs with aortic valve closes
Lo est al e before blood ejection is P• Lowest value before blood ejection is Pdiastolic

P iPressure in and aroundand around
the heart

System step responseSystem step response
SurgicalgloveThree-
waystopcock
Step response by the bulbMeasure output
MatchO-ringAir
Saline
Air
Rubberwasher
Sphygmomanometerbulb

Step responseStep response
l ny
211
T
n
22
1
ln4
ln
n
n
n
yyπ
yy
1ny

Sinusoidal Response (frequency)
Pressure sensorFrequency responseIdeal sensor compares reading
"Ideal“
p g
Idealsensor
Catheter
Underwaterspeaker
Saline
Low-frequencysine generatorsine generator

Waveform distortionWaveform distortion

Waveform distortionWaveform distortion

Heart soundsHeart sounds
• Sounds: due to acceleration and deceleration of the blood.
• Murmurs: due to blood turbulence

Heart sounds:
1st: closing mitral and tricuspid valvesand tricuspid valves
2nd: closing of aortic valve (end of ECG T)
3rd: end ventricular3rd: end ventricular filling
4th: contraction of atria and propelling blood into ventricles

Normal/AbnormalitiesNormal/Abnormalities
• Normal murmurs during early systolic phase in children.
• Abnormal ones due to stenoses and leaks at different valves (aortic mitral pulmonary)different valves (aortic, mitral, pulmonary).
• Measurement of time duration between murmurs, relation to heart cycle may determine the abnormality in the heartdetermine the abnormality in the heart

Auscultation techniques to measure heart sound
• BW of heart sounds (0.1-2000 Hz)

StethoscopesStethoscopes
• Transfer heart sound through tube to ears
• Electronic stethoscopes (microphones), not ( p )accepted by many doctors since sound is different

Indirect measurements of BPSphygmomanometer
• Non-invasive• Reduce cuff pressure blood
flows hear the sound in the scopep• Korotkoff sounds (20-300 Hz) are
heart with a stethoscopedi fi d i• Manometer reading at first sound is
systolic pressure• Sounds stop at diastolic pressure p p
(why?)• Automatic systems are also
availableavailable.• Less accurate for infants and
hypertensive patients• Not effective in noisy area

Automatic Detection of pressureAutomatic Detection of pressure
• Automatically inflate the cuff with known pressurep
• Replace stethoscope with a microphoneWh h fi K k ff d d d d• When the first Kortkoff sound detected, record pressure inside the cuff
• When sounds are no longer present, record cuff pressurecuff pressure,

Ultrasonic determination of BPUltrasonic determination of BP
• Doppler sensor detect vessel wall motion.I fl t ff ith k• Inflate cuff with known pressure
• Start deflating when motion• Start deflating, when motion is detected, record pressure
• When motion no longer• When motion no longer detected, record pressure
• Good for infants andGood for infants and hypertensive patients
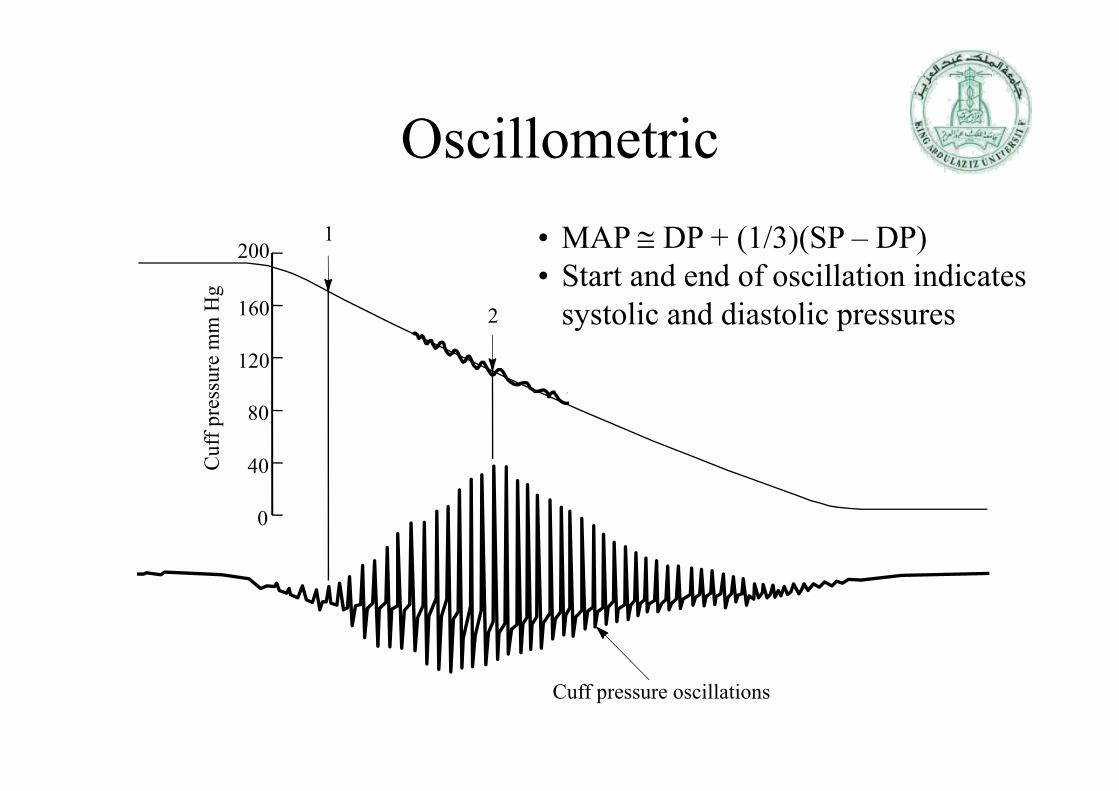
O ill t iOscillometric
200
160
1H
g• MAP DP + (1/3)(SP – DP)• Start and end of oscillation indicates
t li d di t li160 2
120
ssur
e m
m H systolic and diastolic pressures
80
40Cuf
f pre
s
0
Cuff pressure oscillations

Block diagram of oscillometric type
Auto zero Pressure
Cuff pressureInternalExternal
Multiplexerand analogto digitalconverter
Auto-zerovalve sensor
Cuff pressureoscillationsBP cuff
Inflation
iDeflate valve
Inflationsystem
Microcomputerwith memoryand I/ODump
valveOver-Pressure
MAP
HR
SYS
Pressureswitch
DYSHR DYS

ReferencesReferences
• Webster (Medical Instrumentation)• Dr Baha and Dr Haitham’s class notesDr Baha and Dr Haitham s class notes• www.Wikipedia.com• www.Cvphysiology.com