Blips - Lan Turner · When you see the simplicity of this pattern and how to trade it you are going...
46
Blips By David Duty CTA www.commonsensecommodities.com Price $99.00 Includes 60 Minutes of Video on Blips Page | 1
Transcript of Blips - Lan Turner · When you see the simplicity of this pattern and how to trade it you are going...
Blips
By David Duty CTA
www.commonsensecommodities.com
Price $99.00
Includes 60 Minutes of Video on Blips
Page | 1

My name is David Duty and I’m a CTA or Commodity Trading Advisor and I
started trading commodities back in 1996 and I’ve been teaching people to trade
for over ten years. I’m also the author of Common Sense Commodities, which was
rated the #1 course on the market to learn to trade commodities.
In this course you are going to learn about a highly effective chart pattern I call
Blips. When you see the simplicity of this pattern and how to trade it you are going
to be amazed to say the least.
Blips can be used to trade any market. You can use them to trade commodities,
stocks, or Forex. You will soon see that you can use these patterns to trade in any
time frame also, so it doesn’t matter if you are a Day Trader, Swing Trader or a
long term Position Trader.
I hope I have your undivided attention, because what you are about to learn
could provide you with a comfortable living if you learn to trade it correctly.
Let’s jump right in and there is no better place to start than with what is a Blip?
A Blip is usually a three day pattern. Now if you are day trading and using 5 or 10
minute charts you can just think of “days” as price bars. So I think I will just use
the term “bar” or “bars” from now on in this course.
So a Blip is a three bar pattern; that makes things easier! Let’s take a look at a Blip
formation in Example 1 on the next page.
As you will see, there are two types of Blips; a Top Blip and a Bottom Blip. You
are going to start seeing Blips on every chart that you look at from this point
forward. If you are like most people, you are going to be amazed at both its
simplicity and accuracy in indicating either a trend reversal or the start of a new
trend, or in certain circumstances the continuation of the current trend.
I want you to think about something. How important would it be for you to know
when a Trend might be ending or when a new Trend might be starting? That’s
what I thought; very important!
First, I need to teach you is and how to spot Blips on a chart. Like I said, a Blip is
usually a three bar formation but sometimes it can take four days to form. First we
are going to look at a three bar Blip. Keep in mind that there are two kinds of
Blips, a Top Blip and a Bottom Blip. See Example 1.
Page | 2
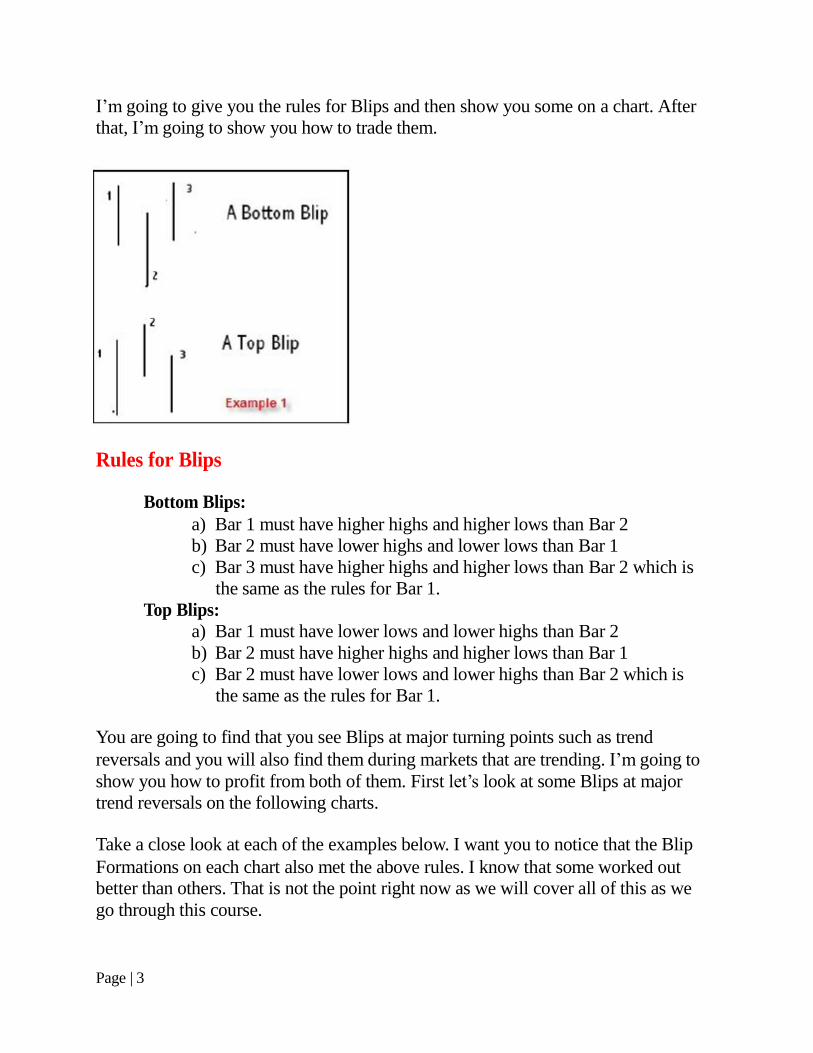
I’m going to give you the rules for Blips and then show you some on a chart. After
that, I’m going to show you how to trade them.
Rules for Blips
Bottom Blips:
a) Bar 1 must have higher highs and higher lows than Bar 2
b) Bar 2 must have lower highs and lower lows than Bar 1
c) Bar 3 must have higher highs and higher lows than Bar 2 which is
the same as the rules for Bar 1.
Top Blips:
a) Bar 1 must have lower lows and lower highs than Bar 2
b) Bar 2 must have higher highs and higher lows than Bar 1
c) Bar 2 must have lower lows and lower highs than Bar 2 which is
the same as the rules for Bar 1.
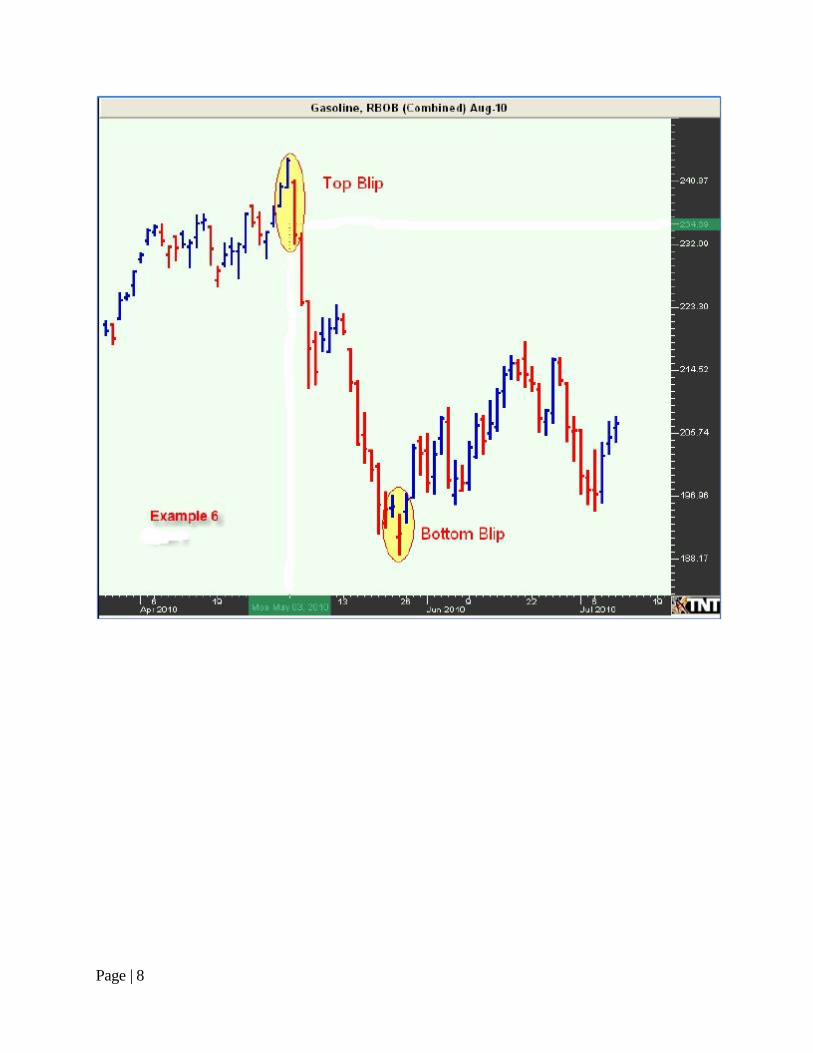
You are going to find that you see Blips at major turning points such as trend
reversals and you will also find them during markets that are trending. I’m going to
show you how to profit from both of them. First let’s look at some Blips at major
trend reversals on the following charts.
Take a close look at each of the examples below. I want you to notice that the Blip
Formations on each chart also met the above rules. I know that some worked out
better than others. That is not the point right now as we will cover all of this as we
go through this course.
Page | 3

Page | 4

Page | 5

Page | 6

Page | 7
Page | 8

I look for Blips after a big rally or after a big downtrend. I guess you could say that
I’m looking for a major price reversal with a Blip. You can use the Blip to enter
a trending market too which you will learn about later.
By just looking at a Blip on a chart you might be thinking that you know how to
trade them but hold on because I’m going to show you several things that you need
to be aware of in order to make sure you are not only trading the correct type Blip
but also placing your order correctly and your stops correctly.
Now that you know what a Blip looks like I want to explain some more “rules”
that will help you tremendously when you start to trade them. Some of it is just
common sense and some is based on what I have been teaching my for over ten
years. They work better than anything else I’ve ever seen. I’m also the first person Page | 9

that I know of to have “discovered” them. At least no one that I know of has ever
discussed anything like them that I’m aware of. I will say that there are two
Japanese Candlestick patterns that are like Blips and they are Morning Stars
(Bottom Blip) and Evening Stars (Top Blip). I did not use Candles when I first
started trading so I was not aware of them. I learned about them from Steve Nison
who is the most recognized authority in the western world on Candles. Steve was
the first person to interpret them from the original Japanese books.
Let’s discuss some of the other “rules” right now and we are going to start with a
Top Blip and discuss the three bars one at a time. Now keep in mind that a Blip can
be on a 5 minute, daily, weekly or even a monthly chart. The time frame is
irrelevant and they work exactly the same way on all charts.
As you can see in Example 8 that the Bar 2 closed in the lower 25% of the bars
range which indicates weakness in the market. In other words the Bears won that
round. But it’s the next bar that tells the true story. Bar 3 which MUST also close
low and the lower the better. And of course Bar 3 must follow the first set of rules
in that it must have lower lows and lower highs than Bar 1. Ideally Bar 3 will also
have lower lows than Bar 1 breaking any support that Bar 1 offered.
Page | 10

Now that you know what they look like and the rules you must apply you are
probably sitting there thinking well this is a great little pattern but how the heck do
I trade it? That’s what we are going to talk about next.
Of course, like in any trade, you need to have an entry point and a protective stop.
You should also have profit targets so that you can figure out your Risk/Reward
Ratio.
Protective Stops
Let’s look at Example 9 so we can see where to enter the market and where to put
our protective stop.
Your entry point will depend on what your Risk Reward Ratio is and how
aggressive or conservative you are. Of course the closer your stop is to your Entry
Point the more aggressive the trade. So an Aggressive stop offers less financial risk
but it offers more risk of being stopped out with a loss. On the other hand, a
Conservative Stop has more financial risk it offers less chance of being stopped
out. These are decisions that you alone can make.
Page | 11

Without knowing where your Exit point, or your profit target is, there is no way to
figure your Risk Reward Ratio. This short course is not designed to teach you
Profit Targets so I trust you already know how to find those.
It should go without saying that a Bottom Blip works the same way, just reversed.
But for sake of clarity I will also include an explanation in Example 10 below.
Now you might be wondering what kind of order to use to enter the trade. You can
use either a Stop or a Limit order. If you use a Stop Order you risk getting a bad
fill if the market gaps on the open and if you use a Limit Order you run the risk of
not getting filled at all. It’s a true Catch-22 for sure. I think overall that a Stop
Order is your best bet to trade Blips and I will give you some examples of why a
little later.
Gaps & Blips
Next I want to discuss with you what you can do if you have a Gap between Bar 2
and Bar 3. Look at Example 11 so you will know what I’m talking about. Page | 12
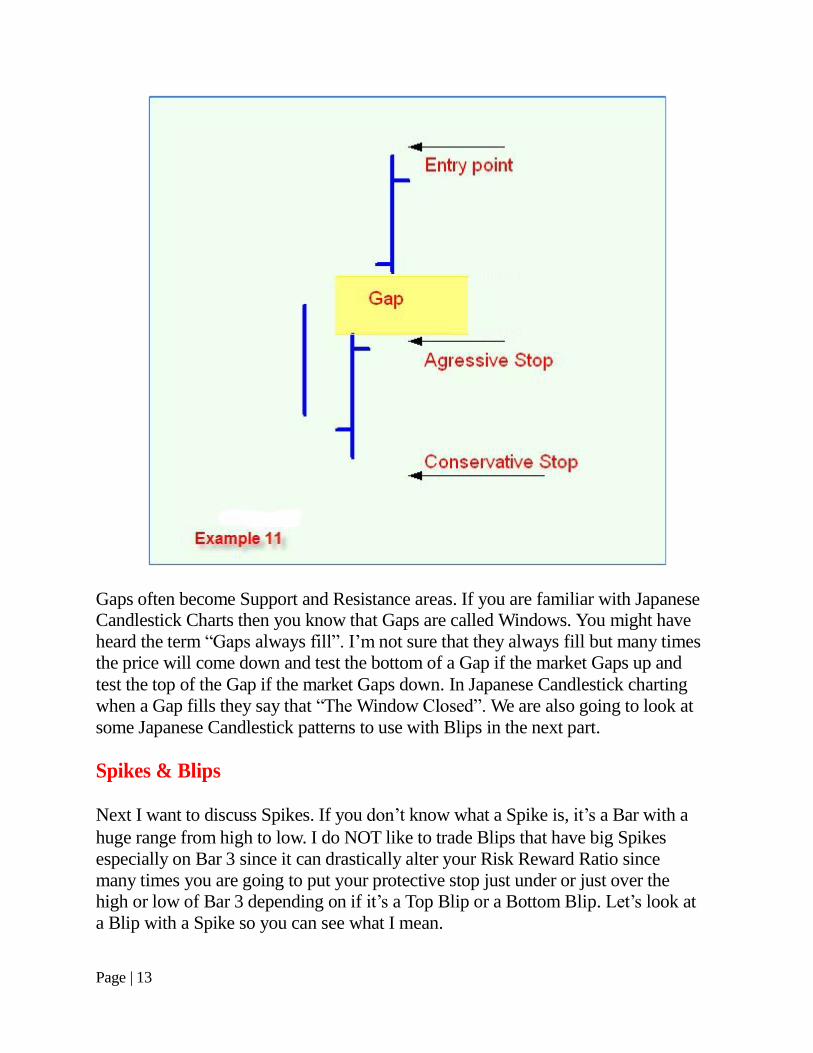
Gaps often become Support and Resistance areas. If you are familiar with Japanese
Candlestick Charts then you know that Gaps are called Windows. You might have
heard the term “Gaps always fill”. I’m not sure that they always fill but many times
the price will come down and test the bottom of a Gap if the market Gaps up and
test the top of the Gap if the market Gaps down. In Japanese Candlestick charting
when a Gap fills they say that “The Window Closed”. We are also going to look at
some Japanese Candlestick patterns to use with Blips in the next part.
Spikes & Blips
Next I want to discuss Spikes. If you don’t know what a Spike is, it’s a Bar with a
huge range from high to low. I do NOT like to trade Blips that have big Spikes
especially on Bar 3 since it can drastically alter your Risk Reward Ratio since
many times you are going to put your protective stop just under or just over the
high or low of Bar 3 depending on if it’s a Top Blip or a Bottom Blip. Let’s look at
a Blip with a Spike so you can see what I mean.
Page | 13

As you can see in Example 12 there was a huge Spike up. If you were to place your
protective stop under Bar 2, the bar before the Spike then you would have incurred
a huge risk. So a good rule of thumb is not to trade Blips with big Spikes on Bar 3.
However in this example if Bar 2 was a big Spike down bar then that would have
been a good thing since the market might have tested new lows but was not able to
hold them and the price rallied.
Japanese Candles & Blips
Remember earlier I said that Bar 2 should close in the upper 25% range for a
Bottom Blip and the lower 25% range for a Top Blip? Well that’s true in many
cases but if you follow Japanese Candles then there are some exceptions to this
rule. There are many Candle patterns that you could use with Blips but since this is
not a course on Candles I’m only going to cover a few of them. First, I’m going to
assume you don’t know what a Japanese Candle even looks like, so I’m going to
cover them briefly. If you already know what they are you can just skip the next
section.
Page | 14

Japanese Candlesticks – A Primer Lesson from My Website
Japanese Candlesticks are really quite easy to understand. I want each of you to
go into this primer with that knowledge. Price information can be visually
presented in a number of ways: Japanese Candlesticks are but one of them
Since you are a Common Sense Commodities student, you already have an
excellent foundation in bar charts. Bar charts represent the exact same
information that Candlesticks do, but with some slight differences. The main
difference being color. The color of a Candlestick represents where prices closed, it is similar to the right tick on the bar chart. Below is a down bar.
As you can see, the right tick (highlighted) is lower that the left one, signifying a
down close.
Here is the corresponding Candlestick:
Instead of the tick to the right signifying a lower close, we have a red (or in some
cases black) shaded in "candle".
Let's go over the terminology of the candle itself. First you have the "body"
of the candle. That is the shaded in portion of the candle, regardless of color.
Page | 15

The red portion of the candle above is the "body". Next, you have the "wicks". Now you may be getting an idea of why they are called Candlesticks! The
"wicks", either above the body or below the body, represent the high and low. So
the wick above represents the high and the wick below represents the low. This
is regardless of the color of the body. So you see, this is very similar to bar
charts!
Here is an example of an up candle or a candle with a higher close with the
corresponding bar next to it. Look at the bar chart and imagine it is shaded in
green and you have a up Candlestick! Both of these simply represent a higher
close!
Not too tough is it? The only difference in appearance to the red/down candle is
that an up candle is shaded green (or sometime hollow/white depending on
your charts) to signify the higher close.
Now that we know what an up and down Japanese Candlestick looks like, let's
discuss how we can put this to use.
There are volumes written on Candlestick...but here's what you really need to
know.
No matter what the pattern or the candle, it must
occur within the context of an established trend!
So let's discuss some basic -- and very important -- Candlesticks.
Trading with Candlesticks does not have to be complicated. Most Candlestick
patterns involve one of just a few candles. They are "building blocks" to most Page | 16

patterns so if you learn to recognize these you can trade Candlesticks with
confidence!
The Candlesticks we will discuss are the following:
Doji
Spinning Top
Hammer
Inverted Hammer
Hanging Man
The "Doji" is the most powerful Candlestick you can find. The reason being is
that -- if you notice -- there is no "body". The open and close were at the same
level! This represents a "pause" or "balance" or even lack of opinion. In the
context of a trend, this is a powerful signal that a reversal may be setting
up! This simply means that without an established trend in place, a Doji (or any
Candlestick for that matter) has less significance. So in a choppy, directionless
market, do not rely on Candlesticks alone!
The open and close must appear at the same price level, wherever that may be
along the high and low of the Candlestick itself.
The Spinning Top below can be considered a "close cousin" to the Doji.
Page | 17

Rather than the open and close having to be at the same level, a Spinning Top
has a small or narrow body. This too signifies a "pause", "balance", or lack of
opinion, just not to the extreme degree of a Doji. Again, we look for these in the
context of an established trend.
So the ideas we want to make sure we get from Part Two are that we want to
recognize Candlesticks that have a very narrow or no body. Why? Because
it represents a "pause", "balance", or lack of an opinion. When we figure in that
we are looking for these Candlesticks in the context of an established trend we
realize that we are now seeing the beginning of a possible shift.
What do we do once we see a candle?
Ok. So what do we do when we see a Candlestick like a Doji or Spinning Top?
Simple, we return to out tried and true CSC principles. In other words, we look
at the current trend, support and/or resistance, 50% Levels, common numbers, chart patterns, and then we confirm direction with our indicators!
It's all starting to make sense now I hope...because all we are doing by using
Candlesticks is making ourselves aware of potential reversals on the chart!
Imagine a Blip with Bar 2 being a Doji!
Imagine seeing a Spinning Top at major Support or Resistance!
What about a Doji at a 50% Level!
Seek to simplify, not to complicate.
Here are a few more Candlesticks we should learn to recognize:
Page | 18

The Candlestick above is called a "Hammer". Unlike Doji and Spinning Tops
which can be used in both uptrends and downtrends, a "Hammer" is a
Candlestick to look for when prices are in a downtrend. So if in the context of an
established DOWNTREND you see a "Hammer", think to yourself: This is a
pause, and could possibly be setting up support for a reversal. Are prices in at a
prior support level? Are prices at a common number? Is this Hammer occurring
on Bar 2 of a Bottom Blip? Is this weekly or monthly support? Is this near or at
a 50% Level?
A "cousin" to the Hammer would be the "Inverted Hammer".
We still look for an "Inverted Hammer" (just like its cousin the Hammer) in a
downtrend. And we should ask ourselves the same questions we would if we saw
a Hammer.
Finally we have the "Hanging Man" which looks just like a Hammer but we
should keep an eye out for this Candlestick in an UPTREND.
Page | 19
When we see a "Hanging Man", we should think to ourselves: This is a pause, and could possibly be setting up resistance for a reversal. Are prices in at a prior
resistance level? Are prices at a common number? Is this Hammer occurring on
Bar 2 of a Top Blip? Is this weekly or monthly resistance? Is this near or at a
50% Level?
Again, be sure that the current trend and your indicators confirm what the
Candlestick is telling you. Here are a few examples:
Are prices forming a Top Blip, with a Bar 2 Doji, and the Slow Stochastic
hooking down through the 80% level?
Are prices near or at the 50% Level with Slow Stochastics hooking above the
20% levels?
What is the MACD Histogram doing? Does it confirm the Candlestick and the
price level reversing? Is there divergence?
You can see there are multiple ways we can put Candlesticks to use. Think of
them as "alerts" that get your attention to potential reversals.
End of Primer on Japanese Candlesticks
Now that you have an understanding of what Japanese Candlesticks are let’s look
at some Blips on charts with some Candle Patterns that you can use.
Page | 20

Candles - Doji & Spinning Tops
As I explained, a Doji candle shows indecision in the market because it opened and
closed at the same, or very close to the same price. Neither the Bulls nor the Bears
won that round. They often precede a change in trend or at least a pause in trend.
So when you see a Doji on Bar 2 where a Blip could be forming, pay close
attention to Bar 3 which is the bar that will often confirm the change in direction
suggested by the Doji, as well as it confirms the Blip. Let’s look at one on a chart.
See Example 13.
You can see that each of these Blips with Doji on Bar 2 had a reversal in the
current trend and good profits could have been made on each one. Remember that
Spinning Tops Candles are just a “fat” Doji where the market opened and closed
very close to each other but not exactly at the same price. You would trade a
Spinning Top exactly like you would the Doji when trading Blips. Also both the
Doji and Spinning Top candles need to have long “wicks” on both the top and
bottom. If not, they can be an entirely different Candlestick formation.
Page | 21
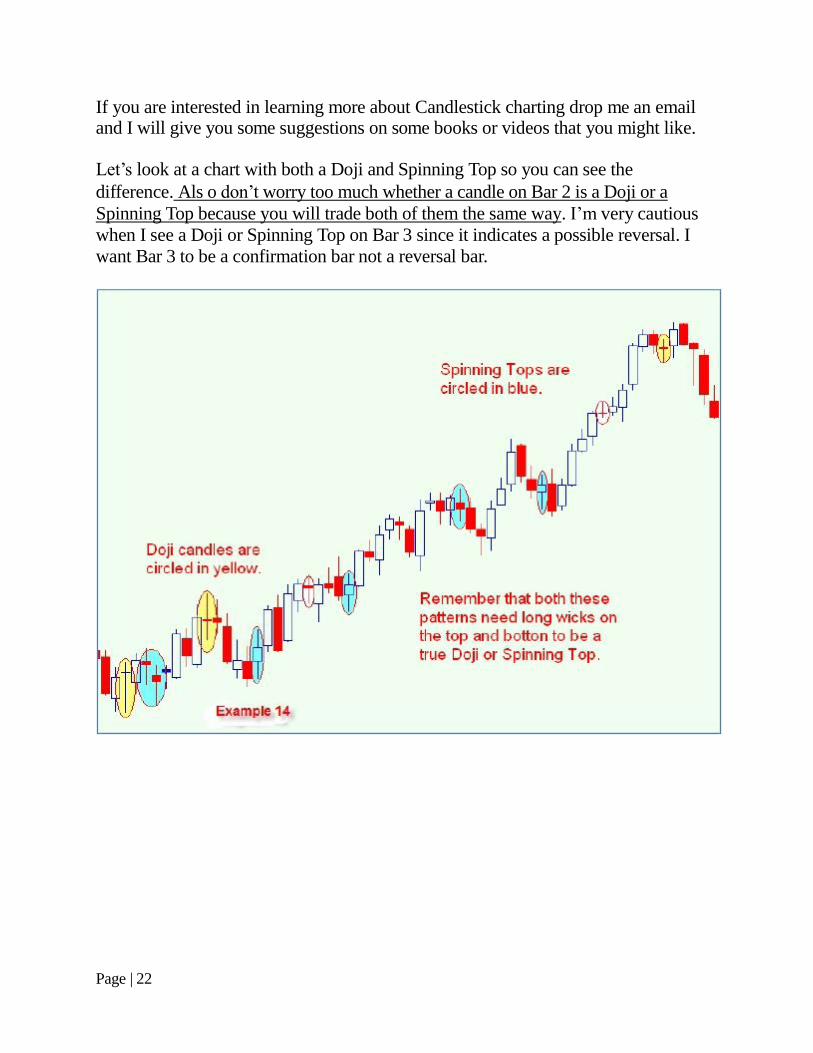
If you are interested in learning more about Candlestick charting drop me an email and I will give you some suggestions on some books or videos that you might like.
Let’s look at a chart with both a Doji and Spinning Top so you can see the
difference. Als o don’t worry too much whether a candle on Bar 2 is a Doji or a
Spinning Top because you will trade both of them the same way. I’m very cautious
when I see a Doji or Spinning Top on Bar 3 since it indicates a possible reversal. I
want Bar 3 to be a confirmation bar not a reversal bar.
Page | 22

Hanging Man & Hammers
A Hanging Man is a topping formation (Bearish) and a Hammer is a bottoming
formation (Bullish). They are exactly the same shape candle. The only difference is
that the Hanging Man represents a top in the market (the market hung itself) and
the Hammer represents a bottom in the market (the market is Hammering out a
bottom). See Example 16.
Page | 23
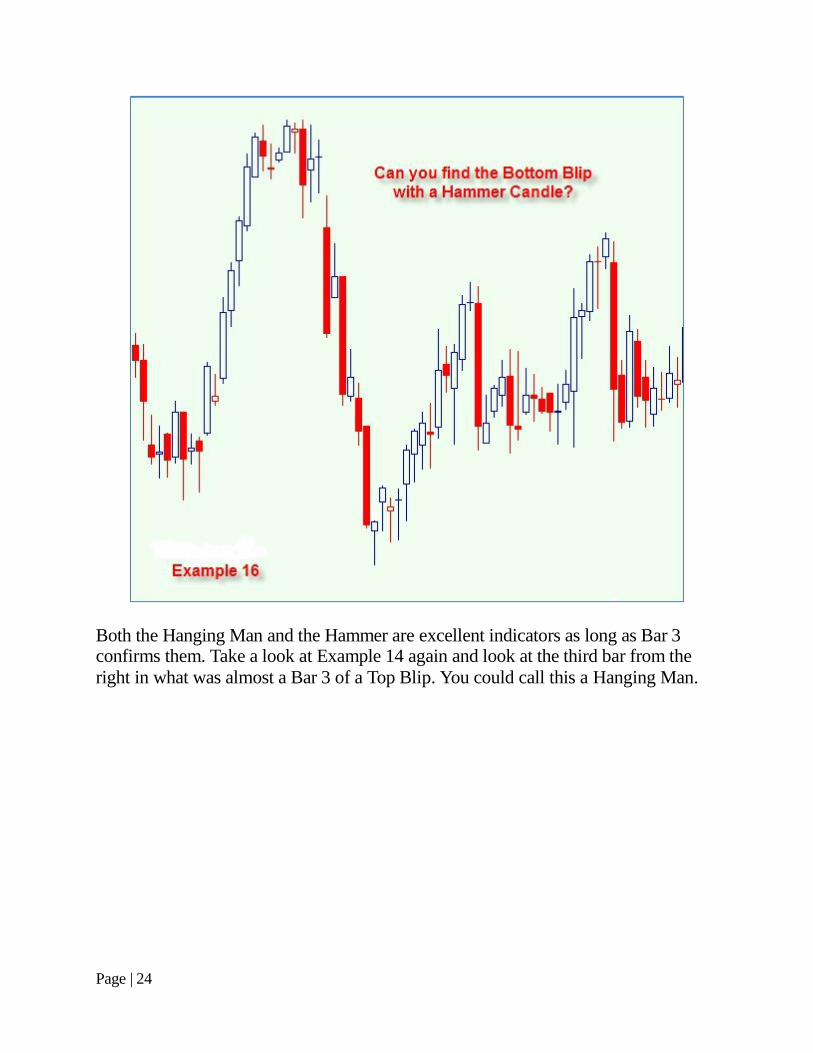
Both the Hanging Man and the Hammer are excellent indicators as long as Bar 3
confirms them. Take a look at Example 14 again and look at the third bar from the
right in what was almost a Bar 3 of a Top Blip. You could call this a Hanging Man.
Page | 24

Inside Bars
So far we have only looked at a Blip that consist of three bars but if you recall at
the first of this course I mentioned that Blips are sometimes a four bar pattern.
Well this is where the Inside Bar comes into play.
An Inside Bar is simply where the current bar traded inside the highs and lows of
the previous bar. This means that an Inside Bar could be on the left or on the right
of Bar 2. I do not like Inside Bars that show up after Bar 3 and usually won’t trade
them as a Blip. Let’s look at one below so you can get a visual image of what they
look like. See Example 18.
Page | 25
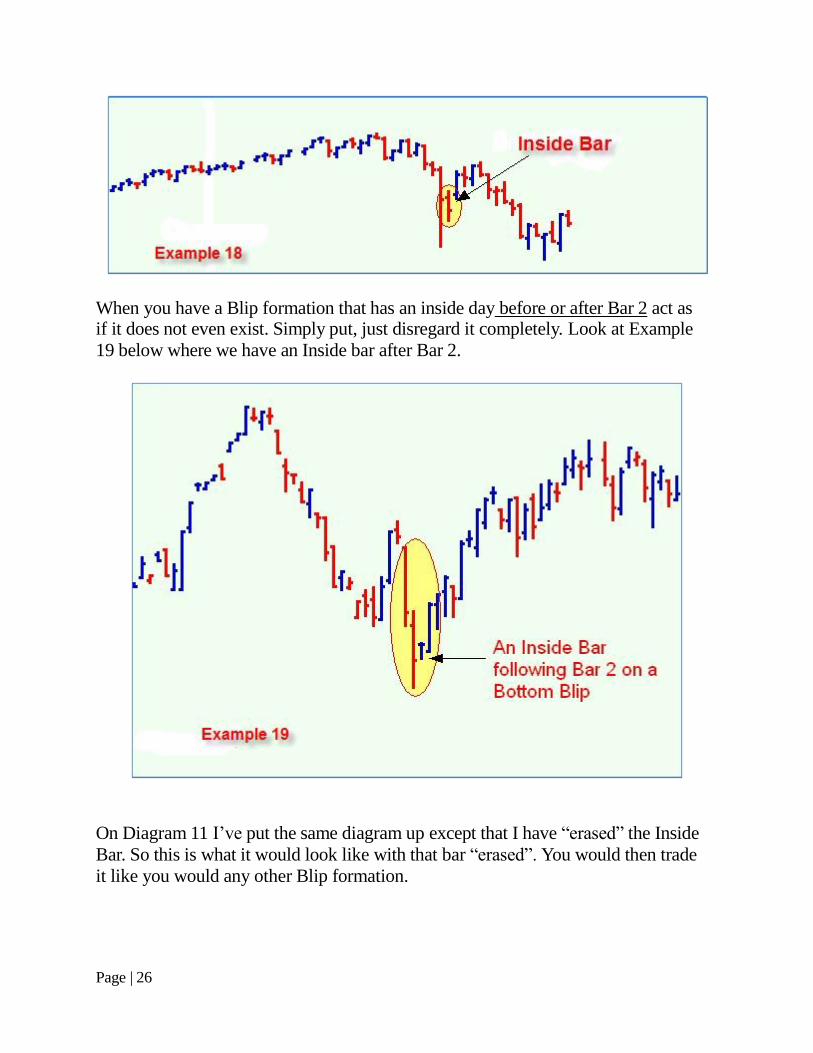
When you have a Blip formation that has an inside day before or after Bar 2 act as
if it does not even exist. Simply put, just disregard it completely. Look at Example
19 below where we have an Inside bar after Bar 2.
On Diagram 11 I’ve put the same diagram up except that I have “erased” the Inside
Bar. So this is what it would look like with that bar “erased”. You would then trade
it like you would any other Blip formation.
Page | 26

Blip Reversals
Not all Blips work all the time. Sometimes we have what I call a Blip Reversal. All
this is that sometimes a Top Blip “reverses” and becomes a Bottom Blip or a
Bottom Blip “reverses” and becomes a Top Blip.
In Example 21, I’ve drawn out what a Blip Reversal looks like. We will look at
some charts with some Blip Reversals on a chart also. After that I will show you
how you can trade them.
As you can see, Example A confirmed and did what we thought it would. If we had
placed our Buy-Stop order above the high of Bar3, we would have been filled on
Bar4. But what happens if Bar4 reverses, and does not go above Bar3? Well, this
is the Blip Reversal, as I call it, and is shown in Example B.
Page | 27
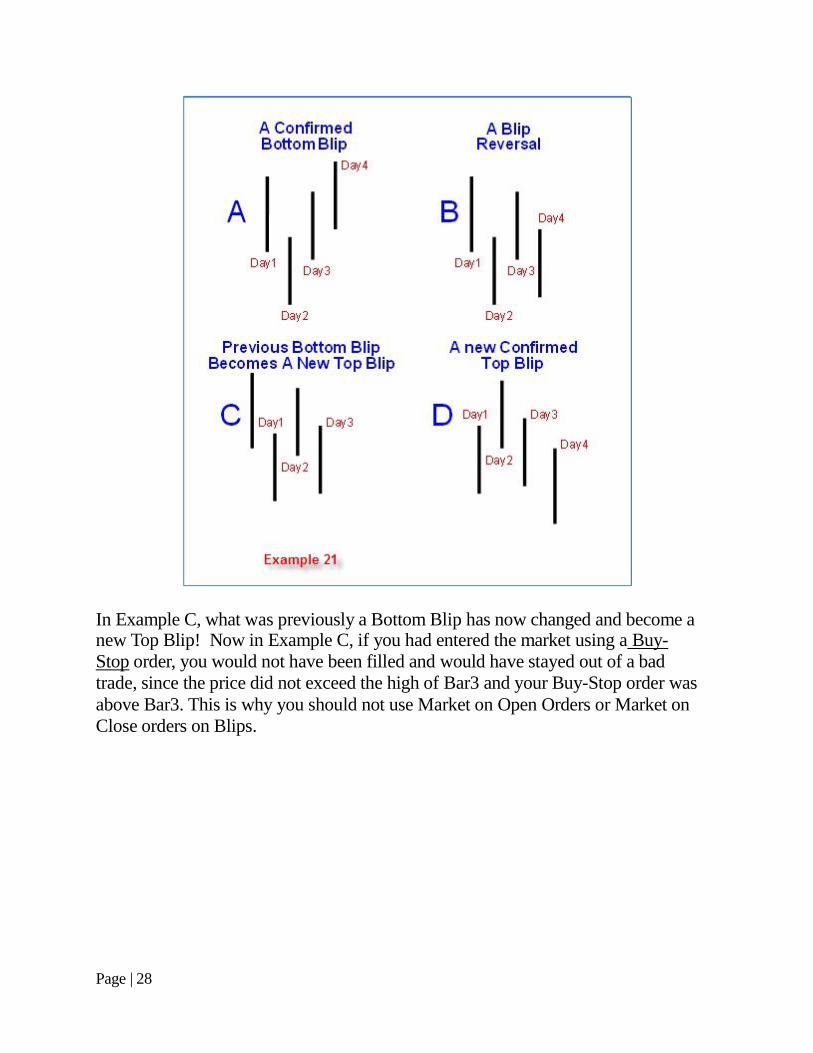
In Example C, what was previously a Bottom Blip has now changed and become a
new Top Blip! Now in Example C, if you had entered the market using a Buy-
Stop order, you would not have been filled and would have stayed out of a bad
trade, since the price did not exceed the high of Bar3 and your Buy-Stop order was
above Bar3. This is why you should not use Market on Open Orders or Market on
Close orders on Blips.
Page | 28

An Alternate Way to Trade Blips
Now that you know we don’t live in a perfect world, I’m going to show you an
alternative method for trading Blips.
You probably know about “bracketing” a Channel or a Trading Range? You can do
the same thing with a Blip. Look at Example 22 Below.
In the Example “Top Blip Forms” you see a possible trade here to short the market
on the formation of a Top Blip. This is the “normal” way to trade these Blips.
Now, here’s the “twist” on how to trade a Blip. You place two orders! Your first
order would to be go short, and place your Sell-Stop order below the low of Bar3.
Page | 29

But at the same time, you place another Buy-Stop order to go long above the high
of Bar3. These would be an OCO order (One Cancels the Other), so the order that
gets filled first cancels the other order. This way, you can’t have two orders at the
same time. The only order you would be in is the one that gets filled first.
Now, if you got filled short when the price broke below the low of Bar3 you are
probably pretty happy, because the Blip did what you expected it to do. It dropped.
On the other hand, if it didn’t drop, but rallied because it was a Blip Reversal, you
got filled going long at a break above the high of Bar3. It’s a win-win situation.
The question now is, where do you place your stops? What you should do is tell
your broker that when one order fills, the other order becomes your protective Stop
Loss order. Again, this is just using some Common $ense in your trading.
Blips on Weekly and Monthly Charts
Keep in mind that you will also find Blips on the Weekly and Monthly Charts.
When you do, they are extremely powerful indicators, and I would try and find a
way to trade them by looking at a Daily Chart and finding a good set-up. Off the
top of my head, I can’t think of any formation or technical indicator that is not
more powerful on a Weekly or Monthly chart than it is on a Daily Chart.
Many inexperienced traders don’t watch the Weekly or Monthly charts as closely
as they should. Don’t be one of them. Watch them closely! See Examples 23 and
24 below. Page | 30

Page | 31
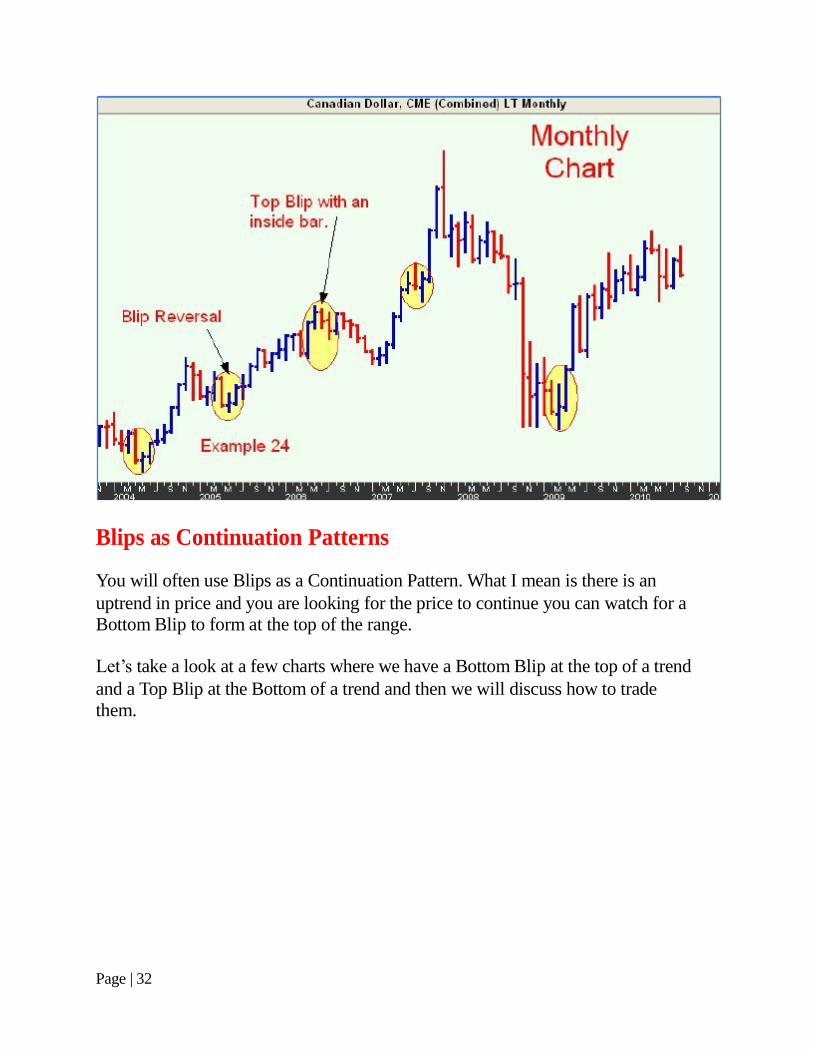
Blips as Continuation Patterns
You will often use Blips as a Continuation Pattern. What I mean is there is an
uptrend in price and you are looking for the price to continue you can watch for a
Bottom Blip to form at the top of the range.
Let’s take a look at a few charts where we have a Bottom Blip at the top of a trend
and a Top Blip at the Bottom of a trend and then we will discuss how to trade
them.
Page | 32

As I mentioned on the above chart we have a Bottom Blip in an uptrend. You can
view Bottom Blips in an uptrend as a continuation pattern. You will see these often
on charts that you are watching.
However I want you to use a little common sense for a moment and look closely at
the Bottom Blip in Example 25. Notice that Bar 1 of the Blip has higher highs than
Bar 3 which makes Bar 1 resistance. For obvious reasons you would not want to
enter a trade long here since your order would be just under the resistance of Bar 1
which would be a stupid thing to do. Don’t get bent out of shape; I did not say you
were stupid. I said that would be a stupid thing to do.
Now based on what you have learned so far what else could you be looking at
here? As you can see, Bar 1 is a Spinning Top which represents a possible pause or
reversal in trend doesn’t it? Also Bar 2 is a Doji, the strongest reversal candle
pattern. Then, like I mentioned there is that nasty resistance just above the high of
Bar 3. So now what do you do? You certainly don’t buy the market here and there
is no reason to sell the market, yet anyway. So you sit and wait, that’s what you do.
But what are you waiting for? You guessed it, a Blip Reversal.
Page | 33

Obviously the same “rules” will apply to a Bottom Blip in a downtrend. Just be
aware of “what’s going on” around the Blips when you see them. See what
happened with the above Blip Reversal in Example 27! I bet you anything you are
chomping at the bit to start trading Blips. But please wait because there is a whole
lot more that we are going to be covering.
Page | 34
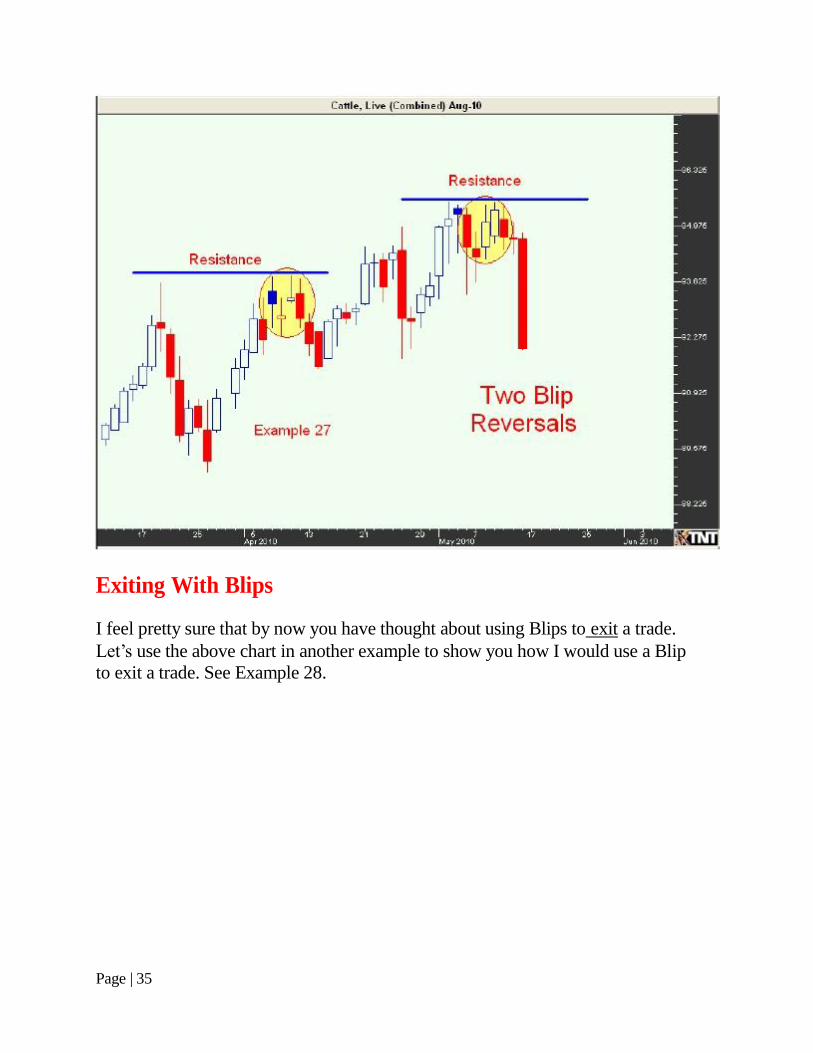
Exiting With Blips
I feel pretty sure that by now you have thought about using Blips to exit a trade.
Let’s use the above chart in another example to show you how I would use a Blip
to exit a trade. See Example 28.
Page | 35

Blips at Support & Resistance Levels
Just like I mentioned in the above example, you can use a Blip to exit a trade when
it forms resistance especially if it does a Blip Reversal.
When you start looking for Blips they will start to jump off the chart because they
are so obvious. I’m sure if you have been looking at some other charts since you
began this course you spotted dozens of them if not hundreds. And of course, they
have been there all along. Aren’t you glad you are learning about trading Blips! Page | 36

Using Indicators & Blips
I’m almost positive that you are using one or more indicators with your charts and
so do I. The two that are my favorite to use with Blips are MACD and Slow
Stochastics. Let’s first look at the definition of these two indicators and then we
will look at how to use them when trading Blips.
Stochastics:
Markets that are heading higher tend to close near the top of the daily range, while
markets that are heading lower tend to close near the bottom of the range.
Stochastics was invented by George Lane and attempts to measure this.
Stochastics is displayed as two lines. The main line is called the %K, and the
second line is called %D, (which is a moving average of %K). Most of the time,
the %K is shown as a solid line and the %D as a broken or dotted line.
Page | 37

Most people use one or all of the following methods to interpret this indicator.
1. Buy when either the %K (lighter line) or the %D (darker line)
falls below a specific level and then rises above that level. Sell when the Oscillator
rises above a specific level. I use 80 and 20 in my software but some people use 70
and 30. Every market is a little different. Look at a chart and switch between the
above settings and see which one more closely reflects what the market actually
did. Usually one is much more accurate than the other.
2. Buy when the %K line rises above (crosses) the %D line, and sell when the %K
line falls below (crosses) the %D line.
3. Many people look for divergence where prices are making new highs yet the
Oscillator is not making or surpassing previous highs. See Example 30 below:
Page | 38

On the chart above, notice that at each trend reversal, Slow Stochastics was
showing an overbought, or oversold, condition. You can use this indicator to help
confirm what you feel could be a trend reversal based on what the chart is showing
you. Did you catch the Double Bottom?
Look at the previous chart at where the current price is. Based on Stochastics, what
do you think the price may do? What I see is that Stochastics is getting into the
overbought area above 90, and if it drops back below 90 and the lines cross, we
might have a price reversal. Can you tie this into the fact that there is strong
resistance just above the current price? Could there be a major 50% level about to
form?
Let’s also look at the same chart and use the Fast Stochastics indicator. Which one
do you think is more accurate? I tend to use the Slow Stochastics much more than
I do Fast Stochastics, but this is a personal decision. You might like Fast
Stochastics better. The major difference between Slow and Fast Stochastics is this
that Fast Stochastics adds a more sensitive %K line. Most traders, including
myself, prefer the Slow Stochastics and feel it gives a more reliable reading.
Page | 39

In Example 31, trading has ended. Let’s take a look at the next contract month
chart and see what the price did. Could you have used Stochastics to determine
beforehand the direction the price should have gone?
Notice on the next two charts that the price continued to rally for a couple of
weeks, and that Stochastics went above 90 and stayed there until the price started
to drop. As soon as the Slow, and Fast, Stochastics dropped below 90 and the lines
crossed, the trend reversed.
I tend to think that the Slow Stochastics is a more reliable indicator— but then
again, it’s a matter of personal preference.
Page | 40

MACD: Moving Average Convergence/Divergence
The MACD is one of my favorite indicators and I have found it to be extremely
reliable most of the time. See Example 34.
Page | 41

Notice how uncannily accurate the MACD was on the above chart. Now, I think
you can see why I like this indicator so much. Can you imagine seeing a Double
Bottom, Bottom Blip, and MACD crossing all at the same time? It happens, but
you have to be watching for it. I call these events “Hammer Trades” because if you
see them but don’t trade them, then you need to hit yourself in the head with a
hammer. Maybe that will knock some Common Sense into you. Don’t you just
love all the puns that can be made with “common sense”?
Not only can you tell when to get into a market with this, you can also use it to
tell you when to get out of a market. Watch it closely!
Look at the following chart as well. It’s the same chart as above, except it has both
the Slow Stochastics and the MACD showing on the same chart.
Page | 42
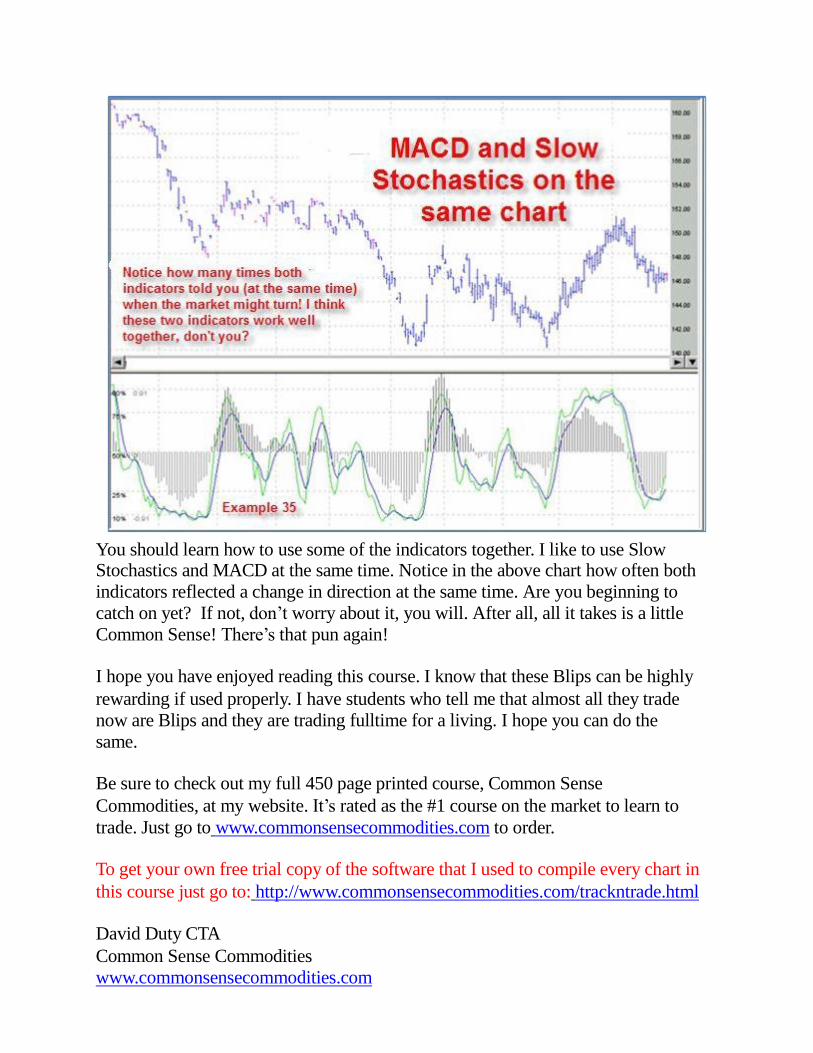
You should learn how to use some of the indicators together. I like to use Slow
Stochastics and MACD at the same time. Notice in the above chart how often both
indicators reflected a change in direction at the same time. Are you beginning to
catch on yet? If not, don’t worry about it, you will. After all, all it takes is a little
Common Sense! There’s that pun again!
I hope you have enjoyed reading this course. I know that these Blips can be highly
rewarding if used properly. I have students who tell me that almost all they trade
now are Blips and they are trading fulltime for a living. I hope you can do the
same.
Be sure to check out my full 450 page printed course, Common Sense
Commodities, at my website. It’s rated as the #1 course on the market to learn to
trade. Just go to www.commonsensecommodities.com to order.
To get your own free trial copy of the software that I used to compile every chart in
this course just go to: http://www.commonsensecommodities.com/trackntrade.html
David Duty CTA
Common Sense Commodities
www.commonsensecommodities.com

USA phone (850) 417-7230 CST
Skype ID: david.duty
To order the full 450 page printed course, Common Sense
Commodities, and Common Sense Options or to find out
information about the all new, David Duty eLearning
Center, please visit my website at
www.commonsensecommodities.com
Page | 44

DISCLAIMER
THE INFORMATION CONTAINED HEREIN IS BELIEVED TO BE RELIABLE BUT
CANNOT BE GUARANTEED AS TO RELIABILITY, ACCURACY, OR
COMPLETENESS. COMMON SENSE COMMODITIES, AND/OR DAVID G. DUTY,
WILL NOT BE RESPONSIBLE FOR ANYTHING, WHICH MAY RESULT FROM ONE’S
RELIANCE ON THIS MATERIAL, NOR THE OPINIONS EXPRESSED HEREIN.
DISCLOSURE OF RISK: THE RISK OF LOSS IN TRADING FUTURES AND OPTIONS
CAN BE SUBSTANTIAL; THEREFORE, ONLY GENUINE RISK FUNDS SHOULD BE
USED. FUTURES AND OPTIONS MAY NOT BE SUITABLE INVESTMENTS FOR ALL
INDIVIDUALS, AND INDIVIDUALS SHOULD CAREFULLY CONSIDER THEIR
FINANCIAL CONDITION IN DECIDING WHETHER TO TRADE. OPTION TRADERS
SHOULD BE AWARE THAT THE EXERCISE OF A LONG OPTION WOULD RESULT
IN A FUTURES POSITION.
HYPOTHETICAL PERFORMANCE RESULTS HAVE MANY INHERENT
LIMITATIONS, SOME OF WHICH ARE DESCRIBED BELOW.
NO REPRESENTATION IS BEING MADE THAT ANY PERSON WILL, OR IS LIKELY
TO, ACHIEVE PROFITS OR LOSSES SIMILAR TO THOSE SHOWN IN THIS COURSE.
IN FACT, THERE ARE FREQUENTLY SHARP DIFFERENCES BETWEEN
HYPOTHETICAL PERFORMANCE RESULTS AND THE ACTUAL RESULTS
SUBSEQUENTLY ACHIEVED BY ANY PARTICULAR TRADING METHOD.
ONE OF THE LIMITATIONS OF HYPOTHETICAL PERFORMANCE RESULTS IS THAT
THEY ARE GENERALLY PREPARED WITH THE BENEFIT OF HINDSIGHT. IN
ADDITION, HYPOTHETICAL TRADING DOES NOT INVOLVE FINANCIAL RISK,
AND NO HYPOTHETICAL TRADING RECORD CAN COMPLETELY ACCOUNT FOR
THE IMPACT OF FINANCIAL RISK IN ACTUAL TRADING. FOR EXAMPLE, THE
ABILITY TO WITHSTAND LOSSES OR TO ADHERE TO A PARTICULAR TRADING
PROGRAM, IN SPITE OF TRADING LOSSES, ARE MATERIAL POINTS WHICH CAN
ALSO ADVERSELY AFFECT ACTUAL TRADING RESULTS. THERE ARE NUMEROUS
OTHER FACTORS RELATED TO THE MARKETS, IN GENERAL, OR TO THE
IMPLEMENTATION OF ANY SPECIFIC TRADING PROGRAM WHICH CANNOT BE
FULLY ACCOUNTED FOR IN THE PREPARATION OF HYPOTHETICAL
PERFORMANCE RESULTS AND ALL OF WHICH CAN ADVERSELY AFFECT
ACTUAL TRADING RESULTS.
Page | 45