Blending Big Data Analytics: Review on Challenges and a ...
17
SPECIAL SECTION ON DATA MINING FOR INTERNET OF THINGS Received May 13, 2019, accepted May 25, 2019, date of publication June 17, 2019, date of current version January 7, 2020. Digital Object Identifier 10.1109/ACCESS.2019.2923270 Blending Big Data Analytics: Review on Challenges and a Recent Study FAIRUZ AMALINA 1 , IBRAHIM ABAKER TARGIO HASHEM 2 , ZATI HAKIM AZIZUL 1 , ANG TAN FONG 1 , AHMAD FIRDAUS 3 , MUHAMMAD IMRAN 4 , AND NOR BADRUL ANUAR 1 1 Faculty of Computer Science and Information Technology, University of Malaya, Kuala Lumpur 50603, Malaysia 2 School of Computing and Information Technology, Taylor’s University, Subang Jaya 47500, Malaysia 3 Faculty of Computer Systems and Software Engineering, University Malaysia Pahang, Kuantan 26600, Malaysia 4 College of Computer and Information Sciences, King Saud University, Riyadh 11451, Saudi Arabia Corresponding authors: Fairuz Amalina ([email protected]) and Nor Badrul Anuar ([email protected]) This work was supported in part by the University Malaya Research Fund Assistance (BKP) under Grant BKS058-2017, in part by the Fundamental Research Grant Scheme under Ministry of Education Malaysia, under Grant FRGS/1/2018/ICT03/UM/02/3, and in part by the Deanship of Scientific Research, King Saud University, through the Research Group Project under Grant RG-1435-051. ABSTRACT With the collection of massive amounts of data every day, big data analytics has emerged as an important trend for many organizations. These collected data can contain important information that may be key to solving wide-ranging problems, such as cyber security, marketing, healthcare, and fraud. To analyze their large volumes of data for business analyses and decisions, large companies, such as Facebook and Google, adopt analytics. Such analyses and decisions impact existing and future technology. In this paper, we explore how big data analytics is utilized as a technique for solving problems of complex and unstructured data using such technologies as Hadoop, Spark, and MapReduce. We also discuss the data challenges introduced by big data according to the literature, including its six V’s. Moreover, we investigate case studies of big data analytics on various techniques of such analytics, namely, text, voice, video, and network analytics. We conclude that big data analytics can bring positive changes in many fields, such as education, military, healthcare, politics, business, agriculture, banking, and marketing, in the future. INDEX TERMS Big data analytics, data analytics, deep learning, machine learning. I. INTRODUCTION The promising technology of today has enlarged user depen- dency on digital devices contributing to the increment of abundant data every second. The Cisco Visual Network- ing Index shows that the global mobile data traffic reached 11.2 exabytes monthly in 2017, and forecast depicts a raise of 13 folds over the next five years [1]. This high traf- fic rate produces ‘‘big data,’’ and the data analysis process periodically differs according to data types. Data have three types, namely, structured, semi-structured, and unstructured. Structured data rely upon big data analytics, whereas unstruc- tured data produce more content than companies have ever produced [2]. Unstructured data include text-based conversa- tions on social media, photos, video recordings, live videos, and sensor data. Traditional data analysis methods are not The associate editor coordinating the review of this manuscript and approving it for publication was Chun-Wei Tsai. that effective in analyzing these large-scale and complex data. Therefore, almost 80% of companies have low vis- ibility into their unstructured data and limited knowledge on managing such data [3]. With unstructured data, mod- ern businesses require new methods to analyze various big data [4]. New methods, namely, artificial intelligence (AI), machine learning, association rule learning, classification tree analysis, genetic algorithm, regression analysis, senti- ment analysis, and social network analysis are widely used in data analysis techniques. These methods also affect the way data are examined [5]. Thus, revisiting and redesign- ing data analysis methods are now trends in modern busi- nesses, especially changing the decision-making process. For example, the adoption of text analytics in decision making has grown from 15% to 45% within the past three years, social media analytics from 17% to 46%, geospatial analyt- ics from 17% to 37%, and predictive analytics from 28% to 51% [6]. VOLUME 8, 2020 This work is licensed under a Creative Commons Attribution 4.0 License. For more information, see http://creativecommons.org/licenses/by/4.0/ 3629
Transcript of Blending Big Data Analytics: Review on Challenges and a ...

SPECIAL SECTION ON DATA MINING FOR INTERNET OF THINGS
Received May 13, 2019, accepted May 25, 2019, date of publication June 17, 2019, date of current version January 7, 2020.
Digital Object Identifier 10.1109/ACCESS.2019.2923270
Blending Big Data Analytics: Reviewon Challenges and a Recent StudyFAIRUZ AMALINA 1, IBRAHIM ABAKER TARGIO HASHEM2, ZATI HAKIM AZIZUL 1,ANG TAN FONG1, AHMAD FIRDAUS3, MUHAMMAD IMRAN 4,AND NOR BADRUL ANUAR 11Faculty of Computer Science and Information Technology, University of Malaya, Kuala Lumpur 50603, Malaysia2School of Computing and Information Technology, Taylor’s University, Subang Jaya 47500, Malaysia3Faculty of Computer Systems and Software Engineering, University Malaysia Pahang, Kuantan 26600, Malaysia4College of Computer and Information Sciences, King Saud University, Riyadh 11451, Saudi Arabia
Corresponding authors: Fairuz Amalina ([email protected]) and Nor Badrul Anuar ([email protected])
This work was supported in part by the University Malaya Research Fund Assistance (BKP) under Grant BKS058-2017, in part by theFundamental Research Grant Scheme under Ministry of Education Malaysia, under Grant FRGS/1/2018/ICT03/UM/02/3, and in part bythe Deanship of Scientific Research, King Saud University, through the Research Group Project under Grant RG-1435-051.
ABSTRACT With the collection of massive amounts of data every day, big data analytics has emerged as animportant trend for many organizations. These collected data can contain important information that may bekey to solving wide-ranging problems, such as cyber security, marketing, healthcare, and fraud. To analyzetheir large volumes of data for business analyses and decisions, large companies, such as Facebook andGoogle, adopt analytics. Such analyses and decisions impact existing and future technology. In this paper,we explore how big data analytics is utilized as a technique for solving problems of complex and unstructureddata using such technologies as Hadoop, Spark, and MapReduce. We also discuss the data challengesintroduced by big data according to the literature, including its six V’s. Moreover, we investigate casestudies of big data analytics on various techniques of such analytics, namely, text, voice, video, and networkanalytics. We conclude that big data analytics can bring positive changes in many fields, such as education,military, healthcare, politics, business, agriculture, banking, and marketing, in the future.
INDEX TERMS Big data analytics, data analytics, deep learning, machine learning.
I. INTRODUCTIONThe promising technology of today has enlarged user depen-dency on digital devices contributing to the increment ofabundant data every second. The Cisco Visual Network-ing Index shows that the global mobile data traffic reached11.2 exabytes monthly in 2017, and forecast depicts a raiseof 13 folds over the next five years [1]. This high traf-fic rate produces ‘‘big data,’’ and the data analysis processperiodically differs according to data types. Data have threetypes, namely, structured, semi-structured, and unstructured.Structured data rely upon big data analytics, whereas unstruc-tured data produce more content than companies have everproduced [2]. Unstructured data include text-based conversa-tions on social media, photos, video recordings, live videos,and sensor data. Traditional data analysis methods are not
The associate editor coordinating the review of this manuscript andapproving it for publication was Chun-Wei Tsai.
that effective in analyzing these large-scale and complexdata. Therefore, almost 80% of companies have low vis-ibility into their unstructured data and limited knowledgeon managing such data [3]. With unstructured data, mod-ern businesses require new methods to analyze various bigdata [4]. New methods, namely, artificial intelligence (AI),machine learning, association rule learning, classificationtree analysis, genetic algorithm, regression analysis, senti-ment analysis, and social network analysis are widely usedin data analysis techniques. These methods also affect theway data are examined [5]. Thus, revisiting and redesign-ing data analysis methods are now trends in modern busi-nesses, especially changing the decision-making process. Forexample, the adoption of text analytics in decision makinghas grown from 15% to 45% within the past three years,social media analytics from 17% to 46%, geospatial analyt-ics from 17% to 37%, and predictive analytics from 28%to 51% [6].
VOLUME 8, 2020 This work is licensed under a Creative Commons Attribution 4.0 License. For more information, see http://creativecommons.org/licenses/by/4.0/ 3629

F. Amalina et al.: Blending Big Data Analytics: Review on Challenges and a Recent Study
Big data analytics adopts complexity [5] and the conceptsof the six V’s in big data characteristics, which includevolume, velocity, variety, variability, veracity, and value.Withthe adoption, the current data analytics requires new tech-niques in handling enormous data. In addition, the analyticprocess becomes complex with massive data from severalsources. Subsequently, the input helps in the creation of animpactful analytic process and facilitates the decision-makingprocess with easy analysis and accurate prediction results [7].Hadoop, Spark, MapReduce, SAS, and Rapid Miner offerflexibility, scalability, and good performance to improvethe analytic process [8], [9]. These advanced tools co-existwith programming languages, such as Python, Scala, andR and SQL. This coexistence boosts the potential of big dataanalytics in transforming unstructured to structured data inmany domains unlimited to smart city [10], healthcare [11],military [12], business [13], education [14], andtransportation [15].
The promising improvement in big data performanceseems engaging; 60% of enterprises were expected tohave Hadoop clusters running in production by the endof 2018 [16]. With this outlook, big data analytics is set toovertake traditional data analysis, allowing further supportin processing enormous data and real-time response [17].The capacity to acquire, store, process a large amount ofdata in various formats, and deliver meaningful informa-tion to users is also known as predictive analytics, whichimmensely impacts various domains [18]. For example inhealthcare, predictive analytics can derive a potential mar-ket in a clinical trial after following insight patterns fromthe patient medical record [18]. Predictive analytics is alsorequired in businesses to provide insights using data man-agement, infrastructure, and talent capability and thus trans-form companies into a competitive force [19]. In addition,predictive analytics on security log data benefits intelligentsecurities with a strategy to predict, prevent, and mitigatefuture cyber-attacks [20]. This important feature of big dataanalytics can help businesses uncover new opportunities.However, the feature is still in infancy and is open for futurework.
The perspective for future studies provides researchers anopportunity to explore few familiar areas in big data analyt-ics, such as definite tools and existing analytics techniques.Katal et al. [21] discussed the issues and challenges in bigdata and suggested only two types of tools, namely, HadoopandMapReduce for data analytics. They explained the impor-tance of big data in various projects and domains, but theyinsufficiently provided information about tools. Another liter-ature has discussed several big data analytics techniques, butcoverage on tools is limited [22]. Gandomi and Haider [23]focused on geospatial analytics providing insufficient cover-age on the overall analytics techniques. To overcome the gapin the literature, the current study explores big data analyticstechniques that have emerged in the 2014-2019, focusingon how data are analyzed and detailing popular tools andprogramming languages used by industries and businesses.
This research also discusses the popular implementation ofthe deep learning method in data analytics. We believe thisstudy can help synthesize the general understanding of bigdata analytics, the suitability of tools and programming lan-guages, along with different big data analytics methods usedin various domains.
The motivation for utilizing blending big data analyt-ics to discover intricate structure in high dimensional datacan be viewed in various domains of science, business andgovernment. Moreover, many studies have been conductedto solve big data problem, however, new researchers stillstruggling to find a suitable research topic for their study.So that, to broaden the point of view in this issue, motivateus to creates a simple taxonomy in big data sources andstudy cases as an example for each type that help to betterunderstanding on how the data are processed and analyze.Especially nowadays, the blending of big data analytics inthe various business domain becomes more competitive andcomplex.
Our main contributions are: i) we summarize current toolsthat are widely used in providing meaningful analysis of alarge set of data, ii) we briefly discuss case studies in blendingwith big data sources that highlight how the analytics helpscholars and companies leverage data sources with analyticsfor driving productivity, and iii) we also discuss case studieson analytics usage by the scholars for their projects whichfocuses on problem and solutions. In addition, the study aimsto investigate and explore the big data analytics techniquesused by industries by focusing on certain case studies invarious domains. We describe the recent big data definitionand its challenges in handling modern data. We also discussthe big data analytics categories, which focus on the six bigdata analytics techniques, namely, text, visual, voice, video,network, and geospatial analytics. These big data analyticstechniques are summarized according to their aims, how theauthors analyzed their data, and the preferred programminglanguages and platforms used for their analyses. Moreover,we highlight the justification behind the authors’ preferencefor certain programming languages when handling big data.To visualize analytics practice in many industry domains, wealso discuss recent trends in blending deep learning tech-niques into data analytics for future enhancement in bigdata.
Section 2 discusses the state of the art in the big data stud-ies, including their latest perspectives, along with the recentdefinitions and the latest challenges in handling modern data.Section 3 reviews the categories of data analytics, togetherwith their associated recent studies and programming lan-guages, the advantages, and the limitations. Section 4 summa-rizes the most recent trend of data analytics, particularly theemergence of new technologies, such as blending data ana-lytics with deep learning in the big data. Section 5 providesfive latest case studies to illustrate the practical case of therecent data analytics in modern business. Finally, Section 6draws the conclusion by pointing out the future direction ofdata analytics.
3630 VOLUME 8, 2020

F. Amalina et al.: Blending Big Data Analytics: Review on Challenges and a Recent Study
II. BIG DATA ANALYTICSAccording to IBM [24], their big data analytics divisiondefines big data as a term that applies to the size of a datasetthat is beyond traditional databases. The dataset characteristicincludes high volume, velocity, and variety and is gener-ated in large scales. The generated big data helps analysts,researchers, and businessmen make good decisions by usingseveral techniques, namely, machine learning, predictive ana-lytics, data mining, statistics, text analytics, and deep learninganalytics. The following subsections discuss the big datadefinition, challenges in big data, and challenges in handlingmodern data.
A. BIG DATABig data is a combination of various factors, such as time anddata type. Big data consists of large volumes of high velocity,complex, and variable data, which need advanced methodsand technologies to capture, store, distribute, manage, andanalyze information [25]. Among the reviewed studies in theliterature [23], [26]–[29] reported a nearly complete charac-terization of big data. Gandomi and Haider [23] defined bigdata volumes as various factors such as time and data type.The reason is that everything that may translate in what bigdata is today unfortunately undescribed the true definition inthe future. In addition, Zhang et al. [30] mentioned that bigdata is unnecessarily referred to as simply a large volume ofdata when it has other features that increase its complexityand result in unique characteristics that differentiate big datafrom other data. Finally, the complete definition we consideris the six V’s and complexity [5]. The big data analytics aimsto provide an alternative to a traditional solution on the basisof databases and data analyses. The solution also aims toanalyze the raw big data to make sense of them and exploittheir value. Based on these observations, the fundamentalresearch on big data solution is critical for the future digitalapplication.
B. BIG DATA CHALLENGESFollowing the characteristics of the ‘‘Big Data’’ byGani et al. [5], the challenges in the big data of the six V’sare volume, velocity, value, variability, veracity, variety, andcomplexity. These characteristics have been exploited in theirbig data definition. All these characteristics are explainedand discussed to visualize the big data challenges for bigdata techniques. They explained how their technique revealsdifferent data formations and update speeds to observe theirbehavior. They stated that big data requires a techniqueapplied to the big data characteristics in optimizing searchperformance with a good time–space index tradeoff. In ourliterature, we describe these big data characteristics as theindirect challenges in the implementation of big data ana-lytics. The six V’s and complexity big data challenges aredefined below.
Volume: refers to the vast growth of applications and socialmedia user addiction that lead to a huge volume of big datafrom unlimited sources, such as Facebook content, Google,
games, and Netflix. Hardware and software applicationsrequire the handling of such data, which become challengingto analyze and store [31].
Variety is related to the interdisciplinary type of data,which are typically collected from a different source, for-mat, and type. Such data are either from sensors, mobiledevices, corporate documents, satellite images, or social net-works. These data are usually in the form of structured, semi-structured, and unstructured data [32]. These various types ofdata require the use of suitable tools or software for analyzingthe data. Finding perfect tools or software is challengingfor data scientists, analysts, or researchers due to certainconstraints.
Veracity refers to the accuracy and truthfulness of thecollected big data. For example, when we collect real-timedata, data corruption or manipulation may occur. Therefore,data staging, which involves cleaning, transforming, filter-ing, or normalizing data, is necessary to discard any irrel-evant information. Data staging becomes challenging whendata volume is large, thus cleaning the data also becomesdifficult [21].
Velocity: refers to the generation of data and speed rate ofthe analysis process. Velocity plays a crucial part in stream-ing real-time data, in which data are generated by onlinetransaction, social network, video audio, or map visualiza-tion. Thus, streaming and real-time analysis are challeng-ing enough because of big data’s current infrastructure andrequired use of a new learning algorithm for efficient andtimely information extraction [7].
Value is an important aspect of big data in determin-ing whether the discovered data are meaningful and usefulfor analysis. However, doing so is also a challenging taskbecause data validation is already complex, given the abun-dant datasets on the line waiting to process [26].
Variability refers to the variation in the data flow that mayoccur when the flow is difficult to maintain. This data flowis also caused by the unstable increasing data load usage ofsocial media [5].
Complexity: relates to the challenging task in processingthe countless generated sources in big data. The processincludes finding an interconnection among data from differ-ent sources [23].
C. DATA CHALLENGESThe advancement in the digital world produces unstructuredbig data in various forms and sizes. Such data come withseveral challenges in modern data handling. Hence, severalexisting challenges in handling modern data, such as storagemodel, privacy and data security, and analysis methods andapplications, are discussed as follows.
1) STORAGE MODELMillions of new Internet of Things (IoT) devices are cur-rently connected to the Internet daily. As an explosive socialmedia, Facebook itself is a great contributor to big data.Considering the huge demands of big data on networks, many
VOLUME 8, 2020 3631

F. Amalina et al.: Blending Big Data Analytics: Review on Challenges and a Recent Study
organizations switch from traditional storage and servers out-sourcing their data to cloud storage. However, data size istoo big, thus uploading such data to the cloud storage in realtime is challenging [21]. In addition, cloud remote sensingapplication demands real-time processing capacities, such aslarge-scale debris flow investigation, flood hazard manage-ment, and surveillance of large ocean oil spills. However,the big data derived from remote sensing is excessively large,and the resulting increase in the complexity of the data cancause the timely storage and processing of large volumes ofmulti-dimensional RS data data-intensive and computation-ally challenging [33].
2) PRIVACY AND DATA SECURITYAlthough big data analytics has become popular in recentyears, dealing with a large amount of data in terms of privacyremains an open issue. The reason is that data are decentral-ized as they come from variable sources, such as sensors,mobile devices, and IoT devices. Moreover, analyzing het-erogeneous data source has become a privacy and securityproblem due to the communication with other external sys-tems. Ensuring that the source is not compromised by anyattacks is also necessary [8]. For example, in healthcare bigdata, smuggling recoverable data becomes a great concern inbig data analytics. This case must be thoroughly mitigatedto prevent another invasion of patient security and privacy.This incident urges the big data to rethink privacy for ana-lytics and developers with privacy agreements to keep thedata confidential if changes in application or privacy regu-lation occur [34], [35]. In addition, General data protectionregulation (GDPR) has the authority to control consumerspersonal data collected by businesses to maintain compliancewith new data protection and privacy laws [36]. The GDPReffect on data ethics at large when companies require toanonymize their data unless identifying information is crucialto its worthiness. In a case of the predictive personalizedprofile, profiling technique can create a new knowledge thatturns personal data into personal actions and behaviors. Theprofiling technique can affect people’s lives in a good andbad intention to steer social and technological process [37].However, inappropriate use of personal data can damage acompany’s brand, which happened with Facebook’s stockdecreased over the US $100 billion following news coverageof data breach involving Cambridge Analytica [38].
3) ANALYSIS METHODSBig data analysis is important to make a huge amount ofdata useful and meaningful. Big data analysis has two mainpoints—to develop effective methods that can accuratelymake predictions and to gain insights into the relationshipamong features [39]. In handling inconsistent, uncertain,and complex data in big data, a true and suitable analysismethod is required. Thus, finding suitable analysis methodsand techniques that can handle inconsistent, uncertain, andcomplex data is another challenge facing by the data analystsand data scientists [28]. Moreover, several analytical methods
are available, such as inquisitive, predictive, prescriptive,and pre-emptive analytics. The potential of these analyticalmethods using big data is unlimited but restricted by theavailability of existing technologies, tools, and skills for bigdata analytics [40].
4) APPLICATIONSSeveral challenges exist in building an effective real-time bigdata application, including real-time event data transfer, sit-uation discovery, analytics, decision making, and responses.This application requires a deep understanding to create aneffective and efficient approach to improve development aswell as reduce risk and improve the quality of life [28].In addition, traditional application suffers from the analysisprocessing constraint, high computational processing, mem-ory limitation, and existing algorithm miscoordination whendealing with these high dimensional data. Analyzing bigdata requires computational complexities, such as machinelearning techniques with small memory requirement andfast processing time [41]. Hence, selecting a suitable bigapplication depends on the purpose. However, selectingapplication becomes complicated because some applicationsare incompatible with certain features. For example, a busi-ness intelligence (BI) application has data mining and predic-tive analytics features. Other applications include streamingfeatures.
III. BLENDING BIG DATA SOURCES FOR ANALYTICSThe exponential growth of big data has produced varioustypes of datasets from different situations and places. Thesedatasets pose many new challenges to conventional dataanalytics because of their large dimensionality, heterogene-ity, and complex features. New data analytics is neededto process and analyze data dynamically, given the chal-lenges in the conventional technique and owing to the threetypes of data, namely, structured data, unstructured data, andsemi-structured data. The structured data refer to the well-organized data in a way very easy to read and find. In thespreadsheet Table 1, consistent fields, such as transaction datastored in relational databases, are defined. Unstructured dataare essentially everything that is unspecific, and data becomedifficult as advance tools are required to access information.Unstructured data encompass text files, documents, emails,text messages, and social media posts. Semi-structured dataare unorganized data, which are more difficult to retrieve,analyze, and store than structured data. Note that structureddata require software, such as Hadoop (e.g., server or mobileapplication log files). Figure 1 provides the classification ofblending big data sources for analytics techniques, namely,text, visual, voice, network, and geospatial analytics. Theconcept of big data analytics is to deal with dissimilar andcomplex raw data input that mainly consists of unsuperviseddata of different sizes and have limited supervised data [42].This analytics is inspired by Gandomi and Haider [23] andexcludes geospatial data. Hence, Table 1 describes the def-inition of big data analytics according to its categories.
3632 VOLUME 8, 2020

F. Amalina et al.: Blending Big Data Analytics: Review on Challenges and a Recent Study
TABLE 1. Various categories of data analytics.
FIGURE 1. Big data taxonomy on data source.
Then, the following subsections discuss several case studiesaccording to the data sources.
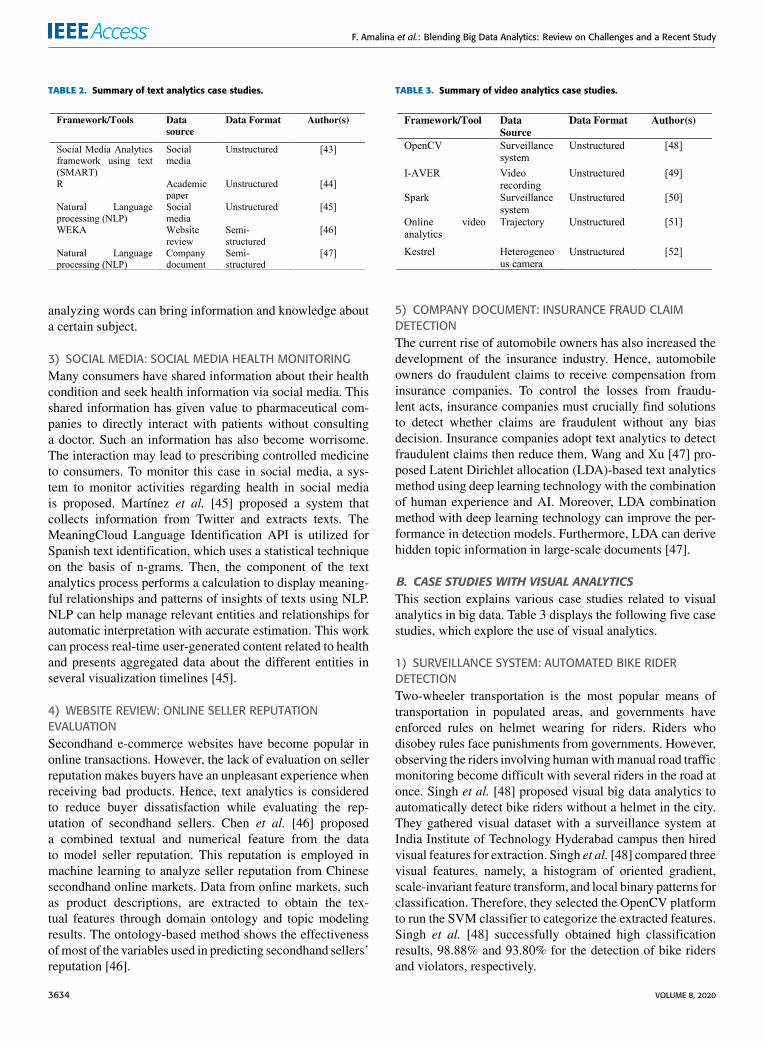
A. CASE STUDIES WITH TEXT ANALYTICSThis section discusses various case studies related to textanalytics in big data. Table 2 details the following five casestudies, which explore the use of text analytics.
1) SOCIAL MEDIA: PRODUCT DEFECT DISCOVERYThe increasing number of consumers has urged companies toexplore new ways in social media to find their brand testi-monial. Therefore, companies must discover product qualitywith text analytics. Abrahams et al. [43] proposed a frame-work called social media analytics using text, which detectsa product defect from social media posting in the vehicleand consumer electrics domain. The ‘‘defect’’ described inthe social media content is collected, and the features are
categorized into types, namely, context independent and con-text specific. Then, the classification accuracy is comparedusing first-order features. Abrahams et al. [43] improved thedefect detection domain.
2) ACADEMIC PAPER: MAIN CONCEPT DISCOVERYBI has drawn the attention of researchers in widely exploringacademic papers. However, the large quantity of academicpapers that are available online increase researchers’ diffi-culty in identifying the main concept surrounding BI withinmost of the relevant papers. Ishikiriyama et al. [44] proposedtext analytics to analyze the relevant academic papers usingsoftware R-project. They identified the main concepts sur-rounding BI in the top 35 samples out of 100,115 papers.The author broke single words to keywords and calculatedthe frequency of the keywords in the sample by word group.From the frequency number of keywords, [44] concluded that
VOLUME 8, 2020 3633
F. Amalina et al.: Blending Big Data Analytics: Review on Challenges and a Recent Study
TABLE 2. Summary of text analytics case studies.
analyzing words can bring information and knowledge abouta certain subject.
3) SOCIAL MEDIA: SOCIAL MEDIA HEALTH MONITORINGMany consumers have shared information about their healthcondition and seek health information via social media. Thisshared information has given value to pharmaceutical com-panies to directly interact with patients without consultinga doctor. Such an information has also become worrisome.The interaction may lead to prescribing controlled medicineto consumers. To monitor this case in social media, a sys-tem to monitor activities regarding health in social mediais proposed. Martínez et al. [45] proposed a system thatcollects information from Twitter and extracts texts. TheMeaningCloud Language Identification API is utilized forSpanish text identification, which uses a statistical techniqueon the basis of n-grams. Then, the component of the textanalytics process performs a calculation to display meaning-ful relationships and patterns of insights of texts using NLP.NLP can help manage relevant entities and relationships forautomatic interpretation with accurate estimation. This workcan process real-time user-generated content related to healthand presents aggregated data about the different entities inseveral visualization timelines [45].
4) WEBSITE REVIEW: ONLINE SELLER REPUTATIONEVALUATIONSecondhand e-commerce websites have become popular inonline transactions. However, the lack of evaluation on sellerreputation makes buyers have an unpleasant experience whenreceiving bad products. Hence, text analytics is consideredto reduce buyer dissatisfaction while evaluating the rep-utation of secondhand sellers. Chen et al. [46] proposeda combined textual and numerical feature from the datato model seller reputation. This reputation is employed inmachine learning to analyze seller reputation from Chinesesecondhand online markets. Data from online markets, suchas product descriptions, are extracted to obtain the tex-tual features through domain ontology and topic modelingresults. The ontology-based method shows the effectivenessofmost of the variables used in predicting secondhand sellers’reputation [46].
TABLE 3. Summary of video analytics case studies.
5) COMPANY DOCUMENT: INSURANCE FRAUD CLAIMDETECTIONThe current rise of automobile owners has also increased thedevelopment of the insurance industry. Hence, automobileowners do fraudulent claims to receive compensation frominsurance companies. To control the losses from fraudu-lent acts, insurance companies must crucially find solutionsto detect whether claims are fraudulent without any biasdecision. Insurance companies adopt text analytics to detectfraudulent claims then reduce them. Wang and Xu [47] pro-posed Latent Dirichlet allocation (LDA)-based text analyticsmethod using deep learning technology with the combinationof human experience and AI. Moreover, LDA combinationmethod with deep learning technology can improve the per-formance in detection models. Furthermore, LDA can derivehidden topic information in large-scale documents [47].
B. CASE STUDIES WITH VISUAL ANALYTICSThis section explains various case studies related to visualanalytics in big data. Table 3 displays the following five casestudies, which explore the use of visual analytics.
1) SURVEILLANCE SYSTEM: AUTOMATED BIKE RIDERDETECTIONTwo-wheeler transportation is the most popular means oftransportation in populated areas, and governments haveenforced rules on helmet wearing for riders. Riders whodisobey rules face punishments from governments. However,observing the riders involving humanwithmanual road trafficmonitoring become difficult with several riders in the road atonce. Singh et al. [48] proposed visual big data analytics toautomatically detect bike riders without a helmet in the city.They gathered visual dataset with a surveillance system atIndia Institute of Technology Hyderabad campus then hiredvisual features for extraction. Singh et al. [48] compared threevisual features, namely, a histogram of oriented gradient,scale-invariant feature transform, and local binary patterns forclassification. Therefore, they selected the OpenCV platformto run the SVM classifier to categorize the extracted features.Singh et al. [48] successfully obtained high classificationresults, 98.88% and 93.80% for the detection of bike ridersand violators, respectively.
3634 VOLUME 8, 2020

F. Amalina et al.: Blending Big Data Analytics: Review on Challenges and a Recent Study
2) CCTV: INTELLIGENT AUDIO-VISUAL EMOTIONRECOGNITIONMany companies nowadays realize that customer satisfactionon services or products is the key to business success. Hence,various works increasingly use customer relationship man-agement (CRM) to emphasize customer relationships. How-ever, CRM usually provides the stand-alone audio miningtechnique to identify customer emotion through voice tone.Seng and Ang [49] claimed that providing further insightsinto customer emotion through voice tone only is inaccurate.Therefore, voice and visual emotion recognition must becombined. Customer satisfaction analysis is then performedusing visual and audio analytics system for a contact cen-ter. The combination of audio and visual analytics for theemotion recognition module can recognize the six universalemotions (happy, angry, sad, disgusted, surprised, and afraid).The video recording captures the customers’ faces (visualdata), and voice from speech (audio data), thereby allowingthe transformation from emotion to customer satisfactionscore [49].
3) SURVEILLANCE SYSTEM: TUNING HYPER-PARAMETEROPTIMIZATIONMany cameras are installed in various places in cities totrack or allocate the person of interest. These cameras pro-duce videos and have consumed massive data, which areimpossible for humans to manually process. Such data alsolead to many hyperparameters. Selecting precise parametersis time consuming, and the possibility of an inaccurate resultis high. Yaseen et al. [50] proposed hyper-parameter tuningthrough a mathematical model and optimized the parame-ters to achieve high object classification accuracy. They alsoadopted Spark for parallel and distributed training for objectclassification with the deep convolutional neural network(CNN). Several parameters are tracked during the trainingof deep CNN and are represented in the form of a graphmultiple times to identify the pattern in the system. Then,the result generated by tuning the hyperparameter is ana-lyzed, and various values are obtained. Finally, parametersthat can produce the best results are suggested. However, thistechnique works quickly for small networks only and per-fectly fits matrix computation scenarios, which usually occurin CNN [50].
4) DRONE TRAJECTORY: MODEL PREDICTIVECOMPRESSIONIn remote areas or disaster zones, drones are deployedas a surveillance to collect site survey videos and detectand track multiple targets. However, the traditional methodanalyzes such videos in offline mode after drones flybecause of the network bandwidth and limited computationalcapability. Current video analytics allows online analysisby video compression approach to minimize the networkbandwidth and maximize the application utility. Hence,Chowdhery and Chiang [51] implemented the model
TABLE 4. Summary of voice analytics case studies.
predictive compression to estimate overlapped areas amongsubsequent image frames on the basis of drone trajectory.Selected compressed images are then transmitted to theground station where images are processed using the machinevision pipeline. Doing so renders online video analytics andgives feedback to the compression module on drones [51].
5) HETEROGENEOUS CAMERA: MULTI-CAMERA VEHICLETRACKINGIn urban areas, multiple heterogeneous cameras are installedaround cities. Hence, heterogeneous cameras add constraintto power and video cloud processing limitations. In addition,the commercial surveillance system does not support hetero-geneous camera processing because the system requires thecentralized collection of videos. Therefore, Qiu et al. [52]contributed to Kestrel video analytics for vehicle tracking.Kestrel visual analytics provides captured vehicle images,and the system returns the sequence of cameras in which vehi-cles are seen. This analytics can quickly search for specificevents or sequences of events with CNN [52].
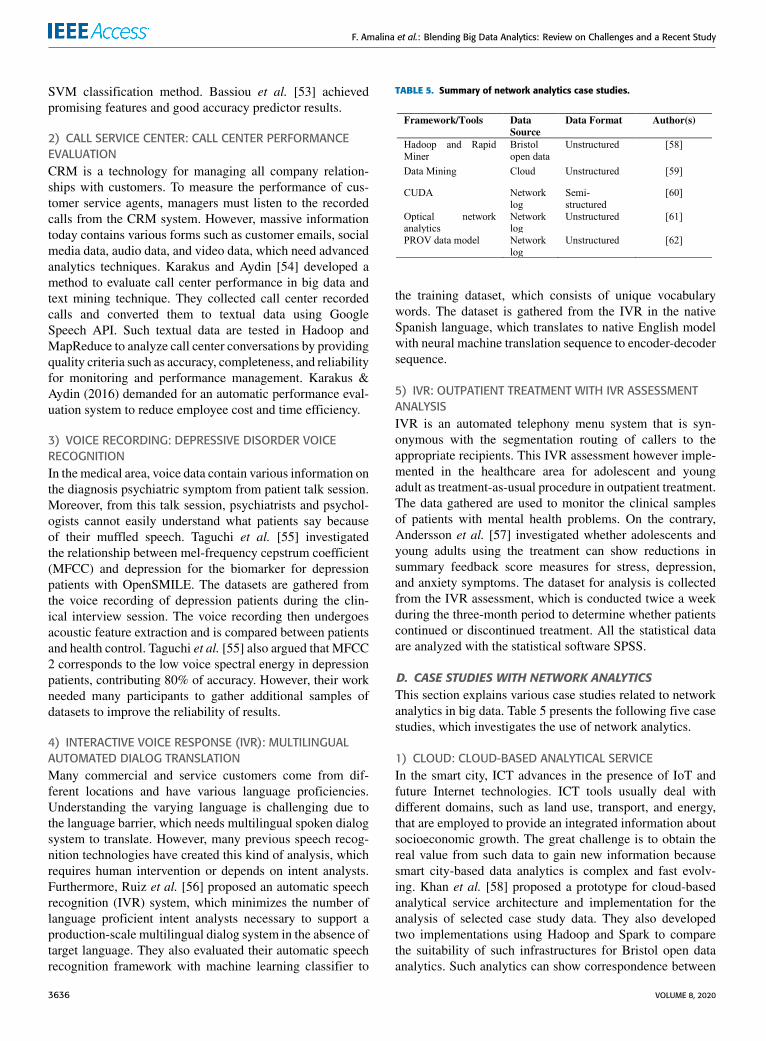
C. CASE STUDIES FOR VOICE ANALYTICSThis section discusses various case studies related to voiceanalytics in big data. Table 4 details the following case stud-ies, which explore the adoption of text analytics.
1) VOICE RECORDING: AUTOMATED VOICE ASSESSMENTSTUDENT COLLABORATIONCollaborative learning activities in classrooms usuallycontain information that is useful for analyzing simplebehaviors when working with students. Collaboration isan important skill for student learning development. Thisskill can also help teachers monitor student collaborativeactivities in classes or small groups with many students.Bassiou et al. [53] used student speech activity to predictthe non-lexical information quality of small group collabo-ration. They recorded student voices with individual noise-canceling microphones to the separated audio channel fromeach student. Then, speech activity detection identifies thedataset features on the high unweighted F1 measure esti-mated across a 10-fold cross-validation scheme using the
VOLUME 8, 2020 3635
F. Amalina et al.: Blending Big Data Analytics: Review on Challenges and a Recent Study
SVM classification method. Bassiou et al. [53] achievedpromising features and good accuracy predictor results.
2) CALL SERVICE CENTER: CALL CENTER PERFORMANCEEVALUATIONCRM is a technology for managing all company relation-ships with customers. To measure the performance of cus-tomer service agents, managers must listen to the recordedcalls from the CRM system. However, massive informationtoday contains various forms such as customer emails, socialmedia data, audio data, and video data, which need advancedanalytics techniques. Karakus and Aydin [54] developed amethod to evaluate call center performance in big data andtext mining technique. They collected call center recordedcalls and converted them to textual data using GoogleSpeech API. Such textual data are tested in Hadoop andMapReduce to analyze call center conversations by providingquality criteria such as accuracy, completeness, and reliabilityfor monitoring and performance management. Karakus &Aydin (2016) demanded for an automatic performance eval-uation system to reduce employee cost and time efficiency.
3) VOICE RECORDING: DEPRESSIVE DISORDER VOICERECOGNITIONIn the medical area, voice data contain various information onthe diagnosis psychiatric symptom from patient talk session.Moreover, from this talk session, psychiatrists and psychol-ogists cannot easily understand what patients say becauseof their muffled speech. Taguchi et al. [55] investigatedthe relationship between mel-frequency cepstrum coefficient(MFCC) and depression for the biomarker for depressionpatients with OpenSMILE. The datasets are gathered fromthe voice recording of depression patients during the clin-ical interview session. The voice recording then undergoesacoustic feature extraction and is compared between patientsand health control. Taguchi et al. [55] also argued that MFCC2 corresponds to the low voice spectral energy in depressionpatients, contributing 80% of accuracy. However, their workneeded many participants to gather additional samples ofdatasets to improve the reliability of results.
4) INTERACTIVE VOICE RESPONSE (IVR): MULTILINGUALAUTOMATED DIALOG TRANSLATIONMany commercial and service customers come from dif-ferent locations and have various language proficiencies.Understanding the varying language is challenging due tothe language barrier, which needs multilingual spoken dialogsystem to translate. However, many previous speech recog-nition technologies have created this kind of analysis, whichrequires human intervention or depends on intent analysts.Furthermore, Ruiz et al. [56] proposed an automatic speechrecognition (IVR) system, which minimizes the number oflanguage proficient intent analysts necessary to support aproduction-scale multilingual dialog system in the absence oftarget language. They also evaluated their automatic speechrecognition framework with machine learning classifier to
TABLE 5. Summary of network analytics case studies.
the training dataset, which consists of unique vocabularywords. The dataset is gathered from the IVR in the nativeSpanish language, which translates to native English modelwith neural machine translation sequence to encoder-decodersequence.
5) IVR: OUTPATIENT TREATMENT WITH IVR ASSESSMENTANALYSISIVR is an automated telephony menu system that is syn-onymous with the segmentation routing of callers to theappropriate recipients. This IVR assessment however imple-mented in the healthcare area for adolescent and youngadult as treatment-as-usual procedure in outpatient treatment.The data gathered are used to monitor the clinical samplesof patients with mental health problems. On the contrary,Andersson et al. [57] investigated whether adolescents andyoung adults using the treatment can show reductions insummary feedback score measures for stress, depression,and anxiety symptoms. The dataset for analysis is collectedfrom the IVR assessment, which is conducted twice a weekduring the three-month period to determine whether patientscontinued or discontinued treatment. All the statistical dataare analyzed with the statistical software SPSS.
D. CASE STUDIES WITH NETWORK ANALYTICSThis section explains various case studies related to networkanalytics in big data. Table 5 presents the following five casestudies, which investigates the use of network analytics.
1) CLOUD: CLOUD-BASED ANALYTICAL SERVICEIn the smart city, ICT advances in the presence of IoT andfuture Internet technologies. ICT tools usually deal withdifferent domains, such as land use, transport, and energy,that are employed to provide an integrated information aboutsocioeconomic growth. The great challenge is to obtain thereal value from such data to gain new information becausesmart city-based data analytics is complex and fast evolv-ing. Khan et al. [58] proposed a prototype for cloud-basedanalytical service architecture and implementation for theanalysis of selected case study data. They also developedtwo implementations using Hadoop and Spark to comparethe suitability of such infrastructures for Bristol open dataanalytics. Such analytics can show correspondence between
3636 VOLUME 8, 2020

F. Amalina et al.: Blending Big Data Analytics: Review on Challenges and a Recent Study
different variables to predict and assign priority ranking aboutlivable areas in Bristol in the future.
2) SENSOR: SMART AGRICULTURE MULTIDISCIPLINARYMODEL IN IoT WIRELESS SENSORAgriculture is the most important source to generate incomefor the human population in India. However, the techno-logical involvement in the agriculture sector is favorable.The increasing number of smartphone users in rural areasis encouraged to develop a portable sensor kit for sensingsoil properties for the current requirement of fertilizers. Soildata are collected and sent to AgroCloud storage for furtherprocessing. Channe et al. [59] proposed a multidisciplinarymodel for smart agriculture; this model analyzes the fertilizerand market requirement, best crop sequences, total produc-tion, and current stock. The proposed model uses wirelessIoT sensors to gather farming data in detail. The data arekept in the AgroCloud storage to be accessible in the pro-posed model. The model consists of five modules, namely,sensorKit module, mobile App module, AgroCloud module,big data mining analysis, and government and AgroBank UI.Thus, this proposed model is helpful in estimating the totalproduction, meeting fertilizer requirement, controlling cost,and notifying farmers about the agriculture situation.
3) NETWORK LOG: NETWORK TRAFFIC ANALYSIS INNETWORK PERFORMANCEThe drastic change of Internet users has brought major chal-lenges for telecommunication networks to manage networkperformance. However, many connected devices to the Inter-net require a powerful tool and method to increase networkperformance. Moreover, working with massive informationfrom network traffic with traditional tools and methods isnearly impossible. Barrionuevo et al. [60] proposed a methodusing general purpose graphic processing units (GPGPUs)and programming to accelerate in the process of networkperformance. Barrionuevo et al. [60] aimed to analyze traf-fic through the network to determine behavior in real timeor time interval. Therefore, the dataset was collected fromnetwork monitoring and then analyzed for recognition andclassification according to the characteristics. Their findingindicated that GPGPU is a good alternative to improve net-work performance.
4) NETWORK LOG: MULTILAYER NETWORK ANALYTICSWITH SOFTWARE DEFINE NETWORKING (SDN)-BASEDMONITORINGThe emerging fifth generation networks rely on innovativeoptical access as well as metro and core networks for greatflexibility in all parts of the networks. Network analyticsis widely used for network management and monitoring.However, traditional network analytics lacks full networkinformation, especially in the optical network, and becomesdynamic to support various network services. Yan et al. [61]proposed a novel SDN-based monitoring analytics frame-work for multilayer network analytics in coverage packet
TABLE 6. Summary of geospatial analytics case studies.
and optical networks. This framework collects multilayermonitoring information to facilitate network operations, thendiagnoses and analyzes optical networks for further networkre-planning and optimization. The experimental results revealthat this framework helps the control plane to efficientlyconfigure the network in hardware and network reliability.
5) NETWORK LOG: DATA ANALYSIS USING PROVENANCEDATAProvenance data contain a piece of information that canexpose how information flows in the system and help usersdecide if the information is trusted. The typical appli-cation cannot easily interpret their information manuallybecause provenance graphs rapidly grow and are complex.Huynh et al. [62] proposed the provenance network analyticsapproach, which combines network analysis and machinelearning technique that can automatically generate prove-nance information from logs and applications. They adoptedthe PROV data model for data analysis to identify documentowners. Huynh et al. [62] also argued that their provenancegraph can describe the origin of data and reveal the interactionof agents in connected activities.
E. CASE STUDIES WITH GEOSPATIAL ANALYTICSThis section discusses various case studies related to geospa-tial analytics in big data. Table 6 details the following six casestudies that explore the use of geospatial analytics.
1) VOLUNTEERED GEOGRAPHIC INFORMATION (VGI):CROWDSOURCED GAZETTEER ANALYSISVGI has recently dominated social media and produces hugegeotagged information. Such an information includes pub-lic place names, place descriptions, and diverse commentsaccording to experience. VGI contributes information thatcan construct gazetteers for mapping. Gazetteers are dic-tionaries of georeferenced place names, which are impor-tant in geographic IR. However, processing data mining andharvesting is computationally intensive for existing tools.Gao et al. [63] introduced a novel approach to harvestingcrowdsourced gazetteer entries from social media and per-forming spatial analysis in a cloud computing environment.
VOLUME 8, 2020 3637

F. Amalina et al.: Blending Big Data Analytics: Review on Challenges and a Recent Study
They also designed and implemented scalable distributedplatform on the basis of Hadoop for processing Big Geo-Dataand facilitating the development of crowdsourced gazetteers.
2) SATELLITE IMAGE: DEPTH COVER IN PIPELINEINFRASTRUCTURE MONITORINGIn many countries, many pipeline infrastructures are deeplyburied under the ground. To discover the measurement ofthese pipelines, a visual inspection with a combination ofhuman eye and photogrammetric techniques is employed.However, this technique is prone to occlusion failurebecause it requires clear tree cover over the buried pipelinesand demands huge storage resources in real scenarios.Hornacek et al. [64] proposed the geospatial analytics systemscalability afforded by the cloud to monitor the depth of coverin scale to solve the issues. They also adopted Elastic Com-pute Cloud service by Amazon Web Services, thus providingtwo storage areas—relational database management systemfor structured data and file storage for unstructured data. Thepipeline depth cover is estimated using vegetation-free digitalterrain model in the case of ALS or digital surface model inthe case of photogrammetry [64].
3) SATELLITE IMAGE: DISCOVER POTENTIAL LOCATION FORWATER HARVESTINGWater plays an important role in human life. Insufficientwater in certain places has a huge impact on agricultureand people’s routine. The rapid climate change and globalwarming can cause less rainwater harvesting and doughtinessthan usual. This situation can result in vulnerability in thefarm sector, in which many people depend on farming forsocioeconomic purpose and food chain. However, due tothe imprecise weather prediction of meteorological offices,a new approach is crucially necessary. Gupta et al. [65]proposed strategy solution to explore potential locations forwater harvesting to tackle socioeconomic factors. They gath-ered geospatial and environmental data by capturing satelliteimages that consist of normalized difference water and veg-etation indices. Gupta et al. [65] also performed a feasibilityanalysis of statistical models to generate the most relevantgeospatial analytics and thus explore potential water harvest-ing locations.
4) GEOGRAPHIC INFORMATION SYSTEM (GIS): GLOBALMANGROVE BIOMASS AND CARBON ESTIMATIONA mangrove is a group of trees that lives in the coastalintertidal zone. Mangrove plays an important role in regu-lating carbon cycling and can affect global change. Estimat-ing mangrove and carbon stock is important to identify thelosses of mangroves and terrestrial carbon cycling. However,the common approach in estimating mangrove biomass andcarbon stock is limited on the local scale and is typicallybased on scaling approach. Tang et al. [66] proposed a frame-work, which integrates GIS-based geospatial analysis andhigh-performance parallel computing for the estimation atthe global level. The framework comprises five major steps,
namely, selection of SRTM tiles, extraction of mangrovecanopy height, calculation of mangrove area, estimation ofbiomass and carbon in mangrove forest, and parallel com-puting for accelerating the spatially explicit estimation. Par-allel computing allows the decomposition of large datasetsinto small computation with high-performance computingresources.
5) VGI: FLOOD INUNDATION VALIDATIONFlooding is one of the most dangerous global situations.Flooding can cause huge economic losses, and recoveringfrom this situation is difficult. Hence, new methods or pre-dictive models are necessary to observe and understand floodevents. However, Rollason et al. [67] proposed a statisti-cal method of comparison against observed data to provideinformation on the flooding process from VGI. They demon-strated the models by reconstructing in detail a severe floodsituation to validate the outputs of the 2D flood inundationmodel of the event. The output validation can reflect thediverse nature of data. Their study involves modern numer-ical modeling to further stimulate complex river-floodplaininteraction [67].
6) GEOGRAPHIC INFORMATION SYSTEM (GIS): VISUALIZINGGEOTAGGED MICROBLOGSThe popularity of online social media usage growing a massmicroblogs form a stream data including geotagged and real-time event with high arrival rates. Geotagged microblogs canhelp users find a wide variety of location-specific informa-tion from a device. However, there is limited applicationsthat can support arbitrary queries on multiple attributes (spa-tial, temporal, and keyword) and interactive visualization.Magdy et al. [68] present Taghreed a full-fledged system forefficient and scalable querying, analyzing, and visualizinggeotagged microblogs. They introduced the system with fourmain components such as indexer, query engine, recoverymanager and visualizer. This system provides effective prun-ing for the microblogs search space and support queries onreal-time microblogs [68].
F. TOOLSMost researchers face challenges in selecting suitable toolsto process huge datasets. The reason is that unsuitable toolsmay cause certain issues to rise. For example, 32% oftools lack in database analytics, 23% have a scalabilityproblem, 22% are slow in processing, and 21% load data tooslowly [4]. Singh and Reddy [69] suggested several factorsthat must be considered in the selection of tools that aresuitable for big data analytics, namely, data size, processingspeed, and model development. Thus, selecting the perfecttools for datasets is crucial. In this section, we provide anexample from recent studies on platforms used and theircharacteristics. Table 7 summarizes the big data analyticsplatform with data mining, scalability, flexibility, fault toler-ance, difficulty, and pros/cons
3638 VOLUME 8, 2020

F. Amalina et al.: Blending Big Data Analytics: Review on Challenges and a Recent Study
TABLE 7. Big data analytics platform.
Hadoop: is an open-source software that essentially mod-ules the design for big data analytics. Hadoop can quicklystore and process any kind of massive data with data vol-umes and varieties that constantly increase, especially from amobile and an IoT device [70]. Hadoop is popular for its faulttolerance and scalability to process huge volumes of data.Hadoop also offers high throughput access, such as HDFSand MapReduce modules, for parallel processing with largedatasets.
MapReduce: is a programming model and frameworkused in Hadoop to enable the processing of large data inparallel computing clusters. MapReduce serves two essentialfunctions mapping, which sorts and filters a given dataset andreducing, in which resulting information is calculated. How-ever, MapReduce is inefficient in iterative algorithms and isundesignated for iterative processes. Thus, MapReduce is aneffective and efficient tool for large-scale fault tolerant dataanalysis [71].
Spark: is an open-source big data processing frame-work, which can use Java, Scala, Python, and R algo-rithms. Spark is reported to work up to 100 times fasterthan Hadoop in a certain classification [72]. This frame-work can also handle advanced data and perform streaminganalytics [73].
Storm: is an open-source tool suitable for real-time pro-cessing data. This tool, which was developed by Storm,started as a BackType for social media analytics [74]. Stormis currently used in many cases such as real-time analytics,online machine learning, continuous computation, and dis-tributed RPC.
RapidMiner: is open-source tool for data mining and foranalyzing data in the memory. This tool, which was devel-oped by RapidMiner Studio, is a powerful GUI that enables
users to create, deliver, and maintain predictive analytics.RapidMiner is a suitable solution for unstructured data suchas text files, log traffic, or images [75].
Knime: is an open-source tool built for the analytics plat-form to discover potential information insight data. This toolis fast to deploy, easy to scale, and intuitive to learn [76].Knime can also provide a graphical workbench for visual-ization [77]
Orange: is an open-sourcemachine learning and data visu-alization [78]. This tool has an interactive data analysis witha large toolbox and supports the remote execution of analysisand visualization for advanced spatial analysis features andmodels [79].
Weka: stands for Waikato environment for knowledgeanalysis [80]. This tool contains manymachine learning algo-rithms for data mining. Weka is also useful for evaluating theperformance of different learning models, data analyses, andpredictive models [81].
Cassandra: is a NoSQL wide column-oriented databasemanagement system under the Apache project. Cassandra is ascalable database that is easy to configure and is designated tomanage enormous datasets [82]. This tool can handle severalconcurrent users across the data center.
Talend: is an open-source tool that can easily run analyticsusing Hadoop technologies, such as HDFS, HBase, Hive, andPig and Sqoop [83]. However, Talend is still in beta and lacksany support for cross-origin data [84].
NodeXL: is an add-in content analysis in Microsoft OfficeExcel and is divided into two types (free and commercial).This tool can import data from the social media API andvisualize, report, and analyze network graph [85].
Gephi: is an open-source tool that is popular with visual-ization and exploration for graph and network analyses [86].
VOLUME 8, 2020 3639

F. Amalina et al.: Blending Big Data Analytics: Review on Challenges and a Recent Study
TABLE 8. Summary of case studies from the industry.
Gephi is interactive and can run several algorithms at thesame time in a separate workspace without blocking userinterface [87].
IV. CASES OF DATA ANALYTICS USAGEThe following case studies discuss how scholars employ dataanalytics for their projects. Table 8 details the nine casereport studies that explore the problems and solutions in dataanalytics.
A social media text analytics framework for double-loop learning for citizen-centric public services: A casestudy of a local government Facebook use
Local governments use Facebook to learn social mediainteraction with citizens to determine the impact of socialmedia pages on public service. Public service focuses oncitizens who participate in social service and organizationallearning for enhancement. Citizen interaction in a publicservice page on Facebook is observed, and unstructuredtextual data are analyzed with qualitative approach. Thus,Reddick et al. [88] proposed a two-stage text analyt-ics framework that generates insights from G-posts andC-posts on the Facebook page. They revealed the pub-lic interest with potential information for public servicemanagement [88].
Stress level detection via online social network (OSN)usage pattern and chronicity analysis: An OSINT threatintelligence module
Text analytics is used to detect stress level by the socialmedia usage pattern through posting a questionnaire on Face-book. Then, feedback is received from Facebook users. Thiswork focuses on psychology studies to reveal the actual per-sonality rather than self-idealization. To reveal personality,
IBM APSS Statistics tool is employed to analyze the dataand examine potential common user characteristics whileperforming unsupervised learning. Thus, text analytics is aperfect way to reveal the insight into unstructured data towardmeaningful information [89].
Modeling of fuzzy-based voice of customer (VOC) forbusiness decision analytics
Aguwa et al. [90] revealed that customer feedback andvoice data can determine customer satisfaction. They con-verted VOC to textual context to identify client satisfac-tion. Aguwa, et al. [90] also developed a fuzzy-based VOCanalysis model and combined the model with text miningtechnique to map out Integrated Customer Satisfaction Index.This technique can improve customer expectations and canfurther interpret customer needs.
Application of speech analytics in information spacemonitoring systems
The voice analytics in the study of Farkhadov et al. [91]is different from the previous work. The system used byFarkhadov et al. [91] is built to analyze telephone qualityspeech in real-world application. To analyze quality speech,they applied large-vocabulary continuous speech recognitionto recognize keywords from speech. They also build a systemusing CMU Sphinx tool to train an acoustic model to enablepredefined linguistic rules. Although this technique has anirremovable drawback, Farkhadov et al. [91] claimed thatvoice analytics can help businesses further manage their dailyroutine and enhance their operation.
Heterogeneous information fusion and visualization fora large-scale intelligent video surveillance system
Regarding the management of daily routine, the intelli-gent video analytics proposed by Fan et al. [92] with a
3640 VOLUME 8, 2020

F. Amalina et al.: Blending Big Data Analytics: Review on Challenges and a Recent Study
video surveillance system can detect alerts and events withoutmanual monitoring. This proposed event-driven visualiza-tion and data fusion process has four subsystems, namely,intelligent visualization, sensor tasking, communication, andvideo streaming and storage. However, during the six-monthexperiment period, the system failed to detect three anomaliesfrom 33 formal test runs. Moreover, the system triggeredalerts by attention task working on stationary cameras. Sub-sequently, the visualization agent assumed the responsibilityof capturing close-up images of human faces by controlling acollaborative PTZ camera.
Network traffic fingerprinting based on approximatedkernel two-sample test
In a constant growth of network traffic volume,Kohout and Pevný [93] suggested that content inspectionis prohibitively expensive because detection systems shouldwork in real time. Therefore, they proposed a frameworkthat can be used in different analyses, that is, a frameworkfor fingerprinting repeated communication over a network.This fingerprint approximates maximum mean discrepancyto efficiently estimate from a small number of observa-tions and to compare the joint distribution of features with-out explicitly estimating their probability density function.Kohout and Pevný [93] demonstrated that the running time islower than that of the prior art.
Socio-cyber network: Potential of cyber-physical sys-tem to define human behaviors using big data analytics
Ahmad et al. [94] believed that human behavior can bederived from the interaction between a smart device andits owner. This work is also motivated by expanding net-work volume. Therefore, the ‘‘socio-cyber network’’ analyt-ics is proposed to provide an insight knowledge of big datathat is generated when the smart device is connected to itsowner. From the data generated, Ahmad et al. [94] proposedanalytics that can be integrated with a different applica-tion under the same domain, which provides the generalizedframework that can help in case of security, healthcare, andtransportation.
Geospatial analytics in retail site selection and salesprediction
Geospatial analytics is not only referred to location ana-lytics but is also perceived as an intersection between BI andgeographic analysis. Ting et al. [95] believed that site selec-tion and sales prediction can estimate through a geographicinformation system. They suggested five feature selectionalgorithms and four different similarity measurement meth-ods to obtain precision location prediction.
Open geospatial infrastructure for data managementand analytics in interdisciplinary research
Jeppesen et al. [96] adopted geospatial data analyticsto investigate categorized fields on the web interface ofGeoNode. Doing so identifies possible intra-field variations,which are then inspected. Jeppesen et al. [96] also maximizedthe identification field for agriculture use cases and trans-ferred the data from a machine to cloud storage. Such datacan provide user-friendly web applications.
V. FUTURE OF BIG DATA ANALYTICSBig data analytics and deep learning technique are new devel-oping research areas that appeal to data scientists, scholars,and researchers to further examine various fields. The big datamentioned in Section II-A refers to the exponential growthand wide availability of digital data, which are difficult tomanage and analyze using traditional tools and technologies.Thus, big data analytics is a process of analyzing and acquir-ing intelligence from big data to make data worth seeingand meaningful [22]. Big data analytics also contains multi-source big data collecting, distributed big data storing, andintra/inter big data processing [8].
With the great potential and revolutionary from big data,the development of advanced technologies and interdisci-plinary teams can work as one. Data analytics is motivatedby the exponential growth of data. Deep learning techniqueis also motivated by the growth and complexity of cellularplatforms, which provide end user immediate access to oper-ational data and apply analytics to business processes and net-workmanagement [97]. This process is challenging due to theincreasing data traffic that leads to big data, thereby decreas-ing revenue per user and user growth expectation for servicequality. However, deep learning services are important forcommunication service providers because they are involvedin a digital network.Moreover, big data analytics utilizes deeplearning algorithms to extract high level, complex abstrac-tions as data representations through the hierarchical learningprocess [7]. The sole objective of deep learning technique is tolearn complex and abstract data representation hierarchically,although they pass through multiple data transformationlayers [98].
Blasting OSNs have recently dominated people around theworld in their daily life. According to the statistical socialnetwork survey conducted by Chaffey [99], over 1.870 mil-lion active Facebook users exist around the world as ofJanuary 2017. Facebook, which collects and analyzes mas-sive data on a daily basis, is aggressively pushing forwarddeep learning technique-related projects [100]. The excessivegrowth of OSNs has attracted much attention from data sci-entists and researchers to investigate this big data category tothe next level.
Big data analytics serves as a good opportunity for mobilecellular networks with performance improvement. The dataaccumulated from the excessive growth of mobile sensingapplications can exceed the server processing capability.Therefore, big data analytics is the technique suitable to usefor processing large-scale data. However, big data in the net-work also causes a bottleneck for real-time data, such as videosurveillance, visual maps, video games, and other integratedmobile sensors. Thus, the fifth generation network standardsare proposed and bring the network speed 10 times fasterthan before [101]. Moreover, in today’s generation usage ofsmartphones, computing the complex features of deep learn-ing technique is important. The reason is that deep networkswithin the deep learning method can develop a complexhierarchy of concepts. Moreover, when unsupervised data are
VOLUME 8, 2020 3641

F. Amalina et al.: Blending Big Data Analytics: Review on Challenges and a Recent Study
FIGURE 2. Decision making process in big data analytics.
collected, and machine learning is executed, such data aremanually labeled with human effort. This process is timeconsuming and expensive. Therefore, employing the deeplearning technique is introduced as it can identify specificdata.
In the meantime, big data analytics has changed therequirement in the decision making process to make a strate-gic, tactical and operational decision [102]. The role of bigdata in decision making leading companies into their main-stream business practice that helps them to predict futureoutcomes, optimize the supply chain and developed real-time decision making [103]. Figure 2 describes the processof successful decision making in big data analytics. Startingfrom developing variety of data sources that correlate withbusiness model, then discovering patterns in large datasetsfor query and analysis purpose, follow by developing a teamof analytics professional with great skills to get insight thedata and develop model using algorithm or tool to extractthe information by three types of analytics (descriptive, pre-dictive and prescriptive). Lastly, companies can improve theability of managers to make better business decisions fromthe available information.
VI. CONCLUSIONSIn this study, we provide an overview of big data defini-tion from several recent studies, in which big data onlyrefers to three V’s (volume, variety, and velocity). Otherresearchers have later added three other V’s (value, variabil-ity, and veracity) and complexity to picture themeaning of bigdata. We also discuss the challenges that arise from big dataaccording to the six V’s and complexity factor. In addition,we focus on big data analytics and its benefits, and a fewcases are described to indicate the real benefits of big dataanalytics, which is characterized according to five categories,namely, text, voice, video, network, and geospatial analytics.Many studies have witnessed that emerging analytics in bigdata is significant on effectiveness and the reliable analysisprocess. Big data analytics can also bring positive changesin many fields, such as education, military, healthcare, poli-tics, business, agriculture, banking, andmarketing.Moreover,we report the challenges brought by big data. Furthermore,we provide industrial cases that adopt analytics in their workFinally, future research would focus on finding a new tech-nique that can solve the existing challenges and create apowerful tool that able to analyse blending data sources.Another future research line is to find out how to leveragethe personal data while retaining their unique data advantagesto protect the data privacy issues. Thus, data analytics arealso important in a development successful decision makingas it has the ability to perform descriptive, predictive and
prescriptive analysis. Our main objectives are to furtherunderstand big data analytics and identify the possible meth-ods, tools, and domains used in such analytics. Althoughour study does not completely resolve the problems involvedin this topic, our objectives are addressed to a certaindegree. Moreover, our research provides useful knowledgefor researchers.
REFERENCES[1] Cisco. (2017). Cisco Visual Networking Index: Global Mobile Data
Traffic Forecast Update, 2015–2020. [Online]. Available: https://www.cisco.com/c/dam/m/en_in/innovation/enterprise/assets/mobile-white-paper-c11-520862.pdf
[2] S. Mackey, ‘‘How unstructured data fuels big data analytics,’’ ADLIB,Burlington, ON, Canada, Feb. 2018.
[3] J. Rizkallah, ‘‘The big (unstructured) data problem,’’ Forbes, Jun. 2017.[4] P. Russom, ‘‘Big data analytics,’’ TDWI, Washington, DC, USA,
Sep. 2011.[5] A. Gani, A. Siddiqa, S. Shamshirband, and F. Hanum, ‘‘A survey on
indexing techniques for big data: Taxonomy and performance evalua-tion,’’ Knowl. Inf. Syst., vol. 46, no. 2, pp. 241–284, 2016.
[6] F. Halper, ‘‘Operationalizing and embedding analytics for action,’’ TDWI,Washington, DC, USA, Jan. 2016.
[7] M. M. Najafabadi, F. Villanustre, T. M. Khoshgoftaar, N. Seliya,R. Wald, and E. Muharemagic, ‘‘Deep learning applications and chal-lenges in big data analytics,’’ J. Big Data, vol. 2, no. 1, p. 1, Feb. 2015.
[8] C.-W. Tsai, C.-F. Lai, H.-C. Chao, and A. V. Vasilakos, ‘‘Big data analyt-ics: A survey,’’ J. Big Data, vol. 2, no. 1, p. 21, 2015.
[9] A. Oussous, F.-Z. Benjelloun, A. A. Lahcen, and S. Belfkih, ‘‘Big datatechnologies: A survey,’’ J. King Saud Univ.-Comput. Inf. Sci., vol. 30,no. 4, pp. 431–448, 2018.
[10] M. M. Rathore, A. Ahmad, A. Paul, and S. Rho, ‘‘Urban planning andbuilding smart cities based on the Internet of Things using big dataanalytics,’’ Comput. Netw., vol. 101, no. 4, pp. 63–80, Jun. 2016.
[11] J. Sun and C. K. Reddy, ‘‘Big data analytics for healthcare,’’ in Proc. 19thACM SIGKDD Int. Conf. Knowl. Discovery Data Mining, 2013, p. 1525.
[12] J. Klein, R. Buglak, D. Blockow, T. Wuttke, and B. Cooper, ‘‘A referencearchitecture for big data systems in the national security domain,’’ pre-sented at the 2nd Int. Workshop Big Data Softw. Eng., Austin, TX, USA,May 2016.
[13] T.-M. Choi, H. K. Chan, and X. Yue, ‘‘Recent development in big dataanalytics for business operations and risk management,’’ IEEE Trans.Cybern., vol. 47, no. 1, pp. 81–92, Jan. 2017.
[14] K. Sin and L. Muthu, ‘‘Application of big data in education data miningand learning analytics—A literature review,’’ ICTACT J. Soft Comput.,vol. 5, no. 4, pp. 1035–1049, 2015.
[15] E. Fumeo, L. Oneto, and D. Anguita, ‘‘Condition based maintenance inrailway transportation systems based on big data streaming analysis,’’Procedia Comput. Sci., vol. 53, pp. 437–446, Jan. 2015.
[16] A.-L. Beall, ‘‘Hadoop survey results reveal use cases, needs and trends,’’SAS, Cary, NC, USA, 2018.
[17] A. Gonçalves, F. Portela, M. F. Santos, and F. Rua, ‘‘Towards of a real-time big data architecture to intensive care,’’ Procedia Comput. Sci.,vol. 113, pp. 585–590, 2017.
[18] Y. Wang, L. Kung, and T. A. Byrd, ‘‘Big data analytics: Understanding itscapabilities and potential benefits for healthcare organizations,’’ Technol.Forecasting Social Change, vol. 126, pp. 3–13, Jan. 2018.
[19] S. Akter, S. F. Wamba, A. Gunasekaran, R. Dubey, and S. J. Childe,‘‘How to improve firm performance using big data analytics capabil-ity and business strategy alignment?’’ Int. J. Prod. Econ., vol. 182,pp. 113–131, Dec. 2016.
[20] K. Kambatla, G. Kollias, V. Kumar, and A. Grama, ‘‘Trends in big dataanalytics,’’ J. Parallel Distrib. Comput., vol. 74, no. 7, pp. 2561–2573,2014.
[21] A. Katal, M. Wazid, and R. H. Goudar, ‘‘Big data: Issues, challenges,tools and good practices,’’ inProc. 6th Int. Conf. Contemp. Comput. (IC3),Aug. 2013, pp. 404–409.
[22] P. Vashisht and V. Gupta, ‘‘Big data analytics techniques: A survey,’’ inProc. Int. Conf. Green Comput. Internet Things (ICGCIoT), Oct. 2015,pp. 264–269.
3642 VOLUME 8, 2020

F. Amalina et al.: Blending Big Data Analytics: Review on Challenges and a Recent Study
[23] A. Gandomi and M. Haider, ‘‘Beyond the hype: Big data concepts,methods, and analytics,’’ Int. J. Inf. Manage., vol. 35, no. 2, pp. 137–144,2015.
[24] Big Data Analytics, IBM, New York, NY, USA, Nov. 2017.[25] G. I. Glosarry, ‘‘The importance of ‘big data’: A definition,’’ Tech. Rep.,
Gartner, Stamford, CT, USA, Jun. 2012.[26] I. A. T. Hashem, I. Yaqoob, N. B. Anuar, S. Mokhtar, A. Gani, and
S. U. Khan, ‘‘The rise of ‘big data’ on cloud computing,’’ Inf. Syst.,vol. 47, pp. 98–115, Jan. 2015.
[27] V. C. Storey and I.-Y. Song, ‘‘Big data technologies and manage-ment: What conceptual modeling can do,’’ Data Knowl. Eng., vol. 108,pp. 50–67, Mar. 2017.
[28] Z. Lv, H. Song, P. Basanta-Val, A. Steed, and M. Jo, ‘‘Next-generationbig data analytics: State of the art, challenges, and future research topics,’’IEEE Trans. Ind. Informat., vol. 13, no. 4, pp. 1891–1899, Aug. 2017.
[29] G. Bello-Orgaz, J. J. Jung, and D. Camacho, ‘‘Social big data: Recentachievements and new challenges,’’ Inf. Fusion, vol. 28, pp. 45–59,Mar. 2016.
[30] X. Zhang, Z. Yi, Z. Yan, G. Min, W. Wang, A. Elmokashfi, S. Maharjan,andY. Zhang, ‘‘Social computing formobile big data,’’Computer, vol. 49,no. 9, pp. 86–90, Sep. 2016.
[31] S. Yin and O. Kaynak, ‘‘Big data for modern industry: Challenges andtrends [point of view],’’ Proc. IEEE, vol. 103, no. 2, pp. 143–146,Feb. 2015.
[32] N. Mohamed and J. Al-Jaroodi, ‘‘Real-time big data analytics: Appli-cations and challenges,’’ in Proc. Int. Conf. High Perform. Comput.Simulation (HPCS), Jul. 2014, pp. 305–310.
[33] L. Wang, Y. Ma, J. Yan, V. Chang, and A. Y. Zomaya, ‘‘pipsCloud:High performance cloud computing for remote sensing big data man-agement and processing,’’ Future Gener. Comput. Syst., vol. 78, no. 1,pp. 353–368, 2018.
[34] S. Peng, S. Yu, and P. Müeller, ‘‘Social networking big data: Opportu-nities, solutions, and challenges,’’ Future Gener. Comput. Syst., vol. 86,pp. 1456–1458, Sep. 2018.
[35] K. Abouelmehdi, A. Beni-Hssane, H. Khaloufi, and M. Saadi, ‘‘Big datasecurity and privacy in healthcare: A review,’’ Procedia Comput. Sci.,vol. 113, pp. 73–80, Jan. 2017.
[36] N. Côrte-Real, P. Ruivo, T. Oliveira, and A. Popovič, ‘‘Unlocking thedrivers of big data analytics value in firms,’’ J. Bus. Res., vol. 97,pp. 160–173, Apr. 2019.
[37] E. Politou, E. Alepis, and C. Patsakis, ‘‘Profiling tax and financialbehaviour with big data under the GDPR,’’ Comput. Law Secur. Rev.,vol. 35, no. 3, pp. 306–329, 2019.
[38] H. J. Watson, ‘‘Update tutorial: Big data analytics: Concepts, technology,and applications,’’ Commun. Assoc. Inf. Syst., vol. 44, no. 1, p. 21, 2019.
[39] J. Fan, F. Han, and H. Liu, ‘‘Challenges of big data analysis,’’ Nat. Sci.Rev., vol. 1, no. 2, pp. 293–314, 2014.
[40] U. Sivarajah, M. M. Kamal, Z. Irani, and V. Weerakkody, ‘‘Criticalanalysis of big data challenges and analytical methods,’’ J. Bus. Res.,vol. 70, pp. 263–286, Jan. 2017.
[41] D. P. Acharjya and K. Ahmed, ‘‘A survey on big data analytics: Chal-lenges, open research issues and tools,’’ Int. J. Adv. Comput. Sci. Appl.,vol. 7, no. 2, pp. 511–518, 2016.
[42] B. Jan, H. Farman, M. Khan, M. Imran, I. Ul Islam, A. Ahmad, S. Ali,and G. Jeon, ‘‘Deep learning in big data analytics: A comparative study,’’Comput. Elect. Eng., vol. 75, pp. 275–287, May 2019.
[43] A. S. Abrahams, W. Fan, G. A. Wang, Z. Zhang, and J. Jiao, ‘‘Anintegrated text analytic framework for product defect discovery,’’ Prod.Oper. Manage., vol. 24, no. 6, pp. 975–990, 2015.
[44] C. S. Ishikiriyama, D. Miro, and C. F. S. Gomes, ‘‘Text mining businessintelligence: A small sample of what words can say,’’ Procedia Comput.Sci., vol. 55, pp. 261–267, Jan. 2015.
[45] P. Martínez, J. L. Martínez, I. Segura-Bedmar, J. Moreno-Schneider,A. Luna, and R. Revert, ‘‘Turning user generated health-related contentinto actionable knowledge through text analytics services,’’Comput. Ind.,vol. 78, pp. 43–56, May 2016.
[46] R. Chen, Y. Zheng, W. Xu, M. Liu, and J. Wang, ‘‘Secondhand sellerreputation in online markets: A text analytics framework,’’Decis. SupportSyst., vol. 108, pp. 96–106, Apr. 2018.
[47] Y. Wang and W. Xu, ‘‘Leveraging deep learning with LDA-based textanalytics to detect automobile insurance fraud,’’ Decis. Support Syst.,vol. 105, pp. 87–95, Jan. 2018.
[48] D. Singh, C. Vishnu, and C. K. Mohan, ‘‘Visual big data analytics fortraffic monitoring in smart city,’’ in Proc. 15th IEEE Int. Conf. Mach.Learn. Appl. (ICMLA), Dec. 2016, pp. 886–891.
[49] K. P. Seng and L.-M. Ang, ‘‘Video analytics for customer emotion andsatisfaction at contact centers,’’ IEEE Trans. Human-Mach. Syst., vol. 48,no. 3, pp. 266–278, Jun. 2018.
[50] M. U. Yaseen, A. Anjum, O. Rana, and N. Antonopoulos, ‘‘Deep learninghyper-parameter optimization for video analytics in clouds,’’ IEEE Trans.Syst., Man, Cybern., Syst., vol. 49, no. 1, pp. 253–264, Jan. 2019.
[51] A. Chowdhery and M. Chiang, ‘‘Model predictive compression for dronevideo analytics,’’ in Proc. IEEE Int. Conf. Sens., Commun. Netw. (SECONWorkshops), Jun. 2018, pp. 1–5.
[52] H. Qiu, X. Liu, S. Rallapalli, A. J. Bency, K. Chan, R. Urgaonkar,B. S. Manjunath, and R. Govindan, ‘‘Kestrel: Video analytics for aug-mented multi-camera vehicle tracking,’’ in Proc. IEEE/ACM 3rd Int.Conf. Internet-Things Design Implement. (IoTDI), Apr. 2018, pp. 48–59.
[53] N. Bassiou, A. Tsiartas, J. Smith, H. Bratt, C. Richey, E. Shriberg, andN. Alozie, ‘‘Privacy-preserving speech analytics for automatic assess-ment of student collaboration,’’ in Proc. Interspeech, 2016, pp. 888–892.
[54] B. Karakus and G. Aydin, ‘‘Call center performance evaluation using bigdata analytics,’’ in Proc. Int. Symp. Netw., Comput. Commun. (ISNCC),May 2016, pp. 1–6.
[55] T. Taguchi, H. Tachikawa, K. Nemoto, M. Suzuki, T. Nagano,R. Tachibana, M. Nishimura, and T. Arai, ‘‘Major depressive disorder dis-crimination using vocal acoustic features,’’ J. Affect. Disorders, vol. 225,pp. 214–220, Jan. 2018.
[56] N. Ruiz, S. Bangalore, and J. Chen, ‘‘Bootstrapping multilingualintent models via machine translation for dialog automation,’’ 2018,arXiv:1805.04453. [Online]. Available: https://arxiv.org/abs/1805.04453
[57] C. Andersson, A. Öjehagen, M. O. Olsson, L. Brådvik, andA. Håkansson, ‘‘Interactive voice response with feedback interventionin outpatient treatment of substance use problems in adolescents andyoung adults: A randomized controlled trial,’’ J. Article, vol. 24, no. 5,pp. 789–797, Oct. 2017.
[58] Z. Khan, A. Anjum, K. Soomro, and M. A. Tahir, ‘‘Towards cloud basedbig data analytics for smart future cities,’’ J. Cloud Comput., vol. 4, p. 2,Dec. 2015.
[59] H. Channe, S. Kothari, and D. Kadam, ‘‘Multidisciplinary modelfor smart agriculture using Internet-of-Things (IoT), sensors, cloud-computing, mobile-computing& big-data analysis,’’ Int. J. Comput. Tech-nol. Appl., vol. 6, no. 3, pp. 374–382, 2015.
[60] M. Barrionuevo, M. Lopresti, N. C. Miranda, and M. F. Piccoli, ‘‘Solvinga big-data problem with GPU: The network traffic analysis,’’ J. Comput.Sci. Technol., vol. 15, no. 1, pp. 30–39, 2015.
[61] S. Yan, A. Aguado, Y. Ou, R. Wang, R. Nejabati, and D. Simeonidou,‘‘Multilayer network analytics with SDN-based monitoring framework,’’IEEE/OSA J. Opt. Commun. Netw., vol. 9, no. 2, pp. A271–A279,Feb. 2017.
[62] T. D. Huynh, M. Ebden, J. Fischer, S. Roberts, and L. Moreau, ‘‘Prove-nance network analytics,’’ J. Data Mining Knowl. Discovery, vol. 32,no. 3, pp. 708–735, May 2018.
[63] S. Gao, L. Li,W. Li, K. Janowicz, and Y. Zhang, ‘‘Constructing gazetteersfrom volunteered big geo-data based on hadoop,’’ Comput., Environ.Urban Syst., vol. 61, pp. 172–186, Jan. 2017.
[64] M. Hornacek, D. Schall, P. Glira, S. Geiger, A. Egger, A. Filip,C. Windisch, and M. Liepe, ‘‘Geospatial analytics in the large for mon-itoring depth of cover for buried pipeline infrastructure,’’ in Proc. IEEEInt. Conf. Cloud Eng. (IC2E), Apr. 2018, pp. 233–240.
[65] A. Gupta, A. Garg, N. Rawat, S. Chigurupati, and U. D. Kumar, ‘‘Everydrop counts: Unleashing the prospective locations for water harvestingusing geospatial analytics,’’ presented at the 1st Int. Conf. Internet ThingsMach. Learn., Liverpool, U.K., 2017.
[66] W. Tang, M. Zheng, X. Zhao, J. Shi, J. Yang, and C. C. Trettin, ‘‘Biggeospatial data analytics for global mangrove biomass and carbon esti-mation,’’ Sustainability, vol. 10, no. 2, p. 472, 2018.
[67] E. Rollason, L. J. Bracken, R. J. Hardy, and A. R. G. Large,‘‘The importance of volunteered geographic information for the vali-dation of flood inundation models,’’ J. Hydrol., vol. 562, pp. 267–280,Jul. 2018.
[68] A. Magdy, L. Alarabi, S. Al-Harthi, M. Musleh, T. M. Ghanem, S. Ghani,and M. F. Mokbel, ‘‘Taghreed: A system for querying, analyzing, andvisualizing geotagged microblogs,’’ presented at the Proc. 22nd ACMSIGSPATIAL Int. Conf. Adv. Geographic Inf. Syst., Dallas, TX, USA,2014.
VOLUME 8, 2020 3643

F. Amalina et al.: Blending Big Data Analytics: Review on Challenges and a Recent Study
[69] D. Singh and C. K. Reddy, ‘‘A survey on platforms for big data analytics,’’J. Big Data, vol. 2, no. 1, p. 8, Oct. 2014.
[70] A. Hadoop, ‘‘What is apache hadoop?’’ Apache, Cambridge, MA, USA,Jan. 2018.
[71] J. Dean and S. Ghemawat, ‘‘MapReduce: Aflexible data processing tool,’’Commun. ACM, vol. 53, no. 1, pp. 72–77, Jan. 2010.
[72] Apache Spark, Apache, Cambridge, MA, USA, Jan. 2018.[73] A. G. Shoro and T. R. Soomro, ‘‘Big data analysis: Apache spark perspec-
tive,’’ Global J. Comput. Sci. Technol., vol. 15, no. 1, pp. 7–14, 2015.[74] Apache Storm, Apache, Cambridge, MA, USA, Jan. 2018.[75] Hadoop Big Data Analytics—How Big is Big?RapidMiner, Boston, MA,
USA, Jan. 2016.[76] About KNIME, KNIME, Zurich, Switzerland, Aug. 2018.[77] M. R. Berthold, N. Cebron, F. Dill, T. R. Gabriel, T. Kötter, T. Meinl,
P. Ohl, K. Thiel, and B. Wiswedel, ‘‘KNIME—The Konstanz informa-tion miner: Version 2.0 and beyond,’’ ACM SIGKDD Explor. Newslett.,vol. 11, no. 1, pp. 26–31, 2009.
[78] Orange Data Mining Fruitful and Fun, Orange, Ljubljana, Slovenia,Aug. 2018.
[79] S. Cho, S. Hong, and C. Lee, ‘‘ORANGE: Spatial big data analysisplatform,’’ in Proc. IEEE Int. Conf. Big Data (Big Data), Dec. 2016,pp. 3963–3965.
[80] WEKA the Workbench for Machine Learning, Hamilton, New Zealand,Aug. 2018.
[81] K. S. Hoon, K. C. Yeo, S. Azam, B. Shunmugam, and F. De Boer, ‘‘Crit-ical review of machine learning approaches to apply big data analytics inDDoS forensics,’’ in Proc. Int. Conf. Comput. Commun. Inform. (ICCCI),Jan. 2018, pp. 1–5.
[82] Apache Cassandra, Apache, Cambridge, MA, USA, Aug. 2018.[83] How Talend Expands the Scope of Sqoop, Talend, Redwood City, CA,
USA, Aug. 2018.[84] V. Marinakis, H. Doukas, J. Tsapelas, S. Mouzakitis, A. Sicilia,
L. Madrazo, and S. Sgouridis, ‘‘From big data to smart energy services:An application for intelligent energy management,’’ Future Gener. Com-put. Syst., to be published.
[85] NodeXL Pro for Research, NodeXL, Redwood City, CA, USA,Aug. 2018.
[86] Gephi, Aug. 2018.[87] M. Bastian, S. Heymann, and M. Jacomy, ‘‘Gephi: An open source
software for exploring and manipulating networks,’’ in Proc. 3rd Int.AAAI Conf. Weblogs Social Media, 2009, pp. 361–362.
[88] C. G. Reddick, A. T. Chatfield, and A. Ojo, ‘‘A social media text analyticsframework for double-loop learning for citizen-centric public services:A case study of a local government Facebook use,’’ Government Inf.Quart., vol. 34, no. 1, pp. 110–125, Jan. 2017.
[89] M. Kandias, D. Gritzalis, V. Stavrou, and K. Nikoloulis, ‘‘Stresslevel detection via OSN usage pattern and chronicity analysis: AnOSINT threat intelligence module,’’ Comput. Secur., vol. 69, pp. 3–17,Aug. 2017.
[90] C. Aguwa, M. H. Olya, and L. Monplaisir, ‘‘Modeling of fuzzy-basedvoice of customer for business decision analytics,’’ Knowl.-Based Syst.,vol. 125, pp. 136–145, Jun. 2017.
[91] M. Farkhadov, V. Smirnov, and A. Eliseev, ‘‘Application of speech ana-lytics in information space monitoring systems,’’ in Proc. 5th Int. Conf.Control, Instrum., Autom. (ICCIA), Nov. 2017, pp. 92–97.
[92] C.-T. Fan, Y.-K. Wang, and C.-R. Huang, ‘‘Heterogeneous informa-tion fusion and visualization for a large-scale intelligent video surveil-lance system,’’ IEEE Trans. Syst., Man, Cybern., Syst., vol. 47, no. 4,pp. 593–604, Apr. 2017.
[93] J. Kohout and T. Pevný, ‘‘Network traffic fingerprinting based on approx-imated kernel two-sample test,’’ IEEE Trans. Inf. Forensics Security,vol. 13, no. 3, pp. 788–801, Mar. 2018.
[94] A. Ahmad, M. Babar, S. Din, S. Khalid, M. M. Ullah, A. Paul,A. G. Reddy, and N. Min-Allah, ‘‘Socio-cyber network: The potential ofcyber-physical system to define human behaviors using big data analyt-ics,’’ Future Gener. Comput. Syst., vol. 92, pp. 868–878, Mar. 2019.
[95] C.-Y. Ting, C. C. Ho, H. J. Yee, and W. R. Matsah, ‘‘Geospatial analyticsin retail site selection and sales prediction,’’ Big Data, vol. 6, no. 1,pp. 42–52, 2018.
[96] J. H. Jeppesen, E. Ebeid, R. H. Jacobsen, and T. S. Toftegaard, ‘‘Opengeospatial infrastructure for data management and analytics in interdis-ciplinary research,’’ Comput. Electron. Agricult., vol. 145, pp. 130–141,Feb. 2018.
[97] K. Yang, R. Liu, Y. Sun, J. Yang, and X. Chen, ‘‘Deep network analyzer(DNA): A big data analytics platform for cellular networks,’’ IEEE Inter-net Things J., vol. 4, no. 6, pp. 2019–2027, Dec. 2017.
[98] N. M. Elaraby, M. Elmogy, and S. Barakat, ‘‘Deep learning: Effectivetool for big data analytics,’’ Int. J. Comput. Sci. Eng., vol. 5, pp. 254–262,Sep. 2016.
[99] D. Chaffey, ‘‘Global social media research summary,’’ Smart Insights,Leeds, U.K.,, Apr. 2016.
[100] X.-W. Chen and X. Lin, ‘‘Big data deep learning: Challenges and per-spectives,’’ IEEE Access, vol. 2, pp. 514–525, May 2014.
[101] Q. Han, S. Liang, and H. Zhang, ‘‘Mobile cloud sensing, big data, and5G networks make an intelligent and smart world,’’ IEEE Netw., vol. 29,no. 2, pp. 40–45, Mar./Apr. 2015.
[102] N. Elgendy and A. Elragal, ‘‘Big data analytics in support of the deci-sion making process,’’ Procedia Comput. Sci., vol. 100, pp. 1071–1084,Jan. 2016.
[103] S. Jeble, S. Kumari, and Y. Patil, ‘‘Role of big data in decision making,’’OSCM, Pune, India, Tech. Rep. 1979-3561, 2018, p. 36.
FAIRUZ AMALINA received the B.Tech. degree(Hons.) in networking systems from the Univer-sity of Kuala Lumpur (UniKL), Malaysia, andthe M.Sc. degree with the University of Malaya,Kuala Lumpur, where she is currently pursuing thePh.D. degree with the Department of ComputerScience and Information Technology. Her researchinterests include big data analytics, artificial intel-ligence, computer security, and malware detectionsystems.
IBRAHIM ABAKER TARGIO HASHEM receivedthe B.E. degree in computer science in Sudan,in 2007, theM.S. degree in computing inMalaysia,in 2012, and the Ph.D. degree in computer sciencefrom the University of Malaya, Malaysia, in 2017.He received professional certificates from CISCO(CCNP, CCNA, and CCNA Security) and APMGGroup (PRINCE2 Foundation, ITIL v3 Founda-tion, and OBASHI Foundation). He was a Tutorwith CISCO Academy, University of Malaya. His
current research interests include big data, cloud computing, distributedcomputing, and networks.
ZATI HAKIM AZIZUL received the B.E. degreein computer science (artificial intelligence) andthe M.S. degree in computer science from theUniversity of Malaya, Malaysia, and the Ph.D.degree in computer science from the University ofAuckland, New Zealand. She was a Senior Lec-turer with the Faculty of Computer Science andInformation Technology, University of Malaya,Kuala Lumpur. Her current research interestsinclude artificial intelligence, biomedical imaging,and autonomous robot.
3644 VOLUME 8, 2020

F. Amalina et al.: Blending Big Data Analytics: Review on Challenges and a Recent Study
ANG TAN FONG received the degree, master’s,and Ph.D. degrees in computer science from theUniversity of Malaya, Malaysia. He is currentlya Senior Lecturer with the Faculty of ComputerScience and Information Technology, Universityof Malaya, Kuala Lumpur. He has published anumber of conference and journal papers locallyand internationally. His research interests includecloud computing, grid computing, programminglanguage, and database.
AHMAD FIRDAUS received the M.Sc. degreein networking from University Teknologi Mara,Malaysia, and the Ph.D. degree from the Univer-sity of Malaya, Malaysia. He is currently a SeniorLecturer with the Faculty of Systems and Soft-ware Engineering, University Malaysia Pahang,Malaysia. His research interests include mobilesecurity, blockchain, and intrusion detectionsystems.
MUHAMMAD IMRAN is currently an AssistantProfessor with the College of Computer and Infor-mation Science, King Saud University. He haspublished a number of research papers in peer-reviewed international journals and conferences.His research interests include mobile ad hoc andsensor networks, WBANs, the IoT, M2M, mul-tihop wireless networks, and fault-tolerant com-puting. His research is financially supported byseveral grants. He has been involved in a number of
conferences and workshops in various capacities such as Program Co-Chair,Track Chair/Co-Chair, and a Technical Program Committee Member. Theseinclude IEEE GLOBECOM, ICC, AINA, LCN, IWCMC, IFIP WWIC, andBWCCA. He has received a number of awards. Recently, the EuropeanAlliance for Innovation (EAI) appointed him as a Co-Editor-in-Chief for EAITransactions on PervasiveHealth and Technology. He also serves as anAsso-ciate Editor for theWireless Communication and Mobile Computing Journal(Wiley), the Interscience International Journal of Autonomous and AdaptiveCommunications Systems (IJAACS),Wireless Sensor Systems (IET), and theInternational Journal of Information Technology and Electrical Engineer-ing. He has served as aGuest Editor for the IEEECommunicationsMagazine,IJAACS, and the International Journal of Distributed Sensor Networks.
NOR BADRUL ANUAR received the M.Sc.degree from the University of Malaya, Malaysia,in 2003, and the Ph.D. degree in information secu-rity from the Centre for Security, Communica-tions, and Network Research (CSCAN), PlymouthUniversity, U.K., in 2012. He is currently theDeputy Dean of Research and Development anda Senior Lecturer with the Faculty of ComputerScience and Information Technology, Universityof Malaya, Kuala Lumpur. He has published a
number of conference and journal papers locally and internationally. Hisresearch interests include information security (i.e., intrusion detection sys-tems), artificial intelligence, and library information systems.
VOLUME 8, 2020 3645