Blackwell Science, Ltd Biogeography and population genetics of the
14
Molecular Ecology (1999) 8 , 1013–1026 © 1999 Blackwell Science Ltd Blackwell Science, Ltd Biogeography and population genetics of the Lake Malawi cichlid Melanochromis auratus : habitat transience, philopatry and speciation JEFFREY A. MARKERT,* MATTHEW E. ARNEGARD,† PATRICK D. DANLEY* and THOMAS D. KOCHER* * Department of Zoology, University of New Hampshire, Durham NH 03824, USA , † Field of Neurobiology and Behavior, Cornell University, Ithaca, NY 14853, USA Abstract Migration rates among nine populations of the endemic Lake Malawi cichlid Melano- chromis auratus were estimated along a 42-km stretch of habitat in the southern end of the lake. Allele frequencies were surveyed at four simple sequence repeat (SSR) loci. The data suggest migration rates among populations are quite low. Exact tests indicate that statistically detectable allele frequency differences exist between many adjacent popu- lations in the study. The F ST value among all populations was estimated to be 0.151 ( P < 0.0002). A biogeographic survey suggests that the highest levels of genetic differenti- ation exist between populations separated by stretches of deep water. Migration is more common between populations separated by shallower water or with shoreline dispersal routes. Reduced allelic diversity was observed at more recently created habitat patches, suggesting that either bottlenecks are associated with the colonization of new habitat patches or that these shallower sites were all founded by genetically depauperate ances- tral populations. The extreme philopatry of M. auratus , coupled with the patchy distri- bution and transient nature of its preferred habitat, provides opportunities for both selection and genetic drift to produce genetic differentiation among populations. Both processes may be important to the evolution of taxonomic diversity in the East African cichlid species flocks. Keywords : biogeography, cichlids, Lake Malawi, Mbuna, microsatellites, migration Received 5 August 1998; revision received 22 January 1999; accepted 22 January 1999 Introduction The flocks of endemic fish species in the East African Great Lakes are well known examples of ‘explosive’ cladogenesis (Greenwood 1964). The fishes of Lake Malawi are a dramatic example, with an estimated 500 endemic species, virtually all of which are in the Teleost family Cichlidae (Ribbink et al . 1983). This extraordin- ary taxonomic diversity has fascinated and challenged evolutionary biologists since the earliest description of the rift valley lakes by European naturalists and explorers in the 19th century (Günther 1864). Since the first formal description of the Rift Valley taxa (see Boulenger (1915) for early citations), many explana- tions for the rapid evolution of taxonomic diversity have been suggested. Proposed explanations include selective mating and brood care (Kosswig 1947), adaptation to changes in habitat arising from lake level dynamics (Trewavas 1947), adaptation to a postulated diversity of habitats resulting from the sheer size of the lakes (Jackson 1955), restricted migration due to predation (Fryer 1965) and microadaptation to fragmented habitats (Fryer 1959a, b). The most recent synthetic model was proposed by Dominey (1984) who suggested that a combination of extremely low gene flow among populations, coupled with sexual selection, could lead to the fixation of distinct mate recognition systems ( sensu Patterson (1985) ) within local populations. Most of these models stress the importance of selection Correspondence: J. A. Markert. Fax: +01-603-862 3784; E-mail: jmarkert@ cisunix.unh.edu
Transcript of Blackwell Science, Ltd Biogeography and population genetics of the

Molecular Ecology (1999)
8
, 1013–1026
© 1999 Blackwell Science Ltd
Blackwell Science, Ltd
Biogeography and population genetics of the Lake Malawi cichlid
Melanochromis auratus
: habitat transience, philopatry and speciation
JEFFREY A. MARKERT,* MATTHEW E. ARNEGARD,† PATRICK D. DANLEY* and THOMAS D. KOCHER**
Department of Zoology, University of New Hampshire, Durham NH 03824, USA
, †
Field of Neurobiology and Behavior, Cornell University, Ithaca, NY 14853, USA
Abstract
Migration rates among nine populations of the endemic Lake Malawi cichlid
Melano-chromis auratus
were estimated along a 42-km stretch of habitat in the southern end ofthe lake. Allele frequencies were surveyed at four simple sequence repeat (SSR) loci. Thedata suggest migration rates among populations are quite low. Exact tests indicate thatstatistically detectable allele frequency differences exist between many adjacent popu-lations in the study. The
F
ST
value among all populations was estimated to be 0.151(
P
< 0.0002). A biogeographic survey suggests that the highest levels of genetic differenti-ation exist between populations separated by stretches of deep water. Migration is morecommon between populations separated by shallower water or with shoreline dispersalroutes. Reduced allelic diversity was observed at more recently created habitat patches,suggesting that either bottlenecks are associated with the colonization of new habitatpatches or that these shallower sites were all founded by genetically depauperate ances-tral populations. The extreme philopatry of
M. auratus
, coupled with the patchy distri-bution and transient nature of its preferred habitat, provides opportunities for bothselection and genetic drift to produce genetic differentiation among populations. Bothprocesses may be important to the evolution of taxonomic diversity in the East Africancichlid species flocks.
Keywords
: biogeography, cichlids, Lake Malawi, Mbuna, microsatellites, migration
Received 5 August 1998; revision received 22 January 1999; accepted 22 January 1999
Introduction
The flocks of endemic fish species in the East AfricanGreat Lakes are well known examples of ‘explosive’cladogenesis (Greenwood 1964). The fishes of LakeMalawi are a dramatic example, with an estimated 500endemic species, virtually all of which are in the Teleostfamily Cichlidae (Ribbink
et al
. 1983). This extraordin-ary taxonomic diversity has fascinated and challengedevolutionary biologists since the earliest description ofthe rift valley lakes by European naturalists and explorersin the 19th century (Günther 1864).
Since the first formal description of the Rift Valley taxa
(see Boulenger (1915) for early citations), many explana-tions for the rapid evolution of taxonomic diversity havebeen suggested. Proposed explanations include selectivemating and brood care (Kosswig 1947), adaptation tochanges in habitat arising from lake level dynamics(Trewavas 1947), adaptation to a postulated diversity ofhabitats resulting from the sheer size of the lakes (Jackson1955), restricted migration due to predation (Fryer 1965)and microadaptation to fragmented habitats (Fryer 1959a,b). The most recent synthetic model was proposed byDominey (1984) who suggested that a combination ofextremely low gene flow among populations, coupledwith sexual selection, could lead to the fixation of distinctmate recognition systems (
sensu
Patterson (1985)) withinlocal populations.
Most of these models stress the importance of selection
Correspondence: J. A. Markert. Fax: +01-603-862 3784; E-mail:[email protected]
MEC658.fm Page 1013 Thursday, June 10, 1999 11:48 AM

1014
J . A . M A R K E R T
E T A L
.
© 1999 Blackwell Science Ltd,
Molecular Ecology
, 8, 1013–1026
to the evolution of lineage divergence. However, selectiveforces must overcome the effects of gene flow betweendiverging gene pools or local adaptations will not develop.It is important to assess both the spatial scale of geneticdifferentiation and identify the physical features of theenvironment that constrain population differentiationif we are to evaluate models proposed to explain therapid evolution of taxonomic diversity in the LakeMalawi cichlid species flock.
Many Malawi cichlids have a high level of habitat fidel-ity which, in combination with the patchy distribution ofhabitat types, could contribute to the evolution of lineagedivergence. The shoreline is a mosaic of habitat typeswith rocky stretches existing as habitat islands separatedby long stretches of sandy or weedy substrate (McKaye& Gray 1984). Rocky habitats also exist along the shoresof several small islands and as completely submergedoffshore rocky outcrops. The configuration of substratetypes along the shores of Lake Malawi is not a fixed
feature of the physical environment. The extent and distri-bution of sandy and rocky habitats is influenced bythe rapid and dramatic changes in water level which aretypical in Lake Malawi (Fryer 1959a; McKaye & Gray1984; Scholz & Rosendahl 1988; Owen
et al
. 1990). Fluctu-ations in water level occur on both geological and historicaltime scales. Owen
et al
. (1990) document three climaticallycontrolled late-Pleistocene decreases in water level, themost recent of which occurred between the years 1500and 1850. During this period, water levels were at least121 m below their present level, and the two southernbasins were mostly dry land.
Decreased rainfall can lead to the loss of rocky habitatswhen water levels fall below the rock–sand interface(Fig. 1). Increases in water level can open newly floodedhabitat patches for colonization and can alter the natureof existing habitat patches by increasing their depth.Variation in water levels can unite previously isolatedhabitat patches or subdivide continuous stretches of
b
5 km
Mvunguti SETsano Rock
Harbour Island
50 kmNankumba Peninsula
Mazinzi Reef
Shallow Reef
Nkhudzi Hills
Mphande Island
Mumbo Island
IIaIa Gap
RockyShore
SandyBeach
ScatteredBoulders,Cobbles
c
Not
Sur
veye
d
Fig. 1 Habitat distribution along theshores of the Nankumba Peninsula.(a) The peninsula divides the southernend of Lake Malawi into two shallowbasins. The shaded area represents partsof the lake which are > 200 m deep(adapted from Owen et al. 1990). (b) Thedistribution of rocky habitats along theshores of the peninsula and the locationof sites from which fish were sampled.(c) A schematic diagram showing thetypical arrangement of rocky habitatalong the shoreline. Rocks and boulders(stippled) slope away from the shore,eventually intersecting the flatter sandylake bottom (checks) When water levelsare high (solid line) mbuna can use therocks as habitat. Periodic recessions inlake level can destroy this habitat(dashed line). Increases in water levelcan completely submerge some rockyareas, making the site inhospitable toobligate rock-dwelling fishes with shallowdepth preferences.
MEC658.fm Page 1014 Thursday, June 10, 1999 11:48 AM

B I O G E O G R A P H Y O F A M A L A W I C I C H L I D
1015
© 1999 Blackwell Science Ltd,
Molecular Ecology
, 8, 1013–1026
habitat, depending on local topography (see McKaye &Gray (1984) or Ribbink
et al
. (1983)).The rocky areas are the primary habitat for a well-
studied guild of small, brightly coloured fish knowncollectively as mbuna (Fryer 1959a). The lithophilic natureof most mbuna, combined with the patchy distributionof rocky habitats within Lake Malawi, form a system inwhich the development of interpopulation genetic hetero-geneity (a probable precondition for lineage splitting)may be explored. Early genetic data suggested thatmigration rates among mbuna populations might be verylow. McKaye
et al
. (1984) found evidence of genetic differ-entiation at some allozyme loci among four populationsof the widely distributed
Pseudotropheus zebra
. Bowers
etal
. (1994) found differences in mitochondrial DNA haplo-type frequencies between populations in the southernend of the lake for two different species in the mbunagenus
Melanochromis.
The recent availability of simplesequence repeat (SSR) loci (Tautz 1989) with their highallelic diversity provides a tool with the resolutionneeded to detect fine-scale population differentiationamong recently established populations.
Recently, van Oppen
et al
. (1997) have used SSR loci todetect population structure in several mbuna speciesacross very small gaps at more stable rocky habitats nearNkhata Bay on the western shore of Lake Malawi. Thenewly flooded rocky habitats in the southern end of thelake, many of which are less than 200-years old, providean opportunity to further explore the spatial and tem-poral scale of population structure in Malawi Cichlids. Wecombine fine-scale population sampling with a detailedsurvey of habitat distribution and an analysis of allelefrequencies at SSR loci to evaluate the influence ofbiogeographic forces on population structure in therock-dwelling Malawi cichlid
Melanochromis auratus
.
Materials and methods
Study species
Melanochromis auratus
(Boulenger 1897) is an easily recog-nizable species that is widely distributed in the southernend of Lake Malawi. It is a small (4
−
9 cm), sexuallydimorphic fish. Females have a bright yellow ground col-our with black or dark-brown horizontal stripes. Malesare slightly larger than females and have a dark-brownor blue/black ground colour with yellow-gold stripes(Bowers 1993). Unlike many other mbuna species in thevicinity of the Nankumba Peninsula,
M. auratus
showslittle systematic variation in colour pattern from localityto locality, although slight intrapopulation variation incolour intensity is common. They are most common atdepths between 1.5 and 10 m, although their full rangeextends from the surface to a depth of 40 m (Ribbink
et al
.
1983). Similar to most other mbuna, they are almost neverobserved over a sandy substrate.
Study area
M. auratus
were sampled from areas in the proximity ofthe Nankumba Peninsula which divides the southern endof Lake Malawi into two shallow basins (Fig. 1). Mbunahabitats in this vicinity are probably quite young. Muchof the southern end of Lake Malawi was dry landbetween the years 1500 and 1850 when lake levels areestimated to have been 121 m lower than they are now(Owen
et al
. 1990), providing an upper boundary to theage of populations at most habitats.
The steeply sloping rocky habitats adjacent to theshores of the Nankumba Peninsula all intersect the flatter,sandy lake bottom (Fig. 1c). The depth of this present-dayrock–sand interface should determine the order in whichsites became available for colonization as the southernbasins refilled (Table 1). Deeper habitats became avail-able first while the shallower habitats became availablemore recently (See Ribbink
et al
. 1983; McKaye & Gray1984; and Fig. 1 for details of this process).
The study area ranges from Mumbo Island (to thenorth and west of the peninsula) to Mphande Island (tothe south and east) (Fig. 1b). Fish were sampled fromwaters adjacent to both these islands, several habitatsadjacent to the eastern shore of the peninsula itself, andtwo submerged offshore rocky ‘reefs’. Divers assessed thedepth of the rock–sand interface at each site. The lengthof each habitat and the distances between habitats wereestimated with the aid of a global positioning system(GPS) receiver and nautical maps (Tripp
et al
. 1957;Malawi Government 1977).
Sample collection
A total of 368 individual
M. auratus
was sampled at ninesites in southern Lake Malawi. Sample sizes at each localityare shown in Table 2; the mean number of fish sampled/site is 41. Sample sizes at these sites, many of which arewithin the boundaries of Lake Malawi National Park, wererestricted under the conditions of our collecting permit.
Fish were captured by SCUBA divers using monofila-ment nets. Divers usually worked within 50 m of eachother to avoid possible complications from the Wahlundeffect. An exception was made at the site designatedShallow Reef where fish were collected from two exposedrocky ledges
≈
800 m apart, at either end of a sprawlingaggregation of rocky habitats in a sand and gravel matrixgenerally 100
−
300 m from shore. This was necessary dueto the relatively low densities of
M. auratus
at these sites.Tissue for this study consisted of fin clips (
≈
0 .5–1 cm
2
)obtained from one of the unpaired fins (for fish collected
MEC658.fm Page 1015 Thursday, June 10, 1999 11:48 AM

1016
J . A . M A R K E R T
E T A L
.
© 1999 Blackwell Science Ltd,
Molecular Ecology
, 8, 1013–1026
in Lake Malawi National Park) or from pectoral fins. Fishcollected in Lake Malawi National Park were clipped andreleased. Fish from other sites were preserved as voucherspecimens. The fin tissue was preserved in 70
−
100%EtOH (undenatured), and the samples were then storedat
c.
−
15
°
C pending transport to the USA.
Locus isolation and characterization
Two of the loci used in this work (UNH-001 and UNH-002) were used previously by Kellogg
et al
. (1995) forpaternity analysis. These and two additional loci, UNH-050 and UNH-231, were isolated using methodsdescribed by Lee & Kocher (1996). All four loci areperfect dinucleotide repeats. Locus 231 was cloned from
Oreochromis niloticus
and the remaining loci weredeveloped from an
M. auratus
library. Primer sequences,GenBank accession numbers, and fragment size rangesare provided in Table 3.
DNA preparation and amplification
DNA samples were extracted and amplified usingthe methods outlined in Kellogg
et al
. (1995). OptimalPCR conditions were determined empirically. UNH-001,UNH-050 and UNH-231 were usually amplified by 25cycles of 94
°
C (0:20), 56
°
C (0:45), 72
°
C (0:45). Forlocus UNH-002 an annealing temperature of 54
°
C wassubstituted and 30 thermal cycles were used. Fragmentsize ranges are listed in Table 3. Samples were electro-phoresed on a 6% denaturing acrylamide gel at 30 W for8.25 h using an ABI 373A DNA sequencer.
Scoring and binning of alleles
GeneScan Analysis software (Applied Biosystems, FosterCity, California, USA) provides highly repeatable estimatesof fragment size. Because of differences in base-paircomposition between ABI’s GeneScan-500 size standardand the PCR products, these estimates were almost neverintegers. In order to determine fragment homology, frag-ment size estimates at each locus were sorted by size and‘binned’ into allele size estimates that typically differedby 2 bp. Allele size estimates were sorted by size andranked. These rank scores were then plotted against allelesize to provide a visual representation of the bins. If binlimits were ambiguous, individuals at both extremes ofthat bin and from neighbouring bins were re-run on asingle gel.
Detection of null alleles
The possibility of ‘null’ alleles (alleles that cannot be visu-alized due to mutations in the PCR primer site) complic-ates the analysis of SSR data. The frequency of thesealleles can be quite high (see Lehman
et al
. (1996) andAllen
et al
. (1995) for recent examples). In their survey ofpopulations of several
Pseudotropheus
species from LakeMalawi, van Oppen
et al.
(1997) reported that a truebreeding null allele is present at locus UNH-002 in someof the mbuna species they studied.
To estimate the frequency of null alleles in our data set,individuals for which PCR products could be generatedat only three of the four loci after two or more attemptswere provisionally assumed to be homozygous for a
Table 1 A description of collection localities along the Nakumba Peninsula. Habitat depth is defined as the depth of the rock–sandinterface
Collection siteDepth of habitat (m) Habitat description
Harbour Island 30 Large boulders with some gravel and cobbles. Continuous with shoreline habitat.Ilala Gap 36 A shoreline habitat composed primarily of large rounded boulders. Fish were collected just south of
the channel between the peninsula and Domwe Island.Mazinzi Reef 13 An isolated and submerged rocky outcrop about 3 km from shore. The total habitat area is an
estimated 20 000 m2 in area and is composed of all size-classes of rocky substrate. The highest point of this structure is 3 m below the lake surface.
Mphande Island 4 An isolated shallow habitat along the lakeward side of Mphande Island consisting of sedimented cobbles, small (< 1 m diameter) boulders and some large (> 3 m) boulders at the rock/sand interface.
Mumbo Island 46 An isolated habitat about 6.5 km west of the Nankumba Peninsula. Habitat at this site is primarily large rocks although some sand and gravel patches are present.
Mvunguti—SE 36 A heterogeneous habitat composed of all sizes of rocky substrate.Nkhudzi Point 11 A heterogeneous habitat composed of all sizes of rocks in addition to patches of gravel and sand.Shallow Reef 3 The substrate at this sprawling site is a sand/gravel matrix with many small patches of rocky habitat.
The gravel field extends approximately 0.4 km from shore along at least one transect. Two large rocky ledges are found nearshore.
Tsano Rock 32 The substrate in the vicinity is primarily rocky, lightly sedimented in sheltered areas, with small patches of sand and gravel in the shallow areas.
MEC658.fm Page 1016 Thursday, June 10, 1999 11:48 AM

BIO
GE
OG
RA
PH
Y O
F A
MA
LA
WI C
ICH
LID
1017
© 1999 B
lackwell Science L
td,
Molecular E
cology
, 8, 1013–1026
Table 2
Sample size and summary statistics for each locus and population
UNH-001 UNH-002 UNH-050 UNH-231
N
No. of Alleles
n
e
H
O
H
E
Null
F
IS
No. of Alleles
n
e
H
O
H
E
Null
F
IS
No. of Alleles
n
e
H
O
H
E
Null
F
IS
No. of Alleles
n
e
H
O
H
E
Null
F
IS
Harbour Island
74 15 4.64 0.767 0.790 0.11 n.s. 12 4.92 0.767 0.805 0.18 n.s. 10 6.63 0.785 0.856 0.08 n.s. 14 3.95 0.782 0.754 0.10 n.s.
Ilala Gap 55 12 4.60 0.772 0.791 0.14 n.s. 17 7.68 0.809 0.878 0.15 n.s. 14 7.02 0.895 0.866 0.04 n.s. 20 10.20 0.911 0.912 0.09 n.s.Mazinzi Reef
38 12 2.81 0.528 0.652 0.13 0.192 6 2.25 0.514 0.564 0.14 n.s. 10 3.48 0.675 0.722 0.11 n.s. 10 2.67 0.573 0.636 0.14 n.s.
Mphande Island
27 10 3.39 0.481 0.719 0.17 n.s. 5 1.49 0.292 0.337 0.16 n.s. 3 1.59 0.385 0.377 0.17 n.s. 8 3.79 0.840 0.751 0.31 n.s.
Mumbo Island
37 11 5.53 0.829 0.832 0.09 n.s. 6 4.07 0.513 0.766 0.16 0.332 7 2.82 0.757 0.654 0.07 n.s. 9 5.72 0.891 0.836 0.00 n.s.
Mvunguti S.E.
12 8 3.41 0.637 0.741 0.18 n.s. 10 7.58 0.833 0.905 0.05 n.s. 9 6.13 0.833 0.872 0.02 n.s. 7 4.17 0.499 0.793 0.19 n.s.
Nkhudzi Point
35 12 3.05 0.691 0.683 0.23 n.s. 5 1.68 0.259 0.409 0.15 0.374 6 1.74 0.419 0.431 0.22 n.s. 12 6.71 0.907 0.865 0.05 n.s.
Shallow Reef
36 9 2.31 0.313 0.576 0.25 n.s. 8 1.64 0.303 0.397 0.10 n.s. 8 3.46 0.765 0.721 0.06 n.s. 7 2.28 0.617 0.570 0.00 n.s.
Tsano Rock 54 15 6.32 0.856 0.851 0.02 n.s. 13 10.00 0.821 0.909 0.10 n.s. 13 8.81 0.896 0.897 0.15 n.s. 12 6.96 0.855 0.866 0.09 n.s.
N
=
number of fish sampled/site; No. of Alleles = total number of alleles observed in a population; n
e = effective number of alleles;
H
O
=
observed heterozygosity;
H
E
=
expected heterozygosity; Null
=
a maximum likelihood estimate of the null allele frequency in a population;
F
IS
values are reported only when they are significantly distinguishable from zero.n.s.
=
not significant.
ME
C658.fm
Page 1017 T
hursday, June 10, 1999 11:48 AM

1018
J . A . M A R K E R T
E T A L
.
© 1999 Blackwell Science Ltd,
Molecular Ecology
, 8, 1013–1026
null allele. These frequencies were used to estimate thefrequency of the null allele in each population using themaximum-likelihood algorithm in
genepop
3.1 (Goudet1995). Heterozygote deficiency was estimated using thescore test (Rousset & Raymond 1995) of
genepop
to esti-mate
F
IS
values and their significance level.
Estimators of between-population heterogeneity
The statistical significance of interpopulation allele fre-quency differences was determined by using exact testsin Raymond & Rousset’s (1995)
genepop
package whichfollows the methods described in Rousset & Raymond(1995). Estimates of population heterozygosity, allelefrequencies and
F
-statistics were estimated with the aidof Goudet’s (1995) program
fstat
. This package estimates
F
-statistics using the method of Weir & Cockerham (1984)and calculates confidence intervals for these estimatesusing a resampling algorithm which permits permuta-tion among loci, alleles, and populations.
Two sets of
F
ST
calculations were performed. The firstestimated the overall
F
ST
among all populations. Thesecond set estimated pairwise
F
ST
values for all pairs ofpopulations. Confidence intervals were estimated for
F
ST
estimates between adjacent populations and between thetwo terminal populations by performing 5000 resampl-ings for the overall
F
ST
estimate and 2000 resamplings foreach of the pairwise comparisons.
Barton & Slatkin’s (1985) rare allele based estimate of
N
m
was calculated using
genepop
3.1 (Raymond & Rousset1995). This divergence estimator should be less sensitivethan Weir & Cockerham’s (1984)
F
ST
to biases which resultfrom the relative youth of the populations surveyed.
Pairwise Nei’s Distance (
D
N
) and (
δµ
)
2
were calculatedfor all pairs of populations using the program
microsat
[version 1.4d] (Minch
et al
. 1995–96). Nei’s distance wasdetermined to be a more appropriate measure of diver-gence between these populations than (
δµ
)
2
(Goldstein
et al
. 1995) which assumes a single step mutation modelfor SSR loci. Although evidence is accumulating whichindicates that stepwise mutation is probably responsible
for generating the global array of alleles present at theseloci (but see Farrall & Weeks 1998), it seems likely that theallele frequency distributions observed in the sampledpopulations are the result of recent historical samplingprocesses rather than postdivergence mutation, given theextremely recent origin of the habitats in the area sur-veyed (Owen
et al
. 1990). The mutation-based statistic(
δµ
)
2
is therefore included for comparison only and isnot intended to represent a reliable index of geneticdifferentiation.
An analysis of isolation by distance was conducted byregressing log
10
M
, where
M
= 1/4((1/
F
ST
)
−
1) againstlog
10
distance following Slatkin (1993). The statisticalsignificance of the relationship between distance andthe parameter
F
ST
/(1
−
F
ST
) was estimated by using theMantel test in
genepop
3.1.
Linkage disequilibrium and locus correlation
To determine whether the four loci surveyed representindependent samples of the
M. auratus
genome,
genepop
was used to perform Fisher’s exact test under a nullhypothesis of no association between genotypes at dif-ferent loci.
To test whether there was a concordance in
F
ST
estim-ates at all four loci, a matrix of Pearson product momentcorrelations and their significance levels was calculatedfor all pairwise
F
ST
estimates.
Results
Distribution of habitats
Habitat depth estimates and brief habitat descriptions arereported in Table 1. Collection sites and habitat distribu-tion are shown in Fig. 1b. In general, the deepest habitatssurveyed are at sites in the north and west of the sam-pled area, whereas the shallower sites are in the southand east. A description of the intervening substratebetween collection sites is shown in Table 4.
Table 3 Information on the four simple sequence loci
Locus Primer sequencesGenBank Accession no.
Annealing temperature
Fragment size range (bp)
Total no. of alleles
Average heterozygosity
UNH-001 GATTAACTCTGTCCCTGTCT U17044 56 °C 157–243 30 0.650CTGAAGTGTTAAAAATATTGTT
UNH-002 TTATCCCAACTTGCAACTCTATTT U17045 54 °C 175–236 24 0.549TCCATTTCCTGATCTAACGACAAG
UNH-050 GTCATCCCACTCACTAACAT AF036714 56 °C 292–364 21 0.707AGAACAAACACAGGAAACTAT
UNH-231 GCCTATTAGTCAAAGCGT G12382 56 °C 192–253 27 0.777ATTTCTGCAAAAGTTTTCC
MEC658.fm Page 1018 Thursday, June 10, 1999 11:48 AM
BIO
GE
OG
RA
PH
Y O
F A
MA
LA
WI C
ICH
LID
1019
© 1999 B
lackwell Science L
td, M
olecular Ecology, 8, 1013–1026
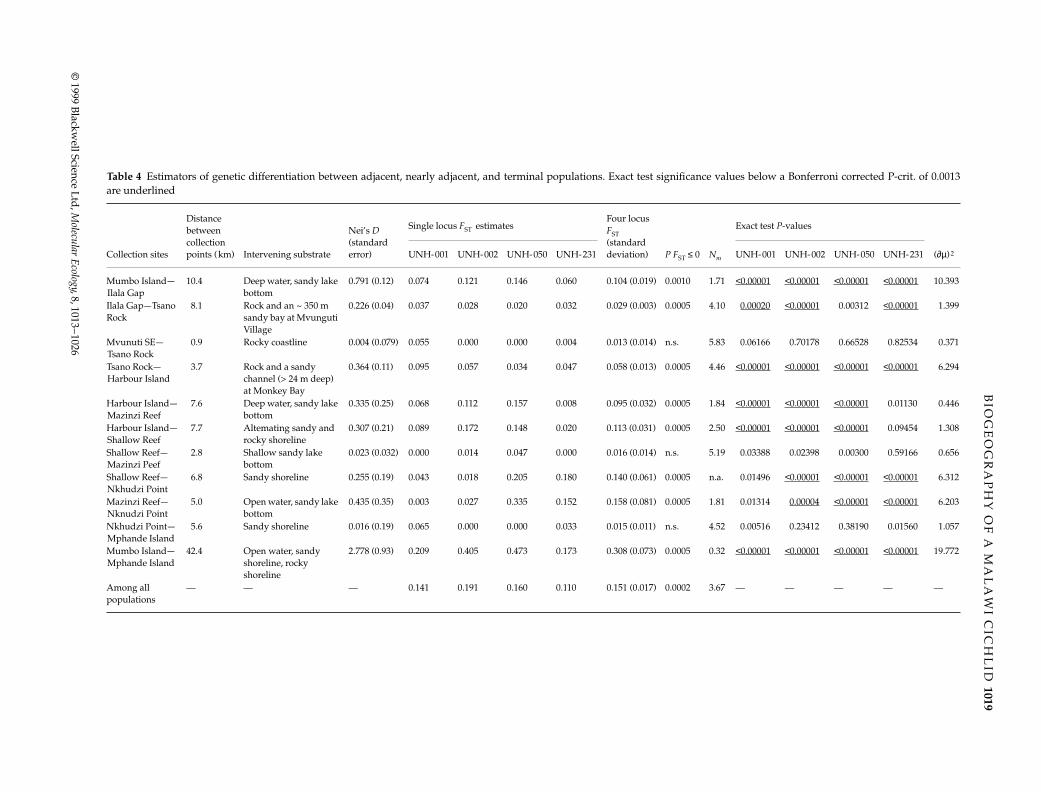
Table 4 Estimators of genetic differentiation between adjacent, nearly adjacent, and terminal populations. Exact test significance values below a Bonferroni corrected P-crit. of 0.0013are underlined
Distance between collection points (km)
Nei’s D (standard error)
Single locus FST estimatesFour locus FST (standard deviation)
Exact test P-values
Collection sites Intervening substrate UNH-001 UNH-002 UNH-050 UNH-231 P FST ≤ 0 Nm UNH-001 UNH-002 UNH-050 UNH-231 (∂µ)2
Mumbo Island—Ilala Gap
10.4 Deep water, sandy lake bottom
0.791 (0.12) 0.074 0.121 0.146 0.060 0.104 (0.019) 0.0010 1.71 <0.00001 <0.00001 <0.00001 <0.00001 10.393
Ilala Gap—Tsano Rock
8.1 Rock and an ~ 350 m sandy bay at Mvunguti Village
0.226 (0.04) 0.037 0.028 0.020 0.032 0.029 (0.003) 0.0005 4.10 0.00020 <0.00001 0.00312 <0.00001 1.399
Mvunuti SE—Tsano Rock
0.9 Rocky coastline 0.004 (0.079) 0.055 0.000 0.000 0.004 0.013 (0.014) n.s. 5.83 0.06166 0.70178 0.66528 0.82534 0.371
Tsano Rock—Harbour Island
3.7 Rock and a sandy channel (> 24 m deep) at Monkey Bay
0.364 (0.11) 0.095 0.057 0.034 0.047 0.058 (0.013) 0.0005 4.46 <0.00001 <0.00001 <0.00001 <0.00001 6.294
Harbour Island—Mazinzi Reef
7.6 Deep water, sandy lake bottom
0.335 (0.25) 0.068 0.112 0.157 0.008 0.095 (0.032) 0.0005 1.84 <0.00001 <0.00001 <0.00001 0.01130 0.446
Harbour Island—Shallow Reef
7.7 Altemating sandy and rocky shoreline
0.307 (0.21) 0.089 0.172 0.148 0.020 0.113 (0.031) 0.0005 2.50 <0.00001 <0.00001 <0.00001 0.09454 1.308
Shallow Reef—Mazinzi Peef
2.8 Shallow sandy lake bottom
0.023 (0.032) 0.000 0.014 0.047 0.000 0.016 (0.014) n.s. 5.19 0.03388 0.02398 0.00300 0.59166 0.656
Shallow Reef—Nkhudzi Point
6.8 Sandy shoreline 0.255 (0.19) 0.043 0.018 0.205 0.180 0.140 (0.061) 0.0005 n.a. 0.01496 <0.00001 <0.00001 <0.00001 6.312
Mazinzi Reef—Nknudzi Point
5.0 Open water, sandy lake bottom
0.435 (0.35) 0.003 0.027 0.335 0.152 0.158 (0.081) 0.0005 1.81 0.01314 0.00004 <0.00001 <0.00001 6.203
Nkhudzi Point—Mphande Island
5.6 Sandy shoreline 0.016 (0.19) 0.065 0.000 0.000 0.033 0.015 (0.011) n.s. 4.52 0.00516 0.23412 0.38190 0.01560 1.057
Mumbo Island—Mphande Island
42.4 Open water, sandy shoreline, rocky shoreline
2.778 (0.93) 0.209 0.405 0.473 0.173 0.308 (0.073) 0.0005 0.32 <0.00001 <0.00001 <0.00001 <0.00001 19.772
Among all populations
— — — 0.141 0.191 0.160 0.110 0.151 (0.017) 0.0002 3.67 — — — — —
ME
C658.fm
Page 1019 T
hursday, June 10, 1999 11:48 AM

1020J. A
. MA
RK
ER
T E
T A
L.
© 1999 B
lackwell Science L
td, M
olecular Ecology, 8, 1013–1026
Table 5 Population allele frequencies at four simple sequence repeat loci
Locus and Population Alleles (estimated no. of CA repeats)
UNH-001 14 18 21 22 23 24 25 26 27 28 29 30 31 32 33 34 35 36 37 38 39 40 41 42 44 45 47 49 69
Harbour Island 0.01 0.01 0.07 0.04 0.04 0.01 0.07 0.33 0.01 0.30 0.01 0.02 0.03 0.03 0.02Ilala Gap 0.02 0.01 0.02 0.01 0.01 0.40 0.17 0.09 0.07 0.02 0.06 0.11Mazinzi Reef 0.01 0.01 0.04 0.57 0.06 0.01 0.01 0.10 0.09 0.01 0.01 0.04Mphande Island 0.13 0.50 0.13 0.02 0.07 0.04 0.02 0.02 0.02 0.06Mumbo Island 0.04 0.26 0.01 0.06 0.16 0.01 0.26 0.01 0.13 0.03 0.03Mvunguti S.E. 0.05 0.09 0.09 0.50 0.14 0.05 0.05 0.05Nkhudzi Point 0.02 0.02 0.02 0.02 0.54 0.02 0.02 0.15 0.04 0.10 0.04 0.02Shallow Reef 0.64 0.06 0.03 0.11 0.02 0.02 0.05 0.05 0.03Tsano Rock 0.01 0.01 0.04 0.01 0.19 0.19 0.02 0.25 0.14 0.02 0.02 0.05 0.02 0.01 0.02
UNH-002 19 21 22 23 24 25 26 27 28 29 30 31 32 33 34 35 36 37 39 40 43
Harbour Island 0.17 0.02 0.01 0.01 0.14 0.01 0.30 0.07 0.23 0.02 0.01 0.01Ilala Gap 0.04 0.02 0.05 0.04 0.19 0.01 0.24 0.09 0.01 0.04 0.01 0.12 0.01 0.03 0.03 0.03 0.02Mazinzi Reef 0.13 0.03 0.06 0.07 0.64 0.07Mphande Island 0.06 0.06 0.81 0.04 0.02Mumbo Island 0.26 0.05 0.35 0.15 0.18 0.01Mvunguti S.E. 0.08 0.04 0.04 0.13 0.17 0.13 0.13 0.21 0.04 0.04Nkhudzi Point 0.06 0.02 0.76 0.13 0.03Shallow Reef 0.09 0.03 0.03 0.02 0.77 0.02 0.02 0.03Tsano Rock 0.01 0.01 0.17 0.02 0.12 0.12 0.06 0.04 0.03 0.06 0.04 0.01 0.08 0.14 0.06 0.01 0.01
UNH-005 67 79 82 84 86 87 88 89 90 91 92 93 94 95 96 97 98 99 102
Harbour Island 0.12 0.02 0.15 0.20 0.15 0.05 0.02 0.20 0.08 0.01Ilala Gap 0.01 0.05 0.20 0.06 0.02 0.18 0.03 0.02 0.03 0.01 0.01 0.18 0.16 0.02Mazinzi Reef 0.49 0.13 0.09 0.13 0.01 0.09 0.01 0.01 0.01 0.01Mphande Island 0.04 0.77 0.19Mumbo Island 0.01 0.09 0.20 0.54 0.03 0.01 0.11Mvunguti S.E. 0.13 0.25 0.04 0.04 0.21 0.08 0.17 0.04 0.04Nkhudzi Point 0.03 0.02 0.74 0.02 0.15 0.05Shallow Reef 0.38 0.35 0.01 0.03 0.10 0.01 0.03 0.07Tsano Rock 0.01 0.14 0.15 0.04 0.08 0.17 0.05 0.04 0.04 0.05 0.16 0.06 0.01
UNH-231 51 52 53 54 56 58 59 61 62 63 64 65 66 67 68 69 70 71 72 73 74 75 76 79 80
Harbour Island 0.03 0.01 0.23 0.02 0.43 0.09 0.04 0.02 0.05 0.01 0.01 0.01 0.02 0.04Ilala Gap 0.09 0.01 0.02 0.03 0.01 0.10 0.01 0.01 0.03 0.08 0.03 0.19 0.04 0.13 0.03 0.02 0.01 0.11 0.01 0.01Mazinzi Reef 0.01 0.01 0.27 0.54 0.04 0.04 0.01 0.01 0.03 0.01Mphande Island 0.02 0.34 0.08 0.04 0.02 0.06 0.08 0.36Mumbo Island 0.11 0.07 0.31 0.08 0.11 0.03 0.08 0.19 0.03Mvunguti S.E. 0.21 0.04 0.04 0.21 0.38 0.08 0.04Nkhudzi Point 0.02 0.20 0.11 0.02 0.02 0.14 0.17 0.02 0.03 0.05 0.03 0.20Shallow Reef 0.22 0.01 0.62 0.03 0.07 0.03 0.01Tsano Rock 0.18 0.02 0.08 0.09 0.24 0.01 0.17 0.05 0.07 0.04 0.03 0.01
ME
C658.fm
Page 1020 T
hursday, June 10, 1999 11:48 AM

B I O G E O G R A P H Y O F A M A L A W I C I C H L I D 1021
© 1999 Blackwell Science Ltd, Molecular Ecology, 8, 1013–1026
Allelic diversity and heterozygosity
A total of 29, 21, 19, and 25 alleles was observed at lociUNH-001, UNH-002, UNH-050 and UNH-231, respect-ively. The average population heterozygosity at all fourloci is 0.671. These results and other estimates of within-population genetic diversity are shown in Table 2. Allelefrequencies for all loci in all populations are shown inTable 5.
A strong positive correlation was observed betweenthe maximum depth of rocky substrate at a site and theobserved heterozygosity at that site (r2 = 0.803, P = 0.003).However, this pattern may be a result of populationancestry rather than habitat age because all the shallowsites are located in the southern end of our survey area.
The maximum likelihood estimate of null allele fre-quencies within each population ranged from 0.0 to 0.31(Table 2). These estimates will probably overstate thefrequency of null alleles because PCR reactions can failfor a variety of reasons other than primer incompatibility(Brookfield 1996); however, at least one additional ampli-fication attempt was made on individuals that did notamplify initially. We expect that true null alleles should beassociated with an excess of homozygosity. Populationswith FIS values which are significantly different from zeroare indicated in Table 2. Populations with high null allelefrequency estimates did not necessarily have FIS valuessignificantly different from zero.
Population differentiation
A high level of population structure was observed. Theoverall FST estimate is 0.151 (95% CI = 0.121 − 0.186, boot-strapping over loci). Pairwise population statistics anddistance estimates between adjacent collection sites aresummarized in Table 4. Pairwise FST values between adja-cent populations range from 0 to 0.158. Pairwise estim-ates of Nm (based on the rare alleles method) betweenadjacent sites range from 1.71 to 5.83.
Gene flow between the two terminal sites is very low.
Barton & Slatkin’s (1986) rare alleles method estimatesthe genetic equivalent of 0.32 migrants/generation. TheFST-based estimate is slightly higher at 0.56 migrants/generation. Both methods produce concordant estimates ofrelative levels of migration (Kendall’s tau = 0.722, P = 0.01)in adjacent populations. The only disagreement in rankscores occurred in population comparisons in which theFST value was statistically indistinguishable from zero,leading us to conclude that either estimator is a good relat-ive index of gene flow between habitat patches despitethe recent establishment of these populations.
All pairwise DN and FST estimates are shown in Table 6.The highest level of differentiation was observed betweenthe two terminal sites, Mumbo and Mphande Islands.Nei’s D value between these two sites is 2.778 and FST is0.308 (P = 0.0005). The lowest Nm and highest (δµ)2 estim-ates were also observed between the two terminal sites.
With a Bonferroni-corrected P (critical) of 0.0013, sig-nificant differences in allele frequency were detected atall four loci in the following adjacent population pairs:Mumbo Island/Ilala Gap and Tsano Rock/HarbourIsland. Differentiation was detected at three of the fourloci between Ilala Gap/Tsano Rock, Harbour Island/Mazinzi Reef, Harbour Island/Shallow Reef, ShallowReef/Nkhudzi Hills, and Mazinzi Reef/Nkhudzi Hills.No evidence of differentiation was detected betweenMvunguti SE/Tsano Rock, Mazinzi Reef/Shallow Reef orNkhudzi Hills/Mphande Island (Table 4).
Linkage disequilibrium and locus correlation
No evidence of linkage between loci was found, suggestingthat each locus is an independent estimate of populationstructure.
Pearson product moment correlations between FST estim-ates at different loci range from 0.4162 [UNH-002 andUNH-050] to 0.8750 [UNH-002 and UNH-231], with anaverage of 0.6321. The correlation matrix is statisticallysignificant (P < 0.001), suggesting different loci generallyyield concordant estimates of genetic differentiation.
Table 6 A matrix of four locus average FST values (below diagonal) and DN values (above diagonal)
Harbour Island
Shallow Reef Ilala Gap
Mphande Island
Mazinzi Reef
Mumbo Island
Mvunguti S. E.
Nkhudzi Point
Tsano Rock
Harbour Island — 0.307 0.939 0.522 0.335 1.348 0.471 0.490 0.364Shallow Reef 0.113 — 1.372 0.286 0.023 2.370 0.897 0.255 0.734Ilala Gap 0.111 0.229 — 1.684 1.287 0.700 0.262 1.490 0.226Mphande Island 0.168 0.150 0.246 — 0.416 2.778 1.414 0.016 1.106Mazinzi Reef 0.095 0.016 0.184 0.171 — 2.138 0.996 0.435 0.753Mumbo Island 0.163 0.305 0.104 0.308 0.264 — 1.034 2.465 0.653Mvunguti SE 0.092 0.251 0.057 0.279 0.212 0.158 — 1.270 0.004Nkhudzi Hills 0.141 0.140 0.217 0.015 0.158 0.286 0.245 — 1.000Tsano Rock 0.058 0.179 0.029 0.213 0.144 0.095 0.013 0.186 —
MEC658.fm Page 1021 Thursday, June 10, 1999 11:48 AM

1022 J . A . M A R K E R T E T A L .
© 1999 Blackwell Science Ltd, Molecular Ecology, 8, 1013–1026
Isolation by distance
Although geological evidence suggests that the popula-tions in the southern end of Lake Malawi were foundedvery recently, a strong pattern of isolation by distanceis observed, with the slope of the regression line being−0.996, r2 = 0.694. This relationship between distanceand genetic differentiation is statistically significant(P < 0.00001). This pattern is consistent with a one-dimensional stepping-stone model at equilibrium (Hellberg1995).
Discussion
SSR loci reveal evidence of genetic substructuring in LakeMalawi cichlids on very fine geographical scales. The firstpublished study on this subject (van Oppen et al. 1997)found evidence of kilometre-scale structuring in fourmbuna species (genus Metriaclima and genus Pseudo-tropheus) from four habitat patches along the westernshore of the lake. We observe an even higher level of geneticdifferentiation among M. auratus populations from theNankumba Peninsula with an overall FST value an orderof magnitude higher than the average FST estimated byvan Oppen et al. (1997). Evidence of fine-scale geneticsubstructuring exists for other mbuna species includingLabeotropheus fuelleborni (Arnegard et al. 1999), andadditional Metriaclima species complex taxa (P. Danleyet al., in preparation). These data suggest that van Oppenet al.’s (1997) assertion that mbuna populations mayrepresent thousands of genetically divergent subunits hasstrong empirical support. By systematically surveyinghabitats in a small area in southern Lake Malawi andsampling M. auratus from these habitats we are able todetermine which components of the physical environ-ment constrain migration and further explore the spatialand temporal scales of genetic differentiation in Malawicichlids.
M. auratus in southern Lake Malawi show a high levelof population differentiation, even relative to the othermbuna species surveyed to date. An overall FST value of0.151 (P < 0.0002) was observed among all sites alonga 42-km transect. Migration between the two terminalsites is estimated to be the genetic equivalent of onemigrant every second generation or less. High pairwiseFST and low Nm values were observed between severaladjacent populations, suggesting that philopatry is ageneral feature of M. auratus biology rather than anartefact of a single major barrier to gene flow within thearea surveyed.
The highest level of differentiation was observedbetween populations separated by long stretches of deepwater. Conversely, collection sites separated by longstretches of rocky or sandy shoreline show much lower
levels of differentiation. These observations are consist-ent with Ribbink’s (1986) hypothesis that deep water canserve as a strong barrier to gene flow. The lowest Nm estim-ates between adjacent sites are found between MumboIsland and Ilala Gap which are separated by approxim-ately 10 km of deep, open water. The rock–sand inter-face occurs at a depth of 45 m at Mumbo Island and 36 mat Ilala Gap. The intervening trough is about 100 m deep(Tripp et al. 1957). Similarly low Nm estimates were calcu-lated between the Mazinzi Reef, a submerged offshorerocky outcrop, and two nearby shoreline sites; HarbourIsland and Nkhudzi Hills. Although the lake bottombetween these two pairs of sites is not nearly as deep as itis between Mumbo Island and the peninsula, depth maystill be a formidable barrier for M. auratus which are mostcommon < 10 m below the surface at all the sites we sur-veyed. Marsh & Ribbink (1981) and Hill & Ribbink (1978)have demonstrated experimentally that some mbuna taxaare unable to control their buoyancy in waters greaterthan 40 m deep and that the maximum rate of depthacclimation for fish in the mbuna genus Petrotilapia is< 4 m/day, leading the authors to suggest that substrate-hugging mbuna are physiologically incapable of crossinglong stretches of deep water. Our data are consistent withRibbink et al.’s (1986) hypothesis and the Ribbink et al.(1983) hypothesis that deep water is a barrier to migra-tion due to the physiological limits of mbuna swimbladders.
The highest levels of gene flow were inferred forsamples collected from either end of continuous stretches ofrocky habitat or from rocky patches separated by shallowsandy shoreline. Ilala Gap and Tsano Rock lie at oppositeends of a nearly continuous stretch of rocky coastlinewhich is interrupted only by an approximately 350 mstretch of sandy shoreline at Mvunguti Village. These twosites are 8.2 km apart yet show considerably less differ-entiation than the sites separated by similar stretches ofopen water. The estimated FST value of 0.029 betweenthese two sites was significantly different from zero (ata Bonferroni-corrected P < 0.0038), but this is low relativeto the other significant FST values. The Nm estimate of 4.10suggests that migration is common between these twosites.
Shallow sandy shoreline also appears to facilitate dis-persal. Mphande Island is located in a shallow bay about5.6 km southeast of Nkhudzi Hills. The shoreline betweenthe two sites is apparently free of classical mbuna habitatyet the estimated Nm value of 4.52, absence of detectableallele frequency differences at any of the four loci and anFST value statistically indistinguishable from zero suggestthat migration occurs between these two sites. A similarpattern is observed between Mazinzi Reef and ShallowReef which have the second-highest pairwise estimate ofmigration observed between adjacent sites in this study
MEC658.fm Page 1022 Thursday, June 10, 1999 11:48 AM

B I O G E O G R A P H Y O F A M A L A W I C I C H L I D 1023
© 1999 Blackwell Science Ltd, Molecular Ecology, 8, 1013–1026
(Nm = 5.19), second only to the rate between Tsano Rockand Mvunguti S.E. which are separated by < 1 km ofrocky habitat. In contrast, low migration rates are estim-ated between Mazinzi Reef and other neighbouringpopulations. Although this difference in migration ratesmight be partly explained by the fact that Shallow Reef ismuch closer to Mazinzi Reef than either Harbour Islandor Nkhudzi Hills (2.8 km vs. 7.6 or 5.0 km, respectively),it seems likely that other geographical features influencethe dispersal of fish from Mazinzi Reef to Shallow Reef.Unlike the other more compact habitats we surveyed,Shallow Reef is a sprawling complex of small rocky habitatsin a sand/gravel matrix. This complex extends 0.4 kmfrom shore along at least one transect. It is possiblethat undetected habitat patches similar to the habitat atShallow Reef form a series of stepping stones betweenMazinzi Reef and Shallow Reef. Alternatively, the similar-ity between these two pairs of sites might be a result ofrecent founding of the two shallower sites (Shallow Reefand Mphande Island) by populations with only modestlevels of genetic diversity.
An alternative explanation for the distribution of geno-types at current habitats might be that they reflect olderpatterns of differentiation rather than current patterns ofmigration. We see an example of this process among thesouthern populations. Allele frequencies at Shallow Reefare most similar to those at Mazinzi Reef, and are distinctfrom Harbour Island, suggesting that gene flow has notoccurred along the shoreline between Harbour Islandand Shallow Reef. These sites are separated by a series ofshallow sandy bays punctuated with a number of rockyhabitats which might be expected to serve as steppingstones. The fact that migration is not detected along thesestepping stones may be a result of the recent availabilityof these very shallow (mostly < 2.5 m) habitats whichhave become stepping stones too recently for migrationalong this route to homogenize allele frequencies betweenHarbour Island and Shallow Reef.
In a similar fashion, the high level of genetic diver-gence between the two apparent genetic units (1) MazinziReef-Shallow Reef and (2) Nkhudzi Hills-Mphande Islandsuggests that these two population pairs are more divergedthan we might expect if Nkhudzi Hills were colonizedby migrants from Mazinzi Reef as water levels rose. Basedsolely on the distance between sites, the expectation isthat Nkhudzi Hills would be only slightly more divergedfrom Mazinzi Reef than Shallow Reef. The observedpattern could result if genetic divergence evolved beforethe current habitats were colonized. Several isolated sitesin the lake could have served as refugia when lake levelswere lower (see Arnegard et al. 1999). If these refugiawere as isolated as Mazinzi Reef or Mumbo Island aretoday, then populations at these sites might become evo-lutionarily detached from other populations in the lake,
and serve as a source of colonists as new rocky outcropsare inundated. There are at least two potential refugia inthe area that could serve as M. auratus habitat duringmoderate recessions in lake level. The waters adjacent toBoadzulu Island, some 13 km south of Mphande Island,contain rocky habitat down to at least 40 m (Ribbink et al.1983). Jerusalem Reef, 7 km east of Mazinzi Reef, is anisolated rocky outcrop, the top of which is ≈ 40 m belowthe lake surface at its shallowest point. M. auratus is notknown to exist at either of these sites currently, but itis known to exist at sites south of Boadzulu Island. Thehabitat in these areas appears similar to that at sites whereM. auratus are abundant, except for the greater depth ofhabitat at Jerusalem Reef. Several other deep reefs inthe southeast arm of Lake Malawi are known to fishermenor are shown on navigational maps (Tripp et al. 1957).Jerusalem Reef and other similar structures could rep-resent former habitats which became progressively lesssuitable for M. auratus as water levels increased. Theobserved pattern of genetic divergence suggests that whileMazinzi Reef could have been colonized by migrantsfrom Harbour Island, Nkhudzi Hills may have beencolonized from now submerged habitats to the east or south.
The four shallow southern sites show lower levels ofheterozygosity compared to the five deeper northernsites. This reduction in heterozygosity may suggest aseries of bottlenecks associated with the colonization ofnewly available habitats. Alternatively, the reduced allelicdiversity may simply reflect smaller populations at theseshallower sites because both habitat area and populationdensity are reduced relative to the adjacent deeper sites.A third possibility is that the southern populations werefounded by a genetically depauperate population fromdeep water sites to the south and east of the study areaand that the pattern of differentiation is more a result ofthe historical distribution of genotypes than of the topo-graphy of individual habitat patches.
How likely is it that observed migration estimates aremerely an artefact of small sample sizes relative to thetotal number of alleles, or that they are a result of survey-ing a small number of loci? Resampling from a simulatedpopulation with an allele distribution similar to locusUNH-001 for all populations combined suggests thatFST estimates between small samples drawn from asingle panmictic population are almost two orders ofmagnitude smaller than those observed between the mostisolated M. auratus populations (Markert 1998). For samplesof only 25 individuals, 95% of pairwise FST estimates are< 0.007 and only the highest 5% of pairwise FST estimateswere found to be statistically distinguishable from zerousing either the resampling algorithms of fstat or theexact tests for allele frequency distribution in genepop.Recently, Ruzzante (1998) has demonstrated that samplevariances in Weir & Cockerham’s (1984) FST estimator are
MEC658.fm Page 1023 Thursday, June 10, 1999 11:48 AM

1024 J . A . M A R K E R T E T A L .
© 1999 Blackwell Science Ltd, Molecular Ecology, 8, 1013–1026
low relative to other estimators, that FST is unbiased evenat small sample sizes, and that the sampling variance inFST actually decreases with an increasing number of allelesfor a given sample size. The main advantage of increasingsample sizes would be to enhance our statistfical power,enabling the detection of smaller levels of genetic differenti-ation and finer discrimination among migration barriers.
Although adding loci would be expected to enhancethe accuracy of the distance estimates, the Pearson cor-relation matrix indicates that the four loci surveyed inthis study are generally concordant with respect to estim-ates of interpopulation differentiation. Single-locus FSTestimates and the statistical significance of allele frequencydifferences for adjacent pairs of populations are shownin Table 4. In the instances where interpopulation hetero-geneity is detectable at only three of the four loci inadjacent populations, a single allele is present at a highfrequency in both populations being compared.
The rapid evolution of the Lake Malawi cichlid flockmay be driven by the fragmented and chronically unstablerocky habitats. The importance of habitat fragmenta-tion and transience in the evolution of the Lake Malawicichlid species was first emphasized by Trewavas (1947)and later elaborated by Fryer (1959b). For the mbuna,Fryer suggested that populations on isolated rocky outcropsare free to pursue independent evolutionary trajectories.The course of these trajectories may be set either by driftor by adaptation to local physical, social, or ecologicalconditions. These local conditions are modified continu-ously as a result of the frequent changes in water level.Ribbink et al. (1983) have suggested that fluctuations inwater level may play a generative role in speciation byaltering the size of rocky zones, exposing or drowninginhabited areas, and fragmenting or uniting habitatpatches. Although this process may lead to local extinc-tions, a perpetually shifting evolutionary landscape coulddrive speciation with each newly available habitat patchpossessing unique physical conditions, collections offauna, and evolutionary challenges which may lead toevolutionary divergence among mbuna populations inthe absence of substantial interhabitat gene flow.
Conclusions
The low level of migration in mbuna species combinedwith the isolated nature of many of the rocky habitatpatches within Lake Malawi provide many opportunitiesfor evolutionary divergence. van Oppen et al. (1997) havesuggested that mbuna species are divided into thousandsof genetically isolated units and that this division providesnumerous opportunities for allopatric speciation. The docu-mentation of fine-scale population differentiation in M.auratus presented here is consistent with this suggestion.
Data are emerging which suggest that fine-scale genetic
substructuring may be a general feature of mbuna bio-logy. van Oppen et al. (1997) and Arnegard et al. (1999)have demonstrated high levels of population structurein five additional species using SSR loci. When com-bined with data from allozyme and mitochondrial DNAsequences (McKaye et al. 1984; Bowers et al. 1994), a wide-spread pattern of philopatry emerges.
Speciation is also likely to be influenced by thedynamic nature of Lake Malawi itself (sensu. Vrba 1985).In mbuna the speciation process is perhaps enhanced bythe chronic instability of the rocky habitats along theshores of the lake. While rapid and frequent changes inlake level alter components of the physical environment,genetic and environmental differences between popula-tions also develop. Colonization of a newly flooded habitatpatch would be expected to be accompanied by stochasticchanges in both allele frequencies (due to founder effects)and community structure. This may differentiate popu-lations with respect to both the potential response toselection (as a result of allele frequency differences), andthe selective environment itself (as a result of differencesin community structure or the physical environment).
The other African Rift Valley Lakes have also experi-enced dramatic climatically driven changes in water levelduring the Pleistocene (cf. Scholz & Rosendahl (1988);Johnson et al. (1996)). If habitat fidelity is a general fea-ture of the biology of the East African cichlids then philo-patry and habitat instability may help explain the rapidevolution of biodiversity observed in the African cichlidspecies flocks.
Acknowledgements
We wish to express our appreciation to Julie Baldizar, KarenKellogg, and Jay R. Stauffer, Jr. (who provided underwater fieldsupport for our research), Aggrey Ambali and Harvey Kabwazi(for their advice and support in Malawi), and Janet Conroy andWoo-Jai Lee (who isolated the microsatellite loci used in thisstudy). Christopher Bvalani, Wykliff Louis, and Timoth Mpondaendured long hours of outfitting and transporting SCUBA diversduring the field portion of this study. We also gratefullyacknowledge the Malawi Parks Department for providingpermission to work in Lake Malawi National Park (Permitno. 684658). This work was supported by grants from theNational Geographic Society (J.A.M., T.D.K.), the NationalScience Foundation (J.A.M., T.D.K.), the Fulbright Commission(P.D.D.) and the Rotary Foundation (M.E.A.). Additional insightswere provided by Ann C. Bucklin, C. Sarah Cohen, IrvingKornfield, Michelle Scott, Monica Stevens-Sommer and LizhaoWu. Three anonymous reviewers and Louis Bernatchez pro-vided useful comments on an earlier version of this manuscript.
References
Allen PJ, Amos W, Pomeroy PP, Twiss SD (1995) Microsatellitevariation in grey seals (Halichoerus grypus) shows evidence of
MEC658.fm Page 1024 Thursday, June 10, 1999 11:48 AM

B I O G E O G R A P H Y O F A M A L A W I C I C H L I D 1025
© 1999 Blackwell Science Ltd, Molecular Ecology, 8, 1013–1026
genetic differentiation between two British breeding colonies.Molecular Ecology, 4, 653–662.
Arnegard ME, Markert JA, Danley PD, Stauffer Jr JR, AmbaliAJD, Kocher TD (1999) Population structure and color vari-ation in the lithophilous cichlid Labeotropheus fuelleborni Ahlalong a recently formed archipelago of rocky habitat patches insouthern Lake Malawi. Proceedings of the Royal Society of London,Series B, 266, 119–130.
Barton NH, Slatkin M (1986) A quasi-equilibrium theory of thedistribution of rare alleles in a subdivided population. Heredity,56, 409–415.
Boulenger GA (1897) Description of a new fish from LakeNyassa. Annals and Magazine of Natural History, 6, 155.
Boulenger GA (1915) Catalogue of the Fresh-Water Fishes of Africain the British Museum (Natural History). British Museum(Natural History), London, UK.
Bowers NJ (1993) A revision of the Genus Melanochromis (Teleostei:Cichlidae) from Lake Malawi, Africa, using morphological andmolecular techniques. PhD Thesis, The Pennsylvania StateUniversity.
Bowers N, Stauffer Jr JR, Kocher TD (1994) Intra- and inter-specific mitcochondrial DNA sequence variation within twospecies of rock-dwelling cichlids (Teleostei: Cichlidae) fromLake Malawi, Africa. Molecular Phylogenetics and Evolution, 3,75–82.
Brookfield JFY (1996) A simple new method for estimating nullallele frequency from heterozygote deficiency. Molecular Eco-logy, 5, 453–455.
Dominey WJ (1984) Effects of sexual selection and life history onspeciation: species flocks in African cichlids and HawaiianDrosophilia. In: Evolution of Species Flocks (eds Echelle AA,Kornfield I), pp. 231–249. University of Orono Press, Orono, USA.
Farrall M, Weeks DE (1998) Mutational mechanisms for generat-ing microsatellite allele-frequency distributions: an analysis of4,558 markers. American Journal of Human Genetics, 62, 1260–1262.
Fryer G (1959a) The ecology and evolution of a group of rock-frequenting Nyasan cichlid fishes known as the ‘Mbuna’.Proceedings of the Zoological Society of London, 132, 237–279.
Fryer G (1959b) Some aspects of evolution in Lake Nyasa. Evolu-tion, 13, 440–451.
Fryer G (1965) Predation and its effects on migration and speci-ation in African fishes: a comment. Proceedings of the ZoologicalSociety of London, 144, 301–322.
Goldstein DB, Linares AR, Cavalli-Sforza LL, Feldman MW (1995)An evaluation of genetic distances for use within microsatelliteloci. Genetics, 139, 463–471.
Goudet J (1995) fstat (Version 1.2): a computer program to cal-culate F-statistics. Journal of Heredity, 86, 485–486.
Greenwood PH (1964) Explosive speciation in African lakes.Proceedings of the Royal Institute of Great Britain, 40, 256–269.
Günther A (1864) Report on a collection of reptiles and fishesmade by Dr Kirk in the Zambezi and Nyasa regions. Proceed-ings of the Zoological Society of London, 1864, 303–314.
Hellberg ME (1995) Stepping-stone gene flow in the solitarycoral Balanophyllia elegans: equilibrium and nonequilibrium atdifferent spatial scales. Marine Biology, 123, 573–581.
Hill BJ, Ribbink AJ (1978) Depth equilibration of a shallow-watercichlid fish. Journal of Fish Biology, 13, 741–745.
Jackson PBN (1955) A new fish of the genus Clarias Gronov. fromLake Nyasa, with notes on the distribution of the Clariidae andother catfishes in the lake. Proceedings of the Zoological Society ofLondon, 125, 681–684.
Johnson TC, Scholz CA, Talbot MR et al. (1996) Late Pleistocenedessication of Lake Victoria and rapid evolution of cichlidfishes. Science, 273, 1091–1093.
Kellogg KA, Markert JA, Stauffer Jr JR, Kocher TD (1995) Micro-satellite variation demonstrates multiple paternity in lekkingcichlid fishes from Lake Malawi, Africa. Proceedings of the RoyalSociety of London, 260, 79–84.
Kosswig C (1947) Selective mating as a factor for speciation incichlid fish of east African lakes. Nature, 159, 604.
Lee W-J, Kocher TD (1996) Microsatellite DNA markers for geneticmapping in Oreochromis niloticus. Journal of Fish Biology, 49,169–171.
Lehman T, Hawley WA, Collins FH (1996) An evaluation of evo-lutionary constraints on microsatellite loci using null alleles.Genetics, 144, 1155–1163.
Malawi Government (1977) Nankumba Peninsula Sheet 1434B2& Part of 1334D4. Dept of Surveys, Blantyre, Malawi.
Markert JA (1998) Population structure and phylogenetic history ofthe Lake Malawi cichlid species flock. PhD Thesis, University ofNew Hampshire.
Marsh AC, Ribbink AJ (1981) A comparison of the abilities ofthree sympatric species of Petrotilapia (Cichlidae, Lake Malawi)to penetrate deep water. Environmental Biology of Fishes, 6, 367–369.
McKaye KR, Gray WN (1984) Extrinsic barriers to gene flow inrock-dwelling cichlids of Lake Malawi: Macrohabitat hetero-geneity and reef colonization. In: Evolution of Fish Species Flocks(eds Echelle AA, Kornfield I), pp. 169–181. University of Maineat Orono Press, Orono, USA.
McKaye KR, Kocher T, Reinthal P, Harrison R, Kornfield I (1984)Genetic evidence of allopatric and sympatric differentiationamong color morphs of a Lake Malawi cichlid fish. Evolution,38, 215–219.
Minch E, Ruiz-Linares A, Goldstein D, Feldman M, Cavalli-Sforza LL (1995–96) MICROSAT (Version 1.4d): a computerprogram for calculating various statistics on microsatelliteallele data WWW: http://lotka.stanford.edu/microsat.html.
van Oppen MJH, Deutsch JC, Turner GF et al. (1997) Unusuallyfine-scale genetic structuring found in rapidly speciatingMalawi cichlid fishes Proceedings of the Royal Society of London,Series B, 264, 1803–1812.
Owen RB, Crossley R, Johnson TC et al. (1990) Major low lakelevels of Lake Malawi and their implications for speciationrates in cichlid fishes. Proceedings of the Royal Society of London,240, 519–553.
Patterson HEH (1985) The recognition concept of species. In:Species and Speciation (ed. Vrba ES) Pretoria, S.A., TransvaalMuseum, 4, 21–34.
Raymond M, Rousset F (1995) genepop (Version 1.2): Popula-tion genetics software for exact tests and ecumenicism.Journal of Heredity, 86, 248–249.
Ribbink AJ (1986) The species concept, sibling species andspeciation. Proceedings of the 3rd European Workshop on CichlidBiology. Musee Royal de L’Afrique Centrale, Tevuren, Belgium.
Ribbink AJ, Marsh AC, Marsh BA, Sharp BJ (1983) A prelimin-ary survey of the cichlid fishes of the rocky habitats in LakeMalawi. South African Journal of Zoology, 18, 149–310.
Rousset F, Raymond M (1995) Testing heterozygote excess anddeficiency. Genetics, 140, 1413–1419.
Ruzzante DE (1998) A comparison of several measures of geneticdistance and population structure with microsatellite data:bias and sampling variance. Canadian Journal of Fisheries andAquatic Sciences, 55, 1–14.
MEC658.fm Page 1025 Thursday, June 10, 1999 11:48 AM

1026 J . A . M A R K E R T E T A L .
© 1999 Blackwell Science Ltd, Molecular Ecology, 8, 1013–1026
Scholz CA, Rosendahl BR (1988) Low lake stands in LakeMalawi and Tanganyika, East Africa, delineated with multi-fold seismic data. Science, 240, 1645–1648.
Slatkin M (1993) Isolation by distance in equilibrium and non-equilibrium populations. Evolution, 47, 264–279.
Tautz D (1989) Hypervariability of simple sequences as a generalsource for polymorphic DNA markers. Nucleic Acids Research,17, 6463–6471.
Trewavas E (1947) Speciation in cichlid fishes of East AfricanLakes. Nature, 160, 96–97.
Tripp RT, Bailey RT, Crosby A, Farrer R (1957) Chipoka toMonkey Bay.
Vrba ES (1985) Environment and evolution: alternative causes ofthe temporal distribution of evolutionary events. South AfricanJournal of Science, 81, 229–236.
Weir BS, Cockerham CC (1984) Estimating F-statistics for theanalysis of population structure. Evolution, 38, 1358–1370.
This work is one of a series of papers which explore populationstructure and phylogeographic history in mbuna species alongthe shores of Lake Malawi’s Nankumba Peninsula. JeffreyMarkert is a postdoctoral research associate who uses molecularpopulation genetics to understand the processes which have ledto the evolution of the taxonomic richness which characterizesthe cichlids of the African Rift Valley lakes. This publicationrepresents a portion of his doctoral dissertation at the Universityof New Hampshire. Matthew Arnegard is a PhD student whoseinterests include animal communication, species recognition,and the evolution of genetic structure in populations. PatrickDanley is a PhD student studying the genetic basis of repro-ductive isolation in cichlids. Thomas Kocher is Professor ofZoology at the University of New Hampshire, and is interestedin genomic approaches to understanding the genetic basis ofspeciation and the evolution of species differences.
MEC658.fm Page 1026 Thursday, June 10, 1999 11:48 AM