Blackbaud Enterprise CRM Data Mart and OLAP Guide · 2 CHAPTER 1 System Statistics When you create...
32
Data Mart and OLAP Guide
-
Upload
hoangduong -
Category
Documents
-
view
214 -
download
0
Transcript of Blackbaud Enterprise CRM Data Mart and OLAP Guide · 2 CHAPTER 1 System Statistics When you create...

Data Mart and OLAP Guide

012511
Enterprise CRM, version 2.9 US©2011 Blackbaud, Inc. This publication, or any part thereof, may not be reproduced or transmitted in any form or by any means, electronic, or mechanical, including photocopying, recording, storage in an information retrieval system, or otherwise, without the prior written permission of Blackbaud, Inc.
The information in this manual has been carefully checked and is believed to be accurate. Blackbaud, Inc., assumes no responsibility for any inaccuracies, errors, or omissions in this manual. In no event will Blackbaud, Inc., be liable for direct, indirect, special, incidental, or consequential damages resulting from any defect or omission in this manual, even if advised of the possibility of damages.
In the interest of continuing product development, Blackbaud, Inc., reserves the right to make improvements in this manual and the products it describes at any time, without notice or obligation.
All Blackbaud product names appearing herein are trademarks or registered trademarks of Blackbaud, Inc.
All other products and company names mentioned herein are trademarks of their respective holder.
Data Mart and OLAP ‐2011

Contents
DATA MARTS AND OLAP . . . . . . . . . . . . . . . . . . . . . . . . . . . . . . . . . . . . . . . . . . . . . . 1
System Statistics . . . . . . . . . . . . . . . . . . . . . . . . . . . . . . . . . . . . . . . . . . . . . . . . . . . . . . . . . . . . . . . . . . . . . 2OLAP Excel Reports . . . . . . . . . . . . . . . . . . . . . . . . . . . . . . . . . . . . . . . . . . . . . . . . . . . . . . . . . . . . . . . . . . . 3
Excel Report Templates . . . . . . . . . . . . . . . . . . . . . . . . . . . . . . . . . . . . . . . . . . . . . . . . . . . . . . . . . . . . . . . 3OLAP Explorer . . . . . . . . . . . . . . . . . . . . . . . . . . . . . . . . . . . . . . . . . . . . . . . . . . . . . . . . . . . . . . . . . . . . . . . 5
OLAP Explorer Toolbar . . . . . . . . . . . . . . . . . . . . . . . . . . . . . . . . . . . . . . . . . . . . . . . . . . . . . . . . . . . . . . . . 7Manage Data Marts . . . . . . . . . . . . . . . . . . . . . . . . . . . . . . . . . . . . . . . . . . . . . . . . . . . . . . . . . . . . . . . . . . 8Reporting Data Mart Page . . . . . . . . . . . . . . . . . . . . . . . . . . . . . . . . . . . . . . . . . . . . . . . . . . . . . . . . . . . . . 8
Start ETL Refresh . . . . . . . . . . . . . . . . . . . . . . . . . . . . . . . . . . . . . . . . . . . . . . . . . . . . . . . . . . . . . . . . . . . . . 8Reset ETL . . . . . . . . . . . . . . . . . . . . . . . . . . . . . . . . . . . . . . . . . . . . . . . . . . . . . . . . . . . . . . . . . . . . . . . . . . . 9Manage KPIs . . . . . . . . . . . . . . . . . . . . . . . . . . . . . . . . . . . . . . . . . . . . . . . . . . . . . . . . . . . . . . . . . . . . . . . . 9Edit KPI Dashboard . . . . . . . . . . . . . . . . . . . . . . . . . . . . . . . . . . . . . . . . . . . . . . . . . . . . . . . . . . . . . . . . . . 10Refresh ETL Process . . . . . . . . . . . . . . . . . . . . . . . . . . . . . . . . . . . . . . . . . . . . . . . . . . . . . . . . . . . . . . . . . 11
ETL History Tab . . . . . . . . . . . . . . . . . . . . . . . . . . . . . . . . . . . . . . . . . . . . . . . . . . . . . . . . . . . . . . . . . . . . . 12SQL Agent Job Tab . . . . . . . . . . . . . . . . . . . . . . . . . . . . . . . . . . . . . . . . . . . . . . . . . . . . . . . . . . . . . . . . . . . 13ETL Report Tab . . . . . . . . . . . . . . . . . . . . . . . . . . . . . . . . . . . . . . . . . . . . . . . . . . . . . . . . . . . . . . . . . . . . . 14Job Schedules Tab . . . . . . . . . . . . . . . . . . . . . . . . . . . . . . . . . . . . . . . . . . . . . . . . . . . . . . . . . . . . . . . . . . . 15OLAP Database Roles Tab . . . . . . . . . . . . . . . . . . . . . . . . . . . . . . . . . . . . . . . . . . . . . . . . . . . . . . . . . . . . . 15
Add Database Roles . . . . . . . . . . . . . . . . . . . . . . . . . . . . . . . . . . . . . . . . . . . . . . . . . . . . . . . . . . . . . . . . . 16Edit Database Roles . . . . . . . . . . . . . . . . . . . . . . . . . . . . . . . . . . . . . . . . . . . . . . . . . . . . . . . . . . . . . . . . . 22Delete Database Roles . . . . . . . . . . . . . . . . . . . . . . . . . . . . . . . . . . . . . . . . . . . . . . . . . . . . . . . . . . . . . . . 22
DATA MARTS CONFIGURATION . . . . . . . . . . . . . . . . . . . . . . . . . . . . . . . . . . . . . . . . . 23
Select Eligible Smart Fields . . . . . . . . . . . . . . . . . . . . . . . . . . . . . . . . . . . . . . . . . . . . . . . . . . . . . . . . . . . 23Select Eligible Attribute Categories . . . . . . . . . . . . . . . . . . . . . . . . . . . . . . . . . . . . . . . . . . . . . . . . . . . . . 24Deploy Eligible Source Codes . . . . . . . . . . . . . . . . . . . . . . . . . . . . . . . . . . . . . . . . . . . . . . . . . . . . . . . . . . 25Edit HTTP Data Source URL . . . . . . . . . . . . . . . . . . . . . . . . . . . . . . . . . . . . . . . . . . . . . . . . . . . . . . . . . . . 25Edit ETL Queues . . . . . . . . . . . . . . . . . . . . . . . . . . . . . . . . . . . . . . . . . . . . . . . . . . . . . . . . . . . . . . . . . . . . 25
INDEX . . . . . . . . . . . . . . . . . . . . . . . . . . . . . . . . . . . . . . . . . . . . . . . . . . . . . . . . . . . 27


1chapter
Data Marts and OLAP
System Statistics . . . . . . . . . . . . . . . . . . . . . . . . . . . . . . . . . . . . . . . . . . . . . . . . . . . . . . . . . . . . . . . . . . 2
OLAP Excel Reports . . . . . . . . . . . . . . . . . . . . . . . . . . . . . . . . . . . . . . . . . . . . . . . . . . . . . . . . . . . . . . . 3
OLAP Explorer . . . . . . . . . . . . . . . . . . . . . . . . . . . . . . . . . . . . . . . . . . . . . . . . . . . . . . . . . . . . . . . . . . . . 5
Manage Data Marts . . . . . . . . . . . . . . . . . . . . . . . . . . . . . . . . . . . . . . . . . . . . . . . . . . . . . . . . . . . . . . . . 8
Reporting Data Mart Page. . . . . . . . . . . . . . . . . . . . . . . . . . . . . . . . . . . . . . . . . . . . . . . . . . . . . . . . . . . 8
After you install the program, you can create a standard data mart with the Blackbaud Data Mart Deployment Wizard. The data mart copies data from your source database and places it in a data warehouse to allow you to conduct complex reporting and analysis. For information about the deployment wizard, see the Installation Guide.
After you create the data mart, options appear in Administration for the Extract, Transform, and Load (ETL) process. The ETL process extracts records from the source database, transforms them for optimal loading into the OLAP cube, and loads them in the data mart. From Administration, you can access the Reporting data mart page to monitor ETL activity, schedule business processes to coincide with the ETL process, and manually start an ETL refresh.
When the deployment wizard creates the standard data mart, it also creates an OLAP cube to conduct complex reporting and analysis on the data in the data mart. The cube increases your ability to manipulate data from the source database, and it allows you to perform advanced reporting. With the OLAP Explorer, you can build pivot tables and charts based on the OLAP cube. The program also includes Microsoft Excel report templates so that you can use subsets of the data in the OLAP cube to create reports in Excel.
1

2 CHAPTER 1
System StatisticsWhen you create a standard data mart, the program copies data from the database and places it in a data warehouse. The program then creates an OLAP cube with data from the data mart to allow you to conduct advanced reporting. To view basic statistics about the Fundraising data mart, click Fundraising system statistics in Analysis. The Fundraising System Statistics page appears.
On this page, statistics provide an overview of the data in the OLAP cube. You use the data in the cube to create reports in Excel or to create pivot tables and charts in the OLAP Explorer.
Under Record Counts, categories appear for the measures in the OLAP cube, along with the number of measures in each category. The OLAP cube categorizes data into measures and dimensions. Measures are numeric values such as constituent count and revenue amount that you track in reports. Dimensions are variables such as date and location that are similar to fields in the database. You calculate the measures at the intersection of the dimensions you select. For example, to create a report that shows how much you raised on a certain day in a certain city, you calculate the revenue amount measure at the intersection of the date and location dimensions. The resulting report shows how much you raised on the designated day in the designated city.
Under Revenue by Calendar Year, revenue statistics appear for each calendar year included in the data mart.

DATA MARTS AND OLAP 3
OLAP Excel ReportsAfter you create a data mart and its OLAP cube, you can conduct complex reporting and analysis on data from the program. To manipulate subsets of data from the OLAP cube in spreadsheets, you can use the Microsoft Excel report templates to create workbooks in Excel.
The workbooks copy a subset of data from the OLAP cube, and you can manipulate the data in the spreadsheets to create complicated reports that take advantage of the cube’s multidimensional view of the data. To create Excel reports from the OLAP cube, go to Analysis and click OLAP Excel reports. The Excel Report Templates screen appears.
On this screen, you select a template from the hierarchy. A description appears under Template Information. To create a workbook based on the template, click Create Workbook. The Save Excel Workbook screen appears. After you save the workbook, you can create spreadsheets in Excel and manipulate the subset of data from the OLAP cube that is associated with the template. For information about how to create reports in Excel, see the Microsoft Excel help file.
Excel Report TemplatesThis table lists the report templates you can use to create workbooks in Excel.
Note: You must use Excel 2007 to create a workbook from the available templates.
Note: If you run a local copy of Excel against a remote OLAP server, you must connect to the cube over HTTP. To supply the URL for the OLAP Excel Reports feature to use in the connection string, see “Edit HTTP Data Source URL” on page 25.
Screen Item DescriptionAge Analysis Use this template to break down constituent counts, revenue counts, and
revenue amounts by the age of constituents.Appeal Analysis Use this template to break down constituent counts, revenue counts, and
revenue amounts for your appeals.

4 CHAPTER 1
Appeal Trend Use this template to chart the amounts that appeals receive each week. You can use the chart to compare appeals.
Campaign Analysis Use this template break down constituent counts, revenue counts, and revenue amounts for your campaigns.
Constituency Analysis Use this template to break down constituent counts, revenue counts, and revenue amounts by constituencies. This template creates a chart to plot revenue amounts by constituency.
Demographic Analysis Use this template to break down constituent counts, revenue counts, and revenue amounts by demographics such as ethnicity, religion, and income.
Designation Analysis Use this template to break down constituent counts, revenue counts, and revenue amounts for your designations.
Education Analysis Use this template to break down constituent counts, revenue counts, and revenue amounts by education information such as class year and study area.
Geographic Analysis Use this template to break down constituent counts, revenue counts, and revenue amounts by geographic information for constituents.
Inbound Channel Analysis
Use this template to break down constituent counts, revenue counts, and revenue amounts by the source, or the inbound channel, of the revenue.
Package Performance Use this template to break down packages in marketing efforts by quantity mailed, gifts, response rate, revenue, average revenue, revenue per piece, cost per piece, and net revenue per piece.
Revenue Report Use this template to break down marketing efforts by quantity mailed, gifts, response rate, revenue, average revenue, total cost, net revenue, return on investment, and cost per dollar raised.
Year over Year Analysis Use this template to break down constituent counts, revenue counts, revenue amounts, and percent changes from fiscal year to fiscal year. This template creates a chart that plots revenue amount by fiscal year.
Screen Item Description

DATA MARTS AND OLAP 5
OLAP ExplorerAfter you create a data mart and its OLAP cube, you can conduct complex reporting and analysis on data from the program. To build pivot tables and charts within the program, you use the OLAP Explorer. The OLAP Explorer allows you to manipulate data in the OLAP cube and take advantage of the cube’s multidimensional view to create complicated reports. To create pivot tables and charts, go to Analysis and click OLAP explorer. The OLAP Explorer appears.
On the OLAP Explorer, you can use the measures and dimensions in the OLAP cube to create complex reports. The cube categorizes data into measures and dimensions to provide a multidimensional view of the data. This allows you to view the data and create reports from a variety of perspectives.
Measures are the numeric values such as constituent count and revenue amount that you track in your reports. Dimensions are variables such as date and location that are similar to the fields in the database. To create a report, you calculate the values of measures at the intersection of dimensions. For example, to create a report that shows how much you raised on a certain day in a certain city, you calculate the revenue amount measure at the intersection of the date and location dimensions. This resulting report shows how much you raised on the designated day in the designated city.
The OLAP Explorer displays your pivot tables and charts on the Chart and Grid tabs. To create the reports, you drag and drop items from Measures and Dimensions to Slicer, Series, and Categorical. When the measures and dimensions are in place, you can use the OLAP cube’s multidimensional view of the data to drill through the levels of data for top‐down analysis.
To create reports in the OLAP Explorer, you manipulate several areas on the screen.
Display mdx cell selectors in grid. When you select this checkbox, entries on the Grid tab include an mdx link. When you click this link, the Cell value MDX screen displays the MDX query statement that populates that cell in the grid.

6 CHAPTER 1
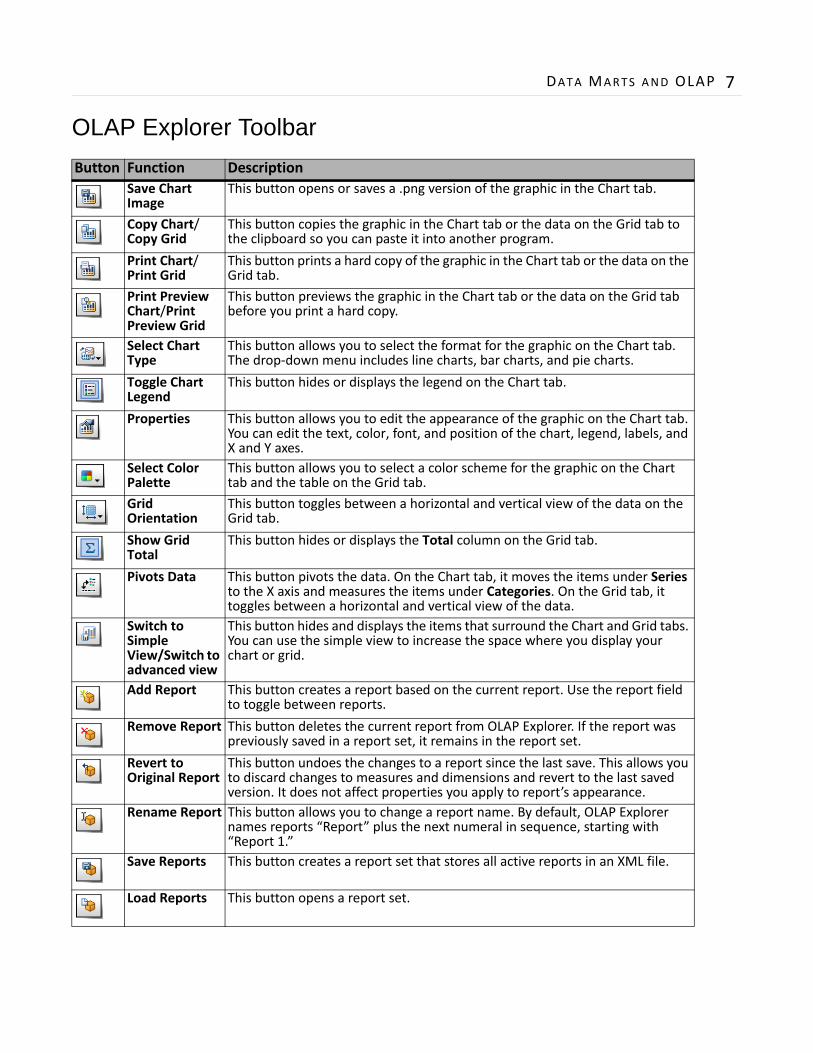
Toolbar. You use the toolbar to manage reports in OLAP Explorer, adjust the appearance, and save and print charts and grids, For information about the toolbar buttons, see “OLAP Explorer Toolbar” on page 7.
Selected Cube. In this field, select the OLAP cube to use in the report. To create an OLAP cube, you deploy a data mart with the Blackbaud Data Mart Deployment Wizard. For information about the deployment wizard, see the Installation Guide. After you select a cube, the measures and dimensions from the cube appear in OLAP Explorer, and you use these items to create your report.
Measures and Dimensions. The OLAP cube categorizes data into measures and dimensions. Measures are numeric values such as constituent count and revenue amount that you track in reports. Dimensions are variables such as date and location that are similar to the fields in the database. To create a report, you calculate the values of measures at the intersection of dimensions. Under Measures and Dimensions, the items appear for the cube you select. To create pivot tables and charts from the data in the cube, you drag and drop measures and dimensions to Slicer, Series, and Categorical. After you select your measures and dimensions, you can use the OLAP cube’s multidimensional view of the data to drill through the levels of data for top‐down analysis. On the Dimension tab of the Add database roles screen, you can filter the dimensions that appear under Measures and Dimensions. For information, see “Add Database Roles” on page 16.
Slicer. To filter the data in your chart and grid, drag and drop dimensions to Slicer and click the arrow beside the dimension. The Edit Slicer Axis Item screen appears. In the hierarchy, select the data to include in your report and click OK. For example, to include only married constituents in a report, drag and drop the Marital Status dimension from Measures and Dimensions to Slicer. On the Edit Slicer Axis Item screen, select “Married” and clear all other items in the hierarchy. The report now only includes data for married constituents.
Chart and Grid tabs. The Chart and Grid tabs display a chart and pivot table with the data you select in the OLAP Explorer. These reports calculate the measures and dimensions under Slicer, Series, and Categories.When you drag and drop items from Measures and Dimensions, the OLAP Explorer updates the chart and grid. To filter the data in the reports, you can manipulate the measures and dimension. To adjust the appearance of the reports, use the OLAP Explorer toolbar. For information about the toolbar buttons, see “OLAP Explorer Toolbar” on page 7.
Series. To calculate the numeric value of measures or dimensions in your report, drag and drop them to Series. The OLAP Explorer calculates the value of these items against any measures and dimensions under Categorical, and the Chart and Grid tabs display the report. The items under Categorical serve as an X axis in the chart, and the chart presents value of the items under Series when measured against the X axis. For example, to create a report to show how much you raised each year, select the Revenue Amount measure under Series and the Revenue Date dimension under Categorical. The chart displays the amount you raised for each year in the Revenue Date dimension.
Categorical. To select the measures or dimensions against which to compare the items under Series, drag and drop them to Categorical. The report calculates value of items under Series when measured against items under Categorical. For example, to create a report on how much money you raised in each State, select the Revenue Amount under Series and the Address dimension under Categorical. The States in the Address dimension appear along the X axis of the chart, and the report calculates the revenue amount raised for each State.
DATA MARTS AND OLAP 7
OLAP Explorer ToolbarButton Function Description
Save Chart Image
This button opens or saves a .png version of the graphic in the Chart tab.
Copy Chart/Copy Grid
This button copies the graphic in the Chart tab or the data on the Grid tab to the clipboard so you can paste it into another program.
Print Chart/Print Grid
This button prints a hard copy of the graphic in the Chart tab or the data on the Grid tab.
Print Preview Chart/Print Preview Grid
This button previews the graphic in the Chart tab or the data on the Grid tab before you print a hard copy.
Select Chart Type
This button allows you to select the format for the graphic on the Chart tab. The drop‐down menu includes line charts, bar charts, and pie charts.
Toggle Chart Legend
This button hides or displays the legend on the Chart tab.
Properties This button allows you to edit the appearance of the graphic on the Chart tab. You can edit the text, color, font, and position of the chart, legend, labels, and X and Y axes.
Select Color Palette
This button allows you to select a color scheme for the graphic on the Chart tab and the table on the Grid tab.
Grid Orientation
This button toggles between a horizontal and vertical view of the data on the Grid tab.
Show Grid Total
This button hides or displays the Total column on the Grid tab.
Pivots Data This button pivots the data. On the Chart tab, it moves the items under Series to the X axis and measures the items under Categories. On the Grid tab, it toggles between a horizontal and vertical view of the data.
Switch to Simple View/Switch to advanced view
This button hides and displays the items that surround the Chart and Grid tabs. You can use the simple view to increase the space where you display your chart or grid.
Add Report This button creates a report based on the current report. Use the report field to toggle between reports.
Remove Report This button deletes the current report from OLAP Explorer. If the report was previously saved in a report set, it remains in the report set.
Revert to Original Report
This button undoes the changes to a report since the last save. This allows you to discard changes to measures and dimensions and revert to the last saved version. It does not affect properties you apply to report’s appearance.
Rename Report This button allows you to change a report name. By default, OLAP Explorer names reports “Report” plus the next numeral in sequence, starting with “Report 1.”
Save Reports This button creates a report set that stores all active reports in an XML file.
Load Reports This button opens a report set.
8 CHAPTER 1
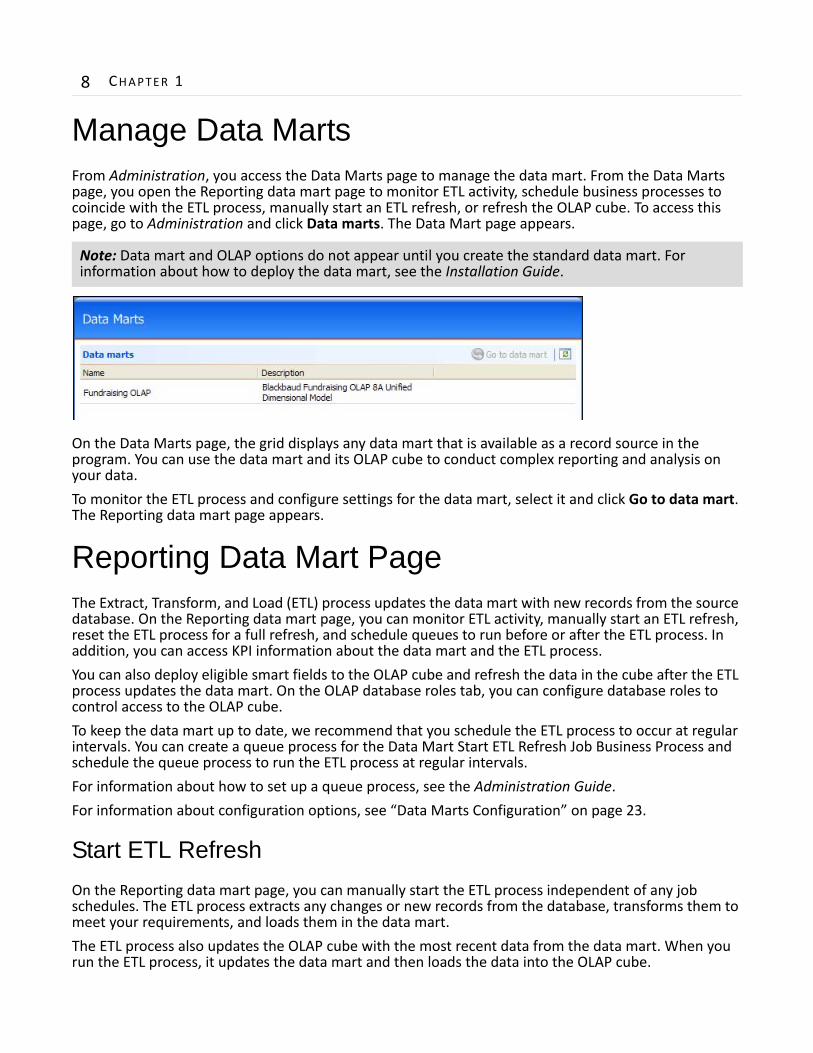
Manage Data MartsFrom Administration, you access the Data Marts page to manage the data mart. From the Data Marts page, you open the Reporting data mart page to monitor ETL activity, schedule business processes to coincide with the ETL process, manually start an ETL refresh, or refresh the OLAP cube. To access this page, go to Administration and click Data marts. The Data Mart page appears.
On the Data Marts page, the grid displays any data mart that is available as a record source in the program. You can use the data mart and its OLAP cube to conduct complex reporting and analysis on your data.
To monitor the ETL process and configure settings for the data mart, select it and click Go to data mart. The Reporting data mart page appears.
Reporting Data Mart PageThe Extract, Transform, and Load (ETL) process updates the data mart with new records from the source database. On the Reporting data mart page, you can monitor ETL activity, manually start an ETL refresh, reset the ETL process for a full refresh, and schedule queues to run before or after the ETL process. In addition, you can access KPI information about the data mart and the ETL process.
You can also deploy eligible smart fields to the OLAP cube and refresh the data in the cube after the ETL process updates the data mart. On the OLAP database roles tab, you can configure database roles to control access to the OLAP cube.
To keep the data mart up to date, we recommend that you schedule the ETL process to occur at regular intervals. You can create a queue process for the Data Mart Start ETL Refresh Job Business Process and schedule the queue process to run the ETL process at regular intervals.
For information about how to set up a queue process, see the Administration Guide.
For information about configuration options, see “Data Marts Configuration” on page 23.
Start ETL RefreshOn the Reporting data mart page, you can manually start the ETL process independent of any job schedules. The ETL process extracts any changes or new records from the database, transforms them to meet your requirements, and loads them in the data mart.
The ETL process also updates the OLAP cube with the most recent data from the data mart. When you run the ETL process, it updates the data mart and then loads the data into the OLAP cube.
Note: Data mart and OLAP options do not appear until you create the standard data mart. For information about how to deploy the data mart, see the Installation Guide.

DATA MARTS AND OLAP 9
Under Refresh data, click Start ETL refresh. The the ETL refresh status page appears, and the process updates the data mart with data that was added or modified in the source database since the last ETL refresh.
For more information about the ETL refresh, see “Refresh ETL Process” on page 11.
Reset ETLOn the Reporting data mart page, you can reset the incremental ETL refresh to prompt a full refresh during the next ETL process. Under Refresh data, click Reset ETL. On the confirmation message that appears, click Yes.
When you reset the incremental ETL refresh, the existing data in the data mart is deleted immediately. And during the next ETL process, the ETL refresh includes the entire source database, not just the data that was added or modified since the previous ETL refresh. This task is useful to remove dated information from the data mart.
The Reset ETL task does not effect the OLAP cube.
Manage KPIsOn the Reporting data mart page, you can manage the Key Performance Indicators for the ETL process. Under More information, click Manage KPIs. The KPI Instances page appears.
On this page, you can manage KPIs for the ETL process. You use KPIs to track your organization’s strategic performance, and the KPI instance for the ETL process defines what you want to accomplish.
For information about KPIs, see the Reports and KPIs Guide.

10 CHAPTER 1
Edit KPI DashboardOn the Reporting data mart page, you can view the KPI dashboard for the ETL process. Under More information, click KPI dashboard. The KPI dashboard page appears.
On this page, you can view Key Performance Indicator data for the ETL process. You use KPIs to track your organization’s strategic performance, and the KPI dashboard displays your progress toward the goals.
For information about the KPI dashboard, see the Reports and KPIs Guide.

DATA MARTS AND OLAP 11
Refresh ETL ProcessAfter you click Start ETL refresh Under Refresh data on the Reporting data mart page, the ETL refresh status page appears. The Start ETL refresh task manually starts the ETL process independent of any job schedules and updates the data mart with data that was added or modified in the source database since the previous ETL refresh. On the ETL refresh status page, you can view information about the ETL process as it runs.
The page displays the job name, current ETL status, whether the process was completed successfully, the date, and how long the process has run. Under Status log, a log appears for the ETL process. You can use this log to check the status and to troubleshoot if a problem occurs during the process.

12 CHAPTER 1
ETL History TabOn the ETL history tab, you can monitor ETL activity for the data mart.
This tab displays the name and description of the data mart, the SQL Server instance, the application database, any queues you schedule to run before or after the ETL process, and the Microsoft Windows user account used to create the data mart.
The SSIS ETL history grid includes each instance of the ETL process. The grid displays when each process occurred, whether it completed successfully, how long it lasted, the ETL Control ID, when the data window was open, and details about the SQL Server Integration Services used during the ETL process. To sort entries in the grid according to package name and type, click Filter.

DATA MARTS AND OLAP 13
SQL Agent Job TabOn the SQL agent job tab, you can view information about the most recent instance of the ETL process.
This tab displays the job name, the current ETL status, whether the most recent instance of the ETL process was completed successfully, when the process was run, and how long it lasted.
Under Status log, a log appears for the most recent instance of the ETL process. You can use this log to check the status or to troubleshoot if a problem occurs during the process.

14 CHAPTER 1
ETL Report TabOn the ETL report tab, you can view a report on the ETL activity.
This tab tracks the instances of the ETL process and displays how long each instance lasts. You can view this information in two formats. A graph chart provides a visual representation of how long each ETL processes lasts, while a standard report lists each instance in a spreadsheet and includes the ETL Control ID and the refresh type. You can use the Report toolbar to print or export the report.
For information about the Report toolbar, see the General Features Guide.

DATA MARTS AND OLAP 15
Job Schedules TabOn the Job schedules tab, you can view information about the job schedules you create to run the ETL process at regular intervals. However, this tab only displays job schedules you create through the SQL Server Configuration Manager. It does not include job schedules for queue processes that you create in Administration.
This tab displays the name of the job schedule, whether it has been enabled, how often it occurs, when it occurs, when it was added, and when it was last changed.
OLAP Database Roles TabOn the OLAP database roles tab, you can create database roles to control access to the information in the data mart’s OLAP cube. With these database roles, you can set permissions to limit the data that users can view and manipulate in the cube. This tab includes three default database roles appear, and you can create roles as necessary.
Note: We recommend that you create a job schedule in the program to keep your data mart up to date. To do this, create a queue process for the Data Mart Start ETL Refresh Job Business Process. After you create the queue process, create a job schedule on the queue process page to run the ETL process at regular intervals. For information about how to create the queue process, see the Administration Guide.
16 CHAPTER 1
When you create a database role, you can assign users to that role and set a variety of permissions for them. You can assign permissions for the database and for the individual cells in the OLAP cube, and you can assign rights to drill through the cube and to filter the data in the cube’s dimensions. The permissions you set for your database roles allow you to enforce security on the OLAP cube and control how users access the information in the database. After you add users to a database role, they can access the cube with the restrictions placed on their database role to conduct advanced reporting on the records in the data mart.
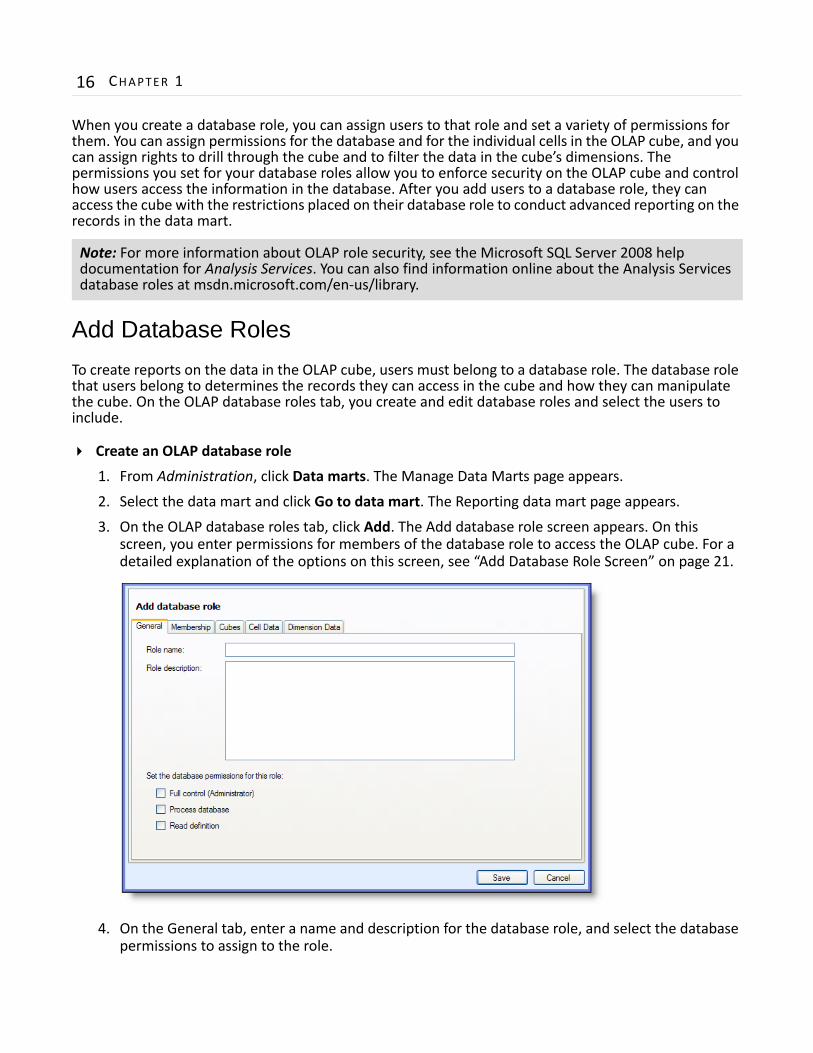
Add Database RolesTo create reports on the data in the OLAP cube, users must belong to a database role. The database role that users belong to determines the records they can access in the cube and how they can manipulate the cube. On the OLAP database roles tab, you create and edit database roles and select the users to include.
Create an OLAP database role
1. From Administration, click Data marts. The Manage Data Marts page appears.
2. Select the data mart and click Go to data mart. The Reporting data mart page appears.
3. On the OLAP database roles tab, click Add. The Add database role screen appears. On this screen, you enter permissions for members of the database role to access the OLAP cube. For a detailed explanation of the options on this screen, see “Add Database Role Screen” on page 21.
4. On the General tab, enter a name and description for the database role, and select the database permissions to assign to the role.
Note: For more information about OLAP role security, see the Microsoft SQL Server 2008 help documentation for Analysis Services. You can also find information online about the Analysis Services database roles at msdn.microsoft.com/en‐us/library.
DATA MARTS AND OLAP 17
• To grant full access and write permissions to change the objects in the data mart, select Full control (Administrator).
• To grant access to process database objects and to view metadata about the objects, select Process database. Users with this permission level cannot change dimensions and cubes or edit the data in them.
• To allow users to view metadata about database objects but to deny access to the data in the cube, select Read definition.
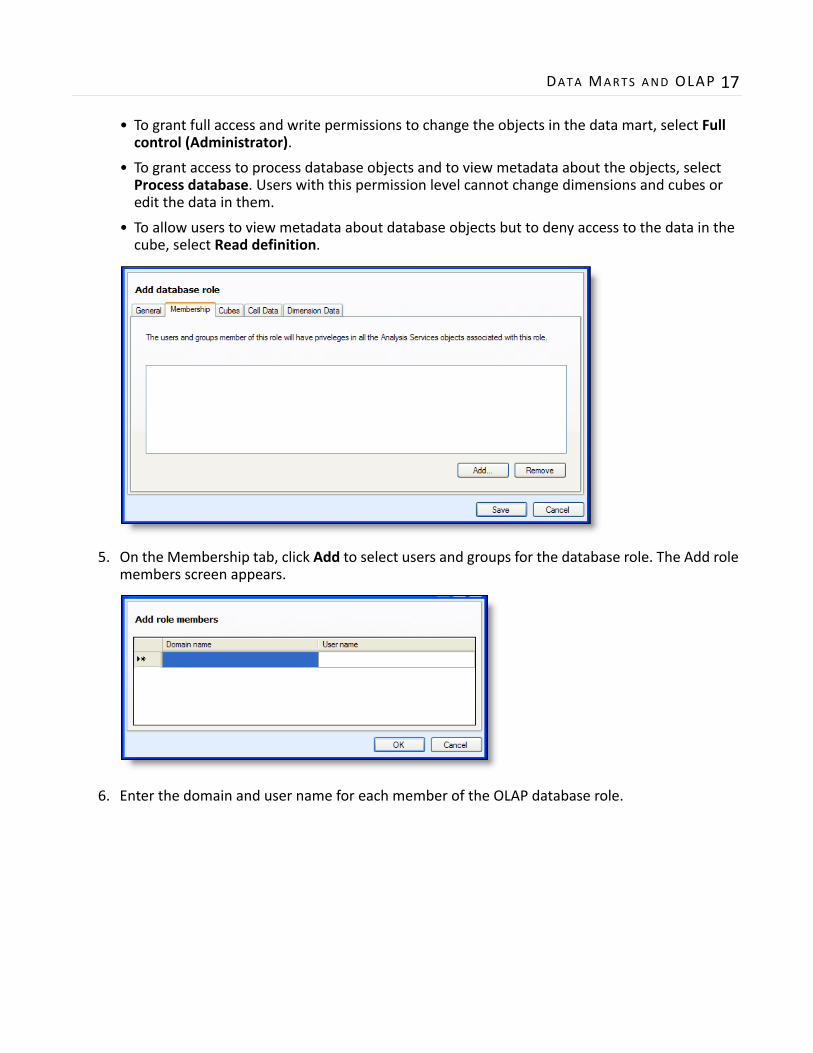
5. On the Membership tab, click Add to select users and groups for the database role. The Add role members screen appears.
6. Enter the domain and user name for each member of the OLAP database role.
18 CHAPTER 1
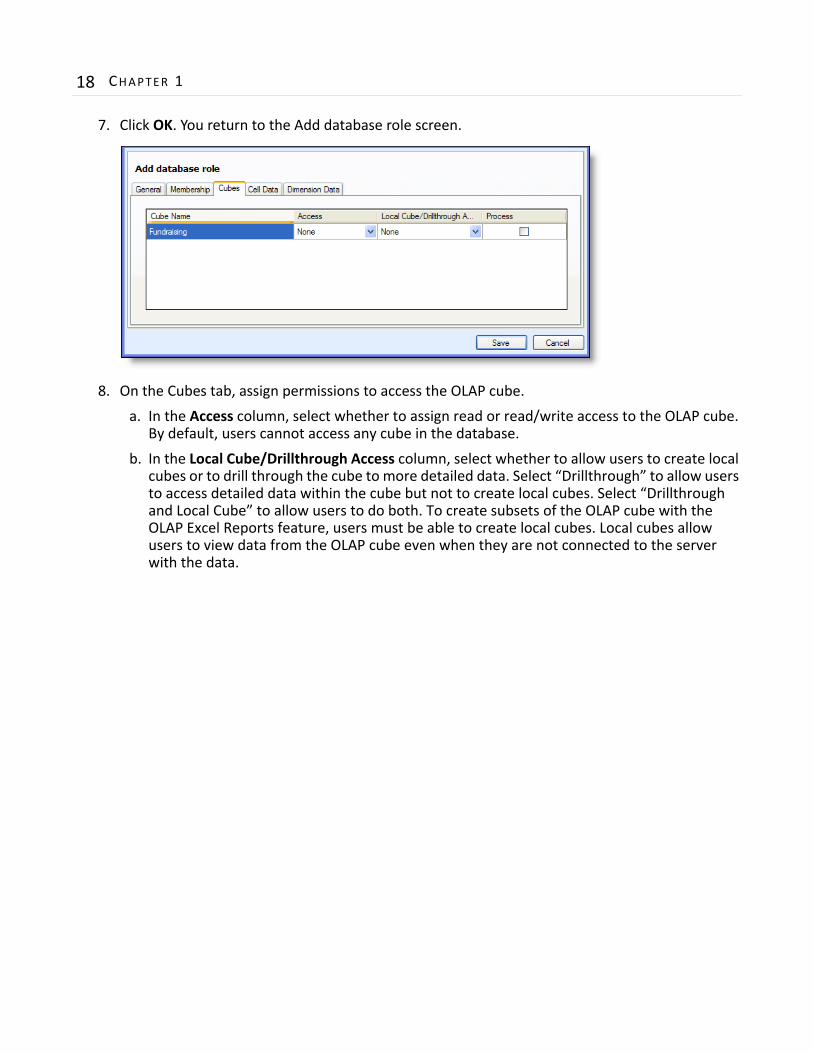
7. Click OK. You return to the Add database role screen.
8. On the Cubes tab, assign permissions to access the OLAP cube.
a. In the Access column, select whether to assign read or read/write access to the OLAP cube. By default, users cannot access any cube in the database.
b. In the Local Cube/Drillthrough Access column, select whether to allow users to create local cubes or to drill through the cube to more detailed data. Select “Drillthrough” to allow users to access detailed data within the cube but not to create local cubes. Select “Drillthrough and Local Cube” to allow users to do both. To create subsets of the OLAP cube with the OLAP Excel Reports feature, users must be able to create local cubes. Local cubes allow users to view data from the OLAP cube even when they are not connected to the server with the data.
DATA MARTS AND OLAP 19
c. In the Process column, select whether to allow users to manipulate data in the cube.
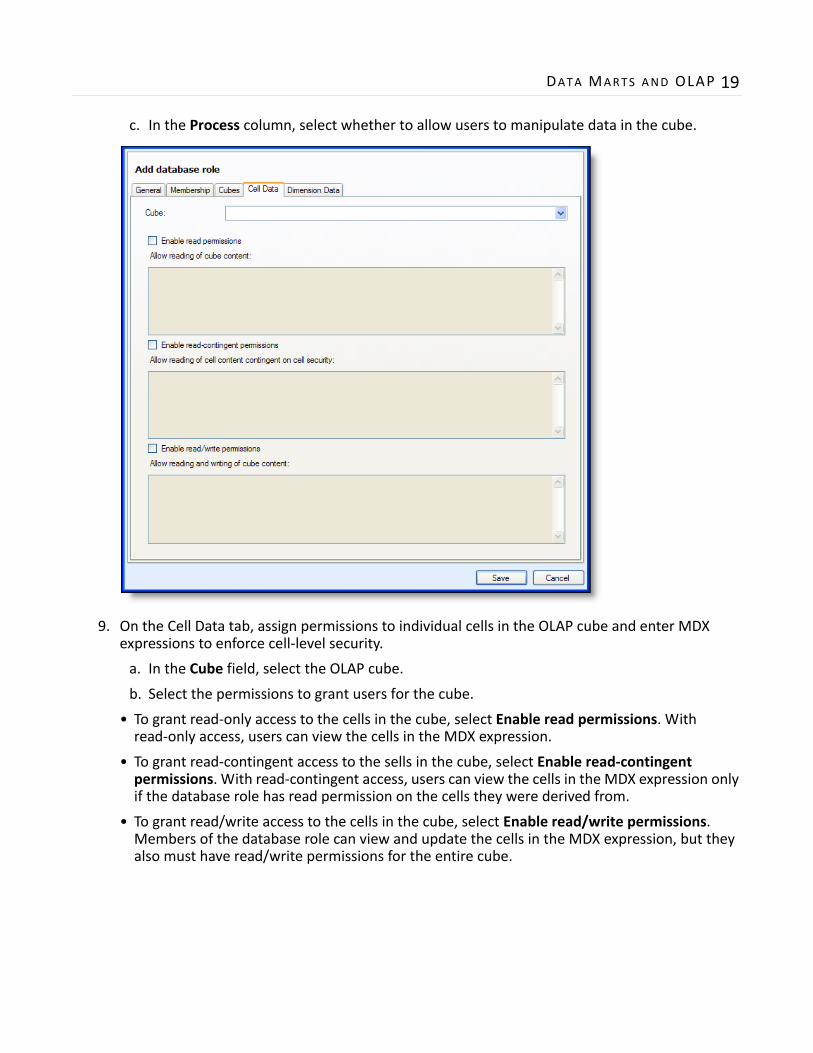
9. On the Cell Data tab, assign permissions to individual cells in the OLAP cube and enter MDX expressions to enforce cell‐level security.
a. In the Cube field, select the OLAP cube.
b. Select the permissions to grant users for the cube.
• To grant read‐only access to the cells in the cube, select Enable read permissions. With read‐only access, users can view the cells in the MDX expression.
• To grant read‐contingent access to the sells in the cube, select Enable read‐contingent permissions. With read‐contingent access, users can view the cells in the MDX expression only if the database role has read permission on the cells they were derived from.
• To grant read/write access to the cells in the cube, select Enable read/write permissions. Members of the database role can view and update the cells in the MDX expression, but they also must have read/write permissions for the entire cube.
20 CHAPTER 1
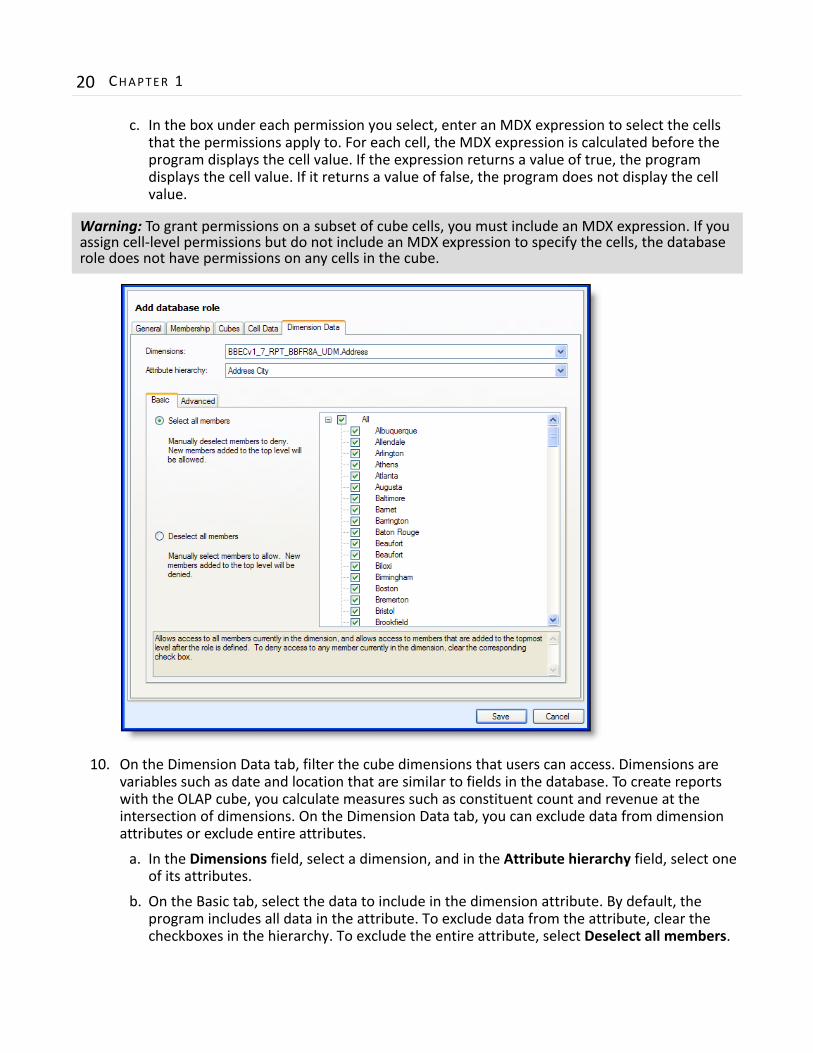
c. In the box under each permission you select, enter an MDX expression to select the cells that the permissions apply to. For each cell, the MDX expression is calculated before the program displays the cell value. If the expression returns a value of true, the program displays the cell value. If it returns a value of false, the program does not display the cell value.
10. On the Dimension Data tab, filter the cube dimensions that users can access. Dimensions are variables such as date and location that are similar to fields in the database. To create reports with the OLAP cube, you calculate measures such as constituent count and revenue at the intersection of dimensions. On the Dimension Data tab, you can exclude data from dimension attributes or exclude entire attributes.
a. In the Dimensions field, select a dimension, and in the Attribute hierarchy field, select one of its attributes.
b. On the Basic tab, select the data to include in the dimension attribute. By default, the program includes all data in the attribute. To exclude data from the attribute, clear the checkboxes in the hierarchy. To exclude the entire attribute, select Deselect all members.
Warning: To grant permissions on a subset of cube cells, you must include an MDX expression. If you assign cell‐level permissions but do not include an MDX expression to specify the cells, the database role does not have permissions on any cells in the cube.

DATA MARTS AND OLAP 21
c. The Advanced tab displays data about the data you filter in a dimension attribute. For Select all members on the Basic tab, any data you exclude appears under Denied member set. For Deselect all members, any data you include appears under Allowed member set. Any data that you cannot exclude from the attribute appears under Default member.
11. Click Save. You return to the OLAP database roles tab. The new database role appears in the grid.
Add Database Role ScreenThis table explains items on the screen that may require additional information.
Screen Item DescriptionSet the database permissions for this role
On the General tab, you can assign full control of the database to members of the database role, or you can place limits on their access. To grant full access and write permissions to change the objects in the data mart, select Full control (Administrator). To grant access to process database objects and to view metadata about the objects, select Process database. Users with this permission level cannot change dimensions and cubes or edit the data in them. To allow users to view metadata about database objects but to deny access to the data in the cube, select Read definition.
Membership tab Enter the domain and user name for each member of the OLAP database role.Cube Name Select a cube to grant access rights.Access Select whether to assign read access or read/write access to the OLAP cube. By
default, users cannot access any cube in the database.Local Cube/Drillthrough Access
Select whether to allow users to create local cubes or to drill through the cube to more detailed data. Select “Drillthrough” to allow users to access detailed data within the cube but not to create local cubes. Select “Drillthrough and Local Cube” to allow users to do both. To create subsets of the OLAP cube with the OLAP Excel Reports feature, users must be able to create local cubes. These local cubes allow users to view data from the OLAP cube even when they are not connected to the server with the data.
Process Select whether to allow users to manipulate the data in the cube.Cell Data tab Assign permissions to individual cells in the OLAP cube and enter MDX
expressions to enforce cell‐level security.To grant read‐only access to the cells in the cube, select Enable read permissions. With read‐only access, users can view the cells in the MDX expression. To grant read‐contingent access to the sells in the cube, select Enable read‐contingent permissions. With read‐contingent access, users can view the cells in the MDX expression only if the database role has read permission on the cells they were derived from. To grant read/write access to the cells in the cube, select Enable read/write permissions. Members of the database role can view and update the cells in the MDX expression, but they also must have read/write permissions for the entire cube.In the box under each permission you select, enter an MDX expression to select the cells that the permissions apply to. For each cell, the MDX expression is calculated before the program displays the cell value. If the expression returns a value of true, the program displays the cell value. If it returns a value of false, the program does not display the cell value.Warning: To grant permissions on a subset of cube cells, you must include an MDX expression. If you assign cell‐level permissions but do not include an MDX expression to specify the cells, the database role does not have permissions on any cells in the cube.
22 CHAPTER 1
Edit Database RolesAfter you create database roles to process the OLAP cube and add the users to the roles, you can edit the database roles as necessary.
Edit an OLAP database role
1. On the OLAP database roles tab of the Reporting data mart page, select a role under Analysis services OLAP database roles.
2. Click Edit. The Edit database role screen appears.
3. Make changes as necessary. The items on this screen are the same as on the Add database role screen. For a detailed explanation of the options, see “Add Database Role Screen” on page 21.
4. Click Save. You return to the OLAP database roles tab.
Delete Database RolesAfter you create a database role to process the OLAP cube, you can delete it as necessary. On the Reporting data mart page, select the role on the OLAP database roles tab and click Delete. On the confirmation message that appears, click Yes. You return to the OLAP database roles tab, and the role no longer appears in the grid.
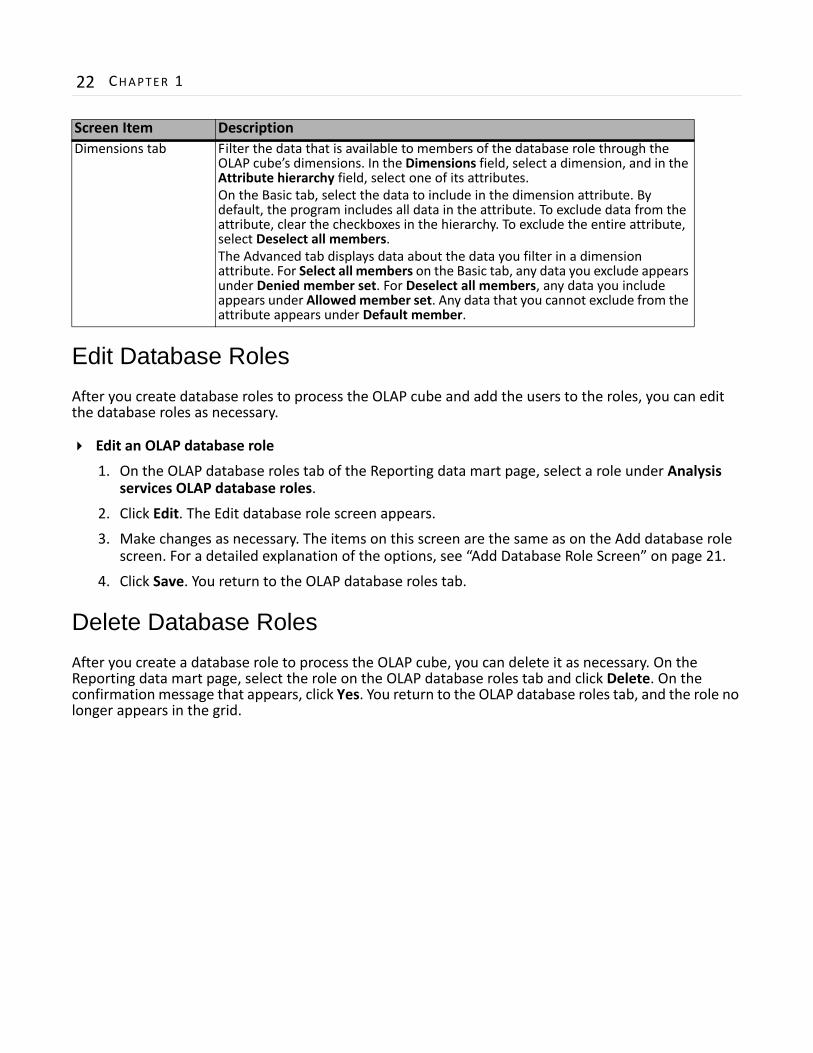
Dimensions tab Filter the data that is available to members of the database role through the OLAP cube’s dimensions. In the Dimensions field, select a dimension, and in the Attribute hierarchy field, select one of its attributes.On the Basic tab, select the data to include in the dimension attribute. By default, the program includes all data in the attribute. To exclude data from the attribute, clear the checkboxes in the hierarchy. To exclude the entire attribute, select Deselect all members.The Advanced tab displays data about the data you filter in a dimension attribute. For Select all members on the Basic tab, any data you exclude appears under Denied member set. For Deselect all members, any data you include appears under Allowed member set. Any data that you cannot exclude from the attribute appears under Default member.
Screen Item Description

2chapter
Data Marts Configuration
Select Eligible Smart Fields . . . . . . . . . . . . . . . . . . . . . . . . . . . . . . . . . . . . . . . . . . . . . . . . . . . . . . . . 23
Select Eligible Attribute Categories. . . . . . . . . . . . . . . . . . . . . . . . . . . . . . . . . . . . . . . . . . . . . . . . . . 24
Deploy Eligible Source Codes . . . . . . . . . . . . . . . . . . . . . . . . . . . . . . . . . . . . . . . . . . . . . . . . . . . . . . 25
Edit HTTP Data Source URL . . . . . . . . . . . . . . . . . . . . . . . . . . . . . . . . . . . . . . . . . . . . . . . . . . . . . . . . 25
Edit ETL Queues . . . . . . . . . . . . . . . . . . . . . . . . . . . . . . . . . . . . . . . . . . . . . . . . . . . . . . . . . . . . . . . . . 25
Before you manage your data mart and OLAP information, we recommend you set up configuration options. From the Reporting data mart page, you can access tasks required to configure these options under Configuration. To access the Reporting data mart page click Data marts in Administration, and on the Data Marts page, select a data mart and click Go to data mart.
Select Eligible Smart FieldsIn addition to the fields that the Data Mart Deployment Wizard includes in the data mart, you can also add eligible smart fields to the data mart. For smart fields to be eligible for the data mart, they must have a record type of constituent or revenue application and the data type must be Boolean or anything with value groups. After you set up eligible smart fields to perform calculations on the records that are the source of the data mart, you can manually add them to the data mart.
2

24 CHAPTER 2
On the Reporting data mart page, click Select eligible smart fields under Configuration. The OLAP smart field selection screen appears.
To load eligible smart fields, select them in the grid on the left and click the arrow to add them to the grid on the right.
Select Eligible Attribute CategoriesIn addition to the fields that the Data Mart Deployment Wizard includes in the data mart, you can also add eligible attribute categories to the data mart. For attribute categories to be eligible for the data mart, they must have a record type of constituent, revenue, educational history, event, registrant, designation, interaction, or modeling and propensity. In addition, the data type for the attribute categories must be code table or yes/no. After you set up eligible attribute categories, you can manually add them to the data mart.
On the Reporting data mart page, click Select eligible attribute categories under Configuration. The OLAP attribute category selection screen appears.
To load eligible attribute categories, select them in the grid on the left and click the arrow to add them to the grid on the right.

DATA MARTS CONF IGURAT ION 25
Deploy Eligible Source CodesWhen the Data Mart Deployment Wizard creates the data mart, it copies data from records in the source. You can also add eligible source codes to the data mart. You add source codes to advertisements or promotions to identify the associated lists, offers, packages, and segments. After you add the source codes to any gifts or other responses you receive, you can use them for analysis purposes.
For more information about source codes, see the Marketing and Communications Guide.
After you associate source codes with the fields from the data mart’s source, you can manually add the source codes to the data mart. On the Reporting data mart page, click Deploy eligible source codes under Configuration. A confirmation message appears. To load the source codes into the data mart, click Yes.
Edit HTTP Data Source URLOn the Reporting data mart page, you can enter a URL to connect to the OLAP cube over HTTP. This allows your local OLAP client to connect to a remote OLAP server. Under Configuration, click Edit HTTP data source url. In the Url field, enter the address to connect to Analysis Services. Click Save. You return to the Reporting data mart page.
With this URL, an OLAP client such as Microsoft Excel can access OLAP data over the Internet. This is useful to run a local copy of Excel against a remote OLAP server. You can configure the web server to proxy the MDX commands from Excel or any other OLAP client, and the OLAP Excel Reports feature will use the URL you supply in the connection string in place of the OLAP server name.
Edit ETL QueuesIf you have business processes that should occur immediately before or after the ETL process, you can create queues for the business process and schedule them to occur each time the ETL process runs. For example, since the ETL process adds data to the data mart, you can run a queue that includes the Smart Field Process after the ETL process to ensure that the smart fields are up to date.
For information about how to set up a queue process, see the Administration Guide.
Attach queues to run before or after the ETL process
1. From Administration, click Data marts. The Data Marts page appears.
2. Select the data mart and click Go to data mart. The Reporting data mart page appears.

26 CHAPTER 2
3. Under Configuration, click Edit ETL queues.
4. In the Pre‐ETL queue field, enter the queue to run before the ETL process. To search for a queue, click the binoculars.
5. In the Post‐ETL 1ueue field, enter the queue to run after the ETL process. To search for a queue, click the binoculars.
6. Click Save. You return to the Reporting data mart page.
ETLdata mart queues 25
Ddata mart 1
add OLAP database roles 16data marts page 8deploy source codes 25ETL history 12ETL job schedules tab 15ETL queues 25ETL report 14ETL SQL agent job 13HTTP data source URL 25manage 8OLAP database roles 15OLAP Excel reports 3OLAP explorer 5OLAP system statistics 2reporting data mart page 8reset ETL process 9start ETL refresh process 8
EETL
history tab 12job schedules 15OLAP database roles tab 15report 14reset 9SQL agent job tab 13start refresh process 8
Excel OLAP reports 3
OOLAP 1
add database roles 16database roles 15deploy source codes 25Excel reports 3Excel templates 3explorer 5
explorer toolbar 7HTTP data source URL 25system statistics 2
Index

28