BLACK SEA MODEL SYSTEM
16
BLACK SEA MODEL SYSTEM Barış Salihoğlu, Heather Cannaby, Sinan Arkın, Bettina A. Fach, Temel Oğuz, Ekin Akoğlu Institute of Marine Sciences, Middle East Technical University, Turkey
Transcript of BLACK SEA MODEL SYSTEM

BLACK SEA MODEL SYSTEM
Barış Salihoğlu,
Heather Cannaby, Sinan Arkın, Bettina A. Fach, Temel Oğuz, Ekin Akoğlu
Institute of Marine Sciences, Middle East Technical University, Turkey
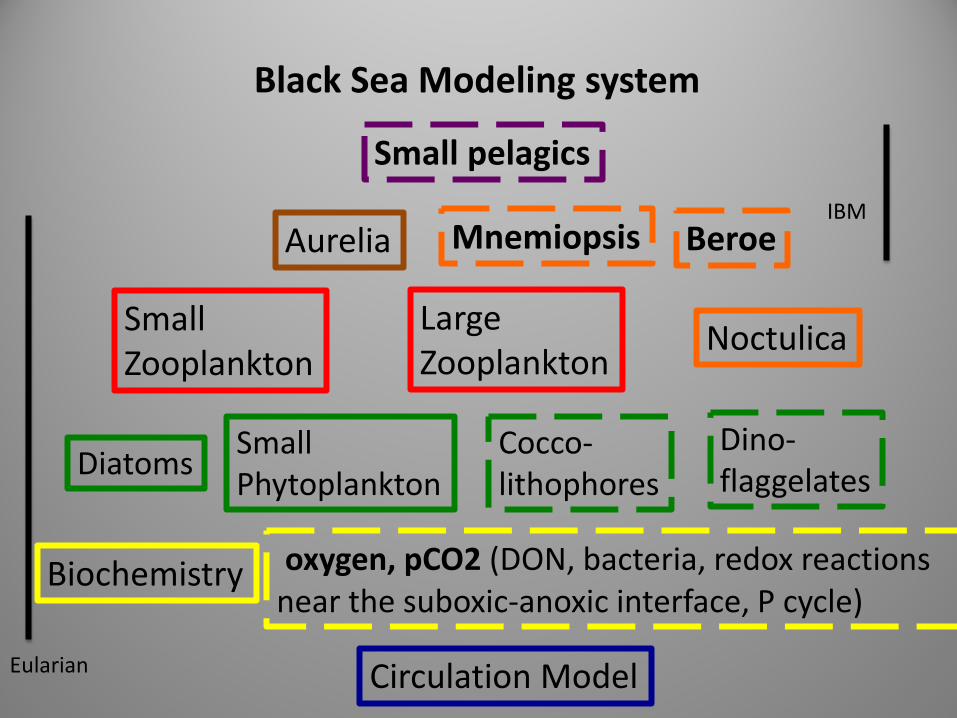
Circulation Model
Biochemistry
Diatoms Small Phytoplankton
Cocco- lithophores
Dino- flaggelates
oxygen, pCO2 (DON, bacteria, redox reactions near the suboxic-anoxic interface, P cycle)
Large Zooplankton
Small Zooplankton
Small pelagics
Mnemiopsis
Black Sea Modeling system
IBM
Eularian
Aurelia
Noctulica
Beroe

28 30 32 34 36 38 40
42
44
46
-2200
-2000
-1800
-1600
-1400
-1200
-1000
-800
-600
-400
-200
-100
-50
0
Technical details of physical model Princeton Ocean Model (pom2k)
• Horizontal grid ~ 5km regular array
• Vertical grid: 26 sigma levels, compressed towards upper 200 m
• Initialisation: Spun up from climatology using atmospheric climatological forcing
• Boundaries • No open boundaries
- Climatic river input (9 in total) - Straits discharges (Bosporus/Kerch)
• Assimıiation of CTD data: - Optimal Interpolation of temperature and salinity deviations from climatic mean onto model grid at monthly time scales (performed prevıously (1971-1992)
Black Sea model domain
27 29 31 33 35 37 39 41
41
42
43
44
45
46
47
Kodori
RioniKizil-Irmak
Strait of Bosporus
Strait of Kerch
Inguri
Eshil-IrmakSakarja
Dnieper
Dniestr
Danube
Rivers and straits included in model

Processes • Feeding: functional response • Growth: bioenergetics • Mortality: predation, starvation • Horizontal movement:
- Directed (annual migration patterns) - Random movement - Advection by currents
Anchovy IBM

Migration model (?)
Advection by currents
+ Random movement
+ Directed movements
Directed movement: • Overwintering migration (north to south):
• T < 15C on north-western shelf • T < 10C off Kerch Strait
• Return migration (south to north) • T > 13-14C
Combination of modeling movement and hard wired movement

The E2E Black Sea model EwEinFORTRAN HTL module
BIMS-ECO LTL module

28 30 32 34 36 38 40
42
44
46
-2200
-2000
-1800
-1600
-1400
-1200
-1000
-800
-600
-400
-200
-100
-50
0
Technical details of physical model Princeton Ocean Model (pom2k)
• Horizontal grid ~ 5km regular array
• Vertical grid: 26 sigma levels, compressed towards upper 200 m
• Initialisation: Spun up from climatology using atmospheric climatological forcing
• Boundaries • No open boundaries
- Climatic river input (9 in total) - Straits discharges (Bosporus/Kerch)
• Assimıiation of CTD data: - Optimal Interpolation of temperature and salinity deviations from climatic mean onto model grid at monthly time scales (performed prevıously (1971-1992)
Black Sea model domain
27 29 31 33 35 37 39 41
41
42
43
44
45
46
47
Kodori
RioniKizil-Irmak
Strait of Bosporus
Strait of Kerch
Inguri
Eshil-IrmakSakarja
Dnieper
Dniestr
Danube
Rivers and straits included in model
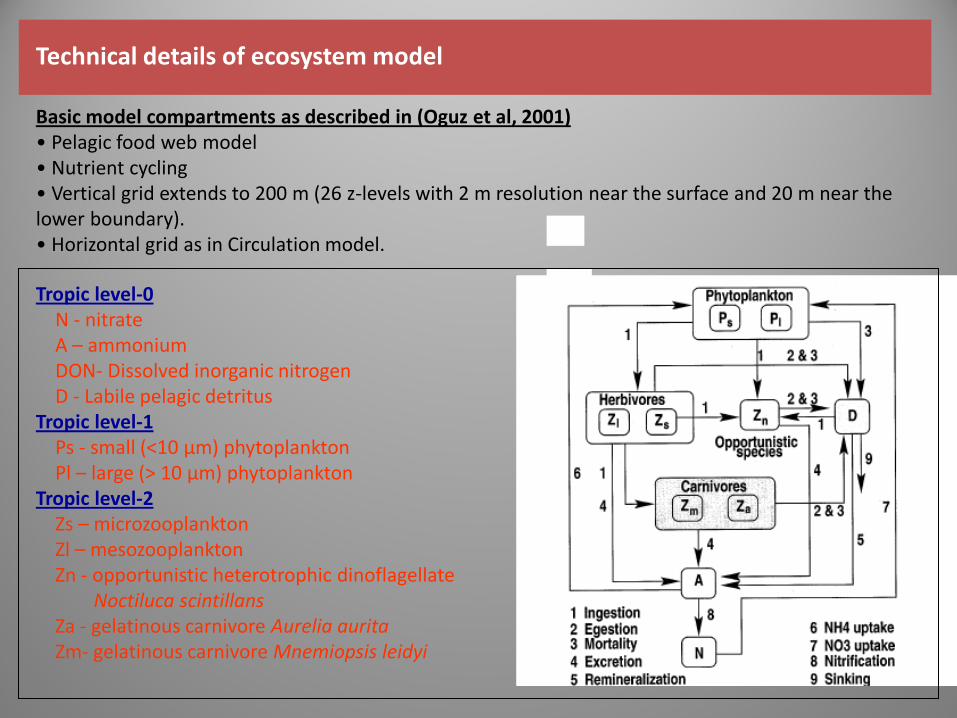
Technical details of ecosystem model
Basic model compartments as described in (Oguz et al, 2001) • Pelagic food web model • Nutrient cycling • Vertical grid extends to 200 m (26 z-levels with 2 m resolution near the surface and 20 m near the lower boundary). • Horizontal grid as in Circulation model.
Tropic level-0 N - nitrate A – ammonium DON- Dissolved inorganic nitrogen D - Labile pelagic detritus Tropic level-1 Ps - small (<10 μm) phytoplankton Pl – large (> 10 μm) phytoplankton Tropic level-2 Zs – microzooplankton Zl – mesozooplankton Zn - opportunistic heterotrophic dinoflagellate Noctiluca scintillans Za - gelatinous carnivore Aurelia aurita Zm- gelatinous carnivore Mnemiopsis leidyi

A more sophisticated version of the model (Oguz et al., 2000, 2001a) includes: • DON, • bacteria, • oxygen as well as oxidation-reduction reactions near the suboxic-anoxic interface An extension of the previous model formulation (Oguz and Merico, 2006) includes four phytoplankton groups: diatoms, dinoflagellates, small phytoplankton coccolithophores) and the additional phosphorus cycle .
Extended ecosystem model formulation

Schematic diagram of biochemical processes included in the model
Extended ecosystem model formulation

Model validation
Within MEECE a comprehensive model validation has been performed assessing: • Model accuracy • General circulation structure • Vertical water column structure • Seasonal and ınterannual variability Data used for model validation: • Gridded and discrete CTD data • Satellite SST data • SeaWifs Chlorophyll-a data

Comparison of modelled SSTs to CTD and satellite data

Well resolved circulation structure (LEFT: Winter-mean circulation (1999) in the upper 30 m
0.3 m s-1
Example of model output (physics)
Well resolved CIL (RIGHT)
Temperature 43 N Temperature (1996-2000)

ple of model output (Nitrate concentration)
Nitrate concentration in the upper 200 m layer of the Black Sea (1996-2000)
Jul 96 Jul 00
1 6.5 (mmol N m-3)

Example of model output (phytoplankton)
Summer mean (Apr-Sep) phytoplankton distribution in the upper 30 m
1999 2000
0.1 μg m-2 6 μg m-2 0.1 μg m-2 6 μg m-2
1999 2000
Summer mean (Apr-Sep) phytoplankton distribution at 42.5N
0.1 μg m-3 1 μg m-3 0.1 μg m-3 1 μg m-3

References
Oguz, T., Malanotte-Rizzoli, P. Ducklow, H. W. (2001) Simulations of phytoplankton seasonal cycle with multi-level and multi-layer physical-ecosystem models: The Black Sea example ". Ecological Modelling, 144, 295-314.
Oguz, T., Fach, B.A., Salihoglu B. (2008). Invasion dynamics of alien ctenophore Mnemiopsis leidyi into the Black Sea and its impact on the anchovy collapse. Journal of Plankton Research, 30 No. 12, doi:10.1093/plankt/fbn094.
Oguz, T., Salihoglu B, Fach, B.A. (2008). A coupled plankton-anchovy population dynamics model assessing nonlinear controls of anchovy stock and anchovy-gelatinous regime shift in the Black Sea. Marine Ecology Progress Series, 369: 229-256, doi:10335/meps07540.