Bitcoin and the Kimchi premium - cafr-sif.com. Bitcoin and the Kimchi premium.pdf · regarding the...
18
Bitcoin and the Kimchi premium Abstract Between 2013 and 2018 Bitcoin were in Korea on average 3.2% more expensive than in the United States, a fact commonly referred to as the Kimchi premium. We argue that fric- tions within the microstructure of the bitcoin network as well as capital controls imposed by the Korean government limit the ability of arbitrageurs to take advantage of persistent price differences. We find that the Bitcoin premia are positively related confirmation times in the blockchain and to bitcoin volatility in line with the idea that the delay and the as- sociated price risk during the transaction period make trades less attractive for risk averse arbitrageurs and hence allow prices to diverge. A cross country comparison shows that bitcoin tend to trade at higher prices in countries with lower financial freedom. Keywords: Bitcoin, Limits to Arbitrage, Crypto-Currencies, Fintech Extended Abstract: preliminary and incomplete
Transcript of Bitcoin and the Kimchi premium - cafr-sif.com. Bitcoin and the Kimchi premium.pdf · regarding the...
Bitcoin and the Kimchi premium
Abstract
Between 2013 and 2018 Bitcoin were in Korea on average 3.2% more expensive than inthe United States, a fact commonly referred to as the Kimchi premium. We argue that fric-tions within the microstructure of the bitcoin network as well as capital controls imposedby the Korean government limit the ability of arbitrageurs to take advantage of persistentprice differences. We find that the Bitcoin premia are positively related confirmation timesin the blockchain and to bitcoin volatility in line with the idea that the delay and the as-sociated price risk during the transaction period make trades less attractive for risk aversearbitrageurs and hence allow prices to diverge. A cross country comparison shows thatbitcoin tend to trade at higher prices in countries with lower financial freedom.
Keywords: Bitcoin, Limits to Arbitrage, Crypto-Currencies, Fintech
Extended Abstract: preliminary and incomplete
1 Introduction
In Korea Bitcoin frequently trade at a higher price than in other markets, a phenomenon referred
to as the Kimchi premium. Between September 2013 and February 2018 the average Kimchi
premium was 3.2% but it reached levels as high as 54.48%. Figure 1 shows a time series plot
as well as a histogram of the Kimchi premium in this time period. In friction-less financial
markets such a price difference could not persist as it would be immediately arbitraged away.
Traders could buy bitcoin in another market, say the US, then transfer them to a Korean Bitcoin
exchange, sell them for Korean Won, and convert the Won to US-dollars for an instant profit.
However, institutional frictions prevent arbitrageurs to keep bitcoin prices in Korea aligned
with the rest of the world. In this paper we analyze two main frictions that can contribute to
a potential misalignment of Bitcoin prices across major markets: capital controls and frictions
emanating from the microstructure of the bitcoin network
An arbitrageur faces two main sources of risk when executing the trade described above.
First, the transfer of bitcoin from a foreign exchange to a Korean exchange takes time during
which the price of bitcoin can change dramatically. Since bitcoin can usually not be shorted the
premium cannot be locked in; bitcoin at a Korean exchange can only be sold once the transfer is
complete. Because bitcoin can be much more volatile than many transitional assets, price risk
(even for the short time of the transfer) can pose a significant deterrent for arbitrageurs. Second,
time varying transaction costs can erode potential arbitrage profits. Demand for transactions
fluctuates over the day and over time. As fees to be included increase, profits from arbitrage
decrease allowing the price difference between bitcoin in Korea and the rest of the world to
increase.
Korean capital controls limit the amount of money that can be sent abroad or at least com-
plicate the transfer of funds and thus create a friction for one part of the arbitrage trade. in
the aftermath of the global financial crisis and the European sovereign debt crisis Korea intro-
duced capital controls that create administrative burden and additional time delay when sending
money abroad as it is needed to complete the arbitrage trade. Even government regulations
1

regarding the interpretation of capital controls and the legal status of bitcoin vary over time.
Preliminary results indicate that the Kimchi premium is significantly positively related to
bitcoin volatility, supporting our idea that price risk for traders limits arbitrage activity. The
Kimchi premium is also positively related to the median confirmation time in the block chain,
supporting the idea that longer transaction times create more uncertainty for arbitrageurs allow-
ing prices to diverge. In ongoing research we are collecting data on transaction fees and news
events, and are refining our measures of bitcoin volatility to use them as explanatory factors for
the Kimchi premium. We will also examine other crypto-currencies to see if a Kimchi premium
exists as well and how it is correlated with the Bitcoin Kimchi premium.
While our paper primarily focuses on Korea, divergent bitcoin prices also exist in other
countries. Figure 2 plots the median bitcoin premium from March 2017 to the end of February
2018 as a function of financial freedom for a selected list of countries. To obtain the premia we
use bitcoin transaction prices from bitcoincharts.com, foreign exchange data from the Federal
Reserve Bank of St. Louis (where available) and OANDA otherwise. To measure financial
freedom we average the to index components ’Investment freedom’ and ’Financial Freedom’ as
published on a country level by the Heritage Foundation. As a stylized fact we observe higher
premia in financially more restrictive countries which is consistent with our view that financial
restrictions in Korea are one contributing factor to the Kimchi premium.
Our work is related to a broad literature of limits of arbitrage.1 There are various constraints
and limitations known in the literature to impede arbitrage trading. Among such constraints2,
the following four factors are the most relevant to the bitcoin price difference: (i) risk (or the
price volatility in our case), (ii) the international trading frictions, (iii) short-sale constraints,
and (iv) opportunity cost (holding costs). For the first and the second factors, we find that
the Kimchi premium has a significant positive relation with the bitcoin price volatility and the
capital control index, as mentioned before.3
1See for example Gromb and Vayanos (2010) for a survey on limits arbitrage.2The constraints include information asymmetry, short-sale constraints, leverage margin constraints, constraints
on equity capital and so on.3See, e.g., Edwards (1999) on the capital control
2

Figure 1. The Bitcoin Kimchi Premium: Bitcoins frequently trade at a higher price in Korea thanin other markets. The premium for purchasing bitcoins with Korean Won (KRW) versus US Dollars(USD) is calculated: (KRWBTCprice in USD)/(USDBTCprice) − 1, where the bitcoin price in USD is themean price of all USD transactions on the Bitstamp exchange for that day. The bitcoin price in KRW issimilarly defined from the Korbit exchange. Conversion from KRW to USD is done using the OANDAdaily average rate.
a) The kimchi premium over time (top panel)
b) Distribution of the kimchi premium (bottom panel)
3
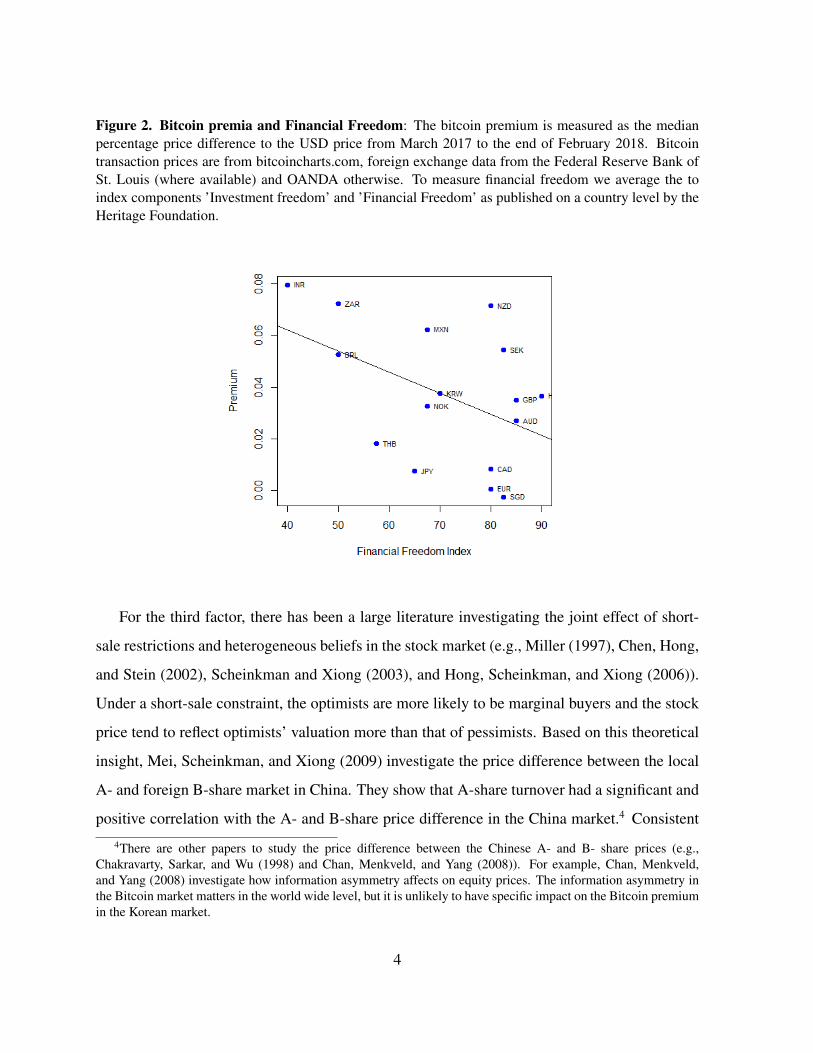
Figure 2. Bitcoin premia and Financial Freedom: The bitcoin premium is measured as the medianpercentage price difference to the USD price from March 2017 to the end of February 2018. Bitcointransaction prices are from bitcoincharts.com, foreign exchange data from the Federal Reserve Bank ofSt. Louis (where available) and OANDA otherwise. To measure financial freedom we average the toindex components ’Investment freedom’ and ’Financial Freedom’ as published on a country level by theHeritage Foundation.
For the third factor, there has been a large literature investigating the joint effect of short-
sale restrictions and heterogeneous beliefs in the stock market (e.g., Miller (1997), Chen, Hong,
and Stein (2002), Scheinkman and Xiong (2003), and Hong, Scheinkman, and Xiong (2006)).
Under a short-sale constraint, the optimists are more likely to be marginal buyers and the stock
price tend to reflect optimists’ valuation more than that of pessimists. Based on this theoretical
insight, Mei, Scheinkman, and Xiong (2009) investigate the price difference between the local
A- and foreign B-share market in China. They show that A-share turnover had a significant and
positive correlation with the A- and B-share price difference in the China market.4 Consistent
4There are other papers to study the price difference between the Chinese A- and B- share prices (e.g.,Chakravarty, Sarkar, and Wu (1998) and Chan, Menkveld, and Yang (2008)). For example, Chan, Menkveld,and Yang (2008) investigate how information asymmetry affects on equity prices. The information asymmetry inthe Bitcoin market matters in the world wide level, but it is unlikely to have specific impact on the Bitcoin premiumin the Korean market.
4

with this stream of research we also find a positive relationship between the Kimchi premium
and the bitcoin trading volume in Korean exchanges.
Finally, the literature on the cross-listed stock price difference shows that the price devia-
tions are positively related to holding costs that impede arbitrage (see, e.g., Pontiff (2006) and
Gagnon and Karolyi (2010)). There are several proxies for holding costs such as idiosyncratic
risk, stock’s dividend yield, and the interest rate. We will explore this angle in future versions
of the paper.
2 Institutional background
2.1 Bitcoin microstructure
The microstructure of bitcoin markets stands out in many ways from traditional markets. Bit-
coin like many crypto-currencies are free of regulation that applies to many traditional monetary
instruments and securities in financial markets. Therefore it is easy to move payments across
borders that constitute soft or hard barriers to flows of capital in traditional markets. Overcom-
ing capital control barriers creates a demand for bitcoin as individuals can circumvent govern-
ment restrictions without much effort. This extra transnational value of Bitcoin can generate
high demand in countries with capital controls such as Korea that can lead to prices above the
world market price if not arbitraged away.
Bitcoin is very popular in Korea. As of February 1st, 2018, there are 16 cryptocurrency
exchanges in South Korea. The five largest exchanges, in terms of trading volumes, are Upbit
(#1), Bithumb (#7), Coinone (#14), Korbit (#18), and Coinnest (#21).5 Korbit was the first
Korean bitcoin exchange that opened in April, 2013. Then, Bithumb (January, 2014), Coinone
(August 2014), Coinnest (July 2017) and Upbit (October, 2017) followed. Until Upbit started
5The number inside the parenthesis is the world ranking in trading volumes (all the cryptocurrencies) by Coin-hills on February 1st, 2018 (see https://www.coinhills.com/market/exchange/)
5

an exclusive partnership with Bittrex (a major U.S. based exchange) on October 2017, Bithumb,
Coinone, and Korbit had been the three major exchanges.6
Two frictions within the Bitcoin system can limit arbitrage activity. Transferring Bitcoin
from one wallet to another requires a short period of time. Many exchanges require a certain
number of confirmations to credit the Bitcoin to an account. A transaction with n confirmations
means that this transaction has been included in a mined block and that there have been n − 1
subsequent blocks mined in the blockchain. Time delay arises from the time it takes for a
transaction to be included in a mined block and from the time it takes to mine the required
number of subsequent blocks. The time to be included in a block can vary substantially. The
average confirmation time reached 11,453 minutes (7.9 days) on January 22, 2018 and in the
period of Feb 14 2017 to Feb 14 2018 the average confirmation time was above 2 hours 31% of
the time.7 The average time between successfully mined blocks is 10 minutes.
When trading on bitcoin exchanges another layer of delay arises. Most exchanges offer
clients accounts similar to an account with a traditional stock broker. Trades are usually only
possible between account holders at the same exchange and a trade is just recorded in the ledger
of the exchange, not on the blockchain. The bitcoins transferred from the seller to the buyer are
held in the name of the exchange on the blockchain before and after the trade; the exchange just
records a change of ownership in its internal records. Account holders can request a transfer to
a private walled out of the exchange account which will trigger a ledger entry on the blockchain.
While there is no data available on processing times by exchanges, anecdotal evidence on sev-
eral bitcoin forums shows that processing times can be substantial with traders waiting up to
several days before exchanges transfer bitcoins from their exchange-account to a private wal-
let from which a transfer (to another exchange) can be initiated. In particular, 5-10 hours of
processing time from a U.S. exchange to a Korean exchange is commonly reported by a major
mass media in Korea. For example, Chosun Ilbo, a Korean newspaper, tested the arbitrage and
reported a processing time of 9 hours from Coinbase to Bithum on December 26, 2017 when
6Among the top three, Korbit is the only one who provides a history of all the trades in unix-time7source: https://blockchain.info/
6

the Kimchi premium was about 28%.8
Transaction fees are endogenously determined in the bitcoin network. When posting a trans-
action to the pool the originator can set a fee that he or she is willing to pay to the miner for the
transaction to be included in the block. Miners can select transactions from the pool and keep
the fee upon successfully mining a block. Transactions with higher fee have a higher probability
to be included in a block. An arbitrageur thus faces a tradeoff between offering a high fee that
will get the transaction processed faster and mitigate price risk and the cost of the higher fee
which will directly reduce the arbitrageur’s profit.
2.2 Capital Controls
On June 13 2010, in the aftermath of the global financial crisis and the European Sovereign
debt crisis, Korea introduced capital controls that were revised several times since. The Ko-
rean foreign exchange transaction law has been very restrictive. According to the most recent
law revision (valid since July 18th, 2017)9, an individual can send money up to 3,000 USD
per transfer and 20,000 USD between January 1st and December 31st through a financial in-
stitution. The total maximum is limited to 50,000 USD a year through different institutions.10
There are several alternative ways to send cash abroad. First, one can use a Korean credit card
when buying Bitcoin at an exchange in the U.S.. However, the maximum amount of purchases
outside of Korea is limited to 10,000 USD per year. In addition, this transaction is considered
as commodity purchase, which means the buyer should pay customs on buying Bitcoin. One
can send US dollars to someone (e.g., relatives or friends in the U.S.) who can help arbitrage
trading through Paypal. In this case, however, Paypal automatically reports this transaction to
8Chosun Ilbo (Daily Chosun) is the # 1 news paper company in South Korea in terms of the total number ofdaily printing. See the following news article by the Chosun Ilbo on January 4: http://news.chosun.com/site/data/html_dir/2018/01/04/2018010400441.html.
9See the government website on small foreign remitment: http://www.mosf.go.kr/nw/nes/detailNesDtaView.do?searchBbsId1=&searchNttId1=MOSF_000000000009556&menuNo=4010100.
10There are some exceptions. For example, the maximum per year is up to 100,000 USD for educational reasonssuch as tuition with proper evidence.
7

the US Internal Revenue Service (IRS) and the IRS normally considers this money inflow to the
receiver as taxable income if the transfer amount is sufficiently large or the transfers occur on
a regular basis. In addition, many Korean lawyers11 say that in the current South Korean law
it is not very clear if transferring Bitcoins between a Korean exchange and exchanges in other
countries is considered as capital in- and out-flow or commodity export/import. This legal in-
terpretation issue might pose an additional risk since the government might investigate transfer
activities ex-post and accuse market participants of violation of the law depending on how they
interpret the law.
3 Data Sources and Model Variables
We describe the data sources and the variables used for our OLS regression analysis. A sum-
mary of the variables can be found in Table 1. Our primary variable of interest is the kimchi
premium (KRW Bitcoin premium over USD). We also look at the EUR Bitcoin premium over
USD for comparison. We define the premium as
Premium =KRW/BTC price× USD/KRW exchange rate− USD/BTC price
USD/BTC price(1)
For the daily USDBTC, KRWBTC, and EURBTC prices we look at all transactions on spe-
cific Bitcoin exchanges (data accessed via https://bitcoincharts.com/). Exchanges
were selected due to data availability, length of trading history, and both current and historical
market share. USDBTC data is from Bitstamp. Bitstamp has offices in Luxembourg, London,
and Berkeley. They are currently the 3rd largest exchange for USDBTC trades by volume and
have the longest trading history of the current major players. In the early days of bitcoin trading
the USDBTC leader was Mt. Gox which famously went bankrupt following a security breach.
The dataset contains 20,251,411 total trades with the first trade occurring on 2011-09-13. The
total notational value (at the time of each trade) is USD 34.4b. KRWBTC data is from Korbit.11See, e.g., http://hongbyun.tistory.com/22.
8

Korbit was South Koreas first bitcoin exchange and is currently third by volume for KRWBTC.
The dataset contains 4,932,571 total trades with the first trade occurring on 2013-09-03. The
total notational value (at the time of each trade) is KRW 13.6t. EURBTC data is from Kraken.
Kraken is currently the largest exchange for EURBTC by volume, with more than half the total
volume. The dataset contains 15,762,932 trades with the first trade occuring at 2014-01-08. The
total notational value (at the time of each trade) is EUR 16.2b.
The USDBTC daily price we utilize for analysis is the mean price of all USD transactions on
the Bitstamp exchange for that day. The KRWBTC and EURBTC daily prices are similarly de-
fined using Korbit and Kraken exchanges respectively. To convert the KRWBTC and EURBTC
prices to USD for comparison we utilize data from OANDA (https://www.oanda.com/).
The daily prices utilized are the average price (not the close) over the 24-hour period (UTC time
standard) aggregated from multiple exchanges. This is necessary for our purposes as the bitcoin
markets operate 24/7.
We estimate short and long term volatility for Bitcoin prices using market data over one day
and 20 days, respectively. For the short term volatility we define volatility as the sum of 10
minute squared returns over one day. Microstructure noise can arise from spreads between bid
and ask prices and from shifts in transaction prices die to the random execution of large trades
at the beginning or the end of the 10 minute interval. We use two measures to mitigate potential
biases doe to microstructure noise. First, we compute daily volatility for a given exchange as
the average of two volatility measures, based on 10 minute returns shifting the tome interval
by 5 minutes. Second, we define volatility as the median volatility over several exchanges.12
Similarly we compute long term volatility for a given exchange as the sum of squared 12 hour
returns over a period of 20 days. We then define long term volatility as the median volatility
over several exchanges.
The Bitcoin blockchain median confirmation time data is from https://blockchain.
12Data availability differs per time period as data is not available for all exchanges at all times. We include datafrom the following exchanges: bitfinex, bitstamp, BTCC, btc-e, coinbase, Gemini, hitbtc, itbit, kraken, OK-Coin,Poloniex as available on bitcoinchain.com.
9

info/. This is the median time in minutes for a Bitcoin transaction to be accepted into a mined
block and added to the public ledger (note: only includes transactions with miner fees). For days
with missing data (of which there are none in the most recent 2 years) we interpolate by using
the prior day’s value. The maximum gap in the data set was 1 day. Results were unchanged
when using straight-line smoothing or removing those days completely from analysis.
For the KRWBTC and EURBTC volumes we look at the daily total number of exchange
transactions (in thousands) on Korbit and Kraken respectively. This approach was taken rather
than volume in bitcoins due to the wildly differing Bitcoin prices at the start versus the end of the
sample period. Alternative measures considered included daily local currency total valuation
and daily USD total valuation. For the KRWUSD and EURUSD foreign exchange volatilities
we use the standard deviation of 1-day logarithmic returns in the daily average KRWUSD and
EURUSD exchanges from OANDA, over the most recent 20 days.
4 Preliminary Findings
To analyze the kimchi-premium we regress daily observations of the relative price difference
for bitcoin in Korea and the US on several factors poxing for potential frictions inhibiting the
arbitrage. All bitcoin for fiat currency transaction times are converted to UTC time standard. At
the moment all analysis is done at the daily level. Days with missing trading data are excluded.
All results were robust to testing on a sample with price smoothing over missing days (where the
price path on missing days was assumed to follow the geometric mean return path connecting
the two known days).
Regression results are shown in Table 2. These initial results lend support to the view that
bitcoin price risk is a significant component to the kimchi premium size. In periods of high
volatility, the cost of waiting for blockchain confirmations could be very significant and deter
arbitrageurs. Models (1) and (2) both document a positive relation between the kimchi premium
and short and long term volatility. Model (3) shows short term volatility is more important in
10

Table 1. Analysis Variables
Variable Name Variable Definition
Kimchi premium (KRWpremium over USD)
Calculated as (KRWBTCprice in USD)/(USDBTCprice) − 1, wherethe bitcoin price in USD is the mean price of all USD transactionson the Bitstamp exchange for that day. The bitcoin price in KRWis similarly defined with data from the Korbit exchange. Conver-sion from KRW to USD is done using the OANDA daily averagerate.
EUR premium over USD The absolute value of (EURBTCprice in USD)/(USDBTCprice) − 1,where the bitcoin price in USD is the mean price of all USD trans-actions on the Bitstamp exchange for that day. The bitcoin pricein EUR is similarly defined from the Kraken exchange. Conver-sion from EUR to USD is done using the OANDA daily averagerate.
Bitcoin short-termvolatility
The sum of 10 minute USDBTC squared returns over one day. Wedefine short-term volatility as the median volatility over severalexchanges: bitfinex, bitstamp, BTCC, btc-e, coinbase, Gemini,hitbtc, itbit, kraken, OK-Coin, Poloniex.
Bitcoin long-termvolatility
The sum of squared 12 hour USDBTC returns over a period of20 days. We define long-term volatility as the median volatilityover several exchanges: bitfinex, bitstamp, BTCC, btc-e, coin-base, Gemini, hitbtc, itbit, kraken, OK-Coin, Poloniex.
Blockchain medianconfirmation time
The median time (in minutes) for a Bitcoin transaction to beaccepted into a mined block and added to the public ledger(note: only includes transactions with miner fees). Source:blockchain.info. To interpolate missing days, the most recentknown value is used (max gap in data set is 1 day).
KRWBTC volume The daily total number of KRW and BTC exchange transactionson the Korbit exchange. Measured in thousands.
KRWUSD volatility The standard deviation of 1-day logarithmic returns in the dailyaverage KRWUSD exchange rate from OANDA, over the mostrecent 20 days.
EURBTC volume The daily total number of EUR and BTC exchange transactionson the Kraken exchange. Measured in thousands.
EURUSD volatility The standard deviation of 1-day logarithmic returns in the dailyaverage EURUSD exchange rate from OANDA, over the mostrecent 20 days.
11

line with the stylized fact that bitcoin volatility varies a lot over time and the idea that arbitrage
activity is short term in nature. Model (4) documents that higher median confirmation times on
the block chain are associated with higher bitcoin premia. An arbitrageur could potentially jump
the queue get her transaction processed faster by offering a higher transaction fee to miners, yet
such a higher transaction fee would also cause a direct reduction in arbitrage profits and hence
allow for a larger premium.
In model (5) we add bitcoin volume data and find that it is positively associated with the
Kimchi premium while the confirmation time becomes insignificant. Several potential explana-
tions are consistent with this finding. Increased trading volume could increase the demand for
concurrent or future transactions in the blockchain and hence both explanatory variables could
be driven by the same underlying factor. Higher trading volume at the exchanges could lead to
increased processing times for deposits or withdrawals (see section ??) of bitcoin in exchanges
and hence increase the turnaround time for an arbitrage trade. The positive association of vol-
ume and premium is also consistent with the findings of Mei, Scheinkman, and Xiong (2009)
who show that A-share turnover had a significant and positive correlation with the A- and B-
share price difference in China. In model (6) we find that a higher FX volatility is associated
with a lower Kimchi premium. Despite a larger coefficient the economic significance of the
FX-vola is much lower as it is orders of magnitude smaller than the bitcoin volatility.
To separate the effect of frictions emanating from within the bitcoin network from Korea
specific factors like the capital controls we perform a similar analysis for the European mar-
ket. Figure 3 plots the relative price difference of bitcoin in the EURO market relative to the
USD market. Price differences are substantial, yet the divergence of bitcoin prices are smaller
then in the Korean market and fairly symmetric in its distribution (average 0.27%, minimum
-4.37%, maximum 4.07%). In our regression analysis for the European market we explain the
absolute value of the premium as we are are primarily interested in explaining the cause of price
divergences.13 Regression results for the EUR premium can be seen in Table 3.
13In the Korean case regression results are very similar for explaining the absolute premium since the premiumis positive almost for the entire sample.
12
Both, the coefficients for the short term and long term volatility have the same sign but are
ten times smaller than in the case of the Korean market. These findings are consistent with an
interpretation that bitcoin price divergences are in part driven by microstructure effects within
the bitcoin network and that increased volatility makes arbitrage more risky and hence allows
prices to diverge more. Yet the smaller amount of frictions in the European market facilitates
arbitrage and hence price divergence is much smaller. Increased volume in European Bitcoin
markets seems to be associated with smaller divergence but the effect is of small economic
significance.
13

Tabl
e2:
Reg
ress
ion
resu
ltsfo
rth
eK
RW
Bitc
oin
prem
ium
over
USD
.Dai
lytim
ese
ries
regr
essi
ons:
the
depe
nden
tvar
iabl
eis
the
prem
ium
for
purc
hasi
ngbi
tcoi
nsw
ithK
orea
nW
on(K
RW
)ve
rsus
US
Dol
lars
(USD
)an
dis
calc
ulat
ed:(K
RW
BT
Cpr
ice
inU
SD)/(U
SDB
TC
pric
e)−
1,w
here
the
bitc
oin
pric
ein
USD
isth
em
ean
pric
eof
allU
SDtr
ansa
ctio
nson
the
Bits
tam
pex
chan
gefo
rth
atda
y.T
hebi
tcoi
npr
ice
inK
RW
issi
mila
rly
defin
edw
ithda
tafr
omth
eK
orbi
texc
hang
e.C
onve
rsio
nfr
omK
RW
toU
SDis
done
usin
gth
eO
AN
DA
daily
aver
age
rate
.T
hein
depe
nden
tvar
iabl
esar
ede
fined
asin
Tabl
e1.
Dep
ende
ntva
riab
le:
KR
WB
itcoi
nPr
emiu
mov
erU
SD
(1)
(2)
(3)
(4)
(5)
(6)
(7)
Bitc
oin
shor
t-te
rm0.0450
∗∗∗
0.0455
∗∗∗
0.0432
∗∗∗
0.0310
∗∗∗
0.0300
∗∗∗
0.0325
∗∗∗
vola
tility
(0.0023)
(0.0028)
(0.0023)
(0.0024)
(0.0024)
(0.0028)
Bitc
oin
long
-ter
m0.0328
∗∗∗
−0.0013
−0.0064
∗
vola
tility
(0.0033)
(0.0037)
(0.0036)
Blo
ckch
ain
med
ian
0.0030
∗∗∗
0.0003
0.0004
0.0004
confi
rmat
ion
time
(0.0005)
(0.0005)
(0.0005)
(0.0005)
KR
WB
TC
volu
me
0.0033
∗∗∗
0.0031
∗∗∗
0.0031
∗∗∗
(tho
usan
dsof
tran
sact
ions
)(0.0003)
(0.0003)
(0.0003)
KR
WU
SD−4.0039
∗∗∗
−4.4785
∗∗∗
vola
tility
(1.2668)
(1.2930)
(Int
erce
pt)
0.0010
0.0071
∗∗0.0016
−0.0256
∗∗∗
−0.0020
0.0113
∗0.0164
∗∗
(0.0022)
(0.0030)
(0.0028)
(0.0047)
(0.0049)
(0.0064)
(0.0070)
Obs
erva
tions
1,62
61,
626
1,62
61,
626
1,62
61,
626
1,62
6R
20.
1903
0.05
740.
1904
0.21
040.
2781
0.28
250.
2840
Adj
uste
dR
20.
1898
0.05
680.
1894
0.20
940.
2768
0.28
080.
2818
Not
e:∗ p<
0.1;
∗∗p<
0.05
;∗∗∗
p<0.
01
14

Figure 3. The Bitcoin EUR Premium: Bitcoins sometimes trade at a higher price even betweenrelatively frictionless markets (here EUR vs. USD) The premium for purchasing bitcoins with Euros(EUR) versus US Dollars (USD) is calculated: (KRWBTCprice in USD)/(USDBTCprice) − 1, where thebitcoin price in USD is the mean price of all USD transactions on the Bitstamp exchange for that day.The bitcoin price in EUR is similarly defined from the Kraken exchange. Conversion from EUR to USDis done using the OANDA daily average rate.
a) The EUR premium over time (top panel)
b) Distribution of the EUR premium (bottom panel)
15

Tabl
e3:
Reg
ress
ion
resu
ltsfo
rth
eE
UR
Bitc
oin
prem
ium
over
USD
.D
aily
time
seri
esre
gres
sion
s:th
ede
pend
ent
vari
-ab
leis
the
abso
lute
valu
eof
the
prem
ium
for
purc
hasi
ngbi
tcoi
nsw
ithE
uro
(EU
R)
vers
usU
SD
olla
rs(U
SD)
and
isca
lcul
ated
:(E
UR
BT
Cpr
ice
inU
SD)/(U
SDB
TC
pric
e)−
1,w
here
the
bitc
oin
pric
ein
USD
isth
em
ean
pric
eof
all
USD
tran
sact
ions
onth
eB
itsta
mp
ex-
chan
gefo
rth
atda
y.T
hebi
tcoi
npr
ice
inE
UR
issi
mila
rly
defin
edw
ithda
tafr
omth
eK
rake
nex
chan
ge.
Con
vers
ion
from
EU
Rto
USD
isdo
neus
ing
the
OA
ND
Ada
ilyav
erag
era
te.T
hein
depe
nden
tvar
iabl
esar
ede
fined
asin
Tabl
e1.
Dep
ende
ntva
riab
le:
EU
RB
itcoi
npr
emiu
mov
erU
SD
(1)
(2)
(3)
(4)
(5)
(6)
(7)
Bitc
oin
shor
t-te
rm0.0049
∗∗∗
0.0050
∗∗∗
0.0050
∗∗∗
0.0061
∗∗∗
0.0061
∗∗∗
0.0061
∗∗∗
vola
tility
(0.0003)
(0.0003)
(0.0003)
(0.0004)
(0.0004)
(0.0004)
Bitc
oin
long
-ter
m0.0034
∗∗∗
−0.0002
0.00001
vola
tility
(0.0004)
(0.0004)
(0.0004)
Blo
ckch
ain
med
ian
−0.0001
0.00002
0.00002
0.00002
confi
rmat
ion
time
(0.00005)
(0.00005)
(0.00005)
(0.00005)
EU
RB
TC
volu
me
−0.0001
∗∗∗
−0.0001
∗∗∗
−0.0001
∗∗∗
(tho
usan
dsof
tran
sact
ions
)(0.00001)
(0.00001)
(0.00001)
EU
RU
SD−0.0780
−0.0781
vola
tility
(0.1174)
(0.1175)
(Int
erce
pt)
0.0030
∗∗∗
0.0037
∗∗∗
0.0031
∗∗∗
0.0035
∗∗∗
0.0027
∗∗∗
0.0030
∗∗∗
0.0030
∗∗∗
(0.0002)
(0.0003)
(0.0003)
(0.0005)
(0.0005)
(0.0006)
(0.0007)
Obs
erva
tions
1,46
01,
460
1,46
01,
460
1,46
01,
460
1,46
0R
20.
1786
0.05
050.
1787
0.17
960.
1900
0.19
030.
1903
Adj
uste
dR
20.
1780
0.04
980.
1776
0.17
850.
1884
0.18
800.
1875
Not
e:∗ p<
0.1;
∗∗p<
0.05
;∗∗∗
p<0.
01
16

References
Chakravarty, Sugato, Asani Sarkar, and Lifan Wu, 1998, Information asymmetry, market seg-mentation and the pricing of cross-listed shares: theory and evidence from Chinese A and Bshares, Journal of International Financial Markets, Institutions and Money 8, 325–356.
Chan, Kalok, Albert J Menkveld, and Zhishu Yang, 2008, Information asymmetry and assetprices: Evidence from the China foreign share discount, The Journal of Finance 63, 159–196.
Chen, Joseph, Harrison Hong, and Jeremy Stein, 2002, Breadth of ownership and stock returns,Journal of Financial Economics 66, 171–205.
Edwards, Sebastian, 1999, How effective are capital controls?, Journal of Economic Perspec-tives 13, 65–84.
Gagnon, Louis, and G Andrew Karolyi, 2010, Multi-market trading and arbitrage, Journal ofFinancial Economics 97, 53–80.
Gromb, Denis, and Dimitri Vayanos, 2010, Limits of arbitrage, Annu. Rev. Financ. Econ. 2,251–275.
Hong, Harrison, Jose Scheinkman, and Wei Xiong, 2006, Asset Float and Speculative Bubbles,Journal of Political Economy 111, 1073–1117.
Mei, Jianping, Jose Scheinkman, and Wei Xiong, 2009, Speculative trading and stock prices:Evidence from Chinese AB share premia, Annals of Economics and Finance 10, 225–3255.
Miller, Edward, 1997, Risk, uncertainty and divergence of opinion, The Journal of Finance 32,1151–1168.
Pontiff, Jeffrey, 2006, Costly arbitrage and the myth of idiosyncratic risk, Journal of Accountingand Economics 42, 35–52.
Scheinkman, Jose, and Wei Xiong, 2003, Overconfidence and speculative bubbles, Journal ofPolitical Economy 111, 1183–1219.
17