BIS Working Papers · BIS Working Papers No 678 CoCo issuance and bank fragility by Stefan Avdjiev,...
77
BIS Working Papers No 678 CoCo issuance and bank fragility by Stefan Avdjiev, Bilyana Bogdanova, Patrick Bolton, Wei Jiang and Anastasia Kartasheva Monetary and Economic Department November 2017 JEL classification: G01, G21, G28, G32 Keywords: CoCos, Contingent Convertible Capital, Bank Capital Regulation, Basel III
Transcript of BIS Working Papers · BIS Working Papers No 678 CoCo issuance and bank fragility by Stefan Avdjiev,...
BIS Working PapersNo 678
CoCo issuance and bankfragility by Stefan Avdjiev, Bilyana Bogdanova, Patrick Bolton, Wei Jiang and Anastasia Kartasheva
Monetary and Economic Department
November 2017
JEL classification: G01, G21, G28, G32
Keywords: CoCos, Contingent Convertible Capital, Bank Capital Regulation, Basel III
BIS Working Papers are written by members of the Monetary and Economic Department of the Bank for International Settlements, and from time to time by other economists, and are published by the Bank. The papers are on subjects of topical interest and are technical in character. The views expressed in them are those of their authors and not necessarily the views of the BIS.
This publication is available on the BIS website (www.bis.org).
© Bank for International Settlements 2017. All rights reserved. Brief excerpts may be reproduced or translated provided the source is stated.
ISSN 1020-0959 (print) ISSN 1682-7678 (online)

CoCo Issuance and Bank Fragility�
Stefan Avdjiev Bilyana Bogdanova Patrick Bolton Wei Jiang
Anastasia Kartasheva
Abstract
The promise of contingent convertible capital securities (CoCos) as a �bail-in�solu-tion has been the subject of considerable theoretical analysis and debate, but little isknown about their e¤ects in practice. In this paper, we undertake the �rst comprehen-sive empirical analysis of bank CoCo issues, a market segment that comprises over 730instruments totaling $521 billion. Four main �ndings emerge: 1) The propensity toissue a CoCo is higher for larger and better-capitalized banks; 2) CoCo issues result instatistically signi�cant declines in issuers�CDS spreads, indicating that they generaterisk-reduction bene�ts and lower costs of debt. This is especially true for CoCos that:i) convert into equity, ii) have mechanical triggers, iii) are classi�ed as Additional Tier1 instruments; 3) CoCos with only discretionary triggers do not have a signi�cant im-pact on CDS spreads; 4) CoCo issues have no statistically signi�cant impact on stockprices, except for principal write-down CoCos with a high trigger level, which have apositive e¤ect.
* Avdjiev, Kartasheva, and Bogdanova are a¢ liated with the Bank for Interna-tional Settlements, Basel, Switzerland; Bolton and Jiang are a¢ liated with ColumbiaBusiness School, New York, U.S.A. The study has bene�ted from discussions by FelipeCortes, Mark Flannery, Florian Heider, George Pennacchi, Klaus Schaeck, Theo Ver-maelen, and comments from Ruth Doubleday, Louise Eggett, Ingo Fender, Ulf Lewrick,Noel Reynolds, and Kostas Tsatsaronis, as well as seminar participants at the Ameri-can Economic Association, Bank for International Settlements, Deutsche Bundesbank,the Committee on the Global Financial System workshop on contingent capital instru-ments, Conference on Financial Regulation at the University of Chicago, De Neder-landsche Bank, European Finance Association, European Winter Finance Conference,Imperial College of London, NBER Risks of Financial Institutions, Research Task Forceof the Basel Committee on Banking Supervision, Western Finance Association, Uni-versity of Geneva, and University of St. Gallen. We thank Minchen Zheng (Columbia)for excellent research assistance. Avdjiev can be reached at [email protected];Bogdanova at [email protected]; Bolton at [email protected]; Jiang [email protected]; and Kartasheva at [email protected]. The viewsexpressed in the paper are those of the authors and do not necessarily represent theviews of the Bank for International Settlements.
1

1 Introduction
If there is one term that epitomizes the infamy of the Global Financial Crisis of 2007-09 it
is �too big to fail�. Even when they sought to impose �nancial discipline on banks that had
assumed excessive levels of leverage, �nancial regulators were more often than not forced to
accept bailouts as the only possible stabilizing intervention because the alternative of putting
the failed banks through some form of resolution and imposing losses on depositors and other
bank creditors was seen to be too dangerous in the middle of the crisis. It is not surprising,
therefore, that a major priority of regulators following the crisis, on top of signi�cantly
tightened bank capital and liquidity regulations, was to create new instruments to facilitate
the write-down of the debt of distressed institutions. In short, the priority became to make
sure that, in the event of another crisis, bail-ins would be a credible alternative to bailouts.
One way of bringing about a swift and seamless bail-in is through the conversion of
contingent convertible capital securities (CoCos) previously issued by the bank. The auto-
matic loss absorption by CoCos when a pre-speci�ed trigger has been breached was the main
appeal of these securities according to the early proponents, in particular, Flannery (2005,
2016); Raviv (2004); Du¢ e (2009); McDonald (2013); Co¤ee (2011); Pennacchi, Vermaelen
and Wol¤ (2014); and the Squam Lake Working Group (2009). These advocates of CoCos
disagreed on the design of CoCos, in particular on whether the trigger should be a stock
price �oor or a minimum equity-capital ratio, and their proposals were criticized by other
commentators, most notably Admati, DeMarzo, Hellwig and P�eiderer (2013) and Sundare-
san and Wang (2015), who argued that CoCos were excessively complex and their conversion
2
could have destabilizing e¤ects.
In the immediate aftermath of the Global Financial Crisis, these debates among acad-
emics were mirrored by di¤erences in opinions and preferences among national bank reg-
ulators. Nevertheless, the introduction of the Basel III framework, which allows banks to
meet part of their regulatory capital requirements with CoCo instruments, created strong
incentives for banks to seriously explore the possibilities for issuing CoCos. Furthermore,
the inclusion of speci�c contingent capital elements in the Basel III framework brought some
homogeneity in CoCo design across jurisdictions. As the number of jurisdictions implement-
ing Basel III grew, banks responded by raising a substantial amount of capital in the form
of CoCo issues. Between January 2009 and December 2015, banks around the world issued
a total of $521 billion in CoCos through 731 di¤erent issues.
The market for bank CoCos is now large enough to undertake a systematic empirical
analysis of bank CoCo issuance. We do this by assembling the �rst comprehensive data set
of all CoCo issues by banks between 2009 and 2015. Beyond providing an overview of the
main characteristics of CoCos and their issuers, our study seeks to address two fundamental
questions: What drives bank CoCo issuance decisions? And how do CoCo issues a¤ect
issuers�balance sheets?
To determine the factors driving CoCo issuance, we perform a duration analysis and
estimate which bank characteristics are associated with a higher propensity to issue a CoCo.
Our �rst main broad �nding is that larger banks and banks with relatively strong balance
sheets, were among the �rst wave of CoCo issuers. But banks with impaired balance sheets
3

that were in greater need of recapitalization were less likely to issue CoCos. Even though this
result is surprising at �rst sight, it is consistent with the predictions of our simple theoretical
model (presented in Appendix B). Issuance decisions are made with shareholder interests
in mind; and shareholders may pass on a CoCo issue if it does not enhance shareholder
value. As our theoretical model predicts, a CoCo issue by a bank with an impaired balance
sheet mostly bene�ts the bank�s senior unsecured debt holders (a version of the classic "debt
overhang" problem). Viewed in this light, our result is less surprising. Consistent with
this interpretation, we also �nd that statistical signi�cance is greater for CoCos that specify
a principal write-down when the trigger is breached rather than a conversion of debt into
equity. Principal write-down CoCos are, in e¤ect, junior to equity in distress states and,
therefore, particularly attractive to shareholders.
We also conduct an event study to evaluate the impact of CoCo issuance on the issuer�s
balance sheet. In particular, we estimate the announcement e¤ect of a CoCo issue on the
issuer�s CDS spreads and equity prices, breaking the e¤ect down by key issuer characteris-
tics and CoCo contract features. Several striking results emerge from this analysis. First,
the overall impact of a CoCo issue on the issuer�s CDS spread is negative and strongly
statistically signi�cant, indicating that, according to market participants, a CoCo issue un-
ambiguously strengthens the issuer�s balance sheet. When we break down the e¤ect by CoCo
loss absorption mechanism, we �nd that the impact on CDS spreads of CoCos that convert
into equity is much stronger than the respective impact of principal write-down CoCos. This
latter result is again consistent with the predictions of our simple model. As we show, a
4

CoCo that converts into equity disciplines risk-taking by shareholders because conversion
may dilute existing equity holders�claims. In contrast, risk-taking is rewarded at the con-
version margin when CoCos absorb losses via a principal write-down. This explains why the
net reduction in credit risk following the issue of a principal write-down CoCos is lower.
When we further separate the announcement e¤ects by the type of trigger mechanism,
we strikingly �nd that the presence of a mechanical trigger makes all the di¤erence. More
concretely, only CoCos that have a mechanical trigger (in addition to a discretionary trigger)
have a signi�cant negative impact on the issuer�s CDS spread. In other words, the issuance
of a CoCo with only a discretionary trigger is seen to have no signi�cant e¤ect on the bank�s
credit risk by the market. The most likely explanation for this market reaction is that
these CoCos are pure "gone concern" instruments, with a lot of uncertainty surrounding the
regulator�s conversion decision. CoCos that also have a mechanical trigger combine both
�gone concern�and �going concern�features. The market reaction to the announcement of
CoCo issues with a mechanical trigger suggests that the triggering event for these CoCos is
more predictable, at least for the "going concern" part.
We also �nd that the level of the mechanical trigger matters. The impact of high-trigger
CoCos on CDS spreads is stronger than that for low-trigger CoCos. These results shed light
on an important controversy around banks�true motivation for issuing CoCos. Ever since
the �rst CoCo issue by Lloyd�s in November 2009, which speci�ed a low trigger, the concern
was raised that the contingent component of these instruments was purely theoretical and
that regulatory intervention to save the issuer would take place long before the low trigger
5

level would be breached (see Alessandri and Haldane, 2009 and Glasserman and Perotti,
2017). Our results only partially con�rm these concerns and indicate that, at least for high-
trigger CoCos, market expectations do factor in a signi�cant probability of conversion. It is
also worth noting that these results also partially dispel another myth about CoCos: that
investors were only focused on the high yields and entirely ignored the risk of conversion.
All in all, we �nd that CoCo issuance has generally contributed to reducing bank fragility.
But not all instruments are equal in this regard. The CoCos that have the strongest strength-
ening e¤ect on bank balance sheets are the ones that absorb losses by converting to equity
as well as those that have a mechanical trigger and an Additional Tier 1 (AT1) designation.1
We also look at the announcement e¤ects on bank equity prices and �nd that for the
full sample there is no signi�cant impact of CoCo issuance on the issuer�s stock price. This
is again consistent with the predictions of our theoretical model and re�ects the fact that
while a CoCo issue may strengthen a bank�s balance sheet it may do so at the behest of
shareholders. Interestingly, however, the one type of CoCo whose main design features are
most bene�cial to shareholders �a principal write-down CoCo with a high trigger �does
have a positive and statistically signi�cant impact on the issuer�s equity price.
Our paper contributes to the wider literature of empirical studies of �nancial contracts
(see Roberts and Su�, 2009, for a survey). Because our �nancial contracts are publicly traded
we are able to shed light on market reactions to particular designs, which is typically not
possible for venture capital contracts and syndicated bank loans.
1The implicit assumption behind the above conclusions (and throughout our analysis) is that CoCoissuance is not substituting for CET1 issuance, i.e. that CoCos are issued on top of (rather than instead of)CET1.
6

None of the CoCos in our sample have converted or been in danger of converting during
our sample period. We therefore cannot investigate the e¤ects of conversion.2 However,
the study by Vallee (2016) of hybrid bonds issued by European banks between 1998 and
2012, which have similar features to CoCos structured as reverse convertible bonds, shows
how conversion can provide a capital cushion to issuing banks in a crisis. Vallee (2016)
studies the e¤ects of the ex-post conversion of these hybrid bonds during the �nancial crisis
of 2007-09 and �nds that conversion had the intended e¤ects predicted by CoCo theories.
The remainder of the paper is organized as follows. Section 2 provides the institutional
background, describes the current state of CoCo issuance, and presents an overview of the
sample. Section 3 describes the post-crisis policy debates around bank regulatory reform.
It also summarizes the predictions derived from the theoretical framework developed in
Appendix B. Section 4 presents the empirical analyses. Section 4.1 contains several duration
analyses on the propensity of a bank to issue a CoCo. Section 4.2 reports the estimates of
the impact of CoCo issuance on the CDS spread and the stock price of the issuing bank, as
well as the di¤erential e¤ects of the main CoCo contract features. Section 5 discusses open
questions about the future design of CoCos and o¤ers concluding comments.
2Outside our sample period, there has been one episode in which coupon suspension was feared forDeutsche Bank�s CoCos in February 2016, and another episode in which conversion of Banco Popular�sCoCos was triggered by the regulator in June 2017.
7
2 Institutional Background and Sample Overview
2.1 The CoCo Market
CoCos have two de�ning features �a trigger modifying the debt repayment terms and a loss-
absorption mechanism. We describe the di¤erent forms these features can take in Figure 1.
A CoCo can have one or more triggers. In the case of multiple triggers, the loss ab-
sorption mechanism is activated when any trigger is breached. Under Basel III, all CoCos
are discretionary trigger. This trigger type allows regulators to activate the loss absorption
mechanism if they decide that the issuer has reached the point of non-viability. In addition,
some CoCos also have a mechanical trigger, which is de�ned relative to the capital of the
CoCo-issuing bank. In theory, the capital measure could be based on book values or market
values. In practice, however, the mechanical triggers of all the CoCos that have been issued
so far are book value-based. In most cases, those are de�ned in terms of the ratio of the
issuing bank�s Common Equity Tier 1 (CET1) capital to its risk-weighted assets (RWA).
[Insert Figure 1 here.]
The loss-absorbing mechanism is the second key characteristic of a CoCo. Recapitaliza-
tion through conversion can occur in two ways. A mandatory conversion into equity (MC)
CoCo increases CET1 capital by converting the CoCo debt into equity at a pre-de�ned con-
version rate. The conversion rate can be based on the market price of the stock at the time
the trigger is breached, a pre-speci�ed price (e.g. the stock price at issuance), or a combina-
tion of the two prices. Principal write-down (PWD) CoCos repair the bank�s balance sheet
8

by writing down the CoCo�s principal amount, either permanently or temporarily.3
The Basel III framework contains two key contingent capital elements (Figure 2).4 First,
all (AT1 and T2) CoCos must include a discretionary trigger, also known as a point of
non-viability (PONV) trigger. Second, all AT1 CoCos classi�ed as liabilities must have a
mechanical trigger, with a minimum trigger level of 5:125% (in terms of CET1/RWA).5
However, the Basel III framework does not specify a particular loss absorption mechanism,
implicitly treating PWD CoCos and MC CoCos in a symmetric fashion.6
[Insert Figure 2 here.]
More recently, two other regulatory changes have further expanded the potential market
footprint of bank CoCos. The �rst change is the upcoming total loss-absorbing capacity
(TLAC) resolution requirements for global systemically important banks (G-SIBs). The
new TLAC requirements can be (at least partially) satis�ed through the issuance of CoCos
as well as other (non-CoCo) "bail-in-able" debt.7 The second change was introduced by the
European Bank Recovery and Resolution Directive (BRRD), which includes the Minimum
Requirement for Own Funds and Eligible Liabilities (MREL) stipulating that a su¢ cient
fraction of bank debt liabilities be bail-in-able.8
3Avdjiev et al. (2013) provide further details on CoCo contract features and bank capital regulationsrelated to CoCos.
4As illustrated in Figure 2, the regulatory minimum capital requirements under the Basel III frameworkare (RWA-based) ratios of 4:5% for CET1, 6% for Tier 1 capital (CET1 + AT1), and 8% for total capital(CET1 + AT1 + T2). All instruments other than those in CET1 are optional �i.e. banks have the optionto meet all their capital requirements using only CET1.
5The latter requirement does not apply to AT1 CoCos classi�ed as equity (i.e. preferred shares).6In some jurisdictions (e.g. Switzerland), national supervisors supplement the Basel III minimum capital
levels by requiring G-SIB banks to have additional capital layers, �lled with CoCos. See FINMA (2015).7The TLAC standard de�nes a minimum requirement for the instruments and liabilities that should be
"bail-in-able" (i.e. readily available for bail-in within resolution) at G-SIBs. See FSB (2015).8See EBA (2016).
9

Nearly as important as bank regulations are institutional investors�constraints and issuer
incentives to create notable clientele e¤ects on CoCo design. In particular, the persistently
low interest rates in the post-�nancial crisis environment incentivized �xed income investors
to invest in high-yield instruments. However, �xed income investors are often restricted by
mandate from investing in instruments that have a non-negligible probability of converting to
equity or face higher compliance costs for these instruments. In contrast, PWD instruments
typically do not fall under such restrictions.
2.2 Sample Overview
Our data set is compiled using information from Bloomberg and Dealogic. We have manu-
ally augmented the data set with additional information from supplementary sources. The
sample that we use in our benchmark analysis consists exclusively of CoCos issued by banks
and excludes those issued by insurance companies and other non-bank �nancial institutions.
Furthermore, we focus on CoCos that have at least one (mechanical or discretionary) con-
tractual trigger.9
The data comprises the main elements of CoCo term sheets, their regulatory classi�ca-
tion, and key issuer characteristics. We collect information on the most important CoCo
contractual terms - the loss absorption mechanism (principal write-down or mandatory con-
version to equity), the trigger type (mechanical or discretionary), and the trigger level (for
CoCos that have a mechanical trigger). In addition, we collect the following variables: ma-
9In this paper, we focus on loss absorption mechanism triggers and we do not analyze coupon cancellationtriggers. We also do not include CoCos that have only a statutory trigger.
10

turity; issued amount; currency of denomination; regulatory capital classi�cation (AT1 or
T2); issue date; price and yield at issuance; coupon rate; and payment rank classi�cation
(subordinated debt, preferred equity, etc.).
As for issuer characteristics, we collect daily data on issuer equity prices and CDS spreads
(for senior unsecured debt). We construct benchmark indices in which banks are grouped
based on their country/region of operations ��Australia and New Zealand,��Canada�, �Eu-
rope,� and �Japan.�For equity prices, we use market capitalization-weighted Datastream
bank country/regional equity indices. For CDS spreads, we calculate equally-weighted av-
erages of the CDS spreads of banks operating in the respective county/regions. In order
to obtain a more representative set of banks included in each country/regional CDS index,
we augment the constituents of the Markit iTraxx and CDX indices with additional banks,
which (i) operate in the respective CoCo-issuing jurisdictions and (ii) have liquid CDS for
senior unsecured debt.10
For the empirical exercise on the determinants of CoCo issuance, we take the universe
of potential CoCo issuers to be the top 500 banks (by total assets in 2009) in CoCo-issuing
advanced economies. This sample encompasses both those banks which eventually do issue
one or more CoCo securities and those banks for which CoCo is a potential option, but
choose not to issue. We obtain annual data of the major balance-sheet variables for the
actual and potential CoCo issuers from Bankscope.
10All the additional banks that we include in our augmented country/regional CDS indices have (seniorunsecured debt) CDS spreads reported by Markit on at least 75% of the business days in our sample. In ourbenchmark empirical exercises, we use the values of each country/regional CDS index on a given date onlyif a CDS spread is reported for at least 75% of the banks included in the respective country/region on thatdate.
11

An overview of the CoCo market through the end of 2015 is presented in Table 1. Between
2009 and 2015, there were 731 CoCo issuances for a combined issuance volume of $521 billion.
The size of the average CoCo issue is $713 million. Nevertheless, that �gure conceals a wide
variation in individual CoCo issue sizes, which range from $2 million to $7 billion.
[Insert Table 1 here.]
The last column of Table 1 provides a break-down of CoCo issuance by region. European
issuers account for 39% of the CoCo market. Another 14% of CoCo issuance has come from
banks from non-European advanced economies. Following a period of rapid growth in CoCo
issuance in the last years, emerging market economies (EMEs) account for over 46% of the
CoCo market by the end of 2015.
The left-hand panel of Figure 3 displays the geographical distribution of CoCo issuance
by individual countries. In the early years of our sample, CoCo issuance was heavily concen-
trated in advanced European countries; issuers headquartered in the UK and Switzerland
were particularly active. In the later years of our sample, CoCo issuance in non-European
advanced economies (Australia, Japan, and Canada) gradually picked up in tandem with the
implementation of Basel III. Issuance by banks in EMEs remained relatively low until the
last couple of years in our sample, when Chinese banks became particularly active issuers of
CoCos. One notable absence from the list of CoCo-issuing jurisdictions is the United States,
where banks have issued AT1 and T2 instruments that have only statutory (as opposed to
contractual) triggers.11
11We have not included the AT1 preferred shares and the T2 subordinated debt instruments issued by US
12

[Insert Figure 3 here.]
Banks tend to issue CoCos either in their respective home currency or in US dollars
(Figure 3, right-hand panel). Virtually all CoCos denominated in British pounds, Australian
dollars, Japanese yen, Canadian dollars, and Chinese yuan were issued by banks from the
respective currency-issuing jurisdictions. Also, roughly two thirds of the $84 billion in euro-
denominated CoCos were issued by banks from the euro area. The US dollar-denominated
issuance totaled $148 billion and accounted for 28% of global issuance.
The majority of the CoCos in our sample have a mechanical trigger in addition to the
discretionary trigger (present in all CoCos in our sample). The total volume of CoCos with
a mechanical trigger is $292 billion (or 56% of the global aggregate), and the amount of
CoCos with only a discretionary trigger is $229 billion (or 44% of the global aggregate). The
majority of CoCos issued by banks in advanced economies tend to have mechanical triggers.
The majority ($205 billion) of the CoCos with a mechanical trigger have trigger levels
that do not exceed 5:125%, which is the minimum trigger level (in terms of CET1/RWA)
required for a CoCo classi�ed as a liability to qualify as AT1 capital under Basel III. About
$87 billion worth of CoCos have a mechanical trigger level that is higher than 5.125%.12
Slightly more than half (55%) of all CoCos are classi�ed as AT1 capital. The rest are
classi�ed as T2 capital. AT1 CoCo issuance has dominated in most advanced economies,
where nearly three quarters of the CoCos are classi�ed as AT1 capital. The only exceptions
banks since all of them have only statutory triggers. As discussed above, we focus on contingent convertiblecapital instruments with at least one contractual trigger.12Another potentially relevant critical capitalization level is the Capital Conservation Bu¤er Requirement
(CBR). When an issuer�s capital bu¤er falls below the CBR, it is constrained in its ability to continue itsexisting dividend and coupon payouts.
13

are Switzerland and Canada (where issuance has been roughly evenly split between AT1 and
T2 CoCos) and Japan (where T2 CoCos have accounted for two thirds of all issuance). In
contrast, EME banks have issued mostly T2 CoCos, which represent 63% of their total CoCo
issuance so far.
Figure 4 tracks the evolution of the CoCo market between 2009 and 2015. It shows that
the volume of CoCo issuance has grown rapidly since 2009. The left-hand panel reveals that,
in the early years, issuance of AT1 instruments was slightly more prevalent than that of T2
instruments. As issuance by EME banks picked up in 2014 and 2015, so too did the share
of T2 CoCos.
[Insert Figure 4 here.]
The right-hand panel of Figure 4 breaks down the evolution of CoCo issuance by the loss
absorption mechanism. Even though MC CoCos dominated in the early years, the issuance
of PWD instruments picked up over time. Growing demand by �xed income investors for
CoCos and shareholder incentives to issue PWD CoCos could be important factors that
contributed to this trend.
3 Policy Debates and Hypotheses
For most advocates, the main case for CoCos is the quick and simple bail-in mechanism
they provide. Early critics of CoCos have argued, however, that an even better and simpler
bail-inable instrument is equity (Admati et al., 2013). Another early concern was that the
14

design of some types of CoCos could result in destabilizing bail-ins (Sundaresan and Wang,
2015). These observations, and others we discuss below, have been at the heart of policy
debates around CoCos. Our analysis focuses on how the design of CoCos matters for the
overall costs and bene�ts from issuing such instruments.
3.1 Market-based or Accounting-based Triggers?
While CoCo issuance reduces the issuing bank�s probability of failure, it also changes the
distribution of payo¤s over di¤erent claims in states of distress. As a result, the CoCo trigger
may be subject to gaming by bank managers, regulators, and investors. Di¤erent designs
give rise to strategic gaming problems. One prominent issue that has been widely discussed
in the literature is the pros and cons of book-value versus market-value triggers in terms of
the promptness and accuracy of conversion.
The responsiveness of book-value triggers depends on the frequency with which book
values are reassessed and disclosed. It also depends on the accuracy and robustness of the
internal risk models that are used to measure the risk exposure of bank balance sheets. These
factors reduce the ability for CoCos with accounting-based triggers to respond in a timely
way to the onset of a sudden crisis. In contrast, market-value triggers, as Flannery (2005,
2016) and Calomiris and Herring (2013) have argued, are that they immediately respond
to news about realized or prospective bank losses. In addition, they are somewhat more
immune to accounting obfuscation.13
13As we have already noted, all AT1 and T2 CoCos must include a discretionary trigger. Such triggers po-tentially have regulatory forbearance problems, and generate excessive sensitivity of the market to regulatoryannouncements.
15
However, a potential shortcoming of market-based triggers is that they are exposed to
price volatility generated by noise trading. Moreover, they may invite stock price ma-
nipulation or speculative attacks. For example, market-based triggers may be vulnerable
to strategic short-selling for the purposes of forcing the conversion of a CoCo and thereby
transferring value from equity holders to CoCo investors, as Hillion and Vermaelen (2004)
have argued. A broader concern with using market prices for regulatory purposes is that
this can distort the information content of prices (see Faure-Grimaud, 2002, and Bond et
al., 2010). For CoCos speci�cally, when a market price triggers conversion, the share price
re�ects both the value of the issuer�s total assets and the redistribution of value among initial
shareholders and CoCo investors, as discussed in Glassermann and Nouri (2016) and Berg
and Kaserer (2015).
There are several proposals that address these latter concerns, including: (i) inducing
gradual conversion into shares (Bulow and Klemperer, 2014); (ii) �xing the number of new
shares at conversion (Flannery, 2016); (iii) letting the trigger be based on a historical moving
average of stock prices (Du¢ e, 2009, and Calomiris and Herring, 2013); and (iv) �xing the
conversion price below the share value at conversion, with an option for initial shareholders
to purchase the new shares at the lower price (Pennacchi et al., 2013).
Another important feature of CoCos is their maturity. As Pennacchi and Tchistyi (2016a)
have argued, CoCos with in�nite maturity are much more robust to price manipulation.
They show that when CoCos are perpetuities, the multiple equilibrium problem identi�ed
by Sundaresan and Wang (2015) disappears and equilibrium is unique regardless of other
16
CoCo features.
3.2 Loss Absorption and Risk-taking Incentives
The e¤ect of CoCo issuance on risk-taking incentives of the issuing bank is an important
aspect of CoCo design. In theory, PWD CoCos could encourage excess risk-taking around
the conversion trigger, whereas MC CoCos that dilute existing shareholders upon conversion
could encourage accounting manipulation to delay conversion. Moreover, CoCos with con-
version terms that transfer value to equity holders upon conversion are likely to encourage
additional risk-taking. Indeed, Berg and Kaserer (2015) analyze the conversion price of Co-
Cos issued by Lloyds in an option-pricing context and show that those bonds create perverse
risk incentives for banks�equity holders.
Excess risk-taking incentives associated with PWD CoCos can be mitigated by exposing
bank executive compensation to CoCo price risk (Bolton et al., 2015 and Hilscher and Raviv,
2014). Approaches to address the concerns regarding MC CoCos have been more diverse.
Flannery (2005) and Calomiris and Herring (2013) urge that the design of CoCos should
take the form of MC CoCos that are dilutive to preexisting equity holders and that convert
well before the bank faces insolvency. Similarly, Martynova and Perotti (2015) show that
CoCos lower bank risk-taking in equilibrium only when they take the form of high-trigger
MC CoCos. But the problem with these CoCo designs is that bank equity holders have
little incentive to issue such CoCos, because doing so mostly bene�ts outstanding unsecured
creditors with higher seniority in the event of a bankruptcy state. In other words, bank
17

equity holders may face a �debt overhang�problem with respect to high-trigger, dilutive,
MC CoCos. However, Chen et al. (2017) and Albul et al. (2013) have shown that equity
holders can have a positive incentive to issue CoCos to the extent that they also bene�t
when the issuer has a lower default risk (for example, via lower costs of debt rollovers).
In summary, the literature highlights that CoCo contract features a¤ect bank risk-taking
incentives. Though CoCo contract design could be in�uenced by regulators, the reality
is that issuing banks have substantial leeway in selecting the contract features they want.
Hence it is important to understand the e¤ects of CoCo designs on bank incentives in order
to induce CoCo contracts that are desirable from the perspective of �nancial stability.
3.3 CoCos as a Macroprudential Tool
Several CoCo design proposals have focused on the question of how CoCos should be modi�ed
to deal with a systemic risk event. The essence of these proposals is that the CoCo trigger
should be contingent on some measure of systemic risk. However, this contract design could
paradoxically lead to higher systemic risk because it would increase moral hazard frictions.
That said, CoCos whose conversion is triggered by a systemic event do o¤er the desirable
property that they deliver a bail-in only when it is needed, in a crisis when restructuring a
bank�s liabilities and raising new capital is di¢ cult.
One early such proposal came from Kashyap et al. (2008), who suggest that banks
purchase capital insurance, with a trigger that is based on a systemic event. Similarly,
the Squam Lake Working Group (2009) proposes that CoCos convert to equity under two
18

conditions: (i) a breach of a trigger based on an accounting capital ratio; and (ii) a declaration
by regulators that there is a systemic crisis. Caballero and Kurlat (2008) have also proposed
that the central bank could issue tradable insurance credits that entitle the holder to attach a
central bank guarantee to assets on its balance sheet during a systemic crisis. Their proposal
eliminates the need to make the trigger contingent on a speci�c event, which they argue is
a better way of dealing with a surprise shock.
CoCos can also be a macroprudential tool if they implement counter-cyclical equity
bu¤ers. One way of achieving this, suggested by Bolton and Samama (2012), is to do
away with automatic triggers altogether and design the CoCos as reverse convertible bonds
granting the issuer the option to convert the bond into equity. Issuers would only convert
when the put option embedded in the CoCo is in the money, which is more likely to be the
case in recessions or in a �nancial crisis. When the issuer exercises the option, the bank
is e¤ectively recapitalized at more favorable terms than those available in the market. A
CoCo structured as a reverse convertible bond would be equivalent to giving the issuer a
commitment to augment its equity capital at will, and at favorable terms, in recessions, thus
implementing a form of countercyclical equity bu¤er. Vallee (2016) shows that European
banks that had issued hybrid debt before the crisis took advantage of the convertibility op-
tion to convert the debt issues in the middle of the crisis of 2007-09, which enabled them to
partially recapitalize their stressed balance sheets. Finally, Zeng (2013) also derives optimal
countercyclical bank capital requirements, and shows that they can be implemented using
CoCo instruments.
19

3.4 Hypotheses
Our empirical analysis focuses on two key questions. What bank characteristics determine
whether a bank issues a CoCo of a given design? And what is the impact of CoCo issuance
on the market price of other claims on the issuing bank? To guide our empirical analysis,
we develop a simple theoretical model (presented in Appendix B) that generates several
predictions on these two questions. The model considers a bank issuer with assets and
liabilities in place that currently satisfy regulatory capital requirements, but risks violating
these requirements in a future crisis state in which it incurs a loss. The decision the issuer
faces is whether to issue a CoCo now, so as to buttress its balance sheet su¢ ciently to be able
to withstand a loss without violating its capital requirements, or risk having to go through
a costly recapitalization in the crisis state. As a trade-o¤ to �re-sale recapitalization costs
in a crisis, the issuer faces CoCo issuance costs. These issuance costs include underwriting
fees and dilution costs due to asymmetric information.
The model assumes that the decision whether to issue a CoCo or not rests with the
shareholders of the issuing bank, who evaluate the relative costs of CoCo issuance today
versus contingent recapitalization tomorrow, with the goal of shareholder value maximiza-
tion. The analysis implies that issuing a CoCo is more attractive to shareholders the less
the CoCo issue is underpriced by the market, the lower the fraction of equity promised to
CoCo investors upon conversion, and the higher the asset sales discount in a crisis.
Accordingly, there are two important di¤erences between an MC CoCo and a PWD CoCo
for a bank issuer. First, the conversion of the PWDCoCo always increases the value of equity,
20

while the conversion of an MC CoCo could result in dilution of equity holders. Second, PWD
CoCos are less likely to be underpriced by the market, because the loss upon conversion is
contractually speci�ed and is therefore less likely to be overestimated by investors. Moreover,
PWD CoCos are 100% �xed income securities, which are more straightforward to value and
which have greater appeal to institutional investors specializing in �xed income securities.
The key predictions of the model about banks�propensities to issue CoCos are as fol-
lows. There is an inverse U-shaped relation between the issuing bank�s incentives to issue
a CoCo and the bank�s equity capitalization. When the bank�s capitalization is very low,
its shareholders have little incentive to issue CoCos, especially MC CoCos, since most of
the bene�ts of the CoCo issue go to senior unsecured debt holders and not equity holders.
When the bank�s capitalization is very high, it has no need to raise costly equity, whether
in the form of CoCos or common stock. It is mostly for intermediate equity capitalization
levels that equity holders have an incentive to issue CoCos, for then equity holders, along
with senior unsecured debt holders, bene�t from the CoCo issue by avoiding a future costly
recapitalization in a crisis.
The model analysis also delivers the following predictions about CoCo-issuing banks�
incentives to engage in excess risk-taking.14 A su¢ ciently dilutive MC CoCo contract mit-
igates bank shareholders� incentives to engage in excess risk-taking, as they would bear a
cost as a result of CoCo conversion following the realization of a loss. This e¤ect is stronger
for CoCos with higher conversion triggers. In contrast, PWD CoCos encourage bank excess
risk-taking by decreasing the size of the losses for bank shareholders in the crisis state.
14Our analysis on risk-taking incentives aligns with the literature reviewed in Section 3.2.
21

Finally, the model delivers key predictions about the e¤ect of CoCo issuance on the
value of the bank�s other claims. First, CoCo issuance, whatever its design, should increase
the recovery value of senior unsecured debt, and therefore lower the bank�s CDS spreads.
However, there is no such clear prediction for the issuing bank�s share price. The reason is
that the decision to issue a CoCo conveys a "mixed" signal about the health of the issuer�s
balance sheet. If the market prior is that the issuer has a very strong balance sheet, then
the issuance of a CoCo is bad news, but if the market prior is that the bank is under-
capitalized, then the issuance of a CoCo is good news. The formal analysis considers a
situation where the issuer may be of three di¤erent types: (i) poorly capitalized banks that
become insolvent upon the realization of a loss; (ii) adequately capitalized banks that require
recapitalization upon the realization of a loss; and (iii) well capitalized banks that do not
require a recapitalization upon the realization of a loss. As we pointed out above, our model
predicts that poorly and well capitalized banks should have no incentives to issue a CoCo.
Thus, an announcement of a CoCo issue can trigger a positive or a negative stock price
reaction, depending on the prior beliefs about the distribution of bank types in the economy.
4 Empirical Analyses
We conduct two main sets of empirical exercises. First, we perform duration analyses in
order to investigate the main determinants of the propensity of a bank to issue a CoCo.
Second, we estimate of the impact of CoCo issuance on the CDS spread and the stock price
of the issuing bank, as well as the di¤erential e¤ects of the main CoCo contract features.
22
In both of our benchmark empirical analyses, we focus on CoCos classi�ed as liabilities
and issued by banks from advanced economies. We do not include CoCos issued by banks
from EMEs since the considerable degree of heterogeneity in the timing of the Basel III
implementation among EME jurisdictions could introduce a signi�cant amount of noise in the
empirical analyses. We do not include CoCos classi�ed as preferred shares in our benchmark
empirical analyses for a couple of reasons. First, as discussed above, CoCos that are classi�ed
as preferred shares are exempt from the requirement to have a mechanical trigger with a
minimum level of 5.125% in order to be eligible to qualify as AT1 capital. This makes
such CoCos considerably di¤erent from AT1 CoCos classi�ed as liabilities. Second, CoCos
classi�ed as preferred shares are concentrated in a very small number of jurisdictions and
represent a tiny fraction of our overall sample.
4.1 Determinants of CoCo Issuance
The �rst question we analyze concerns banks�propensity to issue CoCos. We focus on an
�unconditional�sample of banks that could be potential CoCo issuers. We restrict the sample
to the top 500 banks (ranked by total assets in 2009) in the set of CoCo-issuing advanced
economies, plus all the CoCo issuers from advanced economies that are not among the top
500. The resulting sample includes a total of 523 banks.
We take January 2009 as the beginning of our sample period and track CoCo issuance of
all the banks in our sample until December 2015.15 For our �rst question, we estimate the
15CoCos were only beginning to be considered as a �nancing option by banks in 2009.
23

expected duration from January 2009 until the time when a bank with given characteristics
issues a CoCo for the �rst time. We perform several duration analyses that are reported in
Table 2. The �rst set of results, reported in Panel A, is from a two-sided Tobit regression of
time to issue in the cross-section, the number of months from January 2009 to the time of
the �rst CoCo issue, as a function of key bank balance sheet characteristics. The duration,
by construction, is bounded from below at zero. For the non-issuers, the time of the �rst
CoCo issue is coded as being censored at the end of the sample period.
[Insert Table 2 here.]
The independent variables we focus on are: (i) total assets (in logs); (ii) Tier 1 (Tier-1
capital); (iii) G-SIB (a dummy variable for G-SIB status); (iv) gross loans; (v) deposits; (vi)
trading securities; and (vii) long-term funding. All variables, except total assets, are scaled
by total assets and expressed as percentage points. All bank characteristics are measured at
the beginning of the sample period, in January 2009. We break down deposits into customer
deposits and bank deposits on the grounds that the risk pro�le of banks with mostly customer
deposits is likely to be signi�cantly di¤erent from that of banks with mostly bank deposits.
We also track interbank lending on both the liability and asset sides through the variables
interbank borrowing and interbank assets.
Our main �ndings are as follows. First, the coe¢ cient on total assets is negative and
signi�cant for all speci�cations. Note that a positive coe¢ cient indicates a longer delay to
issuance, or a low propensity to issue, so that our �rst result implies that larger banks are
quicker to issue CoCos over our sample period. This con�rms the anecdotal evidence that
24

smaller banks take longer to test the market for new �nancing vehicles.16
Second, the coe¢ cient on Tier 1 is negative and statistically signi�cant in most speci-
�cations. Recall that our theoretical prediction is that inadequately capitalized banks are
less likely to issue CoCos. Based on the coe¢ cient in column (1), a one-percentage-point
increase in Tier 1 capital (including CET1 and AT1, with an average ratio of 7:0% in 2009)
is associated with a 3:8-month shortening in the time to issuance, out of a sample average
of 55.7 months (from January 2009) for all issuers. To take into account the potential non-
monotonicity in the relation, we add the square of the variable Tier 1 (or Tier 1 ^ 2), in
speci�cation (3). Although the coe¢ cient on the squared term is negative, it is insigni�cant.
This is likely due to the fact that the increasing regulatory benchmark during our benchmark
window implied issuance needs for most banks. As a consequence, hardly any banks in our
sample were in an �extremely well funded�state, which prevented the non-monotonicity in
the theoretical model from taking e¤ect.
Third, on the asset side of bank balance sheets, the coe¢ cients on both gross loans
and trading securities are negative and signi�cant. A higher value of the trading securities
variable is typically interpreted as an indication of greater risk-taking by a bank (Roengpitya
et al, 2014). Every percentage point increase in trading securities (with an average of 17:8%)
predicts a 0:9 months shortening of the expected duration to �rst issuance.
Fourth, on the liability side, deposits are commonly considered to be a reliable and sticky
source of bank �nancing, as opposed to wholesale funding which is more sensitive to changes
in interest rates and more prone to �runs�in response to negative information about bank
16See, e.g., "Coco bonds: Mass conversion," Economist, September 13th, 2014.
25
pro�tability. Indeed, Huang and Ratnovski (2011) suggest that wholesale funding was one
of the major sources of bank vulnerability during the �nancial crisis. Consistent with their
analysis, we �nd that banks that are predominantly �nanced by deposits are signi�cantly (at
the 5% level) less likely to issue CoCos. The coe¢ cient of 0:810 for deposits suggests that
for every 10-percentage point increase in deposits relative to total assets, a bank waits on
average 8:1 more months before issuing its �rst CoCo. Further breaking down deposits into
customer deposits and bank deposits, we observe that both elements are highly signi�cant.
Finally, column (5) in Panel A shows that an increase in interbank assets has no signi�cant
e¤ect, but that banks more reliant on interbank borrowing are signi�cantly less likely to issue
CoCos. In the interbank market, a few banks tend to play the role of market makers by
channeling the excess deposits of, usually smaller, banks that do not have access to lending
opportunities to medium-sized and larger banks that have ample lending opportunities (Fecht
et al., 2011).
Panel B of Table 2 reports the estimates of a Cox (1972) proportional hazards analysis of
banks�propensity to issue CoCos in each month during our sample period of January 2009 to
December 2015. Here a higher coe¢ cient means a higher probability of issuing a �rst CoCo
in a given month, conditional on no-issuance until the previous month. Each coe¢ cient,
once exponentiated, could be interpreted as an �odds ratio�of issuance by a bank in a given
month.
The results of the Cox hazards analysis mostly reinforce those reported in Panel A: larger
banks, as well as banks with more loans and marketable securities are more likely to issue
26

a CoCo. The opposite is true for banks with more deposits and more interbank borrowing.
Note, however, that Tier 1 capital adequacy no longer matters at the monthly frequency,
except when both Tier 1 and (Tier 1)^2, are included as regressors, suggesting that the
negative relation between core capital and propensity of CoCo issuance is most prominent
among banks with low levels of Tier 1 capital.
Panels C and D of Table 2 break down CoCo issuance into PWD CoCo and MC CoCo
issues at the bank-month level using the Fine and Gray (1999) competing risk model. Under
this model, the �rst issue of a CoCo with a particular loss-absorbing mechanism (PWD or
MC) is considered the realization of one type of risk, with the other possible form of loss-
absorbing mechanism interpreted as a �competing risk.�Accordingly, this model estimates
the propensity to issue a particular type of CoCo instrument, taking into account that
another type of CoCo is also available in the issuer�s choice set.
A �nding that emerges from this analysis is that total assets and Tier 1 tend to be
more consistently signi�cant for PWD CoCos. This �nding is consistent with our theoretical
prediction that CoCos are issued when they primarily bene�t shareholders, but not when
they primarily bene�t senior unsecured debt investors. The larger banks, and the better
capitalized banks, are likely to be more resilient in a crisis. For these banks there is therefore
a low credit risk associated with their senior unsecured debt, and hence a low debt overhang
problem. In other words, most of the potential bene�ts of a CoCo issue go to incumbent
shareholders, who tend to bene�t more from a PWD CoCo issue than from an MC CoCo
issue, since the latter has the potential to dilute the value of their shares upon conversion.
27

4.2 Impact of CoCo Issuance on Senior Debt and Equity
4.2.1 Empirical set-up
The issuance of a CoCo can a¤ect the CDS spread of the issuing bank through two main
channels. First, it reduces the probability of default by providing an additional layer of loss-
absorbing capacity.17 Second, issuing a CoCo a¤ects the risk-taking incentives of the bank�s
management and equity holders, which can alter the probability of default and thereby have
an impact on the riskiness of senior debt. While the second e¤ect could go in either direction
depending on the main CoCo design features, the �rst e¤ect should be weakly bene�cial for
banks�senior debt holders. Overall, CoCo issuance is expected to lower CDS spreads, as our
theoretical analysis suggests.
As we explain in Section 3.4, the e¤ect of issuing a CoCo on the issuer�s stock price is
more di¢ cult to determine, a priori. However, the relative e¤ect of di¤erent CoCo designs
on the issuer�s stock price is easier to pin down. Given that PWD CoCos do not have any
negative equity dilution e¤ects, we expect to see a more positive stock price response to the
issuance announcement of a PWD CoCo than to an MC CoCo.
We assess the announcement e¤ect of issuing CoCos on CDS spreads and equity prices
using two di¤erent empirical approaches. First, we follow the estimation methodology used
in James (1987) to determine the impact of CoCo issuance. In addition to assessing the
overall e¤ect, we also examine how it depends on the main CoCo contract features (loss
absorption mechanism, trigger type, trigger level, etc.) and on issuer characteristics (size,
17As discussed in the Introduction, our analysis is based on the implicit assumption that CoCos are issuedon top of (rather than instead of) CET1.
28

capital cushion over trigger level, G-SIB status, geographical location, etc.).18 Second, we
estimate the impact of CoCo issuance on CDS spreads and equity prices in a standard
cross-sectional regression framework.
The event date for CoCo issuance is not always clearly de�ned. Unlike in other event
studies, where all relevant information is simultaneously announced to all market participants
at a clearly de�ned point in time, for CoCo issues there is no single point in time when an
upcoming issue is publicly announced. Instead, information about an upcoming issue spreads
among market participants in a di¤usion-like process. According to market participants, the
information about the intention of a bank to issue a CoCo is revealed to a small group of
potential buyers over the two weeks prior to the date of the issuance. As the book is built,
the information is likely to di¤use to a wider set of investors and to be incorporated into
equity prices and CDS spreads prior to the actual date of the issue. Still, the issue date
often reveals additional value-relevant information, such as the over-subscription status of
the issue.
Due to the above reasons, we adopt a conservative approach in selecting the event date
and the window size for our benchmark exercise. More concretely, when measuring the
impact of CoCo issuance on CDS spreads, we select an 11-day window (in units of trading
days), which starts ten business days before the issuance date (t-10) and ends at the issuance
date (t): [t-10, t]. When measuring the impact on equity prices, we select a shorter, six-day
window, which starts �ve business days before the issuance date (t-5) and ends at the issuance
date (t): [t-5, t]. We select a shorter event window for equity prices than for CDS spreads
18Appendix A contains a detailed description of the estimation methodology.
29
since the former tend to be more informationally sensitive than the latter. As a result,
equity prices are more likely than CDS spreads to have their reaction to CoCo issuance be
�contaminated�by other information that is revealed during the event window.19
4.2.2 Impact on bank CDS spreads
We estimate the change in issuers�CDS spreads (on senior unsecured debt) around CoCo
issuance dates. Table 3 reports the results of this estimation.
[Insert Table 3 here.]
Our main �nding is that the overall impact of CoCo issuance on the CDS spread of the
issuing bank is negative and strongly statistically signi�cant. The z-value (�2:70) indicates
that the cumulative change vis-à-vis the benchmark during the 11-day event window is
negative and statistically signi�cant at the 1% level.20
The economic signi�cance is also meaningful. The average prediction error (APE) for the
full sample is approximately 3 bps. Once prediction errors are weighted by the (US dollar)
volume of each issue, the estimated impact increases to 5 bps. This implies that issuing a
CoCo reduces the annual interest costs associated with each $10 billion of (non-CoCo) bank
debt by $5 million. Furthermore, the estimated economic impact varies considerably across
CoCo sub-groups, ranging from 2 to 22 bps.
19We also conduct robustness checks, in which we explore a number of alternative window sizes and eventdates. While we do not report those results in the paper due to space constraints, all of them are availableupon request.20The second statistic we examine is the proportion of negative prediction errors. It has a value of 57%
and is statistically signi�cant at the 5% level by the Wilcoxon signed rank statistic.
30

We next break down the full sample into subsamples sorted by the most important CoCo
contract terms and issuer characteristics. Our �rst sorting variable is the loss absorption
mechanism (mandatory conversion or principal write-down). In line with the predictions
of Section 3.4, the impact of mandatory conversion (MC) CoCos on CDS spreads tends
to be considerably stronger than the impact of principal write-down (PWD) CoCos. The
estimated impact of MC CoCo issuance is negative and statistically signi�cant at the 1%
level (with a z-value of �3:07). Roughly two-thirds (63%) of the prediction errors in the MC
CoCo subsample have a negative sign and the Wilcoxon signed rank statistic is statistically
signi�cant at the 1% level. The coe¢ cient for the impact of PWD CoCo issuance has the
right (negative) sign, but it is not statistically signi�cant (according to both, the z-statistic
and the Wilcoxon signed rank statistic).
In economic terms, the size of the estimated impact of MC CoCo issuance on CDS
spreads is also considerably larger than the impact of PWD CoCo issuance. The simple
average prediction error for MC CoCos (�5:0 bps) is roughly three and a half times higher
than that for PWD CoCos (�1:4 bps). When we weight prediction errors by the size of each
respective CoCo issue, the estimated impact of issuing MC CoCos is �8:4 bps, whereas the
impact of issuing PWD CoCos is �2:4 bps.
The signi�cant di¤erences between the estimated impacts of issuing MC CoCos and
PWD CoCos on the CDS spread of the issuing bank points in particular to the potential
importance of the loss absorption mechanism for banks� risk-taking incentives. The MC
feature increases the cost of risk-taking for current shareholders and management due to
31

the threat of equity dilution. But, no such costs are imposed by PWD CoCos. On the
contrary, PWD CoCos actually increase the risk-taking incentives of shareholders, as PWD
CoCo holders could absorb losses ahead of shareholders. Thus, in the case of PWD CoCos,
the risk-taking incentive e¤ect works in the opposite direction of the loss absorption e¤ect
(which has a negative impact on CDS spreads for both loss absorption mechanisms). In
contrast, the two e¤ects reinforce each other in the case of MC CoCos.
A second major �nding is that the presence of a mechanical trigger in CoCo term sheets
plays a very important role. The estimated impact of issuing a CoCo with a mechanical
trigger is negative and statistically signi�cant at the 5% level (with a z-value of �2:22).
That subsample of CoCos has an average prediction error of �3:3 bps and weighted average
prediction error of �4:8 bps. In contrast, the estimated impact of issuing a CoCo that only
has a discretionary trigger, while also negative, is not statistically signi�cant.
There are a number of explanations for this key �nding. CoCos with only a discretionary
trigger are more akin to pure "gone concern" instruments and inherit all the uncertainties
associated with regulatory intervention in a bank resolution. At what point will the CoCo
be triggered? What happens in resolution? Will the CoCo be totally or partially wiped out?
Will it be the only debt instrument to be bailed in? All of these uncertainties compound to
make the valuation of the CoCo and assessing the impact of the CoCo issue on the value
of senior unsecured debt very di¢ cult. In contrast, CoCos that also have a mechanical
trigger combine features of both �gone concern� and �going concern� instruments. As a
consequence, such CoCos are likely to absorb losses earlier, which is desirable from the
32

perspective of senior unsecured bondholders.
The level of the mechanical trigger is also important for the CDS market reaction. The
estimated impact of issuing CoCos with a high trigger (above the minimum trigger for AT1
classi�cation of 5:125%) on CDS spreads is negative and statistically signi�cant at the 10%
level. The estimated impact of CoCos with a low trigger (less than or equal to 5.125%) is also
negative, but is not statistically signi�cant. CoCos with a high trigger are closer to "going
concern" CoCos, as they are more likely to convert before the PONV than low-trigger CoCos.
Thus, they provide higher-quality protection to unsecured bondholders of the CoCo-issuing
bank.
A third major result is that the impact of CoCo issuance on CDS spreads is a¤ected by the
interaction of the main CoCo design features. Namely, MC CoCos with a mechanical trigger
have a negative and statistically signi�cant impact, whose magnitude (-6.2 bps) is greater
than those of the respective one-dimensional subcategories (MC CoCos and CoCos with a
mechanical trigger). This implies that the above two characteristics interact with each other
to boost the impact of CoCos on CDS spreads. Intuitively, the combination of reduced risk-
taking incentives (associated with the MC feature) and automatic loss absorption (associated
with the mechanical trigger feature) provide the greatest degree of protection for senior
unsecured debt holders. Meanwhile, the impact of MC CoCos with a discretionary trigger is
also negative, but it is only statistically signi�cant at the 10% level and its magnitude (�1:5
bps) is considerably smaller.
33
A fourth important �nding is that the size of the CoCo issue (as a share of RWA) also
matters. Large CoCo issues have a negative and statistically signi�cant (at the 5% level)
impact on CDS spreads, but small issues have no statistically signi�cant e¤ect. The weighted
average impact on the issuing bank�s CDS spread is considerably higher for relatively larger
issues (�7:2 bps) than for relatively smaller issues (�1:7 bps). This is not surprising. The
larger the issue, the thicker the layer of protection that CoCos provide to the senior unsecured
bondholders. Moreover, the fact that the bank was able to place a relatively large issue in
itself reveals that investors have con�dence in the overall healthiness of the bank.
The regulatory classi�cation of CoCo instruments also plays an important role. AT1
CoCos have a negative and highly signi�cant (at the 1% level) impact on CDS spreads. In
contrast, the impact of T2 CoCos is insigni�cant. The weighted average prediction error
for AT1 CoCos is �6:7 bps, whereas that for T2 CoCos is only �0:4 bps. Intuitively, the
enhanced design features associated with the higher quality AT1 capital instruments provide
better protection for the senior creditors of the issuing bank.
Our results also suggest that CoCo issuance tends to have a bigger e¤ect on the CDS
spreads of relatively smaller issuers. The impact of CoCos issued by banks with total assets
of less than $1 trillion is negative and statistically signi�cant at the 1% level. In contrast,
the impact of CoCo issuance on CDS spreads tends to be insigni�cant for banks whose total
assets exceed $1 trillion. Splitting banks according to their G-SIB classi�cation generates
similar results.21 That is, the impact of CoCos issued by banks that are not classi�ed as
21For the latter data split, we classify CoCo-issuing banks according to their G-SIB status at the time ofCoCo issuance (for G-SIB lists by year, see FSB (2016)).
34

G-SIBs is highly signi�cant while the impact of CoCos issued by G-SIBs is not statistically
signi�cant. This latter �nding could be interpreted as indicating that market participants
believe that only G-SIBs bene�t from an implicit government guarantee.
We turn next to the results of our cross-sectional regression analysis of the impact of
CoCo issuance on CDS spreads. These results, reported in Table 4, are in line with the
results obtained using the James (1987) methodology.
[Insert Table 4 here.]
The �rst set of cross-sectional regressions examines the e¤ect of the loss absorption mech-
anism (Table 4, Panel A). In line with the results obtained using the James (1987) method-
ology, the main �nding is that the impact of MC CoCo on CDS spreads is much more
negative and signi�cant than that of PWD CoCos (speci�cation (1)). In the baseline spec-
i�cation, the impact of MC CoCos is negative and statistically signi�cant at the 5% level.
Once additional dummy controls are included, the impact of MC CoCos is still negative
and statistically signi�cant at the 5% level for AT1 instruments (speci�cation (2)) and for
repeat issuers (speci�cation (4)). In contrast, the estimated impact of PWD CoCos is not
statistically signi�cant in any of the examined speci�cations.
The second set of results provides insights into the impact of the trigger type (Table 4,
Panel B). In line with the results obtained using the James (1987) methodology, the impact
of CoCos with mechanical triggers is negative and statistically signi�cant at the 5% level
(Column 1). In contrast, the impact of CoCos that only have a discretionary trigger is
not statistically signi�cant. The negative impact of mechanical-trigger CoCos appears to
35

be stronger for non-G-SIBs (Column 2) and for repeat issuers (Column 3). In sum, CoCos
are most likely to be bene�cial to senior unsecured bondholders if their automatic loss-
absorption feature is combined with a thicker layer of protection (as in the case of repeat
issuers) or with an issuer that is not systemically important (as in the case of non-G-SIBs).
The last regression in Panel B examines two-dimensional splits of the main CoCo design
features (Column 4). They indicate that the impact of MC CoCos with a mechanical trigger
(MC/MT CoCos) is negative and statistically signi�cant at the 5% level. The impacts of
the other three CoCo types (MC/DT, PWD/MT, PWD/MT) are also negative, but not
statistically signi�cant.
The third set of regressions investigates the e¤ect of changing the level of the mechanical
trigger (Table 4, Panel C). The estimates from the baseline speci�cation indicate that both
high-trigger and low-trigger CoCos have a negative impact, which is statistically signi�cant
at the 10% level (Column 1). The speci�cations with additional dummy controls reveal that
the high-trigger CoCos of repeat issuers have a negative and strongly statistically signi�cant
(at the 1% level) impact (Column 3). In contrast, the impact of repeat issuers�low-trigger
CoCos is statistically signi�cant only at the 10% level. Interestingly, the impact of �rst-time
issuers�CoCos is not statistically signi�cant, regardless of the trigger level. One possible
explanation for these results is that the early loss absorption feature of high-trigger CoCos
has a larger impact for repeat issuers, since they increase the size of the already existing layer
of protection that CoCos provide for senior unsecured debt, making CoCos a more potent
loss absorption tool. This hypothesis is further supported by the fact that the coe¢ cient on
36

the issued CoCo amount (as a share of RWA) in the same regression speci�cation is negative
and statistically signi�cant.
4.2.3 Impact on bank equity prices
Our theoretical analysis does not yield clear-cut predictions on the e¤ects of CoCo issuance
on equity prices. That said, we should expect PWD CoCos to have a more positive e¤ect on
stock price than MC Cocos, all else equal, because they are more protective of shareholders.
Table 5 reports the results using the same methodologies as in Table 3, but replacing CDS
spreads with stock prices as an independent variable. For the overall sample, the impact of
CoCo issuance is not statistically signi�cant. This most likely re�ects the same ambiguity
that we discuss in our theoretical predictions. The results for the one-dimensional subsample
splits along the main CoCo design features (loss absorption mechanism, trigger type, trigger
level) are also insigni�cant.
[Insert Table 5 here.]
The two-dimensional subsample splits generate the most interesting results for the impact
of CoCo issuance on equity prices. The most important �nding is that issuing a PWD CoCo
with a high trigger has a positive and statistically signi�cant (at the 5% level) impact on
the equity price of the issuing bank. The combination of (i) the early loss absorption feature
associated with high-trigger CoCos and (ii) the fact that PWD CoCo holders absorb losses
ahead of equity holders appears to explain this result. Conversely, the impact of high-
trigger MC CoCos on equity prices is negative, albeit not statistically signi�cant. A likely
37

explanation for this result is that the e¤ect of possible dilution of equity holders may be
(partially) o¤set by the e¤ect of owning shares in a bank that is better capitalized and more
stable as a result of the CoCo issuance. The fact that the estimated impact of high-trigger
MC CoCos goes in the opposite direction to that of high-trigger PWD CoCos also explains
why the overall impact of high-trigger CoCos (from the one-dimensional sample splits) is
insigni�cant.
Finally, we examine the impact of CoCo issuance on equity prices in cross-sectional
regressions. The main results, which are presented in Table 6, are in line with the ones
obtained using the James (1987) methodology. When examined on a stand-alone basis, the
main CoCo design features (loss absorption mechanism, trigger type, trigger level) do not
have a statistically signi�cant impact on equity prices.
[Insert Table 6 here.]
The regression speci�cations that include two-dimensional (CoCo design feature) dum-
mies generate the most interesting and statistically signi�cant results (Columns 1-3). Just as
for the estimates generated using the James (1987) methodology, the cross-sectional regres-
sion coe¢ cients imply that the impact of PWD CoCos with a high trigger on equity prices
is positive and statistically signi�cant (at the 5% level). Furthermore, the impact of PWD
CoCos with a mechanical trigger is also positive and statistically signi�cant (Columns 4-5).
However, its estimated magnitude is somewhat smaller than the one for PWD CoCos with a
high trigger. Thus, the positive impact of PWD CoCos on stock prices appears to be present
for all PWD CoCos with a mechanical trigger. Nevertheless, it is stronger for high-trigger
38
PWD CoCos (which absorb losses relatively early) than for low-trigger PWD CoCo (which
absorb losses relatively late).
5 Conclusion
Overall, our analysis indicates that CoCos can contribute to reducing bank fragility. The
CoCo market is no longer a small niche market. Although CoCos are deemed to be complex
by many commentators, possibly too complex for retail investors, there appears to be a
su¢ ciently large institutional investor clientele that stands ready to hold them. One reason
why CoCos are perceived to be so complex is that there is a great variety of CoCo designs,
as we have shown. What is more, the designs that have been chosen by issuers are quite
di¤erent from those recommended by the large theoretical literature on CoCos (e.g., Albul et
al (2013), Chen et al (2017), Glasserman and Nouri (2016), Pennacchi and Tchistyi (2016a,
2016b), Chan and van Wijnbergen (2016)).
The change in the mix of CoCo designs is primarily driven by a combination of exper-
imentation, issuer incentives and investor demand. Now that the CoCo market is reaching
maturity, it is important to �nd out which designs are desirable and which ones are not from
a �nancial stability point of view, as well as where CoCo design can possibly be simpli�ed
with a view to standardizing this market.
Our study provides a �rst set of answers to these questions. One of our important �ndings
is the shift over time from MC to PWD CoCos. Our other results suggest that this shift is
driven by shareholder preferences, as the announcement e¤ect of PWD CoCos on stock price
39

is positive. This shift is also driven by �xed income investor clienteles, who prefer to hold
pure �xed income products rather than hybrids, other things equal.
But is this a desirable development from a �nancial stability perspective? We have
shown that the issuance of MC CoCos has a stronger impact on CDS spreads, which may
suggest that MC CoCos have a superior design from the point of view of reducing bank
fragility. However, we have also shown that shareholder risk-taking incentives tend to be
stronger for instruments with PWD features. This points to a trade-o¤ in terms of the
combined e¤ects of contractual features and overall issuance volumes for �nancial stability
that any e¤orts to standardize CoCo instruments would have to take into account. Other
potential avenues for standardization include: (i) reconsidering the bene�ts of CoCos with
only discretionary triggers; (ii) requiring higher triggers, so that CoCos are more like "going
concern" than "gone concern" instruments; (iii) revisiting the merits of T2 CoCos; (iv)
considering whether to increase CoCo requirements with the goal of increasing their overall
loss-absorbing capacity.
We have explored only a subset of questions on the e¤ects of CoCos on issuing banks�
balance sheets. An important open question for the immediate future concerns the investor
clientele of CoCos. Unfortunately, the lack of information on the buy side makes it di¢ cult
to know the distribution of CoCo holdings and assess whether CoCos reduce rather than
redistribute risks in the banking system. CoCos would enhance the stability of issuing
banks and the banking system at large only if the holders of CoCos were long-term investors
unconnected to the banking system.
40

References
[1] Admati, Anat, Peter DeMarzo, Martin Hellwig, and Paul P�eiderer, 2013. Fallacies,
irrelevant facts and myths in the discussion of capital regulation: Why bank equity is
not expensive. Rock Center for Corporate Governance at Stanford University Working
Paper No. 161.
[2] Albul, Boris, Dwight M. Ja¤ee, and Alexei Tchistyi, 2013. Contingent convertible bonds
and capital structure decisions. Unpublished working paper.
[3] Alessandri, Piergiorgio, and Andrew Haldane, 2009. Banking on the State. Bank of
England, 9 November 2009.
[4] Avdjiev, Stefan, Anastasia Kartasheva, and Bilyana Bogdanova, 2013. CoCo: A primer.
BIS Quarterly Review, September.
[5] Basel Committee on Banking Supervision, 2011. Basel III: A global regulatory frame-
work for more resilient banks and banking systems, June 2011.
[6] Berg, Tobias, and Christoph Kaserer, 2015. Does contingent capital induce excessive
risk-taking. Journal of Financial Intermediation 24, 356-385.
[7] Bolton, Patrick, and Frederic Samama, 2012. Capital access bonds: Contingent capital
with option to convert, Economic Policy 27, 275-317.
[8] Bolton, Patrick, Hamid Mehran, Joel Shapiro, 2015. Executive compensation and risk
taking. Review of Financial Studies 6, 2139�2181.
41

[9] Bond, Philip, Itay Goldstein and Edward Simpson Prescott 2010. Market-based correc-
tive actions. Review of Financial Studies 23, 781�820.
[10] Bulow, Jeremy and Paul Klemperer, 2014. Equity recourse notes: Creating counter-
cyclical bank bapital. CEPR Discussion Paper No. DP10213.
[11] Caballero, Ricardo and Pablo Kurlat, 2008. The Surprising�Origin and Nature of Fi-
nancial Crises: A Macroeconomic Policy Proposal. 2008 Economic Symposium, "Main-
taining Stability in a Changing Financial System." Federal Reserve Bank of Kansas
City.
[12] Calomiris, Charles W., and Richard J. Herring, 2013. How to Design a Contingent
Convertible Debt Requirement That Helps Solve Our Too-Big-to-Fail Problem. Journal
of Applied Corporate Finance 25, 39-62.
[13] Chan, Stephanie, and Sweder van Wijnbergen, 2016. Coco Design, Risk Shifting and
Financial Fragility. Unpublished working paper.
[14] Chen, Nan, Paul Glasserman, Behzad Nouri, and Markus Pelger, 2017. Contingent
capital, tail risk, and debt-induced collapse. Review of Financial Studies, forthcoming.
[15] Co¤ee Jr, John C, 2011. Systemic risk after Dodd-Frank: Contingent capital and the
need for regulatory strategies beyond oversight. Columbia Law Review 111, 795�1878.
[16] Cox, David R., 1972. Regression Models and Life Tables. Journal of the Royal Statistical
Society, Ser. B, 34, 187-220.
42

[17] Du¢ e, Darrel, 2009. Contractual methods for out-of-court restructuring of systemically
important �nancial institutions. Submission requested by the US Treasury Working
Group on Bank Capital, November 9.
[18] European Banking Authority (EBA), 2016. Report on the implementation and design
of MREL framework, 14 December 2016.
[19] Faure-Grimaud, Antoine, 2002. Using Stock Price Information to Regulate Firms. Re-
view of Economic Studies 69, 169 - 190.
[20] Fecht, Falko, Kjell G. Nyborg, and Jorg Rocholl, 2011. The price of liquidity: The
e¤ects of market conditions and bank characteristics. Journal of Financial Economics
102, 344-362.
[21] Financial Stability Board, 2016. 2016 list of global systemically important banks (G-
SIBs), 21 November 2016.
[22] Financial Stability Board, 2015. Principles of loss-absorbing and recapitalization capac-
ity of G-SIBs in resolution, 9 November 2015.
[23] Fine, J. and Gray, R., 1999. A Proportional Hazards Model for the Subdistribution of
a Competing Risk. Journal of the American Statistical Association 94, 496�509.
[24] FINMA, 2015, New "too big to fail" capital requirements for global systemically impor-
tant banks in Switzerland, Swiss Financial Market Supervisory Authority, 21 October
2015.
43

[25] Flannery, Mark J., 2005. No pain, no gain? E¤ecting market discipline via reverse con-
vertible debentures. In: Hal S. Scott (Ed.), Capital Adequacy Beyond Basel: Banking,
Securities, and Insurance.
[26] Flannery, Mark J., 2016. Stabilizing large �nancial institutions with contingent capital
certi�cates. Quarterly Journal of Finance 6, 1-26.
[27] Glasserman, Paul, and Behzad Nouri, 2016. Market-Triggered Changes in Capital Struc-
ture: Equilibrium Price Dynamics. Econometrica 84, 2113-2153.
[28] Glasserman, Paul, and Enrico Perotti, 2017. The unconvertible CoCo Bonds. In: Achiev-
ing Financial Stability: Challenges to Prudential Regulation, 317-329.
[29] Hillion, Pierre and Theo Vermaelen, 2004. Death spiral convertibles. Journal of Financial
Economics 71, 381-415.
[30] Hilscher, Jens, and Alon Raviv, 2014. Bank stability and market discipline: The e¤ect of
contingent capital on risk taking and default probability. Journal of Corporate Finance
29, 542�560.
[31] Huang, Rocco, and Lev Ratnovski, 2011, The dark side of bank wholesale funding.
Journal of Financial Intermediation 20, 248-263.
[32] James, Christopher, 1987. Some evidence on the uniqueness of bank loans. Journal of
Financial Economics 19, 217-235.
44
[33] Kashyap, Anil K, Raghuram G Rajan, and Jeremy C Stein. 2008. Rethinking Capital
Regulation. 2008 Economic Symposium, "Maintaining Stability in a Changing Financial
System." Federal Reserve Bank of Kansas City.
[34] Martynova, Natalya, and Enrico Perotti, 2015. Convertible bond and bank risk-taking.
Dutch National Bank Working Paper No. 480, August.
[35] McDonald, R. 2013. Contingent capital with dual price trigger. Journal of Financial
Stability 9, 230-241.
[36] Pennacchi, George, Theo Vermaelen, and Christian C.P. Wol¤, 2014. Contingent Capi-
tal: The case of COERCs. Journal of Financial and Quantitative Analysis 49, 541�574.
[37] Pennacchi, George, and Alexei Tchistyi, 2016a. A Reexamination of contingent convert-
ibles with stock price triggers. Unpublished working paper.
[38] Pennacchi, George, and Alexei Tchistyi, 2016b. On equilibrium when contingent capital
has a market trigger: A correction to Sundaresan and Wang Journal of Finance (2015).
Unpublished working paper.
[39] Raviv, Arthur, 2004. Bank stability and market discipline: debt-for-equity swap versus
subordinated notes. Unpublished working paper.
[40] Roberts, Michael R. and Amir Su�, 2009. Financial Contracting: A Survey of Empirical
Research and Future Directions. Annual Review of Financial Economics 1, 207-226.
45

[41] Roengpitya, Rungporn, Nikola Tarashev, and Kostas Tsatsaronis, 2014. Bank business
models. BIS Quarterly Review, December.
[42] Sundaresan, Suresh, and Zhenyu Wang, 2015. On the design of contingent capital with
a market trigger. Journal of Finance 70, 881�920.
[43] Squam Lake Working Group on Financial Regulation (2009). An expedited resolution
mechanisms for distressed �nancial �rms: regulatory hybrid securities. Squam Lake
Working Group, Council on Foreign Relations, April.
[44] Vallee, Boris, 2016. Contingent Capital Trigger E¤ects: Evidence from Liability Man-
agement Exercises. Unpublished working paper.
[45] Zeng, Jing, 2013. Contingent Capital Structure. Unpublished working paper.
46

Appendix A: Impact of CoCo Issuance - Empirical Method-
ology
We conduct our empirical analysis of the impact of CoCo issuance on CDS spreads and
equity prices in two steps.
In the �rst part, we employ the event methodology used in James (1987). The prediction
error associated with CoCo instrument j on day t is de�ned as:
PEjt = Rjt � (�j + �jRmt);
where Rjt is the equity return or the change in the CDS spread on day t of the bank that
has issued CoCo instrument j; Rmt is the return on the benchmark equity or CDS index on
day t; �j and �j are the estimated coe¢ cients from a CAPM over an estimation period of
200 business days that excludes the 40 business days centered around the event date.
The cumulative prediction error (CPE) of CoCo instrument j over an event window
(t0 � T; t0) is given by:
CPEj =
t0Xt=t0�T
PEjt;
and the average cumulative prediction error (ACPE) over a sample of CoCo instruments of
size N is:
ACPE =1
N
NXj=1
CPEj:
Tests of statistical signi�cance are based on cumulative standardized prediction errors
47
(CSPE) over the event window (t0 � T; t0) that account for the number of days in the
estimation period and the length of the event window so as to control for the increase
in variance from prediction outside the estimation period. The cumulative standardized
prediction error for bank j over the event window (t0 � T; t0) is de�ned as:
CSPEj =
t0Xt=t0�T
PEjtSjt
;
where
Sjt =
"TV 2
j
"1 +
1
M+
(Rmt � �Rm)2PM
i=1(Rmi � �Rm)2
## 12
and M is the number of business days in the CAPM estimation, V 2j is the variance of the
residual in CoCo instrument j�s CAPM regression and �Rm is the mean market return over
the estimation period.
The average cumulative standardized prediction error (ACSPE) over the event window
(t0 � T; t0) is:
ACSPE =1
N
NXj=1
CSPEj:
Assuming the individual prediction errors are independent across instruments, the Z
statistic
Z =pN(ACSPE)
is distributed as N(0; 1) under the null hypothesis that the average cumulative standardized
prediction error equals 0.
48

In the second part of our empirical examination of the impact of CoCo issuance on
CDS spreads and equity prices, we estimate multivariate cross-sectional regressions. More
precisely, we focus on the following speci�cation:
CPEj = �j + �jXj;+uj;
where CPEj are the cumulative prediction errors (de�ned above) over the event window
(t0 � T; t0) and Xj is a set of characteristics of the instrument and the issuing bank. More
concretely, we focus on the main CoCo contractual features such as the loss absorption
mechanism, the trigger type, and the trigger level. In order to properly account for multiple
issuance by a single bank over the sample period, we use clustered regressions, assuming that
the errors are independent across banks, but allowing them to be correlated within banks.
49

Appendix B: A simple analytical framework
The model
It is helpful to consider the incentives of a bank to issue a CoCo in a simple formal analytical
framework. The formal analysis can also clarify the e¤ects of the CoCo issuance on the value
of other bank�s claims and its incentives to take risk.
We take as given the balance sheet of the bank at date 0, and we consider a two-period
model. On the asset side, the bank has assets in place with book value A. Except for an
aggregate risk exposure with two states of the world - a crisis state and a boon state - these
are well diversi�ed assets. They yield positive earnings � at t = 1 in the boon state, which
occurs with probability (1 � �), and a positive loss l in the crisis state with probability �.
Under risk-neutral preferences (or probabilities) the ex ante market value of the bank�s assets
is then
A[1 + � � �(l + �)]:
On the liability side, the bank has deposits with face value D and senior unsecured debt
with face value B. The bank�s equity is therefore given by E = A[1 + �� �(l+ �)]�D�B,
and its equity to capital ratio is
�0 =E
A[1 + � � �(l + �)]:
We denote the required capital ratio by � and take it that �0 � �, but that, following a loss
50

at date 1, the bank may be in a situation where �1 < �:
At date 0, the bank can issue a CoCo instrument with face value C and a capital-ratio
trigger ~�, with � � ~� < �0. Should the bank�s equity-capital ratio fall below a trigger ~�, the
CoCo instrument reduces bank debt and improves the bank�s equity-capital ratio by either
converting into equity or through a principal write-down.
Consider �rst how conversion to equity CoCos (MC CoCos) work. These instruments
stipulate that the investor gets a fraction � > 0 of the bank�s equity when the bank�s equity-
capital ratio falls below ~�; and receives the coupon payment P when the capital ratio is
above ~�: We shall restrict attention to situations where the CoCo trigger may be breached
only if the bank incurs a loss at date 1. In that state of the world the pre-conversion equity
value is given by
El = A(1� l)� (D +B + C)
and conversion is triggered if
ElA(1� l)
< ~�.
Post conversion equity value is
E1c = maxf0; A(1� l)� (D +B)g,
and CoCo holders receive a fraction � of this value. Old equity holders are diluted upon
51

conversion by CoCo holders if and only if E1c > 0 and
� > �c =C
E1c.
Note that if the terms of the MC CoCo are such that equity holders are diluted, � > �c,
then the price of the MC CoCo at date 0 is greater than the par value C.
In contrast, if � < �c then equity holders bene�t from the conversion of CoCos, and
CoCo holders are negatively a¤ected by conversion triggered by the loss l. In that case, the
date 0 price of the MC-CoCo is less than the par value C.
Consider next principal write-down CoCos (PWD CoCos). These instruments stipulate
a principal and a coupon payment P as long as the bank�s equity-capital ratio is above ~�.
Should the trigger ~� be breached, however, then the repayment terms are reduced to �C,
where 1 > � � 0. By design, shareholders cannot be diluted by conversion of PWD CoCo
holders. On the contrary, shareholder value always increases upon conversion of a PWD
CoCo, and it is decreasing in �. Therefore, the price of a PWD CoCo at date 0 is always
less than the par value C. Note that PWD CoCos can be viewed as a special case of MC
CoCos with � = 0.
Determinants of CoCo issuance
The leading regulatory motivation for CoCos is the bail-in mechanism: conversion of a CoCo
avoids a costly recapitalization at date 1, following the realization of the loss l. Consider
52

this capital strengthening motivation for CoCos and suppose that
A(1� l)� (D +B)
A(1� l)< �.
Following the realization of a loss at date 1, the bank must then either be recapitalized or
some debt must be bailed in.
Going-concern CoCos and the recapitalization of a well capitalized bank. First, we con-
sider the case when the loss l is small enough that:
A(1� l)� (D +B) > 0.
That is, the bank can be recapitalized without any bail-in (as the point of non-viability or
PONV has not yet been reached). To reduce the number of cases to consider, we also assume
that B is large enough that
A(1� l)�D
A(1� l)> �.
Recapitalization of a bank that has not reached the PONV can be done by either (i) shrinking
the bank�s balance sheet, (ii) reducing debt or (iii) raising new equity. Suppose that the bank
issues a CoCo in order to be able to reduce its senior unsecured debt in the loss state to the
point B̂ such that
A(1� l)� (D + B̂)
A(1� l)= �.
Let F denote the amount raised by the bank issuing an MC CoCo at date 0, and suppose
53
without loss of generality that the bank uses these proceeds to reduce its senior unsecured
debt from B to B̂ = B � F , so that it is just able to meet its capital requirements following
a loss in the crisis state.
Under Modigliani-Miller assumptions, this MC-CoCo is worth
F = (1� �)C + ��[A(1� l)� (D +B � F )],
or
F =(1� �)C + ��[A(1� l)� (D +B)]
1� ��.
And (C; �) are such that
(D +B)� (1� �)C = A(1� l)(1� �(1� ��)).
In a Modigliani-Miller world there are no issuance costs, so that all banks at risk of a
future recapitalization would weakly prefer to issue a CoCo. In practice, however, banks
face CoCo issuance costs that are given by a combination of underwriting fees and negative
�nancial market reaction to the CoCo issue (the market may interpret issuance of a CoCo
as a signal of �nancial weakness of the issuing bank). This can be modeled in a simple way
by assuming that investors overestimate the true size of potential losses: When true losses
are l, they believe the losses to be equal to �l, where � > 1. A CoCo issuer will then incur
an expected issuance cost of:
��Al(�� 1):
54

The bank compares the expected issuance costs of a CoCo to the alternative of recapi-
talizing the bank following a loss (to meet its minimum equity-capital constraint) through
asset sales. The bank then sells � of its assets at a discounted (�re-sale) price ��, where
� < 1 and uses the proceeds to retire some of its senior unsecured debt B, so that its new
equity-capital ratio becomes
A(1� l)� (D +B � ��)
A(1� l)�� � �.
Such a recapitalization is also costly for shareholders, as they incur the �re-sale cost (1��)�.
The ex ante expected �re-sale costs are
�(1� �)�,
where � is given by
� =D +B � A(1� l)(1� �)
�+ �.
The CoCo issuance cost is set against the expected bene�t of avoiding a costly recapi-
talization in a crisis. Thus, shareholders of a well capitalized bank are better o¤ issuing a
CoCo if:
�Al(�� 1) < (1� �)
�D +B � A(1� l)(1� �)
�+ �
�.
Issuing a CoCo is more attractive to shareholders, the less the CoCo issue is underpriced by
the market, the lower the fraction of equity promised to CoCo investors upon conversion,
55

and the higher the asset sales discount at the time of �nancial distress.
These predictions are broadly robust to the design of the CoCo instrument and also apply
to PWD CoCos. An important di¤erence between an MC CoCo and a PWD CoCo for a
bank issuer is that the latter is less likely to be undervalued by the market. First, the loss
upon conversion is contractually speci�ed and, therefore, less likely to be overestimated by
investors. Second, a PWD CoCo is a 100% �xed income security, which is more straight-
forward to value and which has greater appeal to institutional investors specializing in �xed
income investments.
Gone-concern CoCos and recapitalization of a PONV bank. Next, we consider the case
when the loss l is such that shareholders anticipate to be wiped out in the crisis state,
A(1� l)� (D +B) � 0.
We assume that the restructuring then involves bail-in of the senior unsecured debt. In
practice, there are many di¤erent ways of restructuring a PONV bank. Moreover, the re-
structuring burden will not necessarily be entirely borne by senior unsecured debt. Much of
our analysis, however, is not a¤ected by how a PONV bank is restructured. When sharehold-
ers anticipate a large loss l that wipes them out in the crisis state then they do not bene�t
from a CoCo issue. However, CoCo issuance may bene�t the holders of senior unsecured
debt.
The empirical predictions of the model about a bank�s propensity to issue CoCos then
depend on the design of the CoCo contract, and the ex ante probability that the bank�s
56

losses are low enough that the bank remains a going concern, or that they are so high that
the bank is a gone concern following the realization of the loss l. The better capitalized a
bank is, the lower the probability that it could become a gone concern, and the stronger its
shareholders�incentives to issue a CoCo, especially a PWD CoCo. Shareholders of banks
that anticipate reaching a PONV following the realization of the loss l, however, have no
incentives to issue a CoCo.
CoCo issuance and banks�risk-taking incentives
Next we analyze how CoCo issuance a¤ects banks�incentives to engage in risk-taking ac-
tivities. Consider the bank�s incentive post-CoCo issuance to invest in a project that has a
mean return of zero but provides a positive return � in the boon state and a negative return
� in the crisis state,
�(1� �)� � = 0.
Suppose that the loss l̂ in the crisis state is such that
A(1� l̂)� (D +B)
A(1� l̂)� �.
Would the CoCo issuer have an incentive to make the same bet as above if it now means
that
A(1� l̂ � )� (D +B)
A(1� l̂)< �?
Under an MC CoCo, the bank shareholders would have no incentive to take this risk if
57

the CoCo is su¢ ciently dilutive. Furthermore, the incentives to engage in risk-taking will be
lower the higher the trigger ratio at which the MC CoCo converts into equity. In contrast,
under a PWD CoCo, the shareholders would have a strict incentive to take this bet as it
would allow them to gain something both in the boon state (�) and in the crisis state (B�B̂).
CoCo issuance and the value of other bank claims
The e¤ect of a CoCo issue should be to lower credit default swap spreads, given that the
probability of the worst outcome of a haircut imposed on senior unsecured debt is decreased
by the CoCo issuance. It should also result in a (weak) increase in the value of senior
unsecured bonds, given that the bank is better capitalized after the CoCo issue.
The predicted stock price reaction, however, is harder to pin down. CoCo issuance
induces both a positive e¤ect on the expected value of the bank (due to the lower risk of
recapitalization at �re-sale prices) and a negative signaling impact about potential losses
(when there is asymmetric information about the size of potential losses between the bank�s
managers and investors).
Consider the situation in which the bank may face three types of losses in a crisis,
l 2 flL; lH ; lHHg. If expected losses in the crisis state are low, lL, then the bank remains
robustly capitalized even after incurring these losses
A(1� lL)� (D +B)
A(1� lL)� �.
If the losses are larger, lH , then the bank will need to recapitalize in the midst of the crisis,
58

but its PONV is not reached,
0 <A(1� lH)� (D +B)
A(1� lH)< �.
And if the losses are very large, lHH ,
A(1� lHH)� (D +B)
A(1� l̂)< 0,
then the bank reaches the PONV.
Suppose that the bank is privately informed about its losses in the crisis, but investors do
not know the true size of losses l 2 flL; lH ; lHHg. Investor beliefs are given by pL = Pr(l = lL),
pH = Pr(l = lH), and pHH = Pr(l = lHH). In addition, investors believe the losses to be
equal to �l, where � > 1, when in fact they are only equal to l. The bank�s managers do
know the true value of l. The managers�remuneration is tied to the future share value of
the bank so that their objective is to maximize the date 1 value of the bank�s equity.
In this situation, the bank with losses lHH or lL has no incentives to issue a CoCo. In the
former case, the CoCo issuance only bene�ts senior unsecured bondholders and has no value
for shareholders, as their equity is wiped out in the crisis state. In the latter case, the bank
does not face a risk of recapitalization in the crisis and would avoid a costly CoCo issuance.
A partially separating equilibrium may then be obtained at date 0 in which a bank type
with losses lH issues a CoCo and bank types lL and lHH do not. The announcement of the
CoCo can then trigger a positive or a negative stock price reaction depending on prior beliefs
59
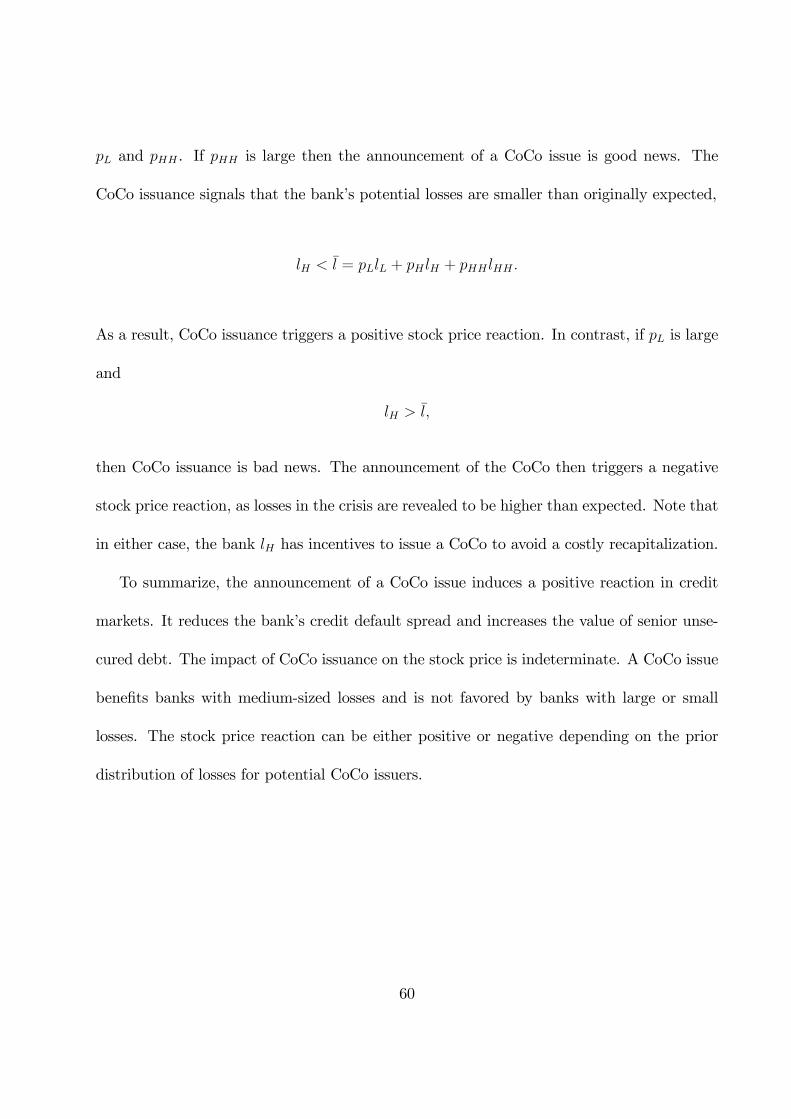
pL and pHH . If pHH is large then the announcement of a CoCo issue is good news. The
CoCo issuance signals that the bank�s potential losses are smaller than originally expected,
lH < �l = pLlL + pH lH + pHH lHH :
As a result, CoCo issuance triggers a positive stock price reaction. In contrast, if pL is large
and
lH > �l;
then CoCo issuance is bad news. The announcement of the CoCo then triggers a negative
stock price reaction, as losses in the crisis are revealed to be higher than expected. Note that
in either case, the bank lH has incentives to issue a CoCo to avoid a costly recapitalization.
To summarize, the announcement of a CoCo issue induces a positive reaction in credit
markets. It reduces the bank�s credit default spread and increases the value of senior unse-
cured debt. The impact of CoCo issuance on the stock price is indeterminate. A CoCo issue
bene�ts banks with medium-sized losses and is not favored by banks with large or small
losses. The stock price reaction can be either positive or negative depending on the prior
distribution of losses for potential CoCo issuers.
60

Table 1. CoCo Issuance, 2009–15 This table reports the amount issued (in billions of US dollars) of CoCos that (i) were issued by banks between January 2009 and December 2015 and (ii) have at least one (mechanical or discretionary) contractual trigger. The number of issues is indicated in parentheses. Individual subcategories do not always add up to the respective reported totals due to missing data and/or rounding. The G-SIB designation refers to a global systemically important bank. The trigger threshold of 5.125% is the minimum required for a CoCo to qualify as additional tier 1 (AT1) capital under Basel III. Sources: Bloomberg; Dealogic.
GSIB designation Loss absorption mechanism Trigger Tier classification Total
GSIB Non-GSIB Principal write-down
Mandatory conversion
Mechanical All levels
Mechanical <=5.125
Mechanical >5.125
Discretionary only
AT 1 Tier 2
Advanced economies 124.4 (108) 155.6 (277) 124.3 (182) 154.7 (194) 206.7 (243) 125.7 (174) 81.0 (69) 73.3 (142) 188.3 (228) 73.2 (117) 280.0 (385)
Euro area 36.7 (32) 48.8 (67) 43.6 (56) 41.7 (41) 73.1 (83) 55.2 (61) 17.9 (22) 12.5 (16) 75.7 (83) 8.1 (15) 85.6 (99)
Non-euro area Europe 69.3 (43) 50.6 (115) 58.1 (84) 61.2 (68) 111.9 (136) 48.7 (89) 63.1 (47) 8.1 (22) 75.6 (86) 27.6 (33) 111.9 (158)
Switzerland 33.6 (18) 4.5 (16) 29.4 (28) 8.4 (4) 33.8 (30) 24.9 (22) 8.9 (8) 4.3 (4) 19.2 (20) 18.9 (14) 38.1 (34)
United Kingdom 32.7 (19) 29.7 (47) 10.7 (6) 51.7 (60) 62.4 (66) 16.9 (37) 45.5 (29) 0 (0) 41.5 (27) 4.2 (3) 62.4 (66)
Other 3.0 (6) 16.4 (52) 18.0 (50) 1.0 (4) 15.7 (40) 6.9 (30) 8.7 (10) 3.7 (18) 14.9 (39) 4.5 (16) 19.4 (58)
Non-European AEs 18.4 (33) 56.1 (95) 22.6 (42) 51.8 (85) 21.8 (24) 21.8 (24) 0 (0) 52.7 (104) 37.0 (59) 37.5 (69) 74.5 (128)
Emerging market economies 69.4 (24) 172.0 (322) 158.6 (258) 65.1 (26) 85.6 (72) 79.5 (53) 6.1 (19) 155.9 (274) 86.6 (75) 147.8 (264) 241.5 (346)
Emerging Asia 69.1 (18) 129.7 (225) 130.0 (193) 62.2 (20) 64.7 (32) 62.5 (19) 2.2 (13) 134.1 (211) 68.7 (53) 123.5 (188) 198.8 (243)
Other EMEs 0.4 (6) 42.3 (97) 28.6 (65) 2.9 (6) 20.9 (40) 16.9 (34) 3.9 (6) 21.8 (63) 17.9 (22) 24.2 (76) 42.7 (103)
Total 193.8 (132) 327.7 (599) 282.9 (440) 219.8 (220) 292.3 (315) 205.2 (227) 87.1 (88) 229.2 (416) 274.9 (303) 221.0 (381) 521.5 (731)

Table 2. Propensity to Issue CoCos: Duration Analyses This table analyses the propensity of banks to issue CoCos using duration analysis. The sample consists of “potential” issuers, defined as the 500 banks with the highest total assets in CoCo-issuing advanced economy jurisdictions, plus the advanced economy CoCo issuers in our sample that are not among the top 500. The sample is from January 2009 through December 2015. Panel A presents results from regressions using a Tobit regression where the dependent variable is Time to Issue (in months from January 2009). Panel B presents results from the Cox (1972) proportional hazards model using time-varying covariates at the bank-month level. Panel C (D) presents results from the Fine and Gray (1999) competing risk hazards model, at the bank-month level, where the issuance of any principal write-down (mandatory conversion) CoCos is the “main risk” and the issuance of any mandatory conversion (principal write-down) CoCos is the “competing risk.” For Panels B–D, observations drop out of the sample right after a bank issues any CoCo for the first time. Banks without any issuance are treated as being censored at the end of the sample period. All dependent variables except Total assets and G-SIB are scaled by total assets, expressed in percentage points. The independent variables are as follows: Total assets (in logarithm), Tier 1 (Tier 1 capital), G-SIB (indicating a global systemically important bank), Gross loans, Trading Securities, Long-term funding, Deposits (the sum of bank deposits and customer deposits), Tier 1 ^ 2 (the square of Tier 1), Customer deposits, Bank deposits, Interbank borrowing (the sum of deposits from banks, repos, and cash collateral), and Interbank assets (the sum of loans and advances to banks, reverse repos, and cash collateral). The t-statistics are in parentheses. *, **, and *** indicate statistical significance at the 10%, 5%, and 1% levels, respectively. Panel A: Duration to First CoCo Issuance
(1) (2) (3) (4) (5)
Total assets -11.019*** -14.317*** -10.844*** -9.641** -16.537***
(-4.36) (-4.63) (-3.53) (-3.22) (-4.65)
Tier 1 -3.760** -3.834** 2.821 -2.974* -2.682
(-2.29) (-2.26) (0.57) (-1.79) (-1.44)
G-SIB -14.859 -13.531 -19.052* -12.933
(-1.33) (-1.22) (-1.71) (-1.14)
Gross loans -0.605** -0.885*** -0.853*** -0.663**
(-2.78) (-3.60) (-3.46) (-2.59)
Trading securities -0.873** -0.732* -0.942** -1.225**
(-2.28) (-1.90) (-2.32) (-2.89)
Long-term funding -0.156 0.378 0.312 -0.114
(-0.79) (1.42) (1.21) (-0.56)
Deposits 0.810**
(Bank+Customer) (3.30)
Tier 1 ^ 2 -0.385
(-1.24)
Customer deposits 0.684**
(2.92)
Bank deposits 2.025***
(4.14)
Interbank borrowing 0.833**
(2.44)
Interbank assets -0.154
(-0.45)
Number of observations 512 510 510 510 506

Panel B: Hazards to First CoCo Issuance
(1) (2) (3) (4) (5)
Total assets 0.449*** 0.530*** 0.515*** 0.429*** 0.581***
(6.19) (6.10) (5.16) (4.59) (5.94)
Tier 1 0.002 0.002 0.461* 0.002 0.048
(0.29) (0.34) (1.91) (0.36) (0.88)
G-SIB 0.330 0.355 0.285 0.253
(1.06) (1.13) (0.89) (0.80)
Gross loans 0.018*** 0.032*** 0.034*** 0.022***
(3.92) (4.38) (4.33) (2.81)
Trading securities 0.037*** 0.033** 0.040*** 0.055***
(3.02) (2.48) (2.66) (3.92)
Long-term funding 0.013** -0.004 -0.004 0.009
(2.16) (-0.47) (-0.52) (1.45)
Deposits -0.026***
(Bank+Customer) (-3.86)
Tier 1 ^ 2 -0.026
(-1.52)
Customer deposits -0.018***
(-2.68)
Bank deposits -0.117***
(-4.94)
Interbank borrowing -0.036***
(-2.98)
Interbank assets -0.017
(-1.35)
Number of observations 3323 3323 3323 3323 3296

Panel C: Hazards to First Principal Write-Down Issuance (with Mandatory Conversion as Competing Risk)
(1) (2) (3) (4) (5)
Total assets 0.419*** 0.473*** 0.495*** 0.350** 0.588***
(3.49) (3.30) (3.27) (2.27) (4.48)
Tier 1 0.002** 0.002** 0.461** 0.002** 0.097**
(2.05) (2.36) (2.28) (2.51) (2.04)
G-SIB 0.580 0.633* 0.591 0.505
(1.55) (1.65) (1.51) (1.29)
Gross loans 0.016*** 0.026*** 0.028*** 0.015*
(3.23) (3.21) (3.21) (1.71)
Trading securities 0.036*** 0.032** 0.038*** 0.046***
(3.54) (2.51) (2.58) (3.28)
Long-term funding 0.019*** 0.006 0.004 0.020***
(3.47) (0.76) (0.54) (3.03)
Deposits -0.025***
(Bank+Customer) (-3.74)
Tier 1 ^ 2 -0.020*
(-1.95)
Customer deposits -0.017***
(-2.69)
Bank deposits -0.103***
(-4.07)
Interbank borrowing -0.023**
(-2.11)
Interbank assets -0.018
(-1.63)
Number of observations 3323 3323 3323 3323 3296

Panel D: Hazards to Mandatory Conversion Issuance (with Principal Write-Down as Competing Risk)
(1) (2) (3) (4) (5)
Total assets 0.399*** 0.505*** 0.396** 0.423** 0.482**
(2.98) (2.83) (2.04) (2.08) (2.33)
Tier 1 -0.002 -0.019 1.160 -0.022 -0.034
(-0.04) (-0.22) (1.62) (-0.31) (-0.36)
G-SIB -0.303 -0.241 -0.304 -0.216
(-0.51) (-0.40) (-0.50) (-0.36)
Gross loans 0.019*** 0.038*** 0.041*** 0.031**
(3.92) (4.07) (2.98) (2.12)
Trading securities 0.035** 0.031 0.037* 0.061***
(2.18) (1.55) (1.71) (3.23)
Long-term funding -0.002 -0.028*** -0.022** -0.009
(-0.30) (-2.76) (-2.15) (-1.17)
Deposits -0.030***
(Bank+Customer) (-4.18)
Tier 1 ^ 2 -0.103*
(-1.76)
Customer deposits -0.019***
(-2.75)
Bank deposits -0.122***
(-3.06)
Interbank borrowing -0.053**
(-2.33)
Interbank assets -0.011
(-0.57)
Number of observations 3323 3323 3323 3323 3296

Table 3. Impact of CoCo Issuance on Issuers’ CDS Spreads: Cumulative Prediction Error (CPE) Analyses This table examines the impact of CoCo issuance on issuing banks’ CDS spreads using the methodology of James (1987). The average cumulative prediction errors (ACPE) for each category are calculated as equally-weighted averages of the cumulative prediction errors (CPEj) for the set of CoCo instruments that belong to each category. The weighted average cumulative prediction errors (WACPE) are calculated as issued, amount-weighted averages of the CPE for the set of CoCo instruments that belong to each category. For each CoCo instrument j, CPEj is defined as the cumulative prediction error (derived from a CAPM model, estimated over a period of 200 business days, excluding the 40 business days centered around the event date) of its issuer’s CDS spread over the event window, which starts 10 business days before the issuance date (t-10) and ends on the issuance date (t). The “Z-value” is defined as Z = √N (ACSPE), where ACSPE is the average cumulative standardized prediction error and N is the sample size. “Proportion negative” is the proportion of negative CPEj. The test statistic is a Wilcoxon signed rank statistic. The null hypothesis is that the proportion of negative prediction errors equals 0.5. The trigger threshold of 5.125% is the minimum required for a CoCo to qualify as additional tier 1 (AT1) capital under Basel III. *, **, and *** indicate statistical significance at the 10%, 5%, and 1% levels, respectively. The sample covers CoCo instruments issued by banks in advanced economies between January 2009 and December 2015.
ACPE Z-value Proportion negative
WACPE Sample size
All CoCos -2.66*** -2.70 0.57** -4.81 136
Loss absorption
Principal write-down (PWD) -1.35 -1.07 0.54 -2.40 87
Mandatory conversion (MC) -4.97*** -3.07 0.63*** -8.37 49
Trigger
Mechanical trigger -3.25** -2.22 0.55** -4.80 83
<=5.125 -3.36 -1.38 0.60 -5.57 50
>5.125 -3.08* -1.83 0.48 -3.91 33
Discretionary trigger only -1.08 -1.15 0.58 -2.14 50
PWD and mechanical trigger -1.61 -1.18 0.55 -2.36 53
PWD and trigger<=5.125 -0.82 -0.63 0.57 -0.67 37
PWD and trigger>5.125 -3.42 -1.20 0.50 -6.38 16
PWD and discretionary trigger only -0.89 -0.22 0.52 -2.51 33
MC and mechanical trigger -6.15** -2.13 0.57* -8.26 30
MC and trigger<=5.125 -10.58 -1.64 0.69 -21.71 13
MC and trigger>5.125 -2.76 -1.39 0.47 -2.43 17
MC and discretionary trigger only -1.46* -1.66 0.71* -1.24 17
Additional Tier 1 -4.17*** -2.63 0.57** -6.69 75
Tier 2 -0.67 -1.00 0.57 -0.35 60
CoCo issue size <median -1.76 -1.46 0.58* -1.66 79 (amount issued/ RWA) >=median -4.36** -2.56 0.57* -7.21 54
Issuer size <$1000bn -4.04*** -2.63 0.62*** -8.97 68 (total assets) >=$1000bn -1.54 -1.25 0.54 -2.18 65
Issuer G-SIB -1.53 -1.15 0.53 -2.03 72
Non-G-SIB -3.93*** -2.72 0.63*** -9.74 64
European issuance -3.15** -2.20 0.55* -5.33 93
Non-European issuance -1.59 -1.58 0.63 -2.38 43
Distance to trigger <median -5.78 -1.37 0.55 -9.13 31 (Regulatory T1 capital/RWA) >=median -2.13* -1.84 0.57* -1.83 49
First-time issuer -2.90 -0.40 0.48 -6.17 40
Repeat issuer -2.55*** -2.93 0.61*** -4.01 94
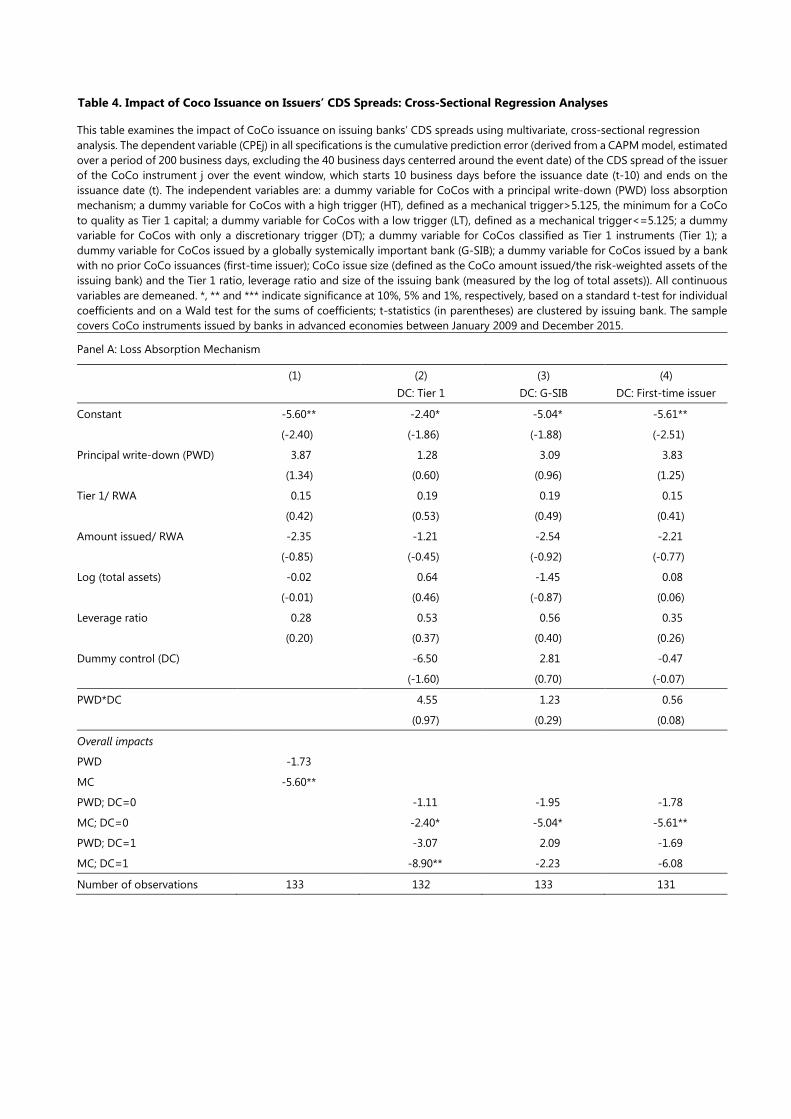
Table 4. Impact of Coco Issuance on Issuers’ CDS Spreads: Cross-Sectional Regression Analyses
This table examines the impact of CoCo issuance on issuing banks’ CDS spreads using multivariate, cross-sectional regression analysis. The dependent variable (CPEj) in all specifications is the cumulative prediction error (derived from a CAPM model, estimated over a period of 200 business days, excluding the 40 business days centerred around the event date) of the CDS spread of the issuer of the CoCo instrument j over the event window, which starts 10 business days before the issuance date (t-10) and ends on the issuance date (t). The independent variables are: a dummy variable for CoCos with a principal write-down (PWD) loss absorption mechanism; a dummy variable for CoCos with a high trigger (HT), defined as a mechanical trigger>5.125, the minimum for a CoCo to quality as Tier 1 capital; a dummy variable for CoCos with a low trigger (LT), defined as a mechanical trigger<=5.125; a dummy variable for CoCos with only a discretionary trigger (DT); a dummy variable for CoCos classified as Tier 1 instruments (Tier 1); a dummy variable for CoCos issued by a globally systemically important bank (G-SIB); a dummy variable for CoCos issued by a bank with no prior CoCo issuances (first-time issuer); CoCo issue size (defined as the CoCo amount issued/the risk-weighted assets of the issuing bank) and the Tier 1 ratio, leverage ratio and size of the issuing bank (measured by the log of total assets)). All continuous variables are demeaned. *, ** and *** indicate significance at 10%, 5% and 1%, respectively, based on a standard t-test for individual coefficients and on a Wald test for the sums of coefficients; t-statistics (in parentheses) are clustered by issuing bank. The sample covers CoCo instruments issued by banks in advanced economies between January 2009 and December 2015.
Panel A: Loss Absorption Mechanism
(1) (2) DC: Tier 1
(3) DC: G-SIB
(4) DC: First-time issuer
Constant -5.60** -2.40* -5.04* -5.61**
(-2.40) (-1.86) (-1.88) (-2.51)
Principal write-down (PWD) 3.87 1.28 3.09 3.83
(1.34) (0.60) (0.96) (1.25)
Tier 1/ RWA 0.15 0.19 0.19 0.15
(0.42) (0.53) (0.49) (0.41)
Amount issued/ RWA -2.35 -1.21 -2.54 -2.21
(-0.85) (-0.45) (-0.92) (-0.77)
Log (total assets) -0.02 0.64 -1.45 0.08
(-0.01) (0.46) (-0.87) (0.06)
Leverage ratio 0.28 0.53 0.56 0.35
(0.20) (0.37) (0.40) (0.26)
Dummy control (DC) -6.50 2.81 -0.47
(-1.60) (0.70) (-0.07)
PWD*DC 4.55 1.23 0.56
(0.97) (0.29) (0.08)
Overall impacts
PWD -1.73
MC -5.60**
PWD; DC=0 -1.11 -1.95 -1.78
MC; DC=0 -2.40* -5.04* -5.61**
PWD; DC=1 -3.07 2.09 -1.69
MC; DC=1 -8.90** -2.23 -6.08
Number of observations 133 132 133 131

Panel B: Trigger Type
(1) (2) DC: G-SIB
(3) DC: First-time issuer
(4) DC: PWD
Constant -4.80** -5.60** -6.09** -8.07**
(-2.13) (-2.13) (-2.46) (-2.21)
Discretionary trigger only (DT) 1.81 3.83 3.38 5.35
(0.84) (1.37) (1.51) (1.36)
Tier 1/ RWA 0.63 0.62 0.72* 0.52
(1.62) (1.54) (1.89) (1.33)
Amount issued/ RWA -5.06 -4.44 -6.06* -5.10
(-1.41) (-1.26) (-1.71) (-1.35)
Log (total assets) 0.16 -1.66 0.09 0.24
(1.42) (1.69) (1.40) (1.49)
Leverage ratio -0.06 0.28 -0.08 0.30
(-0.05) (0.21) (-0.06) (0.22)
Dummy control (DC) 5.77** 3.43 5.31
(2.33) (1.29) (1.54)
DT*DC -1.86 -6.08 -5.87
(-0.58) (-1.47) (-1.41)
Overall impacts
DT -3.00
Mechanical trigger (MT) -4.80**
DT; DC=0 -1.77 -2.71
MT; DC=0 -5.60** -6.09**
DT; DC=1 2.14 -5.36
MT; DC=1 0.17 -2.66
PWD;MT -2.75
MC;MT -8.07**
PWD;DT -3.28
MC;DT -2.72
Number of observations 130 130 129 130

Panel C: Trigger Level
(1) (2) DC: G-SIB
(3) DC: First-time issuer
Constant -4.20* -2.39 -7.44***
(-1.72) (-0.95) (-2.60)
Low trigger (LT) -0.97 -6.00 2.02
(-0.29) (-1.12) (0.68)
Discretionary trigger only (DT) 1.22 0.92 4.77
(0.55) (0.38) (1.62)
Tier 1/ RWA 0.63* 0.64 0.81*
(1.65) (1.62) (1.93)
Amount issued/ RWA -5.16 -4.65 -6.31*
(-1.38) (-1.27) (-1.70)
Log (total assets) 0.10 -2.08 0.03
(0.07) (-1.08) (0.02)
Leverage ratio -0.12 0.56 -0.05
(-0.08) (0.39) (-0.04)
Dummy control (DC) 3.33 6.93*
(0.82) (1.95)
LT*DC 6.40 -6.42
(1.09) (-0.96)
DT*DC 1.26 -9.54**
(0.29) (-2.03)
Overall impacts
LT -5.16*
DT -2.98
HT -4.20*
LT; DC=0 -8.38* -5.42*
DT; DC=0 -1.46 -2.67
HT; DC=0 -2.39 -7.44***
LT; DC=1 1.35 -4.91
DT; DC=1 3.13 -5.28
HT; DC=1 0.94 -0.51
Number of observations 130 130 129

Table 5. Impact of CoCo Issuance on Issuers’ Equity Prices: Cumulative Prediction Error (CPE) Analyses This table examines the impact of CoCo issuance on issuing banks’ equity prices using the methodology of James (1987). The average cumulative prediction errors (ACPE) for each category are calculated as equally-weighted averages of the cumulative prediction errors (CPEj) for the set of CoCo instruments that belong to each category. The weighted average cumulative prediction errors (WACPE) are calculated as issued amount-weighted averages of the CPE for the set of CoCo instruments that belongs to each category. For each CoCo instrument j, CPEj is defined as the cumulative prediction error (derived from a CAPM model, estimated over a period of 200 business days, excluding the 40 business days centered around the event date) of its issuer’s equity price over the event window, which starts 5 business days before the issuance date (t-5) and ends on the issuance date (t). The “Z-value” is defined as Z = √N (ACSPE), where ACSPE is the average cumulative standardized prediction error and N is the sample size. “Proportion negative” is the proportion of negative CPEj. The test statistic is a Wilcoxon signed rank statistic. The null hypothesis is that the proportion of negative prediction errors equals 0.5. *, **, and *** indicate statistical significance at the 10%, 5%, and 1% levels, respectively. The sample covers CoCo instruments issued by banks in advanced economies between January 2009 and December 2015.
ACPE Z-value Proportion negative
WACPE Sample size
All CoCos 0.15 0.76 0.35 0.27 170
Loss absorption
Principal write-down (PWD) 0.27 1.03 0.29 1.16 103
Mandatory conversion (MC) -0.04 -0.07 0.88 -0.74 67
Trigger
Mechanical trigger 0.40 1.02 0.23 0.60 97
<=5.125 -0.17 0.73 0.29 0.04 65
>5.125 1.55 0.73 0.55 1.32 32
Discretionary trigger only -0.24 -0.07 0.95 -0.38 67
PWD and mechanical trigger 0.69 1.56 0.15 1.91 60
PWD and trigger<=5.125 -0.19 0.66 0.36 0.20 47
PWD and trigger>5.125 3.87** 2.10 0.22 7.33 13
PWD and discretionary trigger only -0.44 -0.44 0.69 -0.57 39
MC and mechanical trigger -0.08 -0.35 0.92 -0.82 37
MC and trigger<=5.125 -0.12 0.32 0.65 -0.34 18
MC and trigger>5.125 -0.04 -0.80 0.66 -1.07 19
MC and discretionary trigger only 0.04 0.41 0.86 -0.11 28
Additional Tier 1 0.23 0.71 0.26 0.35 92
Tier 2 0.06 0.35 0.79 0.13 78
CoCo issue size <median 0.33 1.44 0.12 0.14 92 (amount issued/ RWA) >=median 0.37 -0.17 0.99 0.43 69
Issuer size <$1000bn 0.65 1.30 0.27 1.75 96 (total assets) >=$1000bn -0.04 0.09 0.85 -0.74 67
Issuer G-SIB 0.06 0.35 0.79 -0.27 74
Non-G-SIB 0.22 0.70 0.48 1.13 96
European issuance 0.17 0.37 0.58 0.43 111
Non-European issuance 0.11 0.78 0.46 -0.24 59
Distance to trigger <median 1.40* 1.65 0.19 1.66 40 (Regulatory T1 capital/RWA) >=median 0.29 0.50 0.38 -0.26 51
First-time issuer 0.76 1.62 0.10 1.36 57
Repeat issuer -0.23 -0.45 0.78 -0.41 108
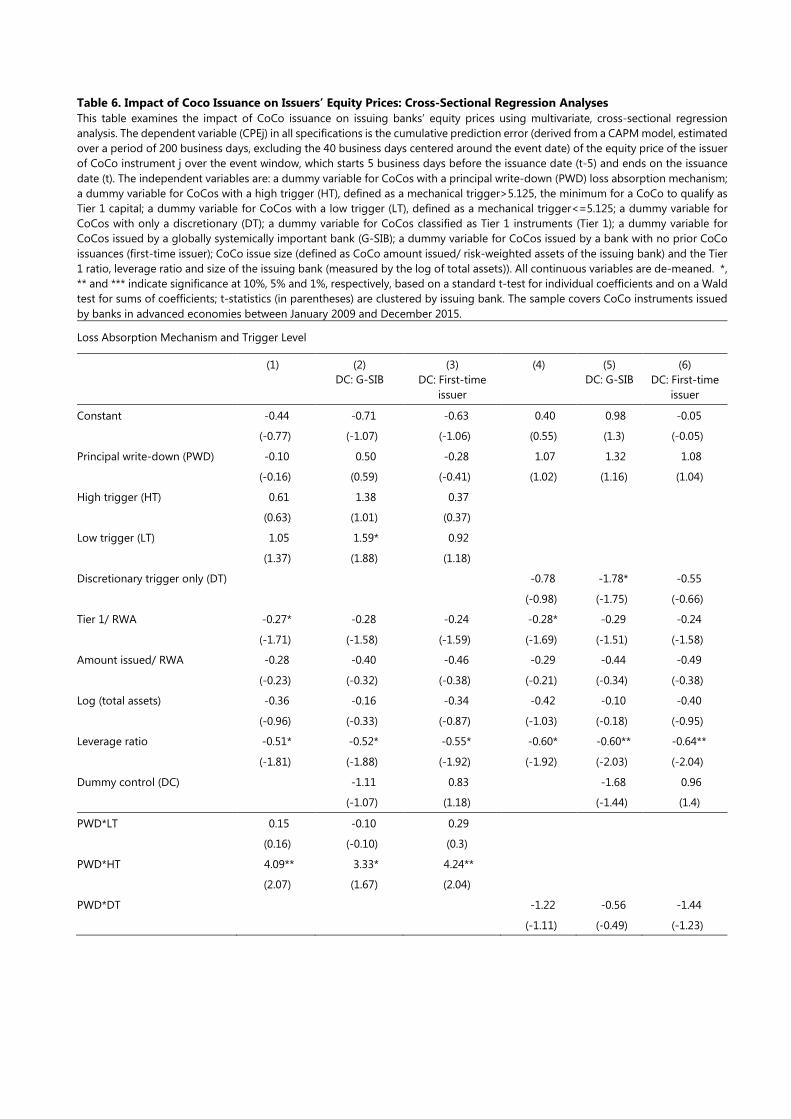
Table 6. Impact of Coco Issuance on Issuers’ Equity Prices: Cross-Sectional Regression Analyses This table examines the impact of CoCo issuance on issuing banks’ equity prices using multivariate, cross-sectional regression analysis. The dependent variable (CPEj) in all specifications is the cumulative prediction error (derived from a CAPM model, estimated over a period of 200 business days, excluding the 40 business days centered around the event date) of the equity price of the issuer of CoCo instrument j over the event window, which starts 5 business days before the issuance date (t-5) and ends on the issuance date (t). The independent variables are: a dummy variable for CoCos with a principal write-down (PWD) loss absorption mechanism; a dummy variable for CoCos with a high trigger (HT), defined as a mechanical trigger>5.125, the minimum for a CoCo to qualify as Tier 1 capital; a dummy variable for CoCos with a low trigger (LT), defined as a mechanical trigger<=5.125; a dummy variable for CoCos with only a discretionary (DT); a dummy variable for CoCos classified as Tier 1 instruments (Tier 1); a dummy variable for CoCos issued by a globally systemically important bank (G-SIB); a dummy variable for CoCos issued by a bank with no prior CoCo issuances (first-time issuer); CoCo issue size (defined as CoCo amount issued/ risk-weighted assets of the issuing bank) and the Tier 1 ratio, leverage ratio and size of the issuing bank (measured by the log of total assets)). All continuous variables are de-meaned. *, ** and *** indicate significance at 10%, 5% and 1%, respectively, based on a standard t-test for individual coefficients and on a Wald test for sums of coefficients; t-statistics (in parentheses) are clustered by issuing bank. The sample covers CoCo instruments issued by banks in advanced economies between January 2009 and December 2015.
Loss Absorption Mechanism and Trigger Level
(1) (2) DC: G-SIB
(3) DC: First-time
issuer
(4) (5) DC: G-SIB
(6) DC: First-time
issuer
Constant -0.44 -0.71 -0.63 0.40 0.98 -0.05
(-0.77) (-1.07) (-1.06) (0.55) (1.3) (-0.05)
Principal write-down (PWD) -0.10 0.50 -0.28 1.07 1.32 1.08
(-0.16) (0.59) (-0.41) (1.02) (1.16) (1.04)
High trigger (HT) 0.61 1.38 0.37
(0.63) (1.01) (0.37)
Low trigger (LT) 1.05 1.59* 0.92
(1.37) (1.88) (1.18)
Discretionary trigger only (DT) -0.78 -1.78* -0.55
(-0.98) (-1.75) (-0.66)
Tier 1/ RWA -0.27* -0.28 -0.24 -0.28* -0.29 -0.24
(-1.71) (-1.58) (-1.59) (-1.69) (-1.51) (-1.58)
Amount issued/ RWA -0.28 -0.40 -0.46 -0.29 -0.44 -0.49
(-0.23) (-0.32) (-0.38) (-0.21) (-0.34) (-0.38)
Log (total assets) -0.36 -0.16 -0.34 -0.42 -0.10 -0.40
(-0.96) (-0.33) (-0.87) (-1.03) (-0.18) (-0.95)
Leverage ratio -0.51* -0.52* -0.55* -0.60* -0.60** -0.64**
(-1.81) (-1.88) (-1.92) (-1.92) (-2.03) (-2.04)
Dummy control (DC) -1.11 0.83 -1.68 0.96
(-1.07) (1.18) (-1.44) (1.4)
PWD*LT 0.15 -0.10 0.29
(0.16) (-0.10) (0.3)
PWD*HT 4.09** 3.33* 4.24**
(2.07) (1.67) (2.04)
PWD*DT -1.22 -0.56 -1.44
(-1.11) (-0.49) (-1.23)

Overall impacts
PWD*HT 4.16** 4.51** 3.71**
MC*HT 0.17 0.67 -0.26
PWD*LT 0.66 1.28* 0.30
MC*LT 0.62 0.88 0.29
PWD*DT -0.54 -0.21 -0.91 -0.53 -0.04 -0.95
MC*DT -0.44 -0.71 -0.63 -0.38 -0.80 -0.59
PWD*MT 1.47** 2.30** 1.04
MC*MT 0.40 0.98 -0.05
Number of observations 155 155 154 155 155 154

Structure of CoCos Figure 1
Main design features of CoCos
Loss absorption mechanismTrigger
Mechanical Discretionary
Market-value
Book-value
Conversion to equity
Principal writedown
and
and/or
or
or
CoCos’ Position in Basel III Capital Requirements1 Figure 2
DT = discretionary trigger; MT = mechanical trigger.
1 The list of instruments in this graph is not exhaustive and is included solely for illustrative purposes. For a complete list of instruments and the associated criteria for inclusion in each of the three capital buckets, see Basel Committee on Banking Supervision (2011). The above shares of risk-weighted assets (RWA) represent the bare minimum capital requirements and do not account for any add-ons, such as the capital conservation buffer, the countercyclical buffer, and the systemically important financial institution (SIFI) surcharge. All instruments other than those in CET1 are optional – the inclusion of an instrument in one of the above three capital buckets implies that banks have the option (but not the requirement) to use that instrument to meet the respective minimum capital requirement (i.e. banks have the option to meet all their capital requirements using only CET1).
Subordinated debt instruments with a DT and an MT ≥ 5.125% Preferred shares
Additional Tier 1 (AT1)
Common shares Retained earnings
Common Equity Tier 1 (CET1)
Subordinated debt instruments with a DT (and optionally an MT of any level)
Tier 2 (T2)
CET 1 ≥ 4.5% RWA
CET 1+AT1≥ 6% RWA
CET 1+AT1+T2≥ 8% RWA

CoCo Issuance
Issued amount, 2009–15, in USD billions Figure 3
By nationality of issuer By currency of issuance
Sources: Bloomberg; Dealogic; authors’ calculations.
The Evolution of the CoCo Market
Issued amount, in USD billions Figure 4
By tier classification By loss absorption mechanism
Note: In some periods, there are minor differences between the quarterly issued amounts in the left- and right-hand panels due to incomplete information (on tier classification or loss absorption mechanism) for a small number of CoCos issued in the respective periods.
Sources: Bloomberg; Dealogic; authors’ calculations.

Previous volumes in this series
No Title Author
677 November 2017
Macroeconomic Implications of Financial Imperfections: A Survey
Stijn Claessens and M Ayhan Kose
676 November 2017
Asset prices and macroeconomic outcomes: a survey
Stijn Claessens and M Ayhan Kose
675 November 2017
Macroprudential Policies in Peru: The effects of Dynamic Provisioning and Conditional Reserve Requirements
Elias Minaya, José Lupú and Miguel Cabello
674 November 2017
Credit supply responses to reserve requirement: loan-level evidence from macroprudential policy
João Barata R. B. Barroso, Rodrigo Barbone Gonzalez and Bernardus F. Nazar Van Doornik
673 November 2017
Loan-to-value policy and housing finance: effects on constrained borrowers
Douglas Kiarelly Godoy de Araujo, Joao Barata Ribeiro Blanco Barroso and Rodrigo Barbone Gonzalez
672 November 2017
Capital and currency-based macroprudential policies: an evaluation using credit registry data
Horacio Aguirre and Gastón Repetto
671 November 2017
Capital misallocation and financial development: A sector-level analysis
Daniela Marconi and Christian Upper
670 November 2017
Policy rules for capital controls Gurnain Kaur Pasricha
669 November 2017
Credit misallocation during the European financial crisis
Fabiano Schivardi, Enrico Sette and Guido Tabellini
668 October 2017
Financial and real shocks and the effectiveness of monetary and macroprudential policies in Latin American countries
Javier Garcia-Cicco, Markus Kirchner, Julio Carrillo, Diego Rodriguez, Fernando Perez, Rocio Gondo, Carlos Montoro and Roberto Chang
667 October 2017
Modeling Time-Varying Uncertainty of Multiple-Horizon Forecast Errors
Todd E Clark, Michael W McCracken and Elmar Mertens
666 October 2017
Bank capital allocation under multiple constraints
Tirupam Goel, Ulf Lewrick and Nikola Tarashev
665 October 2017
Interest rates and house prices in the United States and around the world
Gregory D Sutton, Dubravko Mihaljek and Agne Subelyte
All volumes are available on our website www.bis.org.