Births in Scottish Hospitals - Information Services Division
39
A National Statistics Publication for Scotland Information Services Division Publication Report Births in Scottish Hospitals Year ending 31 st March 2012 Publication date – 27 th August 2013
Transcript of Births in Scottish Hospitals - Information Services Division
A National Statistics Publication for Scotland
Information Services Division
Publication Report
Births in Scottish Hospitals
Healthy Birthweight
Year ending 31st March 2010
Publication date – 28th August 2012
Births in Scottish Hospitals
Year ending 31st March 2012
Publication date – 27th August 2013

1
Information Services Division
Contents
Contents ............................................................................................................................ 1
Introduction ....................................................................................................................... 2
Key points ......................................................................................................................... 3
Results and Commentary .................................................................................................. 4
NRS Birth Registrations and SMR02 Births ...................................................................... 4
Maternal Age ..................................................................................................................... 5
Mode of delivery ................................................................................................................ 7
Birthweight and gestation .................................................................................................. 9
Healthy Birthweight ......................................................................................................... 10
Early access to antenatal services .................................................................................. 13
Smoking and pregnancy ................................................................................................. 15
Miscarriage ..................................................................................................................... 22
Level of Care of Newborn Babies ................................................................................... 23
Drug Misuse in Pregnancy .............................................................................................. 25
Glossary .......................................................................................................................... 26
List of Charts ................................................................................................................... 28
Contact ............................................................................................................................ 29
Further Information .......................................................................................................... 29
Rate this publication ........................................................................................................ 29
Appendix ......................................................................................................................... 30
A1 – Background Information .......................................................................................... 30
Smoking and Pregnancy ................................................................................................. 31
A2 – Publication Metadata .............................................................................................. 35
A3 – Early Access details (including Pre-Release Access) ............................................. 37
A4 – ISD and Official Statistics ....................................................................................... 38

2
Information Services Division
Introduction The data presented here are mainly obtained from the Scottish Morbidity Record 02 (SMR02) submitted by maternity hospitals to ISD, who have collected this information since 1975. A wide range of information is collected on the SMR02 - some of which are detailed below:
mother - age, height, smoking history, previous obstetric history.
birth - induction, analgesia, method of delivery, outcome.
baby - apgar score, sex, gestation, weight. Although there is no legal requirement to submit these data to ISD, the level of submission falls only slightly short of the known total number of births occurring each year. Further details are shown on the first chart in the Results and Commentary section - this shows a comparison of births recorded on SMR02 compared to number of births registered with the National Records of Scotland (NRS). See also background information (Appendix 1). For the first time in this publication, we have used data from the Scottish Birth Record (SBR) to display the numbers and percentages of babies requiring different types of care. Also new to this publication, although previously published in Drug Misuse Statistics Scotland, are data on drug misuse in pregnancy. The maternity data are sourced from SMR02 and the neonatal discharges from SBR.

3
Information Services Division
Key points
There were 57,911 births (including live and still births) recorded on SMR02 for the year ending March 2012. Data from SMR02 represent approximately 99% of the births registered by the National Records Service. Some of this shortfall will be due to data on home births not being available from SMR02 data.
Mothers are getting older: Births to mothers aged 30-34 have risen steadily, accounting for 28.8% of all maternities. Since 1975/76 there has also been a steady rise in the proportion of mothers aged 35 and over (from 6.0% to 19.9% in 2011/12).
Smoking in pregnancy: The number of women who were smokers at the time of their booking appointment fell from 25.4% in 2000/01 to 19.3% in 2011/12. The level of 'Not Known' has decreased from 13.5% in 2000/01 to 5.3% in 2011/12. It should be noted that the percentage of ‘unknowns’ may include a proportion of smokers and it is also known that there is considerable under-reporting of smoking by pregnant women themselves.
Caesarean section: In singleton births, elective* and emergency caesarean section rates have both increased steadily since 1975/76 (from 4.7% to 11.9% and 3.9% to 15.9% respectively). The overall caesarean section rate has risen from 8.6% in 1975/76 to 27.8% in 2011/12. [*An elective caesarean section refers to a caesarean section planned in advance and in most cases will have been recommended for clinical reasons such as breech, multiple births or previous caesarean section. It may also be the case that the woman will have chosen this method of delivery for non-clinical reasons.]
Forceps deliveries: Forceps deliveries fell from 13.3% in 1975/76 to a low of 6.8% in 2001/02 before rising to 9.8% in 2011/12. Deliveries by Ventouse (vacuum extraction) show a contrasting trend with deliveries rising to 5.6% in 2002/03 and then falling to 3.1% in 2011/12.
Premature babies: The percentage of pre-term (born before 37 completed weeks) singleton babies rose from 5.2% in 1975/76 to a peak of 6.7% in 2003/04 and has now fallen to 5.9% in 2011/12.
Deprivation: Mothers in the category of highest deprivation most commonly start a family around ages 19 to 22 years. This is in contrast to those in the category of least deprivation where the most common age for a first birth is 30 years.
Birthweight: The percentage of singleton babies with a healthy birthweight was 89.9% in the year ending March 2012. This percentage has remained relatively stable over the last ten years.
Drug misuse: In 2011/12, 2.0% (nearly 1 in 50) of maternities in Scotland recorded drug misuse. Nearly half of those (552) recorded misuse of opioids.
4
Information Services Division
Results and Commentary
NRS Birth Registrations and SMR02 Births
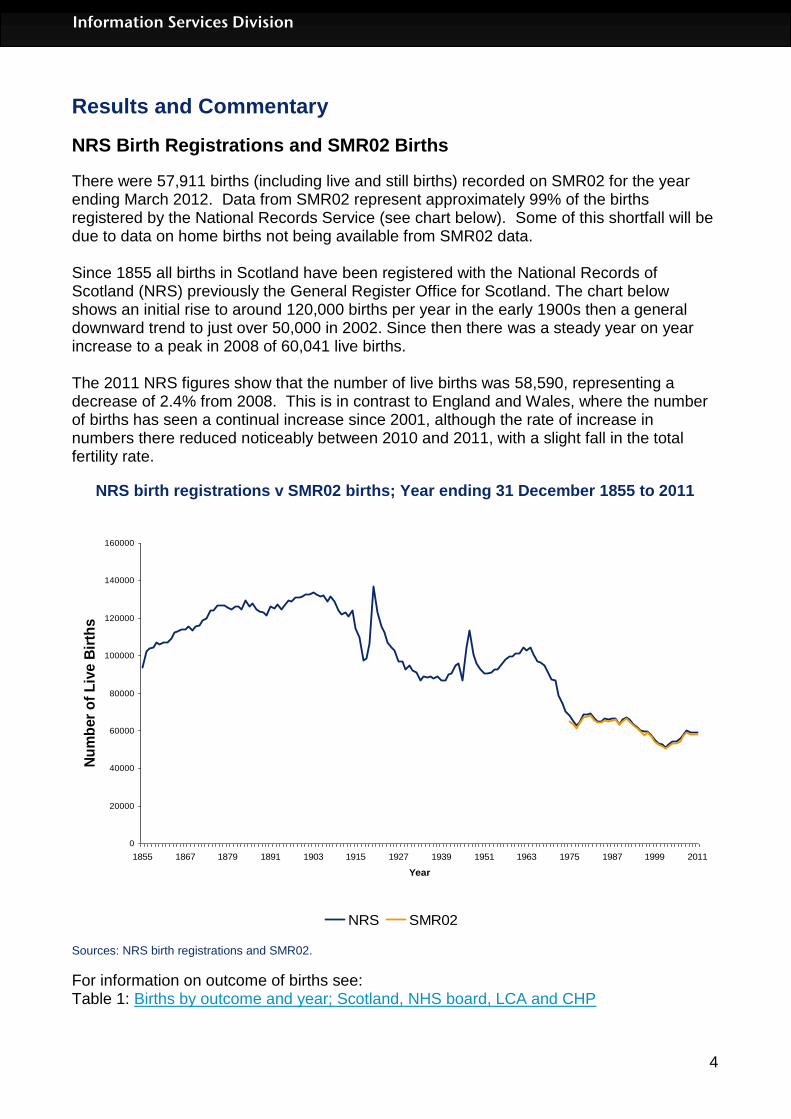
There were 57,911 births (including live and still births) recorded on SMR02 for the year ending March 2012. Data from SMR02 represent approximately 99% of the births registered by the National Records Service (see chart below). Some of this shortfall will be due to data on home births not being available from SMR02 data. Since 1855 all births in Scotland have been registered with the National Records of Scotland (NRS) previously the General Register Office for Scotland. The chart below shows an initial rise to around 120,000 births per year in the early 1900s then a general downward trend to just over 50,000 in 2002. Since then there was a steady year on year increase to a peak in 2008 of 60,041 live births. The 2011 NRS figures show that the number of live births was 58,590, representing a decrease of 2.4% from 2008. This is in contrast to England and Wales, where the number of births has seen a continual increase since 2001, although the rate of increase in numbers there reduced noticeably between 2010 and 2011, with a slight fall in the total fertility rate.
NRS birth registrations v SMR02 births; Year ending 31 December 1855 to 2011
0
20000
40000
60000
80000
100000
120000
140000
160000
1855 1867 1879 1891 1903 1915 1927 1939 1951 1963 1975 1987 1999 2011
Year
Nu
mb
er
of
Liv
e B
irth
s
NRS SMR02
Sources: NRS birth registrations and SMR02.
For information on outcome of births see: Table 1: Births by outcome and year; Scotland, NHS board, LCA and CHP
5
Information Services Division
Maternal Age
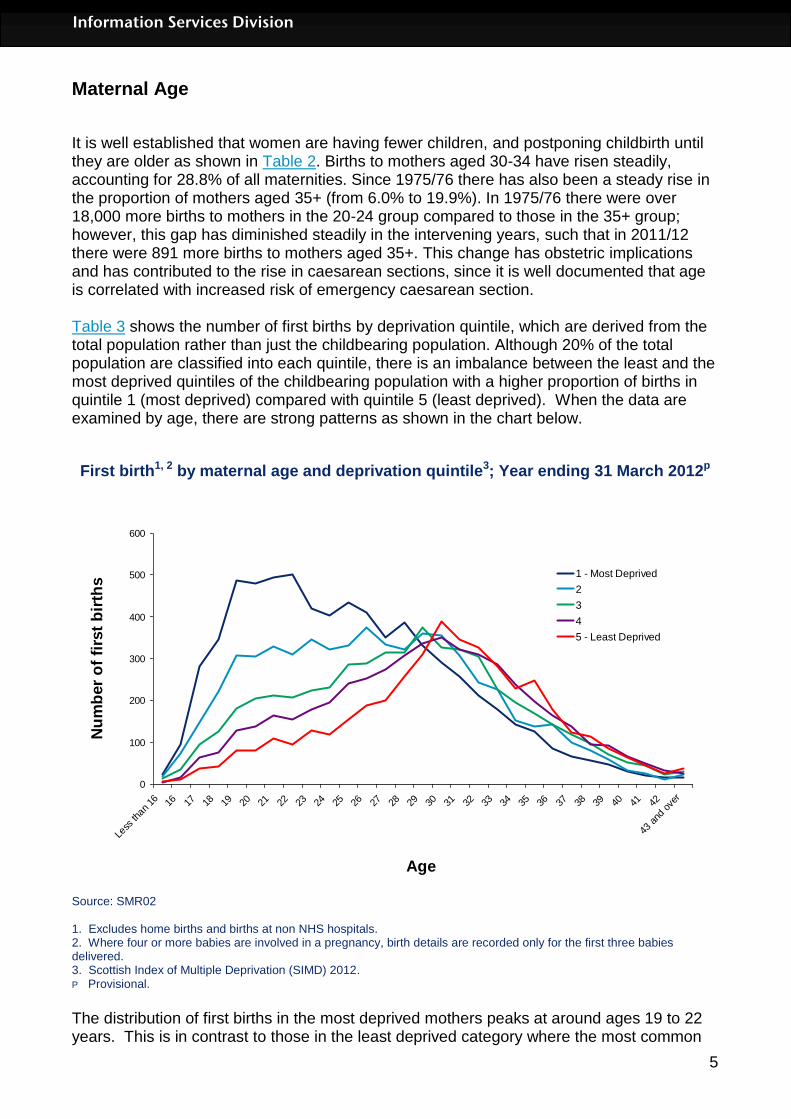
It is well established that women are having fewer children, and postponing childbirth until they are older as shown in Table 2. Births to mothers aged 30-34 have risen steadily, accounting for 28.8% of all maternities. Since 1975/76 there has also been a steady rise in the proportion of mothers aged 35+ (from 6.0% to 19.9%). In 1975/76 there were over 18,000 more births to mothers in the 20-24 group compared to those in the 35+ group; however, this gap has diminished steadily in the intervening years, such that in 2011/12 there were 891 more births to mothers aged 35+. This change has obstetric implications and has contributed to the rise in caesarean sections, since it is well documented that age is correlated with increased risk of emergency caesarean section. Table 3 shows the number of first births by deprivation quintile, which are derived from the total population rather than just the childbearing population. Although 20% of the total population are classified into each quintile, there is an imbalance between the least and the most deprived quintiles of the childbearing population with a higher proportion of births in quintile 1 (most deprived) compared with quintile 5 (least deprived). When the data are examined by age, there are strong patterns as shown in the chart below.
First birth1, 2 by maternal age and deprivation quintile3; Year ending 31 March 2012p
0
100
200
300
400
500
600
Less
than
16 16 17 18 19 20 21 22 23 24 25 26 27 28 29 30 31 32 33 34 35 36 37 38 39 40 41 42
43 a
nd o
ver
Age
Nu
mb
er
of
firs
t b
irth
s
1 - Most Deprived
2
3
4
5 - Least Deprived
Source: SMR02 1. Excludes home births and births at non NHS hospitals. 2. Where four or more babies are involved in a pregnancy, birth details are recorded only for the first three babies delivered. 3. Scottish Index of Multiple Deprivation (SIMD) 2012. P Provisional.
The distribution of first births in the most deprived mothers peaks at around ages 19 to 22 years. This is in contrast to those in the least deprived category where the most common
6
Information Services Division
age for a first birth is 30 years. In the under 20s, there were seven times the proportion of births in the more deprived groups compared to the least deprived. In the 20-24 year olds the ratio of babies born in the least deprived quintile to those born in the most deprived quintile is 4 to 1. This starts to reverse at approximately 30 years, and for the combined age groups 30-34 and 35-39, the ratio is approximately 1 to 1.6. This is a slight decrease from the previous year. Much the same sort of pattern is seen when all births are examined rather than just first births. The data support the view that these changes in behaviour (delaying reproduction) are occurring in all sections of society. For more information on births by maternal age see: Table 2: Maternities by maternal age and year; Scotland, NHS board, LCA and CHP Table 3: Maternities (first birth and all births), by maternal age and deprivation (SIMD); Scotland and by NHS board by year

7
Information Services Division
Mode of delivery
Singleton births In singleton births, spontaneous vertex (normal vaginal) deliveries have fallen steadily since 1975/76 from (75.8% to 59.1%). Forceps deliveries fell from 13.3% in 1976 to a low of 6.8% in 2001/02 before rising to 9.8% in 2011/12. The chart below illustrates the changes in mode of delivery since 1997/98.
Live singleton births1, 2 by mode of delivery (excluding SVD); 1998-2012p, Year ending 31 March
0.0
2.0
4.0
6.0
8.0
10.0
12.0
14.0
16.0
18.0
19
98
19
99
20
00
20
01
20
02
20
03
20
04
20
05
20
06
20
07
20
08
20
09
20
10
20
11
r
20
12
p
Year
Perc
en
tag
e
Forceps
Vacuum
Breech
Caesarean - Elective
Caesarean - Emergency
Source: SMR02 1. Excludes home births and births at non NHS hospitals. 2. Where four or more babies are involved in a pregnancy, birth details are recorded only for the first three babies delivered. r Revised. P Provisional.
Elective* and emergency caesarean section rates have both increased steadily since 1975/76 (from 4.7% to 11.9% and 3.9% to 15.9% respectively). The overall caesarean section rate has risen from 8.6% in 1975/76 to 27.8% in 2011/12. Possible explanations for this rise include demographic changes, differences in clinical practice, characteristics and views of the obstetrician, the organisation and availability of resources, one to one support in labour and womens’ choices. The change in practice for delivery of breech presentation, repeat caesarean section, delivery of preterm infants and twins are contributing to the overall rise. In addition, maternal weight is rising and this has been shown to correlate with a rise in caesarean section 1. Ventouse (vacuum extraction) was less than 1% until 1989/90 then rose to 5.6% in 2002/03. Since then there was a steady decline until 2009/10 with a slight increase in the most recent year. It now sits at 3.1% in 2011/12. Vaginal breech delivery has fallen slowly but steadily from 1.7% in 1975/76 to 0.2% in 2011/12. In 1975/76 rates of induction of

8
Information Services Division
labour were 47.6% and then fell steadily to reach a low of 20.3% in 1988/89. The rate was 23.8% in 2011/12. Population studies have shown a rise in perinatal and neonatal morbidity and mortality in prolonged pregnancies which has led to current recommendations for considering induction of labour after 41 completed weeks 2,3. Multiple births Multiple births are less likely to be delivered vaginally, with 38.8% being delivered by elective caesarean section in 2011/12 (compared to 6.1% in 1975/76) and 30.1% in 2011/12 by emergency section (compared to 4.5% in 1975/76). The incidence of multiple births is rising partly because of an older maternal population (multiple births are more common with increasing maternal age) and the use of ovulation induction and IVF (In Vitro Fertilisation). *An elective caesarean section refers to a caesarean section, which has been planned in advance and in most cases will have been recommended for clinical reasons such as breech or multiple births or previous caesarean section. It may also be the case that the woman will have chosen this method of delivery for non-clinical reasons.
For more information on mode of delivery see: Table 4: Live births by mode of delivery (and induced) by year; Scotland, NHS board and hospital.
References:
1. National Sentinel Caesarean Section Audit Report. October 2001 2. Gülmezoglu AM, Crowther CA, Middleton P. Induction of labour for improving birth outcomes for women at or beyond term. Cochrane Database of Systematic Reviews 2006, Issue 4. Art. No.: CD004945. DOI: 10.1002/14651858.CD004945.pub2. 3. http://www.nice.org.uk/nicemedia/live/12012/41255/41255.pdf

9
Information Services Division
Birthweight and gestation
Singleton births Low birthweight (LBW) is a major determinant of infant mortality and morbidity. In addition, as it is associated with a variety of social and environmental factors, it is often used as a health status indicator. Low birthweight may result from being born too soon (i.e. a preterm birth), from poor intrauterine growth or from a combination of the two. A number of factors have been shown to be associated with low birthweight and/or preterm births. These include maternal smoking, maternal age (older and younger mothers are more likely to have a low birthweight baby), deprivation, previous obstetric history, low pre-pregnancy maternal weight, drug/alcohol use, hypertension and multiple births. Information on some of these factors is also recorded and available on these web pages: maternal age; smoking at booking and maternal smoking recorded at public health nurse/health visitor's First Visit. The chart below shows trends in the proportions of babies born of low (1500-2499g) and very low (under 1500g) birthweight (VLBW) at full term (at or after 37 weeks gestation) and pre-term (before 37 weeks gestation) for singleton births. There was a slight rise in the proportion of low birthweight babies in the past year, most of this consequent on a rise in preterm deliveries but also a suggestion of a rise in the proportion of term babies who are of low birthweight.
Live singleton births 1, 2 by birthweight and gestation; 1998-2012p, Year ending 31 March
0.0
1.0
2.0
3.0
4.0
5.0
6.0
7.0
8.0
19
98
19
99
20
00
20
01
20
02
20
03
20
04
20
05
20
06
20
07
20
08
20
09
20
10
20
11
r
20
12
p
Year
Perc
en
tag
e
Total Low (< 2500g Full Term - Low (< 2500g)
Preterm - Low (< 2500g) Preterm - Very Low (< 1500g)
Total Preterm (< 37 weeks)
Source: SMR02 1. Excludes home births and births at non NHS hospitals. 2. Where four or more babies are involved in a pregnancy, birth details are recorded only for the first three babies delivered. 3. Includes births where the birthweight is unknown. P Provisional.

10
Information Services Division
For more information on birthweight and gestation see: Table 5: Live births by birthweight, gestation and year; Scotland and NHS board Table 6: Births by term, birthweight and year; Scotland and NHS board Table 7: Live births by birthweight, deprivation and year; Scotland and NHS board
Healthy Birthweight
Birthweight is one of the important indicators used to assess the health of an infant at birth and there has been an overall rise in mean birthweight in recent years. However, it is important to be able to differentiate between babies who are light because they are preterm and those who are inappropriately light after adjustment for gestational age at birth. Such babies, known as “small for gestational age” may be growth restricted and have an increased risk of other complications. Some of the babies who are large for gestational age may be macrosomic, perhaps secondary to maternal diabetes. Birthweight that is not within normal ranges has a strong association with poor health outcomes in infancy, childhood and across the whole life course, including long term conditions such as diabetes and coronary heart disease. The data in the accompanying tables is presented for live births and has been produced by comparing the birthweights and gestations with a set of standard tables derived from Scottish data on all births from the years 1998-2003. The details of the way in which the standards were derived are available here: http://www.biomedcentral.com/1471-2393/8/5.
For the year ending March 2012 the percentage of babies with a healthy birthweight was 89.9%. This percentage has remained relatively stable over the last ten years.

11
Information Services Division
Percentage of Babies of Healthy Birthweight (Appropriate Weight for Gestational Age), Scotland, 2001-2012p
0%
10%
20%
30%
40%
50%
60%
70%
80%
90%
100%
2001 2002 2003 2004 2005 2006 2007 2008 2009 2010 2011r 2012p
Year
Perc
enta
ge o
f B
abie
s o
f H
ealthy
Birth
weig
ht
1 – Centiles for Birthweight Charts for Gestational Age for Scottish Singleton Births, Sandra Bonnellie et al, BMC Pregnancy and Child Birth 2008 In order to match to the birthweight standard charts cases with unknown gestation, birthweight and parity were excluded as were cases with estimated gestation outwith the range 24-43 weeks and undetermined gender 2 - Excludes home births, births at non-NHS hospitals and multiple births. 3 - Scotland data includes births where NHS board of residence is unknown or outside Scotland. r – Revised p - Provisional Source: SMR02 ISD Scotland
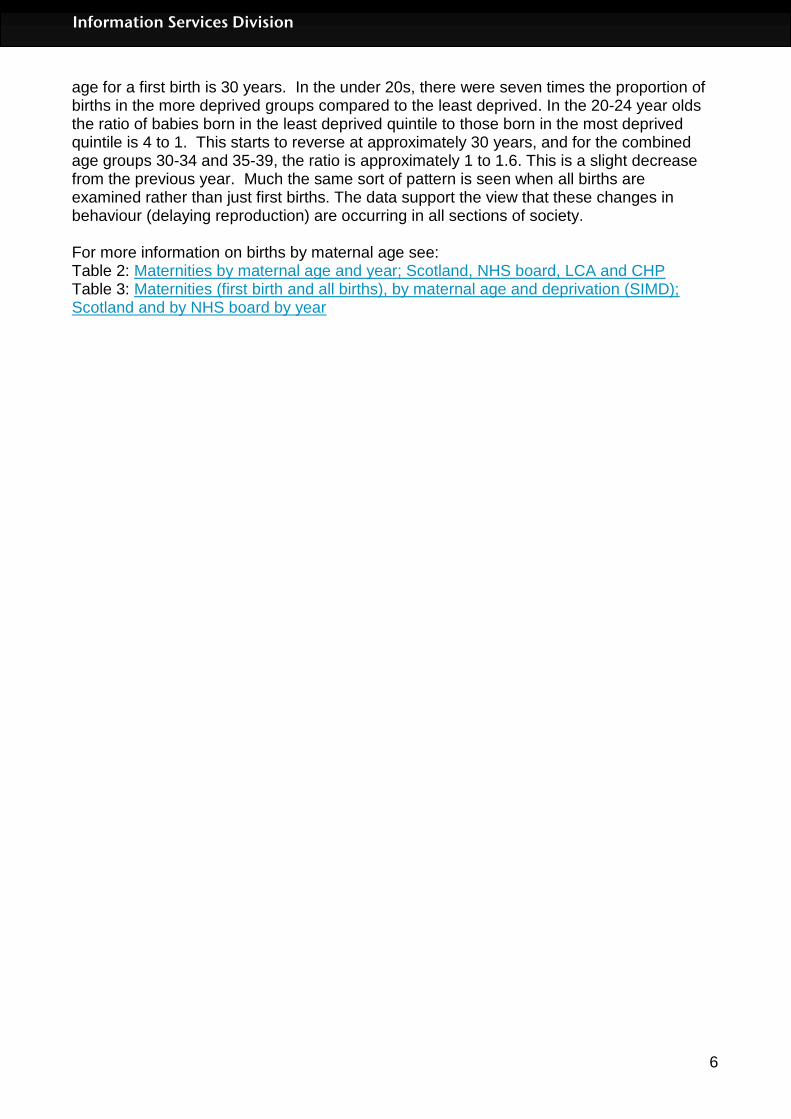
Little variation is seen across the different NHS Boards in the percentage of babies with a healthy birthweight.
12
Information Services Division
Percentage of Babies of Healthy Birthweight (Appropriate Weight for Gestational Age), Year ending March 2012p, by NHS Board, with Upper and Lower 95% Confidence Interval
0
10
20
30
40
50
60
70
80
90
100N
HS
Ay
rsh
ire
an
d A
rra
n
NH
S B
ord
ers
NH
S D
um
frie
s a
nd
Ga
llo
wa
y
NH
S F
ife
NH
S F
ort
h V
all
ey
NH
S G
ram
pia
n
NH
S G
rea
ter
Gla
sg
ow
an
d C
lyd
e
NH
S H
igh
lan
d
NH
S L
an
ark
sh
ire
NH
S L
oth
ian
NH
S O
rkn
ey
NH
S S
hetl
an
d
NH
S T
ay
sid
e
NH
S W
es
tern
Is
les
Sc
otl
an
d
Perc
enta
ge o
f B
abie
s o
f H
ealthy
Birth
weig
ht
1 – Centiles for Birthweight Charts for Gestational Age for Scottish Singleton Births, Sandra Bonnellie et al, BMC Pregnancy and Child Birth 2008 In order to match to the birthweight standard charts cases with unknown gestation, birthweight and parity were excluded as were cases with estimated gestation outwith the range 24-43 weeks and undetermined gender 2 - Excludes home births, births at non-NHS hospitals and multiple births. 3 - Scotland data includes births where NHS board of residence is unknown or outside Scotland. r – Revised p - Provisional Source: SMR02 ISD Scotland
For more information on healthy birthweight see: Table 10 Appropriate weight for gestational age

13
Information Services Division
Early access to antenatal services
The Scottish Government has developed a “Health, Efficiency, Access and Treatment” (HEAT) target for early access to antenatal services. Full details are available here: http://www.scotland.gov.uk/About/Performance/scotPerforms/partnerstories/NHSScotlandperformance/AntenatalAccess. The rationale for this target is that the advice and interventions available during antenatal care are likely to have the greatest effect if they are started early. In particular, there is evidence that those women at highest risk of poor pregnancy outcomes are less likely to access antenatal care early and /or have a poorer experience of that care. The target specifies that: “At least 80% of pregnant women in each SIMD quintile will have booked for antenatal care by the 12th week of gestation by March 2015 so as to ensure improvements in breast feeding rates and other important health behaviours.” The gestation at booking (in completed weeks) is calculated by subtracting the time between the delivery and booking dates from the gestation at delivery (in completed weeks). It should be noted that for the purpose of the HEAT target, the SIMD quintiles are derived at individual NHS Board level (ie the population of each NHS Board divided into five SIMD quintiles). The figure for the whole of Scotland uses SIMD derived from the total population. Data are presented in this publication for the financial year 2011/2012 although the deadline for the target to be reached is not until March 2015. The official data for the target will be produced on the “Scotland Performs” website: http://www.scotland.gov.uk/About/Performance/scotPerforms/partnerstories/NHSScotlandperformance. At the present time, individual NHS Boards are working on improving the quality of their data (including missing booking dates) and their approach to antenatal care. For the period 2011/2012 there were some problems with completeness in some board areas, so the figures presented here should be considered to be illustrative only. For more information on early access to antenatal services see: Table 12: Early access to antenatal services

14
Information Services Division
Percentage of all maternities1 booked by 12 weeks gestation by NHS board of residence 2 and deprivation quintile3, Year ending 31 March 2012p SIMD Quintile
NHS Board 1-Most
deprived 2 3 4 5-Least
deprived
Scotland 65.2 71.8 73.9 74.8 73.7
Ayrshire and Arran 82.9 83.8 85.3 83.4 85.3
Borders 85.1 85.0 86.4 89.7 86.1
Dumfries and Galloway 83.9 81.5 86.0 87.5 90.7
Fife 16.2 17.8 21.5 24.9 20.3
Forth Valley 85.7 85.9 85.4 84.6 88.2
Grampian 84.6 87.4 87.4 88.7 88.5
Greater Glasgow and Clyde 54.4 59.3 59.7 60.6 61.6
Highland 82.4 84.7 80.9 87.2 85.9
Lanarkshire 77.2 74.2 76.0 76.7 73.6
Lothian 80.2 81.4 81.8 82.1 83.1
Orkney 82.5 76.9 86.1 85.4 92.9
Shetland 40.6 50.0 46.9 41.1 39.0
Tayside 65.9 79.1 74.3 74.4 72.7
Western Isles 73.5 82.4 56.9 80.7 89.2
Percentage of all maternities1 where there is no date of booking by NHS board of residence 2 and deprivation quintile3, Year ending 31 March 2012p
SIMD Quintile
NHS Board 1-Most
deprived 2 3 4 5-Least
deprived
Scotland 13.4 11.6 10.5 9.5 11.2
Ayrshire and Arran 1.7 1.8 2.4 3.7 1.7
Borders 3.2 3.3 2.7 2.3 1.8
Dumfries and Galloway 0.5 0.8 1.8 1.4 0.4
Fife 81.7 79.0 74.1 64.6 70.1
Forth Valley 2.4 2.4 4.1 3.5 3.9
Grampian 0.1 0.3 0.0 0.2 0.2
Greater Glasgow and Clyde 14.4 11.9 10.1 11.0 8.5
Highland 5.7 3.8 7.6 4.6 3.7
Lanarkshire 3.6 8.1 7.5 7.3 9.9
Lothian 8.4 7.6 7.4 7.9 9.1
Orkney 0.0 0.0 0.0 0.0 0.0
Shetland 39.1 37.5 42.9 48.2 46.3
Tayside 2.1 1.8 3.5 2.3 5.4
Western Isles 0.0 0.0 9.8 0.0 0.0 1. Excludes records where mother has delivered at home or at non-NHS hospital. 2 Scotland data includes delivery records where NHS board of residence is unknown or outside Scotland. 3 Deprivation in the boards is based on SIMD health board quintile, whereas deprivation in Scotland is based on SIMD Scotland quintiles. 4. Scottish Index of Multiple Deprivation (SIMD) 2012 r – Revised p - Provisional.
15
Information Services Division
Smoking and pregnancy
It is widely accepted that smoking during pregnancy is harmful to both mother and baby. As mentioned in the Birthweight and Gestation section, maternal smoking is associated with preterm and/or low birthweight babies. Smoking in pregnancy is also associated with increased risk of miscarriage, stillbirth and sudden unexpected death in infancy (SUDI). The Scottish Stillbirth Perinatal and Infant Mortality and Morbidity Report provides information on the incidence of stillbirth and SUDI. Smoking behaviour in pregnancy is collected at a woman's first antenatal booking appointment which usually takes place within the first three months of pregnancy. These booking appointments take place either at hospital or in the community and are recorded on the Scottish Woman Held Maternity Record, with data being subsequently transcribed onto the Scottish Morbidity Record (SMR02). Information on maternal smoking is also recorded at the health visitor's First Visit to the mother and baby which usually takes place about 10 days after the birth. Data from the First Visit is recorded on the Pre-school component of the Child Health Systems Programme (CHSP-PS).The CHSP-PS was introduced in 1991 and the number of participating boards has increased over the years. All NHS Boards in Scotland now use the CHSP-PS. In recent years, there have been concerns about the completeness and quality of the SMR02 data, and to a lesser extent, the CHSP-PS data. In the following charts, we present the data so that the reader can see the level of recording of all responses including 'unknown', and they can also compare the two systems. It should be noted that the CHSP-PS data does not record whether the woman was a 'former' smoker. The label of 'missing' in the CHSP-PS data is assumed to be equivalent to the label of 'Not Known' in the SMR02 data. There is considerable pressure on women not to smoke during pregnancy, and there is evidence of under-reporting by women of their smoking behaviour at the booking clinic1. The health visitors perform their First Visit at home, so it is less easy for the mother to hide evidence of smoking. Charts showing overall smoking rates, deprivation categories, NHS board and mother’s age for ‘Smoking history at Booking’ and ‘Smoking at health visitor’s first visit’ are shown on the following pages. Please refer to footnotes relevant to charts at end of Smoking and Pregnancy section. Links to the tables are available here: Table 8: Smoking history at booking; Scotland, NHS board, deprivation and maternal age Table 9: Smoking at health visitor’s first visit; Scotland, NHS board, deprivation and maternal age Reference:
1. Shipton D, Tappin D, Vadiveloo T, Crossley J, Aitken D, Chalmers J. Reliability of self reported smoking status by pregnant women for estimating smoking prevalence: a retrospective, cross sectional study. BMJ 2009;339:b4347.
16
Information Services Division
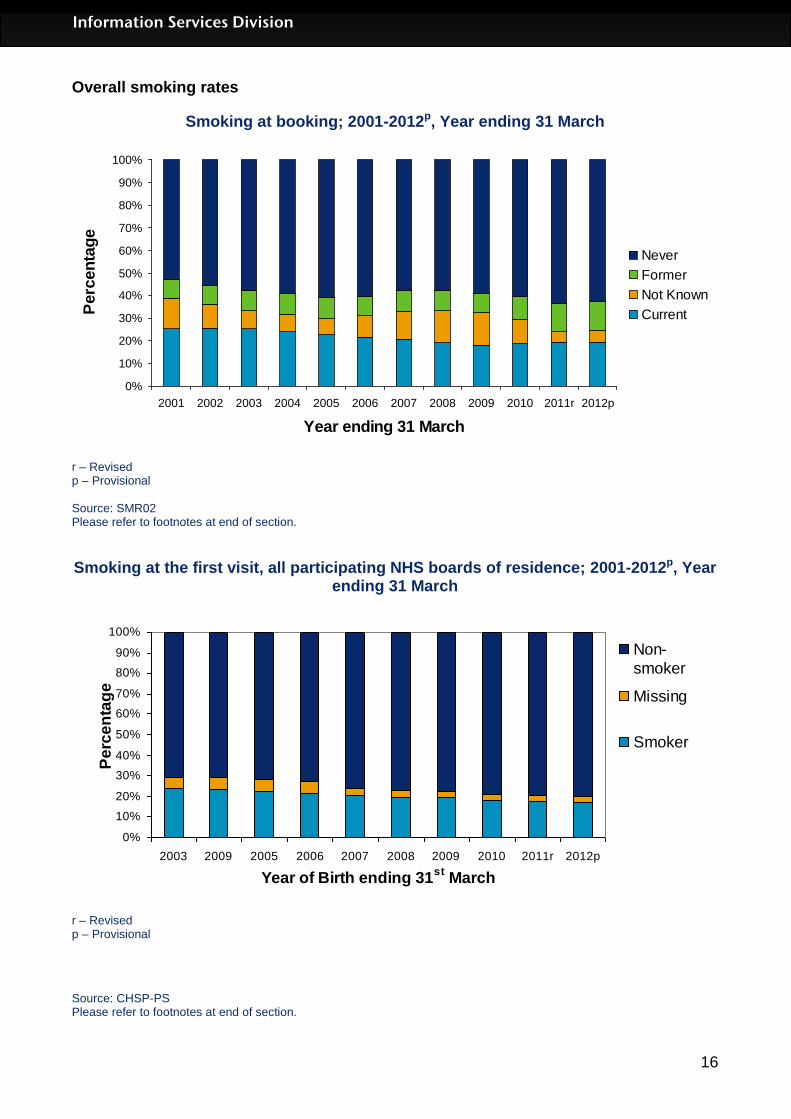
Overall smoking rates
Smoking at booking; 2001-2012p, Year ending 31 March
0%
10%
20%
30%
40%
50%
60%
70%
80%
90%
100%
2001 2002 2003 2004 2005 2006 2007 2008 2009 2010 2011r 2012p
Year ending 31 March
Perc
en
tag
e
Never
Former
Not Known
Current
r – Revised p – Provisional Source: SMR02 Please refer to footnotes at end of section.
Smoking at the first visit, all participating NHS boards of residence; 2001-2012p, Year ending 31 March
0%
10%
20%
30%
40%
50%
60%
70%
80%
90%
100%
2003 2009 2005 2006 2007 2008 2009 2010 2011r 2012p
Year of Birth ending 31st
March
Pe
rce
nta
ge
Non-
smoker
Missing
Smoker
r – Revised p – Provisional
Source: CHSP-PS Please refer to footnotes at end of section.
17
Information Services Division
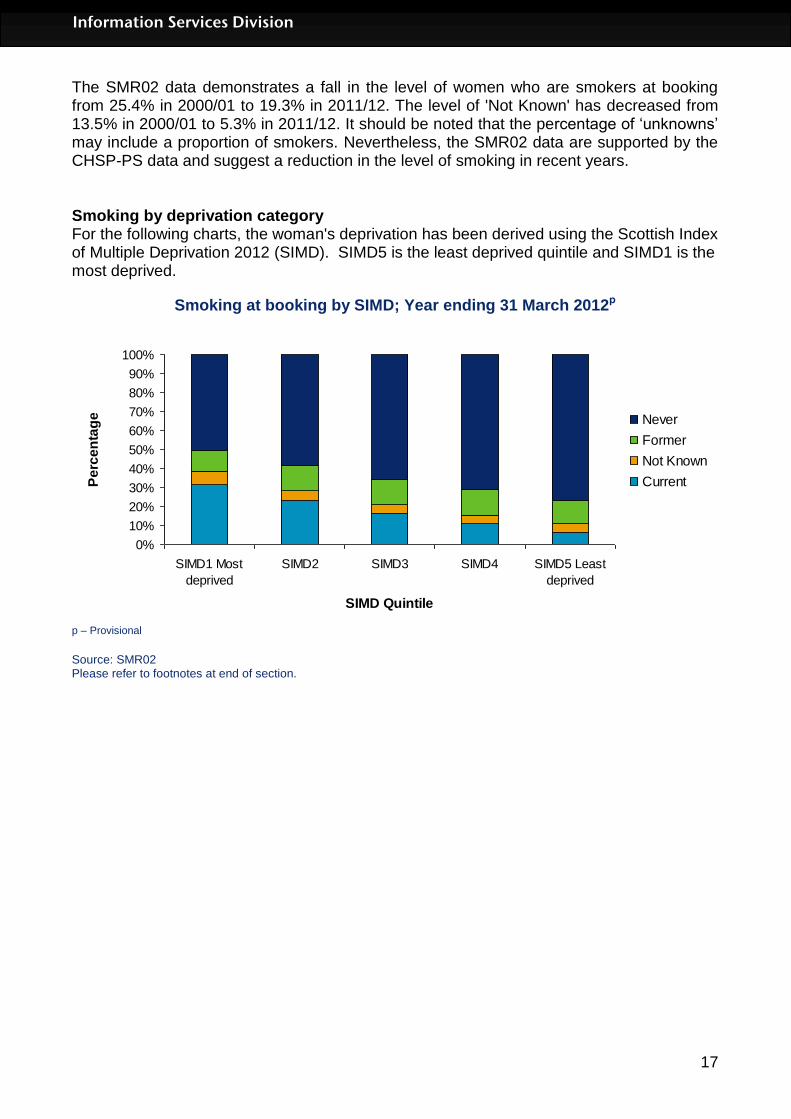
The SMR02 data demonstrates a fall in the level of women who are smokers at booking from 25.4% in 2000/01 to 19.3% in 2011/12. The level of 'Not Known' has decreased from 13.5% in 2000/01 to 5.3% in 2011/12. It should be noted that the percentage of ‘unknowns’ may include a proportion of smokers. Nevertheless, the SMR02 data are supported by the CHSP-PS data and suggest a reduction in the level of smoking in recent years. Smoking by deprivation category For the following charts, the woman's deprivation has been derived using the Scottish Index of Multiple Deprivation 2012 (SIMD). SIMD5 is the least deprived quintile and SIMD1 is the most deprived.
Smoking at booking by SIMD; Year ending 31 March 2012p
0%
10%
20%
30%
40%
50%
60%
70%
80%
90%
100%
SIMD1 Most
deprived
SIMD2 SIMD3 SIMD4 SIMD5 Least
deprived
SIMD Quintile
Pe
rce
nta
ge Never
Former
Not Known
Current
p – Provisional
Source: SMR02 Please refer to footnotes at end of section.

18
Information Services Division
Smoking at first visit by SIMD; Year ending 31 March 2012p
0%
10%
20%
30%
40%
50%
60%
70%
80%
90%
100%
SIMD 1 (Most
Deprived)
SIMD 2 SIMD 3 SIMD 4 SIMD 5 (Least
Deprived)
SIMD Quintile
Pe
rce
nta
ge
Non-
smoker
Missing
Smoker
p – Provisional Source: CHSP-PS Please refer to footnotes at end of section.
These charts demonstrate clearly the strong relationship between smoking and deprivation, with smoking at booking in 2011/12 ranging from 31.3% in SIMD1 to 6.6% in SIMD5.

19
Information Services Division
Smoking by NHS Board The following charts show the variation in smoking across NHS Boards. Please note the wide variation in the 'Not Known' category, especially in 'Smoking at Booking' data.
Smoking at booking by NHS Board of residence; Year ending 31 March 2012 p
0%
20%
40%
60%
80%
100%
Ayrsh
ire &
Arra
n
Border
s
Dum
fries
& G
alloway
Fife
Forth V
alley
Gra
mpian
Gre
ater
Glasg
ow &
Clyde
Highla
nd
Lana
rksh
ire
Loth
ian
Ork
ney
Shetla
nd
Tayside
West
ern Is
les
NHS Board of Residence
Pe
rce
nta
ge
Never
Former
Not Known
Current
p – Provisional Source: SMR02 Please refer to footnotes at end of section.
Smoking at first visit by participating NHS Board of review; Year ending 31 March 2012 p
0%
10%
20%
30%
40%
50%
60%
70%
80%
90%
100%
Ayrsh
ire &
Arra
n
Border
s
Dum
fries
& G
alloway
Fife
Forth V
alley
Gra
mpian
Gre
ater
Glasg
ow &
Clyde
Highla
nd
Lana
rksh
ire
Loth
ian
Ork
ney
Shetla
nd
Tayside
West
ern Is
les
NHS Board of Review
Pe
rce
nta
ge
Non-
smoker
Missing
Smoker
p – Provisional Source: CHSP-PS
20
Information Services Division
Please refer to footnotes at end of section.
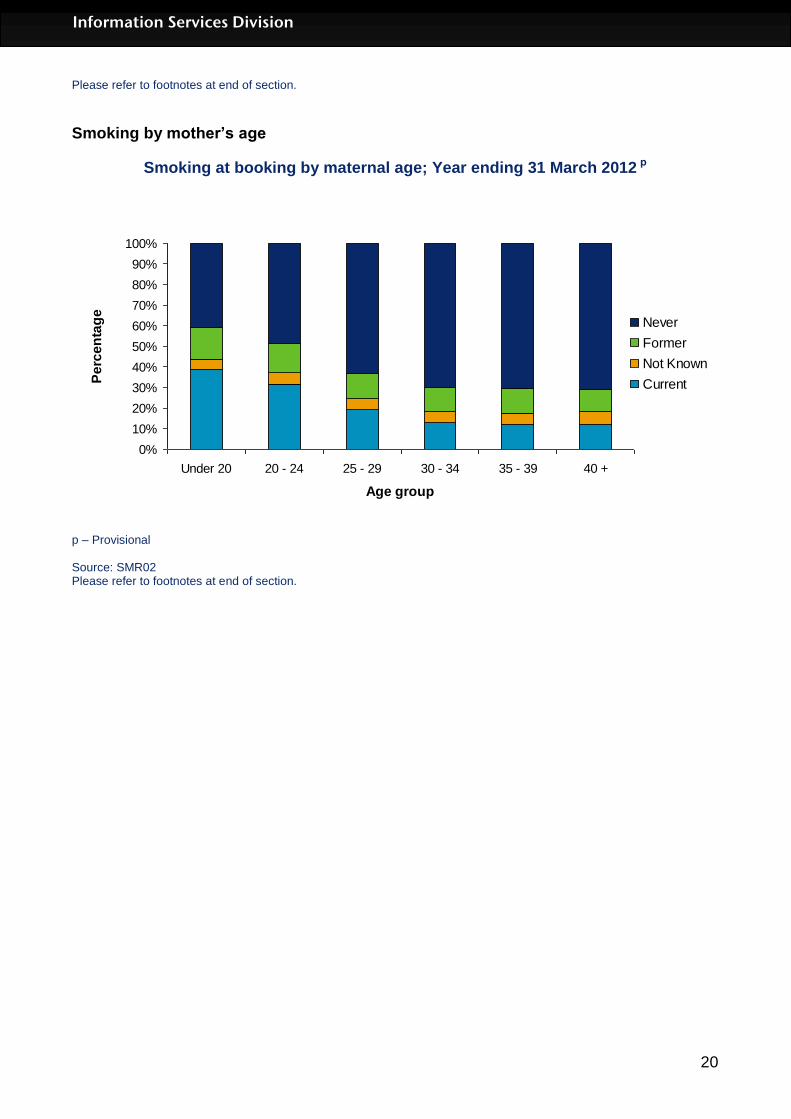
Smoking by mother’s age
Smoking at booking by maternal age; Year ending 31 March 2012 p
0%
10%
20%
30%
40%
50%
60%
70%
80%
90%
100%
Under 20 20 - 24 25 - 29 30 - 34 35 - 39 40 +
Age group
Pe
rce
nta
ge
Never
Former
Not Known
Current
p – Provisional Source: SMR02 Please refer to footnotes at end of section.
21
Information Services Division
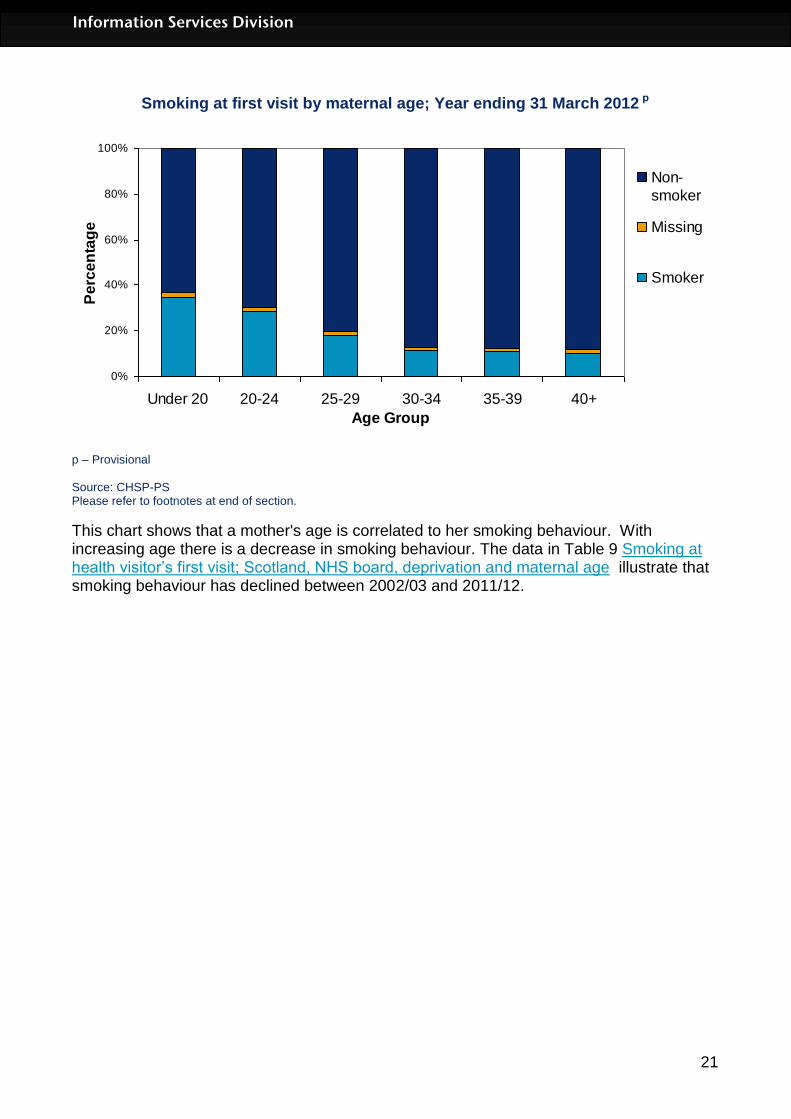
Smoking at first visit by maternal age; Year ending 31 March 2012 p
0%
20%
40%
60%
80%
100%
Under 20 20-24 25-29 30-34 35-39 40+
Age Group
Pe
rce
nta
ge
Non-
smoker
Missing
Smoker
p – Provisional Source: CHSP-PS Please refer to footnotes at end of section.
This chart shows that a mother's age is correlated to her smoking behaviour. With increasing age there is a decrease in smoking behaviour. The data in Table 9 Smoking at health visitor’s first visit; Scotland, NHS board, deprivation and maternal age illustrate that smoking behaviour has declined between 2002/03 and 2011/12.

22
Information Services Division
Miscarriage
Accurate assessment of the number of miscarriages (previously referred to as “spontaneous abortions”) that occur is not possible as only miscarriages that require hospital inpatient or day-case treatment are recorded. Hospital based information is derived from two sources: the acute hospital inpatient and day-case record (SMR01) and the maternity inpatient and day case record (SMR02), with individual episodes being derived from only one of these sources. It is possible that some, particularly early, miscarriages are either managed solely by General Practitioners or may not be recognised by the women and so are never referred to hospital. There is a general downward trend in the number of recorded miscarriages, falling from 7,546 in 1997/98 to 5,008 in 2011/12. The table in the link below shows the number of miscarriages by NHS board of residence and age group for year end 31st March 2012.
Table 11: Miscarriage by NHS board
23
Information Services Division
Level of Care of Newborn Babies
Although the majority of newborn babies adapt rapidly to life outside the womb, a proportion of babies need extra care. For the first time in this publication, we have used data from the Scottish Birth Record (SBR) to display the numbers and percentages of babies requiring different types of care. The main types of extra care are:
Intensive care: This is care provided for babies who are the most unwell or unstable and
have the greatest needs in relation to staff skills and staff to patient ratios. The 2010
standards document from the British Association for Perinatal Medicine (BAPM)
suggests that the ratio of suitably qualified nursing staff to babies would be of the order
of one nurse to one baby.
High dependency care: This is care provided for babies who require highly skilled staff
but where the ratio of nurse to patient is less than intensive care. The BAPM standards
suggest that this ratio would be of the order of one nurse to two babies.
Special care: Special care is provided for babies who require additional care delivered
by the neonatal service but do not require either Intensive or High Dependency care.
The BAPM standards suggest that this ratio would be of the order of one nurse to four
babies.
For each baby, we have sought the most intensive type of care used following birth. So if a baby had initially been admitted to “Special care” and then required to be transferred to “Intensive care”, the baby would be recorded in this table as requiring “Intensive care”. The data for the Scottish Birth Record are collected in different ways in the various hospitals in Scotland. Some enter data directly onto the system and for others the data may be collected onto a separate system and transferred electronically to the SBR. Some units only collect minimal data on healthy babies and this is reflected in the high levels of data for which ‘Level of Care’ is labelled as ‘Missing/Unknown’. Further investigation of the data by birthweight, including linkage to SMR02 data to obtain more complete information, suggests that the majority of such births were of normal birthweight (2500-5999g) and therefore less likely to have required extra care. However, as with the publication of any new type of information, there are likely to be concerns about completeness and accuracy. Readers are therefore encouraged to treat these data as being provisional, and to contact ISD if they think that there are important discrepancies between what they expect to see and the data that are displayed. It is often by publishing such data that problems can be identified and the data improved. The tables here are presented by the NHS Board of residence rather than by hospital. They suggest that approximately 11.4% of babies require some sort of extra care, with 2.0% of these babies requiring intensive care. The balance of the different types of extra care varies by Board of residence and this probably reflects the availability of different type of provision in the main hospitals serving the NHS Boards.

24
Information Services Division
Live births1 by level of care and health board of residence, Scotland Year ending March 2012p
Level of Care
Health Board of Residence
Intensive Care HDU
Special Care
Total Requirin
g Extra Care Other
2
Missing/ Unknown
3 Total
Ayrshire & Arran 108 60 243 411 337 3078 3826
Borders 17 5 96 118 898 18 1034
Fife 18 12 365 395 357 3412 4164
Greater Glasgow & Clyde 166 64 1535 1765 86 12461 14312
Highland 31 9 355 395 2196 570 3161
Lanarkshire 197 334 507 1038 118 5236 6392
Grampian 200 62 445 707 2122 3478 6307
Orkney 10 0 9 19 114 73 206
Lothian 157 20 708 885 8795 32 9712
Tayside 138 148 138 424 3806 96 4326
Forth Valley 87 46 168 301 68 2856 3225
Western Isles * * * 17 197 35 249
Dumfries & Galloway * * 128 159 1204 50 1413
Shetland 10 0 13 23 165 60 248
Unknown 6 * * 32 164 41 237
Total 1174 769 4746 6689 20627 31496 58812
Ayrshire & Arran 2.8% 1.6% 6.4% 10.7% 8.8% 80.4% 100.0%
Borders 1.6% 0.5% 9.3% 11.4% 86.8% 1.7% 100.0%
Fife 0.4% 0.3% 8.8% 9.5% 8.6% 81.9% 100.0%
Greater Glasgow & Clyde 1.2% 0.4% 10.7% 12.3% 0.6% 87.1% 100.0%
Highland 1.0% 0.3% 11.2% 12.5% 69.5% 18.0% 100.0%
Lanarkshire 3.1% 5.2% 7.9% 16.2% 1.8% 81.9% 100.0%
Grampian 3.2% 1.0% 7.1% 11.2% 33.6% 55.1% 100.0%
Orkney 4.9% 0.0% 4.4% 9.2% 55.3% 35.4% 100.0%
Lothian 1.6% 0.2% 7.3% 9.1% 90.6% 0.3% 100.0%
Tayside 3.2% 3.4% 3.2% 9.8% 88.0% 2.2% 100.0%
Forth Valley 2.7% 1.4% 5.2% 9.3% 2.1% 88.6% 100.0%
Western Isles * * * 6.8% 79.1% 14.1% 100.0%
Dumfries & Galloway * * 9.1% 11.3% 85.2% 3.5% 100.0%
Shetland 4.0% 0.0% 5.2% 9.3% 66.5% 24.2% 100.0%
Unknown 2.5% * * 13.5% 69.2% 17.3% 100.0%
Total 2.0% 1.3% 8.1% 11.4% 35.1% 53.6% 100.0%
Source: SBR 1Live births only, stillbirths are excluded. Multiple births are included.
2Other includes mainly normal and transitional care, although a very small number of births requiring medical
and home care are also included. 3Where boards have a large proportion of births recorded in the Missing/Unknown category the majority are
thought to have required normal care. p – Provisional. * Indicates values that have been suppressed due to the potential risk of disclose and to help maintain patient confidentiality.

25
Information Services Division
Drug Misuse in Pregnancy
This section is based on maternity data (SMR02) and neonatal discharges (Scottish Birth Record) collected by ISD. Care should be taken when comparing numbers over time as hospitals have improved recording of drug misuse data items over the last 5 years. These items were made mandatory as of April 2011, so there was improved recording of these items in anticipation of that change. The number of maternities recording drug misuse was 1,119 (19.6 per 1,000 maternities) in 2011/12. This is a slight decrease on the previous year at 1,187 (20.7 per 1,000 maternities) in 2010/11. Rates have doubled over the last 5 years with 516 (9.0 per 1,000 maternities) recording drug misuse in 2007/08. This change in rates is likely to be as a result of better recording of data, as noted above. In 2011/12, 2.0% (nearly 1 in 50) of maternities in Scotland recorded drug misuse. Nearly half of those (552) recorded misuse of opioids. (See Table 14.2.) There is variation in the rate of maternities recording drug misuse by NHS board, from 49.4 per 1,000 maternities for NHS Lothian during the 3 year period 2009/10-2011/12 to 6.7 per 1,000 for NHS Lanarkshire. Differing levels of data completeness across hospitals is thought to contribute to some of this variation. The trend over the last 5 years is increasing with the largest increase seen in NHS Lothian. This increase in rates is likely to be as a result of better recording of data, as noted above. (See Table 14.1.) In 2011/12, of the 1,135 births to mothers recording drug misuse, 77.0% were reported as having a full-term normal birthweight (874). This compared to 90.4% of all births recorded as having a full-term normal birthweight. 13.5% of births recording drug misuse were preterm, almost double that for all births at 7.4%. (See Table 14.3.) The rate of maternities recording drug misuse was 2.8 times as many in the most deprived category (31.8 per 1,000 births) as in the least deprived (11.5 per 1,000 births) in 2011/12. (See Table 14.4.) The rate of neonatal discharges recording drug misuse (the baby was affected by or had withdrawal symptoms from maternal use of drugs or drug addiction) was 5.6 per 1,000 live births for the period 2009/10-2011/12. (See Table 14.5.) In 2011/12, 376 babies (not shown in table) were recorded as being affected by drug misuse. It should be noted that NHS Forth Valley were unable to record drug misuse information for discharges in 2010/11 and 2011/12 on SBR.

26
Information Services Division
Glossary All births When four or more babies are born, details about the babies are
only recorded on the SMR02 for the first three babies delivered. However, the total number of births from the pregnancy are recorded.
Antenatal Occurring before birth.
Delivery A delivery is a pregnancy resulting in a live or still birth.
Deprivation Category Tables presenting information by deprivation category have been based on the Scottish Index of Multiple Deprivation (SIMD) 2012 quintiles.
Elective Caesarean An elective caesarean section refers to a caesarean section, which has been planned in advance and in most cases will have been recommended for clinical reasons such as breech or multiple births or previous caesarean section. It may also be the case that the woman will have chosen this method of delivery for non-clinical reasons.
Full term A birth is considered full-term if the delivery occurs during or after the 37th week of gestation.
Live Births A live birth is defined as a birth where the baby was born breathing or showing other signs of life.
Low birthweight Babies with a birthweight of less than 2,500 grams.
Macrosomic Babies with an abnormally large body size.
Maternity A pregnancy resulting in a live or stillbirth, with multiple births being counted only once.
Multiple birth A baby from a pregnancy resulting in more than one live or stillbirth.
Parity Refers to the number of previous pregnancies resulting in a live or stillbirth.
Postnatal Occurring after birth.
Pregnancy The period during which a woman is pregnant.
Preterm A birth is considered preterm if the delivery occurs before the 37th completed week of gestation.
Singleton birth A baby from a pregnancy resulting in only one live or stillbirth.
Stillbirths The Registration of Births, Deaths and Marriages (Scotland) Act 1965 defines a stillbirth as a child which was born after the 24th week of pregnancy and which did not breathe or show any other sign of life.
Very low birthweight Babies with a birthweight of less than 1,500 grams.

27
Information Services Division
List of Tables
Table No. Name Time period File & size
1 Births by outcome;
Scotland
NHS board of residence
Local Council Area
Community Health Partnership
1976 - 2012 1998 - 2012 1998 - 2012 1998 – 2012
Excel [495kb]
2 Maternities by maternal age;
Scotland
NHS board of residence
Local Council Area
Community Health Partnership
1976 - 2012 1998 - 2012 1998 - 2012 1998 - 2012
Excel [313kb]
3 Maternities (first birth and all births) by maternal age and deprivation
Scotland
NHS board of residence
1998 - 2012
Excel [497kb]
4 Live births by mode of delivery and induction;
Scotland
NHS board of residence
hospital
1976 - 2012 1998 - 2012 2000, 2005,
2012
Excel [467kb]
5 Live births (all, singleton and multiple) by birthweight and gestation
Scotland
NHS board of residence
1976 - 2012
Excel [1531kb]
6 All births (live and still), pre-term and full term by birthweight
Scotland
NHS board of residence
1976 - 2012
Excel [401kb]
7 Live births (all, singleton and multiple) by birthweight and deprivation
Scotland
NHS board of residence
1998 - 2012
Excel [501kb]
8 Smoking history at booking;
Scotland
NHS board of residence
deprivation
maternal age
2001 - 2012 2001 - 2012 2001 - 2012 2001 - 2012
Excel [639kb]
9 Smoking at health visitor’s first visit;
Scotland
NHS board of residence
deprivation
maternal age
2001 - 2012 2001 - 2012 2001 - 2012 2001 – 2012
Excel [280kb]
10 Appropriate for gestational age
Summary
Small
Appropriate
Large
2012 Excel [104kb]

28
Information Services Division
Exclusions
11 Miscarriages by maternal age
NHS board of residence
2001 - 2012 Excel (214kb)
12 Early access to antenatal services
Scotland
NHS board of residence
2012
Excel (358kb)
13 Level of care
NHS board of residence
2012
Excel (27kb)
14 Drug misuse in pregnancy
Scotland
NHS board of residence
Local Council Area
2006 - 2012
Excel (68kb)
List of Charts
Chart No. Name Time period File & size
1 NRS birth registrations v SMR02 births 1855 – 2011 SMR02 from 1980
Excel [39kb]
2 First birth by maternal age and deprivation 2012 Excel [52kb]
3 Live singleton births by mode of delivery 1998-2012 Excel [55kb]
4 Live singleton births by birthweight and gestation
1998 - 2012
Excel [59kb]
5 Smoking at booking by deprivation 1998-2012 Excel [59kb]
6 Healthy Birthweight, Scotland, 2001-2012 2001-2012 Excel [20kb]
7 Healthy Birthweight, by NHS Board, 2012 2012 Excel [22kb]

29
Information Services Division
Contact Kenny McIntyre Senior Information Analyst [email protected] 0131 275 6557 Celina Davis Principal Information Analyst [email protected] 0131 275 6199
Further Information Further information can be found on the ISD website
Rate this publication Click here to provide feedback and rate this publication.
30
Information Services Division
Appendix
A1 – Background Information
Maternity Data Source (inpatients and day cases) Hospital based maternity and birth data are derived from the maternity inpatient and day case record (SMR02). Births In Scotland the most reliable number of births is based on the civil registration system administered by the National Records of Scotland (NRS). However, NRS numbers are based on the date of registration of the births rather than the date of birth, so that a child born in late December of one year may not be registered until the following year. The data presented on these web pages are derived from SMR02 (maternity hospital records) and are based on date of discharge from hospital. Unlike civil registrations, there is no legal requirement to complete the maternity return, with under-recording of home births being one area for particular concern. Coverage and completeness Since 1975/76 the SMR02 system has achieved national coverage of approximately 98 per cent of all births and pregnancies and includes a wide range of clinical data such as birthweight, gestational age, mode of delivery, induction and outcome of pregnancy. More recently, information on smoking during pregnancy (1993/94) and drug and alcohol misuse (2003/04) has been introduced. There are, however, concerns about the completeness and accuracy of the recording of these variables. See note below on issues regarding smoking data. Delivery records account for approximately half of all SMR02 discharges each year with antenatal, postnatal and abortion episodes forming the remaining discharges (see also Teenage Pregnancy and Abortion Act Statistics). Tables in this website which are based on SMR02 information exclude home births. Detailed birth information about the fourth or subsequent babies (third prior to 1997) in a multiple delivery is also not available from this source, as the SMR02 can only facilitate the recording of information on three babies (two prior to 1997). The data for year ending 31 March 2012 should be regarded as provisional and will be revised at the update next year. Throughout this publication, figures shown for each year relate to live births, still births, maternities, or pregnancies which occurred in the year ending 31 March. The one exception to this is the section on NRS birth registrations v’s SMR02 births, which is based on year ending 31 December. Population data used for calculating age specific rates are provided by the National Records of Scotland (NRS). Healthy Birthweight The data in the accompanying tables have been produced by comparing the birthweights and gestations of singleton and multiple live births with a set of standard tables derived from Scottish data on all births from the years 1998-2003. The details of the way in which the standards were derived are available here: http://www.biomedcentral.com/1471-2393/8/5.

31
Information Services Division
The birthweights of both live and stillborn babies were included during the production of the standard tables. Only babies with lethal congenital anomalies and obvious outliers, such as those with recorded birthweights less than 250 grams, were excluded. As the analysis provided in this report includes only live births, this means there are some issues with comparability to the standard tables. Stillborn babies on average have lower birthweight than live born babies of comparable gestation. This means that the proportion of babies who are small for gestational age (under the 5th centile) will be slightly lower than 5% when only live born babies are considered. As the proportion of births that are stillborn is highest at the lowest gestations, this effect will be most pronounced for severely or extremely preterm babies (specifically gestational age 24-31 weeks in this report). However, because such a small proportion of babies are so preterm (less than 1%), there is very little effect on the overall healthy birthweight figure and comparison of trends in the data over time is not affected. Scottish Index of Multiple Deprivation 2012 (SIMD 2012) Tables presenting information by deprivation category have been based on the Scottish Index of Multiple Deprivation (SIMD) 2012 quintiles. Previous publications used SIMD 2009. Quintile 1 represents most deprived and 5 represents least deprived. Deprivation for individuals is estimated from aggregate data derived from the census and other routine sources. These are used to estimate the deprivation of individuals in small geographical areas. The Scottish Index of Multiple Deprivation has seven domains (income, employment, education, housing, health, crime, and geographical access), which have been combined into an overall index to pick out area concentrations of multiple deprivation. Further information about SIMD can be found at: http://www.isdscotland.org/Products-and-Services/Deprivation/Deprivation-Overview/ Our policy of population-weighting the quintiles remains unchanged, so the datazones contained within each quintile will differ slightly to those presented in Scottish Government releases.
Smoking and Pregnancy
Accuracy of Smoking at Booking Data Data on smoking behaviour is based on self-reported information obtained from mothers at their ante-natal booking visit in the community or at hospital. The 'smoking at booking' data item was introduced in 1993/94 and it should be noted that, particularly in the earlier years and again more recently, this information is not always recorded and therefore can affect the results. Because of concerns about the quality of 'smoking at booking' data, care should be taken in interpreting the results. Data exclude home births and births at non-NHS hospitals.

32
Information Services Division
Smoking at First Visit These statistics are derived from data recorded at the health visitor First Visit review (at around 10 days old), for NHS Boards in Scotland which participate in the Child Health Systems Programme Pre-School system (CHSP-PS). The CHSP-PS system facilitates the call/recall of children for reviews from shortly after birth until school entry and records results. The system is dynamic, with ongoing updating of records. For this reason there can be very minor changes to the published data for previous years, however any changes are negligible. The number of Boards using the CHSP Pre-School system and recording data has increased since 2001/02 from 10 to all 14 NHS Boards in Scotland. NHS Western Isles have recorded data from 2006/07, NHS Shetland from 2008/09, and NHS Grampian and NHS Orkney from 2010/11. Data for NHS Grampian and NHS Orkney for 2010/11 are partial. These Boards implemented the system in June 2010 and July 2010 respectively and therefore data are not available for babies born in the first quarter of 2010/11 who had a First Visit before the implementation date. In addition it should be noted that NHS Highland did not fully implement the system until May 2007, though data are available for the area of NHS Highland inherited from former NHS Argyll & Clyde (i.e. Argyll & Bute Council Area) for financial years 2001/02 to 2006/07. Three of the four NHS Boards that don’t have data available for all years are island boards (Orkney, Shetland and Western Isles). These boards have a small number of births each year and therefore the impact of data not being available for these boards on the ‘Scotland’ / ‘All participating NHS Boards’ rates and trend is negligible. However NHS Grampian has a relatively large number of births each year (around 10% of all births in Scotland). Grampian did not start recording data on the system until 2010/11 and the reported smoking rates in Grampian in 2010/11 and 2011/12 are lower than the Scotland average. This means that if Grampian data had been available for years 2001/02 to 2009/10, it is likely that the ‘Scotland’ level reported smoking rates at the First Visit would have been slightly lower for these years. This should be borne in mind when comparing the ‘Scotland’ rates for 2010/11 and 2011/12 with previous years. Please refer to the notes pages at : Smoking at health visitor’s first visit; Scotland, NHS board, deprivation and maternal age for further information. Accuracy of Smoking at First Visit Data The CHSP PS system, from which these statistics are derived, facilitates the call/recall of children for reviews from shortly after birth until school entry and records results. The system is dynamic, with ongoing updating of records. For this reason there can be very minor changes to previously published data for previous years, however any changes are negligible. Please refer to the notes pages at : Smoking at health visitor’s first visit; Scotland, NHS board, deprivation and maternal age for further information. Drug Misuse in Pregnancy This section is based on maternity data (SMR02) and neonatal discharges (Scottish Birth Record) collected by ISD. Care should be taken when comparing numbers over time as hospitals have improved recording of drug misuse data items over the last 5 years. These items were made mandatory as of April 2011, so there was improved recording of these

33
Information Services Division
items in anticipation of that change. This will mean that more will be known about drug use in pregnancy in comparison to previous years. While the number of maternities recording drug misuse (from the SMR02 dataset) has increased in recent years, the number of neonatal discharges recording drug misuse (SMR11 & SBR) has remained relatively steady. Note that a greater number of births than maternities can be recorded as multiple births are recorded as only one maternity. To minimise the potential risk of disclosure where data is shown by NHS board and council area, data have been grouped up into 3 year rolling aggregates in Tables B4.1 and B4.5. Drugs misuse is recorded on the SMR02 using the following ICD10 codes: ICD10 Description
F11 Opioids
F12 Cannabinoids
F13 Sedatives or Hypnotics
F14 Cocaine
F15 Other Stimulants
F16 Hallucinogens
F18 Volatile Solvents
F19 Multiple / Other Psychoactive Substances
O35.5 Maternal care for suspected damage to foetus by drugs
Additionally drug misuse can be recorded as a hard-coded data item (ie – there is a small number of possible choices rather than the broad range of codes available in a system such as ICD10), which was introduced in April 2003. However, not all hospitals are able to submit using the hard-coded data item, as their patient administration system (PAS) has not been modified to allow this. It should be noted that the NHS Tayside data issues in 2006/07 have been addressed and the data have been revised. There were a number of duplicate records (approx. 500) deleted from the file, and a shortfall in data from NHS Tayside for financial year 2006/07 which cannot be resolved. There was also a small impact on surrounding NHS Board area figures for these years related to this issue. SMR02 Quality Assurance Assessment An assessment of SMR02 data quality was carried out by the Data Quality Assurance Team at ISD. Results were published in April 2010 and are available at www.isdscotland.org/data_quality_assurance. This audit assessed 34 data items from the maternity dataset (SMR02) against information found in the medical record or Scottish Woman-Held Maternity Record (SWHMR). While 18 of the data items did match in 90% or more of the records, the remaining 16 data items matched with less than 90% of the records, five of these were very poorly recorded with fewer than 40% matching. One of the recommendations from this report was that 4 of the 5 data items that were very poorly recorded should become mandatory, rather than remain optional, to improve the quality of this data. These included the following 3 drug misuse related items: (1) Drug Misuse During this Pregnancy
(2) Ever Injected Illicit Drugs
(3) Drugs Used
34
Information Services Division
As a result of the report recommendation, the ‘Drug Misuse During this Pregnancy’ data item changed from optional to mandatory in April 2011. Neonatal discharges Neonatal discharges were originally recorded using SMR11 records (including from neonatal units and postnatal cots), with records being generated for sick babies who fall into one of the following categories: Babies who require medical care (other than resuscitation immediately after birth or routine screening), Babies who have a congenital anomaly (whether or not medical treatment is given at that time). The SMR11, which was completed only for sick babies admitted to neonatal units, was replaced by the Scottish Birth Record (SBR) from April 2003. The SBR has been incrementally implemented across Scotland from 2003, with all areas now using SBR to record information for sick babies, and the majority of areas now recording information on all births. Drugs misuse is recorded on the SMR11 and the SBR returns using the following ICD10 codes in addition to those listed for SMR02. ICD10 Description
P04.4 Foetus and newborn affected by maternal use of drugs of addiction
P96.1 Neonatal withdrawal symptoms from maternal use of drug addiction
The figures presented here cover 3 year aggregates, 2003/04-2005/06 to 2009/10-2011/12. Data for all years shown are revised, so may be different from previously published figures. Care should be taken when comparing numbers over time, as there has been an improvement in drug misuse recording over the last five years. However, it is also worth noting that recording practice of drug misuse diagnoses may vary between hospitals, which may explain some of the variation between NHS health boards or council areas. The replacement of SMR11 with the SBR, which occurred incrementally across Scotland, may also have had an impact on these figures. We are also aware that some outstanding clinical coding has been entered on the SBR and figures for recent years have increased and differ from those previously published. Further information Information on the background of the Scottish Birth Record and current development is available at http://www.isdscotland.org/Products-and-Services/Scottish-Birth-Record/. Further statistics relating to births are available at http://www.isdscotland.org/Health-
Topics/Maternity-and-Births/Births/. The Data Quality Assurance, Assessment of Maternity Data (SMR02) 2008-2009 is available at www.isdscotland.org/data_quality_assurance.

35
Information Services Division
A2 – Publication Metadata
Metadata Indicator
Description
Publication title
Births in Scottish Hospitals
Description Annual update to information on births in Scottish NHS hospitals. This includes information on the mother, the delivery and the baby, available at various geographies including NHS Board, Local Council Area, Community Health Partnership and hospital level.
Theme Health and Social Care.
Topic Maternity and pregnancy services.
Format Excel workbooks.
Data source(s) SMR02 (maternity hospital discharge summary), SMR01 (acute hospital discharge summary) in miscarriage data and CHSP-PS (child health systems programme-pre school.
Date that data are acquired
1st July 2013 (two months prior to release).
Release date 27 August 2013
Frequency Annual
Timeframe of data and timeliness
Data for financial year ending 31 March 2013. The delay between data timeframe and date of publication timeliness is mainly due to delays in data submission from some NHS boards. Publication of data is generally delayed until SMR02 submission is estimated to be around 97-98% complete.
Continuity of data
Reports data from 1975/76.
Revisions statement
Data are generally noted as provisional (due to a small shortfall in completeness of data) at time of publication. The data are then revised at next year's update. Concepts and definitions
Revisions relevant to this publication
Maternal Smoking at First Visit figures for all years revised. See Appendix A1 Smoking at First Visit section. For the first time in this publication, we have used data from the Scottish Birth Record (SBR) to display the numbers and percentages of babies requiring different types of care. Also new to this publication, although previously published in Drug Misuse Statistics Scotland, are data on drug misuse in pregnancy. These data are sourced from SMR02 (maternity data) and SBR (neonatal discharges).
Concepts and definitions
http://www.isdscotland.org/Health-Topics/Maternity-and-Births/Births
Relevance and key uses of the statistics
Making information publicly available for planning, epidemiology, provision of services and the statistics provides comparative information.
Accuracy SMR02 data are subjected to validation on submission. The figures are compared to previous years' figures and to expected trends. The SMR02 data are also occasionally assessed for accuracy by ISD's Data Quality Assurance -- see latest report 'Data Quality Assurance (Assessment of

36
Information Services Division
Maternity Data) 2008-09' Report at http://www.isdscotland.org/Products-and-Services/Data-Quality
Completeness There is generally around a 1-3% shortfall in the number of births when compared to the National Records of Scotland (NRS) birth registrations, formerly General Register Office Scotland (GROS). Some of this shortfall is due to data on home births not being available from SMR02 data source. For comparison of SMR02 births v NRS registrations see: http://www.isdscotland.org/Health-Topics/Maternity-and-Births/Publications/2013-08-27/mat_bb_chart1.xls
Comparability Maternity data for England are published by NHS information Centre at HES Online (http://www.hesonline.nhs.uk/Ease/servlet/ContentServer?siteID=1937&categoryID=1009) - some of this will be directly comparable with Scottish published data e.g. birthweight, gestation. Where directly comparable, Scottish maternity data are regularly provided to ONS, Department of Health for contribution to both UK and International reports/databases e.g. UK Health Statistics, Social Trends, European Health for All database. In these comparisons, data are provided only at national (Scotland) level or may be aggregated to UK.
Accessibility It is the policy of ISD Scotland to make its web sites and products accessible according to published guidelines.
Coherence and clarity
Births in Scottish Hospital tables are accessible via the ISD website at http://www.isdscotland.org/Health-Topics/Maternity-and-Births/Births Drop down menus are presented where appropriate e.g. for selection of geography i.e. NHS board/local council area/community health partnership or for selection of singleton/multiple/all births or live/stillbirths/total births.
Value type and unit of measurement
Numbers and crude rates are presented.
Disclosure The ISD protocol on Statistical Disclosure Protocol is followed: http://www.isdscotland.org/Products-and-Services/Data-Protection-and-Confidentiality
Official Statistics designation
National Statistics.
UK Statistics Authority Assessment
http://www.statisticsauthority.gov.uk/assessment/assessment/assessment-reports/assessment-report-110---statistics-on-maternities-and-births-in-scotland.pdf
Last published 27 November 2012
Next published August 2014
Date of first publication
1975
Help email [email protected]
Date form completed
29 July 2013

37
Information Services Division
A3 – Early Access details (including Pre-Release Access)
Pre-Release Access Under terms of the "Pre-Release Access to Official Statistics (Scotland) Order 2008", ISD are obliged to publish information on those receiving Pre-Release Access ("Pre-Release Access" refers to statistics in their final form prior to publication). The standard maximum Pre-Release Access is five working days. Shown below are details of those receiving standard Pre-Release Access and, separately, those receiving extended Pre-Release Access. Standard Pre-Release Access:
Scottish Government Health Department NHS Board Chief Executives NHS Board Communication leads
Extended Pre-Release Access Extended Pre-Release Access of 8 working days is given to a small number of named individuals in the Scottish Government Health Department (Analytical Services Division). This Pre-Release Access is for the sole purpose of enabling that department to gain an understanding of the statistics prior to briefing others in Scottish Government (during the period of standard Pre-Release Access).
Scottish Government Health Department (Analytical Services Division)

38
Information Services Division
A4 – ISD and Official Statistics
About ISD Scotland has some of the best health service data in the world combining high quality, consistency, national coverage and the ability to link data to allow patient based analysis and follow up. Information Services Division (ISD) is a business operating unit of NHS National Services Scotland and has been in existence for over 40 years. We are an essential support service to NHSScotland and the Scottish Government and others, responsive to the needs of NHSScotland as the delivery of health and social care evolves. Purpose: To deliver effective national and specialist intelligence services to improve the health and wellbeing of people in Scotland. Mission: Better Information, Better Decisions, Better Health Vision: To be a valued partner in improving health and wellbeing in Scotland by providing a world class intelligence service. Official Statistics Information Services Division (ISD) is the principal and authoritative source of statistics on health and care services in Scotland. ISD is designated by legislation as a producer of ‘Official Statistics’. Our official statistics publications are produced to a high professional standard and comply with the Code of Practice for Official Statistics. The Code of Practice is produced and monitored by the UK Statistics Authority which is independent of Government. Under the Code of Practice, the format, content and timing of statistics publications are the responsibility of professional staff working within ISD. ISD’s statistical publications are currently classified as one of the following:
National Statistics (ie assessed by the UK Statistics Authority as complying with the Code of Practice)
National Statistics (ie legacy, still to be assessed by the UK Statistics Authority)
Official Statistics (ie still to be assessed by the UK Statistics Authority)
other (not Official Statistics) Further information on ISD’s statistics, including compliance with the Code of Practice for Official Statistics, and on the UK Statistics Authority, is available on the ISD website. The United Kingdom Statistics Authority has designated these statistics as National Statistics, in accordance with the Statistics and Registration Service Act 2007 and signifying compliance with the Code of Practice for Official Statistics. Designation can be broadly interpreted to mean that the statistics:
meet identified user needs;
are well explained and readily accessible;
are produced according to sound methods, and
are managed impartially and objectively in the public interest. Once statistics have been designated as National Statistics it is a statutory requirement that the Code of Practice shall continue to be observed.