Birkbeck Commons Introduction
15
1 Moorland Habitat Monitoring: A resurvey of Selected Moorland Agri-environment Agreement Sites: Site reports – No.2 Birkbeck Commons 1. Introduction Natural England (NE) and its predecessors has carried out a series of monitoring programmes on many upland sites in England that contain Priority Habitats, including dry and wet heath, blanket bog and calcareous grassland. These sites have been managed under agri-environment schemes for up to two decades or more, and some were formerly also subject to grazing restrictions under Environmental Cross Compliance (ECC) regulations. Monitoring focussed initially on the condition of heather (Calluna vulgaris) in relation to grazing pressure, and latterly also on the overall condition of the vegetation across the range of habitats present on a site. The aim of this project was to re-survey a selection of these sites using standardised methods, and to provide a series of individual site reports describing their current and changing habitat condition, along with a separate overview of the findings from the complete set of sites. Data from the surveys have also been provided to NE to allow more detailed examination of individual sites to help guide local management inputs. Each site comprised a whole moorland grazing unit and encompassed a range of vegetation types. A range of variables was recorded at 100 randomly located sample points in each site. Variables to be recorded were agreed with NE prior to the survey, to assess heather grazing and the condition of key habitats. The methodology was based on a modified version of the NE overgrazing surveillance methodology (including laboratory assessment of a heather Grazing Index) and the Common Standards Monitoring (CSM) Guidance for Upland Habitats. Full details of the project objectives and methodology are given in the main overview report. Defra, UK - Science Search The Birkbeck Commons site was re-surveyed during 18 – 27 February 2015. Results of the survey are presented in a standard format in the following sections. Management information (particularly grazing) is also summarised from reports provided by NE. An assessment is then made of change in vegetation since the previous surveys and this is considered in the context of current and past management practices. 2. Overview 2.1 General description Birkbeck Commons is located in the Lake District and is 714 ha in area. It is part of the Shap Fells SSSI and Lake District High Fells SAC. A significant proportion of the site comprises rough acid grassland (29% of sample points in 2015), along with blanket bog (21%), flushes, fens & swamps (16%) and fragmented heath (15%) (Figure 1). The site is generally wet, with a few areas dominated by Myrica gale. Wet heath is also present but is somewhat degraded. In addition to domestic livestock (including 15 – 20 ponies present during the survey) it is grazed by red deer. Heather was only present at 33% of sample points, with overall mean cover of 14% (Figure 3a). In wet heath and heather heath vegetation types its mean cover was 47%, but only 9% in fragmented heath. Heather was in the building growth stage at just over two thirds of the sample point where it was present, and the mature stage at the remainder; no pioneer or degenerate heather was recorded (Figure 3c). Recent burning was only recorded at one sample point (Figure 3e). The most commonly dominant graminoid across the site was Nardus stricta (49% of sample points; Figure 3h).
Transcript of Birkbeck Commons Introduction
1
Moorland Habitat Monitoring: A resurvey of Selected Moorland Agri-environment Agreement Sites: Site
reports – No.2
Birkbeck Commons
1. Introduction
Natural England (NE) and its predecessors has carried out a series of monitoring programmes on
many upland sites in England that contain Priority Habitats, including dry and wet heath, blanket bog
and calcareous grassland. These sites have been managed under agri-environment schemes for up
to two decades or more, and some were formerly also subject to grazing restrictions under
Environmental Cross Compliance (ECC) regulations. Monitoring focussed initially on the condition of
heather (Calluna vulgaris) in relation to grazing pressure, and latterly also on the overall condition of
the vegetation across the range of habitats present on a site.
The aim of this project was to re-survey a selection of these sites using standardised methods, and
to provide a series of individual site reports describing their current and changing habitat condition,
along with a separate overview of the findings from the complete set of sites. Data from the surveys
have also been provided to NE to allow more detailed examination of individual sites to help guide
local management inputs.
Each site comprised a whole moorland grazing unit and encompassed a range of vegetation types.
A range of variables was recorded at 100 randomly located sample points in each site. Variables to
be recorded were agreed with NE prior to the survey, to assess heather grazing and the condition of
key habitats. The methodology was based on a modified version of the NE overgrazing surveillance
methodology (including laboratory assessment of a heather Grazing Index) and the Common
Standards Monitoring (CSM) Guidance for Upland Habitats. Full details of the project objectives and
methodology are given in the main overview report. Defra, UK - Science Search
The Birkbeck Commons site was re-surveyed during 18 – 27 February 2015. Results of the survey
are presented in a standard format in the following sections. Management information (particularly
grazing) is also summarised from reports provided by NE. An assessment is then made of change
in vegetation since the previous surveys and this is considered in the context of current and past
management practices.
2. Overview
2.1 General description
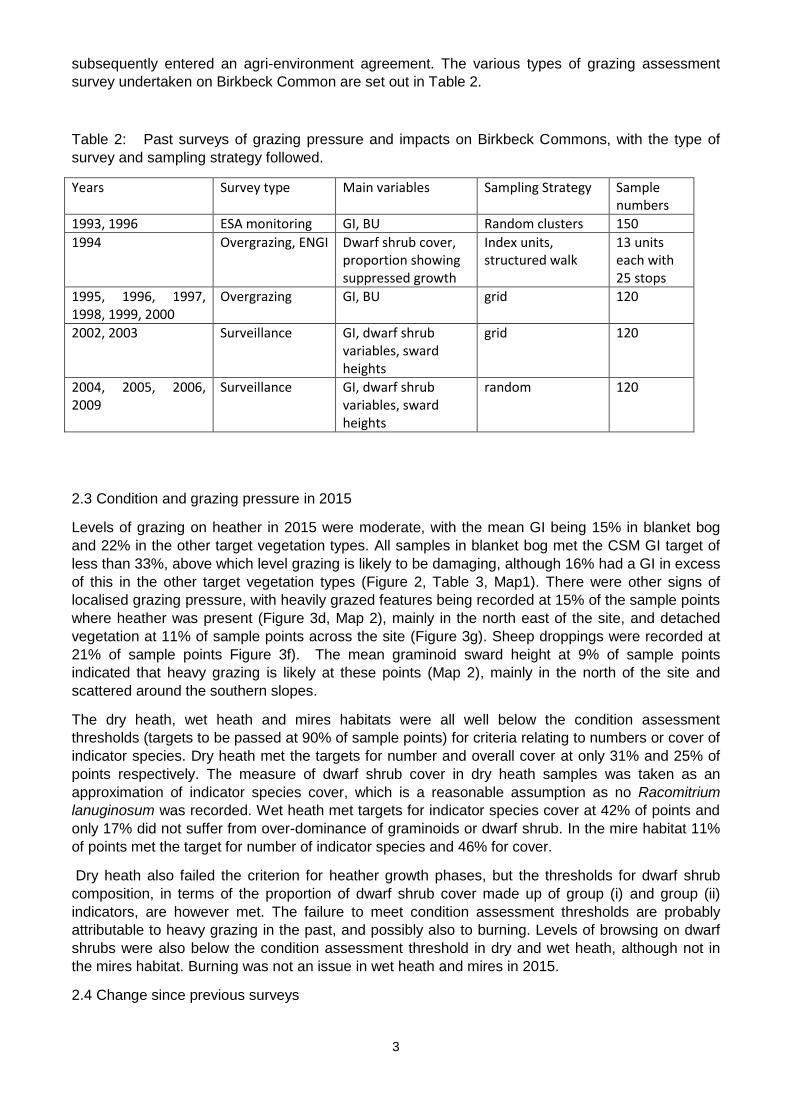
Birkbeck Commons is located in the Lake District and is 714 ha in area. It is part of the Shap Fells
SSSI and Lake District High Fells SAC. A significant proportion of the site comprises rough acid
grassland (29% of sample points in 2015), along with blanket bog (21%), flushes, fens & swamps
(16%) and fragmented heath (15%) (Figure 1). The site is generally wet, with a few areas dominated
by Myrica gale. Wet heath is also present but is somewhat degraded. In addition to domestic
livestock (including 15 – 20 ponies present during the survey) it is grazed by red deer.
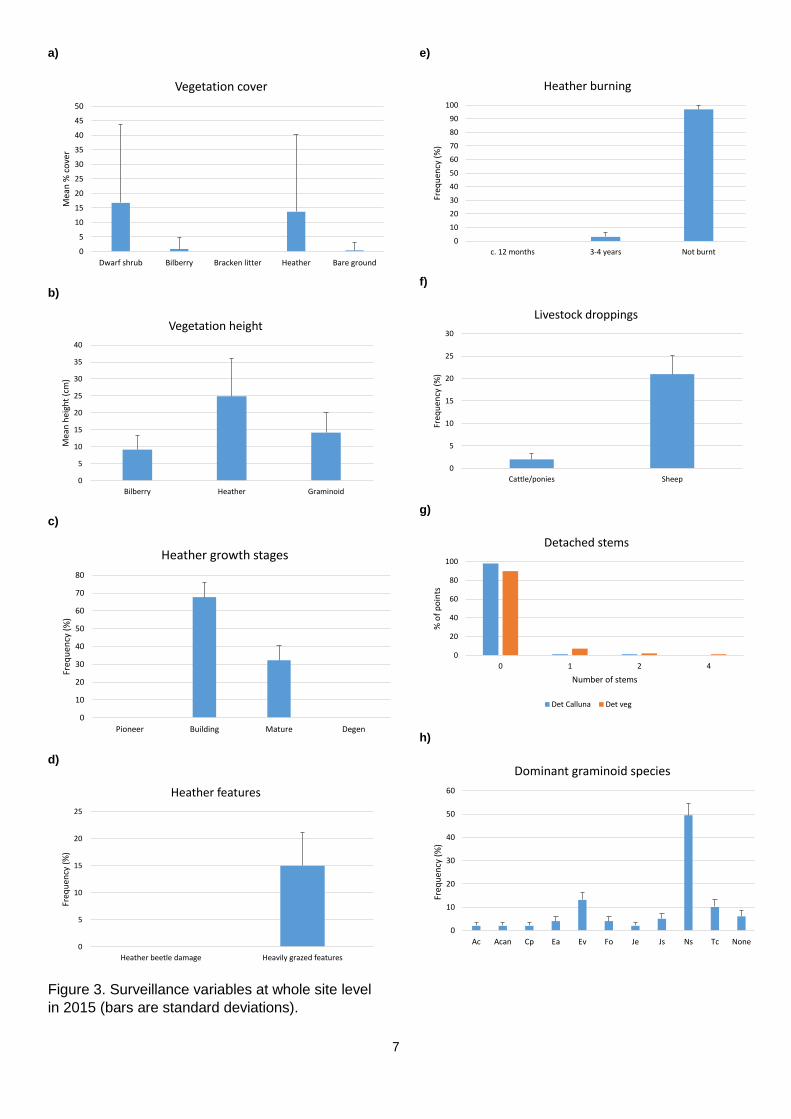
Heather was only present at 33% of sample points, with overall mean cover of 14% (Figure 3a). In
wet heath and heather heath vegetation types its mean cover was 47%, but only 9% in fragmented
heath. Heather was in the building growth stage at just over two thirds of the sample point where it
was present, and the mature stage at the remainder; no pioneer or degenerate heather was
recorded (Figure 3c). Recent burning was only recorded at one sample point (Figure 3e). The most
commonly dominant graminoid across the site was Nardus stricta (49% of sample points; Figure
3h).
2
2.2 Site management
The first formal complaint of overgrazing on the site was made in 1995, and in 1998 an agreement
was reached with commoners not to exceed existing grazing rights. These were 3.2 sheep ha-1
(2286 sheep), 0.17 cattle ha-1 (121 cattle), 0.05 equines ha-1 (i.e. 39 ponies, horses, followers) and 4
breeding geese. In 2001, 12 of the 15 commoners entered agreements under the Lake District
Environmentally Sensitive Area (ESA) scheme, which permitted grazing levels of 0.225 LU ha-1 (1.5
ewes per ha-1) plus followers in summer and a 25% reduction in winter, although in 2002 it was
noted that stocking was slightly higher than this.
The site was entered into a Higher Level Scheme (HLS) agreement in 2010. This included options
HL10 (restoration of moorland), HL12 (management of heather, gorse and grass) and HL15
(seasonal livestock exclusion supplement). A stocking calendar was prescribed, which specified
maximum and minimum numbers of sheep on a monthly basis (Table 1). Maximum permitted
stocking density is equivalent to 1.3 sheep ha-1 (August and September) or 0.104 LU ha-1 based on
revised rates for hill sheep breeds, and no sheep grazing is permitted from November to March
inclusive1. The scenario is complicated by the unauthorised presence of fell ponies. The sheep
stocking levels in the HLS agreement allow for 25 fell ponies from November to April and 7 from
May to October, but these pony numbers have been exceeded from time to time. Burning is also
restricted to a 110 ha area and a rotation of no less than 20 years, with an annual average of 5.5 ha
per year. Further restrictions applied to burning include the avoidance of sensitive areas.
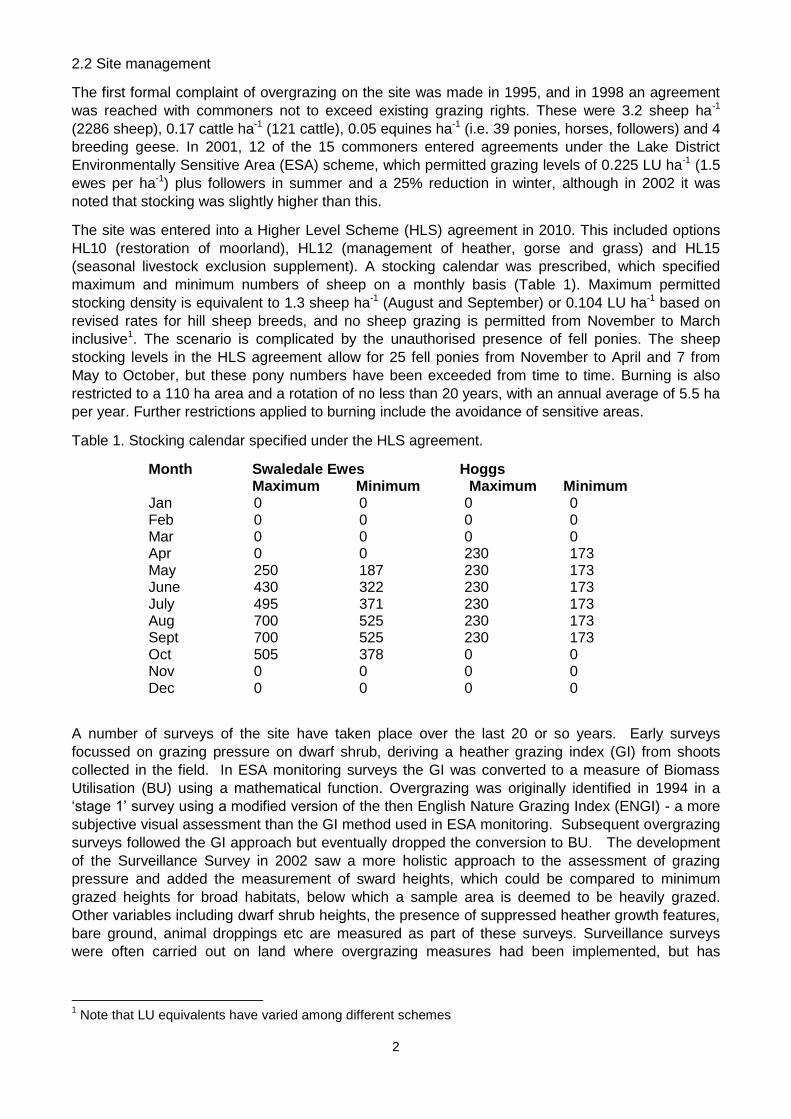
Table 1. Stocking calendar specified under the HLS agreement.
Month Swaledale Ewes Hoggs Maximum Minimum Maximum Minimum Jan 0 0 0 0 Feb 0 0 0 0 Mar 0 0 0 0 Apr 0 0 230 173 May 250 187 230 173 June 430 322 230 173 July 495 371 230 173 Aug 700 525 230 173 Sept 700 525 230 173 Oct 505 378 0 0 Nov 0 0 0 0 Dec 0 0 0 0
A number of surveys of the site have taken place over the last 20 or so years. Early surveys
focussed on grazing pressure on dwarf shrub, deriving a heather grazing index (GI) from shoots
collected in the field. In ESA monitoring surveys the GI was converted to a measure of Biomass
Utilisation (BU) using a mathematical function. Overgrazing was originally identified in 1994 in a
‘stage 1’ survey using a modified version of the then English Nature Grazing Index (ENGI) - a more
subjective visual assessment than the GI method used in ESA monitoring. Subsequent overgrazing
surveys followed the GI approach but eventually dropped the conversion to BU. The development
of the Surveillance Survey in 2002 saw a more holistic approach to the assessment of grazing
pressure and added the measurement of sward heights, which could be compared to minimum
grazed heights for broad habitats, below which a sample area is deemed to be heavily grazed.
Other variables including dwarf shrub heights, the presence of suppressed heather growth features,
bare ground, animal droppings etc are measured as part of these surveys. Surveillance surveys
were often carried out on land where overgrazing measures had been implemented, but has
1 Note that LU equivalents have varied among different schemes
3
subsequently entered an agri-environment agreement. The various types of grazing assessment
survey undertaken on Birkbeck Common are set out in Table 2.
Table 2: Past surveys of grazing pressure and impacts on Birkbeck Commons, with the type of
survey and sampling strategy followed.
Years Survey type Main variables Sampling Strategy Sample numbers
1993, 1996 ESA monitoring GI, BU Random clusters 150
1994 Overgrazing, ENGI Dwarf shrub cover, proportion showing suppressed growth
Index units, structured walk
13 units each with 25 stops
1995, 1996, 1997, 1998, 1999, 2000
Overgrazing GI, BU grid 120
2002, 2003 Surveillance GI, dwarf shrub variables, sward heights
grid 120
2004, 2005, 2006, 2009
Surveillance GI, dwarf shrub variables, sward heights
random 120
2.3 Condition and grazing pressure in 2015
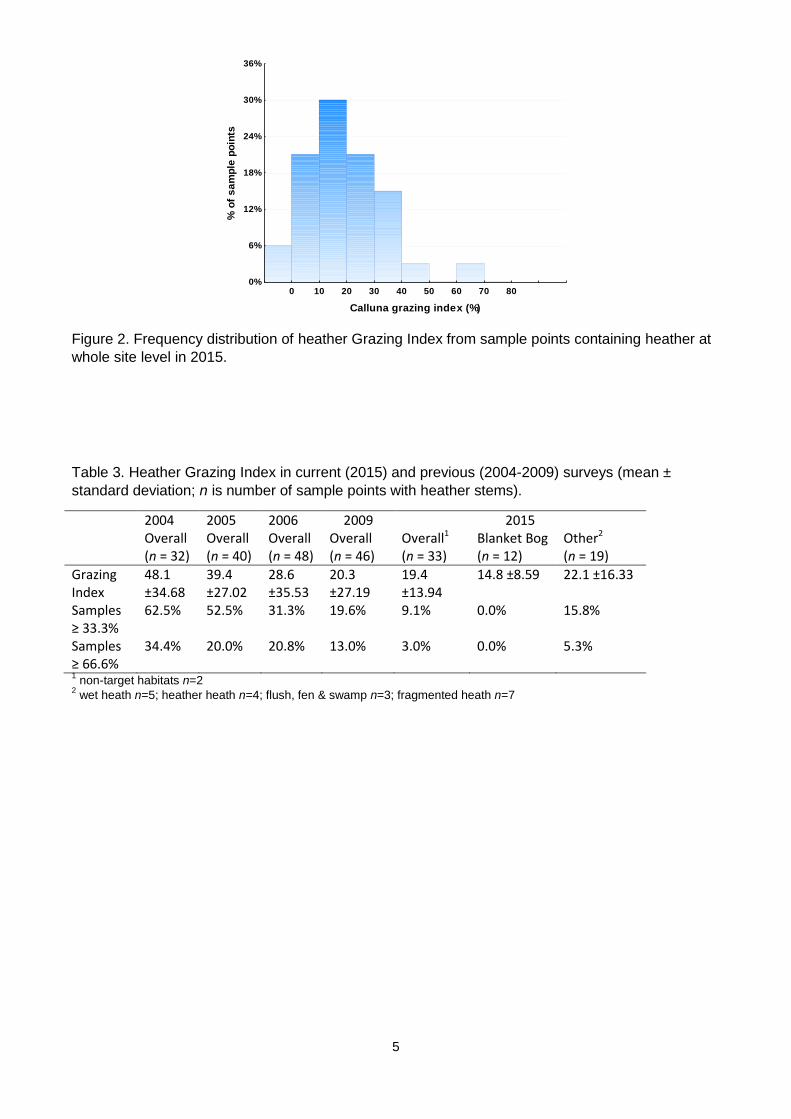
Levels of grazing on heather in 2015 were moderate, with the mean GI being 15% in blanket bog
and 22% in the other target vegetation types. All samples in blanket bog met the CSM GI target of
less than 33%, above which level grazing is likely to be damaging, although 16% had a GI in excess
of this in the other target vegetation types (Figure 2, Table 3, Map1). There were other signs of
localised grazing pressure, with heavily grazed features being recorded at 15% of the sample points
where heather was present (Figure 3d, Map 2), mainly in the north east of the site, and detached
vegetation at 11% of sample points across the site (Figure 3g). Sheep droppings were recorded at
21% of sample points Figure 3f). The mean graminoid sward height at 9% of sample points
indicated that heavy grazing is likely at these points (Map 2), mainly in the north of the site and
scattered around the southern slopes.
The dry heath, wet heath and mires habitats were all well below the condition assessment
thresholds (targets to be passed at 90% of sample points) for criteria relating to numbers or cover of
indicator species. Dry heath met the targets for number and overall cover at only 31% and 25% of
points respectively. The measure of dwarf shrub cover in dry heath samples was taken as an
approximation of indicator species cover, which is a reasonable assumption as no Racomitrium
lanuginosum was recorded. Wet heath met targets for indicator species cover at 42% of points and
only 17% did not suffer from over-dominance of graminoids or dwarf shrub. In the mire habitat 11%
of points met the target for number of indicator species and 46% for cover.
Dry heath also failed the criterion for heather growth phases, but the thresholds for dwarf shrub
composition, in terms of the proportion of dwarf shrub cover made up of group (i) and group (ii)
indicators, are however met. The failure to meet condition assessment thresholds are probably
attributable to heavy grazing in the past, and possibly also to burning. Levels of browsing on dwarf
shrubs were also below the condition assessment threshold in dry and wet heath, although not in
the mires habitat. Burning was not an issue in wet heath and mires in 2015.
2.4 Change since previous surveys
4
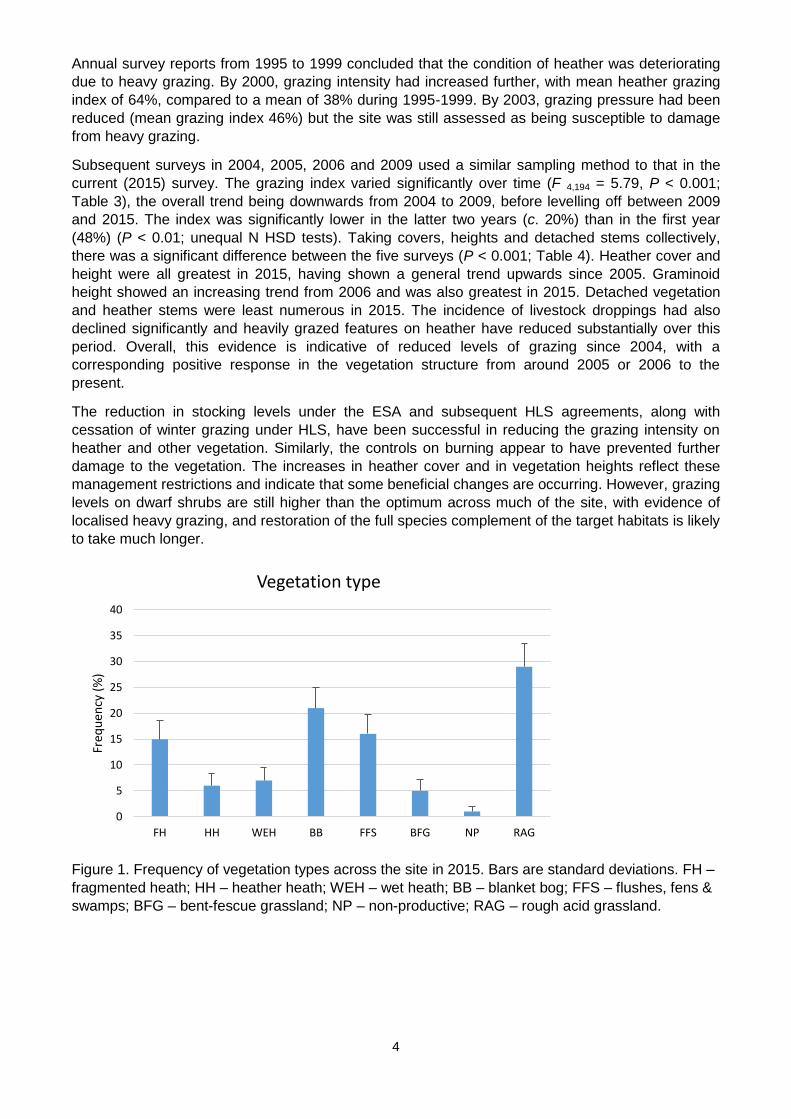
Annual survey reports from 1995 to 1999 concluded that the condition of heather was deteriorating
due to heavy grazing. By 2000, grazing intensity had increased further, with mean heather grazing
index of 64%, compared to a mean of 38% during 1995-1999. By 2003, grazing pressure had been
reduced (mean grazing index 46%) but the site was still assessed as being susceptible to damage
from heavy grazing.
Subsequent surveys in 2004, 2005, 2006 and 2009 used a similar sampling method to that in the
current (2015) survey. The grazing index varied significantly over time (F 4,194 = 5.79, P < 0.001;
Table 3), the overall trend being downwards from 2004 to 2009, before levelling off between 2009
and 2015. The index was significantly lower in the latter two years (c. 20%) than in the first year
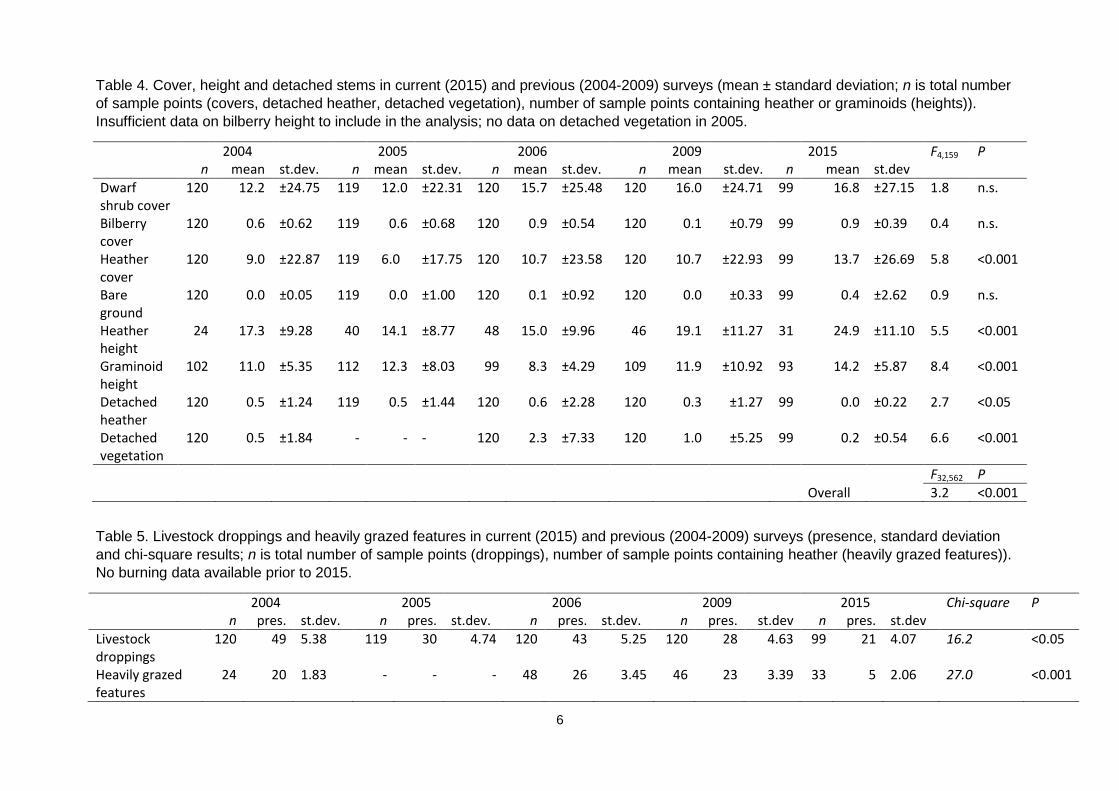
(48%) (P < 0.01; unequal N HSD tests). Taking covers, heights and detached stems collectively,
there was a significant difference between the five surveys (P < 0.001; Table 4). Heather cover and
height were all greatest in 2015, having shown a general trend upwards since 2005. Graminoid
height showed an increasing trend from 2006 and was also greatest in 2015. Detached vegetation
and heather stems were least numerous in 2015. The incidence of livestock droppings had also
declined significantly and heavily grazed features on heather have reduced substantially over this
period. Overall, this evidence is indicative of reduced levels of grazing since 2004, with a
corresponding positive response in the vegetation structure from around 2005 or 2006 to the
present.
The reduction in stocking levels under the ESA and subsequent HLS agreements, along with
cessation of winter grazing under HLS, have been successful in reducing the grazing intensity on
heather and other vegetation. Similarly, the controls on burning appear to have prevented further
damage to the vegetation. The increases in heather cover and in vegetation heights reflect these
management restrictions and indicate that some beneficial changes are occurring. However, grazing
levels on dwarf shrubs are still higher than the optimum across much of the site, with evidence of
localised heavy grazing, and restoration of the full species complement of the target habitats is likely
to take much longer.
Figure 1. Frequency of vegetation types across the site in 2015. Bars are standard deviations. FH –
fragmented heath; HH – heather heath; WEH – wet heath; BB – blanket bog; FFS – flushes, fens &
swamps; BFG – bent-fescue grassland; NP – non-productive; RAG – rough acid grassland.
0
5
10
15
20
25
30
35
40
FH HH WEH BB FFS BFG NP RAG
Freq
uen
cy (
%)
Vegetation type
5
Figure 2. Frequency distribution of heather Grazing Index from sample points containing heather at
whole site level in 2015.
Table 3. Heather Grazing Index in current (2015) and previous (2004-2009) surveys (mean ±
standard deviation; n is number of sample points with heather stems).
2004 2005 2006 2009 2015 Overall
(n = 32) Overall (n = 40)
Overall (n = 48)
Overall (n = 46)
Overall1
(n = 33) Blanket Bog (n = 12)
Other2 (n = 19)
Grazing Index
48.1 ±34.68
39.4 ±27.02
28.6 ±35.53
20.3 ±27.19
19.4 ±13.94
14.8 ±8.59 22.1 ±16.33
Samples ≥ 33.3%
62.5% 52.5% 31.3% 19.6% 9.1% 0.0% 15.8%
Samples ≥ 66.6%
34.4% 20.0% 20.8% 13.0% 3.0% 0.0% 5.3%
1 non-target habitats n=2
2 wet heath n=5; heather heath n=4; flush, fen & swamp n=3; fragmented heath n=7
0 10 20 30 40 50 60 70 80
Calluna grazing index (%)
0%
6%
12%
18%
24%
30%
36%
% o
f s
am
ple
po
ints
6
Table 4. Cover, height and detached stems in current (2015) and previous (2004-2009) surveys (mean ± standard deviation; n is total number
of sample points (covers, detached heather, detached vegetation), number of sample points containing heather or graminoids (heights)).
Insufficient data on bilberry height to include in the analysis; no data on detached vegetation in 2005.
2004 2005 2006 2009 2015 F4,159 P n mean st.dev. n mean st.dev. n mean st.dev. n mean st.dev. n mean st.dev
Dwarf shrub cover
120 12.2 ±24.75 119 12.0 ±22.31 120 15.7 ±25.48 120 16.0 ±24.71 99 16.8 ±27.15 1.8 n.s.
Bilberry cover
120 0.6 ±0.62 119 0.6 ±0.68 120 0.9 ±0.54 120 0.1 ±0.79 99 0.9 ±0.39 0.4 n.s.
Heather cover
120 9.0 ±22.87 119 6.0 ±17.75 120 10.7 ±23.58 120 10.7 ±22.93 99 13.7 ±26.69 5.8 <0.001
Bare ground
120 0.0 ±0.05 119 0.0 ±1.00 120 0.1 ±0.92 120 0.0 ±0.33 99 0.4 ±2.62 0.9 n.s.
Heather height
24 17.3 ±9.28 40 14.1 ±8.77 48 15.0 ±9.96 46 19.1 ±11.27 31 24.9 ±11.10 5.5 <0.001
Graminoid height
102 11.0 ±5.35 112 12.3 ±8.03 99 8.3 ±4.29 109 11.9 ±10.92 93 14.2 ±5.87 8.4 <0.001
Detached heather
120 0.5 ±1.24 119 0.5 ±1.44 120 0.6 ±2.28 120 0.3 ±1.27 99 0.0 ±0.22 2.7 <0.05
Detached vegetation
120 0.5 ±1.84 - - - 120 2.3 ±7.33 120 1.0 ±5.25 99 0.2 ±0.54 6.6 <0.001
F32,562 P
Overall 3.2 <0.001
Table 5. Livestock droppings and heavily grazed features in current (2015) and previous (2004-2009) surveys (presence, standard deviation
and chi-square results; n is total number of sample points (droppings), number of sample points containing heather (heavily grazed features)).
No burning data available prior to 2015.
2004 2005 2006 2009 2015 Chi-square P n pres. st.dev. n pres. st.dev. n pres. st.dev. n pres. st.dev n pres. st.dev
Livestock droppings
120 49 5.38 119 30 4.74 120 43 5.25 120 28 4.63 99 21 4.07 16.2 <0.05
Heavily grazed features
24 20 1.83 - - - 48 26 3.45 46 23 3.39 33 5 2.06 27.0 <0.001
7
a)
b)
c)
d)
Figure 3. Surveillance variables at whole site level
in 2015 (bars are standard deviations).
e)
f)
g)
h)
0
5
10
15
20
25
30
35
40
45
50
Dwarf shrub Bilberry Bracken litter Heather Bare ground
Mea
n %
co
ver
Vegetation cover
0
5
10
15
20
25
30
35
40
Bilberry Heather Graminoid
Mea
n h
eigh
t (c
m)
Vegetation height
0
10
20
30
40
50
60
70
80
Pioneer Building Mature Degen
Freq
uen
cy (
%)
Heather growth stages
0
5
10
15
20
25
Heather beetle damage Heavily grazed features
Freq
uen
cy (
%)
Heather features
0
10
20
30
40
50
60
70
80
90
100
c. 12 months 3-4 years Not burnt
Freq
uen
cy (
%)
Heather burning
0
5
10
15
20
25
30
Cattle/ponies Sheep
Freq
uen
cy (
%)
Livestock droppings
0
20
40
60
80
100
0 1 2 4
% o
f p
oin
ts
Number of stems
Detached stems
Det Calluna Det veg
0
10
20
30
40
50
60
Ac Acan Cp Ea Ev Fo Je Js Ns Tc None
Freq
uen
cy (
%)
Dominant graminoid species
8
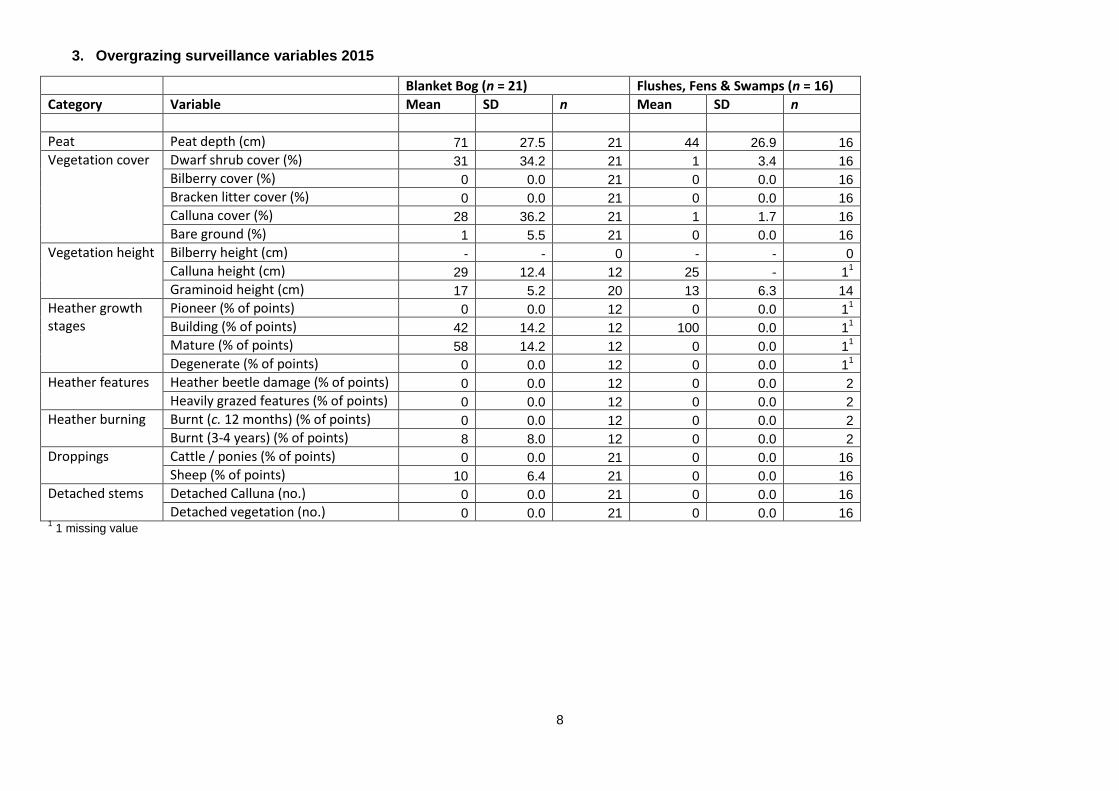
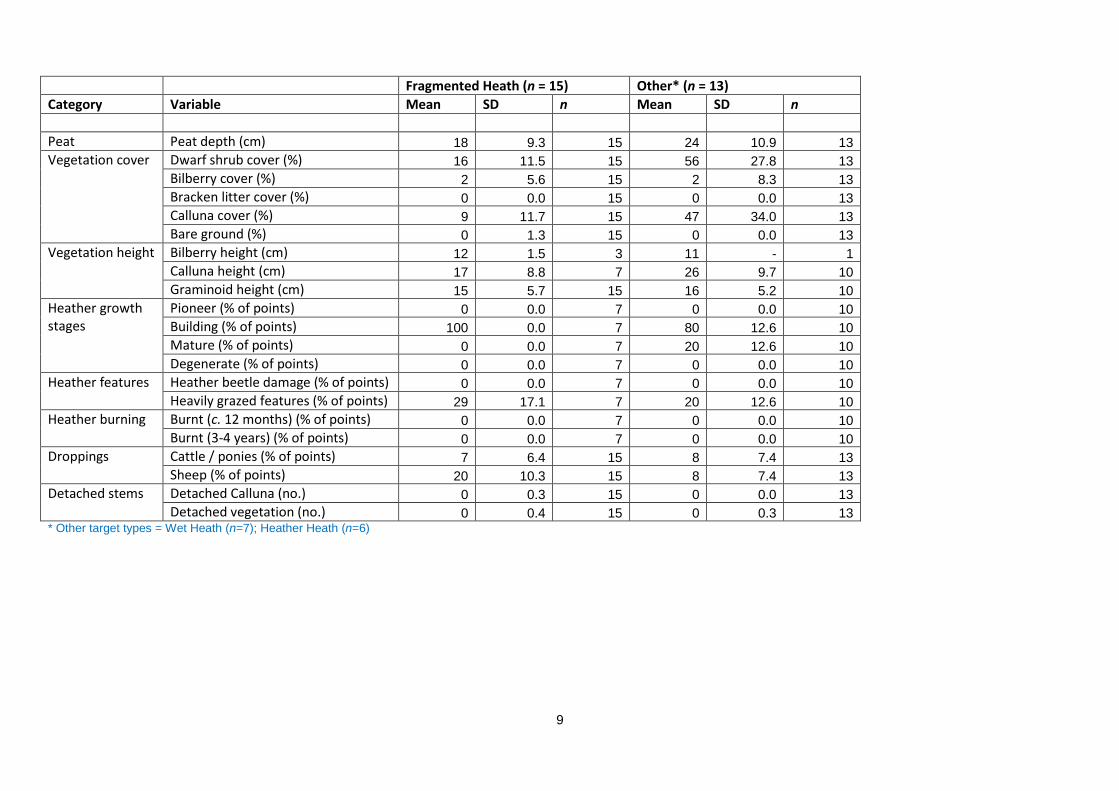
3. Overgrazing surveillance variables 2015
Blanket Bog (n = 21) Flushes, Fens & Swamps (n = 16)
Category Variable Mean SD n Mean SD n
Peat Peat depth (cm) 71 27.5 21 44 26.9 16
Vegetation cover Dwarf shrub cover (%) 31 34.2 21 1 3.4 16
Bilberry cover (%) 0 0.0 21 0 0.0 16
Bracken litter cover (%) 0 0.0 21 0 0.0 16
Calluna cover (%) 28 36.2 21 1 1.7 16
Bare ground (%) 1 5.5 21 0 0.0 16
Vegetation height Bilberry height (cm) - - 0 - - 0
Calluna height (cm) 29 12.4 12 25 - 11
Graminoid height (cm) 17 5.2 20 13 6.3 14
Heather growth stages
Pioneer (% of points) 0 0.0 12 0 0.0 11
Building (% of points) 42 14.2 12 100 0.0 11
Mature (% of points) 58 14.2 12 0 0.0 11
Degenerate (% of points) 0 0.0 12 0 0.0 11
Heather features Heather beetle damage (% of points) 0 0.0 12 0 0.0 2
Heavily grazed features (% of points) 0 0.0 12 0 0.0 2
Heather burning Burnt (c. 12 months) (% of points) 0 0.0 12 0 0.0 2
Burnt (3-4 years) (% of points) 8 8.0 12 0 0.0 2
Droppings Cattle / ponies (% of points) 0 0.0 21 0 0.0 16
Sheep (% of points) 10 6.4 21 0 0.0 16
Detached stems Detached Calluna (no.) 0 0.0 21 0 0.0 16
Detached vegetation (no.) 0 0.0 21 0 0.0 16 1 1 missing value
9
Fragmented Heath (n = 15) Other* (n = 13)
Category Variable Mean SD n Mean SD n
Peat Peat depth (cm) 18 9.3 15 24 10.9 13
Vegetation cover Dwarf shrub cover (%) 16 11.5 15 56 27.8 13
Bilberry cover (%) 2 5.6 15 2 8.3 13
Bracken litter cover (%) 0 0.0 15 0 0.0 13
Calluna cover (%) 9 11.7 15 47 34.0 13
Bare ground (%) 0 1.3 15 0 0.0 13
Vegetation height Bilberry height (cm) 12 1.5 3 11 - 1
Calluna height (cm) 17 8.8 7 26 9.7 10
Graminoid height (cm) 15 5.7 15 16 5.2 10
Heather growth stages
Pioneer (% of points) 0 0.0 7 0 0.0 10
Building (% of points) 100 0.0 7 80 12.6 10
Mature (% of points) 0 0.0 7 20 12.6 10
Degenerate (% of points) 0 0.0 7 0 0.0 10
Heather features Heather beetle damage (% of points) 0 0.0 7 0 0.0 10
Heavily grazed features (% of points) 29 17.1 7 20 12.6 10
Heather burning Burnt (c. 12 months) (% of points) 0 0.0 7 0 0.0 10
Burnt (3-4 years) (% of points) 0 0.0 7 0 0.0 10
Droppings Cattle / ponies (% of points) 7 6.4 15 8 7.4 13
Sheep (% of points) 20 10.3 15 8 7.4 13
Detached stems Detached Calluna (no.) 0 0.3 15 0 0.0 13
Detached vegetation (no.) 0 0.4 15 0 0.3 13 * Other target types = Wet Heath (n=7); Heather Heath (n=6)
10
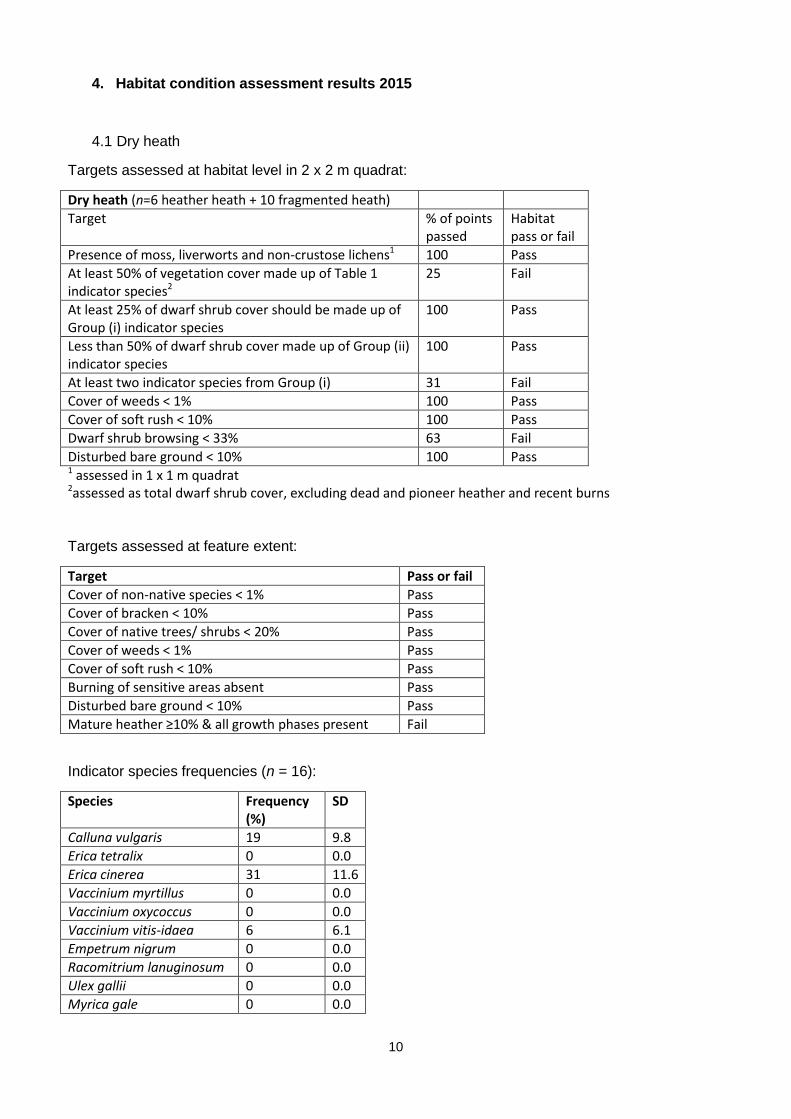
4. Habitat condition assessment results 2015
4.1 Dry heath
Targets assessed at habitat level in 2 x 2 m quadrat:
Dry heath (n=6 heather heath + 10 fragmented heath)
Target % of points passed
Habitat pass or fail
Presence of moss, liverworts and non-crustose lichens1 100 Pass
At least 50% of vegetation cover made up of Table 1 indicator species2
25 Fail
At least 25% of dwarf shrub cover should be made up of Group (i) indicator species
100 Pass
Less than 50% of dwarf shrub cover made up of Group (ii) indicator species
100 Pass
At least two indicator species from Group (i) 31 Fail
Cover of weeds < 1% 100 Pass
Cover of soft rush < 10% 100 Pass
Dwarf shrub browsing < 33% 63 Fail
Disturbed bare ground < 10% 100 Pass 1 assessed in 1 x 1 m quadrat 2assessed as total dwarf shrub cover, excluding dead and pioneer heather and recent burns Targets assessed at feature extent:
Target Pass or fail
Cover of non-native species < 1% Pass
Cover of bracken < 10% Pass
Cover of native trees/ shrubs < 20% Pass
Cover of weeds < 1% Pass
Cover of soft rush < 10% Pass
Burning of sensitive areas absent Pass
Disturbed bare ground < 10% Pass
Mature heather ≥10% & all growth phases present Fail
Indicator species frequencies (n = 16):
Species Frequency (%)
SD
Calluna vulgaris 19 9.8
Erica tetralix 0 0.0
Erica cinerea 31 11.6
Vaccinium myrtillus 0 0.0
Vaccinium oxycoccus 0 0.0
Vaccinium vitis-idaea 6 6.1
Empetrum nigrum 0 0.0
Racomitrium lanuginosum 0 0.0
Ulex gallii 0 0.0
Myrica gale 0 0.0
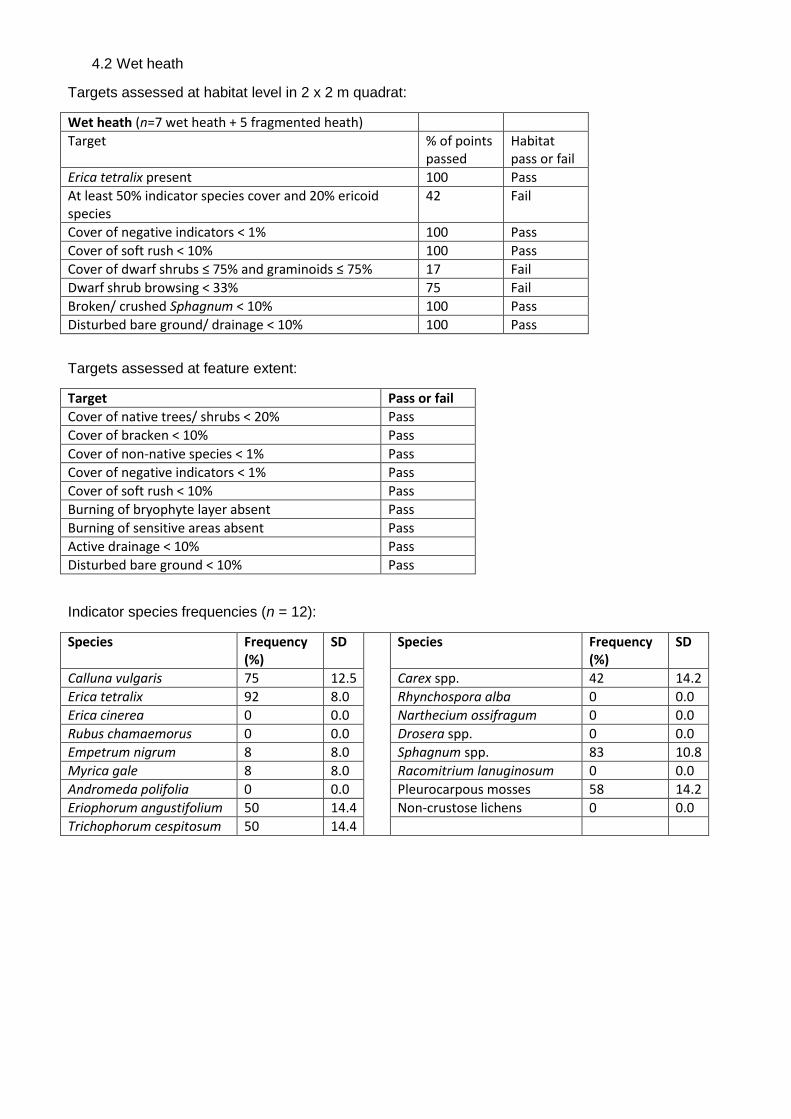
4.2 Wet heath
Targets assessed at habitat level in 2 x 2 m quadrat:
Wet heath (n=7 wet heath + 5 fragmented heath)
Target % of points passed
Habitat pass or fail
Erica tetralix present 100 Pass
At least 50% indicator species cover and 20% ericoid species
42 Fail
Cover of negative indicators < 1% 100 Pass
Cover of soft rush < 10% 100 Pass
Cover of dwarf shrubs ≤ 75% and graminoids ≤ 75% 17 Fail
Dwarf shrub browsing < 33% 75 Fail
Broken/ crushed Sphagnum < 10% 100 Pass
Disturbed bare ground/ drainage < 10% 100 Pass
Targets assessed at feature extent:
Target Pass or fail
Cover of native trees/ shrubs < 20% Pass
Cover of bracken < 10% Pass
Cover of non-native species < 1% Pass
Cover of negative indicators < 1% Pass
Cover of soft rush < 10% Pass
Burning of bryophyte layer absent Pass
Burning of sensitive areas absent Pass
Active drainage < 10% Pass
Disturbed bare ground < 10% Pass
Indicator species frequencies (n = 12):
Species Frequency (%)
SD Species Frequency (%)
SD
Calluna vulgaris 75 12.5 Carex spp. 42 14.2
Erica tetralix 92 8.0 Rhynchospora alba 0 0.0
Erica cinerea 0 0.0 Narthecium ossifragum 0 0.0
Rubus chamaemorus 0 0.0 Drosera spp. 0 0.0
Empetrum nigrum 8 8.0 Sphagnum spp. 83 10.8
Myrica gale 8 8.0 Racomitrium lanuginosum 0 0.0
Andromeda polifolia 0 0.0 Pleurocarpous mosses 58 14.2
Eriophorum angustifolium 50 14.4 Non-crustose lichens 0 0.0
Trichophorum cespitosum 50 14.4
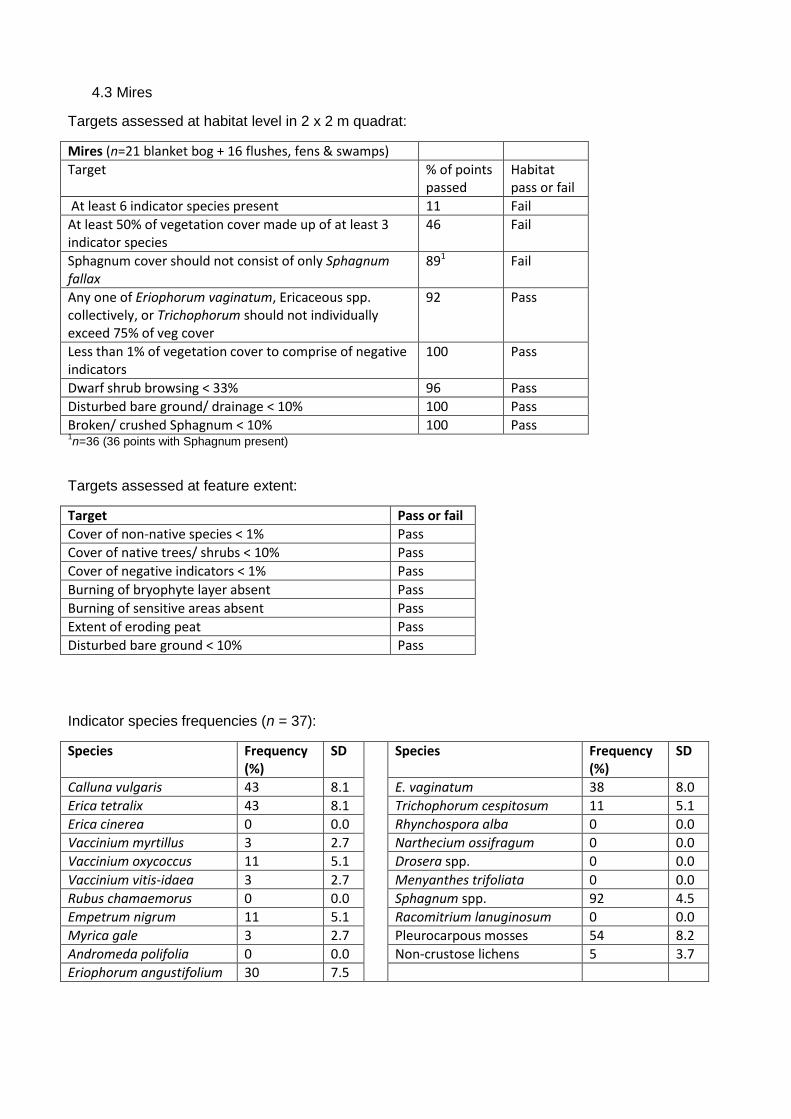
4.3 Mires
Targets assessed at habitat level in 2 x 2 m quadrat:
Mires (n=21 blanket bog + 16 flushes, fens & swamps)
Target % of points passed
Habitat pass or fail
At least 6 indicator species present 11 Fail
At least 50% of vegetation cover made up of at least 3 indicator species
46 Fail
Sphagnum cover should not consist of only Sphagnum fallax
891 Fail
Any one of Eriophorum vaginatum, Ericaceous spp. collectively, or Trichophorum should not individually exceed 75% of veg cover
92 Pass
Less than 1% of vegetation cover to comprise of negative indicators
100 Pass
Dwarf shrub browsing < 33% 96 Pass
Disturbed bare ground/ drainage < 10% 100 Pass
Broken/ crushed Sphagnum < 10% 100 Pass 1n=36 (36 points with Sphagnum present)
Targets assessed at feature extent:
Target Pass or fail
Cover of non-native species < 1% Pass
Cover of native trees/ shrubs < 10% Pass
Cover of negative indicators < 1% Pass
Burning of bryophyte layer absent Pass
Burning of sensitive areas absent Pass
Extent of eroding peat Pass
Disturbed bare ground < 10% Pass
Indicator species frequencies (n = 37):
Species Frequency (%)
SD Species Frequency (%)
SD
Calluna vulgaris 43 8.1 E. vaginatum 38 8.0
Erica tetralix 43 8.1 Trichophorum cespitosum 11 5.1
Erica cinerea 0 0.0 Rhynchospora alba 0 0.0
Vaccinium myrtillus 3 2.7 Narthecium ossifragum 0 0.0
Vaccinium oxycoccus 11 5.1 Drosera spp. 0 0.0
Vaccinium vitis-idaea 3 2.7 Menyanthes trifoliata 0 0.0
Rubus chamaemorus 0 0.0 Sphagnum spp. 92 4.5
Empetrum nigrum 11 5.1 Racomitrium lanuginosum 0 0.0
Myrica gale 3 2.7 Pleurocarpous mosses 54 8.2
Andromeda polifolia 0 0.0 Non-crustose lichens 5 3.7
Eriophorum angustifolium 30 7.5
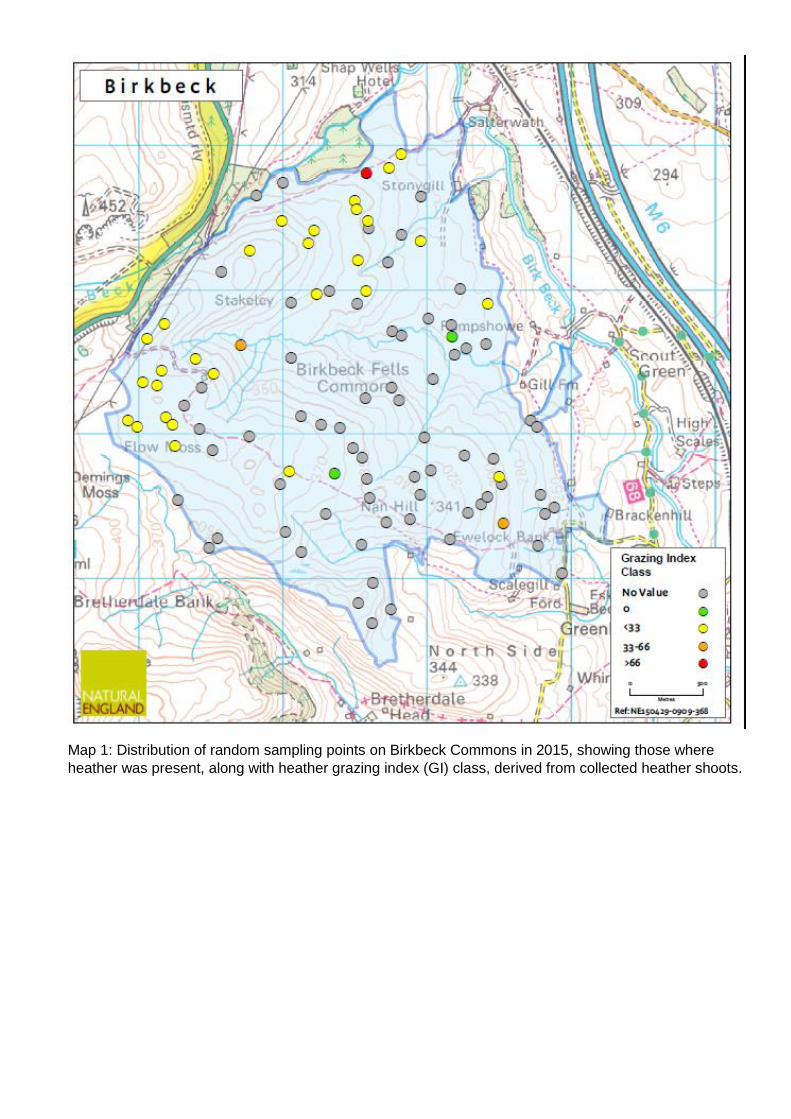
Map 1: Distribution of random sampling points on Birkbeck Commons in 2015, showing those where
heather was present, along with heather grazing index (GI) class, derived from collected heather shoots.
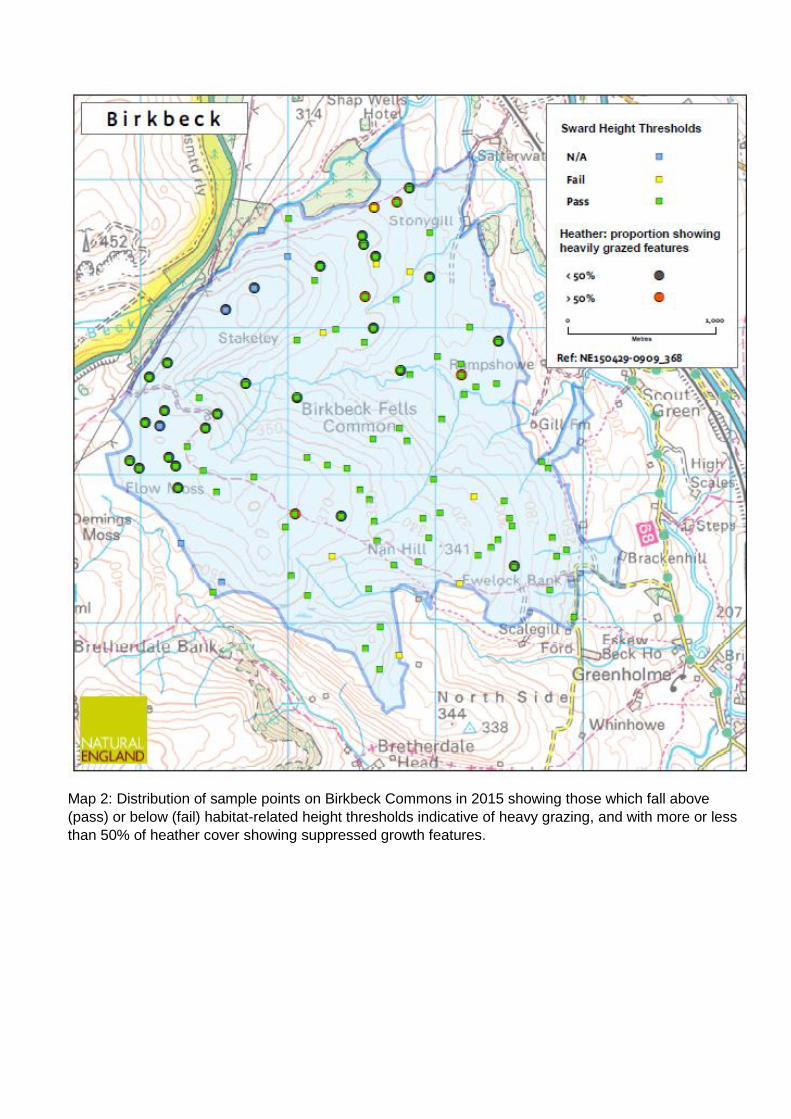
Map 2: Distribution of sample points on Birkbeck Commons in 2015 showing those which fall above
(pass) or below (fail) habitat-related height thresholds indicative of heavy grazing, and with more or less
than 50% of heather cover showing suppressed growth features.
Further information Natural England evidence can be downloaded from our Access to Evidence Catalogue. For more information about Natural England and our work see Gov.UK. For any queries contact the Natural England Enquiry Service on 0300 060 3900 or e-mail [email protected] .
Copyright This report is published by Natural England under the Open Government Licence - OGLv3.0 for public sector
information. You are encouraged to use, and reuse, information subject to certain conditions. For details of the
licence visit Copyright. Natural England photographs are only available for non-commercial purposes. If any other
information such as maps or data cannot be used commercially this will be made clear within the report.
© Natural England and other parties 2017
Report number RP01639 Number 2
ISBN 978-1-78354-386-1