BIOTECHNOLOGY Three-dimensional ... - Stanford University€¦ · RESEARCH ARTICLE BIOTECHNOLOGY...
11
RESEARCH ARTICLE SUMMARY ◥ BIOTECHNOLOGY Three-dimensional intact-tissue sequencing of single-cell transcriptional states Xiao Wang*, William E. Allen*, Matthew A. Wright, Emily L. Sylwestrak, Nikolay Samusik, Sam Vesuna, Kathryn Evans, Cindy Liu, Charu Ramakrishnan, Jia Liu, Garry P. Nolan†, Felice-Alessio Bava†, Karl Deisseroth† INTRODUCTION: Single-cell RNA sequencing has demonstrated that both stable cell types and transient cell states can be discovered and defined by transcriptomes. In situ transcrip- tomic methods can map both RNA quantity and position; however, it remains challenging to simultaneously satisfy key technological re- quirements such as efficiency, signal intensity, accuracy, scalability to large gene numbers, and applicability to three-dimensional (3D) volumes. Well-established single-molecule fluorescence in situ hybridization (FISH) approaches (such as MERFISH and seqFISH) have high detection efficiency but require long RNA species (more than 1000 nucelotides) and yield lower intensity than that of enzymatic amplification methods (tens versus thousands of fluorophores per RNA molecule). Other pioneering in situ sequencing methods (via padlock probes and fluorescent in situ sequencing) use enzymatic amplification, thus achieving high intensity but with room to improve on efficiency. RATIONALE: We have developed, validated, and applied STARmap (spatially-resolved tran- script amplicon readout mapping). STARmap begins with labeling of cellular RNAs by pairs of DNA probes followed by enzymatic amplifica- tion so as to produce a DNA nanoball (amplicon), which eliminates background caused by mis- labeling of single probes. Tissue can then be transformed into a 3D hydrogel DNA chip by anchoring DNA amplicons via an in situ– synthesized polymer network and removing proteins and lipids. This form of hydrogel- tissue chemistry replots amplicons onto an op- tically transparent hydrogel coordinate system; then, to identify and quantify RNA species- abundance manifested by DNA amplicons, the identity of each species is encoded as a five-base barcode and read out by means of an in situ sequencing method that decodes DNA sequence in multicolor fluorescence. Using a new two-base sequencing scheme (SEDAL), STARmap was found to simultaneously detect more than 1000 genes over six imaging cycles, in which sequenc- ing errors in any cycle cause misdecoding and are effectively rejected. RESULTS: We began by (i) detecting and quan- tifying a focused 160-gene set (including cell type markers and activity-regulated genes) simul- taneously in mouse primary visual cortex; (ii) clustering resulting per-cell gene expression patterns into a dozen distinct inhib- itory, excitatory, and non- neuronal cell types; and (iii) mapping the spatial distribution of all of these cell types across layers of cortex. For validation, per-cell-type gene expression was found to cor- relate well both with in situ hybridization re- sults and with single-cell RNA sequencing, and widespread up-regulation of activity-regulated genes was observed in response to visual stim- ulation. We next applied STARmap to a higher cognitive area (the medial prefrontal cortex) and discovered a more complex distribution of cell types. Last, we extended STARmap to much larger numbers of genes and spatial scales; we mea- sured 1020 genes simultaneously in sections— obtaining results concordant with the 160-gene set —and measured 28 genes across millimeter- scale volumes encompassing ~30,000 cells, re- vealing 3D patterning principles that jointly characterize a broad and diverse spectrum of cell types. CONCLUSION: STARmap combines hydrogel- tissue chemistry and in situ DNA sequencing to achieve intact-tissue single-cell measurement of expression of more than a thousand genes. In the future, combining this intact-system gene expression measurement with complementary cellular-resolution methodologies (with which STARmap is designed to be compatible)— including in vivo activity recording, optogenetic causal tests, and anatomical connectivity in the same cells—will help bridge molecular, cellular, and circuit scales of neuroscience. ▪ RESEARCH Wang et al., Science 361, 380 (2018) 27 July 2018 1 of 1 The list of author affiliations is available in the full article online. *These authors contributed equally to this work. †Corresponding author. Email: [email protected] (K.D.); [email protected] (F.-A.B.); [email protected] (G.P.N.) Cite this article as X. Wang et al., Science 361, eaat5691 (2018). DOI: 10.1126/science.aat5691 Intact tissue 3D sequencing in the gel SNAIL probes SEDAL sequencing with error-reduction Hydrogel-tissue chemistry >1000 genes mapped over six cycles STARmap: discovery and distribution of cell types in 3D Targeted in situ RNA sequencing approach DNA amplicons DNA-gel Amplify mRNA mRNA Cell Single-cell analyses of gene expression Decode Cell types Cells Genes Barcodes 5-nt code error-checking STARmap for 3D transcriptome imaging and molecular cell typing. STARmap is an in situ RNA-sequencing technology that transforms intact tissue into a 3D hydrogel-tissue hybrid and measures spatially resolved single-cell transcriptomes in situ. Error- and background-reduction mechanisms are implemented at multiple layers, enabling precise RNA quantification, spatially resolved cell typing, scalability to large gene numbers, and 3D mapping of tissue architecture. ON OUR WEBSITE ◥ Read the full article at http://dx.doi. org/10.1126/ science.aat5691 .................................................. on July 30, 2018 http://science.sciencemag.org/ Downloaded from
Transcript of BIOTECHNOLOGY Three-dimensional ... - Stanford University€¦ · RESEARCH ARTICLE BIOTECHNOLOGY...

RESEARCH ARTICLE SUMMARY◥
BIOTECHNOLOGY
Three-dimensional intact-tissuesequencing of single-celltranscriptional statesXiao Wang*, William E. Allen*, Matthew A. Wright, Emily L. Sylwestrak,Nikolay Samusik, Sam Vesuna, Kathryn Evans, Cindy Liu, Charu Ramakrishnan,Jia Liu, Garry P. Nolan†, Felice-Alessio Bava†, Karl Deisseroth†
INTRODUCTION: Single-cell RNA sequencinghas demonstrated that both stable cell typesand transient cell states can be discovered anddefined by transcriptomes. In situ transcrip-tomic methods can map both RNA quantityand position; however, it remains challengingto simultaneously satisfy key technological re-quirements such as efficiency, signal intensity,accuracy, scalability to large gene numbers, andapplicability to three-dimensional (3D) volumes.Well-established single-molecule fluorescencein situ hybridization (FISH) approaches (suchas MERFISH and seqFISH) have high detectionefficiency but require long RNA species (morethan 1000 nucelotides) and yield lower intensitythan that of enzymatic amplification methods(tens versus thousands of fluorophores per RNA
molecule). Other pioneering in situ sequencingmethods (via padlock probes and fluorescentin situ sequencing) use enzymatic amplification,thus achieving high intensity but with roomto improve on efficiency.
RATIONALE:We have developed, validated,and applied STARmap (spatially-resolved tran-script amplicon readout mapping). STARmapbegins with labeling of cellular RNAs by pairsof DNA probes followed by enzymatic amplifica-tion so as to produce a DNA nanoball (amplicon),which eliminates background caused by mis-labeling of single probes. Tissue can then betransformed into a 3D hydrogel DNA chip byanchoring DNA amplicons via an in situ–synthesized polymer network and removing
proteins and lipids. This form of hydrogel-tissue chemistry replots amplicons onto an op-tically transparent hydrogel coordinate system;then, to identify and quantify RNA species-abundance manifested by DNA amplicons, theidentity of each species is encoded as a five-basebarcode and read out by means of an in situsequencingmethod that decodes DNA sequencein multicolor fluorescence. Using a new two-basesequencing scheme (SEDAL), STARmap wasfound to simultaneously detect more than 1000genes over six imaging cycles, in which sequenc-ing errors in any cycle cause misdecoding andare effectively rejected.
RESULTS:We began by (i) detecting and quan-tifying a focused 160-gene set (including celltypemarkers and activity-regulated genes) simul-taneously in mouse primary visual cortex; (ii)
clustering resulting per-cellgene expression patternsinto a dozen distinct inhib-itory, excitatory, and non-neuronal cell types; and(iii) mapping the spatialdistribution of all of these
cell types across layers of cortex. For validation,per-cell-type gene expression was found to cor-relate well both with in situ hybridization re-sults and with single-cell RNA sequencing, andwidespread up-regulation of activity-regulatedgenes was observed in response to visual stim-ulation. We next applied STARmap to a highercognitive area (the medial prefrontal cortex) anddiscovered a more complex distribution of celltypes. Last, we extended STARmap tomuch largernumbers of genes and spatial scales; we mea-sured 1020 genes simultaneously in sections—obtaining results concordant with the 160-geneset—and measured 28 genes across millimeter-scale volumes encompassing ~30,000 cells, re-vealing 3D patterning principles that jointlycharacterize a broad and diverse spectrum ofcell types.
CONCLUSION: STARmap combines hydrogel-tissue chemistry and in situ DNA sequencingto achieve intact-tissue single-cell measurementof expression of more than a thousand genes.In the future, combining this intact-system geneexpression measurement with complementarycellular-resolution methodologies (with whichSTARmap is designed to be compatible)—including in vivo activity recording, optogeneticcausal tests, and anatomical connectivity in thesame cells—will help bridge molecular, cellular,and circuit scales of neuroscience.▪
RESEARCH
Wang et al., Science 361, 380 (2018) 27 July 2018 1 of 1
The list of author affiliations is available in the full article online.*These authors contributed equally to this work.†Corresponding author. Email: [email protected] (K.D.);[email protected] (F.-A.B.); [email protected] (G.P.N.)Cite this article as X. Wang et al., Science 361, eaat5691 (2018).DOI: 10.1126/science.aat5691
Intact tissue
3D sequencingin the gel
SNAIL probes
SEDAL sequencing with error-reduction
Hydrogel-tissue chemistry
>1000 genes mapped over six cycles
STARmap: discovery and distribution of cell types in 3D
Targeted in situ RNA sequencing approach
DNA amplicons
DNA-gel
Amplify
mRNA
mRNA
Cell
Single-cellanalyses of gene
expression
Decode
Cell types
Cells
Gen
es
Barcodes
5-nt codeerror-checking
STARmap for 3D transcriptome imaging and molecular cell typing. STARmap is an in situRNA-sequencing technology that transforms intact tissue into a 3D hydrogel-tissue hybrid andmeasures spatially resolved single-cell transcriptomes in situ. Error- and background-reductionmechanisms are implemented at multiple layers, enabling precise RNA quantification, spatiallyresolved cell typing, scalability to large gene numbers, and 3D mapping of tissue architecture.
ON OUR WEBSITE◥
Read the full articleat http://dx.doi.org/10.1126/science.aat5691..................................................
on July 30, 2018
http://science.sciencemag.org/
Dow
nloaded from

RESEARCH ARTICLE◥
BIOTECHNOLOGY
Three-dimensional intact-tissuesequencing of single-celltranscriptional statesXiao Wang1*, William E. Allen1,2*, Matthew A. Wright1,3, Emily L. Sylwestrak1,Nikolay Samusik4, Sam Vesuna1, Kathryn Evans1, Cindy Liu1, Charu Ramakrishnan1,Jia Liu5, Garry P. Nolan4†, Felice-Alessio Bava4†‡, Karl Deisseroth1,3,6†
Retrieving high-content gene-expression information while retaining three-dimensional (3D)positional anatomyat cellular resolution has been difficult, limiting integrative understanding ofstructure and function in complex biological tissues.We developed and applied a technologyfor 3D intact-tissue RNA sequencing, termed STARmap (spatially-resolved transcript ampliconreadout mapping), which integrates hydrogel-tissue chemistry, targeted signal amplification,and in situ sequencing.The capabilities of STARmapwere tested bymapping 160 to 1020 genessimultaneously in sections of mouse brain at single-cell resolution with high efficiency,accuracy, and reproducibility. Moving to thick tissue blocks, we observed a molecularly definedgradient distribution of excitatory-neuron subtypes across cubic millimeter–scale volumes(>30,000 cells) and a short-range 3D self-clustering in many inhibitory-neuron subtypes thatcould be identified and described with 3D STARmap.
In biological tissues, diversity of functionarises from diversity of form—in part, via thecomplexity of cell-specific gene expression,which defines the distinct three-dimensional(3D) molecular anatomy and cellular proper-
ties of each tissue. In situ transcriptomic toolsfor the spatial mapping of gene expression withsubcellular resolution have emerged that maybe applicable to probing these tissue structure–function relationships, including both multiplexedin situ RNA hybridization and in situ RNA se-quencing (1–10). Current in situ sequencing ap-proaches face the challenge of implementingenzymatic reactions in the dense, complex tissueenvironment and currently suffer from low efficien-cy (2), but the potential value of such intact-tissuesequencing could be enormous; in comparisonwith hybridization-based multiplexing/readout,which uses multiple polynucleotide probes toencode gene identity (3–5), sequencing operateswith single-nucleotide resolution and thus inher-ently provides greater information. In addition,
in situ sequencing methods typically use signalamplification, which is important for the detec-tion of short transcripts (such as neuropeptides)and for high-quality imaging in thick tissueblocks. However, current sequencing methodshave not yet been successfully applied to 3Dvolumes of intact tissue because of fundamentallimitations in requisite sensitivity, fidelity, andscalability for throughput in tissues such as themammalian brain.Hydrogels have been widely used for extra-
cellular 3D scaffolding in applications acrossbiology and medicine (11–13). Recently developedhydrogel-tissue chemistry (HTC) methodologies(14), beginning with CLARITY (15), physicallylink in situ–synthesized polymers with selectedintracellular biomolecules. This process transformsthe tissue, from within its constituent cells, intoa new state suitable for high-resolution volu-metric imaging and analysis compatible withmany kinds of molecular phenotyping for pro-teins, nucleic acids, and other targets (15). HTC-based hydrogel-embedding strategies have beenextended to nucleic acid analyses in the formof in situ hybridization for RNA (16–19), butthese have not yet been extended to in situ RNAsequencing—which would have the potential toreveal the full molecular complexity of the tran-scriptome. In nontissue environments, however,purely synthetic hydrogels have been used toaccommodate enzymatic reactions that includeDNA sequencing (20), and if biological tissuecould be converted into a hydrogel-embeddedform compatible with creation, retention, andfunctional presentation of RNA-derived or hybri-dized complementary DNA (cDNA), it might be
possible to perform 3D in situ sequencing with-in such a tissue-hydrogel formulation—leveragingthe crucial attendant properties of optical trans-parency, reduced background, elevated diffusionrate, and greater mechanical stability. We achievedthis goal with the development and applicationof a sequencing-based method (spatially-resolvedtranscript amplicon readoutmapping, or STARmap)for targeted 3D in situ transcriptomics in intacttissue (Fig. 1A); using STARmap, we were ableto identify organizational principles of a full spec-trum of cell types, which would not have beenotherwise accessible for identification in the adultmammalian brain.
ResultsDesign and validation ofSTARmap principles
One component is an efficient approach for insitu amplification of a library of cDNA probeshybridized with cellular RNAs (this approachis termed SNAIL, for specific amplification ofnucleic acids via intramolecular ligation). Reversetranscription may be the major efficiency-limitingstep for in situ sequencing (7, 21), and SNAILbypasses this step with a pair of primer andpadlock probes (fig. S1A) designed so that onlywhen both probes hybridize to the same RNAmolecule can the padlock probe be circularizedand rolling-circle-amplified to generate a DNAnanoball (amplicon) that contains multiple copiesof the cDNA probes (Fig. 1, A to D). This mech-anism ensures target-specific signal amplificationand excludes noise that invariably otherwisearises from nonspecific hybridization of singleprobes. The outcome includes much higher ab-solute intensity and signal-to-noise ratio (SNR)as compared with those of commercial single-molecule fluorescent in situ hybridization (smFISH)probes (fig. S1, B to F) and substantial improve-ment of detection efficiency (comparable with thatof single-cell RNA sequencing), with simplifiedexperimental procedures compared with previousin situ RNA sequencing methods (fig. S1, G to I).To enable cDNA amplicon embedding in the
tissue-hydrogel setting, amine-modified nucleo-tides were spiked into the rolling-circle amplifi-cation reaction, functionalized with an acrylamidemoiety by using acrylic acidN-hydroxysuccinimideesters, and copolymerized with acrylamide mono-mers so as to form a distinct kind of hydrogel-DNA amplicon network (Fig. 1A and fig. S2A).The resulting tissue-hydrogel was then subjectedto protein digestion and lipid removal in order toenhance transparency (fig. S2, B to E). This de-sign chemistry dictates that amplicons are co-valently linked with the hydrogel network, andsuch cross-linking is essential to maintain theposition and integrity of the amplicons throughmany cycles of detection (fig. S2, F to H).A five-base barcode (library size of 1024) was
designed and built into each padlock probe as agene-unique identifier to be sequenced, thusenabling multiplexed gene detection (Fig. 1A).Sequencing-by-synthesis paradigms were avoidedbecause these require elevated reaction tem-peratures, which in turn are problematic for
RESEARCH
Wang et al., Science 361, eaat5691 (2018) 27 July 2018 1 of 9
1Department of Bioengineering, Stanford University, Stanford,CA 94305, USA. 2Neuroscience Program, StanfordUniversity, CA 94305, USA. 3Department of Psychiatry andBehavioral Sciences, Stanford University, CA 94305, USA.4Baxter Laboratory, Department of Microbiology andImmunology, Stanford University, Stanford, CA 94305, USA.5Department of Chemical Engineering, Stanford University,CA 94305, USA. 6Howard Hughes Medical Institute, StanfordUniversity, CA 94305, USA.*These authors contributed equally to this work.†Corresponding author. Email: [email protected] (K.D.);[email protected] (F.-A.B.); [email protected] (G.P.N.)‡Present address: Institut Curie, PSL Research University, UniversitéParis Sud, Université Paris-Saclay, Centre Universitaire, CNRS UMR3348, Orsay 91405, France.
on July 30, 2018
http://science.sciencemag.org/
Dow
nloaded from

Wang et al., Science 361, eaat5691 (2018) 27 July 2018 2 of 9
Fig. 1. STARmap principles: in situ RNA sequencing for spatial tran-scriptomics within the 3D tissue environment. (A) STARmap overviewschematic. After brain tissue is prepared (mouse brain protocols areavailable in the supplementary materials, materials and methods), thecustom SNAIL probes that encounter and hybridize to intracellular mRNAs(dashed lines) within the intact tissue are enzymatically replicated ascDNA amplicons. The amplicons are constructed in situ with an acrylicacid N-hydroxysuccinimide moiety modification (blue) and then copolym-erized with acrylamide to embed within a hydrogel network (blue wavylines), followed by clearance of unbound lipids and proteins (fig. S2). EachSNAIL probe contains a gene-specific identifier segment (red) that isread-out through in situ sequencing with two-base encoding for errorcorrection (SEDAL) (fig. S3). Last, highly multiplexed RNA quantification inthree dimensions reveals gene expression and cell types in space.(B) SNAIL logic. A pair of primer and padlock probes amplifies target-specific signals and excludes noise known to commonly arise fromnonspecific hybridization of a single probe. (C and D) Only adjacent bindingof primer and padlock probes leads to signal amplification. mRNA A
represents Gapdh, and mRNA B represents Actb. Both fluorescent imagesshow Gapdh (gray) mRNA and cell nuclei (blue) labeling in mouse brainslice; there is an absence of labeling with mismatched primer and padlock(right). Scale bar, 10 mm. (E) In situ sequencing of DNA amplicons in thetissue-hydrogel complex via SEDAL, the sequencing-by-ligation methoddevised for STARmap. For each cycle, the reading probes (gray line withoutstar-symbol label) contain an incrementally increasing-length run ofdegenerate bases (N representing an equal mixture of A, T, C, and G) withphosphate at the 5′ end (5′P) to set the reading position; the decodingprobes (gray line with star-symbol label) are labeled by fluorophores withcolor coding for the dinucleotide at the 3′ end. Only if both probes areperfectly complementary to the DNA template (black lower sequence) canthe two kinds of probes then be ligated to form a stable product with ahigh melting temperature, allowing later imaging after unligated probes arewashed away. After each imaging cycle, probes are stripped away fromthe robust tissue-hydrogel by using 60% formamide so that the next cyclecan begin. X, unknown base to be read; red underline, decoded sequence;Ch1 to Ch4, fluorescence channels. Scale bar, 2 mm.
RESEARCH | RESEARCH ARTICLEon July 30, 2018
http://science.sciencemag.org/
Dow
nloaded from
Wang et al., Science 361, eaat5691 (2018) 27 July 2018 3 of 9
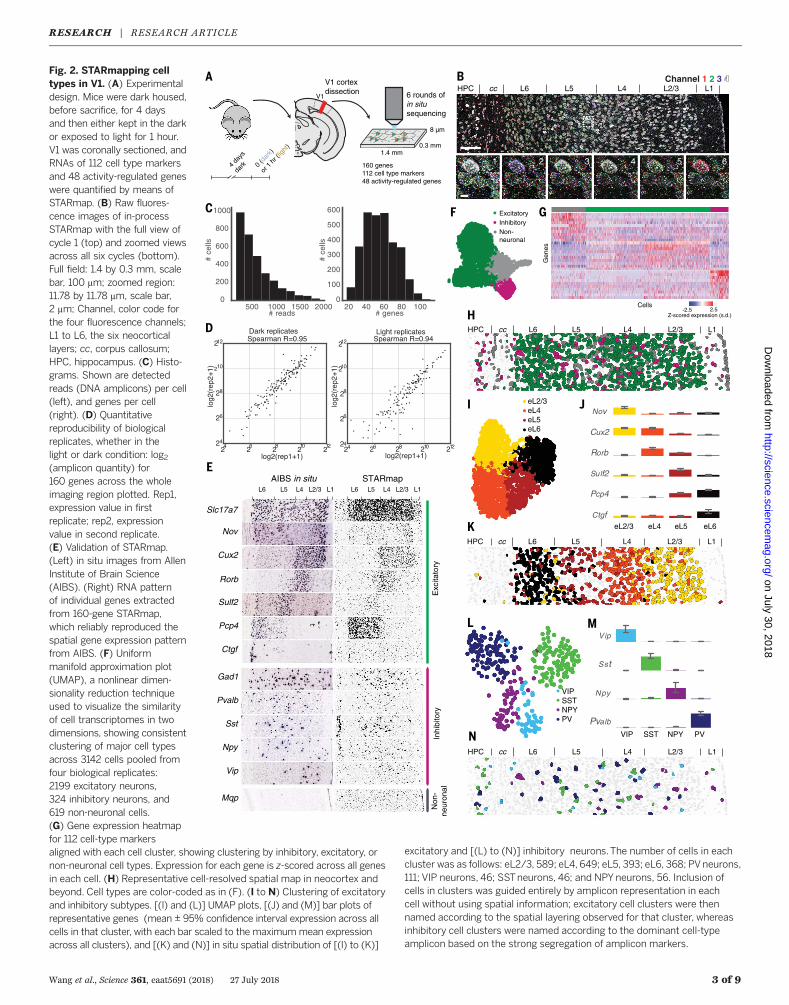
Fig. 2. STARmapping celltypes in V1. (A) Experimentaldesign. Mice were dark housed,before sacrifice, for 4 daysand then either kept in the darkor exposed to light for 1 hour.V1 was coronally sectioned, andRNAs of 112 cell type markersand 48 activity-regulated geneswere quantified by means ofSTARmap. (B) Raw fluores-cence images of in-processSTARmap with the full view ofcycle 1 (top) and zoomed viewsacross all six cycles (bottom).Full field: 1.4 by 0.3 mm, scalebar, 100 mm; zoomed region:11.78 by 11.78 mm, scale bar,2 mm; Channel, color code forthe four fluorescence channels;L1 to L6, the six neocorticallayers; cc, corpus callosum;HPC, hippocampus. (C) Histo-grams. Shown are detectedreads (DNA amplicons) per cell(left), and genes per cell(right). (D) Quantitativereproducibility of biologicalreplicates, whether in thelight or dark condition: log2(amplicon quantity) for160 genes across the wholeimaging region plotted. Rep1,expression value in firstreplicate; rep2, expressionvalue in second replicate.(E) Validation of STARmap.(Left) in situ images from AllenInstitute of Brain Science(AIBS). (Right) RNA patternof individual genes extractedfrom 160-gene STARmap,which reliably reproduced thespatial gene expression patternfrom AIBS. (F) Uniformmanifold approximation plot(UMAP), a nonlinear dimen-sionality reduction techniqueused to visualize the similarityof cell transcriptomes in twodimensions, showing consistentclustering of major cell typesacross 3142 cells pooled fromfour biological replicates:2199 excitatory neurons,324 inhibitory neurons, and619 non-neuronal cells.(G) Gene expression heatmapfor 112 cell-type markersaligned with each cell cluster, showing clustering by inhibitory, excitatory, ornon-neuronal cell types. Expression for each gene is z-scored across all genesin each cell. (H) Representative cell-resolved spatial map in neocortex andbeyond. Cell types are color-coded as in (F). (I to N) Clustering of excitatoryand inhibitory subtypes. [(I) and (L)] UMAP plots, [(J) and (M)] bar plots ofrepresentative genes (mean ± 95% confidence interval expression across allcells in that cluster, with each bar scaled to the maximummean expressionacross all clusters), and [(K) and (N)] in situ spatial distribution of [(I) to (K)]
excitatory and [(L) to (N)] inhibitory neurons.The number of cells in eachcluster was as follows: eL2/3, 589; eL4, 649; eL5, 393; eL6, 368; PVneurons,111; VIP neurons, 46; SSTneurons, 46; and NPYneurons, 56. Inclusion ofcells in clusters was guided entirely by amplicon representation in eachcell without using spatial information; excitatory cell clusters were thennamed according to the spatial layering observed for that cluster, whereasinhibitory cell clusters were named according to the dominant cell-typeamplicon based on the strong segregation of amplicon markers.
RESEARCH | RESEARCH ARTICLEon July 30, 2018
http://science.sciencemag.org/
Dow
nloaded from
high-resolution imaging and sample stability (16)in comparison with sequencing-by-ligationmethodsthat can be implemented at room temperature.However, none of the reported or commerciallyavailable sequencing-by-ligation methods exhibitthe necessary SNR or accuracy for this challeng-ing intact-tissue application: Supported OligoLigation Detection (SOLiD) sequencing causesstrong background fluorescence in biologicalsamples (10), whereas combinatorial probeanchor ligation (cPAL) sequencing (22) lacksan error-rejection mechanism (fig. S3). Forthis reason, an approach we term sequencingwith error-reduction by dynamic annealing andligation (SEDAL) was devised specifically forSTARmap (fig. S3).SEDAL uses two kinds of short, degenerate
probes: reading probes to decode bases, and fluo-rescence probes to transduce decoded sequenceinformation into fluorescence signals. The twoshort probes only transiently bind to the targetDNA and ligate to form a stable product forimaging only when a perfect match occurs; aftereach cycle corresponding to a base readout, thefluorescent products are stripped with form-amide, which eliminates error accumulationas sequencing proceeds (Fig. 1E and fig. S3B).In contrast to SOLiD, SEDAL exhibits minimalbackground (fig. S3, C to F). A two-base encod-
ing scheme was designed and implemented inorder to mitigate any residual errors related toimaging high densities of spots (fig. S3, G andH). On the basis of a panel of four very highlyexpressed test genes in mouse brain (to mimicamplicon crowdedness as would be encounteredin highly multiplexed gene-detection), we foundthat the error rate of STARmap was more thanan order of magnitude lower than prior cPALmethods (~1.8 versus 29.4%) (fig. S3, I to L) (17).
Spatial cell typing in primary visualcortex with 160-gene STARmapping
To test whether STARmap could deliver on theinitial goal of high-content 3D intact-tissue se-quencing of single-cell transcriptional states withthe necessary sensitivity and accuracy, we ap-plied STARmap to a pressing challenge in neuro-science: detecting and classifying cell types andcorresponding tissue-organization principlesin the neocortex of the adult mouse brain. Theanatomy and function of the mouse primaryvisual neocortex have been extensively studied(23), a setting which here allows validation ofour results by comparison with prior findingsthat span multiple papers, methodologies, anddata sources (but the full diversity of deeplymolecularly defined cell types within the visualcortex has not yet been spatially resolved in a
single experiment, precluding identification ofpotentially fundamental joint statistics and orga-nizational principles across 3D volumes). Amongmany examples of the experimental leverage suchinformation could provide, joint 3D cell-typologymapping might be used to help decode thespatiotemporal logic of neural activity–triggeredgene expression as a function of cell type andspatial location.We therefore used five-base barcoded SNAIL
probes over six rounds of in situ SEDAL sequenc-ing in coronal mouse brain slices (Figs. 1A and2, A and B) to survey a large but focused andcurated gene set [160 genes including 112 pu-tative cell-type markers collated from mousecortical single-cell RNA sequencing (24, 25)and 48 activity-regulated genes (ARGs) (26, 27)].In one arm of the experiment, visually evokedneural activity was provided to a cohort of micevia 1 hour of light exposure after 4 days of hous-ing in the dark; other mice were kept con-tinuously in the dark (27, 28). Eight-mm-thickvolumes containing up to 1000 cells coveringall cortical layers were imaged. After six roundsof sequencing, fluorescent Nissl staining wasused to segment cell bodies, allowing attributionof amplicons to individual cells (fig. S4, A and B).The values corresponding to amplicons-per-celland genes-per-cell varied substantially (Fig. 2C),whereas the 160-gene expression pattern wasconsistent between biological replicates [corre-lation coefficient (r) = 0.94 to 0.95] (Fig. 2D),revealing reliable detection of transcript diversityat the single-cell level. Because only 160 geneswere encoded out of the 1024 possible barcodesfrom five bases, we were able to quantify se-quencing errors that resulted in sequences beingcorrupted from the 160 true barcodes to the864 invalid barcodes, which was remarkablylow at 1 to 4%. We found that this 160-genepilot faithfully reproduced the spatial distri-bution of known cortical layer markers and in-terneurons, illustrated here via comparison ofin situ images from paired public atlases (29)and STARmap results (Fig. 2E).We next performed cell classification using
expression data of the 112 cell-type markers.First, >3000 cells pooled from four biologicalreplicates were clustered into three major celltypes (excitatory neurons, inhibitory neurons,and non-neuronal cells) by using graph-basedclustering after principal-component decompo-sition (30) and then further subclustered undereach category (Fig. 2, F to H, and fig. S4C). Therichly defined excitatory neurons segregated intofour major types (here denoted eL2/3, eL4, eL5,and eL6) by spatial correspondence with anatomiccortical layers and expression profiles of knownlayer-specific gene markers (Fig. 2, I to K, andfig. S5, A and B). Although spatial organiza-tion of the four excitatory types exhibited alayered pattern, there was extensive intermix-ing among different cell types within each layer.Inhibitory neurons were also clustered into fourmajor types, here denoted by the dominantinterneuron marker of each subtype [VIP, SST,NPY, and PV (Pvalb)] (Fig. 2, L to N, and fig. S5,
Wang et al., Science 361, eaat5691 (2018) 27 July 2018 4 of 9
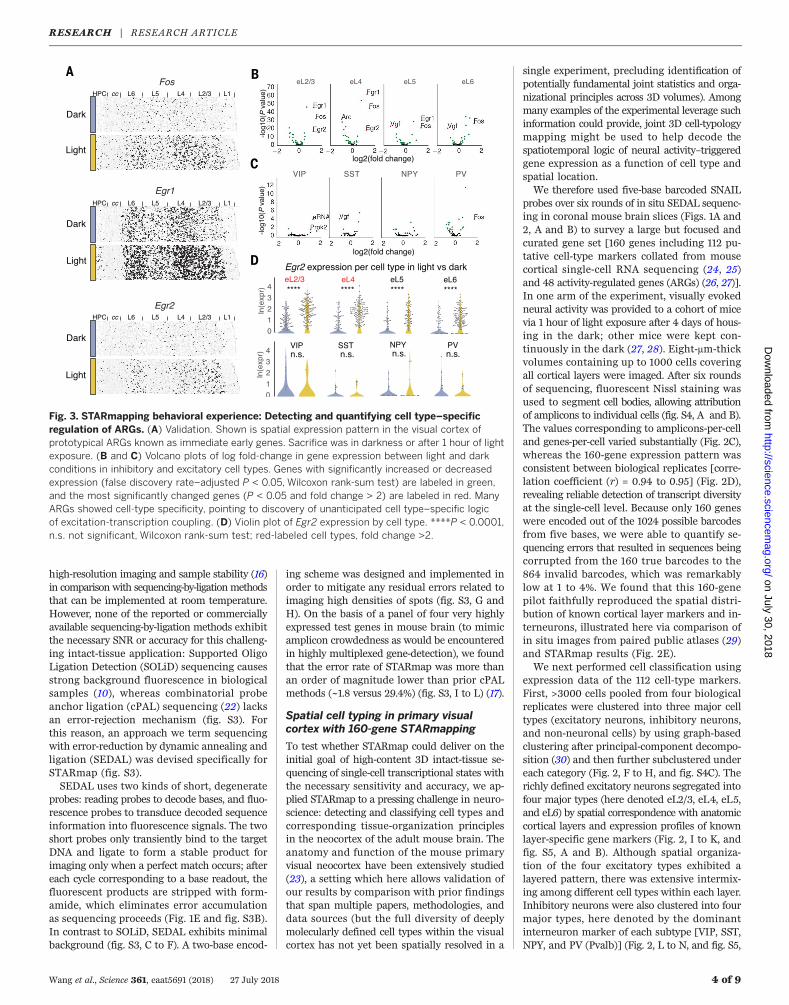
Fig. 3. STARmapping behavioral experience: Detecting and quantifying cell type–specificregulation of ARGs. (A) Validation. Shown is spatial expression pattern in the visual cortex ofprototypical ARGs known as immediate early genes. Sacrifice was in darkness or after 1 hour of lightexposure. (B and C) Volcano plots of log fold-change in gene expression between light and darkconditions in inhibitory and excitatory cell types. Genes with significantly increased or decreasedexpression (false discovery rate–adjusted P < 0.05, Wilcoxon rank-sum test) are labeled in green,and the most significantly changed genes (P < 0.05 and fold change > 2) are labeled in red. ManyARGs showed cell-type specificity, pointing to discovery of unanticipated cell type–specific logicof excitation-transcription coupling. (D) Violin plot of Egr2 expression by cell type. ****P < 0.0001,n.s. not significant, Wilcoxon rank-sum test; red-labeled cell types, fold change >2.
RESEARCH | RESEARCH ARTICLEon July 30, 2018
http://science.sciencemag.org/
Dow
nloaded from

C and D); the VIP and NPY type were observedto distribute more to the upper layers (L1 toL3), whereas SST and PV types were foundmore commonly in the lower layers (L4 toL6). We also detected non-neuronal cell types,including astrocytes, oligodendrocytes, endothe-lial cells, and smooth muscle cells (fig. S6). Thenumber of major cell types illustrated here (12in total) can be further broken down (single-cellRNA sequencing can lead to classification into40 or more subtypes, which is consistent withthe readily apparent heterogeneity of geneexpression within each type) (figs. S5 and S6).With our targeted 112-gene set and at the size of600 to 800 cells per sample, all 12 major celltypes could be reliably detected without batch
effects with highly similar spatial patterningamong four biological replicates (defined as sam-ples prepared from different animals) (fig. S7)and matched with published single-cell RNA se-quencing results (fig. S8).We next sought to take advantage of STARmap’s
quantitative capabilities at the single-cell level,in order to test differential gene expression analy-ses across experimental conditions, in molec-ularly defined cell types. To this end, we assessedvisual stimulus–dependent gene expressionpatterns (via 48 defined ARGs with single-cellresolution in situ). Further developing the single-cell RNA sequencing procedure, mouse brainswere flash-frozen with minimal handling timeafter sacrifice (<5 min), for maximal preservation
of native transcriptional signatures. Consistentwith prior reports (26–28), we observed globalinduction of known immediate-early genes (Fos,Egr1, and Egr2) (Fig. 3A) in the primary visualcortex (V1) upon 1 hour of light exposure. Atsingle-cell resolution, the quantitative extent (foldchange in expression) of ARG changes exhibitedstriking diversity across neuronal cell types (Fig. 3,B and C, and fig. S9) (28). In general, ARG ex-pression programs in excitatory neurons acrossdifferent layers were highly similar, whereasARG expression programs in inhibitory cells ex-hibited much more distinct cell type–specificcharacteristics (fig. S9C); for example, Egr2 ex-hibited light-induction across excitatory neurons(Fig. 3D) but not in inhibitory neurons, whereasProk2 was up-regulated in Vip inhibitory neurons(Fig. 3C) (22). Last, because neural activity cantrigger cotranscription of noncoding RNAs fromwithin enhancers of ARGs (26, 31), we also studiedexemplars of these enhancer RNAs (eRNAs) (here,eRNAs 1 to 5 of the Fos gene); these transcripts,not polyadenylated, would be very difficult tomeasure with current single-cell RNA sequenc-ing. eRNA3 was identified as the most notableand consistent ARG marker (fig. S9B).
Comparing spatial cell-type distributionsin frontal and sensory cortices
We then investigated to what extent the cell typesof the higher cognitive cortex resemble those ofthe sensory cortex, as exemplified by V1. Weapplied the same 160-gene set to STARmappingthe cell populations of the medial prefrontal cor-tex (mPFC) (Fig. 4A), which is involved in high-level cognitive functions such as attention andmemory and is thought to be dysregulated inmajor psychiatric disorders (32). We identified15 distinct molecular cell types, including sixexcitatory neuron subtypes (eL2/3, eL5-1, eL5-2,eL5-3, eL6-1, and eL6-2, annotated by anatomiccortical layers), five inhibitory neuron subtypes(VIP, Reln, SST, Lhx6 and NPY, annotated bydominant gene markers), and four non-neuronaltypes (astrocytes, oligodendrocytes, endothe-lial cells, and smooth-muscle cells) (Fig. 4B andfig. S10).The spatial organization of broad cell types
in mPFC resembled that of V1 with intermixedexcitatory neuronal layers and sparsely distri-buted inhibitory neurons (Fig. 4C); however, thenature and composition of neuronal subtypes inmPFC and V1 strikingly differed (Fig. 4, D andE). For excitatory subtypes, mPFC lacks eL4 (whichis consistent with previous reports) (33) andexhibits reduced eL2/3 and vast expansion ofeL5 and eL6 compared with that of V1 (Fig. 4E).Many new types of cell were discovered, includ-ing three eL5 subtypes and two eL6 subtypes, ascharacterized by gene markers Sema3e, Plcxd2,Tpbg, Syt6, and Ctgf, respectively (Fig. 4D).Substantially different tissue organization by
cell type was also observed for inhibitory sub-clusters. Sst-, Vip-, and Npy-positive subtypesin mPFC were represented similarly among allinhibitory neurons compared with those in V1,whereas Pvalb-positive cells were comparatively
Wang et al., Science 361, eaat5691 (2018) 27 July 2018 5 of 9
Fig. 4. STARmapping cell types and neural activity in mPFC. (A) Diagram of targeted region(red box) containing primarily prelimbic cortex (PrL) within mPFC. (B) UMAP visualization of allinhibitory (VIP, Reln, SST, Lhx6, and NPY), excitatory (eL2/3, eL5-1, eL5-2, eL5-3, eL6-1, and eL6-2),and non-neuronal (Astro, Oligo, Smc, and Endo) cell types. (C) Spatial visualization of cell type layoutin mPFC, using the same color scheme as in (B). (D) Barplot of representative genes per cluster (mean ±95% confidence interval), with each bar scaled to the maximum mean expression for that geneacross clusters. (E) Piecharts showing the relative proportion of each major and minor cell type in bothmPFC and visual cortex. (F) Violin plots of Fos gene induction in different excitatory cell types in mPFCin response to cocaine. The mice were sacrificed after 1 hour of cocaine or saline injection. Expr,normalized expression; n.s., not significant; *P < 0.05, ***P < 0.001, ****P < 0.0001, likelihood ratiotest. Astro, astrocytes; Oligo, oligodendrocytes; Smc, smooth muscle cells; Endo, endothelial cells.
RESEARCH | RESEARCH ARTICLEon July 30, 2018
http://science.sciencemag.org/
Dow
nloaded from

much sparser. In V1, Reln-positive neurons co-exist with Sst and Npy, whereas in mPFC, thesesegregate as a single cluster, with ~50% co-marked by Ndnf; we also discovered a new in-hibitory subtype labeled by Lhx6, which in factconstitutes the most abundant inhibitory sub-type in mPFC (Fig. 4E). Although the 5-HT(3A)receptor (Htr3a) expression has been reported
in cortical inhibitory neurons (34), Htr3a hasnot been ranked as a critical genetic marker ofinhibitory subtypes in V1. In mPFC, however,we found that Htr3a distinguishably marks alarge fraction of Vip+ neurons and a subset ofReln+ neurons (fig. S10D).Superficial layers (L1 to L3) were found to
contain Vip, Reln, and Npy subtypes, whereas
deeper layers (L5 to L6) were found to containall of the inhibitory subtypes. All of the 15 celltypes with tissue-level spatial organization couldbe reliably detected with STARmap across fourbiological replicates (fig. S11). The capability ofSTARmap for multidimensional cell typing inmPFC was further demonstrated in the settingof activity dependence, supporting the possibil-ity of defining cell types in part by communica-tion properties, including activity during behavior(35, 36). One hour after cocaine injection (37), aspecific subpopulation of deep-layer excitatoryneurons (such as Tpbg labeled eL5-2) in mPFCwas activated compared with that in saline-injectedcontrol mice (Fig. 4F), revealing STARmap capa-bility for identifying functional segregation ofneuronal subtypes in mPFC.
Scaling STARmap to more than1000 genes
To further test the scalability of STARmap, weextended our gene list from 160 to 1020 genes,leveraging previously published single-cell RNAsequencing data (24). The 1020-gene set was firstvalidated in mouse hippocampal neuron culture,with successful resolution of neuronal and glialcells (fig. S12). We then probed mouse V1 neo-cortex with the 1020-gene set in order to evaluateperformance in spatial cell typing in comparisonwith that of the 160-gene set. Amplicons obtainedin the 1020-gene experiment were much denser incells as compared with those in 160-gene experi-ments but were optically resolvable in 3D withhigh-resolution imaging and postimaging decon-volution (Fig. 5A).We observed that a higher percentage (40%)
of amplicons were filtered out in the 1020-geneexperiments by our error-rejection mechanism(fig. S3H) in comparison with the four-gene ex-periments (20%) (fig. S3L), indicating that a morefrequent initial color-misassignment potentiallyresulted from amplicon merging or optical reso-lution and further demonstrating the importanceof our designed error-rejection mechanism.Crucially, despite the read loss, we successfullyclustered single cells of the imaging area into15 annotated cell types and one unclassified typeusing 1020 genes and the same data analysis pipe-line from the focused 160 gene probe set (Fig. 5,B and C, and fig. S13). Three new cell types wereidentified in addition to the 12 cell types detectedby 160 genes (Fig. 5B): eL6 was resolved intotwo subtypes (eL6-1 and eL6-2), a previouslyuncharacterized hippocampal excitatory subtype(HPC) was identified, and microglial cells werecleanly identified with an expansion of non-neuronal cell type markers in the 1020-gene set.Beyond those advances, the 1020-gene findings
also successfully reproduced the cell types (andtheir spatial patterning) from the 160-gene find-ings and further allowed discovery of multiplenew gene markers for each cell type (for example,3110035E14Rik for deep layers, Cnot6l for Sstneurons, and Cplx1 for Pvalb neurons) (Fig. 5Dand fig. S13). These molecularly defined celltypes were highly reproducible between biolog-ical replicates for 1020-gene detection and were
Wang et al., Science 361, eaat5691 (2018) 27 July 2018 6 of 9
Fig. 5. Simultaneous mapping of 1020 genes in V1 by STARmap. (A) Input fluorescence data.(Left) Maximum-intensity projection of the first sequencing round for 1020 gene experiment, showingall four channels simultaneously. Yellow square, zoom region. Scale bar, 100 mm. (Right) Zoom into asingle cell showing spatial arrangement of amplicons in three dimensions across six sequencingrounds. (B) Joint UMAP plot showing all excitatory (HPC, eL2/3, eL4, eL5, eL6-1, and eL6-2), non-neuronal (Smc, Other, Olig, Micro, Endo, and Astro), and inhibitory (PVALB, SST, VIP, and NPY) celltypes. (C) Plot of all differentially expressed genes across every cluster, with P < 10−12 and log foldchange > 1.5. (D) Spatial map of all excitatory, non-neuronal, and inhibitory cell types in visual cortexusing the same color code of (B). HPC, hippocampus; Smc, smooth muscle cells; Other, otherunclassified cells; Oligo, oligodendrocytes; Micro, microglia; Endo, endothelia cells; Astro, astrocytes.
RESEARCH | RESEARCH ARTICLEon July 30, 2018
http://science.sciencemag.org/
Dow
nloaded from

concordant with published single-cell RNA se-quencing results (fig. S14). We further assessedthe possibility of scaling up STARmap to ac-commodate higher gene numbers; although theSTARmap scheme can encode and decode morethan 1 million codes and the physical volume ofmammalian cells is not limiting for amplificationof more than 1000 genes (fig. S15), the 1020-geneexperiments approached the upper limit of theoptical volume of cells (fig. S15E); for those casesin which more genes are needed, STARmap
may cover the whole transcriptome with more se-quencing rounds of serial 1000-gene detection,or via optical resolution enhanced with super-resolution microscopy (38, 39) or the physical swell-ing typical of the hydrogel-tissue chemistries (14, 19).
Adapting STARmap to thick tissueblocks for 3D analyses
In neuroscience, addressing the 3D complexityof both neurons and neural circuits has gener-ally required the development and use of thick
tissue blocks or fully intact brains for functionaland structural readouts, including electrophysio-logy, imaging of activity, and analysis of mor-phology and connectivity. Therefore, for linkingthese readout measures from intact or semi-intact tissue preparations with cellular-resolutiongene expression readouts from the very samepreparations, methods of 3D spatial transcrip-tomic analysis in thick tissues have long beensought in order to achieve datastream regis-tration as well as preserve 3D morphology and
Wang et al., Science 361, eaat5691 (2018) 27 July 2018 7 of 9
Fig. 6. 3D architecture of cell types in visualcortex volumes. (A) Volumetric STARmappingvia sequential SEDAL gene readout. Using amodified STARmap procedure (fig. S16) andcyclic gene readout (four genes in each cycle),large tissue volumes can be rapidly mapped atsingle-cell resolution without oversampling eachamplicon. (B) Validation showing specificSTARMAP labeling of YFP-expressing neurons(from transgenic Thy1::YFP mouse line) in3D cortical volume. Scale bar, 0.5 mm.(C) Representative labeling of (left) major celltypes, (left center) layer-specific markers,(right center) inhibitory markers, and (right)activity-regulated genes acquired overmultiple rounds in visual cortex STARmapvolumes. (D) Per-cell expression matrix of28 genes from 32,845 single cells from onevolume clustered into multiple excitatory,inhibitory, and non-neuronal cell types,z-scored across genes for each cell in orderto normalize for mean differences in totalsignal between cells. Columns are sorted byorder of sequencing rounds as conducted, ingroups of four. (E) (Top) Spatial histograms ofexcitatory, inhibitory, and non-neuronalcell types, using same color labels as (D).Cells were counted in 5-mm bins in a 2Dmax-projection and plotted in cell-count-per-micrometer units as a function of distancefrom the corpus callosum (cc) to the pia,averaged across the bins perpendicular tothe cortical layers. (Bottom) Plot ofmax-projected cell locations color-coded bycluster as in (D). (F) Spatial distribution ofeach cell type (excitatory, inhibitory, andnon-neuronal) and subtypes in threedimensions. Each dot represents a singlecell; spatial dimensions are in micrometers.(G) Average nearest-neighbor distancescomputed in three dimensions between allexcitatory cells (Excite) and each inhibitory celltype. For self-comparisons, the nearest neigh-bor was defined as the closest nonidentical cell;persistent self-correlation reveals self-clusteringof inhibitory subtypes. (H) Same distances as(H) but using shuffled (randomized) cell-typelabels. (I) Nearest-neighbor distances com-puted in three dimensions between each inhib-itory cell of a certain type and any member ofthe same type (Inhib → Inhib, eg VIP → VIP)or any excitatory neuron (Inhib → Excite).**** P < 0.0001, Wilcoxon rank-sum test.
RESEARCH | RESEARCH ARTICLEon July 30, 2018
http://science.sciencemag.org/
Dow
nloaded from

to obtain readouts from very much larger cellnumbers (2). The initial experiments were car-ried out in brain slices no more than one cellbody thick; we therefore next developed andtested STARmap to overcome limitations indiffusional access and imaging throughput forlarge tissue volumes, with a modified strategy forlinearly reading out gene expression at cellularresolution so as to enable high-throughput mo-lecular analysis in tissue volumes (Fig. 6A andfig. S16). Specificity and penetration depth oflarge-volume STARmap were tested initially byusing Thy1::YFPmouse brains, in which STARmapsuccessfully detected yellow fluorescent protein(YFP) mRNA across 150 mm of tissue thicknessand specifically colocalized YFP protein andmRNAat single-cell resolution (Fig. 6B) without label-ing the tens of thousands of interspersed neigh-boring cells.We then extended the spatial cell-typing of
mouse V1 to more than 30,000 cells acrossvolumes spanning all six layers and the corpuscallosum. Using a curated gene set including 23cell-type markers and five ARGs read out overseven cycles of linear SEDAL sequencing (Fig. 6,C and D, and fig. S17), we applied K-means clus-tering of marker genes (supplementary materials,materials and methods) for each cell type (recov-ering 11 cell types corresponding to the majorityof those extracted by the 160-gene experiment).We found that 3D patterning of the 11 cell types(Fig. 6, E and F) was consistent with the 160-gene thin-section tissue findings but providedan accurate and quantitative profiling of cellulardistribution across space, with much larger cellnumbers. As reflected by both spatial-histogram(Fig. 6E) and correlational analyses (fig. S17B),excitatory subtypes exhibited a layered gradientdistribution, with the spatial density of each sub-type decaying across space into adjacent layers.By contrast, inhibitory subtypes were dispersed,albeit with layer preferences exhibited by the Vipsubtype (largely located in layer 2/3) and the Sstand Pvalb subtypes (in layers 4 and 5). Non-neuronal cells were largely seen in layer 1 andwhite matter.To discover yet-finer volumetric patterns, we
further analyzed the distribution of distancesfrom each individual cell from each sequencing-defined subtype to its nearest neighbors, find-ing unexpectedly that the nearest neighbor ofany inhibitory neuron tended to be its ownsubtype, rather than excitatory neurons or otherinhibitory subtypes (Fig. 6G). If inhibitory neu-rons were randomly dispersed among the moreabundant excitatory neurons in a purely salt-and-pepper distribution, the distance betweeninhibitory neurons would be larger than thatfrom inhibitory to excitatory neurons (Fig. 6H).Instead, the actual intrasubtype distance of in-hibitory neurons was much shorter (~15 mm,which is equivalent to the size of a single neu-ron, indicating direct somatic juxtaposition)(Fig. 6I), revealing a short-range self-clusteringorganization of inhibitory subtypes across vol-umes that could only be accurately measured inthree but not in two dimensions (fig. S18A). When
guided by this initial STARmap observation,evidence for such patterning could be also ob-tained in transgenic mouse lines (fig. S18, B andC). This discovery bears considerable relevance toprevious functional work; for example, electro-physiological studies have suggested that inhib-itory neurons in spatial proximity tend to beconnected by electric (gap) junctions importantfor setting up synchronized firing patterns(40, 41), and in vivo imaging has suggested thatinhibitory-neuron groupings in visual cortex couldsharpen visual responses (42).
Discussion
STARmap defines a platform for 3D in situ tran-scriptomics, enabled by state-of-the-art DNA li-brary preparation and sequencing in an HTCformulation. Here, STARmap was shown to beapplicable to the study of molecularly definedcell types and activity-regulated gene expressionin mouse cortex and to be scalable to larger 3Dtissue blocks so as to visualize short- and long-range spatial organization of cortical neuronson a volumetric scale not previously accessible.In future work, STARmap may also be adaptedto longer sequencing lengths or higher gene num-bers; there is no intrinsic limit to the number ofgenes or RNA species that can be simultaneouslyand quantitatively accessed with STARmap (fig.S15); STARmap may also be capable of integrat-ing cell-type information with single-neuron mor-phology and projection anatomy (for example, bymeans of Brainbow and MAPseq) (43, 44) as wellas with in vivo neural activity imaging andelectrophysiology. This platform can also be gen-eralized to study other heterogeneous cell popula-tions in diverse tissues across the body, althoughthe brain poses special challenges well suited toSTARmap analysis. For example, the polymor-phic ARG expression observed across differentcell types is likely to depend on both intrinsiccell-biological properties (such as signal trans-duction pathway-component expression) andon extrinsic properties such as neural circuitanatomy that routes external sensory informa-tion to different cells (here, in visual cortex). Ingeneral, it may not be possible to fully definebrain cell typology independent of such 3D anat-omy as well as activity patterns exhibited andexperienced by cells during behavior; the natureof input and output communication pathways forthe cells in question in fact can form the founda-tion for defining cell types (35, 36). Towardthis end, in situ transcriptomics exemplifiedby STARmap can effectively link this imaging-basedmolecular information with complementarycellular-resolution datastreams describing anat-omy, natural activity, and causal importance, thuspromising to fundamentally deepen our under-standing of brain function and dysfunction (2).
Methods summary
All animal procedures followed animal careguidelines approved by Stanford University’sAdministrative Panel on Laboratory Animal Care(APLAC) and guidelines of the National Institutesof Health. For thin sections, animals were anes-
thetized and rapidly decapitated; the brain tis-sues were sliced by use of a cryostat. For thicksections, animals were anesthetized and trans-cardially perfused with paraformaldehyde; thebrain tissues were sliced by use of a vibratome.In STARmap experiments, tissues were hybridizedwith SNAIL probes, enzymatically amplified,hydrogel embedded, and sequentially imagedby using the SEDAL process and a confocal mi-croscope. The resulting image datasets wereregistered across multiple cycles by using thepositions of all amplicons in each cycle anddecoded. For cell typing and single-cell geneexpression analyses, the amplicons were attrib-uted to individual cells based on segmentationimages of fluorescent Nissl staining. All thedetailed procedures for the experiments and dataanalyses are described in the supplementarymaterials.
REFERENCES AND NOTES
1. N. Crosetto, M. Bienko, A. van Oudenaarden, Spatially resolvedtranscriptomics and beyond. Nat. Rev. Genet. 16, 57–66(2015). doi: 10.1038/nrg3832; pmid: 25446315
2. E. Lein, L. E. Borm, S. Linnarsson, The promise of spatialtranscriptomics for neuroscience in the era of molecular celltyping. Science 358, 64–69 (2017). doi: 10.1126/science.aan6827; pmid: 28983044
3. E. Lubeck, L. Cai, Single-cell systems biology by super-resolution imaging and combinatorial labeling. Nat. Methods 9,743–748 (2012). doi: 10.1038/nmeth.2069; pmid: 22660740
4. K. H. Chen, A. N. Boettiger, J. R. Moffitt, S. Wang, X. Zhuang,RNA imaging. Spatially resolved, highly multiplexed RNAprofiling in single cells. Science 348, aaa6090 (2015).doi: 10.1126/science.aaa6090; pmid: 25858977
5. S. Shah, E. Lubeck, W. Zhou, L. Cai, In situ transcriptionprofiling of single cells reveals spatial organization of cells inthe mouse hippocampus. Neuron 92, 342–357 (2016).doi: 10.1016/j.neuron.2016.10.001; pmid: 27764670
6. R. Ke et al., In situ sequencing for RNA analysis in preservedtissue and cells. Nat. Methods 10, 857–860 (2013).doi: 10.1038/nmeth.2563; pmid: 23852452
7. J. H. Lee et al., Highly multiplexed subcellular RNA sequencingin situ. Science 343, 1360–1363 (2014). doi: 10.1126/science.1250212; pmid: 24578530
8. A. P. Frei et al., Highly multiplexed simultaneous detection ofRNAs and proteins in single cells. Nat. Methods 13, 269–275(2016). doi: 10.1038/nmeth.3742; pmid: 26808670
9. X. Chen, Y.-C. Sun, G. M. Church, J. H. Lee, A. M. Zador,Efficient in situ barcode sequencing using padlock probe-basedBaristaSeq. Nucleic Acids Res. 46, e22 (2018). doi: 10.1093/nar/gkx1206; pmid: 29190363
10. M. Nagendran, D. P. Riordan, P. B. Harbury, T. J. Desai,Automated cell-type classification in intact tissues by single-cell molecular profiling. eLife 7, e30510 (2018). doi: 10.7554/eLife.30510; pmid: 29319504
11. N. A. Peppas, J. Z. Hilt, A. Khademhosseini, R. Langer,Hydrogels in biology and medicine: From molecular principlesto bionanotechnology. Adv. Mater. 18, 1345–1360 (2006).doi: 10.1002/adma.200501612
12. A. M. Rosales, K. S. Anseth, The design of reversible hydrogelsto capture extracellular matrix dynamics. Nat. Rev. Mater. 1,1–15 (2016). pmid: 29214058
13. R. Y. Tam, L. J. Smith, M. S. Shoichet, Engineering cellularmicroenvironments with photo- and enzymatically responsivehydrogels: Toward biomimetic 3D cell culture models.Acc. Chem. Res. 50, 703–713 (2017). doi: 10.1021/acs.accounts.6b00543; pmid: 28345876
14. V. Gradinaru, J. Treweek, K. Overton, K. Deisseroth, Hydrogel-tissue chemistry: Principles and applications. Annu. Rev.Biophys. 47, 355–376 (2018). doi: 10.1146/annurev-biophys-070317-032905; pmid: 29792820
15. K. Chung et al., Structural and molecular interrogation of intactbiological systems. Nature 497, 332–337 (2013). doi: 10.1038/nature12107; pmid: 23575631
16. E. L. Sylwestrak, P. Rajasethupathy, M. A. Wright, A. Jaffe,K. Deisseroth, Multiplexed intact-tissue transcriptional analysis
Wang et al., Science 361, eaat5691 (2018) 27 July 2018 8 of 9
RESEARCH | RESEARCH ARTICLEon July 30, 2018
http://science.sciencemag.org/
Dow
nloaded from

at cellular resolution. Cell 164, 792–804 (2016). doi: 10.1016/j.cell.2016.01.038; pmid: 26871636
17. S. Shah et al., Single-molecule RNA detection at depth byhybridization chain reaction and tissue hydrogel embeddingand clearing. Development 143, 2862–2867 (2016).doi: 10.1242/dev.138560; pmid: 27342713
18. J. R. Moffitt et al., High-performance multiplexed fluorescencein situ hybridization in culture and tissue with matrix imprintingand clearing. Proc. Natl. Acad. Sci. U.S.A. 113, 14456–14461(2016). doi: 10.1073/pnas.1617699113; pmid: 27911841
19. F. Chen et al., Nanoscale imaging of RNA with expansionmicroscopy. Nat. Methods 13, 679–684 (2016). doi: 10.1038/nmeth.3899; pmid: 27376770
20. J. Shendure et al., Accurate multiplex polony sequencing of anevolved bacterial genome. Science 309, 1728–1732 (2005).doi: 10.1126/science.1117389; pmid: 16081699
21. J. H. Lee et al., Fluorescent in situ sequencing (FISSEQ) of RNAfor gene expression profiling in intact cells and tissues.Nat. Protoc. 10, 442–458 (2015). doi: 10.1038/nprot.2014.191;pmid: 25675209
22. R. Drmanac et al., Human genome sequencing usingunchained base reads on self-assembling DNA nanoarrays.Science 327, 78–81 (2010). doi: 10.1126/science.1181498;pmid: 19892942
23. L. L. Glickfeld, R. C. Reid, M. L. Andermann, A mouse modelof higher visual cortical function. Curr. Opin. Neurobiol.24, 28–33 (2014). doi: 10.1016/j.conb.2013.08.009;pmid: 24492075
24. B. Tasic et al., Adult mouse cortical cell taxonomy revealedby single cell transcriptomics. Nat. Neurosci. 19, 335–346(2016). doi: 10.1038/nn.4216; pmid: 26727548
25. A. Zeisel et al., Brain structure. Cell types in the mousecortex and hippocampus revealed by single-cell RNA-seq.Science 347, 1138–1142 (2015). doi: 10.1126/science.aaa1934;pmid: 25700174
26. T. K. Kim et al., Widespread transcription at neuronal activity-regulated enhancers. Nature 465, 182–187 (2010).doi: 10.1038/nature09033; pmid: 20393465
27. A. R. Mardinly et al., Sensory experience regulates corticalinhibition by inducing IGF1 in VIP neurons. Nature 531,371–375 (2016). doi: 10.1038/nature17187; pmid: 26958833
28. S. Hrvatin et al., Single-cell analysis of experience-dependenttranscriptomic states in the mouse visual cortex.Nat. Neurosci. 21, 120–129 (2018). doi: 10.1038/s41593-017-0029-5; pmid: 29230054
29. E. S. Lein et al., Genome-wide atlas of gene expression in theadult mouse brain. Nature 445, 168–176 (2007). doi: 10.1038/nature05453; pmid: 17151600
30. K. Shekhar et al., Comprehensive classification of retinalbipolar neurons by single-cell transcriptomics. Cell 166,1308–1323.e30 (2016). doi: 10.1016/j.cell.2016.07.054;pmid: 27565351
31. J. Y. Joo, K. Schaukowitch, L. Farbiak, G. Kilaru, T.-K. Kim,Stimulus-specific combinatorial functionality of neuronal c-fosenhancers. Nat. Neurosci. 19, 75–83 (2016). doi: 10.1038/nn.4170; pmid: 26595656
32. M. Carlén, What constitutes the prefrontal cortex? Science358, 478–482 (2017). doi: 10.1126/science.aan8868;pmid: 29074767
33. H. B. Uylings, H. J. Groenewegen, B. Kolb, Do rats have aprefrontal cortex? Behav. Brain Res. 146, 3–17 (2003).doi: 10.1016/j.bbr.2003.09.028; pmid: 14643455
34. S. Lee, J. Hjerling-Leffler, E. Zagha, G. Fishell, B. Rudy, Thelargest group of superficial neocortical GABAergic interneuronsexpresses ionotropic serotonin receptors. J. Neurosci. 30,16796–16808 (2010). doi: 10.1523/JNEUROSCI.1869-10.2010;pmid: 21159951
35. A. Paul et al., Transcriptional architecture of synapticcommunication delineates GABAergic neuron identity. Cell171, 522–539.e20 (2017). doi: 10.1016/j.cell.2017.08.032;pmid: 28942923
36. T. N. Lerner, L. Ye, K. Deisseroth, Communication inneural circuits: Tools, opportunities, and challenges.Cell 164, 1136–1150 (2016). doi: 10.1016/j.cell.2016.02.027;pmid: 26967281
37. L. Ye et al., Wiring and molecular features of prefrontal ensemblesrepresenting distinct experience. Cell 165, 1776–1788 (2016).doi: 10.1016/j.cell.2016.05.010; pmid: 27238022
38. M. J. Rust, M. Bates, X. Zhuang, Sub-diffraction-limit imagingby stochastic optical reconstruction microscopy (STORM).Nat. Methods 3, 793–795 (2006). doi: 10.1038/nmeth929;pmid: 16896339
39. E. Betzig et al., Imaging intracellular fluorescent proteins atnanometer resolution. Science 313, 1642–1645 (2006).doi: 10.1126/science.1127344; pmid: 16902090
40. J. R. Gibson, M. Beierlein, B. W. Connors, Two networks ofelectrically coupled inhibitory neurons in neocortex.Nature 402, 75–79 (1999). doi: 10.1038/47035;pmid: 10573419
41. Y. Amitai et al., The spatial dimensions of electrically couplednetworks of interneurons in the neocortex. J. Neurosci. 22,4142–4152 (2002). doi: 10.1523/JNEUROSCI.22-10-04142.2002; pmid: 12019332
42. T. Ebina et al., 3D clustering of GABAergic neurons enhancesinhibitory actions on excitatory neurons in the mouse visualcortex. Cell Reports 9, 1896–1907 (2014). doi: 10.1016/j.celrep.2014.10.057; pmid: 25464846
43. J. Livet et al., Transgenic strategies for combinatorialexpression of fluorescent proteins in the nervous system.Nature 450, 56–62 (2007). doi: 10.1038/nature06293;pmid: 17972876
44. J. M. Kebschull et al., High-throughput mapping of single-neuron projections by sequencing of barcoded RNA. Neuron91, 975–987 (2016). doi: 10.1016/j.neuron.2016.07.036;pmid: 27545715
ACKNOWLEDGMENTS
We are grateful for the efforts and support of Deisseroth laboratorymembers A. Crow, S. Quirin, A. Chibukhchyan, C. Lee, M. Lo,and C. Delacruz. We thank M. Lovett-Barron for helping with imageregistration and J. H. Lee (Cold Spring Harbor Laboratory), J. Yan(Princeton University), N. D. Donoghue (Brown University), and
Q. Dai (University of Chicago) for advice. We thank Deisserothlaboratory members L. Ye, A. Andalman, H. Wang, and B. Hsuehfor discussion. We also thank L. Luo for suggestions on themanuscript. Funding: X.W. is supported by a Life Science ResearchFoundation fellowship and the Gordon and Betty Moore Foundation.W.E.A. is supported by a Fannie and John Hertz Foundation Fellowshipand an NSF Graduate Research Fellowship. E.L.S. is supportedby a NIMH Ruth L. Kirschstein NRSA fellowship (1F32MH110144-01).M.A.W. is supported by an NIMH Career Development Award(1K08MH113039). J.L. is supported by a Bio-X InterdisciplinaryInitiatives Seed Grant. G.P.N., N.S., and F.-A. B. were supported by theParker Institute for Cancer Immunotherapy, the FDA, and theNIH; F.-A.B. was supported by the Human Frontiers Science Program.K.D. is supported by NIMH (R01MH099647), NIDA (P50DA042012),the DARPA NeuroFAST program W911NF-14-2-0013, the NSFNeuroNex program, the Gatsby Foundation, the AE Foundation, theNOMIS Foundation, the Fresenius Foundation, the Wiegers FamilyFund, the James Grosfeld Foundation, the Sam and Betsy ReevesFoundation, and the H. L. Snyder Foundation. Author contributions:X.W. and K.D. initiated the STARmap project to integrate HTC with insitu sequencing. X.W. developed the STARmap HTC, SEDALsequencing, and STARmap hardware, designed all the DNA probes,and conducted the experiments. W.E.A. developed the STARmapsoftware pipeline and analyzed the sequencing data. N.S., F.-A.B., andG.P.N. designed the initial versions of the SNAIL system. X.W. andF.-A.B. developed the SNAIL process for mouse brain tissue andcompared SNAIL with other in situ methods. M.A.W. and E.L.S.conducted animal behavior and preparation of mouse brain tissue andcontributed valuable advice. M.A.W. compared Nissl staining withother segmentation methods. W.E.A. and E.L.S. designed thevisual-stimulus and cocaine-stimulus procedures. S.V. generated theCLARITY data with PV transgenicmice. K.E. and C.R. contributed topreparation of cell cultures. C.L. assisted with experiments. J.L.assisted with experiments and graphic design. K.D. supervised allaspects of the work. X.W., W.E.A., and K.D. interpreted the STARmapdata, designed and prepared the figures, and wrote the manuscript,with edits from all authors. Competing interests: The design,steps, and applications of STARmap are covered in pending patentapplication material from Stanford University; all methods, protocols,and sequences are freely available to nonprofit institutions andinvestigators. Data and materials availability: All data are availablein the main text or the supplementary materials. Computationaltools and code and other materials are available at http://clarityresourcecenter.org. References for the open-source softwarepackages used here can be found in the supplementary materials.
SUPPLEMENTARY MATERIALS
www.sciencemag.org/content/361/6400/eaat5691/suppl/DC1Materials and MethodsFigs. S1 to S18References (45–49)Tables S1 and S2
13 March 2018; resubmitted 1 June 2018Accepted 13 June 201810.1126/science.aat5691
Wang et al., Science 361, eaat5691 (2018) 27 July 2018 9 of 9
RESEARCH | RESEARCH ARTICLEon July 30, 2018
http://science.sciencemag.org/
Dow
nloaded from

Three-dimensional intact-tissue sequencing of single-cell transcriptional states
Liu, Charu Ramakrishnan, Jia Liu, Garry P. Nolan, Felice-Alessio Bava and Karl DeisserothXiao Wang, William E. Allen, Matthew A. Wright, Emily L. Sylwestrak, Nikolay Samusik, Sam Vesuna, Kathryn Evans, Cindy
originally published online June 21, 2018DOI: 10.1126/science.aat5691 (6400), eaat5691.361Science
, this issue p. eaat5691; see also p. 328Sciencebrain at single-cell resolution to define cell types and circuit states and to reveal cell organization principles.sequencing (see the Perspective by Knöpfel). More than 1000 genes were simultaneously mapped in sections of mousewith hydrogel-tissue chemistry to develop a multidisciplinary technology for three-dimensional (3D) intact-tissue RNA
combined an efficient sequencing approachet al.but face a challenge in dense, complex tissue environments. Wang other hand, can only profile a small number of transcripts. In situ sequencing technologies address these shortcomings
RNA sequencing samples the entire transcriptome but lacks anatomical information. In situ hybridization, on theTranscriptome mapping in the 3D brain
ARTICLE TOOLS http://science.sciencemag.org/content/361/6400/eaat5691
MATERIALSSUPPLEMENTARY http://science.sciencemag.org/content/suppl/2018/06/20/science.aat5691.DC1
CONTENTRELATED
http://stm.sciencemag.org/content/scitransmed/7/281/281re2.fullhttp://science.sciencemag.org/content/sci/361/6400/328.full
REFERENCES
http://science.sciencemag.org/content/361/6400/eaat5691#BIBLThis article cites 49 articles, 13 of which you can access for free
PERMISSIONS http://www.sciencemag.org/help/reprints-and-permissions
Terms of ServiceUse of this article is subject to the
is a registered trademark of AAAS.Sciencelicensee American Association for the Advancement of Science. No claim to original U.S. Government Works. The title Science, 1200 New York Avenue NW, Washington, DC 20005. 2017 © The Authors, some rights reserved; exclusive
(print ISSN 0036-8075; online ISSN 1095-9203) is published by the American Association for the Advancement ofScience
on July 30, 2018
http://science.sciencemag.org/
Dow
nloaded from