©Biotechnology Society ISSN 0974-1453 ... · PDF fileResearch Article ILLUSTRATIVE...
17
Sivakumar et al (2015) Biotechnology International 8(4): 101-117 101 ©Biotechnology Society www.bti.org.in ISSN 0974-1453 Research Article ILLUSTRATIVE MORPHOLOGICAL TAXONOMY AND DNA BARCODING STUDY OF REBA CARP Cirrhinus reba (HAMILTON) FROM LOWER ANICUT, TAMIL NADU, INDIA 1* Mathialagan Ramasamy, 3 Subburaj Jayachandran, 4 Thangaraj Muthusamy, 1* Sivakumar Rajangam, 2 Chandrasekar Shanmugam 1 Post Graduate and Research Department of Biotechnology, AVS College of Arts & Science, Salem-636 106, Tamil Nadu; 1*,2 Post Graduate and Research Department of Zoology, Government Arts College, Kumbakonam – 612 001, Tamil Nadu; 3 Chettinad Academy of Research & Education, Kelambakkam, Chennai-603 103, Tamil Nadu; 4 Faculty of Marine Sciences, Division of Marine Biotechnology, Centre for Advanced Studies in Marine Biology, Annamalai University, Parangipettai-608 502, Tamil Nadu, India. *Corresponding Author: [email protected] ABSTRACT DNA barcoding are mainly focusing an analysis on a short standardized segment and 5' region of mitochondrial DNA cytochrome c oxidase subunit I (COI) gene is a standard marker of DNA barcode. Here, the photographic image for essentially helpful an identification guide for field collection. The mtCOI gene has also been advocated for identification marker in many animal species. The present work discusses the mtCOI gene to discriminate wild species Cirrhinus reba. Key Words: Biometric characters, MtCOI gene, Phylogenetic tree, Species identification. INTRODUCTION Cirrhinus reba has drawn attention as one of the potential new candidate species for aquaculture and captive breeding (Ayyappan and Jena, 2001). In order to identify species, the exploited fish resource must be collected (Begg and Waldman, 1999). Resembling, analysis of morphometric and meristic characters has been widely used for identification of fish stocks to determine the taxonomic groups even to distinguish cohorts of a single species rather than sub-populations (Murta,
-
Upload
nguyenlien -
Category
Documents
-
view
218 -
download
3
Transcript of ©Biotechnology Society ISSN 0974-1453 ... · PDF fileResearch Article ILLUSTRATIVE...
Sivakumar et al (2015) Biotechnology International 8(4): 101-117
101
©Biotechnology Society www.bti.org.in
ISSN 0974-1453
Research Article
ILLUSTRATIVE MORPHOLOGICAL TAXONOMY AND DNA BARCODING
STUDY OF REBA CARP Cirrhinus reba (HAMILTON) FROM LOWER ANICUT,
TAMIL NADU, INDIA
1*Mathialagan Ramasamy, 3Subburaj Jayachandran,4Thangaraj Muthusamy,
1*Sivakumar Rajangam, 2Chandrasekar Shanmugam
1Post Graduate and Research Department of Biotechnology, AVS College of Arts & Science,
Salem-636 106, Tamil Nadu; 1*,2Post Graduate and Research Department of Zoology,
Government Arts College, Kumbakonam – 612 001, Tamil Nadu; 3Chettinad Academy of
Research & Education, Kelambakkam, Chennai-603 103, Tamil Nadu; 4Faculty of Marine
Sciences, Division of Marine Biotechnology, Centre for Advanced Studies in Marine Biology,
Annamalai University, Parangipettai-608 502, Tamil Nadu, India.
*Corresponding Author: [email protected]
ABSTRACT
DNA barcoding are mainly focusing an analysis on a short standardized segment and 5'
region of mitochondrial DNA cytochrome c oxidase subunit I (COI) gene is a standard
marker of DNA barcode. Here, the photographic image for essentially helpful an
identification guide for field collection. The mtCOI gene has also been advocated for
identification marker in many animal species. The present work discusses the mtCOI
gene to discriminate wild species Cirrhinus reba.
Key Words: Biometric characters, MtCOI gene, Phylogenetic tree, Species identification.
INTRODUCTION
Cirrhinus reba has drawn attention
as one of the potential new candidate species
for aquaculture and captive breeding
(Ayyappan and Jena, 2001). In order to
identify species, the exploited fish resource
must be collected (Begg and Waldman,
1999). Resembling, analysis of
morphometric and meristic characters has
been widely used for identification of fish
stocks to determine the taxonomic groups
even to distinguish cohorts of a single
species rather than sub-populations (Murta,

Sivakumar et al (2015) Biotechnology International 8(4): 101-117
102
2000). In this context, the International
Union of Conservation and Nature (IUCN,
2011) recommended complete research on
taxonomical discrimination. Yet, the
taxonomic ambiguity exists for several fish
genera/ species and proper identification is
imperative for fisheries management (Lakra
et al., 2011). Besides, identification is mega
challenge in fishes prompted by an
international Fish Barcoding of Life (FISH-
BOL) initiative (http://www.fishbol.org)
with the aim of barcoding for all fishes.
Although, the mitochondrial cytochrome c
oxidase subunit I (mtCOI) gene divergence
and species identification success has been
previously assessed for some marine fishes,
average divergence found among freshwater
fish species is unknown. Given their higher
diversity and dramatic phenotypic changes
during developmental stages of fish, species
identification is not easy task even for
trained taxonomists (Ward et al., 2009). In
addition, species level identification is
repeatedly complicated through lack of
strong morphological and anatomical
characters to discriminate species and
degree of unpredictability which affects
some diagnostic characters. Consequently,
fish fauna provides an excellent opportunity
to test the efficacy of barcode-based species
delimitation and identification of freshwater
fishes over a broad geographic range
(Hebert et al., 2008). Moreover, it is
difficult to distinguish between Labeo bata
and C. reba even in their adult stage using
morphological characters. At the moment,
accurate species identification system in
fisheries research is a challenging one
through the life cycle of fishes, from eggs
and larvae to sibling adult stages. However,
taxonomic and phylogenetic analyses using
molecular markers are essential to test
whether classification based morphological
characters are corroborated (Mohanty et al.,
2013). In such cases wherever
morphological information are insufficient
to identify species, macromolecules such as
DNA, RNA and Proteins may serve as
unique identifiers to discriminate species.
Similarly, DNA barcoding has emerged as a
powerful molecular system for fast and
accurate species identification because, the
conserved sequence of the 5'- region in
mtCOI gene was proposed as a platform for
the universal DNA barcoding of life (Hebert
et al., 2003). It has been recommended as a
universal, standard and effective DNA
barcoding marker of fishes (Hebert et al.,
2008). Further, in Tamil Nadu, the river of
Cauvery has at least 106 freshwater species
included in seventeen families
(www.fishbase.com). Unfortunately, most of
the species have not been barcoded yet.
Moreover, the present mitochondrial DNA
(mtDNA) barcode based classification of
freshwater minor carp C. reba is to resolve
the key areas of doubt arising from
morphological taxonomy. It will also help
further in easy identification of the studied
species (Bhattacharjee et al., 2012). The
purpose of this study is to provide detailed
morphological (photographical) image
identification with special reference to DNA
barcoding of this species, as a basis for
further ontogenetic research as well as to
contribute for taxonomic and phylogenetic
inference.
MATERIALS AND METHODS
Study area and biometric
sampling
Sivakumar et al (2015) Biotechnology International 8(4): 101-117
103
Lower Anicut (Kollidam River) is
one of the major freshwater fishery
resources within the northern region of
Tamil Nadu (11° 15' N latitude and 79° 30'
E longitude) which was selected for the
present study. Among the varied fish fauna
landed, the family of Cyprinidae is one of
the dominant fisheries in this region.
Sampling focused the species C. reba
collected from the landing centre at Lower
Anicut, Tamil Nadu. Fifty individuals of
fresh specimens were used for phenotypic-
taxonomy and DNA barcoding. After
collection, specimens were weighed in and
total length (mm), standard length (mm),
fork length (mm) was measured with the
help of measuring board. Total weight (g)
was measured with an electronic balance
(DIGI’ Arts maximum=1000 g to d=0.5 g).
Specimens were identified morphologically
using scientific literature relevant to the
group with original descriptions by Talwar
and Jhingran, 1991. After identification,
fresh specimens were photographed in all
morphological body parts alive (left-hand
side) prior to tissue sampling. As a result,
tissue samples (i.e., caudal fin) were
collected and stored in sterile eppendorf
tubes containing absolute ethanol, sealed
with parafilm kept at room temperature until
further analysis.
Photographic image identification
The wild populations of C. reba
were employed by invasive photographic
techniques. The natural markings such as
irregular shapes of dark greenish colour on
the body surface with colour patterns of fins
which remain unchanged during life stages.
C. reba was selected individual, using a
digital camera (SAMSUNG-PL 20 with 5x
level; Lens focal length: 4.9-24.5; mega
pixel 14.2 using Adobe Photoshop ver.
CS3). Photographs were taken perpendicular
to the subject were only used when the fish
with all types of fins were fully extended.
Additionally, the resulting of the high-
resolution images was used to extrapolate
the morphological identification.
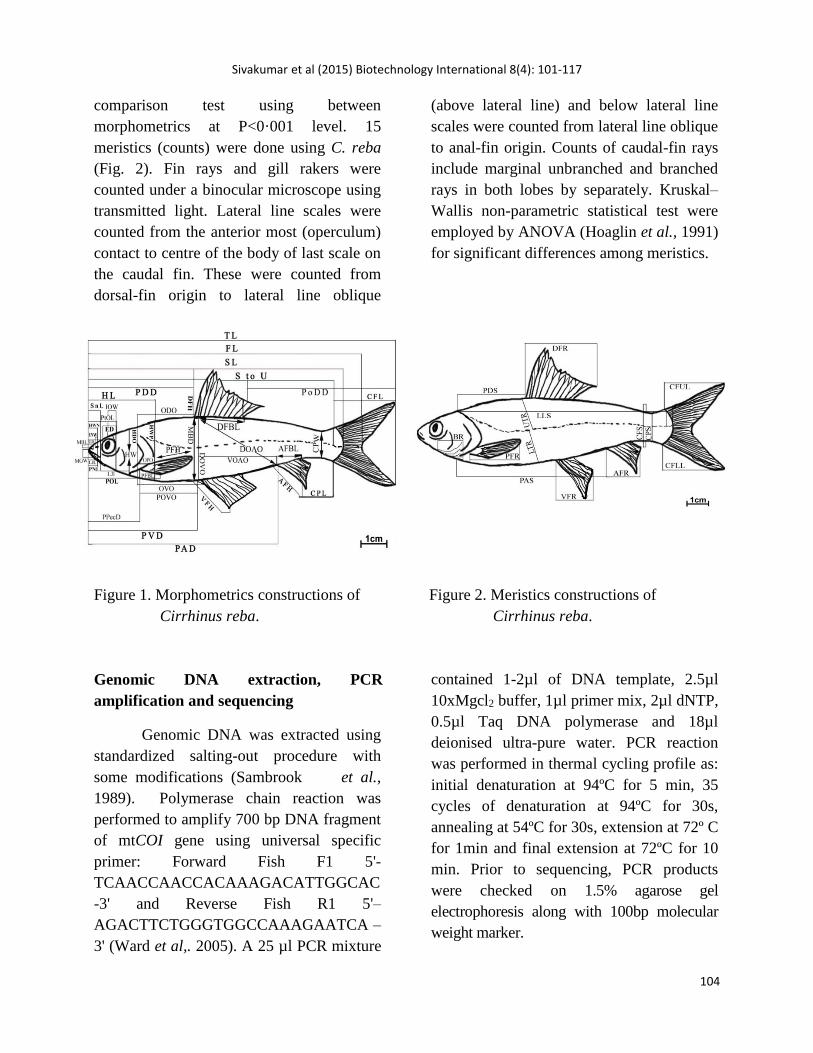
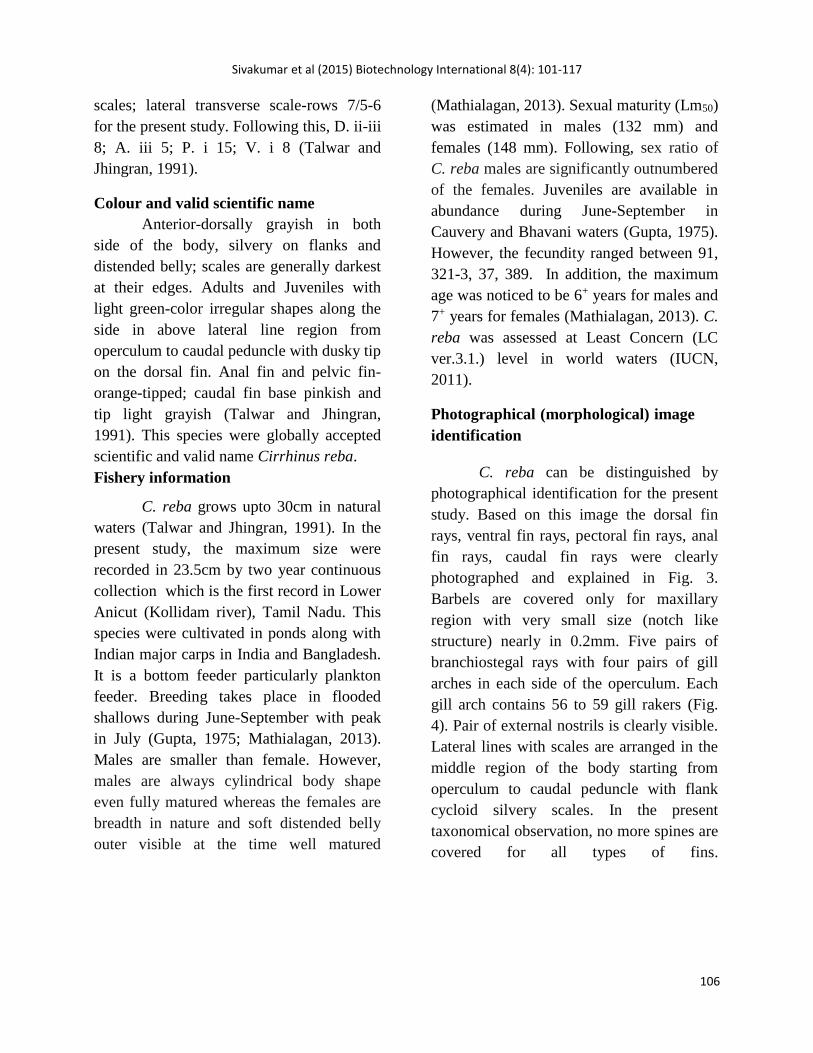
Morphometrics and Meristics
Forty three morphometrics were
measured to an accuracy of 0.1 mm
respectively with all measurements (Fig. 1).
Measurements and counts were done as per
Hubbs and Lagler (1964) and made using
point to point dial calipers and data were
recorded to tenths of a millimeter.
Measurements were made on the left side of
the body whenever possible whereas the
right side depending on state and shape of
preservation. Measurements of the head are
represented as a proportion of head length
(HL); head length and body parts are given
as proportions of standard length (SL).
Statistical analyses were conducted on
morphometrics and meristics, while
meristics are discrete and fixed early in
development (Turan et al., 2006).
Morphometrics were analyzed by SYSTAT,
ver. 13.1 and SPSS, ver. 19.0. Linear
regression and line parameter such as a
(intercept) b (slope) and r2 (regression)
values were made with log-transformed
measurement. Pearson’s correlations co-
efficient (r) were used between
morphometrics at P<0.05 and P<0.01 level
significance. Test of Homogeneity of
Variances (Levene Statistic) by one-way
Analysis of Variance (ANOVA) with Post
Hoc Tuke’s-b Alpha (0.01) multiple
Sivakumar et al (2015) Biotechnology International 8(4): 101-117
104
comparison test using between
morphometrics at P<0·001 level. 15
meristics (counts) were done using C. reba
(Fig. 2). Fin rays and gill rakers were
counted under a binocular microscope using
transmitted light. Lateral line scales were
counted from the anterior most (operculum)
contact to centre of the body of last scale on
the caudal fin. These were counted from
dorsal-fin origin to lateral line oblique
(above lateral line) and below lateral line
scales were counted from lateral line oblique
to anal-fin origin. Counts of caudal-fin rays
include marginal unbranched and branched
rays in both lobes by separately. Kruskal–
Wallis non-parametric statistical test were
employed by ANOVA (Hoaglin et al., 1991)
for significant differences among meristics.
Figure 1. Morphometrics constructions of Figure 2. Meristics constructions of
Cirrhinus reba. Cirrhinus reba.
Genomic DNA extraction, PCR
amplification and sequencing
Genomic DNA was extracted using
standardized salting-out procedure with
some modifications (Sambrook et al.,
1989). Polymerase chain reaction was
performed to amplify 700 bp DNA fragment
of mtCOI gene using universal specific
primer: Forward Fish F1 5'-
TCAACCAACCACAAAGACATTGGCAC
-3' and Reverse Fish R1 5'–
AGACTTCTGGGTGGCCAAAGAATCA –
3' (Ward et al,. 2005). A 25 µl PCR mixture
contained 1-2µl of DNA template, 2.5µl
10xMgcl2 buffer, 1µl primer mix, 2µl dNTP,
0.5µl Taq DNA polymerase and 18µl
deionised ultra-pure water. PCR reaction
was performed in thermal cycling profile as:
initial denaturation at 94ºC for 5 min, 35
cycles of denaturation at 94ºC for 30s,
annealing at 54ºC for 30s, extension at 72º C
for 1min and final extension at 72ºC for 10
min. Prior to sequencing, PCR products
were checked on 1.5% agarose gel
electrophoresis along with 100bp molecular
weight marker.

Sivakumar et al (2015) Biotechnology International 8(4): 101-117
105
Phylogenetic inference and statistical
analyses
Bidirectional sequences of the
amplified COI gene products were purified
by automated capillary sequencer (ABI 3100
PE). Nucleotide sequences were aligned and
edited based on chromatogram inspection
using FinchTV ver. 1.4. Sequences were
trimmed according to the translated
vertebrate mitochondrial amino acid code
program namely MEGA ver. 5.0 (Kumar et
al., 2011). The result obtained was blasted
with similar sequences from National Center
for Biotechnology Information (NCBI),
Barcode of Life Database (BOLD) and
Basic Local Alignment Search Tool
(BLAST) program. Based on the percentage
of similarity, the species was confirmed
within and between species sequences with
high similarity phylogenetic analysis.
Sequences have been deposited to NCBI
GenBank and accession numbers for
barcodes. Phylogenetic trees were
constructed to provide species divergence
through Neighbor Joining (NJ) and
Minimum Evolution (ME) algorithm, were
implemented by MEGA ver. 5.0. Sequence
were conducted using the Kimura 2-
parameter (K2P) model (Kimura, 1980)
includes all nucleotide sequences with
codon positions (1st + 2nd +3rd+ Non-
coding). Herein, Evolutionary divergence,
Codon-based Z test for neutrality and
Fisher’s exact test for neutrality was carried
out. Probability of rejecting null hypothesis of
strict-neutrality position in synonymous and
non-synonymous substitutions (dN = dS)
codon-based test of neutrality were also
analyzed.
RESULTS AND DISCUSSION
Major Keys Description
Key to family One or two pairs or no barbels. Body laterally compressed.
Key to subfamily No knob at symphysis or junction of two arms of lower jaw.
Dorsal fin 7 to 30 branched rays inserted before or opposite origin
of pelvic fins and with or without an osseous simple ray.
Lateral line complete or incomplete running along middle of the
caudal peduncle (Talwar and Jhingran, 1991).
Key to genus Dorsal fin 8 to 16 branched rays. Upper lip and lower lip not continuous.
Key to subgenus Dorsal fin 11 to 15 branched rays
Key to species Lateral line scales 34 to 38. Dorsal fin less than body height.
Morphological identification
Body fairly elongates its depth much
more than head length. Snout slightly
projecting beyond mouth, more pronounced
in juveniles often with pores. Mouth broad;
upper lip entire, often fringed in juveniles; a
thin cartilaginous covering inside of lower
jaw. Barbels of one pair of short rostrals
generally present. Dorsal fin height less than
depth of body. Pectoral fins as long as head.
Caudal fin deeply forked. Scales hexagonal
and moderate, lateral line with 34 to 38
Sivakumar et al (2015) Biotechnology International 8(4): 101-117
106
scales; lateral transverse scale-rows 7/5-6
for the present study. Following this, D. ii-iii
8; A. iii 5; P. i 15; V. i 8 (Talwar and
Jhingran, 1991).
Colour and valid scientific name
Anterior-dorsally grayish in both
side of the body, silvery on flanks and
distended belly; scales are generally darkest
at their edges. Adults and Juveniles with
light green-color irregular shapes along the
side in above lateral line region from
operculum to caudal peduncle with dusky tip
on the dorsal fin. Anal fin and pelvic fin-
orange-tipped; caudal fin base pinkish and
tip light grayish (Talwar and Jhingran,
1991). This species were globally accepted
scientific and valid name Cirrhinus reba.
Fishery information
C. reba grows upto 30cm in natural
waters (Talwar and Jhingran, 1991). In the
present study, the maximum size were
recorded in 23.5cm by two year continuous
collection which is the first record in Lower
Anicut (Kollidam river), Tamil Nadu. This
species were cultivated in ponds along with
Indian major carps in India and Bangladesh.
It is a bottom feeder particularly plankton
feeder. Breeding takes place in flooded
shallows during June-September with peak
in July (Gupta, 1975; Mathialagan, 2013).
Males are smaller than female. However,
males are always cylindrical body shape
even fully matured whereas the females are
breadth in nature and soft distended belly
outer visible at the time well matured
(Mathialagan, 2013). Sexual maturity (Lm50)
was estimated in males (132 mm) and
females (148 mm). Following, sex ratio of
C. reba males are significantly outnumbered
of the females. Juveniles are available in
abundance during June-September in
Cauvery and Bhavani waters (Gupta, 1975).
However, the fecundity ranged between 91,
321-3, 37, 389. In addition, the maximum
age was noticed to be 6+ years for males and
7+ years for females (Mathialagan, 2013). C.
reba was assessed at Least Concern (LC
ver.3.1.) level in world waters (IUCN,
2011).
Photographical (morphological) image
identification
C. reba can be distinguished by
photographical identification for the present
study. Based on this image the dorsal fin
rays, ventral fin rays, pectoral fin rays, anal
fin rays, caudal fin rays were clearly
photographed and explained in Fig. 3.
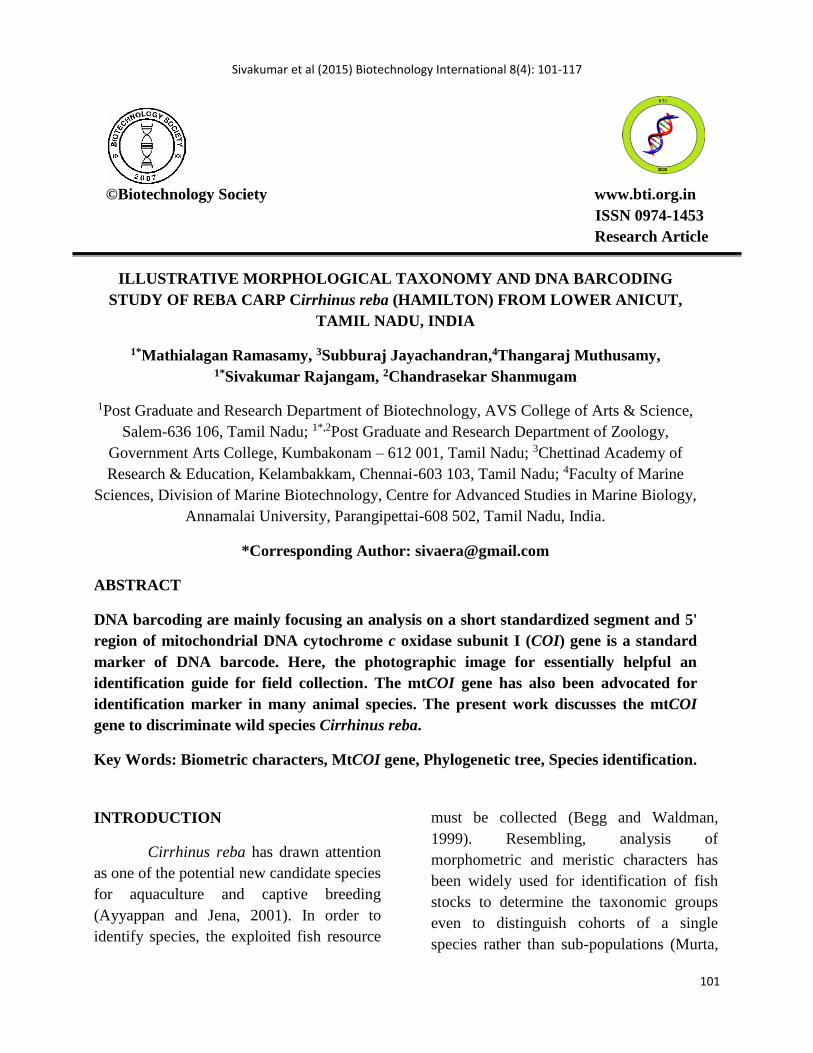
Barbels are covered only for maxillary
region with very small size (notch like
structure) nearly in 0.2mm. Five pairs of
branchiostegal rays with four pairs of gill
arches in each side of the operculum. Each
gill arch contains 56 to 59 gill rakers (Fig.
4). Pair of external nostrils is clearly visible.
Lateral lines with scales are arranged in the
middle region of the body starting from
operculum to caudal peduncle with flank
cycloid silvery scales. In the present
taxonomical observation, no more spines are
covered for all types of fins.

Sivakumar et al (2015) Biotechnology International 8(4): 101-117
107
.
Figure 3. Photographical (morphological) image identification of Cirrhinus reba. (A) Colour in live
specimen C. reba 13.7 mm SL. Note: oval shape ring are covered by pale green in pectoral
and vertical fins. Circular shape ring are covered by dark green patches in body surface. (B)
Structure of the mouth (sub-terminal shape). (C) Nasal hole. (D) Dorsal fin. (E)
Branchiostegal rays. (F) Structure of the barbel (very small size). (G) Pectoral fin. (H) Caudal
fin. (I)Ventralfin.(J)Analfin.
Figure 4. Structure of gill rakers of Cirrhinus reba.
Sivakumar et al (2015) Biotechnology International 8(4): 101-117
108
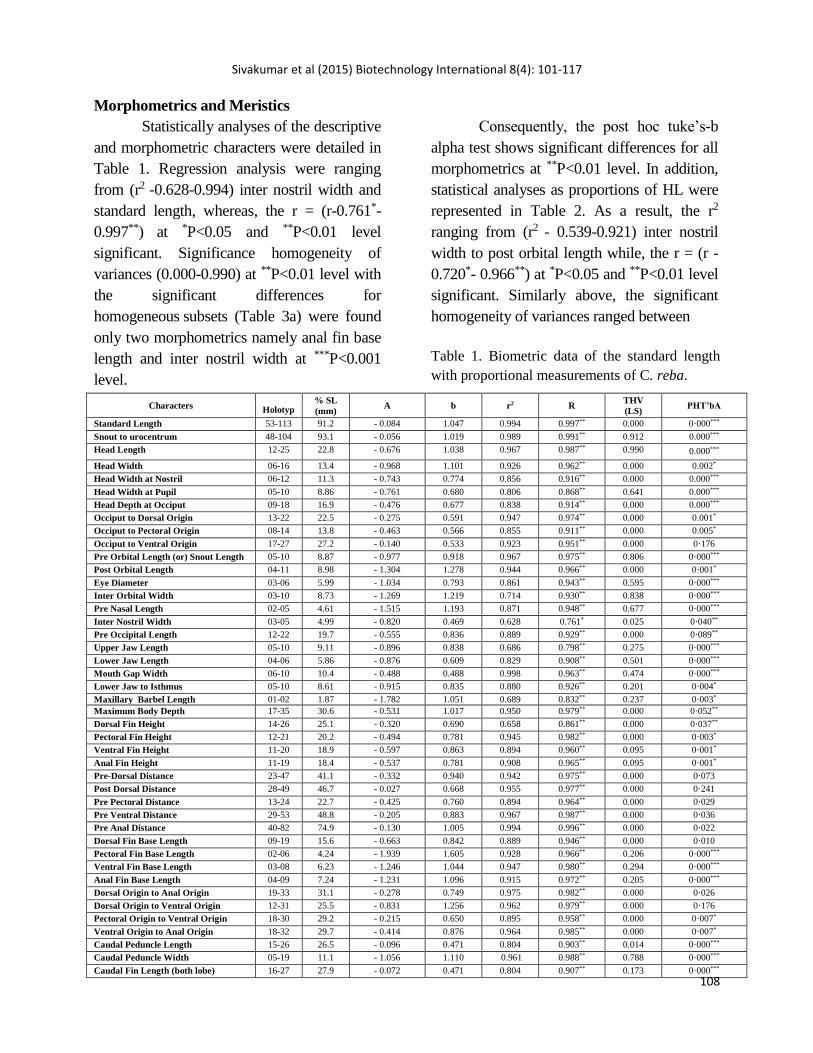
Morphometrics and Meristics
Statistically analyses of the descriptive
and morphometric characters were detailed in
Table 1. Regression analysis were ranging
from (r2 -0.628-0.994) inter nostril width and
standard length, whereas, the r = (r-0.761*-
0.997**) at *P<0.05 and **P<0.01 level
significant. Significance homogeneity of
variances (0.000-0.990) at **P<0.01 level with
the significant differences for
homogeneous subsets (Table 3a) were found
only two morphometrics namely anal fin base
length and inter nostril width at ***P<0.001
level.
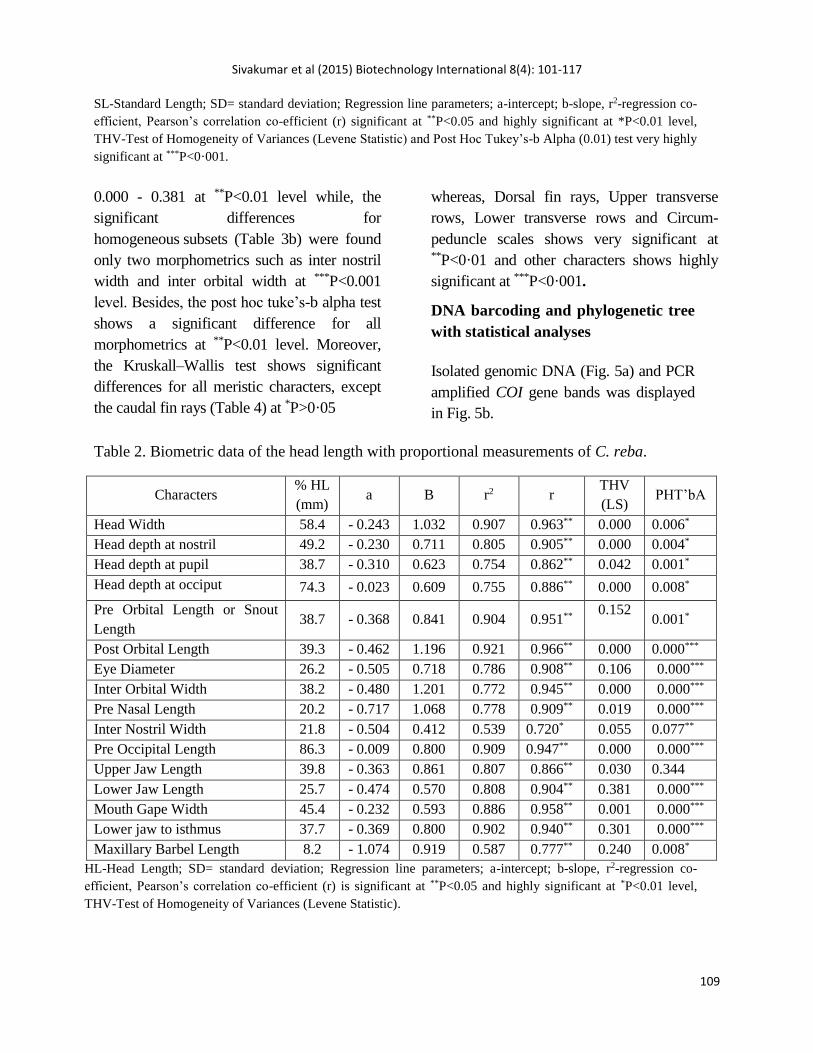
Consequently, the post hoc tuke’s-b
alpha test shows significant differences for all
morphometrics at **P<0.01 level. In addition,
statistical analyses as proportions of HL were
represented in Table 2. As a result, the r2
ranging from (r2 - 0.539-0.921) inter nostril
width to post orbital length while, the r = (r -
0.720*- 0.966**) at *P<0.05 and **P<0.01 level
significant. Similarly above, the significant
homogeneity of variances ranged between
Table 1. Biometric data of the standard length
with proportional measurements of C. reba.
Characters
Holotyp
e (mm)
% SL
(mm) A b r2 R
THV
(LS) PHT’bA
Standard Length 53-113 91.2 - 0.084 1.047 0.994 0.997** 0.000 0·000***
Snout to urocentrum 48-104 93.1 - 0.056 1.019 0.989 0.991** 0.912 0.000***
Head Length 12-25 22.8 - 0.676 1.038 0.967 0.987** 0.990 0.000***
Head Width 06-16 13.4 - 0.968 1.101 0.926 0.962** 0.000 0.002*
Head Width at Nostril 06-12 11.3 - 0.743 0.774 0.856 0.916** 0.000 0.000***
Head Width at Pupil 05-10 8.86 - 0.761 0.680 0.806 0.868** 0.641 0.000***
Head Depth at Occiput 09-18 16.9 - 0.476 0.677 0.838 0.914** 0.000 0.000***
Occiput to Dorsal Origin 13-22 22.5 - 0.275 0.591 0.947 0.974** 0.000 0.001*
Occiput to Pectoral Origin 08-14 13.8 - 0.463 0.566 0.855 0.911** 0.000 0.005*
Occiput to Ventral Origin 17-27 27.2 - 0.140 0.533 0.923 0.951** 0.000 0·176
Pre Orbital Length (or) Snout Length 05-10 8.87 - 0.977 0.918 0.967 0.975** 0.806 0·000***
Post Orbital Length 04-11 8.98 - 1.304 1.278 0.944 0.966** 0.000 0·001*
Eye Diameter 03-06 5.99 - 1.034 0.793 0.861 0.943** 0.595 0·000***
Inter Orbital Width 03-10 8.73 - 1.269 1.219 0.714 0.930** 0.838 0·000***
Pre Nasal Length 02-05 4.61 - 1.515 1.193 0.871 0.948** 0.677 0·000***
Inter Nostril Width 03-05 4.99 - 0.820 0.469 0.628 0.761* 0.025 0·040**
Pre Occipital Length 12-22 19.7 - 0.555 0.836 0.889 0.929** 0.000 0·089**
Upper Jaw Length 05-10 9.11 - 0.896 0.838 0.686 0.798** 0.275 0·000***
Lower Jaw Length 04-06 5.86 - 0.876 0.609 0.829 0.908** 0.501 0·000***
Mouth Gap Width 06-10 10.4 - 0.488 0.488 0.998 0.963** 0.474 0·000***
Lower Jaw to Isthmus 05-10 8.61 - 0.915 0.835 0.880 0.926** 0.201 0·004*
Maxillary Barbel Length
01-02 1.87 - 1.782 1.051 0.689 0.832** 0.237 0·003*
Maximum Body Depth 17-35 30.6 - 0.531 1.017 0.950 0.979** 0.000 0·052**
Dorsal Fin Height 14-26 25.1 - 0.320 0.690 0.658 0.861** 0.000 0·037**
Pectoral Fin Height 12-21 20.2 - 0.494 0.781 0.945 0.982** 0.000 0·003*
Ventral Fin Height 11-20 18.9 - 0.597 0.863 0.894 0.960** 0.095 0·001*
Anal Fin Height 11-19 18.4 - 0.537 0.781 0.908 0.965** 0.095 0·001*
Pre-Dorsal Distance 23-47 41.1 - 0.332 0.940 0.942 0.975** 0.000 0·073
Post Dorsal Distance 28-49 46.7 - 0.027 0.668 0.955 0.977** 0.000 0·241
Pre Pectoral Distance 13-24 22.7 - 0.425 0.760 0.894 0.964** 0.000 0·029
Pre Ventral Distance 29-53 48.8 - 0.205 0.883 0.967 0.987** 0.000 0·036
Pre Anal Distance 40-82 74.9 - 0.130 1.005 0.994 0.996** 0.000 0·022
Dorsal Fin Base Length 09-19 15.6 - 0.663 0.842 0.889 0.946** 0.000 0·010
Pectoral Fin Base Length 02-06 4.24 - 1.939 1.605 0.928 0.966** 0.206 0·000***
Ventral Fin Base Length 03-08 6.23 - 1.246 1.044 0.947 0.980** 0.294 0·000***
Anal Fin Base Length 04-09 7.24 - 1.231 1.096 0.915 0.972** 0.205 0·000***
Dorsal Origin to Anal Origin 19-33 31.1 - 0.278 0.749 0.975 0.982** 0.000 0·026
Dorsal Origin to Ventral Origin 12-31 25.5 - 0.831 1.256 0.962 0.979** 0.000 0·176
Pectoral Origin to Ventral Origin 18-30 29.2 - 0.215 0.650 0.895 0.958** 0.000 0·007*
Ventral Origin to Anal Origin 18-32 29.7 - 0.414 0.876 0.964 0.985** 0.000 0·007*
Caudal Peduncle Length 15-26 26.5 - 0.096 0.471 0.804 0.903** 0.014 0·000***
Caudal Peduncle Width 05-19 11.1 - 1.056 1.110 0.961 0.988** 0.788 0·000***
Caudal Fin Length (both lobe) 16-27 27.9 - 0.072 0.471 0.804 0.907** 0.173 0·000***
Sivakumar et al (2015) Biotechnology International 8(4): 101-117
109
SL-Standard Length; SD= standard deviation; Regression line parameters; a-intercept; b-slope, r2-regression co-
efficient, Pearson’s correlation co-efficient (r) significant at **P<0.05 and highly significant at *P<0.01 level,
THV-Test of Homogeneity of Variances (Levene Statistic) and Post Hoc Tukey’s-b Alpha (0.01) test very highly
significant at ***P<0·001.
0.000 - 0.381 at **P<0.01 level while, the
significant differences for
homogeneous subsets (Table 3b) were found
only two morphometrics such as inter nostril
width and inter orbital width at ***P<0.001
level. Besides, the post hoc tuke’s-b alpha test
shows a significant difference for all
morphometrics at **P<0.01 level. Moreover,
the Kruskall–Wallis test shows significant
differences for all meristic characters, except
the caudal fin rays (Table 4) at *P>0·05
whereas, Dorsal fin rays, Upper transverse
rows, Lower transverse rows and Circum-
peduncle scales shows very significant at **P<0·01 and other characters shows highly
significant at ***P<0·001.
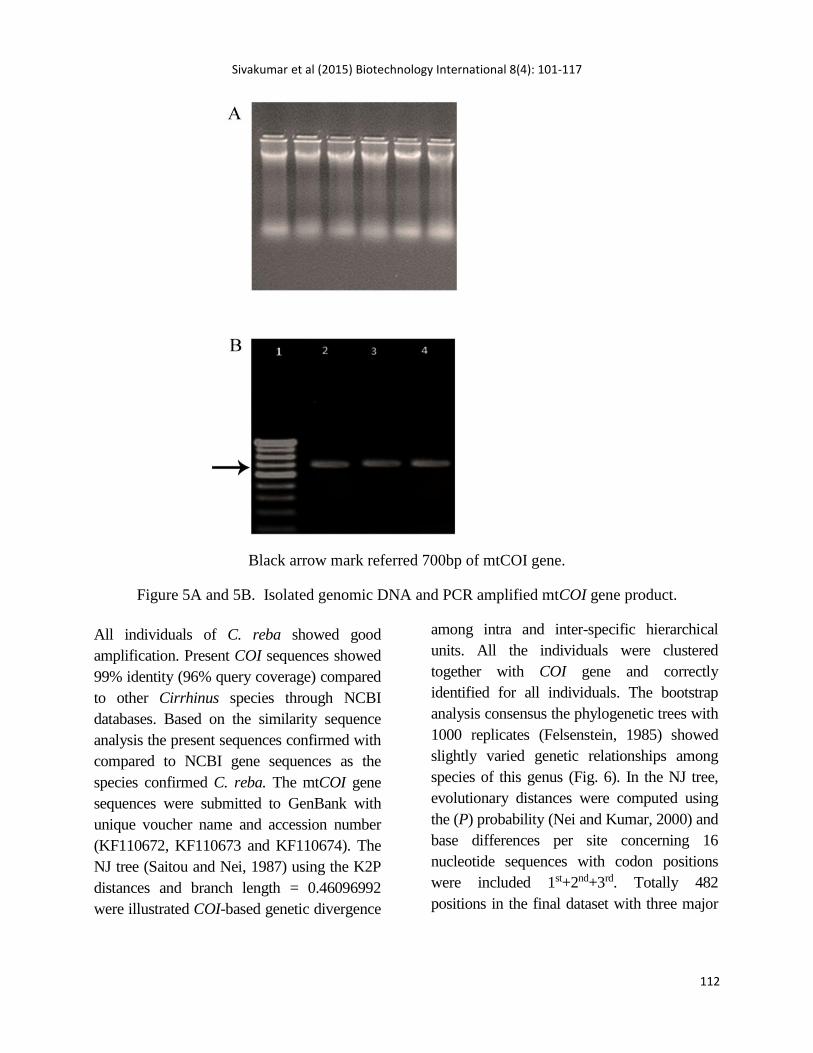
DNA barcoding and phylogenetic tree
with statistical analyses
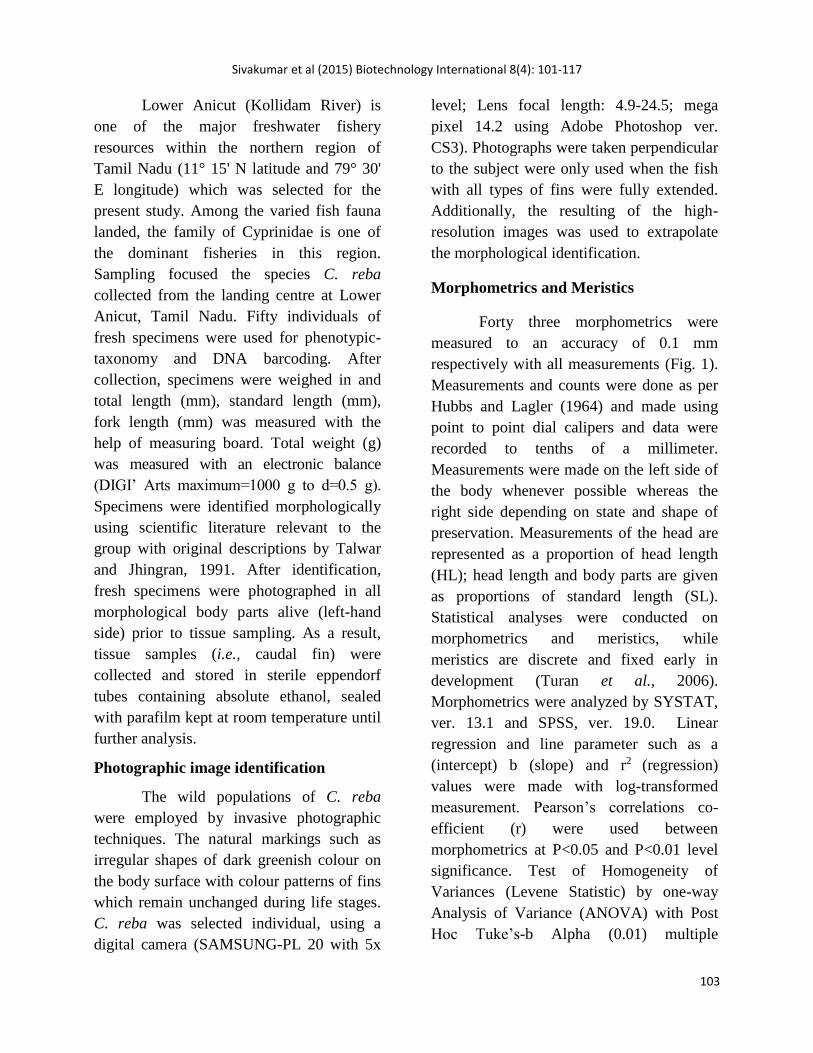
Isolated genomic DNA (Fig. 5a) and PCR
amplified COI gene bands was displayed
in Fig. 5b.
Table 2. Biometric data of the head length with proportional measurements of C. reba.
HL-Head Length; SD= standard deviation; Regression line parameters; a-intercept; b-slope, r2-regression co-
efficient, Pearson’s correlation co-efficient (r) is significant at **P<0.05 and highly significant at *P<0.01 level,
THV-Test of Homogeneity of Variances (Levene Statistic).
Characters % HL
(mm) a B r2 r
THV
(LS) PHT’bA
Head Width 58.4 - 0.243 1.032 0.907 0.963** 0.000 0.006*
Head depth at nostril 49.2 - 0.230 0.711 0.805 0.905** 0.000 0.004*
Head depth at pupil 38.7 - 0.310 0.623 0.754 0.862** 0.042 0.001*
Head depth at occiput 74.3 - 0.023 0.609 0.755 0.886** 0.000 0.008*
Pre Orbital Length or Snout
Length 38.7 - 0.368 0.841 0.904 0.951**
0.152 0.001*
Post Orbital Length 39.3 - 0.462 1.196 0.921 0.966** 0.000 0.000***
Eye Diameter 26.2 - 0.505 0.718 0.786 0.908** 0.106 0.000***
Inter Orbital Width 38.2 - 0.480 1.201 0.772 0.945** 0.000 0.000***
Pre Nasal Length 20.2 - 0.717 1.068 0.778 0.909** 0.019 0.000***
Inter Nostril Width 21.8 - 0.504 0.412 0.539 0.720* 0.055 0.077**
Pre Occipital Length 86.3 - 0.009 0.800 0.909 0.947** 0.000 0.000***
Upper Jaw Length 39.8 - 0.363 0.861 0.807 0.866** 0.030 0.344
Lower Jaw Length 25.7 - 0.474 0.570 0.808 0.904** 0.381 0.000***
Mouth Gape Width 45.4 - 0.232 0.593 0.886 0.958** 0.001 0.000***
Lower jaw to isthmus 37.7 - 0.369 0.800 0.902 0.940** 0.301 0.000***
Maxillary Barbel Length 8.2 - 1.074 0.919 0.587 0.777** 0.240 0.008*
Sivakumar et al (2015) Biotechnology International 8(4): 101-117
110
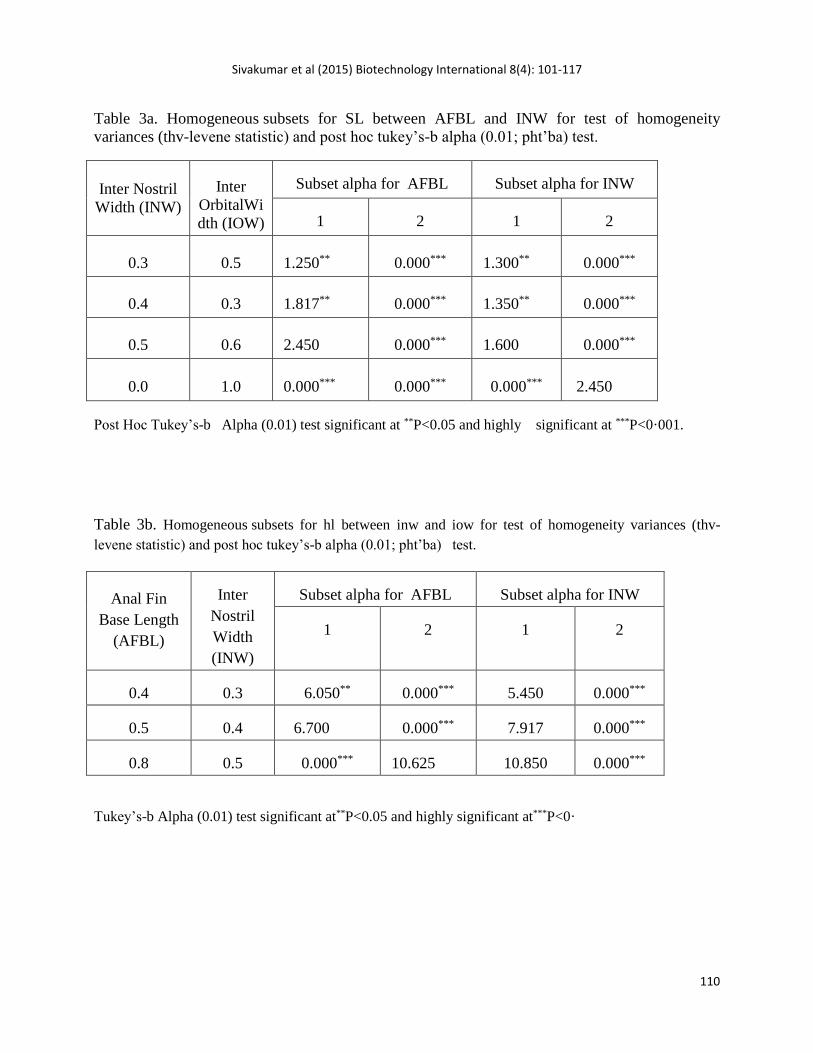
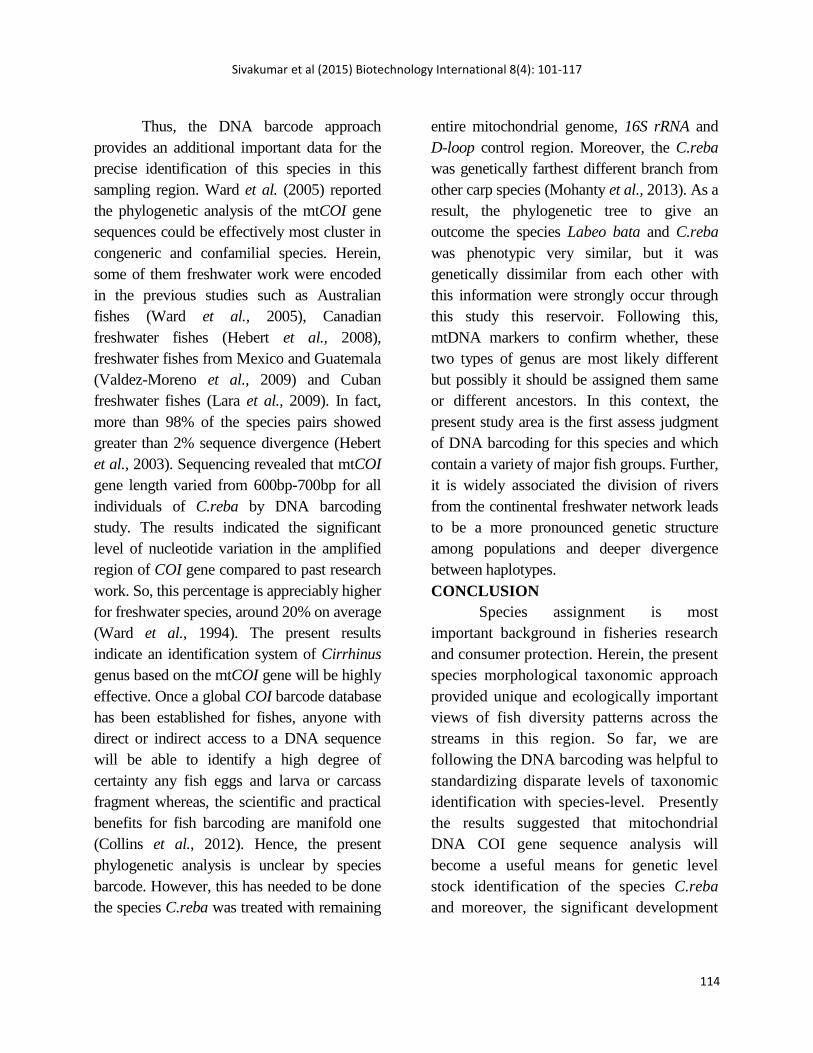
Table 3a. Homogeneous subsets for SL between AFBL and INW for test of homogeneity
variances (thv-levene statistic) and post hoc tukey’s-b alpha (0.01; pht’ba) test.
Post Hoc Tukey’s-b Alpha (0.01) test significant at **P<0.05 and highly significant at ***P<0·001.
Table 3b. Homogeneous subsets for hl between inw and iow for test of homogeneity variances (thv-
levene statistic) and post hoc tukey’s-b alpha (0.01; pht’ba) test.
Tukey’s-b Alpha (0.01) test significant at**P<0.05 and highly significant at***P<0·
Inter Nostril
Width (INW)
Inter
OrbitalWi
dth (IOW)
Subset alpha for AFBL Subset alpha for INW
1 2 1 2
0.3 0.5 1.250** 0.000*** 1.300** 0.000***
0.4 0.3 1.817** 0.000*** 1.350** 0.000***
0.5 0.6 2.450 0.000*** 1.600 0.000***
0.0 1.0 0.000*** 0.000*** 0.000*** 2.450
Anal Fin
Base Length
(AFBL)
Inter
Nostril
Width
(INW)
Subset alpha for AFBL Subset alpha for INW
1 2 1 2
0.4 0.3 6.050** 0.000*** 5.450 0.000***
0.5 0.4 6.700 0.000*** 7.917 0.000***
0.8 0.5 0.000*** 10.625 10.850 0.000***

Sivakumar et al (2015) Biotechnology International 8(4): 101-117
111
Table 4. Kruskal–wallis test for meristic characters of C. reba.
B=Branched, UB=Unbranched, H - Kruskal–Wallis statistical value; *P>0·05 - significant; **P<0.01 -
very significant; ***P<0·001 – highly significant.
Meristic counts Range
H-statistics Probability Minimum Maximum
Branchiostegal Rays 0 5 4.721 P<0·001***
Gill Rakers 56 59 2.633 P<0·001***
Dorsal Fin
Rays
U 2 3 31.013 P<0·01**
B 0 8
Ventral Fin
Rays
U 0 1 28.034 P<0·001***
B 0 8
Pectoral Fin
Rays
U 0 1 11.355 P<0·001***
B 0 15
Anal Fin
Rays
U 0 3 25.942 P<0·001***
B 0 5
Pre Dorsal Scales 12 14 8.458 P<0·001***
Pre Anal Scales 23 25 14.612 P<0·001***
Lateral Line Scales 35 38 19.562 P<0·001***
Upper Transverse Rows 6 8 9.713 P<0·01**
Lower Transverse Rows 5 7 9.311 P<0·01**
Circumpeduncle Scales 17 19 7.215 P<0·01**
Circumference scales 30 32 5.349 P<0·001***
Caudal Fin
Upper Lobe
U 0 3
38.893 P>0·05*
B 0 9
Caudal Fin
Lower Lobe
U 0 3
B 0 8
Sivakumar et al (2015) Biotechnology International 8(4): 101-117
112
Black arrow mark referred 700bp of mtCOI gene.
Figure 5A and 5B. Isolated genomic DNA and PCR amplified mtCOI gene product.
All individuals of C. reba showed good
amplification. Present COI sequences showed
99% identity (96% query coverage) compared
to other Cirrhinus species through NCBI
databases. Based on the similarity sequence
analysis the present sequences confirmed with
compared to NCBI gene sequences as the
species confirmed C. reba. The mtCOI gene
sequences were submitted to GenBank with
unique voucher name and accession number
(KF110672, KF110673 and KF110674). The
NJ tree (Saitou and Nei, 1987) using the K2P
distances and branch length = 0.46096992
were illustrated COI-based genetic divergence
among intra and inter-specific hierarchical
units. All the individuals were clustered
together with COI gene and correctly
identified for all individuals. The bootstrap
analysis consensus the phylogenetic trees with
1000 replicates (Felsenstein, 1985) showed
slightly varied genetic relationships among
species of this genus (Fig. 6). In the NJ tree,
evolutionary distances were computed using
the (P) probability (Nei and Kumar, 2000) and
base differences per site concerning 16
nucleotide sequences with codon positions
were included 1st+2nd+3rd. Totally 482
positions in the final dataset with three major
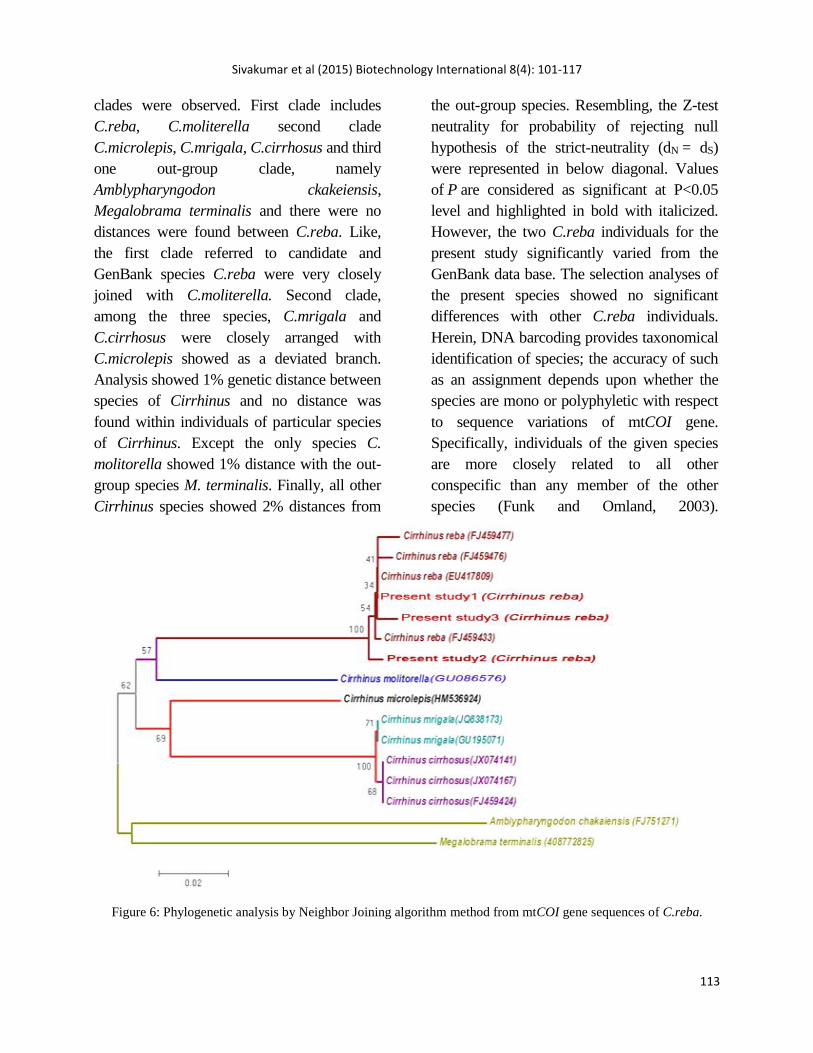
Sivakumar et al (2015) Biotechnology International 8(4): 101-117
113
clades were observed. First clade includes
C.reba, C.moliterella second clade
C.microlepis, C.mrigala, C.cirrhosus and third
one out-group clade, namely
Amblypharyngodon ckakeiensis,
Megalobrama terminalis and there were no
distances were found between C.reba. Like,
the first clade referred to candidate and
GenBank species C.reba were very closely
joined with C.moliterella. Second clade,
among the three species, C.mrigala and
C.cirrhosus were closely arranged with
C.microlepis showed as a deviated branch.
Analysis showed 1% genetic distance between
species of Cirrhinus and no distance was
found within individuals of particular species
of Cirrhinus. Except the only species C.
molitorella showed 1% distance with the out-
group species M. terminalis. Finally, all other
Cirrhinus species showed 2% distances from
the out-group species. Resembling, the Z-test
neutrality for probability of rejecting null
hypothesis of the strict-neutrality (dN = dS)
were represented in below diagonal. Values
of P are considered as significant at P<0.05
level and highlighted in bold with italicized.
However, the two C.reba individuals for the
present study significantly varied from the
GenBank data base. The selection analyses of
the present species showed no significant
differences with other C.reba individuals.
Herein, DNA barcoding provides taxonomical
identification of species; the accuracy of such
as an assignment depends upon whether the
species are mono or polyphyletic with respect
to sequence variations of mtCOI gene.
Specifically, individuals of the given species
are more closely related to all other
conspecific than any member of the other
species (Funk and Omland, 2003).
Figure 6: Phylogenetic analysis by Neighbor Joining algorithm method from mtCOI gene sequences of C.reba.
Sivakumar et al (2015) Biotechnology International 8(4): 101-117
114
Thus, the DNA barcode approach
provides an additional important data for the
precise identification of this species in this
sampling region. Ward et al. (2005) reported
the phylogenetic analysis of the mtCOI gene
sequences could be effectively most cluster in
congeneric and confamilial species. Herein,
some of them freshwater work were encoded
in the previous studies such as Australian
fishes (Ward et al., 2005), Canadian
freshwater fishes (Hebert et al., 2008),
freshwater fishes from Mexico and Guatemala
(Valdez-Moreno et al., 2009) and Cuban
freshwater fishes (Lara et al., 2009). In fact,
more than 98% of the species pairs showed
greater than 2% sequence divergence (Hebert
et al., 2003). Sequencing revealed that mtCOI
gene length varied from 600bp-700bp for all
individuals of C.reba by DNA barcoding
study. The results indicated the significant
level of nucleotide variation in the amplified
region of COI gene compared to past research
work. So, this percentage is appreciably higher
for freshwater species, around 20% on average
(Ward et al., 1994). The present results
indicate an identification system of Cirrhinus
genus based on the mtCOI gene will be highly
effective. Once a global COI barcode database
has been established for fishes, anyone with
direct or indirect access to a DNA sequence
will be able to identify a high degree of
certainty any fish eggs and larva or carcass
fragment whereas, the scientific and practical
benefits for fish barcoding are manifold one
(Collins et al., 2012). Hence, the present
phylogenetic analysis is unclear by species
barcode. However, this has needed to be done
the species C.reba was treated with remaining
entire mitochondrial genome, 16S rRNA and
D-loop control region. Moreover, the C.reba
was genetically farthest different branch from
other carp species (Mohanty et al., 2013). As a
result, the phylogenetic tree to give an
outcome the species Labeo bata and C.reba
was phenotypic very similar, but it was
genetically dissimilar from each other with
this information were strongly occur through
this study this reservoir. Following this,
mtDNA markers to confirm whether, these
two types of genus are most likely different
but possibly it should be assigned them same
or different ancestors. In this context, the
present study area is the first assess judgment
of DNA barcoding for this species and which
contain a variety of major fish groups. Further,
it is widely associated the division of rivers
from the continental freshwater network leads
to be a more pronounced genetic structure
among populations and deeper divergence
between haplotypes.
CONCLUSION
Species assignment is most
important background in fisheries research
and consumer protection. Herein, the present
species morphological taxonomic approach
provided unique and ecologically important
views of fish diversity patterns across the
streams in this region. So far, we are
following the DNA barcoding was helpful to
standardizing disparate levels of taxonomic
identification with species-level. Presently
the results suggested that mitochondrial
DNA COI gene sequence analysis will
become a useful means for genetic level
stock identification of the species C.reba
and moreover, the significant development
Sivakumar et al (2015) Biotechnology International 8(4): 101-117
115
of streams in this region. So far, we are
following the DNA barcoding was helpful to
standardizing disparate levels of taxonomic
identification with species-level. Presently
the results suggested that mitochondrial
DNA COI gene sequence analysis will
become a useful means for genetic level
stock identification of the species C.reba.
Moreover, the significant development of
our knowledge concerning about systematic
of the freshwater fishes in this region and
also facilitate to monitoring changes in the
geographic distribution that will almost
certainly occur in the future.
ACKNOWLEDGEMENT
We would like to express our
sincere thanks to Dr. S. Ajmal Khan,
Emeritus Professor, Centre for Advanced
Studies in Marine Biology, Annamalai
University, Parangipettai, Tamil Nadu.
We are very grateful to Dr. V.
Ramaiyan, Former Director of CAS in
Marine Biology, Annamalai University,
for helping to improve this paper with
extensive scientific suggestions. Dr. R.
Mathialagan express his thanks to UGC
– RGNF, New Delhi – 110 058, for
providing the financial assistance to the
present work.
REFERENCES
Ayyappan, S., and Jena, J. K. (2001).
Sustainable Freshwater
Aquaculture in India. Sustainable
Indian Fisheries, Pandian, T. J.
(ed.) pp. 88-133.
Begg, G. A. and Waldman, J. R. (1999).
A holistic approach to fish stock
identification, Fish. Res., 43: 35-
44.
Bhattacharjee, J., M. Bishal Dhar Ghosh,
A. B., Laskar and Sankar, K.
(2012). Identification and Re-
Evaluation of Freshwater
Catfishes through DNA
Barcoding, Plos One, 7: 1-7.
Collins, R. A., K. F. Armstrong, R. Meier,
Y. Yi, S. D. J. Brown, R. H.
Cruickshank, S. Keeling and
Johnston, C. (2012). Barcoding and
Border Biosecurity: Identifying
Cyprinid Fishes in the Aquarium
Trade, Plos One, 7: e28381.
Felsenstein, J (1985). Confidence limits
on phylogenies: an approach using
the bootstrap, Evolution, 39: 783–
791.
Funk, D. J. and Omland, K. E. (2003).
Species-level paraphyly and
polyphyly: frequency, causes and
consequences, with insights from
animal mitochondrial DNA,
Annual Review of Ecology,
Evolution and Systematics, 34:
397–423.
Gupta, S. (1975). Some observations on
the biology of Cirrhinus reba
(Cuvier), J. Fish Biol., 7: 71-76.
Hebert, P. D. N., A. Cywinska, S. L. Ball
and De Waard, J. R. (2003).
Biological identifications through
DNA barcodes, Proc. Royal Soc.
B: Biol. Sci., 270: 313-321.
Sivakumar et al (2015) Biotechnology International 8(4): 101-117
116
Hebert, N., R. Hanner, E. Holm, N.E.
Mandrak, E. Taylor, M. Burridge,
D. Watkinson, P. Dumont, A.
Curry, P. Bentzen, J. Zhang, J.
April and Bernatchez, L. (2008).
Identifying Canadian freshwater
fishes through DNA barcodes,
PloS One, 3: 1–8. e2490.
Hoaglin, D. C., F. Mosteller and Tukey, J.
(1991). Fundamentals of
Exploratory Analysis of Variance,
New York, NY: John Wiley &
Sons.
Hubbs, C. L. and K. F. Lagler (1964).
Fishes of the Great lakes region.
University of Michigan Press,
Ann. Arbor. 213pp.
IUCN. (2011), IUCN Red List of
Threatened Species. Ver. 2011.2.
www.iucnredlist.org
Kimura, (1980). A simple method for
estimating evolutionary rate of
base substitutions through
comparative studies of nucleotide
sequences, Journal of Molecular
Evolution, 15: 111–120.
Kumar, S. D. Peterson, N. Peterson,
Stecher, G., M. Nei and Tamura,
K. (2011). MEGA.5: Molecular
Evolutionary Genetics Analysis
using Maximum Likelihood,
Evolutionary Distance and
Maximum Parsimony Methods,
Molecular Biology and Evolution.
Lakra W. S. M. S. Verma, M. Goswami,
K. K. Lal, V. Mohindra, P. Punia,
A. Gopalakrishnan, K. V. Singh,
R. D. Ward and P. Hebert (2011).
DNA barcoding Indian marine
fishes, Molecular Ecology
Resources. 11: 60–71.
Lara, A., J. L. Ponce De Leon, R.
Rodriguez, D. Casane, G., Cote,
L. Bernatchez and García-
Machado, E. (2009). DNA
barcoding of Cuban freshwater
fishes: evidence for cryptic
species and taxonomic conflicts,
Molecular Ecology Resources. 10:
421–430.
Mathialagan, R. (2013). Studies on the
Molecular taxonomy and Biology
of Reba carp Cirrhinus reba
(Hamilton, 1822) from lower
Anicut, Tamil Nadu, India. Ph.D.
Thesis, Bharathidasan University,
Tiruchirappallai, 254 pp.
Mohanty, M., P. Jayasankar, L. Sahoo and
Das, P. (2013). A comparative
study of COI and 16S rRNA
genes for DNA barcoding of
cultivable carps in India.
Mitochondrial DNA, Early
Online: 1–9.
Murta A. G. (2000). Morphological
variation of horse mackerel
(Trachurus trachurus) in the
Iberian and North African
Atlantic: implications for stock
identification, ICES J. Mar. Sci.,
57: 1240-1248.
Nei, M. and Kumar, S. (2000). Molecular
evolution and phylogenetics. New
York: Oxford University Press.
333p.
Saitou, N. and Nei, M. (1987). The
Neighbour-Joining method: a new
method for reconstructing
Sivakumar et al (2015) Biotechnology International 8(4): 101-117
117
evolutionary trees, Mol. Biol.
Evol. 4: 406–425.
Sambrook, J., E. F. Fritsch and Maniatis,
T. (1989). Molecular Cloning: A
Laboratory Manual, Cold Springs
Harbor Laboratory Press, Cold
Springs Harbor, NY, USA.
Talwar, P. K and Jhingran, A. G. (1991).
Inland fishes of India and adjacent
countries. Oxford-IBH Publishing
Co. Pvt. Ltd., New Delhi. Vol.1.
A.A. Balkema, Rotterdam. 541p.
Turan, C. M., B. Oral, E. Ozturk and
Duzgunes (2006). Morphometric
and meristic variation between
stocks of bluefish (Pomatomus
saltatrix) in the Black, Marmara,
Aegean and northeastern
Mediterranean Seas, Fish. Res.
79: 139-147.
Valdez-Moreno M. Ivanova N.V. Elias-
Gutierrez M. Contreras-Balderas
S. and Hebert, P. D. N., (2009).
Probing diversity in freshwater
fishes from Mexico and
Guatemala with DNA barcodes,
Journal of Fish Biology. 74: 377–
402.
Ward, R. D. and Grewe, P. M. (1994).
Appraisal of molecular genetic
techniques in fisheries, Reviews
in Fish Biology and Fisheries. 4:
300-325.
Ward, R. D., T. S. Zemlak, B. H. Innes, P.
R. Last., and Hebert, P. D. N.
(2005). DNA barcoding
Australia’s fish species, Philos.
Trans. R. Soc. Lond. B Biol. Sci.
360: 1847–57.
Ward, R. D., R. Hanner and P. D. N.
Hebert, 2009. The campaign to
DNA barcode all fishes, FISH
BOL. J. Fish Biol., 74: 329- 356.