Biotech crops –Challenges and Consequences for the seed ...€¦ · Biotech crops –Challenges...
37
Biotech crops – Challenges and Consequences for the seed industry Marcel Bruins International Seed Federation 8 th EESNET Meeting 16-18 Nov. 2008, Siofok, Hungary
Transcript of Biotech crops –Challenges and Consequences for the seed ...€¦ · Biotech crops –Challenges...

Biotech crops – Challenges and Consequences for the seed industry
Marcel BruinsInternational Seed Federation
8th EESNET Meeting 16-18 Nov. 2008, Siofok, Hungary
Outline
� ISF
� Seed Industry at a snapshot
� History & basic facts
� Challenges and consequences
� Summary
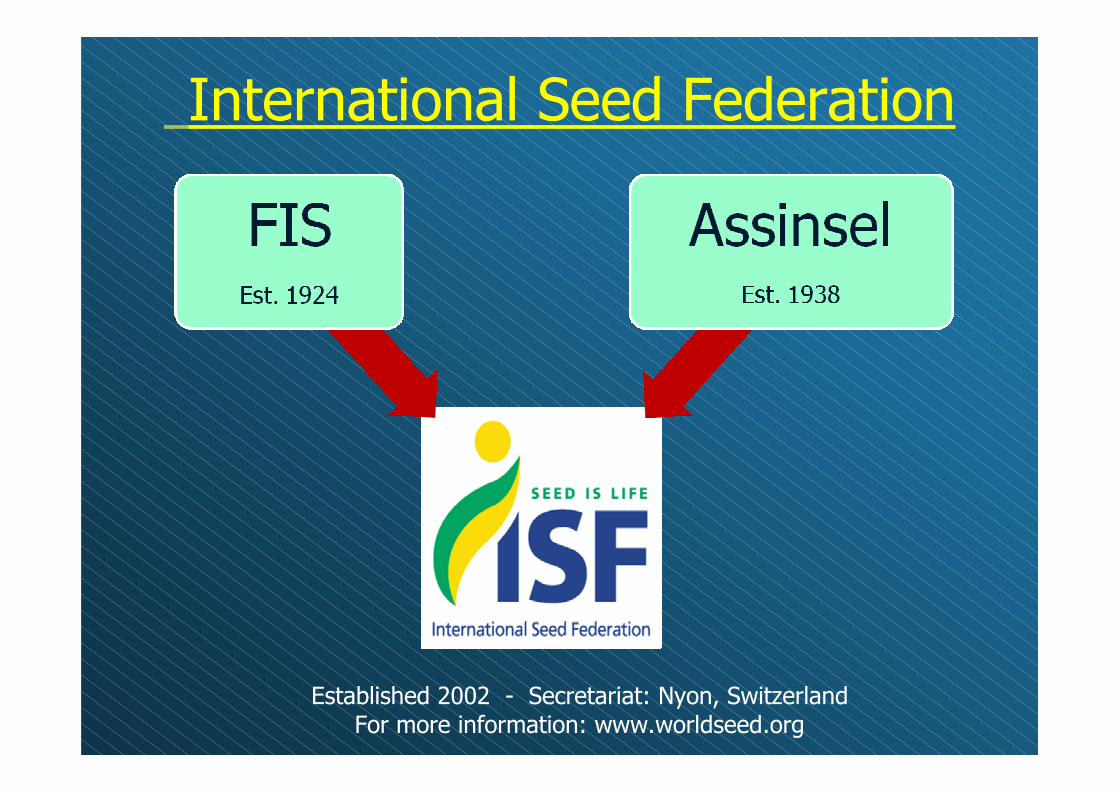
International Seed Federation
Established 2002 - Secretariat: Nyon, SwitzerlandFor more information: www.worldseed.org
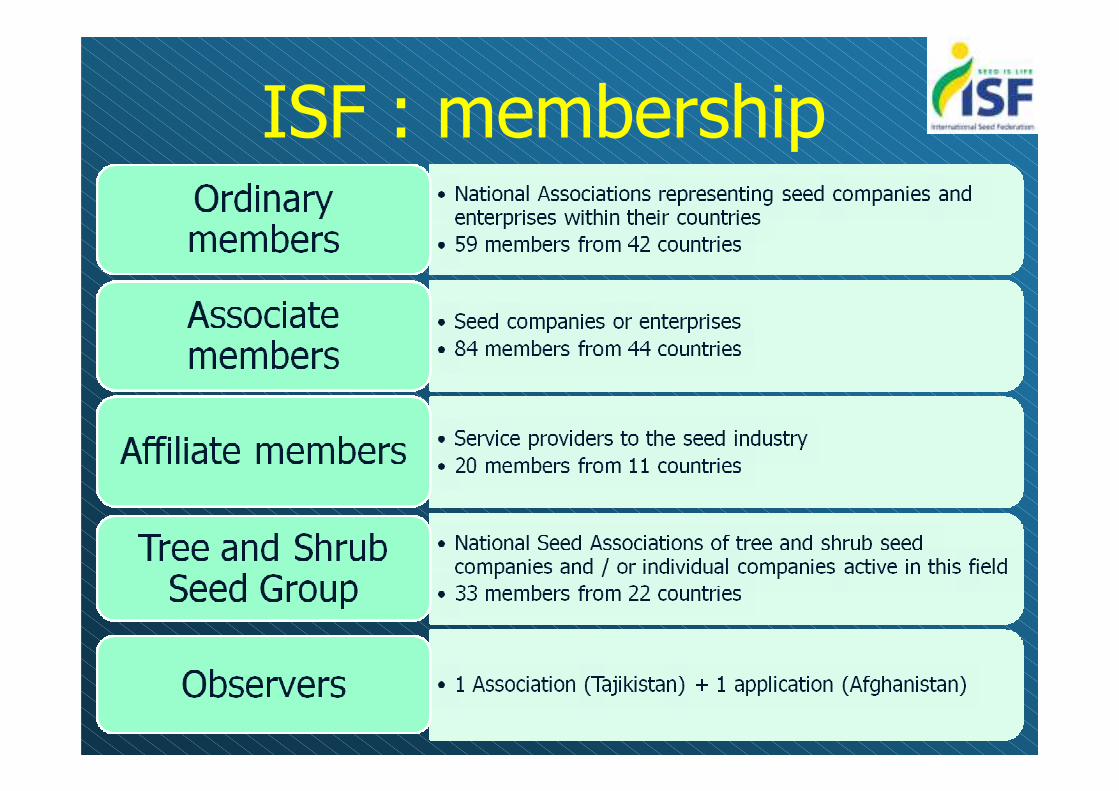
ISF : membership

International Seed Federation- membership countries -
2007WW Seed market: 36,5 billion USD
Farm Saved Seed: 15 billion USD
Internationally Traded: 6.4 billion USD
197 members from 73 countries 96% of international seed trade
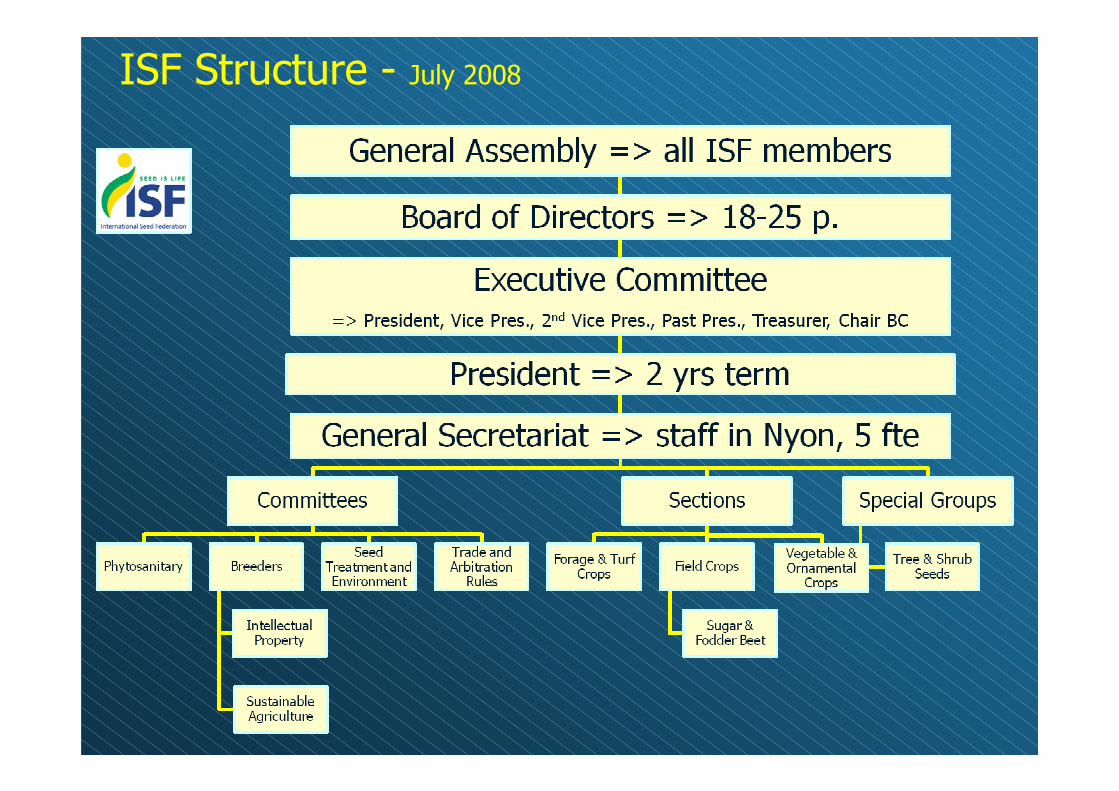
ISF Structure - July 2008

ISF’s Mission
� Facilitate the international movement of seed, related know-how and technology
Trade
Rules
Arbitrat
ion Rule
s
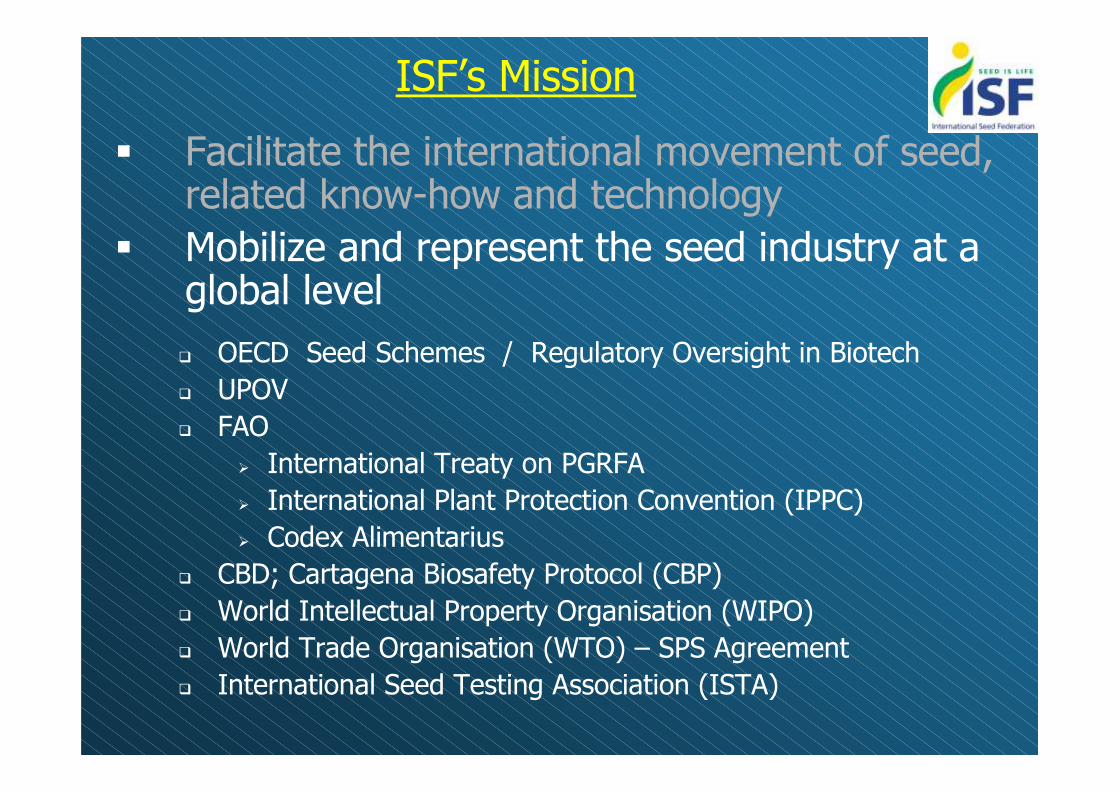
ISF’s Mission
� Facilitate the international movement of seed, related know-how and technology
� Mobilize and represent the seed industry at a global level
� OECD Seed Schemes / Regulatory Oversight in Biotech
� UPOV
� FAO
� International Treaty on PGRFA
� International Plant Protection Convention (IPPC)
� Codex Alimentarius
� CBD; Cartagena Biosafety Protocol (CBP)
� World Intellectual Property Organisation (WIPO)
� World Trade Organisation (WTO) – SPS Agreement
� International Seed Testing Association (ISTA)

ISF’s Mission
� Facilitate the international movement of seed, related know-how and technology
� Mobilize and represent the seed industry at a global level
� Inform its members of developments within the industry and in the international regulatory environment
� Promote, on behalf of its members, the interests and image of the seed industry
ISF Activities => quarterly Newsletter ISF Info

ISF Activities
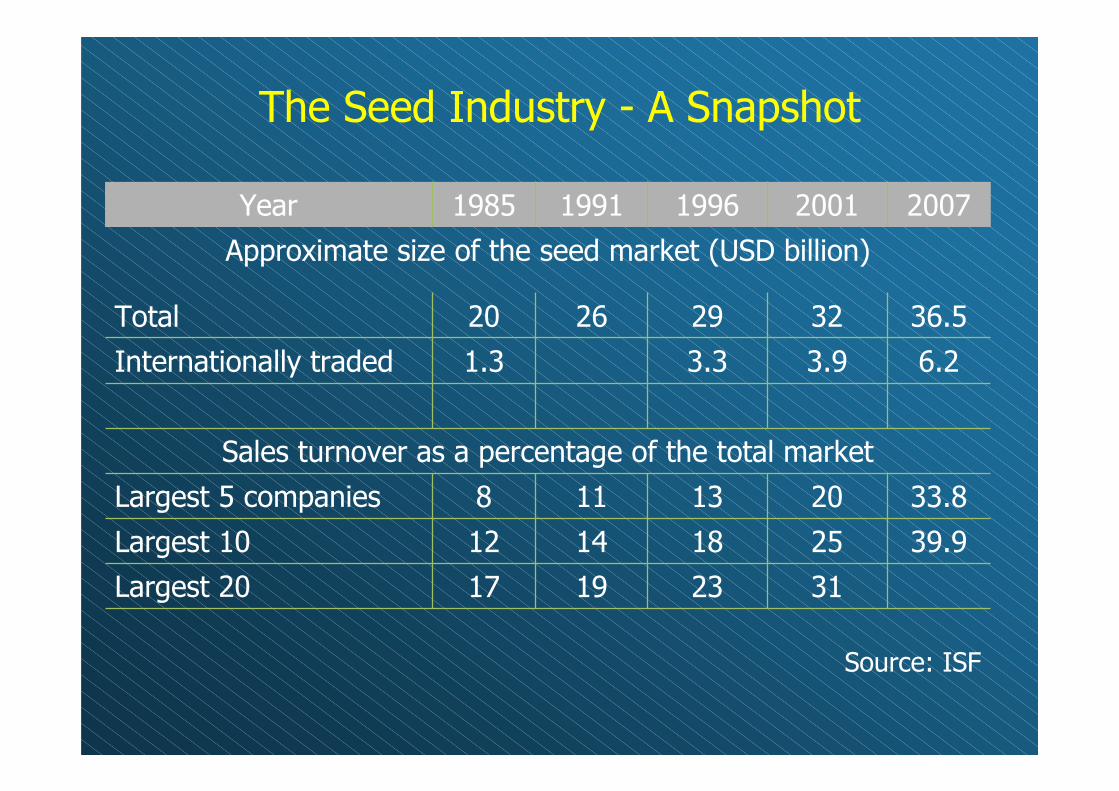
The Seed Industry - A Snapshot
Year 1985 1991 1996 2001 2007
Approximate size of the seed market (USD billion)
Total 20 26 29 32 36.5
Internationally traded 1.3 3.3 3.9 6.2
Sales turnover as a percentage of the total market
Largest 5 companies 8 11 13 20 33.8
Largest 10 12 14 18 25 39.9
Largest 20 17 19 23 31
Source: ISF

Evolution of seed companiesCompany turnover in million USD
19851985 19961996 20062006 20072007
PioneerPioneer 735735 PioneerPioneer 15001500 MonsantoMonsanto 40284028 MonsantoMonsanto 49644964
SandozSandoz 290290 NovartisNovartis 900900 DuPont PioneerDuPont Pioneer 27812781 DuPont PioneerDuPont Pioneer 33503350
DekalbDekalb 201201 LimagrainLimagrain 650650 SyngentaSyngenta 17431743 SyngentaSyngenta 20182018
UpjohnUpjohn--AsgrowAsgrow 200200 AdvantaAdvanta 460460 LimagrainLimagrain 12751275 LimagrainLimagrain 13141314
LimagrainLimagrain 180180 SeminisSeminis 375375 KWS Saat AGKWS Saat AG 615615 Land OLand O’’LakesLakes 10001000
Shell NickersonShell Nickerson 175175 TakiiTakii 320320 Land OLand O’’LakesLakes 550550 KWSKWS 753753
TakiiTakii 175175 SakataSakata 300300 Bayer CropScienceBayer CropScience 465465 Bayer CropScienceBayer CropScience 535535
Ciba GeigyCiba Geigy 152152 KWSKWS 255255 SakataSakata 410410 DLF TrifoliumDLF Trifolium 420420
VanderHaveVanderHave 150150 CargillCargill 250250 DLF TrifoliumDLF Trifolium 365365 TakiiTakii 394394
CACBACACBA 130130 DekalbDekalb 250250 TakiiTakii 342342 SakataSakata 384384
SakataSakata 120120 Pau EuralisPau Euralis 175175 Dow MycoggenDow Mycoggen 302302 Dow MycogenDow Mycogen 350350
CargillCargill 115115 MonsantoMonsanto 170170 BarenbrugBarenbrug 197197 DesprezDesprez 225225
OrsanOrsan 115115 SigmaSigma 160160 Saaten UnionSaaten Union 187187 Rijk ZwaanRijk Zwaan 210210
LubrizolLubrizol 110110 S. UnionS. Union 155155 DesprezDesprez 186186 BarenbrugBarenbrug 205205
VolvoVolvo 9797 RAGTRAGT 140140 RAGTRAGT 149149 Saaten UnionSaaten Union 196196
ICTICT 9090 S. WeibullS. Weibull 140140 SvalSvalööf Weibullf Weibull 137137 RAGTRAGT 182182
Royal SluisRoyal Sluis 8080 CebecoCebeco 140140 InVivoInVivo 116116 Enza Zaaden Enza Zaaden (estim.)(estim.) 182182
CebecoCebeco 8080 DLFDLF 135135 De RuiterDe Ruiter 151151
KWSKWS 7575 BarenbrugBarenbrug 133133 InVivoInVivo 140140

Domestic Seed Market 2007 (USD million)
Total Total
USA 8,500 Australia 400
China 4,000 Korea 400
France 2,150 UK 400
Brazil 2,000 Mexico 350
India 1,500 Poland 350
Japan 1,500 Turkey 350
Germany 1,500 Taiwan 300
Italy 1,000 South Africa 300
Argentina 950 Hungary 300
Canada 550 Netherlands 300
Russian Federation 500 Czech Republic 300
Spain 450 Total 32,002*
*The commercial world seed market is assessed at approximately US$ 36.5 billion

Significant increase global seed market
• Development of hybrids
• Heterosis, Uniformity, Built in protection,
• Increase of seed treatment
• Doubled in last 10 years, now at 1.6 billion USD
• Development of transgenic varieties
• 114 million ha., 12 million farmers, 6.9 billion USD

Seed Exports in 2007 (USD million)
Agric. Vegetables Total Agric. Vegetables Total
Netherlands 186 854 1040 China 41 47 88
USA 650 369 1019 Australia 66 13 79
France 698 216 914 United Kingdom 44 28 72
Germany 442 41 483 Israel 9 62 71
Canada 265 82 347 Brazil 45 8 53
Denmark 281 44 325 Poland 46 2 48
Chile 124 80 204 South Africa 40 8 48
Hungary 186 10 196 New Zealand 27 17 44
Italy 114 70 184 Czech Republic 38 4 42
Mexico 162 9 171 Turkey 29 8 37
Belgium 139 3 142 Romania 31 0 31
Argentina 97 21 118 Sweden 24 5 29
Austria 102 3 105 Slovakia 29 0 29
Japan 30 71 101 Thailand 18 36 54
Spain 54 35 89 Total 4171 2227 6398

Seed Imports in 2007 (USD million)
Agric. Vegetables Total Agric. Vegetables Total
USA 461 211 672 Hungary 92 17 109
France 331 91 422 Austria 76 15 91
Mexico 258 156 414 Greece 65 21 86
Netherlands 182 199 381 Romania 64 11 75
Germany 304 64 368 South Africa 9 66 75
Italy 197 130 327 Turkey 31 42 73
Spain 121 171 292 Denmark 52 14 66
Canada 181 56 237 Brazil 39 19 58
Ukraine 204 31 235 Saudi Arabia 44 14 58
UK 133 65 198 Switzerland 44 13 57
Russia 157 33 190 Czech Republic 51 5 56
Belgium 125 27 152 Argentina 42 10 52
Japan 79 62 141 Portugal 30 21 51
Poland 98 41 139 Bulgaria 44 6 50
China 63 53 116 Total 4175 2063 6238

Growing international seed trade
• Cheap & fast transportation
• Development of hybrid varieties
• Higher speed of breeding & commercial processes
=> counter season production

1983 First demonstration of transfer and stableexpression of a “foreign” gene in a plant (tobacco – petunia)
1985 First transfer of a gene coding for an agronomic trait (herb. tol. in tobacco)
1988 First transgenic plant with a “quality” trait (delayed ripening in tomato)
1994 ‘Flavr Savr’- tomato introduced
1995 Bt corn introduced, 1.5 m ha of GM crops
1996 RR soybeans introduced
2007 114 m ha. grown with GM crops
Biotech crops – a Time Line -
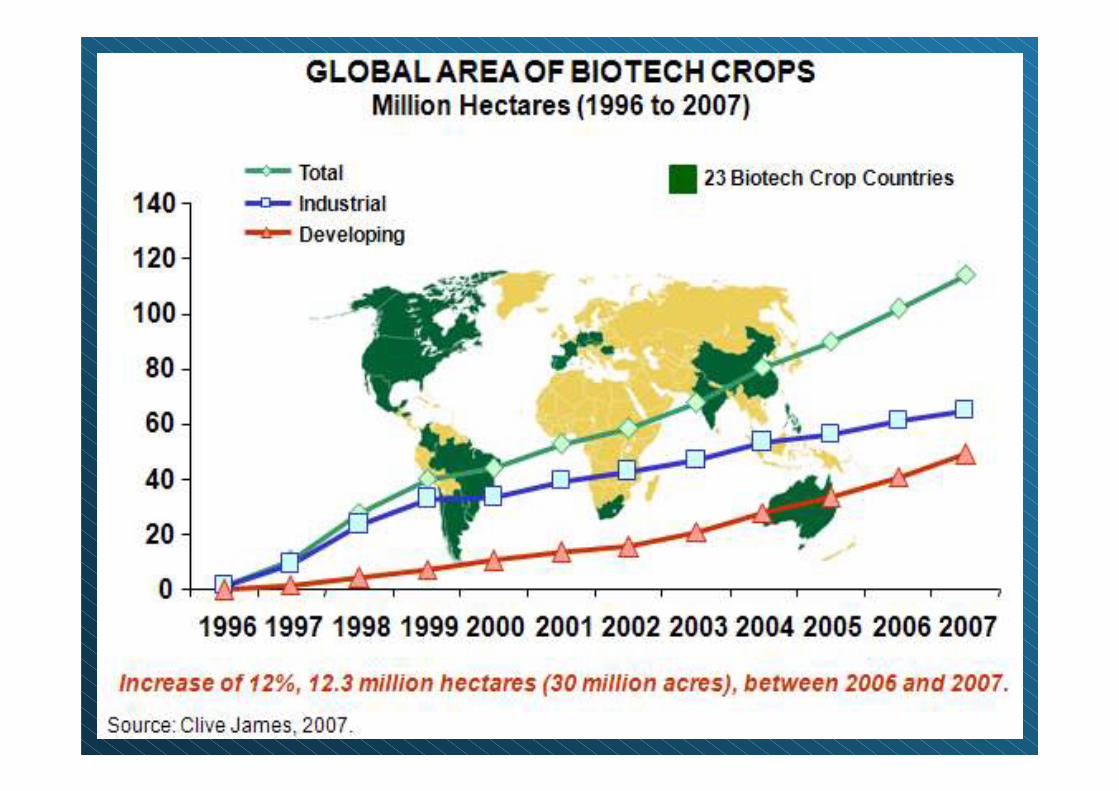
Source: C. James, 2007


• 12 million farmers growing biotech crops
=>11 million are resource poor farmers
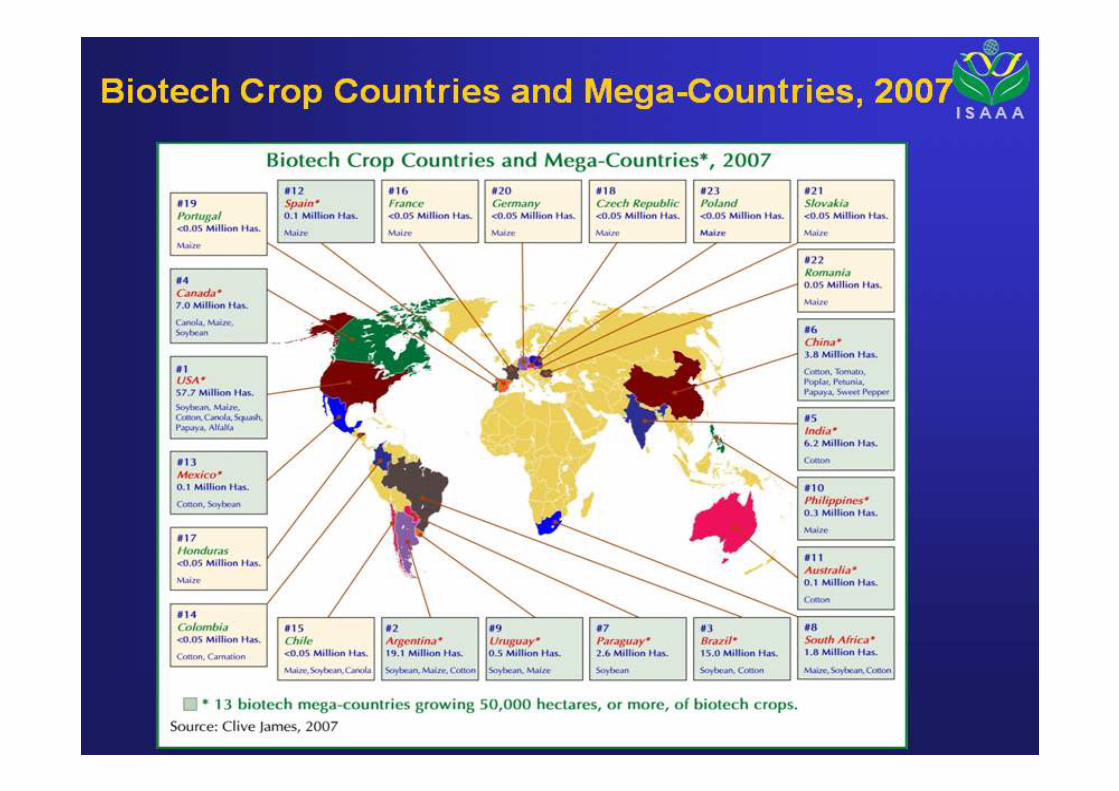
• 12 developing countries and 11 developed
countries growing biotech crops
• Bt cotton yields: up 50% CN, up 10% IN
• Reduced insecticide use : >50% (CN & IN)
• Increased income/ha: 250$ (IN); 220$ (CN)
Facts on biotech crops

Challenges and consequences
� New traits
� Create added value
� Traits create additional revenue to invest in genetics
� Traits and technologies will continue to help unlock additional genetic value
� Concentration of the seed industry
� Higher regulatory burden
� Adventitious Presence
� Financial burden
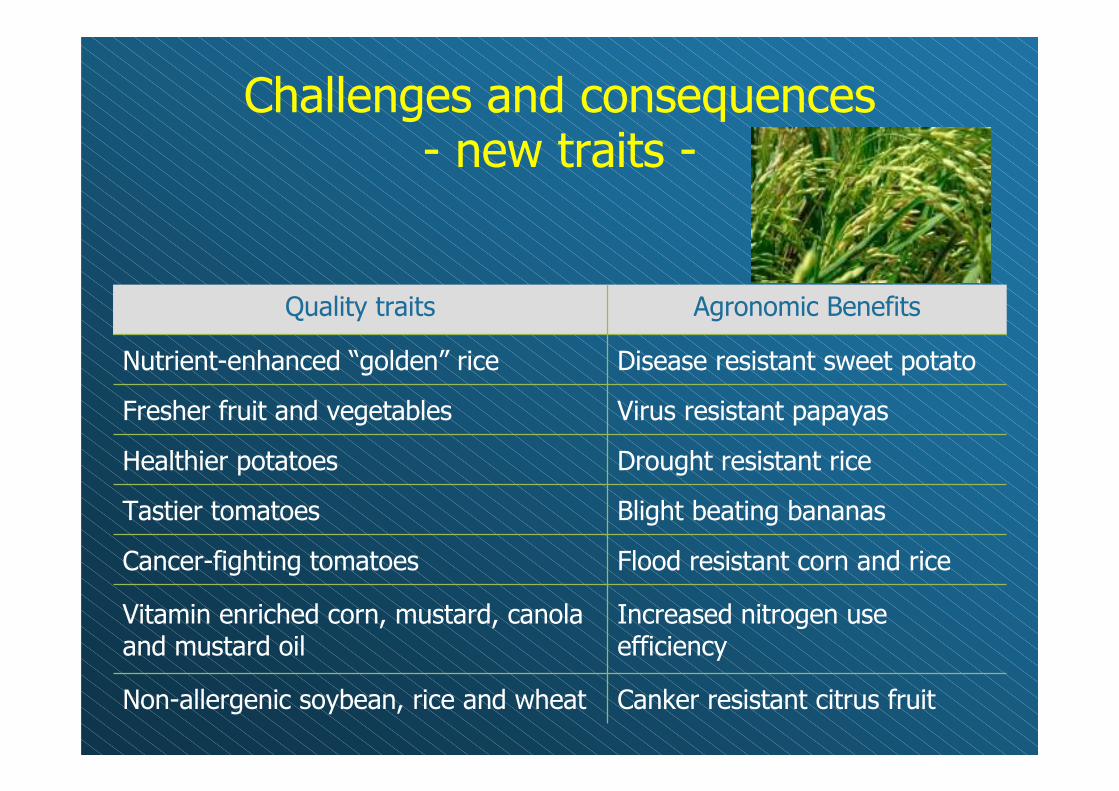
Challenges and consequences- new traits -
Quality traits Agronomic Benefits
Nutrient-enhanced “golden” rice Disease resistant sweet potato
Fresher fruit and vegetables Virus resistant papayas
Healthier potatoes Drought resistant rice
Tastier tomatoes Blight beating bananas
Cancer-fighting tomatoes Flood resistant corn and rice
Vitamin enriched corn, mustard, canola and mustard oil
Increased nitrogen use efficiency
Non-allergenic soybean, rice and wheat Canker resistant citrus fruit

Challenges and consequences- create added value (billion USD) -
Year 1996 2000 2004 2007
Total 30 36.5
GM Seed 0.12 2.70 4.67 6.90
% 0.4 19.2
Source: ISF

Components of the priceof a GM seed unit
CropGenetic
"seed"
"Seed
treatment"
Technology
fee Total
% genetic
of total
Sugar beetSugar beet 100100 5555 105105 260260 38%38%
MaizeMaize 7070 2020 3030 120120 58%58%
Maize Maize -- double stackdouble stack 7070 2020 4545 135135 52%52%
Cotton BtCotton Bt 4545 1515 7474 134134 34%34%
Cotton Cotton -- double stackdouble stack 100100 2525 263263 388388 26%26%
MaizeMaize 145145 3535 5454 234234 62%62%
Maize Maize -- double stackdouble stack 145145 3535 108108 288288 50%50%
Maize Maize -- triple stacktriple stack 9090 2020 115115 225225 40%40%
SoybeanSoybean 1515 44 1313 3232 47%47%
Challenges and consequences- higher regulatory burden -
� National
� Assessment of the safety of all biotech plant products intended for consumption by humans and animals
� Oversight on field testing of biotech seeds and plants to ensure their release causes no harm to agriculture and the environment
� Evaluation of environmental safety
� International (Cartagena Biosafety Protocol, CODEX, OECD)
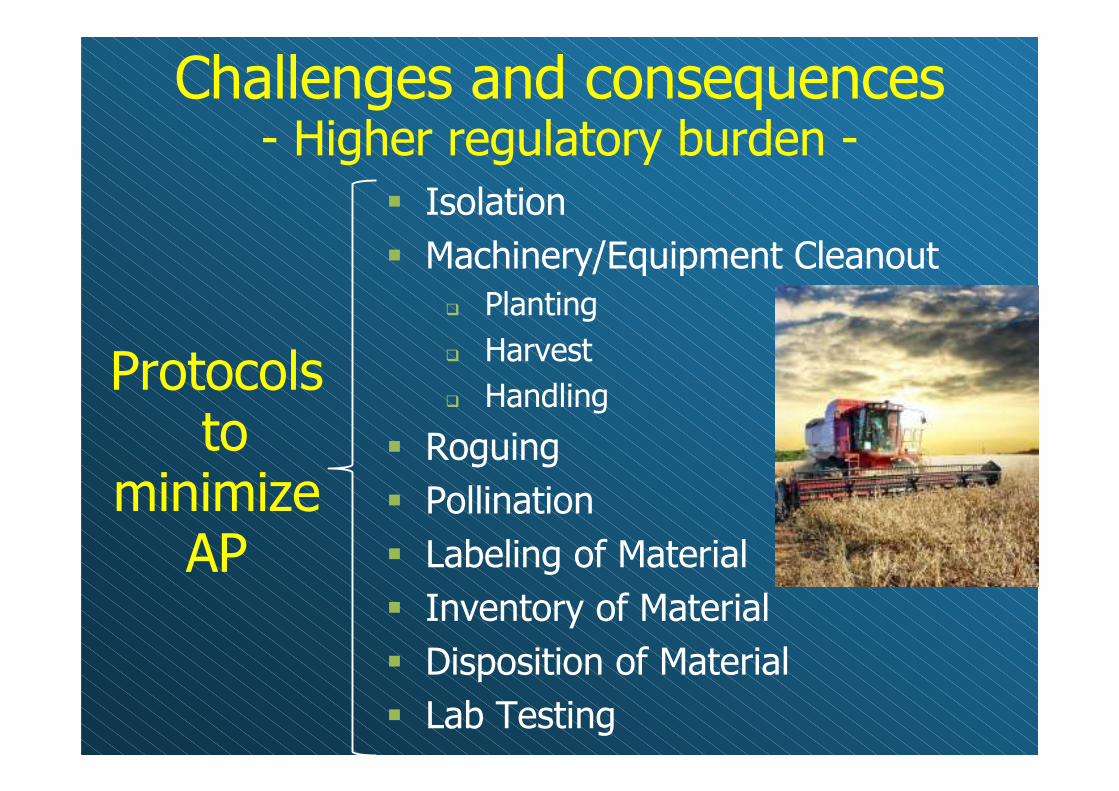
Protocolsto
minimize AP
� Isolation
� Machinery/Equipment Cleanout
� Planting
� Harvest
� Handling
� Roguing
� Pollination
� Labeling of Material
� Inventory of Material
� Disposition of Material
� Lab Testing
Challenges and consequences- Higher regulatory burden -
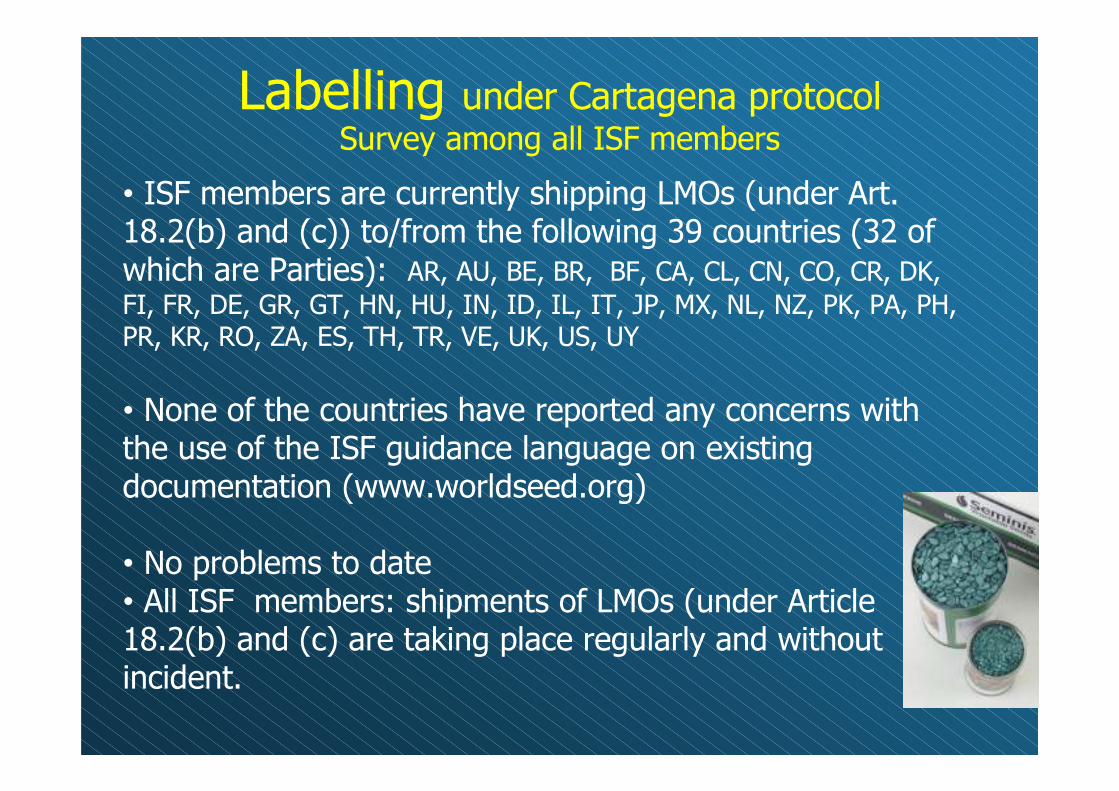
Labelling under Cartagena protocolSurvey among all ISF members
• ISF members are currently shipping LMOs (under Art. 18.2(b) and (c)) to/from the following 39 countries (32 of which are Parties): AR, AU, BE, BR, BF, CA, CL, CN, CO, CR, DK, FI, FR, DE, GR, GT, HN, HU, IN, ID, IL, IT, JP, MX, NL, NZ, PK, PA, PH, PR, KR, RO, ZA, ES, TH, TR, VE, UK, US, UY
• None of the countries have reported any concerns with the use of the ISF guidance language on existing documentation (www.worldseed.org)
• No problems to date• All ISF members: shipments of LMOs (under Article 18.2(b) and (c) are taking place regularly and without incident.

Challenges and consequences- Adventitious Presence (AP)-
AP (also Low Level Presence LLP): Incidental Presence of biotech traits already approved in one country, but not yet in the country of import.
2005: Global Adventitious Presence Coalition (GAPC)
AP in Commodities (food & feed)Codex ad hoc Task Force on Foods derived from Biotech.
=> 2008 approved Annex to Codex Plant Guidelines
AP in Seeds => ISF WG on AP in Seed=> Environmental safety issue=> ISF / BIAC proposal to place AP on agenda of OECD WG Harmonization ofRegulatory Oversight in Biotech

Adventitious Presence
Consequences
� Potential to cause significant trade disruptions
� Significant burden on the importing country’s
authorities when adventitious presence is detected
� Threatened survival of seed companies without the
resources and technology to test their seed for
adventitious presence of ‘unauthorised’ GM material

Challenges and consequences- Financial burden -
Source ESA / Prof. N. Kalaitzandonakes, 2007

To summarise…
� ISF supports plant breeders’ efforts to continually improve plant varieties using the full range of technologies available to them, of which recombinant DNA technology is one
� ISF considers “co-existence” to be a purely economic issue that has nothing to do with product/crop safety
� ISF expects that developers of GM traits - approved for commercialisation, and release for sale - make available the necessary technology for testing adventitious presence of GM traits to seed companies for their internal use
For ISF Position Papers, see www.worldseed.org
Thank you for your attention
www.worldseed.org