Biostratigraphy Beneath Central San Francisco Bay Along ...biostratigraphy of southern San Francisco...
17
11 Abstract To define the late Pleistocene and Holocene biostratigra- phy of the sedimentary deposits beneath San Francisco Bay near the San Francisco-Oakland Bay Bridge and to assess possible fault offsets near Yerba Buena Island, we examined cores taken by the California Department of Transportation for seismic retrofitting of the bridge. We used foraminifers, diatoms, and other microorganisms to identify intervals of Pleistocene and Holocene estuarine and alluvial deposition, and examined the estuarine intervals in greater detail to char- acterize the bay at the time when the sediment was deposited. Although foraminifers generally were poorly preserved, suf- ficient microfossils were observed in the estuarine deposits to define three biofacies: biofacies A, dominated by Trocham- mina inflata and shallow-water diatoms; biofacies B, with Ammonia beccarii and Elphidium excavatum and subtidal diatoms; and biofacies C, with Elphidiella hannai and the diatom Isthmia nervosa. These biofacies indicate progres- sively deeper or colder estuarine conditions, from intertidal mudflat and marsh to deep subtidal. This biostratigraphy, which correlates with that reported at other transects in the south bay, reflects the late Pleistocene transgressive episode that has been correlated with the latest interglacial (Substage 5e, ~125–120 ka). The use of microfossils in this study permits a more detailed late Pleistocene stratigraphy at the San Francisco- Oakland Bay Bridge transect than was previously available on the basis of engineering data alone. Holocene samples were too discontinuous to permit definition of a detailed stratigraphy and resolution of the question of faults beneath the bay. More closely spaced, better preserved samples are needed to address these issues. Introduction The objectives of this study were (1) to define the late Pleistocene and Holocene biostratigraphy of the sedimentary deposits beneath San Francisco Bay along the eastern and western spans of the San Francisco-Oakland Bay Bridge (figs. 1, 2), and (2) to compare the biostratigraphy in adjacent bore- holes to assess possible fault offsets near Yerba Buena Island. Biostratigraphy Beneath Central San Francisco Bay Along the San Francisco-Oakland Bay Bridge Transect By Mary McGann, 1 Doris Sloan, 2 and Elmira Wan 1 _________________________ 1 U.S. Geological Survey. 2 University of California, Berkeley. CONTENTS Page Abstract------------------------------------------------------------------------------ 11 Introduction-------------------------------------------------------------------------- 11 Methods------------------------------------------------------------------------------ 12 Results-------------------------------------------------------------------------------- 15 Eastern Transect---------------------------------------------------------------- 15 Western Transect--------------------------------------------------------------- 15 Discussion--------------------------------------------------------------------------- 18 Conclusions-------------------------------------------------------------------------- 18 Acknowledgments------------------------------------------------------------------ 18 References Cited-------------------------------------------------------------------- 18 Figure 1.—San Francisco Bay, showing locations of the San Francisco-Oakland Bay Bridge and the Southern Crossing, a proposed bridge between San Francisco and Alameda that was to be constructed just south of the existing San Francisco-Oakland Bay Bridge. Biostratigraphy Beneath Central San Francisco Bay Along the San Francisco-Oakland Bay Bridge Transect California San Pablo Bay South bay Richardson Bay San Rafael Bay San Francisco Oakland bay Central Suisun Bay San Joaquin River Sacramento River PACIFIC OCEAN 37°30' 38°00' 10 KILOMETERS 0 5 Grizzly Bay SAN FRANCISCO- OAKLAND BAY BRIDGE SOUTHERN CROSSING Fig. 2 122°00' 37°45' 122°15' 122°30' Alameda
Transcript of Biostratigraphy Beneath Central San Francisco Bay Along ...biostratigraphy of southern San Francisco...
11
AbstractTo defi ne the late Pleistocene and Holocene biostratigra-
phy of the sedimentary deposits beneath San Francisco Bay near the San Francisco-Oakland Bay Bridge and to assess possible fault offsets near Yerba Buena Island, we examined cores taken by the California Department of Transportation for seismic retrofi tting of the bridge. We used foraminifers, diatoms, and other microorganisms to identify intervals of Pleistocene and Holocene estuarine and alluvial deposition, and examined the estuarine intervals in greater detail to char-acterize the bay at the time when the sediment was deposited. Although foraminifers generally were poorly preserved, suf-fi cient microfossils were observed in the estuarine deposits to defi ne three biofacies: biofacies A, dominated by Trocham-mina infl ata and shallow-water diatoms; biofacies B, with Ammonia beccarii and Elphidium excavatum and subtidal diatoms; and biofacies C, with Elphidiella hannai and the diatom Isthmia nervosa. These biofacies indicate progres-sively deeper or colder estuarine conditions, from intertidal mudfl at and marsh to deep subtidal. This biostratigraphy, which correlates with that reported at other transects in the south bay, refl ects the late Pleistocene transgressive episode that has been correlated with the latest interglacial (Substage 5e, ~125–120 ka).
The use of microfossils in this study permits a more detailed late Pleistocene stratigraphy at the San Francisco-
Oakland Bay Bridge transect than was previously available on the basis of engineering data alone. Holocene samples were too discontinuous to permit defi nition of a detailed stratigraphy and resolution of the question of faults beneath the bay. More closely spaced, better preserved samples are needed to address these issues.
IntroductionThe objectives of this study were (1) to defi ne the late
Pleistocene and Holocene biostratigraphy of the sedimentary deposits beneath San Francisco Bay along the eastern and western spans of the San Francisco-Oakland Bay Bridge (fi gs. 1, 2), and (2) to compare the biostratigraphy in adjacent bore-holes to assess possible fault offsets near Yerba Buena Island.
Biostratigraphy Beneath Central San Francisco Bay Along the San Francisco-Oakland Bay Bridge Transect
By Mary McGann,1 Doris Sloan,2 and Elmira Wan1
_________________________
1U.S. Geological Survey.2University of California, Berkeley.
CONTENTS
PageAbstract------------------------------------------------------------------------------ 11Introduction-------------------------------------------------------------------------- 11 Methods------------------------------------------------------------------------------ 12Results-------------------------------------------------------------------------------- 15 Eastern Transect---------------------------------------------------------------- 15 Western Transect--------------------------------------------------------------- 15Discussion--------------------------------------------------------------------------- 18Conclusions-------------------------------------------------------------------------- 18Acknowledgments------------------------------------------------------------------ 18References Cited-------------------------------------------------------------------- 18
Figure 1.—San Francisco Bay, showing locations of the San Francisco-Oakland Bay Bridge and the Southern Crossing, a proposed bridge between San Francisco and Alameda that was to be constructed just south of the existing San Francisco-Oakland Bay Bridge.
Biostratigraphy Beneath Central San Francisco Bay Along the San Francisco-Oakland Bay Bridge Transect
California
San Pablo Bay
South bay
RichardsonBay
San RafaelBay
SanFrancisco
Oakland
bayCentral
SuisunBay San Joaquin River
SacramentoRiver
PAC
IFIC
OC
EA
N
37°30'
38°00'
10 KILOMETERS0 5
GrizzlyBay
SAN FRANCISCO-OAKLAND BAY BRIDGE
SOUTHERNCROSSING
Fig. 2
122°00'
37°45'
122°15'122°30'
Alameda
12 Crustal Structure of the Coastal and Marine San Francisco Bay Region, California
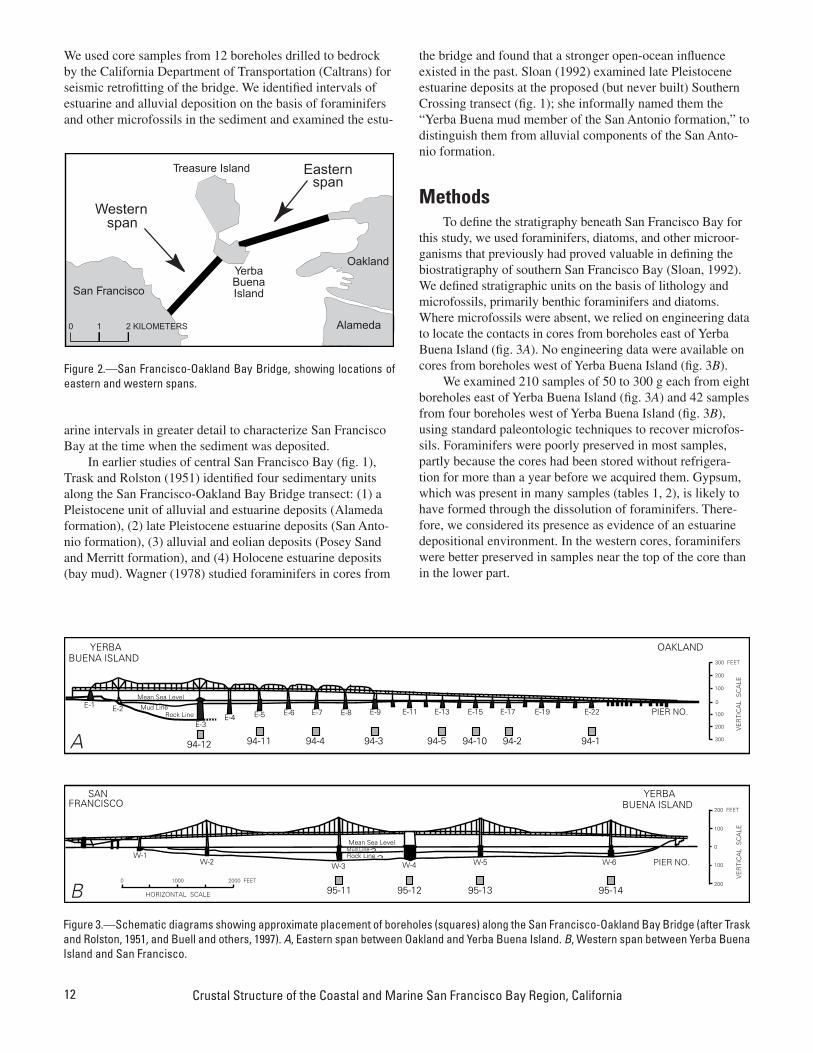
We used core samples from 12 boreholes drilled to bedrock by the California Department of Transportation (Caltrans) for seismic retrofi tting of the bridge. We identifi ed intervals of estuarine and alluvial deposition on the basis of foraminifers and other microfossils in the sediment and examined the estu-
arine intervals in greater detail to characterize San Francisco Bay at the time when the sediment was deposited.
In earlier studies of central San Francisco Bay (fi g. 1), Trask and Rolston (1951) identifi ed four sedimentary units along the San Francisco-Oakland Bay Bridge transect: (1) a Pleistocene unit of alluvial and estuarine deposits (Alameda formation), (2) late Pleistocene estuarine deposits (San Anto-nio formation), (3) alluvial and eolian deposits (Posey Sand and Merritt formation), and (4) Holocene estuarine deposits (bay mud). Wagner (1978) studied foraminifers in cores from
Figure 2.—San Francisco-Oakland Bay Bridge, showing locations of eastern and western spans.
HORIZONTAL SCALE
0 1000 2000 FEET
OAKLAND
E-1 E-2
Mean Sea Level
Mud LineRock Line E-4 E-5 E-6 E-7 E-8 E-9 E-11 E-13 E-15 E-17 E-19
E-3
94-12 94-11 94-4 94-5 94-294-3 94-10
E-22
94-1
PIER NO.0
200
200
PIER NO.W-2W-1
W-3 W-4 W-5 W-6
Mean Sea LevelMud LineRock Line
95-1495-1395-1295-11200
200 FEET
0
VE
RTI
CA
L S
CA
LE
100
100
A
B
SANFRANCISCO
YERBABUENA ISLAND
YERBABUENA ISLAND
100
100
300 FEET
300V
ER
TIC
AL
SC
ALE
Figure 3.—Schematic diagrams showing approximate placement of boreholes (squares) along the San Francisco-Oakland Bay Bridge (after Trask and Rolston, 1951, and Buell and others, 1997). A, Eastern span between Oakland and Yerba Buena Island. B, Western span between Yerba Buena Island and San Francisco.
the bridge and found that a stronger open-ocean infl uence existed in the past. Sloan (1992) examined late Pleistocene estuarine deposits at the proposed (but never built) Southern Crossing transect (fi g. 1); she informally named them the “Yerba Buena mud member of the San Antonio formation,” to distinguish them from alluvial components of the San Anto-nio formation.
MethodsTo defi ne the stratigraphy beneath San Francisco Bay for
this study, we used foraminifers, diatoms, and other microor-ganisms that previously had proved valuable in defi ning the biostratigraphy of southern San Francisco Bay (Sloan, 1992). We defi ned stratigraphic units on the basis of lithology and microfossils, primarily benthic foraminifers and diatoms. Where microfossils were absent, we relied on engineering data to locate the contacts in cores from boreholes east of Yerba Buena Island (fi g. 3A). No engineering data were available on cores from boreholes west of Yerba Buena Island (fi g. 3B).
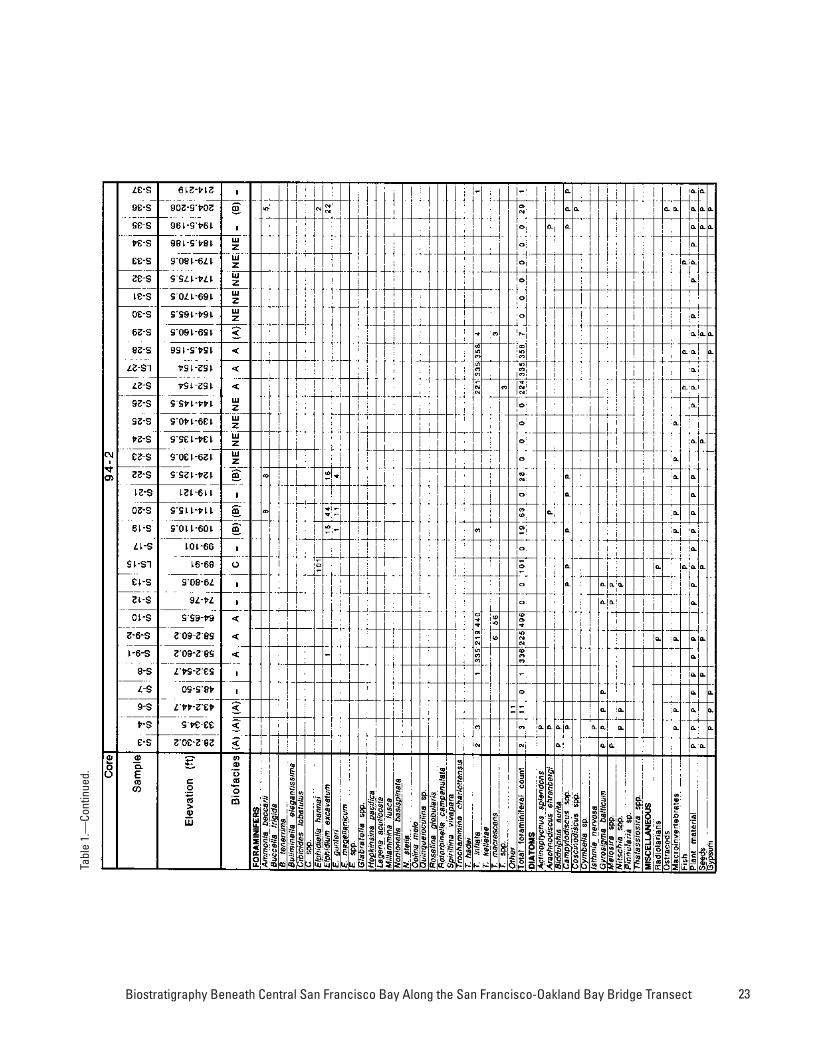
We examined 210 samples of 50 to 300 g each from eight boreholes east of Yerba Buena Island (fi g. 3A) and 42 samples from four boreholes west of Yerba Buena Island (fi g. 3B), using standard paleontologic techniques to recover microfos-sils. Foraminifers were poorly preserved in most samples, partly because the cores had been stored without refrigera-tion for more than a year before we acquired them. Gypsum, which was present in many samples (tables 1, 2), is likely to have formed through the dissolution of foraminifers. There-fore, we considered its presence as evidence of an estuarine depositional environment. In the western cores, foraminifers were better preserved in samples near the top of the core than in the lower part.
Westernspan
Easternspan
Treasure Island
0 2 KILOMETERS
YerbaBuenaIsland
Oakland
San Francisco
1 Alameda

13
Figu
re 4
.—St
ratig
raph
ic s
edim
enta
ry s
ectio
ns in
bor
ehol
es b
enea
th th
e ea
ster
n sp
an o
f the
San
Fra
ncis
co-O
akla
nd B
ay B
ridge
. Con
tact
s ar
e ba
sed
prim
arily
on
mic
ropa
leon
tolo
gic
data
. W
here
mic
rofo
ssils
are
abs
ent,
engi
neer
ing
data
wer
e us
ed. A
, Cor
es 9
4–5,
94–
10, 9
4–2,
and
94–
1. B
, Cor
es 9
4–12
, 94–
11, 9
4–4,
and
94–
3. O
nly
uppe
rmos
t par
t of P
leis
toce
ne u
nit i
s sh
own.
0 5040302010 60 70 80
70 130
170
230
20 270
50 1000
150
200
250
10 30 40 60 80 90 110
120
140
160
180
190
210
220
240
260
280
(ME
TER
S)
(FE
ET)
CO
RE
94-
10C
OR
E 9
4-2
CO
RE
94-
1
FF/D
F/D F DDFF/D
Non
estu
arin
e
Est
uarin
e
Est
uarin
e
90
Non
estu
arin
e
Est
uarin
e
A(A)
A
Est
uarin
e
CO
RE
94-
5
F/D
F/D F 0 D F
(A)
(B)
(B)
C
Allu
vial
or
estu
arin
e
Non
estu
arin
e
Est
uarin
e
Est
uarin
e
F/D
BD 00 D F/D
F/DD 0 0 F/D 0 0 F F0 0 0 000
(A)
D F/D
C
0 F/D
(B)
F/D
(B)
F/D
(B)
D 0 0 0 0 0 0 0 0 0 DFA
F(A
)F
A
F/D
(B)
F/D
F/D
B
F/D
F/D
A
F/D
F/D
F/D 0 0 0 D 0 0 0FF F F F F F0 0 0 0 0 0 0 DD D 0
Est
uarin
e
MLL
W
ELEVATION
MICROFOSSILS
SAMPLE INTERVAL
BIOFACIES
PALE
O-
EN
VIR
ON
ME
NT
UN
IT
SAMPLE NUMBER
S-3
S-7
S-1
0
S-1
2
S-8
S-1
4
S-1
7
S-1
9
S-2
3
S-2
6S
-27
S-2
9S
-30
S-1
6
S-3
5
S-2
5
S-2
8
S-3
4
S-3
6
S-4
1
S-4
0
S-2
0
S-2
2
S-2
1
S-1
3
S-3
1S
-32
S-3
7
S-3
8
S-3
9
S-4
2
MICROFOSSILS
SAMPLE INTERVAL
BIOFACIES
PALE
O-
EN
VIR
ON
ME
NT
UN
IT
SAMPLE NUMBER
S-3
S-7
S-1
0
S-1
2
S-8
S-1
7
S-1
5
S-1
9
S-2
3
S-2
6
S-2
7
S-2
9S
-30
S-3
5
S-2
5
S-2
8
S-3
4
S-3
6
S-2
0
S-2
2S
-21
S-1
3
S-3
1S
-32
S-3
7
S-4
S-6
S-9
S-3
3
S-2
4
MICROFOSSILS
SAMPLE INTERVAL
BIOFACIES
PALE
O-
EN
VIR
ON
ME
NT
UN
IT
SAMPLE NUMBER
MICROFOSSILS
SAMPLE INTERVAL
BIOFACIES
PALE
O-
EN
VIR
ON
ME
NT
UN
IT
SAMPLE NUMBER
S-2
S-1
5
S-1
3
S-4
S-6
S-9
S-3
S-7
S-1
0
S-1
2
S-8
S-1
7
S-1
4
S-2
3
S-2
6S
-27
S-2
9S
-30
S-2
5
S-2
8
S-2
0
S-2
2
S-1
3
S-3
1
S-5
S-2
4
S-1
8
S-1
1
0
NE
Est
uarin
e
Non
estu
arin
e
Non
estu
arin
e
NE
NE
NE
(A)
NE
NE
NE
NE
NE
NE
NE
NE
NE
NE
NE
NE
(A)
(A)
Est
uarin
e
Est
uarin
e
Non
estu
arin
e
Non
estu
arin
e
Est
uarin
e
Allu
vial
or
estu
arin
e
Est
uarin
e
NE
NE
NE
NE
NE
NE
NE
NE
NE
NE
NE
NE
NE
NE
A
Hol
ocen
e
Late
Ple
isto
cene
Wat
er
Late
st P
leis
toce
ne
Ple
isto
cene
EX
PLA
NA
TIO
N
and
Hol
ocen
e
Biostratigraphy Beneath Central San Francisco Bay Along the San Francisco-Oakland Bay Bridge Transect

14 Crustal Structure of the Coastal and Marine San Francisco Bay Region, California
Figu
re 4
.—Co
ntin
ued.
ELEVATION
0 5040302010 60 70 80
70 130
170
23020 270
50 1000
150
200
250
10 30 40 60 80 90 110
120
140
160
180
190
210
220
240
260
280
(ME
TER
S)
(FE
ET)
CO
RE
94-
12
F/D
F/D
F/D
F/D
F/D FF D D F/D D 0 0 FD 0 0 F/D D D DF/D
F/D
F/D
F/D
F/D
F/D D
(B)
(B/C
)C C C A(B
)(B
)
(C)
C C(B)
(A)
Est
uarin
e
CO
RE
94-
11C
OR
E 9
4-4
F F/D 0 0 0 F FD 0
Non
estu
arin
e
Est
uarin
e
B (C)
(B/C
)
(A)
(B)
C C(C)
A C C (C)
C
Non
estu
arin
e
Est
uarin
e
Est
uarin
e
MLL
W
90
(A)
(A)
A C
Non
estu
arin
e
Est
uarin
e
Est
uarin
e
CO
RE
94-
3
MICROFOSSILS
SAMPLE INTERVAL
F/D
F/D D F/D 0 0 F
BIOFACIES
PALE
O-
EN
VIR
ON
ME
NT
UN
IT
(A)
(A)
C
Est
uarin
e
Non
estu
arin
e
Est
uarin
e
F/D
F/D F D D F/D D 0 0 0 FF/D
F/D
F/DF 0 F F/D D F/D
F/D
F/D
F/D
F/D
F/D D 00 0 0 0 0
F/D
B
F/D
B
F/D
B
0 0 0 0 0 F/DD D F F/D F F/D 0 F F F 0 0 0
(B)
CA
0
SAMPLE NUMBER
S-1
S-3
S-5
S-6
S-7
S-9
S-1
0
S-1
2S
-13
MICROFOSSILS
SAMPLE INTERVAL
BIOFACIES
PALE
O-
EN
VIR
ON
ME
NT
UN
IT
SAMPLE NUMBER
S-1
S-3
S-5
S-6
S-7
S-9
S-1
0
S-1
2S
-13
S-2
S-4
S-8
S-1
1
S-1
4
S-1
7S
-18
S-1
5
S-1
9
S-3
3
S-2
3S
-24
S-2
6S
-27
S-2
9S
-30
S-2
0
S-3
5
S-2
5
S-2
8
S-3
1S
-32
MICROFOSSILS
SAMPLE INTERVAL
BIOFACIES
PALE
O-
EN
VIR
ON
ME
NT
UN
IT
SAMPLE NUMBER
MICROFOSSILS
SAMPLE INTERVAL
BIOFACIES
PALE
O-
EN
VIR
ON
ME
NT
UN
IT
SAMPLE NUMBER
S-1
S-3
S-5
S-6
S-7
S-9
S-1
0
S-1
2
S-8
S-1
1
S-1
4
S-1
7S
-18
S-1
5
S-1
9
S-2
3S
-24
S-2
6S
-27
S-2
9S
-30
S-1
6
S-3
5
S-2
5
S-2
8
S-1
S-3
S-5
S-6
S-7
S-9
S-1
0
S-1
2S
-13
S-2
S-4
S-8
S-1
1
S-1
4
S-1
7S
-18
S-1
5
S-1
9
S-3
3
S-2
3S
-24
S-2
6S
-27
S-2
9S
-30
S-2
0
S-3
5
S-2
1
S-2
8
S-3
1S
-32
S-2
2
S-3
4
S-1
6
S-3
4
S-3
6
S-3
9S
-38
S-2
0
S-2
2S
-21
0 D
D D 0
Est
uarin
e
Non
estu
arin
e
Est
uarin
e
Non
estu
arin
e
Non
estu
arin
e
0 0
Est
uarin
e
Non
estu
arin
e
Non
estu
arin
e
Non
estu
arin
e
NE
NE
NE
NE
NE
NE
NE
NE
NE
NE
NE
NE
NE
NE
NE
NE
NE
NE
NE
NE
NE
NE
NE
NE
NE
NE
NE
NE
NE
NE
NE
NE
NE
NE
A
B

15
In the eastern cores, only 24 of 210 samples (11 percent) contained more than 300 foraminifers; a total of 37 samples (18 percent) contained more than 100 foraminifers, and an additional 6 samples contained from 50 to 100 foraminifers (3 percent with >50 foraminifers; table 1). In two cores, foraminifers were very rare: In core 94–1 (fi g. 4A) only two samples (S–16, S–39) contained suffi cient foraminifers for reliable analysis; and in core 94–10 (fi g. 4A), foraminifers were common only in sample S–3. Preservation was best in cores 94–11 and 94–12 (fi g. 4B).
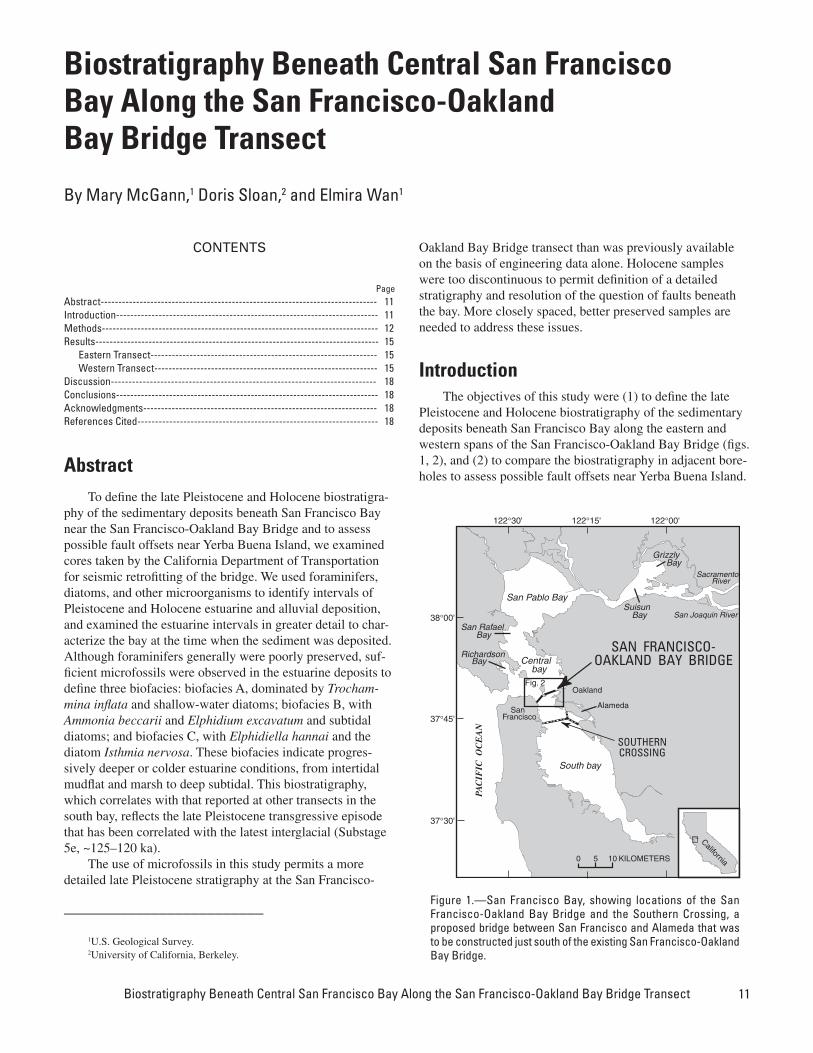
In the western cores, 7 of 42 samples (17 percent) con-tained more than 300 specimens, all in core 95–14 (fi g. 5); a total of 18 samples (43 percent) contained more than 100 foraminifers, and an additional 5 samples contained from 50 to 100 specimens (12 percent with >50 foramini-fers; table 2). In many of these samples, the foraminifers are well preserved; however, the samples were spaced too far apart to permit stratigraphic interpretation of the cores. Therefore, in the interest of completeness, we report micro-fossil occurrences in table 2 without biostratigraphic inter-pretation.
In many samples containing no or few foraminifers, suf-fi cient diatoms were preserved to permit environmental inter-pretations. Several samples contained a few foraminifers but no other organic evidence of estuarine deposition. Where the mineral content of the residues appeared to be nonestuarine, we considered the foraminifers to be displaced and inter-preted the depositional environment as nonestuarine.
ResultsLithology and microfossils indicate that the stratigraphy
at the Bay Bridge is much like that described in earlier studies (Trask and Rolston, 1951; Wagner, 1978; Sloan, 1992). We identifi ed four sedimentary units (fi g. 4): (1) at least 120 ft of Pleistocene alluvial and estuarine deposits, (2) about 15 to 95 ft of late Pleistocene estuarine deposits, (3) 5 to 45 ft of alluvial and eolian deposits, and (4) 20 to 40 ft of Holocene estuarine deposits. We report here on the biostra-tigraphy of the two youngest estuarine units. In the earlier Pleistocene deposits, estuarine and alluvial depositional envi-ronments were discriminated where suffi cient microfossil data were available; however, in many cores, sampling intervals were too widely spaced and microfossils too poorly preserved to permit more detailed stratigraphic analysis.
The dominant species of foraminifers in both the late Pleistocene and Holocene estuarine units are Ammonia bec-carii (Linné), Elphidiella hannai (Cushman and Grant), Elphidium excavatum (Terquem), and Trochammina infl ata (Montagu) (tables 1, 2). They indicate deposition under intertidal and shallow to deep subtidal estuarine conditions (0–~20 m water depth; salinity, ~10–~31 practical salin-ity units; Arnal and others, 1980; Sloan, 1992; McGann and Sloan, 1999; San Francisco Estuary Institute, 1999; see the U.S. Geological Survey’s Water Resources Division San Francisco Bay water-quality Web site at URL http//:
sfbay.wr.usgs.gov/access/wqdata/index.html). Trochammina hadai, a species recently introduced into San Francisco Bay (McGann and others, 2000), is present in low numbers in three Holocene samples (core 94–11, samples S–2, S–4; core 94–12, sample S–3T); its presence in subsurface samples is likely due either to bioturbation or to contamination during coring.
The dominant sand-size diatoms in the estuarine units include Actinoptychus, Arachnodiscus, Biddulphia, Campyl- odiscus, Cymbella, Isthmia, Gyrosigma, and Thalassiosira. These brackish to marine genera are all common in the surface sediment of San Francisco Bay today (Mahood and others, 1986; Laws, 1988).
On the basis of the occurrence of these foraminifers and diatoms, we defi ne three biofacies in the late Pleistocene and Holocene estuarine deposits: biofacies A, dominated by Trochammina infl ata and diatoms, including Campylodis-cus, Biddulphia, Cymbella, Gyrosigma, Melosira, Nitzschia, Pinnularia, or Thallasiosira; biofacies B, dominated by Ammonia beccarii and Elphidium excavatum, including also the diatoms Actinoptychus and Arachnodiscus; and biofacies C, containing abundant Elphidiella hannai and the diatom Isthmia nervosa. These three biofacies indicate progressively deeper or colder estuarine conditions, from intertidal mudfl at and marsh (biofacies A, ~0–7-ft depth; maximum salinity, ~10 practical salinity units), through shallow subtidal (biofa-cies B, ~7–49-ft depth; salinity, ~10–30 practical salinity units), to deep subtidal (biofacies C, 39–72-ft depth; salinity, ~15–32 practical salinity units).
Eastern Transect
In the late Pleistocene estuarine deposits, biofacies C is most common, occurring in 17 samples (fi gs. 4A, 4B; table 1). Biofacies A and B are present in 14 and 9 samples, respectively, and 2 samples have a biofacies transitional between biofacies B and C. In most cores, the top and bottom samples contain biofacies A or B, or too few data are available for reliable interpretation. Biofacies C occurs near the middle of the unit.
In contrast, in the Holocene estuarine deposits, biofacies A and B are most common, occurring in 8 and 9 samples, respectively (fi gs. 4A, 4B; table 1). Biofacies C is present in only 2 samples. Biofacies A occurs near the base of the unit, except in cores 94–3 and 94–12, where biofacies B is present in the lowermost samples, and in cores 94–10 and 94–11, where biofacies A is absent. Biofacies B occurs in the uppermost samples from all cores except 94–2, in which it is absent.
Western Transect
In the undifferentiated late Pleistocene and Holocene estuarine deposits, no samples contain biofacies A; however, a biofacies transitional between biofacies A and B is present in 1 sample from core 95–13 (S–5–3; fi g. 5; table 2). Biofa-
Biostratigraphy Beneath Central San Francisco Bay Along the San Francisco-Oakland Bay Bridge Transect

16 Crustal Structure of the Coastal and Marine San Francisco Bay Region, California
Figu
re 5
.—Sa
mpl
e lo
catio
ns a
nd p
aleo
envi
ronm
enta
l int
erpr
etat
ion
of s
edim
enta
ry d
epos
its in
bor
ehol
es b
enea
th th
e w
este
rn s
pan
of th
e Sa
n Fr
anci
sco-
Oakl
and
Bay
Brid
ge. C
on-
tact
s ar
e ba
sed
on m
icro
pale
onto
logi
c da
ta. S
ampl
e A,
S–2
6–1
to S
–26–
8; B
, S–5
–1 to
S–5
–7; C
, S–7
–1 to
S–7
–5; D
, S–2
6–1
to S
–26–
5.
ELEVATION
0
5040302010 60 70
70 130
17020 50 1000
150
20010 30 40 60 80 90 110
120
140
160
180
190
210
220
(ME
TER
S)
(FE
ET)
CO
RE
95-
11C
OR
E 9
5-12
CO
RE
95-
13
MLL
W
CO
RE
95-
14
MICROFOSSILS
SAMPLE INTERVAL
BIOFACIES
PALE
O-
EN
VIR
ON
ME
NT
SAMPLE NUMBER
MICROFOSSILS
SAMPLE INTERVAL
BIOFACIES
PALE
O-
EN
VIR
ON
ME
NT
SAMPLE NUMBER
MICROFOSSILS
SAMPLE INTERVAL
BIOFACIES
PALE
O-
EN
VIR
ON
ME
NT
SAMPLE NUMBER
MICROFOSSILS
SAMPLE INTERVAL
BIOFACIES
PALE
O-
EN
VIR
ON
ME
NT
SAMPLE NUMBER
S-4
5-1
S-4
7-1
S-4
6-2
S-4
8-1
S-1
3-2
S-2
6-3
S-2
0-1
S-3
6-2
S-8
-1S
-8-4
S-1
0-1
S-1
5-2
S-1
2-5
S-1
2-2
S-1
0-4
S-1
9-5
S-2
0-1
F/D 0F/D F F
0F/D
F/D
F/D
F/D
F/D
F/D
F/D
F/D
F/D
F/D
F/D
F/D
F/D 0F/D
B B (B)
B
(B)
B (B)
B
B/C (C)
(C)
C C C C C C C
Est
uarin
e
Est
uarin
e
Est
uarin
e
Est
uarin
e
Non
estu
arin
e
Non
estu
arin
e
Non
estu
arin
e
Est
uarin
e
DC
B
A
NE
NE
NE

17
Figu
re 6
.—Ex
pand
ed v
iew
of s
tratig
raph
ic s
edim
enta
ry s
ectio
n in
cor
e 94
–11,
sho
win
g di
ffere
nce
betw
een
cont
acts
bas
ed o
n m
icro
pale
onto
logi
c an
d en
gine
erin
g da
ta.
ELEVATION
0
5040302010 60 70 80
70 130
170
23020 27050 1000
150
200
25010 30 40 60 80 90 110
120
140
160
180
190
210
220
240
260
280
(ME
TER
S)
(FE
ET)
MLL
W
90
SAMPLE INTERVAL
0 0F/D D 00
AE
stua
rine
Non
estu
arin
e
MICROFOSSILS
BIOFACIES
PALE
O-
EN
VIR
ON
ME
NT
(FE
ET)
140
170
150
160
180
Est
uarin
e
Con
tact
bas
edon
mic
rofo
ssil
data
Con
tact
bas
edon
eng
inee
ring
data
10 f
t. d
iffer
ence
INTERPRETATIONBASED ONMICROFOSSILS
INTERPRETATIONBASED ONENGINEERING
0
EX
PLA
NA
TIO
N
ELEVATION
Hol
ocen
e
Late
Ple
isto
cene
Wat
er
Late
st P
leis
toce
ne
Ple
isto
cene
and
Hol
ocen
e
SAMPLE NUMBER
S-2
0S
-21
S-2
2S
-23
S-2
4
S-2
6S
-27
B (C)
(B/C
)
(A)
(B)
C C(C)
A C C (C)
C
Non
estu
arin
e
Est
uarin
e
Est
uarin
e
F/D
F/D F D D F/D D 0 0 0 FF/D
F/D
F/DF 0 F F/D D F/D
F/D
F/D
F/D
F/D
F/D D 00 0 0 0 0MICROFOSSILS
SAMPLE INTERVAL
BIOFACIES
PALE
O-
EN
VIR
ON
ME
NT
UN
IT
SAMPLE NUMBER
S-1
S-3
S-5
S-6
S-7
S-9
S-1
0
S-1
2S
-13
S-2
S-4
S-8
S-1
1
S-1
4
S-1
7S
-18
S-1
5
S-1
9
S-3
3
S-2
3S
-24
S-2
6S
-27
S-2
9S
-30
S-2
0
S-3
5
S-2
1
S-2
8
S-3
1S
-32
S-2
2
S-3
4
S-1
6
0 0
Est
uarin
e
Non
estu
arin
e
Non
estu
arin
e
NE
NE
NE
NE
NE
NE
NE
NE
NE
NE
NEA
NE
NE
NE
Biostratigraphy Beneath Central San Francisco Bay Along the San Francisco-Oakland Bay Bridge Transect

18 Crustal Structure of the Coastal and Marine San Francisco Bay Region, California
cies B is the only one present in cores 95–11 and 95–12. Bio-facies C is present in 10 of the 14 estuarine samples from core 95–14, and the other 4 samples have a biofacies transitional between biofacies B and C. Little vertical change was noted in any of these four cores.
Discussion
On the basis of the stratigraphic position of the sedimen-tary units and the biofacies present in the deposits, the stratig-raphy at the San Francisco-Oakland Bay Bridge transect can be correlated with the stratigraphies at the Southern Crossing transect ~6 km to the south studied by Sloan (1992) and at the San Mateo Bridge transect (Atwater and others, 1977), ~26 km south of the bridge. The late Pleistocene estuarine unit at the San Francisco-Oakland Bay Bridge transect is correlative with Sloan’s informally named Yerba Buena mud of Sangamon age (Substage 5e, ~125–120 ka). The Holocene estuarine deposits are present at all three transects.
The biofacies present in the eastern Caltrans cores refl ect the same late Pleistocene transgressive episode as that seen at the Southern Crossing (Sloan, 1992) and San Mateo Bridge (Atwater and others, 1977) transects. The intertidal-mudfl at and marsh deposits at the base (with biofacies A) are suc-ceeded by shallow subtidal (with biofacies B) and then deep subtidal (with biofacies C) deposits. A subsequent drop in sea level or a tectonic event that created a shallower bay is indi-cated by the presence of biofacies B or A near the top of the late Pleistocene deposits.
In the Holocene unit east of Yerba Buena Island, the transgressive pattern is less clear, partly because of poor sample coverage. Although biofacies A is present in the lowermost samples from several cores from boreholes east of Yerba Buena Island, in cores 94–3 and 94–12 (fi g. 4B) biofacies A is present in the middle of the unit rather than at the base or top, as in the late Pleistocene unit. This sequence may refl ect a shallowing episode or may be an artifact of the spacing of samples or the poor preservation of foraminifers.
The use of microfossils in this study permits a more detailed late Pleistocene stratigraphy at the San Francisco-Oakland Bay Bridge transect than was previously avail-able. Most earlier studies relied on engineering properties alone (Hoover-Young Bridge Commission, 1930; Trask and Rolston, 1951). By using foraminifers and diatoms as indicators of estuarine environments, we can locate contacts between the estuarine and alluvial units with greater preci-sion than was previously possible. For example, in core 94–12 (fi g. 4B), the micropaleontologic data support a contact between the late Pleistocene and Pleistocene units as defi ned by Caltrans on the basis of engineering data (Reid Buell, oral commun., 1997). In contrast, in core 94–11, the engineering data suggest that the base of the Yerba Buena mud is lower than set by Caltrans, who located it at ~145 ft, below sample 21 (fi g. 6). However, the presence of the marine and estuarine diatom Campylodiscus in sample 23 indicates that this sample
is not alluvial, and that therefore the contact should be placed another 10 ft lower. Where no microfossil evidence is avail-able, engineering data can provide the necessary control, as in contacts between the latest Pleistocene and Holocene alluvial units and the latest Pleistocene estuarine unit in core 94–5.
Because microfossils were poorly preserved and the cores were discontinuous, samples containing preserved foramini-fers were not closely enough spaced to permit us to resolve the question of faults beneath the bay.
ConclusionsMicrofossil and engineering data are both essential to
developing a detailed subsurface stratigraphic framework for San Francisco Bay. Microfossils are important in defi ning the environmental conditions in past estuaries. Both types of information are needed by engineers as they site bridges in the Nation’s estuaries or undertake seismic retrofi tting of bridges in regions susceptible to earthquake activity, such as San Francisco Bay. If more closely spaced and better pre-served samples are available when the sedimentary depos-its beneath San Francisco Bay are sampled in the future, the Holocene stratigraphy of the central bay can be further refi ned.
Acknowledgments We thank Reid Buell, John Thorne, Laurel Jensen, and
Mark Palmer of Caltrans for providing samples for microfau-nal analysis; Bradley Carkin, Jacquelin Letran, May Zhao, and Hai Le for technical assistance; and John Barron and Scott Starratt for their reviews of the manuscript.
References Cited
Arnal, R.E., Quinterno, P.J., Conomos, T.J., and Gram, Ralph, 1980, Trends in the distribution of Recent foraminifera in San Francisco Bay, in Sliter, W.V., ed., Studies in marine micro-paleontology and paleoecology (Bandy volume): Cushman Foundation for Foraminiferal Research Special Publication 18, p. 17–39.
Atwater, B.F., Hedel, C.W., and Helley, E.J., 1977, Late Quaternary depositional history, Holocene sea-level changes, and vertical crustal movement, southern San Francisco Bay, California: U.S. Geological Survey Professional Paper 1014, 15 p.
Buell, Reid, Huyette, C.M., Rogers, Michael, and Thorne, John, 1997, Geologic issues for the proposed new east span of the San Francisco-Oakland Bay Bridge: Sacramento, California Department of Transportation, 8 p.
Hoover-Young San Francisco Bay Bridge Commission, 1930, San Francisco Bay Bridge: Sacramento, California State Printing Offi ce, 234 p.
Laws, R.A., 1988, Diatoms (Bacillariophysceae) from surface sedi-ments in the San Francisco Bay estuary: California Academy of Sciences Proceedings, v. 45, no. 9, p. 133–254.

19
Mahood, A.D., Fryxell, G.A., and McMillan, M., 1986, The diatom genus Thalassiosira; species from the San Francisco Bay system: California Academy of Sciences Proceedings, v. 44, no. 8, p. 127–155.
McGann, Mary, and Sloan, Doris, 1999, Benthic foraminifers in the Regional Monitoring Program’s San Francisco Estuary samples, in San Francisco Estuary Institute, 1999, 1997 annual report; San Francisco Estuary Regional Monitoring Program for Trace Substances: Richmond, Calif., p. 249–258.
McGann, Mary, and Sloan, Doris, and Cohen, A. N., 2000, Invasion by a Japanese Marine Microorganism in western North America: Hydrobiologia, v. 421, no. 1–3, p. 25–30.
San Francisco Estuary Institute, 1999, 1997 annual report; San Fran-cisco Estuary Regional Monitoring Program for Trace Sub-stances: Richmond, Calif., 276 p.
Sloan, Doris, 1992, The Yerba Buena mud, record of the last-intergla-cial predecessor of San Francisco Bay, California: Geological Society of America Bulletin, v. 104, no. 6, p. 716–727.
Trask, P.D., and Rolston, J.W., 1951, Engineering geology of San Fran-cisco Bay, California: Geological Society of America Bulletin, v. 62, no. 9, p. 1079–1110.
Wagner, D.B., 1978, Environmental history of central San Francisco Bay with emphasis on foraminifera paleontology and clay min-eralogy: Berkeley, University of California, Ph.D. thesis, 274 p.
Biostratigraphy Beneath Central San Francisco Bay Along the San Francisco-Oakland Bay Bridge Transect
21
TABLES 1, 2

22 Crustal Structure of the Coastal and Marine San Francisco Bay Region, California
Tabl
e 1.
—M
icro
foss
il oc
curr
ence
s in
bor
ehol
es a
long
the
east
ern
span
of t
he S
an F
ranc
isco
-Oak
land
Bay
Brid
ge
[All
valu
es in
abs
olut
e ab
unda
nces
; P, p
rese
nt. L
S, L
exan
sam
ple;
NE,
non
estu
arin
e bi
ofac
ies.
Bio
faci
es in
par
enth
eses
, sam
ples
con
tain
ing
less
than
100
fora
min
ifers
but
eno
ugh
mic
rofo
ssils
to
indi
cate
bio
faci
es; d
ashe
s, in
suffi
cien
t dat
a to
det
erm
ine
estu
arin
e bi
ofac
ies]
23
Tabl
e 1.
—Co
ntin
ued.
Biostratigraphy Beneath Central San Francisco Bay Along the San Francisco-Oakland Bay Bridge Transect

24 Crustal Structure of the Coastal and Marine San Francisco Bay Region, California
Tabl
e 1.
—Co
ntin
ued.

25
Tabl
e 1.
—Co
ntin
ued.
Biostratigraphy Beneath Central San Francisco Bay Along the San Francisco-Oakland Bay Bridge Transect

26 Crustal Structure of the Coastal and Marine San Francisco Bay Region, California
Tabl
e 1.
—Co
ntin
ued.

27
Tabl
e 1.
—Co
ntin
ued.
Biostratigraphy Beneath Central San Francisco Bay Along the San Francisco-Oakland Bay Bridge Transect

28 Crustal Structure of the Coastal and Marine San Francisco Bay Region, California
Tabl
e 2.
—M
icro
foss
il oc
curr
ence
s in
bor
ehol
es a
long
the
wes
tern
spa
n of
the
San
Fran
cisc
o-Oa
klan
d Ba
y Br
idge
.
[All
valu
es in
abs
olut
e ab
unda
nces
; P, p
rese
nt. N
E, n
ones
tuar
ine
biof
acie
s. B
iofa
cies
in p
aren
thes
es, s
ampl
es c
onta
inin
g le
ss th
an 1
00 fo
ram
inife
rs b
ut e
noug
h m
icro
foss
ils to
indi
cate
bio
faci
es; d
ashe
s, in
suffi
cien
t dat
a to
det
erm
ine
estu
arin
e bi
ofac
ies]