Biostatistics-Lecture 10 Linear Mixed Model Ruibin Xi Peking University School of Mathematical...
22
Biostatistics-Lecture 10 Linear Mixed Model Ruibin Xi Peking University School of Mathematical Sciences
-
Upload
christian-doyle -
Category
Documents
-
view
228 -
download
2
Transcript of Biostatistics-Lecture 10 Linear Mixed Model Ruibin Xi Peking University School of Mathematical...

Biostatistics-Lecture 10Linear Mixed Model
Ruibin XiPeking University
School of Mathematical Sciences

An example
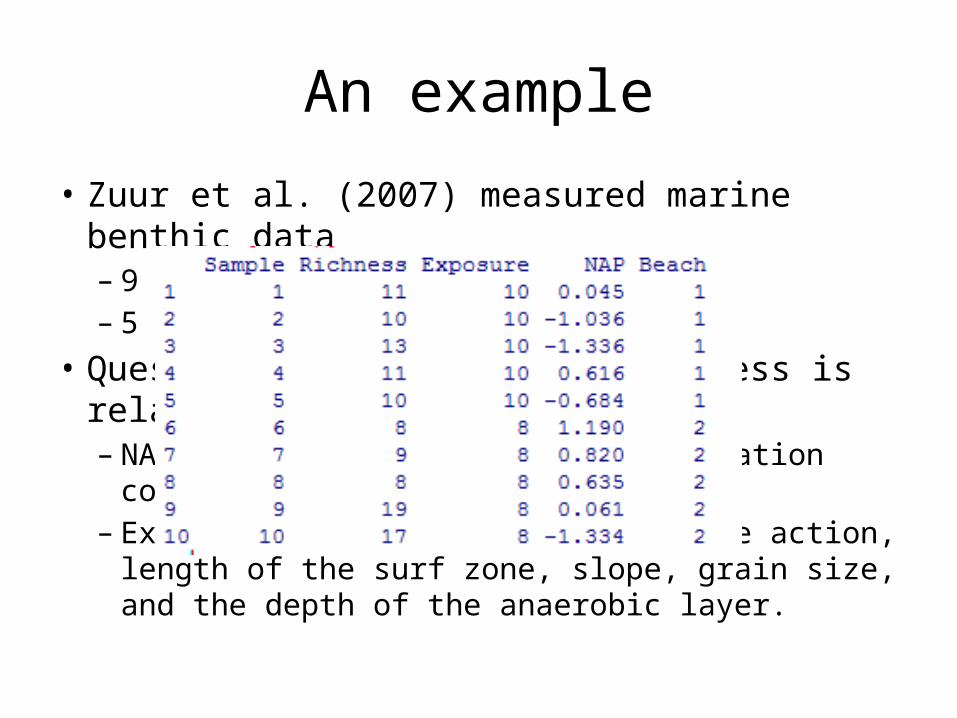
• Zuur et al. (2007) measured marine benthic data– 9 inter-tidal area were measured– 5 samples were taken in each area
• Question: whether species richness is related to – NAP: the height of the sampling station compared to
the mean tidal level– Exposure: an index composed of wave action, length
of the surf zone, slope, grain size, and the depth of the anaerobic layer.

An example
• Zuur et al. (2007) measured marine benthic data– 9 inter-tidal area were measured– 5 samples were taken in each area
• Question: whether species richness is related to – NAP: the height of the sampling station compared to
the mean tidal level– Exposure: an index composed of wave action, length
of the surf zone, slope, grain size, and the depth of the anaerobic layer.
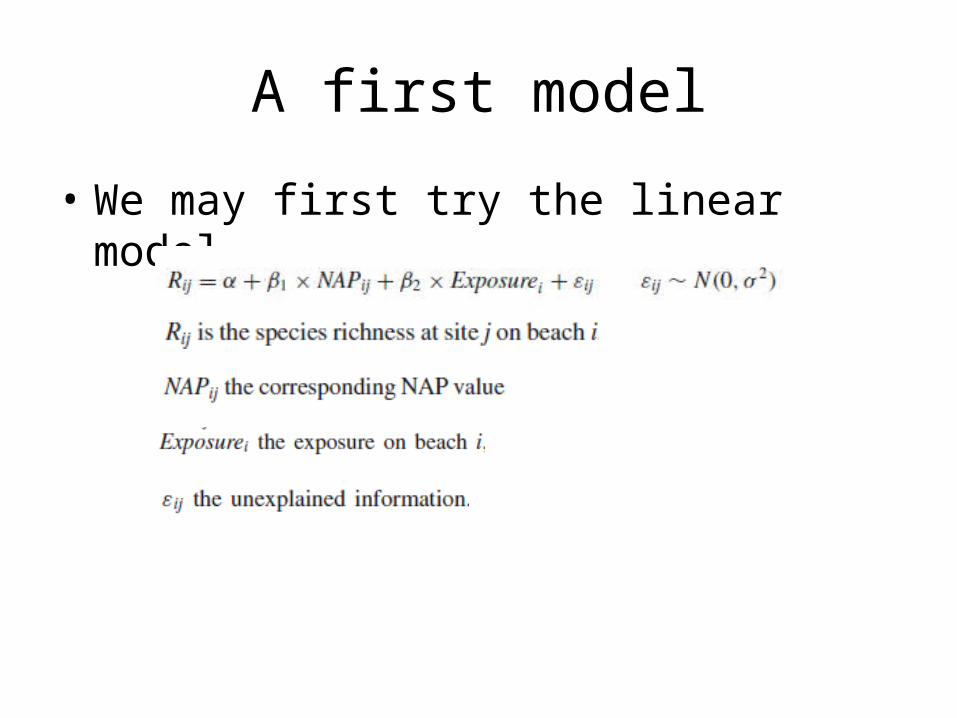
A first model
• We may first try the linear model
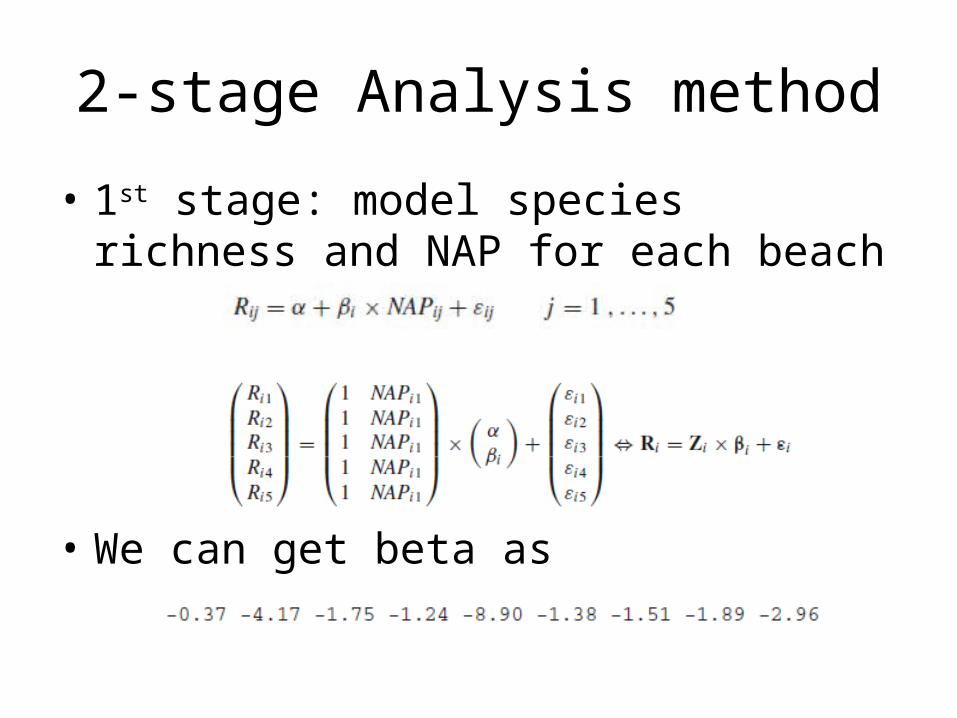
2-stage Analysis method
• 1st stage: model species richness and NAP for each beach
• We can get beta as
2-stage analysis method
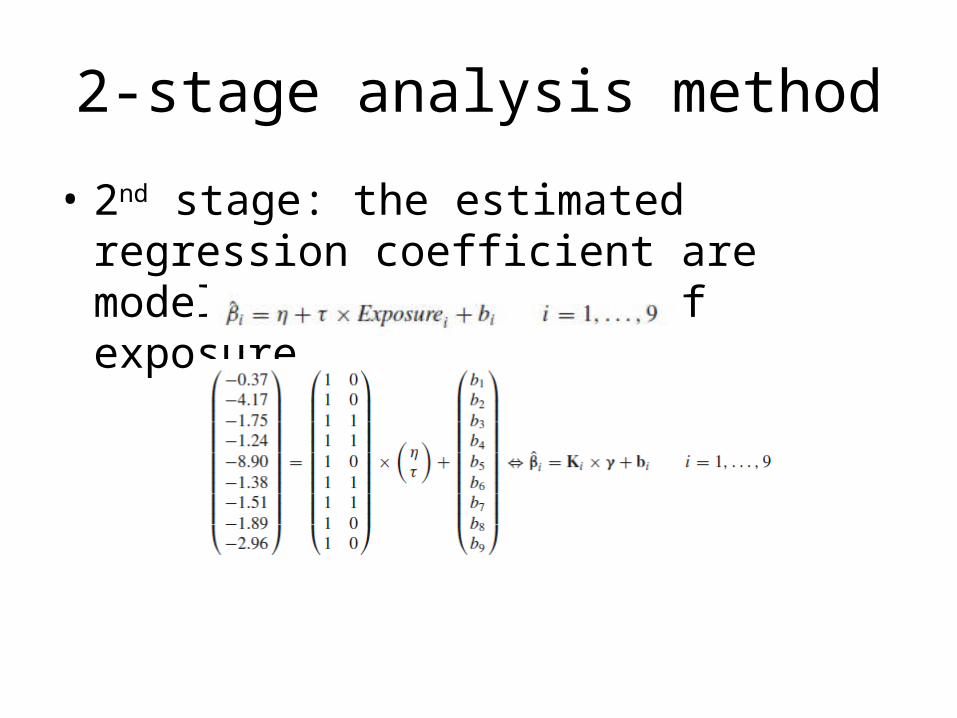
• 2nd stage: the estimated regression coefficient are modeled as a function of exposure
2-stage analysis method
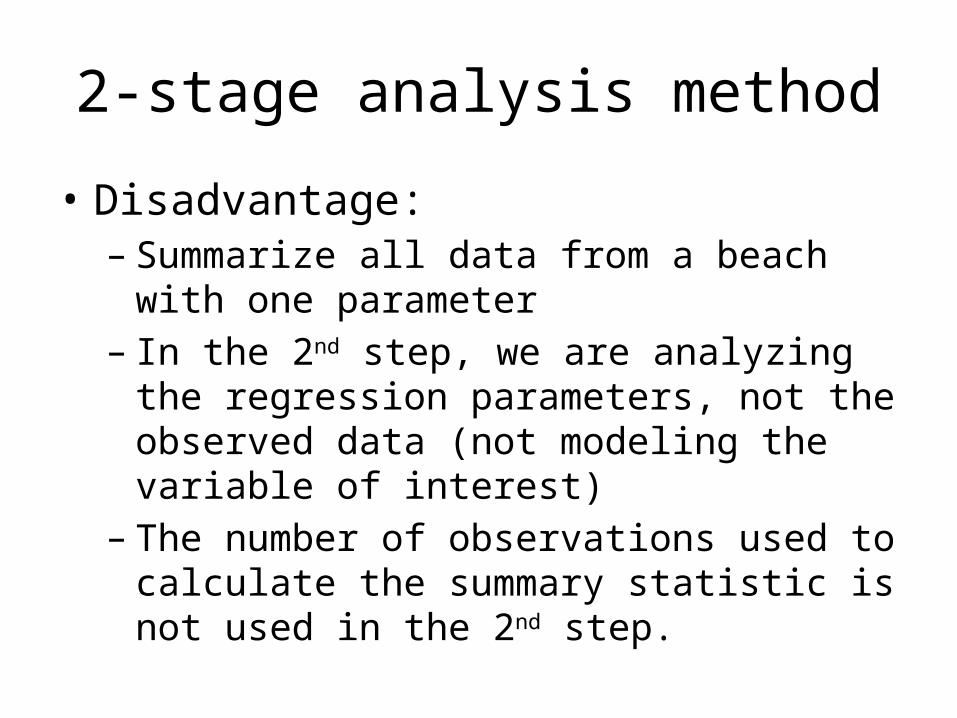
• Disadvantage:– Summarize all data from a beach with one
parameter– In the 2nd step, we are analyzing the regression
parameters, not the observed data (not modeling the variable of interest)
– The number of observations used to calculate the summary statistic is not used in the 2nd step.

Linear Mixed effect model
• The model
Fixed effect termRandom effect term
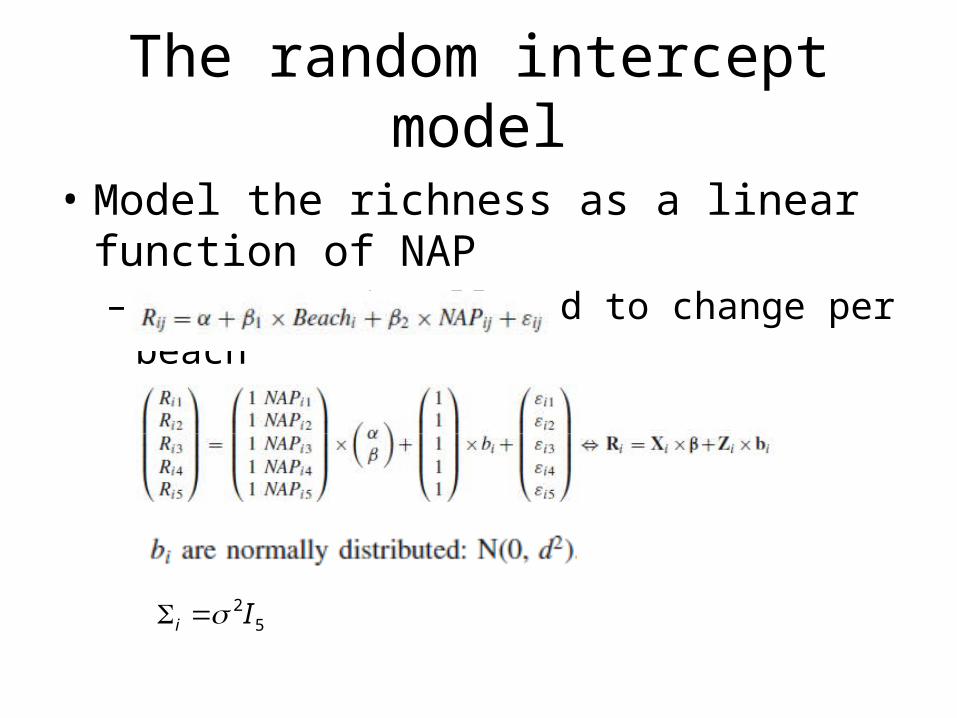
The random intercept model
• Model the richness as a linear function of NAP– Intercept is allowed to change per beach
52Ii
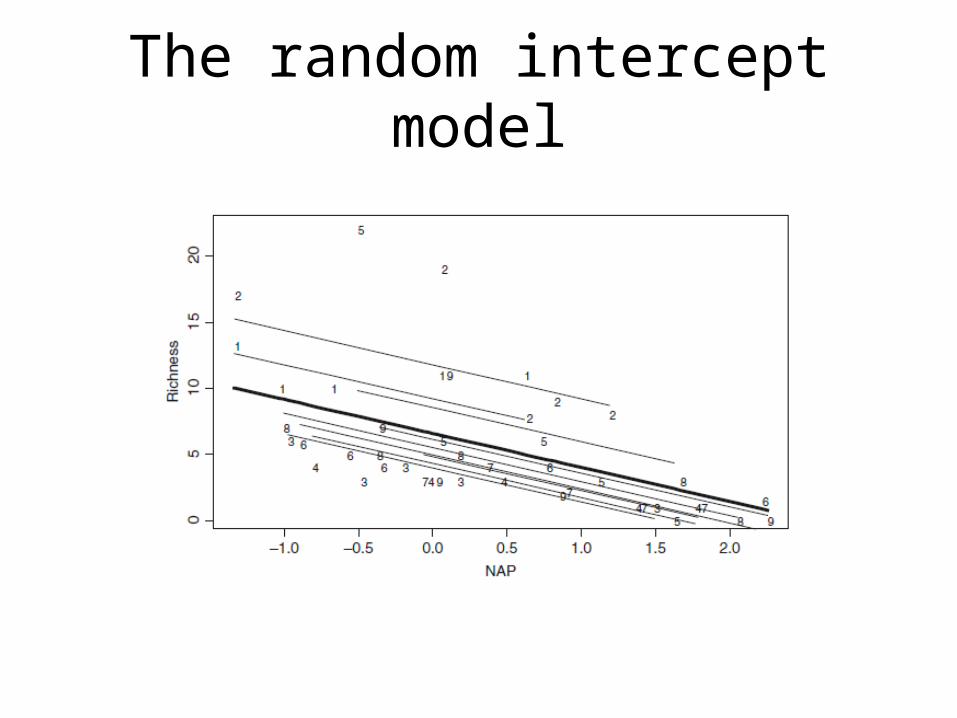
The random intercept model

The random intercept and slope model
• The model
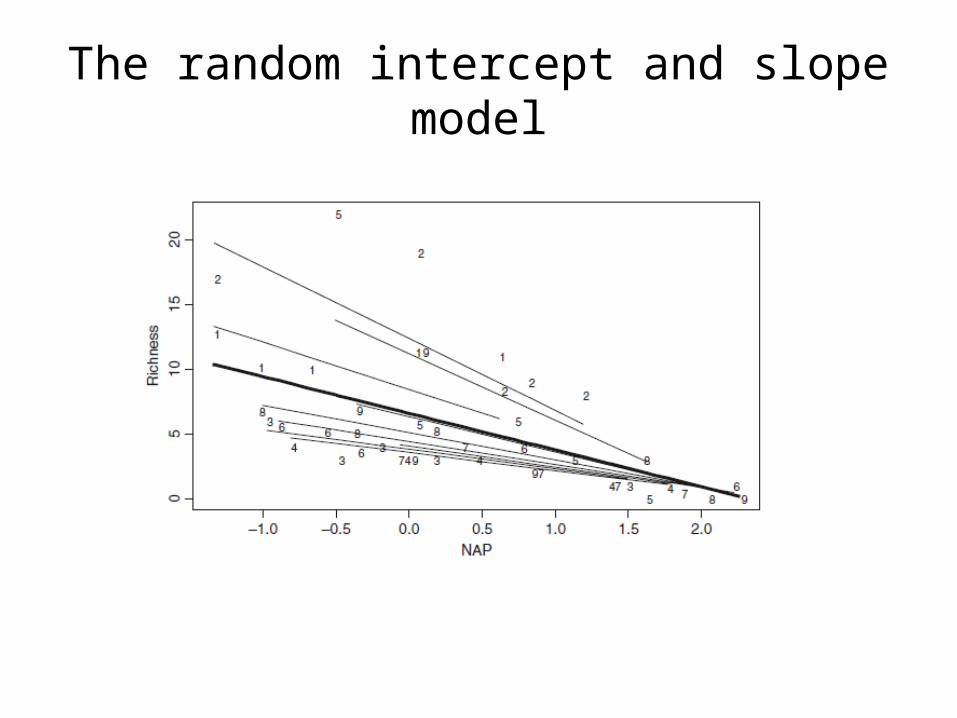
The random intercept and slope model

Induced correlation
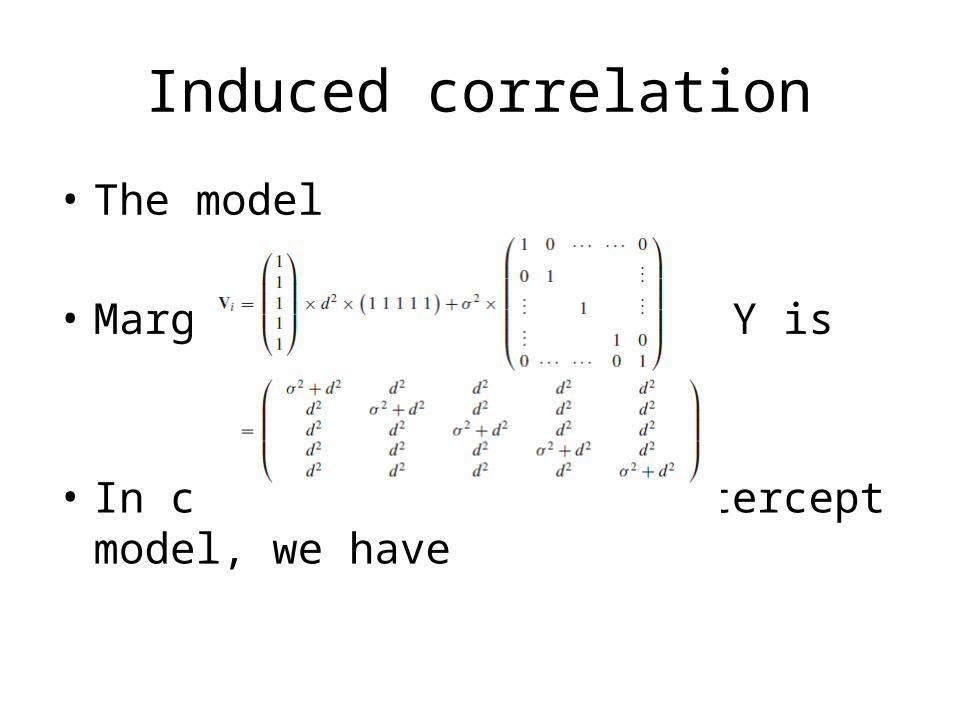
• The model
• Marginal distribution of Y is
• In case of the random intercept model, we have
Induced correlation
• The model
• Marginal distribution of Y is
• In case of the random intercept model, we have

Induced correlation
• For the random intercept and slope model, we have
The marginal model
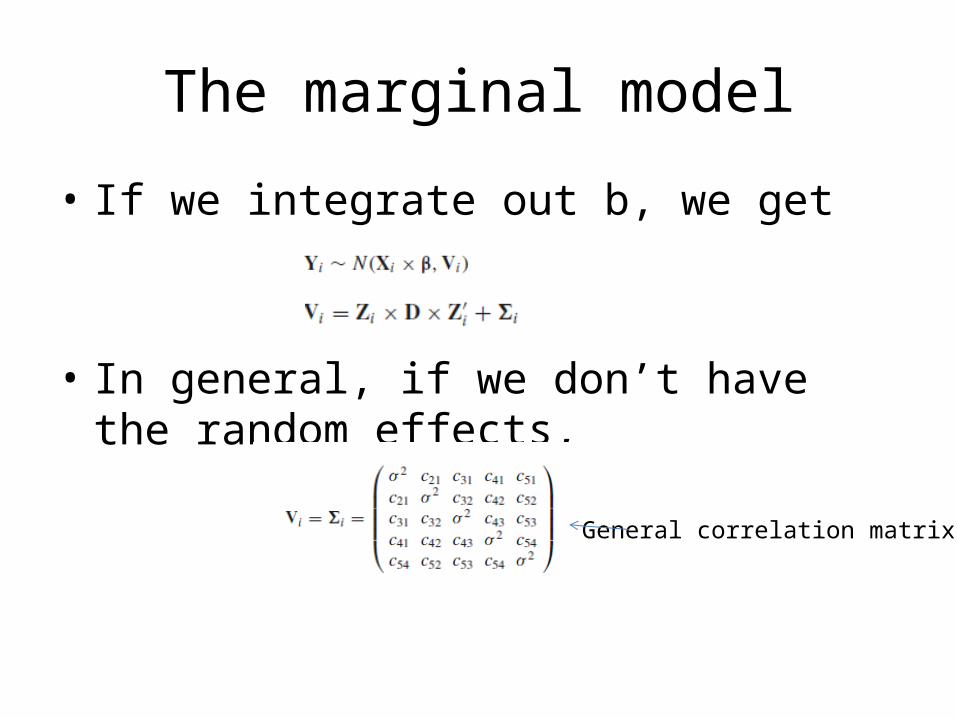
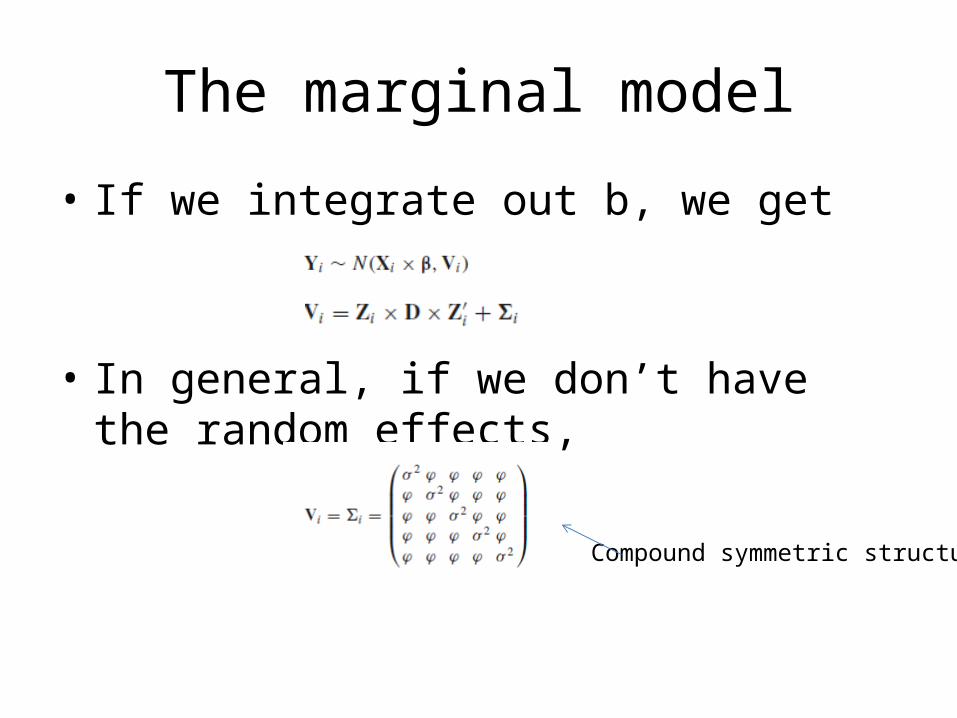
• If we integrate out b, we get
• In general, if we don’t have the random effects,
General correlation matrix
The marginal model
• If we integrate out b, we get
• In general, if we don’t have the random effects,
Compound symmetric structure
REML
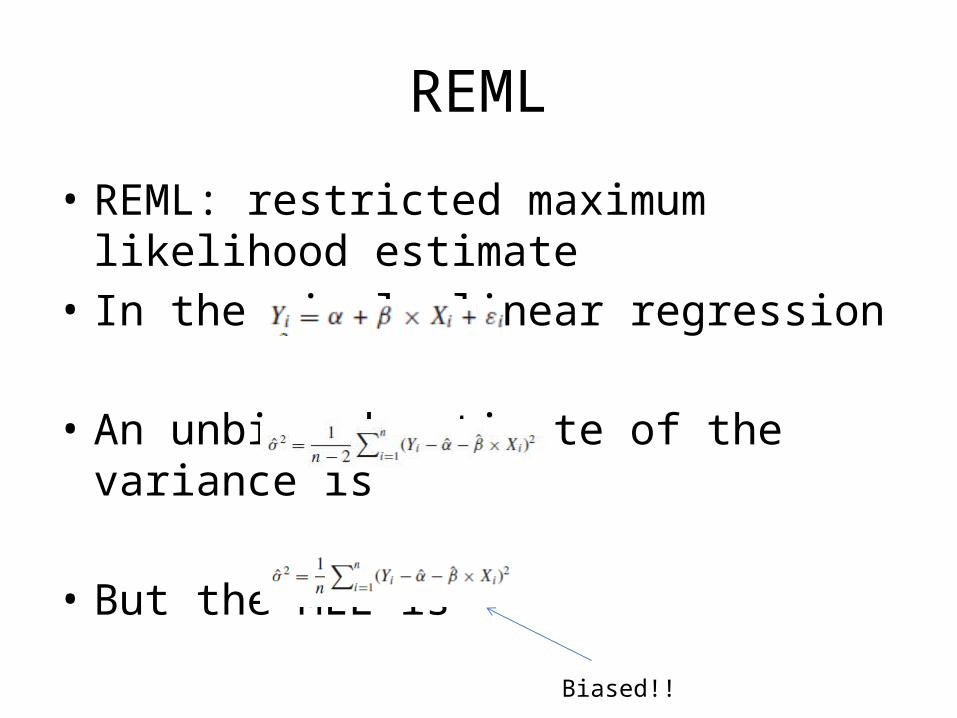
• REML: restricted maximum likelihood estimate• In the simple linear regression
• An unbiased estimate of the variance is
• But the MLE is
Biased!!

REML• REML works as follows
• Written in matrix form
• The normality assumption implies
• Take A of dimension n×n-2, such that A’ and X are orthogonal,
Maximize this we get REML

REML
• For the linear mixed model
• Putting all observations together
• Similarly, we can take A with• Thus
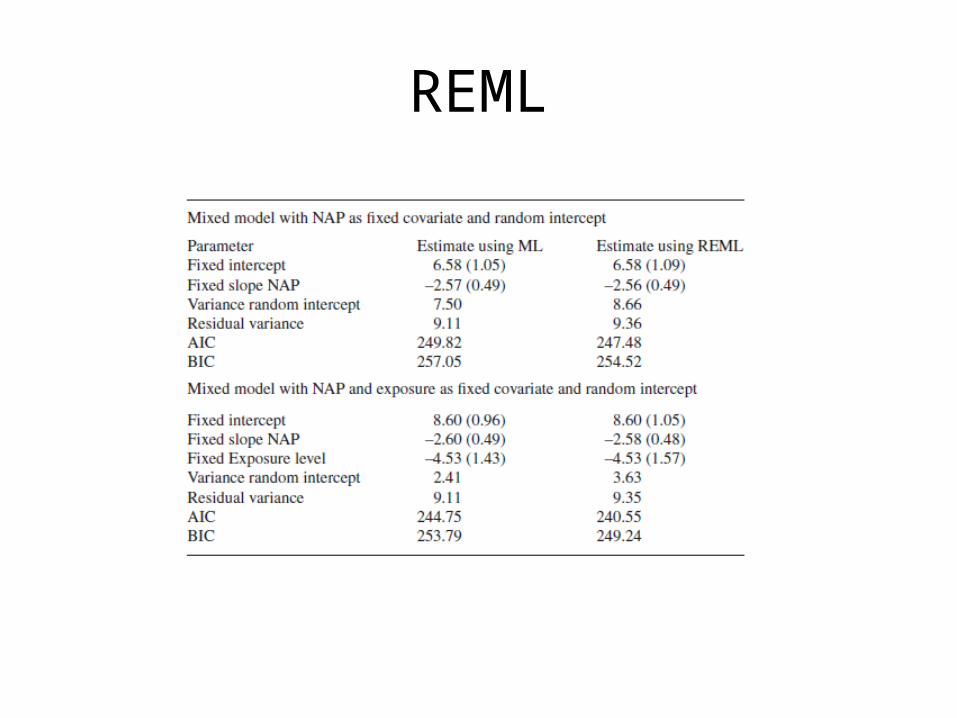
REML